Embed Size (px)
Citation preview

NBER WORKING PAPER SERIES
CURSE OF ANONYMITY OR TYRANNY OF DISTANCE? THE IMPACTS OF JOB-SEARCH SUPPORT IN URBAN ETHIOPIA
Girum AbebeStefano Caria
Marcel FafchampsPaolo Falco
Simon FranklinSimon Quinn
Working Paper 22409http://www.nber.org/papers/w22409
NATIONAL BUREAU OF ECONOMIC RESEARCH1050 Massachusetts Avenue
Cambridge, MA 02138July 2016
We are grateful to Gharad Bryan, Erica Field, Markus Goldstein, Douglas Gollin, Jeremy Magruder, David McKenzie, Mushfiq Mobarak, Amanda Pallais, and Alemayehu Seyoum Taffesse for helpful comments and to Jali Bekele, Giulio Schinaia, Vaclav Tehle, Biruk Tekle, Marc Witte, Alemayehu Woldu and Ibrahim Worku for outstanding research assistance. Data collection and experimental implementation were funded by GLM | LIC (‘Assisting Job Search in Low-Employment Communities: The Effect of Information Provision and Transport Vouchers in Addis Ababa’) and by the International Growth Centre (‘Assisting Job Search in Low-Employment Communities: The Effect of a Screening Intervention in Addis Ababa’). The project would not have been possible without the constant support of Rose Page and the Centre for the Study of African Economies (University of Oxford), nor without the support of the Ethiopian Development Research Institute in Addis Ababa. This RCT was registered in the American Economic Association Registry for randomized control trials under Trial number AEARCTR-0000911. The views expressed herein are those of the authors and do not necessarily reflect the views of the National Bureau of Economic Research.
At least one co-author has disclosed a financial relationship of potential relevance for this research. Further information is available online at http://www.nber.org/papers/w22409.ack
NBER working papers are circulated for discussion and comment purposes. They have not been peer-reviewed or been subject to the review by the NBER Board of Directors that accompanies official NBER publications.
© 2016 by Girum Abebe, Stefano Caria, Marcel Fafchamps, Paolo Falco, Simon Franklin, and Simon Quinn. All rights reserved. Short sections of text, not to exceed two paragraphs, may be quoted without explicit permission provided that full credit, including © notice, is given to the source.
Curse of Anonymity or Tyranny of Distance? The Impacts of Job-Search Support in UrbanEthiopiaGirum Abebe, Stefano Caria, Marcel Fafchamps, Paolo Falco, Simon Franklin, and SimonQuinnNBER Working Paper No. 22409July 2016JEL No. J64,O15,O18
ABSTRACT
We conduct a randomized evaluation of two job-search support programs for urban youth in Ethiopia. One group of treated respondents receives a subsidy to cover the transport costs of job search. Another group participates in a job application workshop where their skills are certified and they are given orientation on how to make effective job applications. The two interventions are designed to lower spatial and informational barriers to employment. We find that both treatments significantly improve the quality of jobs that young jobseekers obtain. Impacts are concentrated among women and the least educated. Using rich high-frequency data from a phone survey, we are able to explore the mechanisms underlying the results; we show that while the transport subsidy increases both the intensity and the efficacy of job search, the job application workshop mainly operates through an increase in search efficacy. Both interventions mitigate the adverse effects of spatial constraints on employment outcomes, and the job application workshop alleviates informational asymmetries by helping workers to signal their ability.
Girum AbebeEDRIAddis [email protected]
Stefano CariaOxford Department of International Development Oxford UniversityOxford [email protected]
Marcel FafchampsFreeman Spogli Institute
Paolo [email protected]
Simon FranklinCentre for Economic Performance London School of [email protected]
Simon QuinnOxford [email protected]
Stanford University616 Serra StreetStanford, CA 94305and [email protected]
A randomized controlled trials registry entry is available at https://www.socialscienceregistry.org/trials/911

1 Introduction
Over half of the world’s population lives in a city and global urbanisation is proceeding at
a rapid pace, especially in developing countries. By 2050, the urban population of Africa
is expected to triple, while that of Asia is expected to grow by 61 percent (United Nations,
2014). A key challenge for policy makers is to find ways to support a growing urban labour
force, and in particular those workers who find it hardest to access the opportunities that
cities have to offer. These individuals tend to be young and are predominantly female.
They have left school after completing compulsory education, they have little work experi-
ence, and they live in poorly connected parts of the city. A growing literature argues that
their labor market opportunities are reduced by the cost of job search and their inability to
signal skills during the recruitment process (Card et al., 2007; Chetty, 2008; Crépon et al.,
2013; Pallais, 2014). Limited labour market opportunities can reduce well-being, depreci-
ate human capital, and change preferences (Clark and Oswald, 1994; Fisman et al., 2015).
Search frictions also affect competition between firms and distort the allocation of labour
(Kaas and Kircher, 2015; Bryan and Morten, 2015). Yet, despite the importance of these
effects, we have surprisingly little evidence documenting how job search constraints can be
addressed in the growing cities of developing economies.
In this paper, we experimentally evaluate two interventions that are designed to help
young urban dwellers search for employment. The first intervention is a transport subsidy.
Job search in our study area requires regular trips to the centre of town and we calibrate
the subsidy amount to cover the cost of this journey. Individuals who are offered this
program can collect the subsidy from an office located in the centre of the city, up to
three times a week, for an average period of 16 weeks. The second intervention is a job
application workshop. Participants are offered orientation on how to make effective job
applications using CVs and cover letters and on how to approach job interviews. Further,
during the event, participants take a mix of standardised personnel selection tests. We use
information from the tests to certify participants’ general skills. These two interventions are
designed to ease spatial and informational constraints to job search. We hypothesised that
treated jobseekers would search more intensely and more effectively, leading to improved
3

employment outcomes.
We evaluate these interventions using a random sample of about 4,000 young individ-
uals in a rapidly expanding metropolis located in a fast growing country – namely, Addis
Ababa, the capital of Ethiopia. This location is ideal for our purpose: a large city with
a total population close to 4 million people, unemployment rates above 20 percent, many
insecure and poorly paid jobs, and rapid in-migration from outlying rural areas. Because
of our interest in search costs related to transport, we focus on subjects who reside at least
2.5 km away from the centre of town.1
We find that both interventions help jobseekers get better jobs. Eight months after
the end of the program, individuals invited to the job application workshop are nearly 40
percent more likely to have permanent employment and nearly 25 percent more likely to be
in formal employment compared to individuals in the control group. Individuals who are
offered the transport subsidy are 25 percent more likely to be in formal employment. These
effects are statistically significant; they are robust to a correction for multiple comparisons;
and their magnitude is economically meaningful. The effects are stronger for women and
for less educated workers (those who have at most secondary education). These are the
groups that typically find it hardest to obtain high quality employment, in Ethiopia and in
other developing countries (OECD, 2015).
To understand the mechanisms that drive these results, we conduct fortnightly phone
interviews with all sampled jobseekers throughout the course of the study. This provides a
rich, high-frequency dataset that allows us to observe how search behaviour evolves in re-
sponse to our interventions.2 We find that the transport subsidy allows jobseekers to search
more intensely. Furthermore, we find that both interventions improve jobseekers’ search
efficacy, particularly for the least educated. On average, control individuals with a high
school degree receive an offer for a permanent job every 10.5 applications. The workshop
and the transport programs bring this down to about one offer every 5.2 applications.
1 Individuals included in the study are between 18 and 29 years of age, have completed high school, areavailable to take up employment, and are not currently working in a permanent job.
2 Recall bias would make it difficult to perform a similar analysis using retrospective questions asked in theendline survey.
4
We also present evidence consistent with the hypothesis that the interventions work by
easing spatial and informational constraints. In particular, both interventions weaken the
correlation between distance from the city centre and the type of occupation that partici-
pants undertake. Furthermore, using data from the personnel selection tests, we find that
the job application workshop strengthens the correlation between skills and good employ-
ment outcomes for workers with less formal qualifications. We present evidence from a
regression discontinuity analysis suggesting that this effect is mostly driven by the orien-
tation component of the job application workshop.
Finally, we measure the indirect impacts of the interventions on the young individuals
who reside close to program participants. Using a randomised saturation design, we find
some positive indirect effects of the transport subsidy on the quality of employment when
the proportion of treated jobseekers is low, and some negative effects when the proportion
of treated jobseekers is high (90 %). We do not find indirect effects of the job application
workshop, despite a fairly high proportion of treated respondents in all clusters (80 %).
Taken together, our evidence shows that the urban unemployed can benefit from simple
interventions that facilitate job search, at least in the context of least developed countries
where the problem is particularly acute. Recent studies have documented that search sub-
sidies and information can connect rural workers to urban jobs (Jensen, 2012; Bryan et al.,
2014). We show that job search assistance can also be effective for workers in urban labour
markets.
There is little experimental evidence documenting the impacts of transportation sub-
sidies and jobseekers’ orientation interventions. Using a randomized field experiment in
Washington DC, Phillips (2014) finds that a public transit subsidy has a large, short-run
effect in reducing unemployment durations, with treatment causing the probability of find-
ing employment within 40 days to increase by 9 percentage points, from 0.26 to 0.35. After
90 days, this difference narrows to a large but statistically insignificant 5 percentage points.
For less developed countries, Franklin (2015) reports the results of an early trial of a trans-
port subsidy intervention administered to a selected sample of motivated jobseekers in
Addis Ababa. He also finds positive impacts on the probability of permanent work. Groh
5

et al. (2015, 2016) find that a soft skills training program and a matching intervention do
not improve the employment outcomes of young Jordanian women. These two interven-
tions have a number of features in common with the job application workshop – chiefly, the
focus on information about skills. However, they are offered to a sample of jobseekers with
tertiary education, in a labour market with much higher unemployment rates. In line with
their results, we are unable to find significant treatment effects for individuals with tertiary
education, but we find that this type of intervention can benefit less educated workers.
More generally, our results contribute to our understanding of how space affects the
functioning of labour markets (Gollin and Rogerson, 2010; Bryan and Morten, 2015; Asher
and Novosad, 2015). We sample young individuals who reside in many different parts of
Addis Ababa and we record detailed geo-coded information about their place of residence.
This allows us to document the spatial pattern of occupational structure in the city and
to calculate heterogeneous treatment effects by distance from the city centre. We find that
both our interventions help jobseekers overcome the spatial constraints on occupational
choices.
We also contribute to a growing literature that studies the economic importance of
cognitive and non-cognitive skills (Bowles et al., 2001; Heckman et al., 2006; Blattman et al.,
2015). We draw from this literature to develop the personnel selections tests used in the
study. Our evidence suggests that in some segments of the labour market employers may
be unable to identify highly skilled workers. The job application workshop overcomes this.
Our results relate directly to the findings in Pallais (2014), who documents the positive
employment effects of an interventions that helps workers signal their skills in an online
labour market.
Finally, we provide the first evidence on the local indirect effects of labour market
interventions in a developing country. Using a randomised saturation design as in Crépon
et al. (2013), we show that indirect effects on non-participants depend on the proportion of
jobseekers that are offered the program in a given area.
The rest of the paper is organised as follows. Section 2 provides some information
6
about the labour market in Addis Ababa. Section 3 describes the two interventions. In
section 4, we introduce the experimental design, the data we use, and the main empirical
specification. Section 4 presents the main results. In section 5, we discuss the nature of the
constraints addressed by our interventions. We conclude with some thoughts about future
interventions.
2 Context
Addis Ababa is the largest city in Ethiopia (African Economist, 2012). Official estimates
suggest that the population of the city totalled 3.2 millions in 2014 and planners expect
that Addis Ababa’s population will more than double in the next 25 years (CSA, 2014;
Davison, 2014).3 Many of the city residents are unemployed. The overall unemployment
rate is 23.5 percent.4 Young people between the age of 20 and 29 face an unemployment
rate of 27.9 percent, and young women a rate of 33.6 percent (CSA, 2014). Furthermore,
available jobs are often insecure and poorly paid. At the time of the endline survey of our
study, only 30 percent of the employed individuals in the control group have a permanent
job. The others work in temporary, casual or self-employment. The stream of income from
these occupations is unstable. For example, 25 percent of temporary workers report that
they had to miss at least one week of work, since they started their current job, because
"work was not available".5 Working poverty is widespread: two workers out of five earn
less than 2 USD per day.6
Job search is costly for unemployed youth. One of the most popular search methods
3 Other estimates suggest that the total population of the city is close to 4.5 million.4 To calculate this rate, the Central Statistical Authority of Ethiopia counts as unemployed all individuals who
do not have a job, but are available for work.5 The median duration of these spells was 4 weeks for temporary workers and 8 weeks for the self-employed.6 Median earnings in the control group at endline are about 70 USD per month. If we adjust this figure using
the World Bank purchasing power parity conversion rates, this corresponds to about 205 USD. However,Addis Ababa is the most expensive city in Ethiopia. Thus when we use the nation-wide PPP adjustmentfactor we overestimate the real purchasing power of salaries in the capital city. Data from the EthiopianStatistical Authority documents that in 2014 2 employed individuals out of 5 in Addis Ababa were availableto work additional hours, further suggesting underemployment and low pay.
7

used by the participants in our study is to visit the job vacancy boards.7 The boards are
located in the centre of the city, forcing participants who live in the periphery to travel
frequently to the centre of the city, which can be costly. Job seekers also face the costs of
gathering information through newspapers, printing CVs and cover letters, travelling to
interviews, etc. Among the active searchers in our sample, the median expenditure on job
search at baseline amounts to about 16 percent of overall expenditure. This goes up to
25 percent for jobseekers who report searching 6 days a week. These are large amounts
especially if we consider that the typical jobseeker spends a long time in unemployment
before finding a job. In our baseline sample, for example, the median jobseekers has spent
about 10 months looking for employment.
Young jobseekers in Addis Ababa find it hard to signal their skills and worth to em-
ployers. To select a shortlist of candidates among a large number of applicants, firms in the
city often use simple criteria such as whether the candidate has previous work experience.8
Job referrals are also frequent (Serneels, 2007; Caria, 2015). This puts young people at a
disadvantage, as they have little work experience and less extensive networks. 55 percent
of the participants in our study report having less than one year of work experience and
only 16 percent have ever worked in a permanent job. Furthermore, many jobseekers do
not seem to be familiar with the process and the standards of job applications. For exam-
ple, while firms report valuing a well-written CV, 41 percent of the study participants who
have applied for at least one job in the last six months have not prepared a CV to support
their applications.
In light of these challenges, we devised three interventions to support young unem-
ployed workers in their job-search. This paper focuses on the first two treatments. The
third one, which is briefly described in Section 2.4, will be the focus of a separate paper.
7 At baseline, 36 percent of participants rank the job vacancy boards as their preferred method of search and53 percent of active searchers have visited the boards at least once in the previous seven days.
8 56 percent of firms report that for blue collar positions they only consider candidates with sufficient workexperience, and 63 percent of firms use this selection method for white collar positions.
8

3 The interventions
3.1 Treatment 1: The transport subsidy
Individuals in this treatment group are offered cash conditional on attending an office in
the centre of Addis Ababa.9 Recipients are required to attend in person, and to show
photographic ID on each visit. Each recipient can collect cash once a day, up to three times
a week. The amount that can be collected on any given day is calibrated to cover the cost of
a return bus fare from the area of residence of the participant at baseline to the intervention
office. 10
The median subsidy available on a given day is equal to 20 Ethiopian Birr (1 USD at the
exchange rate at the beginning of the intervention). This is about two thirds of the median
weekly expenditure on job search at baseline, and 10 percent of overall weekly expenditure.
The minimum amount is 15 ETB (0.75 USD) and the maximum 30 ETB (1.5 USD).
We stagger the start time and the end time of the subsidy, randomly. This generates
variation across individuals in the number of weeks during which the treatment was avail-
able, and in the time of treatment. The number of weeks of treatment varied from 13 to 20,
with a median of 16 weeks. We implement the intervention between September 2014 and
January 2015.
3.2 Treatment 2: The job application workshop
The job application workshop is designed to help jobseekers signal their skills to employers.
It has two components: an orientation session and a testing session. The orientation session
helps jobseekers make more effective use of their existing signals (job experience, educa-
9 This office is located close to the major job vacancy boards. The office was also near a central bus station,from which buses leave to destinations all around Addis Ababa.
10 We calibrate the subsidy to allow participants to travel on minibuses. Study participants can in principlewalk to the office or use less expensive large public buses – an inferior means of transport that is crowdedand infrequent – and save a part of the transfer. Qualitative evidence suggests that this is not common.Furthermore, we do not find that individuals in this treatment group increase their savings during theweeks of the intervention.
9

tion, etc.). In the testing session, we certify skills that are "hard to observe" for employers,
such as cognitive ability, and we provide participants with an instrument (the certificates)
to signal those skills.
The intervention takes place over two days. On the first day, participants take the tests.
On the second day, they attend the orientation session. The intervention is administered
by the School of Commerce of Addis Ababa University, between September and October
2014. The School of Commerce has a reputation for reliable personnel selection services
and many firms screen their applicants using tests developed, and sometimes administered
by, the School of Commerce. In a survey of 500 medium to large firms in Addis Ababa,
we find that about 40 percent of firms know about the personnel selection services offered
by the School of Commerce (Abebe et al., 2015). 80 percent of these firms report that they
trust the services offered by the School of Commerce.
The orientation session covers three main topics: CV writing, application letters and
job interviews. All the training materials were developed by the School of Commerce
and later reviewed by our team. We administer four tests: (i) a Raven matrices test, (ii)
a test of linguistic ability in Amharic, (iii) a test of mathematical ability and (iv) a ‘work-
sample’ test. The results of the tests are presented in a certificate, which jobseekers can
use in support of their job applications. The certificates explain the nature of the tests
and report the relative grade of the individual for each test, and an aggregate measure of
performance.11 The certificates are officially issued by the School of Commerce and the
Ethiopian Development Research Institute.12
We chose the tests on the basis of the results of several qualitative interviews with firm
managers in the city.13 The Raven test is a widely used measure of cognitive ability (Raven,
2000). It is believed to be one of the best predictors of worker productivity (Schmidt and
Hunter, 1998; Chamorro-Premuzic and Furnham, 2010) and it has been used by economists
11 We report relative performance using bands: a band for the bottom 50 percent of the distribution and thenseparate bands for individuals in the upper deciles of the distribution: 50-60%, 60-70%, 70-80%, 80-90%,90-100%.
12 Participants collect the final certificates from the School of Commerce, after all testing sessions are com-pleted.
13 These interviews highlights managers’ information needs and the degree of familiarity that managers havewith various tests.
10
to measure worker quality in several contexts (Dal Bó et al., 2013; Beaman et al., 2013). The
tests of mathematical and linguistic ability are designed to capture general mathematical
and linguistic skills, as in the OECD’s PIAAC survey or the World Bank’s STEP survey
(OECD, 2013; Pierre et al., 2014). The ‘work-sample’ test captures participants’ ability to
carry out simple work tasks: taking minutes during a business meeting, carrying out a
data entry task under time pressure, and meeting a deadline to complete a data entry task
at home. The literature in organisational psychology suggests that ‘work-sample’ tests can
be used alongside measures of cognitive ability to predict worker performance (Schmidt
and Hunter, 1998).
3.3 Job fair
Alongside the two treatments that we study in the paper, we also implemented a third
intervention. Individuals assigned to this treatment, were invited to attend, free of charge
a job fair. This is a distinct treatment, which we plan to evaluate in a separate paper.
4 Experimental design and data
4.1 The sample
We randomise treatment assignment at two levels: geographic clusters and individuals.
We defined geographic clusters using the Ethiopian Central Statistical Agency (CSA) enu-
meration areas.14 Our sampling frame excluded clusters within 2.5 km of the centre of
Addis Ababa, and clusters outside the city boundaries. Clusters were selected at random
from our sampling frame, with the condition that directly adjacent clusters could not be
selected, to minimise potential spill-over effects across clusters.
In each selected cluster, we used door-to-door sampling to construct a list of all indi-
viduals in the cluster who: (i) were 18 or older, but younger than 30; (ii) had completed
14 CSA defines enumeration areas as small, non-overlapping geographical areas. In urban areas, these typicallyconsist of 150 to 200 housing units.
11

high school; (iii) were available to start working in the next three months; and (iv) were
not currently working in a permanent job or enrolled in full time education. We randomly
sampled individuals from this list to be included in the study. Our lists included individu-
als with different levels of education. We sampled with higher frequency from the groups
with higher education. This ensured that individuals with vocational training and univer-
sity degrees are well represented in the study. All selected individuals were contacted for
an interview.
We completed baseline interviews with 4388 eligible respondents. We attempted to con-
tact individuals by phone for at least a month (three months, on average); we dropped in-
dividuals who could not be reached after at least three attempted calls.15 We also dropped
any individual who had found a permanent job and who retained the job for at least six
weeks. Finally, we dropped individuals who had migrated away from Addis Ababa dur-
ing the phone survey. Table 8 in the online appendix shows of how many individuals were
dropped from the sample at each point and the reasons for them being dropped. In all we
were left with 4059 individuals who were are included in our experimental study.
4.2 Face-to-face interviews and the phone survey
We collect data on study participants through both face-to-face and phone interviews. We
complete baseline face-to-face interviews between May and July 2014 and endline inter-
views between June and August 2015. We collect information about the sociodemographic
characteristics of study participants, their education, work history, finances and their ex-
pectations and attitudes. We also include a module to study social networks.
We also construct a rich, high-frequency panel dataset through fortnightly phone inter-
views. We call all study participants through the duration of the study. In these interviews
we administer a short questionnaire focused on job search and employment. Franklin
(2015) shows that high-frequency phone surveys of this type do not generate Hawthorne
15 We give details of the phone interviews in section 4.2 below
12

effects, for example, they do not affect jobseekers’ responses during the endline interview.
4.3 Randomisation
We randomly assigned geographic clusters to one of five treatment groups: (i) control, (ii)
transport, (iii) job application workshop, (iv) job fair, (v) job fair and workshop. To ensure
balance, we created blocks of clusters with similar baseline observables and randomly
assigned clusters within each block to the five groups (Bruhn and McKenzie, 2009).16
Not all individuals in the clusters assigned to the transport intervention and job ap-
plication workshop were designated to receive treatment. Among those in the transport
clusters, we implemented a randomised saturation design. We varied the proportion of
sampled individuals who were offered treatment from 20% to 40%, 75% and 90%. Ta-
ble 2 shows the number of clusters assigned to each saturation level and the number of
individuals who were offered treatment in those clusters.
In clusters assigned to the job application workshop we kept the level of saturation
fixed. 80% of all individuals in these clusters were invited to attend the workshop. Hav-
ing set cluster saturation levels, we assigned individuals within clusters to treatment and
controls. This was done by blocking individuals within clusters by their education level,
and implementing a simple re-randomisation rule. The final assignment to treatment is
outlined in Table 1. Finally, individuals designated to receive the transport intervention
were randomly assigned to a start and an end week. This is illustrated in table 9 in the
online appendix.
< Table 1 here. >
< Table 2 here. >16 We used the following variables to create the blocks: distance of cluster centroid from city centre; total
sample size surveyed in the cluster; total number of individuals with degrees; total number of individualswith vocational qualifications; total number of individuals who have worked in the last 7 days; total numberof individuals who have searched for work in the last 7 days; total number of individuals of Oromo ethnicity;average age of individuals in the cluster.
13
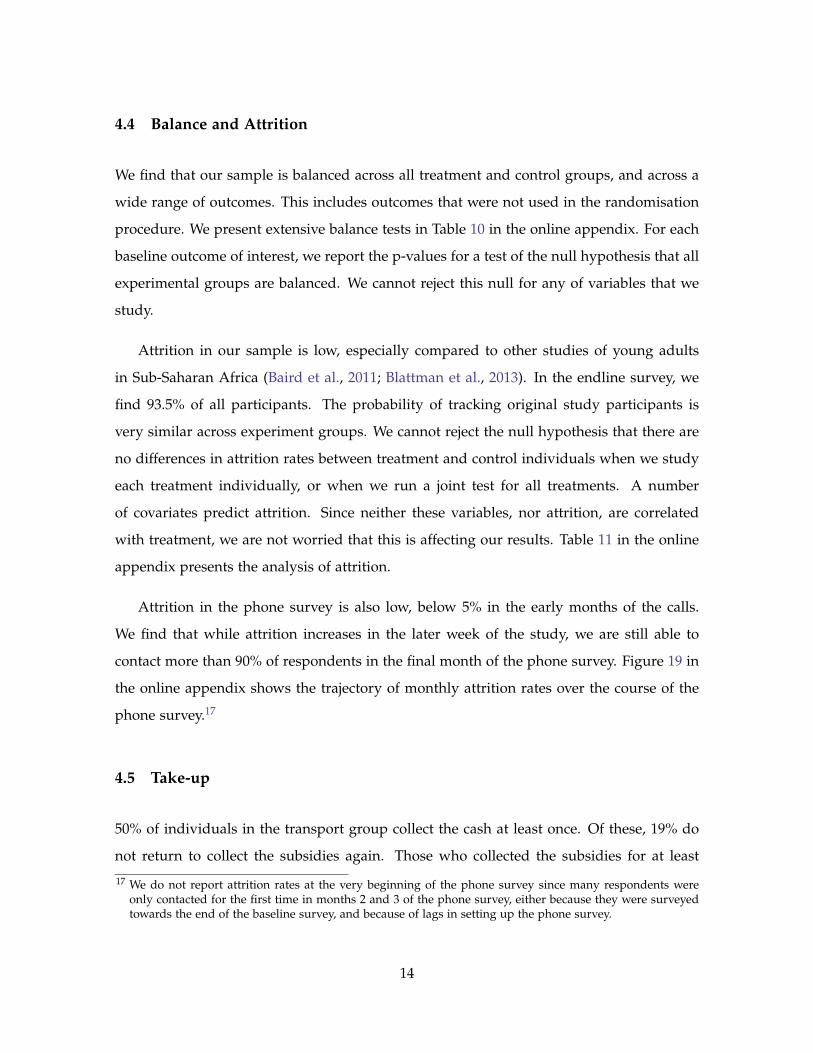
4.4 Balance and Attrition
We find that our sample is balanced across all treatment and control groups, and across a
wide range of outcomes. This includes outcomes that were not used in the randomisation
procedure. We present extensive balance tests in Table 10 in the online appendix. For each
baseline outcome of interest, we report the p-values for a test of the null hypothesis that all
experimental groups are balanced. We cannot reject this null for any of variables that we
study.
Attrition in our sample is low, especially compared to other studies of young adults
in Sub-Saharan Africa (Baird et al., 2011; Blattman et al., 2013). In the endline survey, we
find 93.5% of all participants. The probability of tracking original study participants is
very similar across experiment groups. We cannot reject the null hypothesis that there are
no differences in attrition rates between treatment and control individuals when we study
each treatment individually, or when we run a joint test for all treatments. A number
of covariates predict attrition. Since neither these variables, nor attrition, are correlated
with treatment, we are not worried that this is affecting our results. Table 11 in the online
appendix presents the analysis of attrition.
Attrition in the phone survey is also low, below 5% in the early months of the calls.
We find that while attrition increases in the later week of the study, we are still able to
contact more than 90% of respondents in the final month of the phone survey. Figure 19 in
the online appendix shows the trajectory of monthly attrition rates over the course of the
phone survey.17
4.5 Take-up
50% of individuals in the transport group collect the cash at least once. Of these, 19% do
not return to collect the subsidies again. Those who collected the subsidies for at least
17 We do not report attrition rates at the very beginning of the phone survey since many respondents wereonly contacted for the first time in months 2 and 3 of the phone survey, either because they were surveyedtowards the end of the baseline survey, and because of lags in setting up the phone survey.
14

two weeks tended to be dedicated users. Conditional on coming to take up the money at
least, 74% of respondents took up the money at least once a week over the course of the
entire study. The average number of total collections among those who took it up was 16,
corresponding to an average cash transfer of 320 ETB (15 USD) per active user, or 160 ETB
(7.5 USD) per intended user.
63% of individuals in the job application workshop group attended the workshop. 80%
of those attending later collected the certificates from the School of Commerce. Not all
of these jobseekers chose to use the certificates to support their job applications. Among
the study participants who collected the certificates and applied to at least one position,
42 percent report ever including the certificates in an application.18 When they did so,
participants report that the firms took the information into consideration.
5 Empirical strategy
We follow a detailed pre-analysis plan registered at: www.socialscienceregistry.org/
trials/911. The plan describes the empirical strategy, the outcome variables of interest, the
definition of these variables, the subgroup analysis, and our approach to multi-hypothesis
testing and attrition.
Our primary objective is to estimate the effects of the programs on the labour market
outcomes of study participants. For each outcome at endline, we will estimate the following
equation:
yic = β0 + β1 · transporti + β2 · workshopi + β3 · jobfairi
+ γ1 · spillover1i + γ2 · spillover2i + α · yic,pre + δ · xi0 + µic (1)
where yic is the endline outcome for individual i in cluster c and xi0 is the vector of
baseline covariate values that were used for re-randomisation and blocking. transporti,
18 This is unlikely to be caused by poor understanding, as participants report to have understood the informa-tion presented in the certificates well and certificates use is correlated with the score reported.
15

workshopi, jobfairi are dummies that capture whether an individual has been offered a
particular program.19 Thus, our estimates measure the intent-to-treat impacts of the in-
terventions. In this paper we focus on the effects of the transport and job application
workshop. As discussed, the effects of the job fair intervention will be reported in a sep-
arate paper. spillover1i identifies control individuals residing in clusters assigned to the
transport treatment, while spillover2i identifies control individuals in clusters assigned
to the job application workshop. We correct standard errors to allow for correlation within
geographical clusters. As we explained above, we sampled individuals who have attained
high education levels with higher frequency. To obtain average treatment effects for the
population of eligible individuals, we weight observations according to the inverse of the
probability of being sampled.20
In the pre-analysis plan, we specify a family of seven primary employment outcomes.
For each one of them we we test the null hypothesis that each treatment had no impact.
We report both a conventional p-value and a ‘sharpened’ q-value (Benjamini et al., 2006).
The q-values control the false discovery rate within the family of the seven hypotheses
that we test for each program. We also specify two families of intermediate outcomes
that help us elucidate what mechanisms drive the primary effects, and seven families of
secondary outcomes. To deal with secondary outcomes, we will use a standard ‘omnibus’
approach: we construct an index for each family and test whether the index is affected by
our treatments. For inference, we proceed as before: we report both p values and false
discovery rate q-values by treating each index as a separate member of a ‘super-family’ of
indices.19 We administered two different versions of the job fairs treatment. We follow the pre-analysis plan and
include a separate dummy for each version of the job fair treatment. For simplicity of exposition, in equation1 we collapse the two dummies into one. Since the effects of the job fairs will be the focus of a separatepaper, they will not be reported below.
20 We use the sampling weights reported in the pre-analysis plan.
16

6 Results
We first present the impacts of each program on the primary employment outcomes. Ta-
ble 3 summarises the results. Each row in the table corresponds to an outcome variable.
We study impacts on overall employment rates, on the number of hours worked and on
the probability of having a permanent job and a job with a written agreement. In Ethiopia,
workers are often employed without a written agreement, which makes it difficult for them
to uphold their formal rights and for the fiscal authority to collect labour taxes.21 Thus,
having a written agreement represents a salient measure of employment formality. We also
test for effects on the probability of being self employed, on earnings and work satisfac-
tion. The first two columns of table 3 report impacts on treated individuals. Columns 3
and 4 show impacts on control individuals in treated clusters (the indirect effects of the
programs). Below each coefficient we report a p-value in parentheses and a q-value in
brackets. The mean outcome for the control group at endline is shown in column 5. In
column 6 we report the results of an F-test for the equality of the effects of the two inter-
ventions.
< Table 3 here. >
We find that both interventions significantly improve the quality of the jobs workers
get. The application workshop increases the probability of working in a permanent job
by nearly 40 percent (raising the share of workers in permanent employment by 6.7 per-
centage points from a level of 17.1 percent in the control group). The effect is statistically
significant at the 1 percent level and remains highly significant after correcting for multiple
comparisons. The transport treatment boosts permanent employment by nearly 20 percent
(a 3.4 percentage points increase from the control level). This effect is significant at the 10
percent level, but has a q-value of 0.23 once we account for multiple comparisons. Both
21 In the endline survey of our study, only 44 percent of workers have signed a written agreement with theiremployer. Those who do are 60 percent less likely to report delays in wage payments and 22 percent morelikely to have received information about health and safety regulations. Furthermore, workers with a writtenagreement are less likely to be working in small shops, construction sites and open markets (locations thatare prone to informality), and more likely to be working in an office or a factory.
17
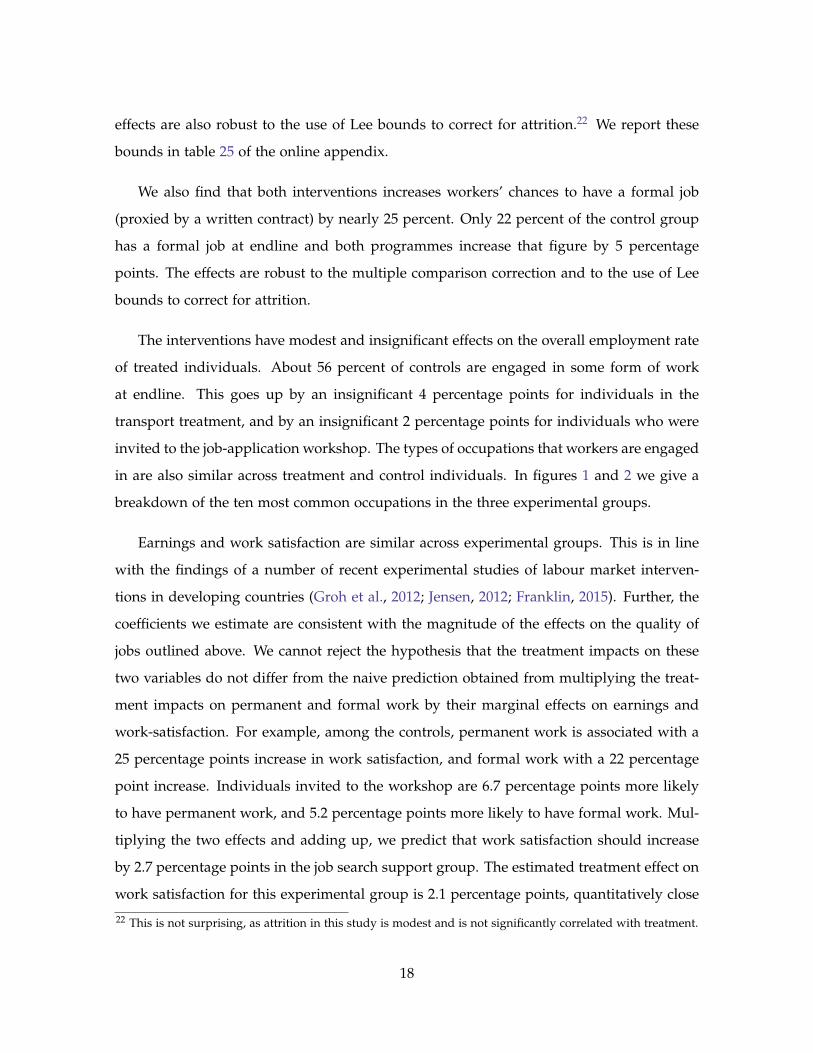
effects are also robust to the use of Lee bounds to correct for attrition.22 We report these
bounds in table 25 of the online appendix.
We also find that both interventions increases workers’ chances to have a formal job
(proxied by a written contract) by nearly 25 percent. Only 22 percent of the control group
has a formal job at endline and both programmes increase that figure by 5 percentage
points. The effects are robust to the multiple comparison correction and to the use of Lee
bounds to correct for attrition.
The interventions have modest and insignificant effects on the overall employment rate
of treated individuals. About 56 percent of controls are engaged in some form of work
at endline. This goes up by an insignificant 4 percentage points for individuals in the
transport treatment, and by an insignificant 2 percentage points for individuals who were
invited to the job-application workshop. The types of occupations that workers are engaged
in are also similar across treatment and control individuals. In figures 1 and 2 we give a
breakdown of the ten most common occupations in the three experimental groups.
Earnings and work satisfaction are similar across experimental groups. This is in line
with the findings of a number of recent experimental studies of labour market interven-
tions in developing countries (Groh et al., 2012; Jensen, 2012; Franklin, 2015). Further, the
coefficients we estimate are consistent with the magnitude of the effects on the quality of
jobs outlined above. We cannot reject the hypothesis that the treatment impacts on these
two variables do not differ from the naive prediction obtained from multiplying the treat-
ment impacts on permanent and formal work by their marginal effects on earnings and
work-satisfaction. For example, among the controls, permanent work is associated with a
25 percentage points increase in work satisfaction, and formal work with a 22 percentage
point increase. Individuals invited to the workshop are 6.7 percentage points more likely
to have permanent work, and 5.2 percentage points more likely to have formal work. Mul-
tiplying the two effects and adding up, we predict that work satisfaction should increase
by 2.7 percentage points in the job search support group. The estimated treatment effect on
work satisfaction for this experimental group is 2.1 percentage points, quantitatively close
22 This is not surprising, as attrition in this study is modest and is not significantly correlated with treatment.
18
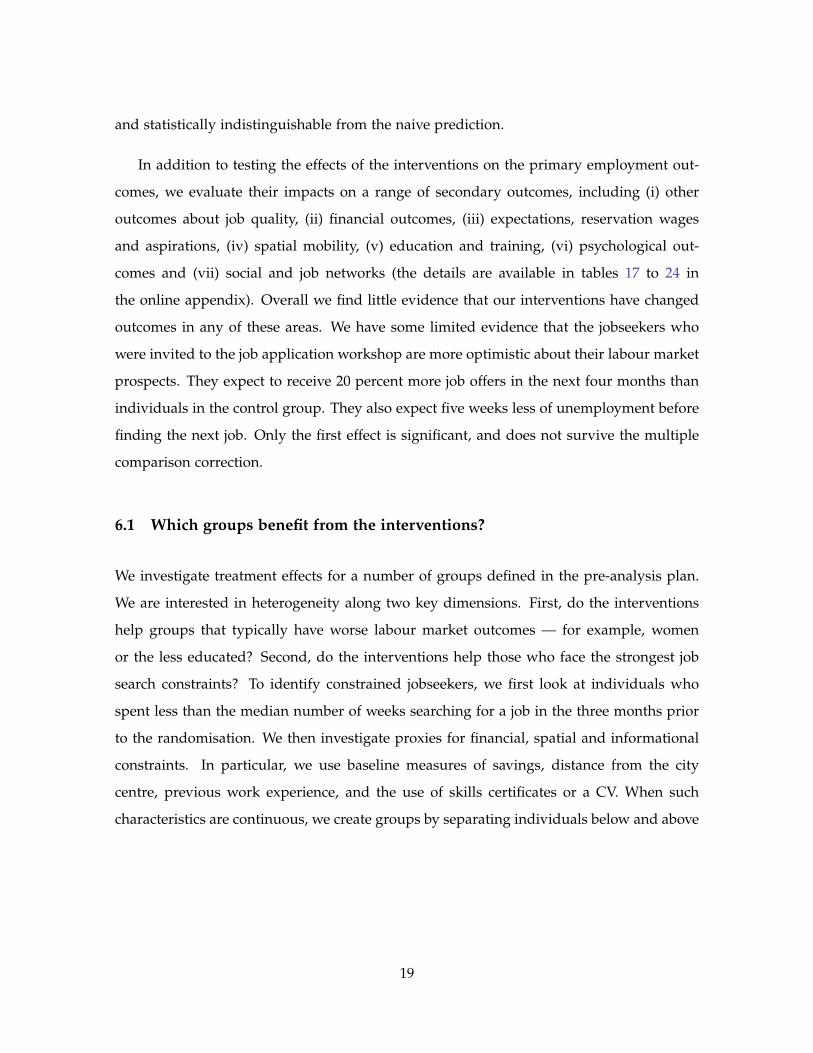
and statistically indistinguishable from the naive prediction.
In addition to testing the effects of the interventions on the primary employment out-
comes, we evaluate their impacts on a range of secondary outcomes, including (i) other
outcomes about job quality, (ii) financial outcomes, (iii) expectations, reservation wages
and aspirations, (iv) spatial mobility, (v) education and training, (vi) psychological out-
comes and (vii) social and job networks (the details are available in tables 17 to 24 in
the online appendix). Overall we find little evidence that our interventions have changed
outcomes in any of these areas. We have some limited evidence that the jobseekers who
were invited to the job application workshop are more optimistic about their labour market
prospects. They expect to receive 20 percent more job offers in the next four months than
individuals in the control group. They also expect five weeks less of unemployment before
finding the next job. Only the first effect is significant, and does not survive the multiple
comparison correction.
6.1 Which groups benefit from the interventions?
We investigate treatment effects for a number of groups defined in the pre-analysis plan.
We are interested in heterogeneity along two key dimensions. First, do the interventions
help groups that typically have worse labour market outcomes — for example, women
or the less educated? Second, do the interventions help those who face the strongest job
search constraints? To identify constrained jobseekers, we first look at individuals who
spent less than the median number of weeks searching for a job in the three months prior
to the randomisation. We then investigate proxies for financial, spatial and informational
constraints. In particular, we use baseline measures of savings, distance from the city
centre, previous work experience, and the use of skills certificates or a CV. When such
characteristics are continuous, we create groups by separating individuals below and above
19

the median level of the characteristic. For each outcome, we run the following specification:
yic =m
∑v=0
[βv +
4
∑f=1
γv f · treat f i · I(xi,pre = v
)+ γv5 · spillover1i · I
(xi,pre = v
)+ γv6 · spillover2i · I
(xi,pre = v
)]+ α · yic,pre + δ · xi0 + µic, (2)
where xi,pre is a categorical variable with values {0, . . . , m}, and I(xi,pre = v
)is a indicator
variable that takes the value of 1 when xi,pre is equal to v. The coefficients γv f estimate the
effect of treatment f for group v.
< Figure 3 here. >
< Figure 4 here. >
< Figure 5 here. >
< Figure 6 here. >
We find that the effects on job quality (permanent and formal work) are concentrated
among the least educated jobseekers and, to some extent, among women. To study het-
erogeneity by education, we separate individuals who have a high school degree and no
further education, individuals who have a high school degree and further vocational train-
ing, and individuals who have a university degree or above. Figures 3 and 4 show that the
effects of both interventions are mostly driven by the group that has only a high school
degree. For this group, the job application workshop raises the probability of permanent
employment by 10 percentage points, and the transport intervention raises it by 5 percent-
age points. On the other hand, treatment effects for individuals with higher educational
attainment are close to zero. In the control group, about 5 percent of individuals with
at most secondary education have a permanent job. The workshop, therefore, triples the
probability of permanent employment for this group, and the transport subsidy doubles
20

it. We find qualitatively similar results for the formality of employment. Impacts are con-
centrated among individuals with a high school degree, who experience an increase in the
probability of formal employment of about one third.
Both the transport intervention and the workshop significantly improve the the quality
of jobs for women. We report these results in figure 5, and table 5 in the appendix. The
transport intervention significantly increases both women’s probability of permanent work
and probability of formal work by 35 percent, while women invited to the workshop are
about 45 percent more likely to work in a permanent job, and 35 percent more likely to
be in formal employment. Effects for men are less robust. The transport intervention does
not increase the probability of permanent employment for men. We can reject the null
hypothesis that the effect of the transport intervention on permanent work is equal for
men and women at the 5 percent level. Further, the job application workshop has a small
and insignificant impact on men’s probability of being in formal employment, and effect
that is statistically different from the effect we measure for women.
Second, the improvement in job quality is concentrated among individuals who do not
search actively at baseline, individuals with no previous work experience, and individuals
with low savings (tables 13, 14 and 15 in the online appendix). For example, individuals
who do not search actively at baseline experience a significant increase in the likelihood of
permanent employment of about 9 percentage points when invited to the job application
workshop. For active jobseekers on the other hand, we estimate an insignificant increase of
4 percentage points.
When we investigate how treatment effects vary with distance from the centre, we ob-
tain a nuanced picture. The permanent employment effects are driven by individuals who
live within 6km of the city centre. Treatment effects are smaller in magnitude and insignifi-
cant for individuals who live in the periphery. However, individuals living in the periphery
experience a significant and marked decline in the probability of self employment thanks
to the transport intervention. This effect is not observed for individuals living closer to the
centre and for individuals invited to the job application workshop. In the final section of
the paper we discuss this finding in greater deal.
21

6.2 Mechanisms
How do treated individuals obtain jobs of higher quality? We study three possible mech-
anisms. First, individuals who are offered the interventions can search more intensely,
for example they can dedicate more time to job search and they can make more applica-
tions. Second, treated individuals can change their search strategy. This can either involve
searching for different jobs or using different search methods. Finally, treated jobseekers can
become more effective at job search. We measure search effectiveness by computing the
ratio of job interviews to applications and the ratio of job offers to applications in the 12
months prior to the endline interview.
In this section, we make extensive use of the high frequency data from the phone
interviews. Pooling data from the phone calls across all weeks enables us to estimate
the weekly impact of the interventions and the overall trajectory of treatment effects. We
estimate two regression models. First, to obtain weekly impact estimates, we run:
yitc =ηt +4
∑g=1
Eg
∑w=Sg
βgw · treatgi · dwit
+2
∑s=1
Es
∑w=Ss
γsw · spilloversi · dwit + αt · yitc,pre + δ · xi0 + µitc. (3)
where ηt is a time-specific intercept term. We allow the effect of the baseline control
term yic,pre to vary over time by estimating αt for each time period, while we estimate
time-invariant effects of individual covariates xi0. w is a variable indicating the number of
weeks since each treated individual began receiving his/her treatment. w = 0 in the week
when the treatment started, and is negative for weeks before that. dwit is a dummy variable
equal to 1 in period t if an individual started receiving their treatment w periods ago. For
example, for an individual assigned to receive the transport treatment from week 15 of
22
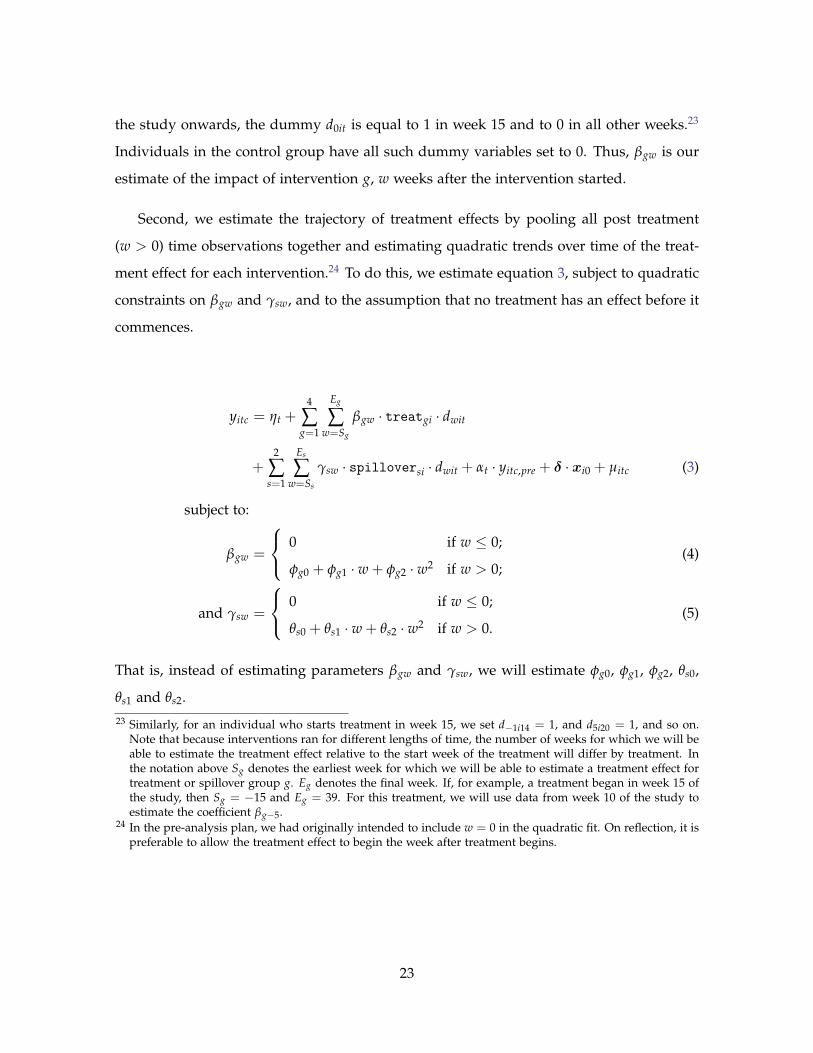
the study onwards, the dummy d0it is equal to 1 in week 15 and to 0 in all other weeks.23
Individuals in the control group have all such dummy variables set to 0. Thus, βgw is our
estimate of the impact of intervention g, w weeks after the intervention started.
Second, we estimate the trajectory of treatment effects by pooling all post treatment
(w > 0) time observations together and estimating quadratic trends over time of the treat-
ment effect for each intervention.24 To do this, we estimate equation 3, subject to quadratic
constraints on βgw and γsw, and to the assumption that no treatment has an effect before it
commences.
yitc = ηt +4
∑g=1
Eg
∑w=Sg
βgw · treatgi · dwit
+2
∑s=1
Es
∑w=Ss
γsw · spilloversi · dwit + αt · yitc,pre + δ · xi0 + µitc (3)
subject to:
βgw =
0 if w ≤ 0;
φg0 + φg1 · w + φg2 · w2 if w > 0;(4)
and γsw =
0 if w ≤ 0;
θs0 + θs1 · w + θs2 · w2 if w > 0.(5)
That is, instead of estimating parameters βgw and γsw, we will estimate φg0, φg1, φg2, θs0,
θs1 and θs2.23 Similarly, for an individual who starts treatment in week 15, we set d−1i14 = 1, and d5i20 = 1, and so on.
Note that because interventions ran for different lengths of time, the number of weeks for which we will beable to estimate the treatment effect relative to the start week of the treatment will differ by treatment. Inthe notation above Sg denotes the earliest week for which we will be able to estimate a treatment effect fortreatment or spillover group g. Eg denotes the final week. If, for example, a treatment began in week 15 ofthe study, then Sg = −15 and Eg = 39. For this treatment, we will use data from week 10 of the study toestimate the coefficient βg−5.
24 In the pre-analysis plan, we had originally intended to include w = 0 in the quadratic fit. On reflection, it ispreferable to allow the treatment effect to begin the week after treatment begins.
23
6.2.1 Effects on job search intensity
We find that the transport intervention increases the intensity of search. In the weeks when
treatment is available, treated individuals are about 25 percentage points more likely to
search for a vacancy at the job board – a form of job search that requires transport. This
represents a fivefold increase over individuals in the control group.25 In the same period,
treated individuals are about 12.5 percent more likely to be doing any job search activity
than control individuals (a 5 percentage point effect over a control mean of 0.4). This effect
decreases linearly after the transport intervention ends. In the model where we impose
quadratic constraints, we are able to estimate a significant effect on job search at least 2
months after the end of the intervention. The job application workshop, on the other hand,
does not affect the likelihood of searching for a job. Figures figures 7, 8 and 9 illustrate
these findings.
We find that study participants temporarily decrease the amount of work they take
during weeks when the transport subsidy is available (figure 10). The effect is driven by a
reduction of work in self-employment (figure 11). Franklin (2015) finds a similar effect of
transport subdisies for a sample of active jobseekers.
More frequent search activity does not translate in a higher number of job applica-
tions for individuals in the transport group. On average, individuals in the control group
place 1.3 applications for temporary jobs and 2.3 applications for permanent jobs in the 12
months before the endline interview. As shown in table 4, these numbers are not signifi-
cantly different for either the transport or the workshop interventions.
< Figure 7 here. >
< Figure 8 here. >
< Figure 9 here. >
25 Throughout the course of phone survey, an average of 5 percent of control individuals search at the jobboards in any given week.
24

< Figure 10 here. >
6.2.2 Effects on search efficacy
Our treatments significantly increase the efficacy of job search for the high impact groups
described above. In the full sample, control respondents receive a job offer of permanent
employment every 6.1 applications. Respondents in the two treatment groups receive an
offer nearly every 4 applications. These effects, described in table 4 are however not sta-
tistically significant. Focusing on high-school graduates, one of the high-impact groups of
the intervention, reveals stronger and statistically significant effects. Control individuals
with a high school degree receive an offer for a permanent job every 10.6 applications. Both
interventions reduce that figure to 5.2 applications, a very large impact. In the discussion
section we present more analysis that allows us to understand what drives the increased
search efficacy among workers with only secondary education. The next section rules out
the possibility that this is due to a change in the types of jobs they search for after the
intervention.
6.2.3 Effects on the types of jobs sought by study participants
We do not find evidence suggesting that treated individuals search for different jobs com-
pared to individuals in the control group. We test this hypothesis in three different ways.
First, we use self-reported data on reservation wages and find that treated individuals
report being willing to work for the same wages as control individuals.26 This holds on av-
erage, as well as within educational categories ( see table 20 and figure 20 in the appendix).
Second, in the endline survey we ask individuals whether they stopped searching for some
occupation in the previous 12 months. This question was aimed at capturing jobseekers’
discouragement. We find that individuals in the three experimental groups are equally
likely to give up searching for at least one occupation and to stop searching for white col-
26 This is consistent with the fact that average earnings are similar across experimental groups, as discussedabove. Quantile regression analysis further confirms that the interventions did not affect earnings at thebottom of the distribution.
25

lar jobs. Finally, in figures 1 and 2 we compare the probability of working in a number
of different occupations across the three groups. Occupation profiles look similar for the
three groups, with a slight shift towards white collar jobs for individuals in the transport
and workshop groups. Overall, this evidence suggests that treated individuals look for
similar occupations and are willing to work for similar wages. The effects on job search
efficacy are thus unlikely to be driven by jobseekers’ decision to search for ‘easier-to-get’
permanent and formal jobs.
6.3 Indirect effects on untreated jobseekers
In this section, we study the outcomes of untreated jobseekers who live close to program
participants. The benefits of the interventions can extend to this group if the young job-
seekers who are offered the programs share information, job referrals or resources with
friends and acquaintances in the same neighbourhood. Information and risk sharing of
this kind have been documented in several recent studies on developing countries’ labour
markets (Angelucci and De Giorgi, 2009; Magruder, 2010).27 On the other hand, untreated
youth living close to program recipients can experience negative effects if these groups
compete for scarce jobs in the same neighbourhood.
As explained in the design section, some eligible respondents living in clusters assigned
to treatment are not offered the program. This is a ‘partial population experiment’ (Moffitt
et al., 2001), which allows us to compare untreated individuals living close to program
participants to untreated individuals living in clusters where no jobseeker has been offered
the program. We report the results of this analysis in columns 4 and 5 of table 3.
We do not find statistically significant differences between untreated individuals living
in geographical clusters assigned to one of the two interventions and untreated individuals
in pure control clusters. However, we are less powered to detect indirect effects compared
to the direct effects we studied above. For example, we estimate that untreated individuals
in clusters assigned to the job application workshop experience an increase in the proba-
27 The descriptive evidence from our surveys further confirms that social networks are an important source ofinformation about work opportunities and are used extensively for job referrals.
26
bility of formal work of 5.6 percentage points. This effect is of the same magnitude as the
treatment effect we estimate on individuals who are offered the job application workshop,
but it is not statistically significant.
We also randomly vary the proportion of individuals treated in the clusters that re-
ceived the transport intervention. This allows us to run a regression of the form:
yic =κ + β20 · S20c · Ci + β40 · S40c · Ci + β75 · S75c · Ci + β90 · S90c · Ci
+ γ20 · S20c · Ti + γ40 · S40c · Ti + γ75 · S75c · Ti + γ90 · S90c · Ti
+ α · yic,pre + δ · xi0 + µic. (6)
where the sample is restricted to individuals in clusters assigned to pure control and
clusters assigned to the transport intervention. Ti identifies individuals who have been
assigned to the transport treatment, while Ci identifies individuals who have not been as-
signed to the transport treatment. S20c is a dummy variable for individuals living in a
cluster where 20% of individuals were offered the transport treatment. Thus, β20 captures
the difference in outcomes between untreated individuals in these clusters and untreated
individuals in clusters where nobody was treated. Further, γ20 measures the difference
in outcomes between treated individuals in S20c clusters and untreated individuals in un-
treated clusters. S40c, S75c, S90c, and the remaining β and γ coefficients have a similar
interpretation.
The indirect effects of the transport treatment depend on the level of saturation. As the
transport intervention has direct impacts on permanent and formal work, we first study
indirect impacts on these two dimensions. In figures 12 and 13 we present estimates from
model 6. We document a positive indirect effect for control individuals in clusters with 25
(40) percent saturation for written agreement (permanent work). We also document that
untreated individuals in clusters with 90 percent saturation are 5.6 percentage points less
27
likely to be in permanent employment than individuals in pure control clusters.28
7 Discussion: What constraints did the interventions relax?
In this section, we present some additional analysis to explore the nature of the constraints
faced by the jobseekers in our study and the extent to which the interventions relaxed these
constraints.29
7.1 Spatial constraints
We have argued that high transport costs make job search difficult for the young unem-
ployed. These costs are particularly high for individuals that live far away from the centre
of the city. If transport costs are indeed a barrier to job search, these individuals may be
more likely to work in sectors of ‘last resort’ compared to those residing closer to the centre
of the city. Some forms of self-employment are thought to be sectors of ‘last resort’ (Falco
and Haywood, 2016). Further, if our interventions relax this spatial constraint to job search,
we expect to observe a weaker spatial pattern in employment outcomes among treated
individuals. We investigate these hypotheses by computing the smoothed local polyno-
mial estimate of the relationship between distance from the city centre and various for of
employment.
We find that in the control group the probability of being self-employed increases al-
most linearly with distance from the city centre. The probability of having any employ-
ment, on the other hand, does not change with distance. This suggests that spatial barriers
influence the occupational structure of the urban labour market and is consistent with
a model where high transport costs distort job search. This finding complements recent
work on the effect of transportat costs on the occupational structure in villages (Asher and
Novosad, 2015).
28 For the regression on permanent work we can reject the null hypothesis that all β coefficients are equal to0.
29 The analysis in this section was not registered in the pre-analysis plan.
28

Most importantly, we find that the transport intervention eliminates the spatial patterns
of self-employment observed in the control group. Figure 17 shows that in the transport
group, individuals who reside far from the city centre have the same probability of being in
self-employment as individuals who live close to the centre of the city. Regression results
with differential effects of distance by group (either linear or quadratic) confirm that the
transport treatment significantly alters the effect of distance. These regressions confirm that
lowering the monetary cost of transport to the city centre removes the spatial influence on
the probability of self-employment: the effect of distance is statistically indistinguishable
from zero for the treatment group.
< Figure 17 here. >
Figure 18 in the appendix shows that the job application workshop similarly mitigates
the effects of space on the probability of self employment. Individuals in this experimental
group do not search more intensely, but become more effective in job search. This suggests
that effects of space can also be mitigated by improving search efficacy.
7.2 Information constraints
Did our interventions enable the labour market to separate more effectively high skilled
workers from low skilled workers? To address this question we exploit the detailed data
from the personnel selection tests. For each test, we regress individual test scores on
a rich set of covariates, including demographic characteristics, educational achievement,
and the work history of study participants. We choose this set of variables because they
can be readily signalled to an employer using a CV, a cover letter, or during the course
of an interview. Using the estimated coefficients, we obtain predicted test scores for all
individuals in our sample. Our objective is to study how predicted skills correlate with
labour market outcomes in different experimental groups.
Suppose that the job application workshop has no effect on participants’ ability to sig-
nal their skills to employers. In that case, we would expect the same correlation between
29

predicted test scores and employment outcomes in the treatment and control groups. In
contrast, suppose that the job application workshop allows individuals to signal their skills
more effectively. In this scenario, we expect to find a larger positive correlation between
predicted test scores and employment outcomes among individuals invited to the work-
shop, compared to the control group. That is, we expect the workshop to be particularly
useful for individuals with strong observable characteristics, who can benefit from being
more able to convey their attractive employment characteristics.
Our results suggest the the ability to signal skills has improved for low-education job-
seekers — the group which experienced the strongest effects from the job application work-
shop. In this group, the correlation between predicted skills and having a permanent job
is significantly stronger among individuals invited to the workshop compared to the con-
trol condition. We also estimate that the correlation between predicted skills and earnings
increases, although insignificantly so. We report this analysis in table 27 and figure 15. We
are unable to find similar effects when comparing low education jobseekers in the transport
group to low education jobseekers in the control condition.30 So this effect is unique to the
job application workshop.
We also find that, among low-education individuals in the control group, high predicted
skills are not associated with better labour market outcomes (see table 27). The labour
market for workers with low levels of education does not seem to separate jobseekers on
basis of the skills which we measure through our tests. This separation occurs, however,
after we introduce the job application workshop program.
To measure predicted skills, we used characteristics that could be easily included in a
CV, cover letter, or discussed in an interview. The orientation component of the job appli-
cation workshop is aimed at making workers more effective in this part of the application
process. Thus the results reported in this section suggest a positive effect of the orientation
component. Skills certification, on the other hand, should enable workers to signal skills
that are ‘hard to observe’, and not necessarily correlated with jobseekers’ observable char-
acteristics. Does the additional information revealed in the certificates allow individuals to30 This result is not reported, but is available upon request.
30

improve their employment outcomes? We turn to this question in the next section.
7.2.1 The role of certification
We look for evidence that the certification component of the workshop leads to better
employment outcomes for individuals who scored well on the tests. To this end, we employ
a regression discontinuity design. The certificates issued to respondents report test scores
in discrete bands. The original test score is not reported on the certificates and it not
disclosed to study participants. This allows us to study the impact of being placed in a
higher band, controlling for the original test score. The intuition behind this test is simple:
if the information that we disclose is driving at least part of the treatment effect, we would
expect a discrete improvement in outcomes when individuals are placed in a higher band.
We perform this analysis for the aggregate score and the Raven test score since we find
that these measures have the strongest predictive power for endline employment outcomes.
Scores below the median were lumped together into a bottom band, while individuals
scoring above the median were divided into five bands for each of the higher deciles of the
test score distribution. We implement local linear regression to control for raw test scores
on either side of the cut-offs, iteratively moving across all 5 relevant cut-offs. We use the
optimal bandwidth selection rule suggested by Imbens and Kalyanaraman (2012), but all
results are consistent with different bandwidth selections.31
We find no evidence that scoring in a higher band, across any of the test scores, leads
to a significant improvement in employment outcomes, relatively to individuals scoring
in a lower band, once we control for the test score itself. Notably this is true for the two
main outcomes of job quality used in the paper so far: permanent work, and work with a
written agreement. Figure 16 illustrates this result, by showing the effect of being above
the median aggregate test score on having a permanent job. The full set of results, using
31 The optimal bandwidth selection is performed using the Stata command given by Nichols (2007). Theselected bandwidth differs across test outcomes and band cut-offs. For example the optimal bandwidth forthe aggregate test score at the 50th percentile is 0.62, where the median of the aggregate score is 4.843 withstandard deviation of 0.88. In cases where the selected bandwidth is larger than the reported test score banditself, we check that the results are robust to restricting the bandwidth to the range within the marks band.
31

optimal and other bandwidth selections, is available on request.
< Figure 16 here. >
We interpret these results as suggestive evidence that the information about ‘hard-
to-observe’ skills carried by the certificates is not crucial in driving the effect of the job
application workshop. Rather, the intervention helps workers improve the way they sig-
nal observable skills. Two further pieces of evidence corroborate these conclusions. First,
self-reported data on the use of the certificates indicates that about 58 percent of the re-
spondents who received the certificate and made at least one job application did not show
the certificate to their prospective employer. Second, the residuals from a regression of
test scores on observable characteristics (a rough proxy for unobservable workers’ abilities)
do not correlate positively with employment outcomes. In sum, while the job application
workshop increased workers’ capacity to signal their easier-to-observe skills, helping em-
ployers separate workers on the basis of idiosyncratic and hard-to-observe skills is more
challenging.
8 Conclusions
Cities in the developing world are growing at an unprecedented pace. A key challenge
for policy makers is to identify effective interventions to support the large number of in-
dividuals who find it hard to access urban labour markets: the young, women and those
without tertiary education. In this paper, we conduct a randomised evaluation of two in-
terventions to improve the labour market prospects of young Ethiopian jobseekers. The
first intervention is a transport subsidy that covers the cost of travelling to the centre of the
city to look for employment. The second intervention is a job application workshop with
two components: certification of skills and orientation on how to make effective job ap-
plications through CVs, cover letters, and interviews. We hypothesised that the programs
would enable jobseekers to search more intensely and more effectively, resulting in im-
proved employment outcomes. A fortnightly panel of short phone interviews allows us to
32

study these mechanisms in detail. We also randomised the proportion of treated jobseekers
within geographical clusters to study the effects of non-participants residing in program
localities.
We find that both interventions help jobseekers to secure better jobs. Individuals who
are offered the job application workshop are 30 percent more likely to have a permanent job,
and nearly 25 percent more likely to have a formal job than individuals in the control group.
The transport subsidy leads to a 25 percent increase in formal employment. These effects
are statistically significant and robust to a correction for multiple comparisons. Impacts
are concentrated among the socio-demographic groups that have the worst employment
outcomes at baseline: women and those with at most secondary education.
On average, we do not find indirect effects on untreated individuals living in the prox-
imity of treated ones. Exploring variation in the intensity of the transport treatment across
areas, we find some positive impacts on the job quality of untreated neighbours when the
proportion of treated jobseekers is low and some negative effects when that proportion is
very high (90%).
Detailed analysis based on a high-frequency phone survey reveals that the interven-
tions operate through the hypothesised mechanisms. The transport intervention allows
jobseekers to search more intensely, while search efficacy improves for jobseekers in both
the transport and the workshop groups. We also find that both interventions relax spatial
constraints on occupational choices. The job application workshop also overcomes a cru-
cial informational barrier by allowing low educated workers to better signal their skills to
employers and earn higher returns on them. These results suggest that interventions of
this kind can ease spatial constraints on job search and correct information asymmetries
that may damage workers’ prospects when ability cannot be easily signalled.
In conclusion, this paper shows that active labour market programs can improve the
employment outcomes of urban jobseekers in developing countries, and especially the
most disadvantaged: the young, women, and those without tertiary education. Explor-
ing whether job-search support can be successfully bundled with interventions that in-
33

crease workers’ cognitive and non-cognitive skills (Card et al., 2011; Attanasio et al., 2011;
Blattman et al., 2015; Ghosal et al., 2015; Heller et al., 2015; Hirshleifer et al., 2015) and how
to best coordinate programs that assist job search and programs that foster entrepreneur-
ship (Blattman et al., 2013; Fafchamps et al., 2014; Fafchamps and Quinn, 2015) are inter-
esting avenues for future research.
34

References
Abebe, G., S. Caria, P. Falco, M. Fafchamps, S. Franklin, and S. Quinn (2015). Addis AbabaFirm Survey.
African Economist (2012). 50 largest cities in africa.
Angelucci, M. and G. De Giorgi (2009). Indirect Effects of an Aid Program: How do CashTransfers Affect Ineligibles’ Consumption? The American Economic Review, 486–508.
Asher, S. and P. Novosad (2015). Market Access and Structural Transformation: Evidencefrom Rural Roads in India. Working Paper.
Attanasio, O., A. Kugler, and C. Meghir (2011). Subsidizing Vocational Training for Dis-advantaged Youth in Colombia: Evidence from a Randomized Trial. American EconomicJournal: Applied Economics, 188–220.
Baird, S., C. McIntosh, and B. Özler (2011). Cash or Condition? Evidence from a CashTransfer Experiment. The Quarterly Journal of Economics.
Beaman, L., N. Keleher, and J. Magruder (2013). Do Job Networks Disadvantage Women?Evidence from a Recruitment Experiment in Malawi. Working Paper.
Benjamini, Y., A. M. Krieger, and D. Yekutieli (2006). Adaptive Linear Step-up Proceduresthat Control the False Discovery Rate. Biometrika 93(3), 491–507.
Blattman, C., N. Fiala, and S. Martinez (2013). Generating Skilled Self-Employment in De-veloping Countries: Experimental Evidence from Uganda. Quarterly Journal of Economics.
Blattman, C., J. C. Jamison, and M. Sheridan (2015). Reducing Crime and Violence: Exper-imental Evidence on Adult Noncognitive Investments in Liberia.
Bowles, S., H. Gintis, and M. Osborne (2001). Incentive-Enhancing Preferences: Personality,Behavior, and Earnings. The American Economic Review 91(2), 155–158.
Bruhn, M. and D. McKenzie (2009). In Pursuit of Balance: Randomization in Practicein Development Field Experiments. American Economic Journal: Applied Economics 1(4),200–232.
Bryan, G., S. Chowdhury, and A. M. Mobarak (2014). Underinvestment in a ProfitableTechnology: The Case of Seasonal Migration in Bangladesh. Econometrica 82(5), 1671–1748.
Bryan, G. and M. Morten (2015). Economic Development and the Spatial Allocation ofLabor: Evidence from Indonesia. Working Paper.
Card, D., R. Chetty, and A. Weber (2007). Cash-on-Hand and Competing Models of In-tertemporal Behavior: New Evidence from The Labor Market. Quarterly Journal of Eco-nomics 122(4).
35

Card, D., P. Ibarrarán, F. Regalia, D. Rosas-Shady, and Y. Soares (2011). The Labor MarketImpacts of Youth Training in the Dominican Republic. Journal of Labor Economics 29(2),267–300.
Caria, S. (2015). Choosing Connections. Experimental Evidence from a Link-FormationExperiment in Urban Ethiopia. Working Paper.
Chamorro-Premuzic, T. and A. Furnham (2010). The Psychology of Personnel Selection. Cam-bridge University Press.
Chetty, R. (2008). Moral Hazard versus Liquidity and Optimal Unemployment Insurance.Journal of political economy 116(2), 173–234.
Clark, A. E. and A. J. Oswald (1994). Unhappiness and unemployment. The EconomicJournal 104(424), 648–659.
Crépon, B., E. Duflo, M. Gurgand, R. Rathelot, and P. Zamora (2013). Do Labor MarketPolicies have Displacement Effects? Evidence from a Clustered Randomized Experiment.The Quarterly Journal of Economics 128(2), 531–580.
CSA (2014). Key Findings on the 2014 Urban Employment Unemployment Survey.
Dal Bó, E., F. Finan, and M. A. Rossi (2013). Strengthening State Capabilities: The Role ofFinancial Incentives in the Call to Public Service. The Quarterly Journal of Economics 128(3),1169–1218.
Davison, W. (2014, August). Addis Ababa Doubling in Size Gives Africa Another Hub.Bloomberg.
Fafchamps, M., D. McKenzie, S. Quinn, and C. Woodruff (2014). Microenterprise Growthand the Flypaper Effect: Evidence from a Randomized Experiment in Ghana. Journal ofdevelopment Economics 106, 211–226.
Fafchamps, M. and S. Quinn (2015). Aspire. Technical report, NBER Working Paper.
Falco, P. and L. Haywood (2016). Entrepreneurship versus Joblessness: Explaining the Risein Self-Employment. Journal of Development Economics 118, 245–265.
Fisman, R., P. Jakiela, and S. Kariv (2015). How did distributional preferences changeduring the great recession? Journal of Public Economics 128, 84–95.
Franklin, S. (2015). Location, Search Costs and Youth Unemployment: A Randomized Trialof Transport Subsidies in Ethiopia. CSAE Working Paper WPS/2015-11.
Ghosal, S., S. Jana, A. Mani, S. Mitra, and S. Roy (2015). Sex Workers, Self-Image andStigma: Evidence from Kolkata Brothels. Working Paper.
Gollin, D. and R. Rogerson (2010). Agriculture, Roads, and Economic Development inUganda. NBER Working Paper.
36
Groh, M., N. Krishnan, D. J. McKenzie, and T. Vishwanath (2012). Soft Skills or Hard Cash?The Impact of Training and Wage Subsidy Programs on Female Youth Employment inJordan. World Bank Policy Research Working Paper (6141).
Groh, M., D. McKenzie, N. Krishnan, and T. Vishwanath (2016). The Impact of Soft SkillsTraining on Female Youth Employment: Evidence from a Randomized Experiment inJordan.
Groh, M., D. McKenzie, N. Shammout, and T. Vishwanath (2015). Testing the Importanceof Search Frictions and Matching Through a Randomized Experiment in Jordan. IZAJournal of Labor Economics 4(1), 1–20.
Heckman, J. J., J. Stixrud, and S. Urzua (2006). The Effects of Cognitive and NoncognitiveAbilities on Labor Market Outcomes and Social Behavior. NBER Working Paper.
Heller, S. B., A. K. Shah, J. Guryan, J. Ludwig, S. Mullainathan, and H. A. Pollack (2015).Thinking, Fast and Slow? Some Field Experiments to Reduce Crime and Dropout inChicago.
Hirshleifer, S., D. McKenzie, R. Almeida, and C. Ridao-Cano (2015). The Impact of Voca-tional Training for the Unemployed: Experimental Evidence from Turkey. The EconomicJournal.
Imbens, G. and K. Kalyanaraman (2012). Optimal bandwidth choice for the regressiondiscontinuity estimator. Review of Economic Studies 79(3).
Jensen, R. (2012). Do Labor Market Opportunities Affect Young Women’s Work and FamilyDecisions? Experimental Evidence from India. The Quarterly Journal of Economics.
Kaas, L. and P. Kircher (2015, October). Efficient Firm Dynamics in a Frictional LaborMarket. American Economic Review 105(10), 3030–60.
Magruder, J. R. (2010). Intergenerational Networks, Unemployment, and Persistent In-equality in South Africa. American Economic Journal: Applied Economics 2(1), 62–85.
Moffitt, R. A. et al. (2001). Policy Interventions, Low-Level Equilibria, and Social Interac-tions. Social dynamics 4(45-82), 6–17.
Nichols, A. (2007, November). RD: Stata module for regression discontinuity estimation.Statistical Software Components, Boston College Department of Economics.
OECD (2013). OECD Skills Outlook 2013: First Results from the Survey of Adult Skills. OECDPublishing.
OECD (2015). OECD Employment Outlook 2015.
Pallais, A. (2014). Inefficient Hiring in Entry-Level Labor Markets. The American EconomicReview 104(11), 3565–3599.
Phillips, D. C. (2014). Getting to Work: Experimental Evidence on Job Search and Trans-portation Costs. Labour Economics 29, 72–82.
37
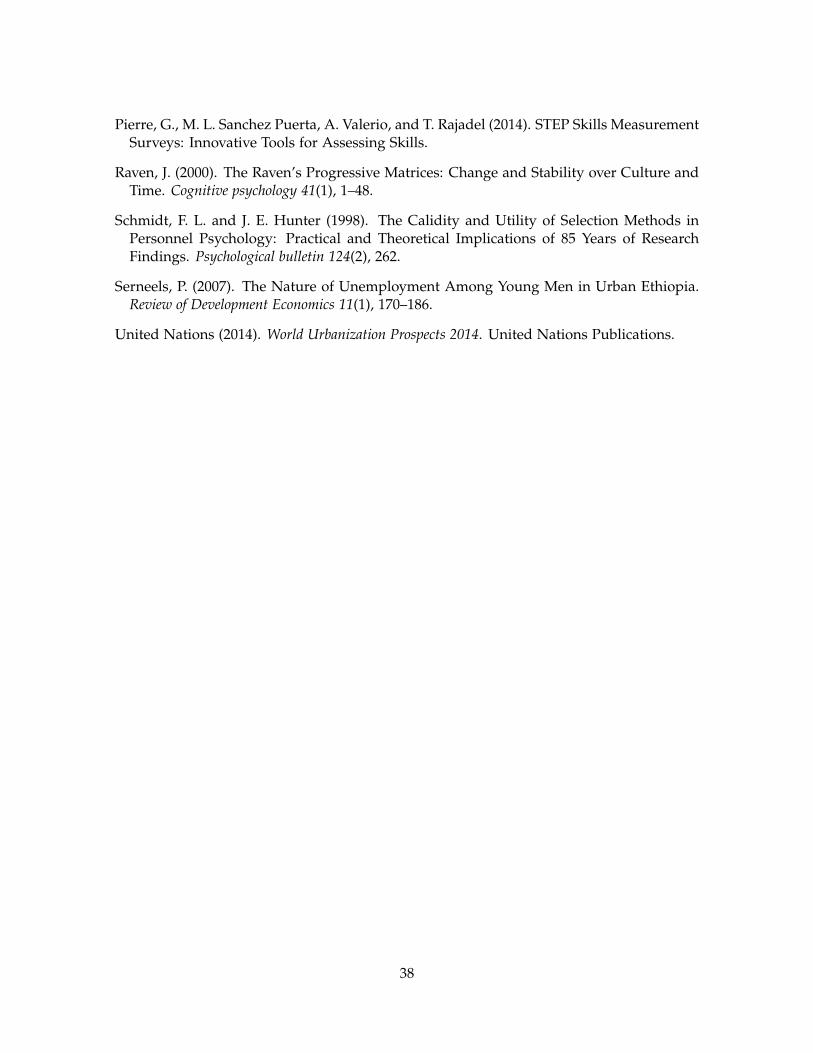
Pierre, G., M. L. Sanchez Puerta, A. Valerio, and T. Rajadel (2014). STEP Skills MeasurementSurveys: Innovative Tools for Assessing Skills.
Raven, J. (2000). The Raven’s Progressive Matrices: Change and Stability over Culture andTime. Cognitive psychology 41(1), 1–48.
Schmidt, F. L. and J. E. Hunter (1998). The Calidity and Utility of Selection Methods inPersonnel Psychology: Practical and Theoretical Implications of 85 Years of ResearchFindings. Psychological bulletin 124(2), 262.
Serneels, P. (2007). The Nature of Unemployment Among Young Men in Urban Ethiopia.Review of Development Economics 11(1), 170–186.
United Nations (2014). World Urbanization Prospects 2014. United Nations Publications.
38
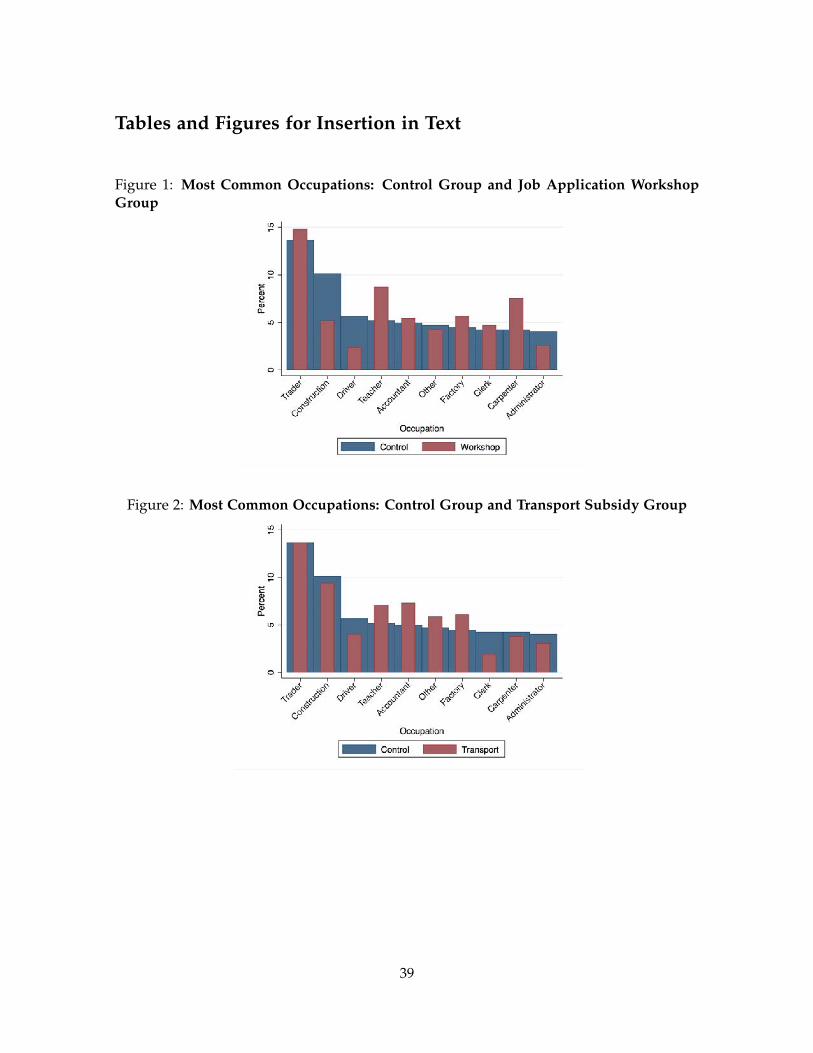
Tables and Figures for Insertion in Text
Figure 1: Most Common Occupations: Control Group and Job Application WorkshopGroup
Figure 2: Most Common Occupations: Control Group and Transport Subsidy Group
39
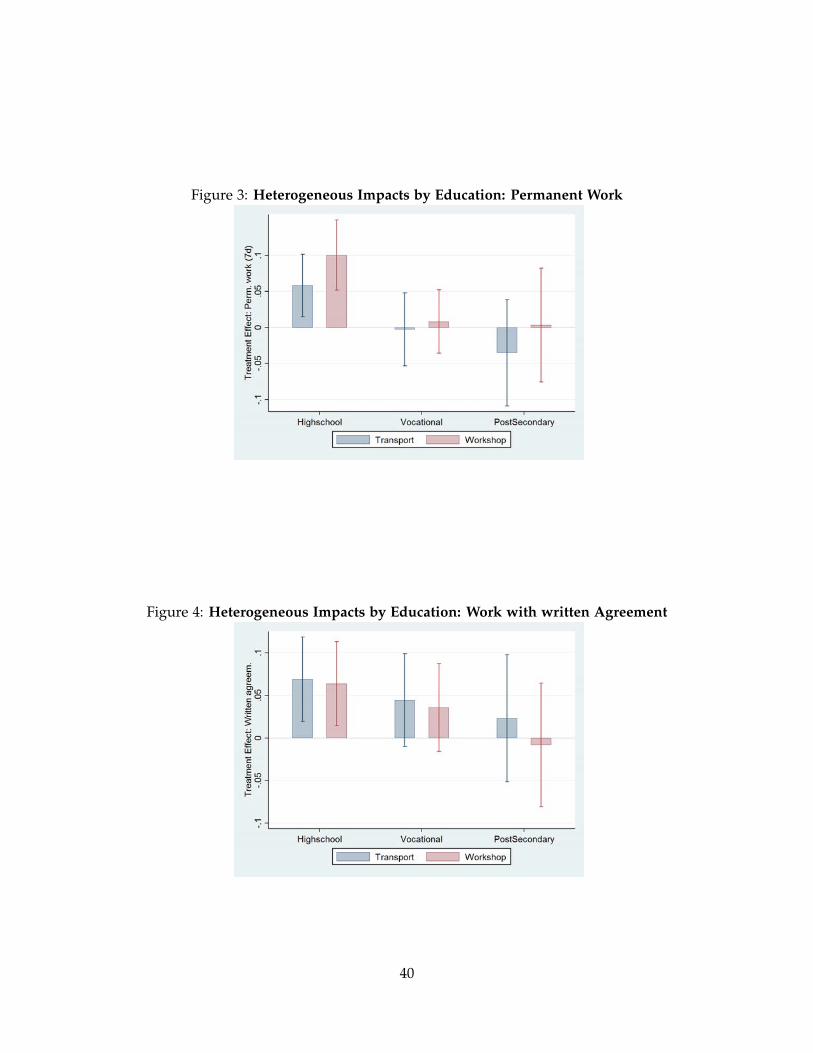
Figure 3: Heterogeneous Impacts by Education: Permanent Work
Figure 4: Heterogeneous Impacts by Education: Work with written Agreement
40
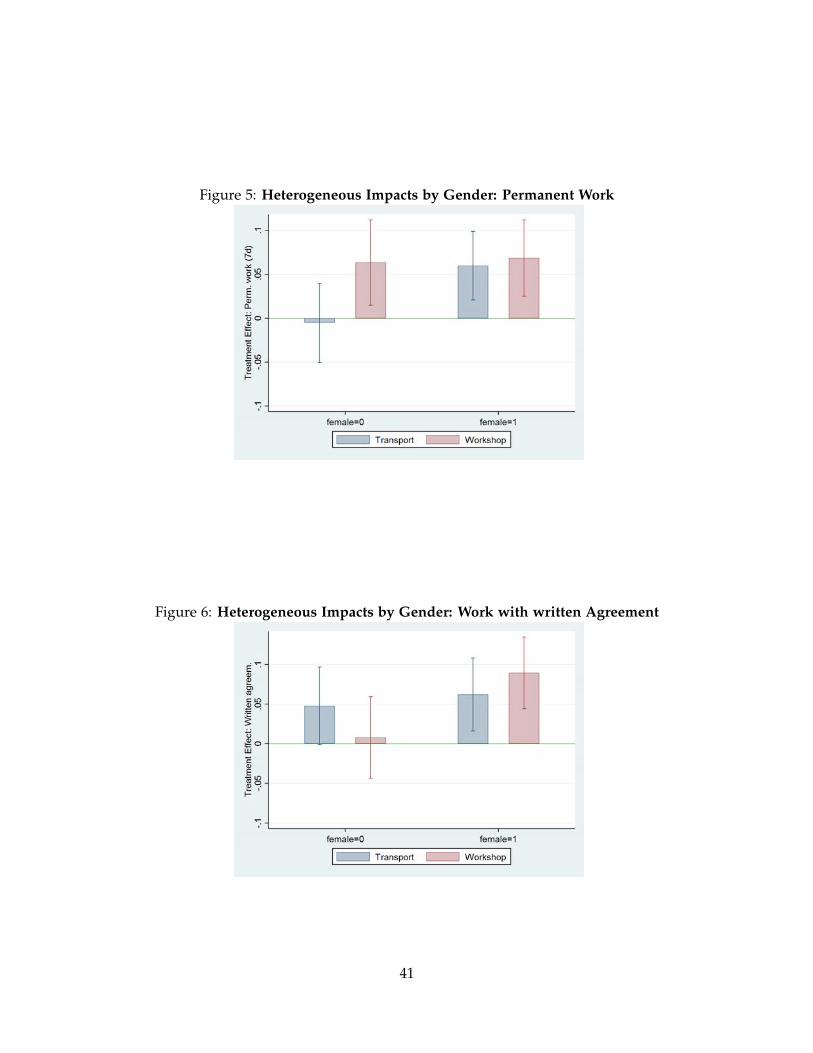
Figure 5: Heterogeneous Impacts by Gender: Permanent Work
Figure 6: Heterogeneous Impacts by Gender: Work with written Agreement
41

Figure 7: Trajectory of Impact on Job Search at the Job Boards: Transport Treatment
Figure 8: Trajectory of Impact on Job Search: Transport Treatment
42

Figure 9: Trajectory of Impact on Job Search: Job application workshop
Figure 10: Trajectory of Impact on Employment: Transport Treatment
43
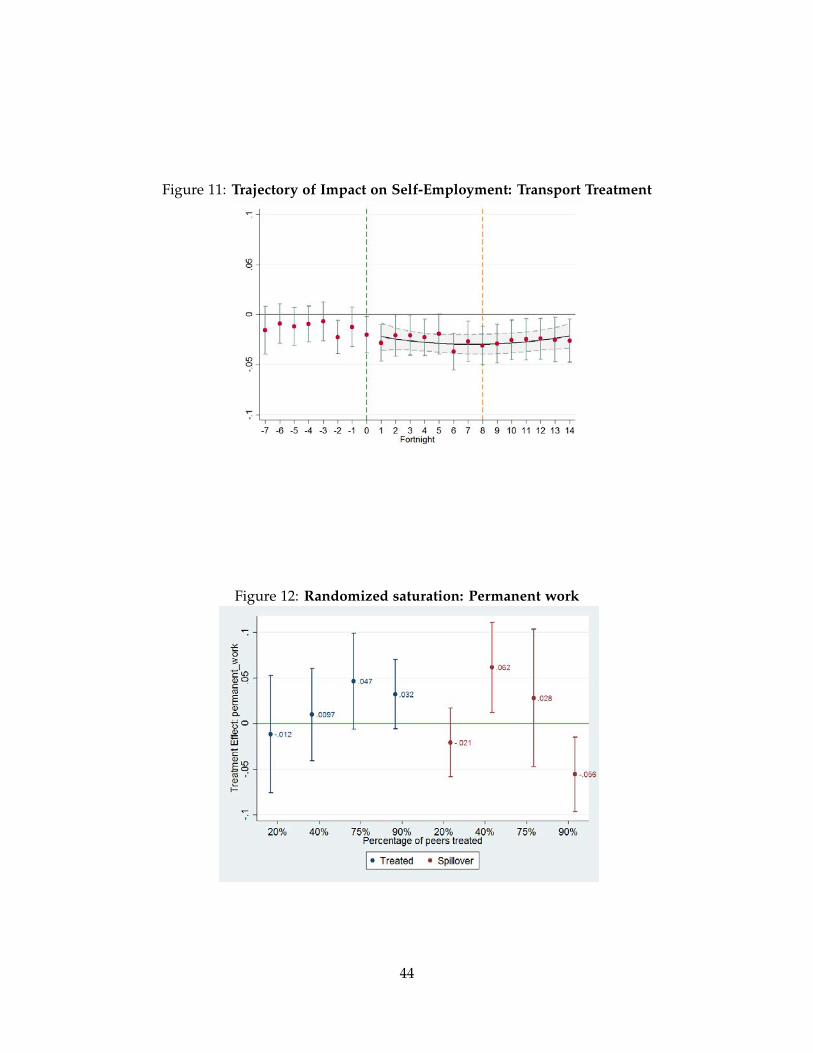
Figure 11: Trajectory of Impact on Self-Employment: Transport Treatment
Figure 12: Randomized saturation: Permanent work
44

Figure 13: Randomized saturation: Written agreement
45
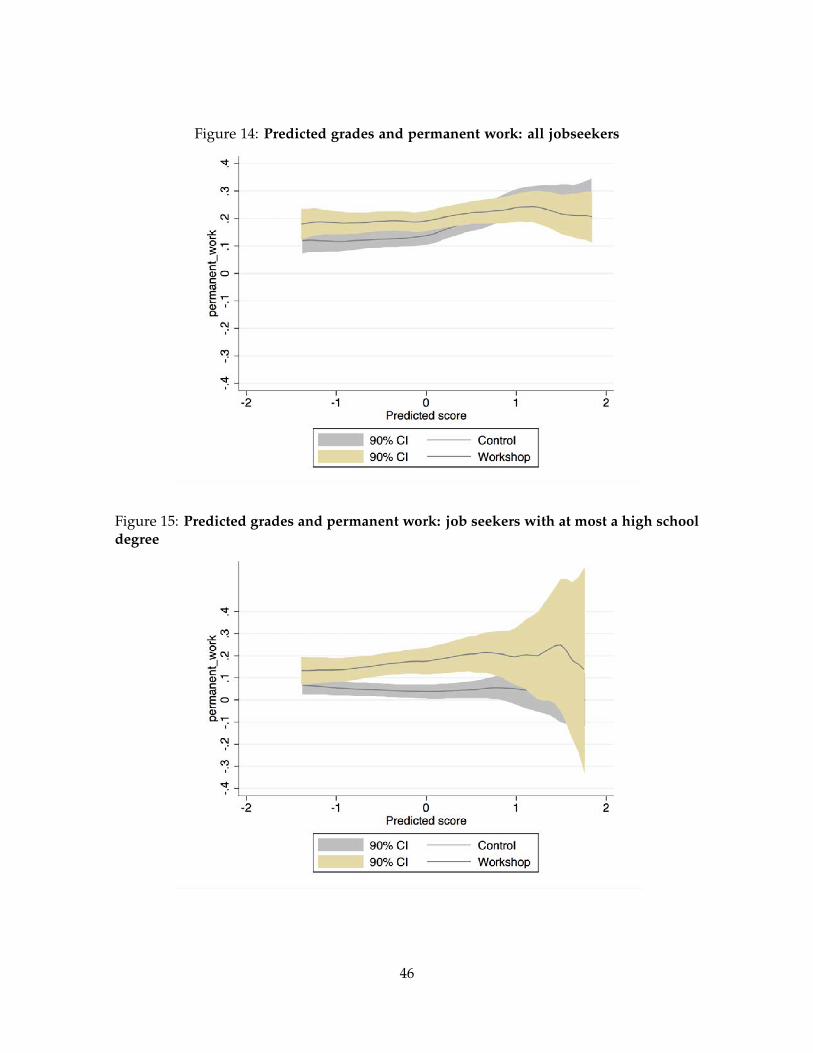
Figure 14: Predicted grades and permanent work: all jobseekers
Figure 15: Predicted grades and permanent work: job seekers with at most a high schooldegree
46

Figure 16: Impact of aggregate test scores on permanent work: Scoring above the median
47

Figure 17: Relationship between distance and self-employment: Impact of transportsubsidies
48
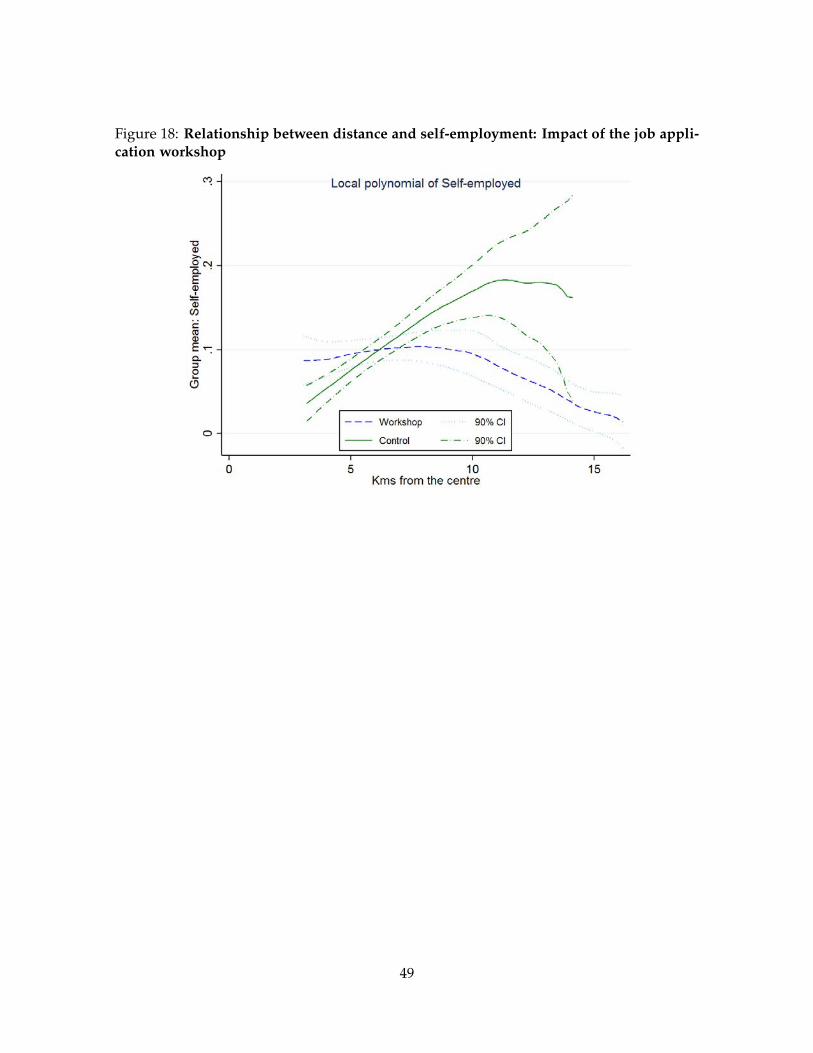
Figure 18: Relationship between distance and self-employment: Impact of the job appli-cation workshop
49

Table 1: Final Assignment to Treatment for Individuals and Clusters(1) (2) (3) (4)
Individuals ClustersCluster Treatment Control Treated Total Total
Transport 500 774 1,274 74Workshop 187 768 955 56Job fairs 0 1007 1007 56Control 823 0 823 48
Total 1,510 2,549 4,059 234
Table 2: Randomised Saturation Levels for the Transport Treatment(1) (2) (3) (4)Individuals Clusters
Proportion Treated Controls Treated Count Proportion20 % 256 65 18 24.32 %40 % 150 96 15 20.27 %75 % 56 191 15 20.27 %90 % 38 422 26 35.14 %
50

Table 3: Employment outcomesOutcome Transport Job App. Workshop Spillover 1 Spillover 2 Control Mean F N
Worked 0.0400 0.0200 -0.0450 0.0320 0.562 0.494 3785(.168) (.529) (.183) (.538)[.305] [1] [1] [1]
Hours worked 0.197 -0.0920 -2.318 0.616 26.20 0.842 3778(.9) (.953) (.213) (.809)
[.717] [1] [1] [1]
Formal work 0.0550 0.0520 0.0140 0.0600 0.224 0.888 3785(.004)*** (.009)*** (.491) (.113)[.031]** [.029]** [1] [1]
Perm. work 0.0340 0.0670 0.00600 0.0150 0.171 0.114 3785(.062)* (.001)*** (.737) (.566)[.23] [.005]*** [1] [1]
Self-employed -0.0200 -0.00500 -0.0170 -0.0180 0.0950 0.346 3785(.187) (.739) (.363) (.542)[.305] [1] [1] [1]
Monthly earnings 2.401 60.03 -43.01 12.12 1145 0.444 3732(.974) (.479) (.634) (.907)[.717] [1] [1] [1]
Satis. with work 0.00300 0.0250 -0.0170 0.0510 0.237 0.473 3785(.919) (.356) (.483) (.284)[.717] [1] [1] [1]
Note. In this table we report the intent-to-treat estimates of the direct and indirect effects of the transport intervention andthe job application workshop on primary employment outcomes. These are obtained by least squares estimation of equation(1), weighting each observation by the inverse of the probability of being sampled. Below each coefficient estimate, we reporta p-value in parenthesis and a q-value in brackets. We correct standard errors to allow for arbitrary correlation at the levelof geographical clusters. q-values are obtained using the sharpened procedure of Benjamini et al. (2006). In the last threecolumns we report the mean outcome for the control group, the p-value from a F-test of the null hypothesis that transportsubsidies and the job application workshop have the same effect, and the number of observations. *** p< 0.01, ** p <0.05, *p<0.1.
51

Table 4: Job searchOutcome Transport Job App. Workshop Spillover 1 Spillover 2 Control Mean F N
Applied to temporary jobs 0.344 -0.0110 0.0160 -0.168 1.311 0.141 3769(.199) (.956) (.949) (.481)[.963] [1] [1] [1]
Applied to permanent jobs -0.0210 0.0490 0.0600 0.0260 2.279 0.720 3764(.936) (.842) (.838) (.931)[.963] [1] [1] [1]
Interviews/Applications -0.0360 -0.0370 0.0340 -0.0140 0.354 0.957 2139(.23) (.168) (.472) (.789)[.963] [.732] [1] [1]
Offers/Applications 0.00400 0.00300 -0.0150 0.0730 0.248 0.971 2140(.924) (.95) (.72) (.28)[.963] [1] [1] [1]
Interviews/Applications (Perm) 0.00800 0.0110 0.00600 -0.0210 0.327 0.929 1659(.841) (.766) (.885) (.71)[.963] [1] [1] [1]
Offers/Applications (Perm) 0.0470 0.0470 0.00800 0.0520 0.164 0.995 1658(.215) (.169) (.821) (.305)[.963] [.732] [1] [1]
Interviews/Applications (Temp) -0.0750 -0.0630 0.0330 -0.0220 0.389 0.773 1314(.07)* (.125) (.666) (.755)[.963] [.732] [1] [1]
Offers/Applications (Temp) -0.0510 -0.0380 -0.0250 0.109 0.332 0.756 1314(.245) (.401) (.658) (.241)[.963] [.732] [1] [1]
Uses CV for applications 0.0150 0.0420 0.0190 -0.00500 0.401 0.313 3785(.604) (.155) (.576) (.914)[.963] [.732] [1] [1]
Uses certificates 0.0340 0.0520 0.0240 0.0280 0.479 0.677 3785(.4) (.257) (.561) (.619)
[.963] [.732] [1] [1]
Note. In this table we report the intent-to-treat estimates of the direct and indirect effects of the transport intervention and thejob application workshop on job search outcomes. These are obtained by least squares estimation of equation (1), weightingeach observation by the inverse of the probability of being sampled. Below each coefficient estimate, we report a p-value inparenthesis and a q-value in brackets. We correct standard errors to allow for arbitrary correlation at the level of geographicalclusters. q-values are obtained using the sharpened procedure of Benjamini et al. (2006). In the last three columns we reportthe mean outcome for the control group, the p-value from a F-test of the null hypothesis that transport subsidies and the jobapplication workshop have the same effect, and the number of observations. *** p< 0.01, ** p <0.05, * p<0.1.
52

Table 5: Effects on main outcomes by genderTransport Job Application Workshop Control Mean
Outcome Male Female F(p) Male Female F(p) Male Female
Worked 0.0610 0.0210 0.502 0.00100 0.0370 0.529 0.642 0.487(.138) (.612) (.986) (.379)[.709] [1] [1] [1]
Hours worked 0.118 0.356 0.943 -0.283 0.486 0.815 28.80 23.80(.958) (.872) (.891) (.836)
[1] [1] [1] [1]
Formal work 0.0490 0.0670 0.660 0.00700 0.0880 0.0476 0.246 0.203(.099)* (.013)** (.827) (.001)***[.651] [.094]* [1] [.016]**
Perm. work -0.00300 0.0660 0.0413 0.0620 0.0650 0.938 0.189 0.154(.909) (.003)*** (.032)** (.011)**
[1] [.039]** [.149] [.079]*
Self-employed -0.0290 -0.0190 0.786 -0.00200 -0.00600 0.910 0.109 0.0821(.305) (.326) (.942) (.765)
[1] [1] [1] [1]
Monthly earnings -3.308 17.48 0.894 102.3 63.11 0.818 1521 794(.981) (.807) (.495) (.47)
[1] [1] [1] [1]
Satis. with work -0.0230 0.0210 0.390 0.0220 0.0290 0.899 0.287 0.190(.569) (.547) (.598) (.404)
[1] [1] [1] [1]
Note. In this table we report, separately for each gender, the intent-to-treat estimates of the direct effects of the transportintervention and the job application workshop on primary employment outcomes. These are obtained by least squaresestimation of equation (2), weighting each observation by the inverse of the probability of being sampled. Below eachcoefficient estimate, we report a p-value in parenthesis and a q-value in brackets. We correct standard errors to allow forarbitrary correlation at the level of geographical clusters. q-values are obtained using the sharpened procedure of Benjaminiet al. (2006). In columns 3 and 6 we report the p-value from F-tests of the null hypotheses that transport subsidies and thejob application workshop, respectively, have the same effect for men and women. In the last two columns we report themean outcome for men and women in the control group.*** p< 0.01, ** p <0.05, * p<0.1.
53
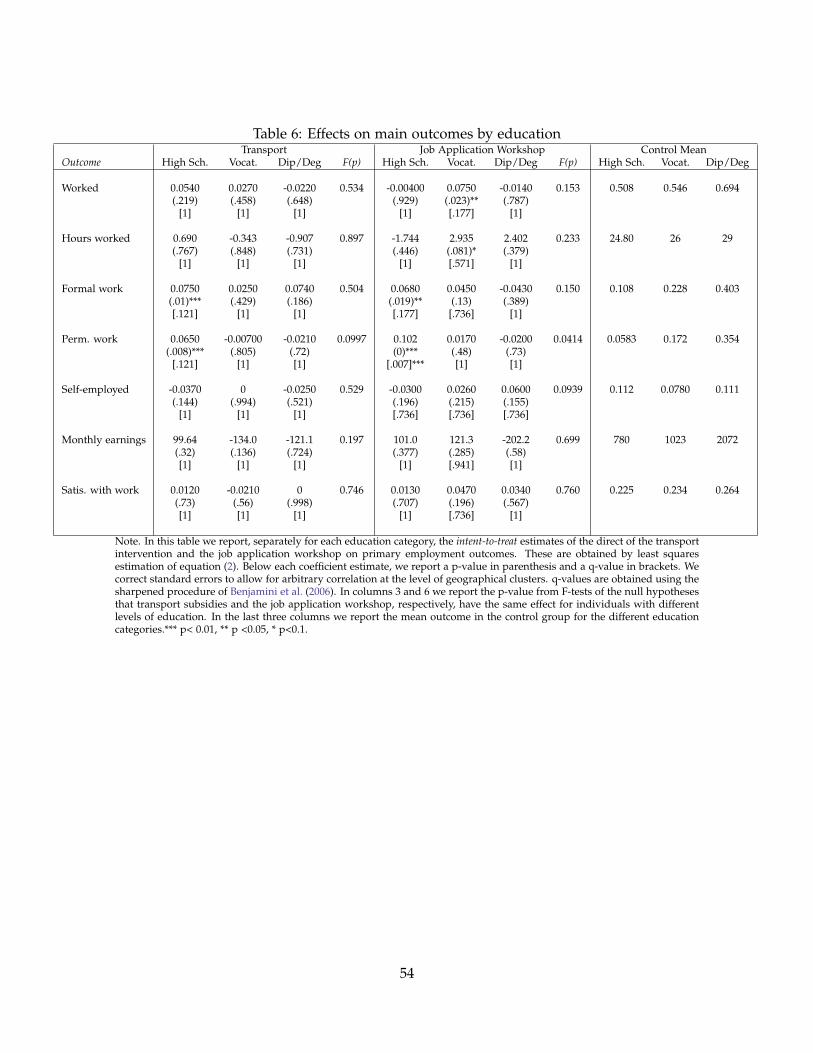
Table 6: Effects on main outcomes by educationTransport Job Application Workshop Control Mean
Outcome High Sch. Vocat. Dip/Deg F(p) High Sch. Vocat. Dip/Deg F(p) High Sch. Vocat. Dip/Deg
Worked 0.0540 0.0270 -0.0220 0.534 -0.00400 0.0750 -0.0140 0.153 0.508 0.546 0.694(.219) (.458) (.648) (.929) (.023)** (.787)
[1] [1] [1] [1] [.177] [1]
Hours worked 0.690 -0.343 -0.907 0.897 -1.744 2.935 2.402 0.233 24.80 26 29(.767) (.848) (.731) (.446) (.081)* (.379)
[1] [1] [1] [1] [.571] [1]
Formal work 0.0750 0.0250 0.0740 0.504 0.0680 0.0450 -0.0430 0.150 0.108 0.228 0.403(.01)*** (.429) (.186) (.019)** (.13) (.389)[.121] [1] [1] [.177] [.736] [1]
Perm. work 0.0650 -0.00700 -0.0210 0.0997 0.102 0.0170 -0.0200 0.0414 0.0583 0.172 0.354(.008)*** (.805) (.72) (0)*** (.48) (.73)
[.121] [1] [1] [.007]*** [1] [1]
Self-employed -0.0370 0 -0.0250 0.529 -0.0300 0.0260 0.0600 0.0939 0.112 0.0780 0.111(.144) (.994) (.521) (.196) (.215) (.155)
[1] [1] [1] [.736] [.736] [.736]
Monthly earnings 99.64 -134.0 -121.1 0.197 101.0 121.3 -202.2 0.699 780 1023 2072(.32) (.136) (.724) (.377) (.285) (.58)[1] [1] [1] [1] [.941] [1]
Satis. with work 0.0120 -0.0210 0 0.746 0.0130 0.0470 0.0340 0.760 0.225 0.234 0.264(.73) (.56) (.998) (.707) (.196) (.567)[1] [1] [1] [1] [.736] [1]
Note. In this table we report, separately for each education category, the intent-to-treat estimates of the direct of the transportintervention and the job application workshop on primary employment outcomes. These are obtained by least squaresestimation of equation (2). Below each coefficient estimate, we report a p-value in parenthesis and a q-value in brackets. Wecorrect standard errors to allow for arbitrary correlation at the level of geographical clusters. q-values are obtained using thesharpened procedure of Benjamini et al. (2006). In columns 3 and 6 we report the p-value from F-tests of the null hypothesesthat transport subsidies and the job application workshop, respectively, have the same effect for individuals with differentlevels of education. In the last three columns we report the mean outcome in the control group for the different educationcategories.*** p< 0.01, ** p <0.05, * p<0.1.
54
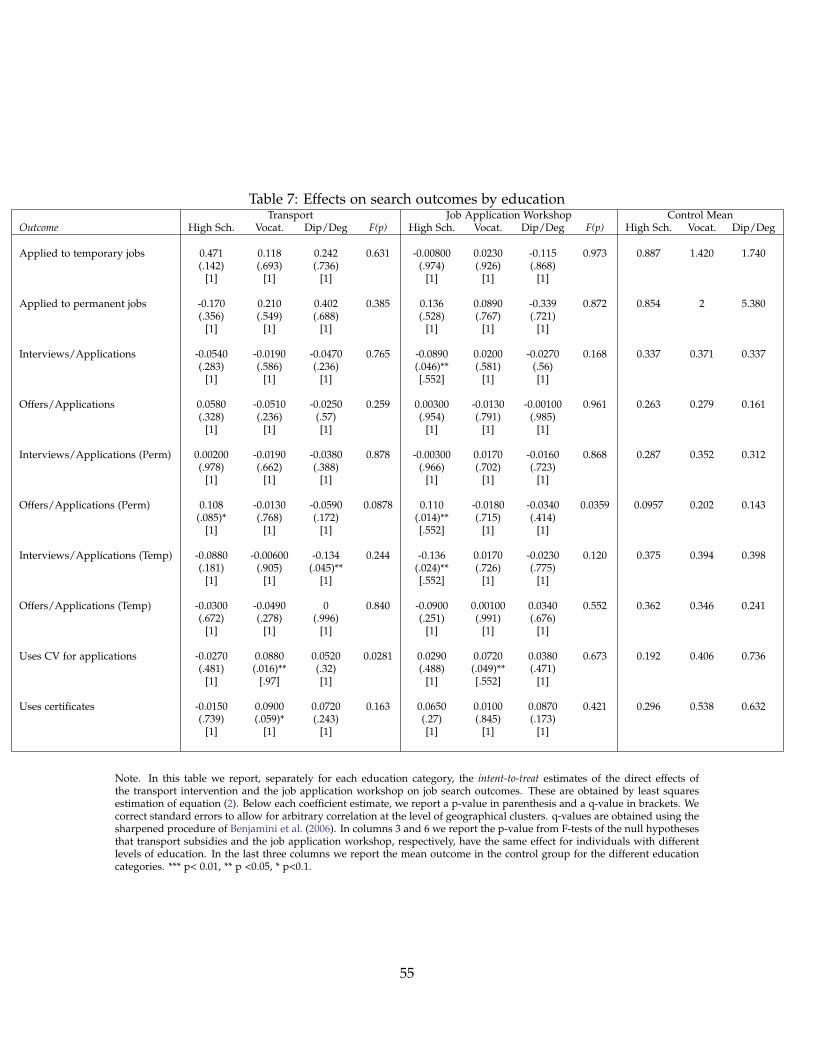
Table 7: Effects on search outcomes by educationTransport Job Application Workshop Control Mean
Outcome High Sch. Vocat. Dip/Deg F(p) High Sch. Vocat. Dip/Deg F(p) High Sch. Vocat. Dip/Deg
Applied to temporary jobs 0.471 0.118 0.242 0.631 -0.00800 0.0230 -0.115 0.973 0.887 1.420 1.740(.142) (.693) (.736) (.974) (.926) (.868)
[1] [1] [1] [1] [1] [1]
Applied to permanent jobs -0.170 0.210 0.402 0.385 0.136 0.0890 -0.339 0.872 0.854 2 5.380(.356) (.549) (.688) (.528) (.767) (.721)
[1] [1] [1] [1] [1] [1]
Interviews/Applications -0.0540 -0.0190 -0.0470 0.765 -0.0890 0.0200 -0.0270 0.168 0.337 0.371 0.337(.283) (.586) (.236) (.046)** (.581) (.56)
[1] [1] [1] [.552] [1] [1]
Offers/Applications 0.0580 -0.0510 -0.0250 0.259 0.00300 -0.0130 -0.00100 0.961 0.263 0.279 0.161(.328) (.236) (.57) (.954) (.791) (.985)
[1] [1] [1] [1] [1] [1]
Interviews/Applications (Perm) 0.00200 -0.0190 -0.0380 0.878 -0.00300 0.0170 -0.0160 0.868 0.287 0.352 0.312(.978) (.662) (.388) (.966) (.702) (.723)
[1] [1] [1] [1] [1] [1]
Offers/Applications (Perm) 0.108 -0.0130 -0.0590 0.0878 0.110 -0.0180 -0.0340 0.0359 0.0957 0.202 0.143(.085)* (.768) (.172) (.014)** (.715) (.414)
[1] [1] [1] [.552] [1] [1]
Interviews/Applications (Temp) -0.0880 -0.00600 -0.134 0.244 -0.136 0.0170 -0.0230 0.120 0.375 0.394 0.398(.181) (.905) (.045)** (.024)** (.726) (.775)
[1] [1] [1] [.552] [1] [1]
Offers/Applications (Temp) -0.0300 -0.0490 0 0.840 -0.0900 0.00100 0.0340 0.552 0.362 0.346 0.241(.672) (.278) (.996) (.251) (.991) (.676)
[1] [1] [1] [1] [1] [1]
Uses CV for applications -0.0270 0.0880 0.0520 0.0281 0.0290 0.0720 0.0380 0.673 0.192 0.406 0.736(.481) (.016)** (.32) (.488) (.049)** (.471)
[1] [.97] [1] [1] [.552] [1]
Uses certificates -0.0150 0.0900 0.0720 0.163 0.0650 0.0100 0.0870 0.421 0.296 0.538 0.632(.739) (.059)* (.243) (.27) (.845) (.173)
[1] [1] [1] [1] [1] [1]
Note. In this table we report, separately for each education category, the intent-to-treat estimates of the direct effects ofthe transport intervention and the job application workshop on job search outcomes. These are obtained by least squaresestimation of equation (2). Below each coefficient estimate, we report a p-value in parenthesis and a q-value in brackets. Wecorrect standard errors to allow for arbitrary correlation at the level of geographical clusters. q-values are obtained using thesharpened procedure of Benjamini et al. (2006). In columns 3 and 6 we report the p-value from F-tests of the null hypothesesthat transport subsidies and the job application workshop, respectively, have the same effect for individuals with differentlevels of education. In the last three columns we report the mean outcome in the control group for the different educationcategories. *** p< 0.01, ** p <0.05, * p<0.1.
55

Online Appendix
56

Appendix A: Further details
Figure 19: Attrition (failure to complete one phone interview) from the Phone Surveyby Month
Table 8: Sample selection before randomisationSample Size No. Dropped % dropped
Eligible at baseline 4388Found on phone 4314 74 1.69%Stayed in phone survey 4254 60 1.39%Without permanent work 4076 178 4.18%Stayed in Addis 4059 17 0.42%
Total Dropped 329 7.58%Final Sample 4059
Table 10: Summary and Tests of Balance
N Mean S.Dev. 1st Q. Median 3rd Q. Min. Max. F-test P
degree 4055 0.18 0.39 0.00 0.00 0.00 0.0 1.0 0.654vocational 4055 0.43 0.50 0.00 0.00 1.00 0.0 1.0 0.914work 4055 0.30 0.46 0.00 0.00 1.00 0.0 1.0 0.710search 4055 0.50 0.50 0.00 0.00 1.00 0.0 1.0 0.950dipdeg 4055 0.25 0.43 0.00 0.00 1.00 0.0 1.0 0.933female 4055 0.53 0.50 0.00 1.00 1.00 0.0 1.0 0.996migrant_birth 4055 0.36 0.48 0.00 0.00 1.00 0.0 1.0 0.684amhara 4055 0.44 0.50 0.00 0.00 1.00 0.0 1.0 0.366oromo 4055 0.25 0.44 0.00 0.00 1.00 0.0 1.0 0.278work_wage_6months 4055 0.45 0.50 0.00 0.00 1.00 0.0 1.0 0.452
57
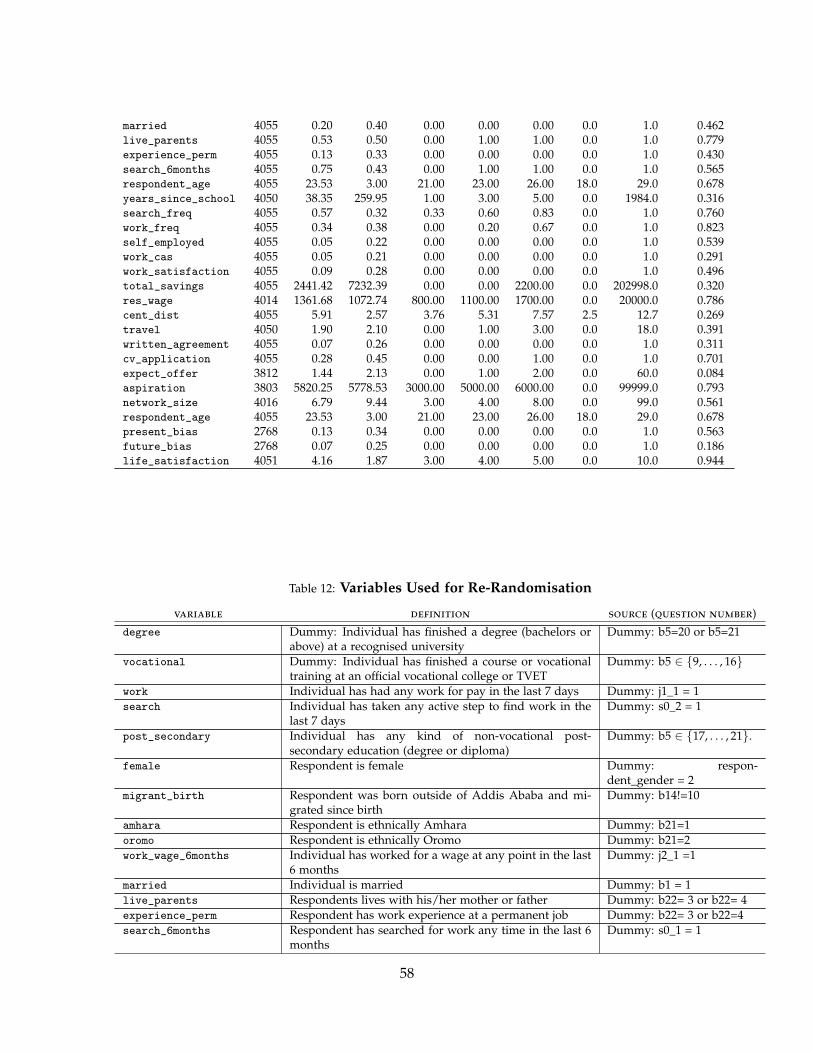
married 4055 0.20 0.40 0.00 0.00 0.00 0.0 1.0 0.462live_parents 4055 0.53 0.50 0.00 1.00 1.00 0.0 1.0 0.779experience_perm 4055 0.13 0.33 0.00 0.00 0.00 0.0 1.0 0.430search_6months 4055 0.75 0.43 0.00 1.00 1.00 0.0 1.0 0.565respondent_age 4055 23.53 3.00 21.00 23.00 26.00 18.0 29.0 0.678years_since_school 4050 38.35 259.95 1.00 3.00 5.00 0.0 1984.0 0.316search_freq 4055 0.57 0.32 0.33 0.60 0.83 0.0 1.0 0.760work_freq 4055 0.34 0.38 0.00 0.20 0.67 0.0 1.0 0.823self_employed 4055 0.05 0.22 0.00 0.00 0.00 0.0 1.0 0.539work_cas 4055 0.05 0.21 0.00 0.00 0.00 0.0 1.0 0.291work_satisfaction 4055 0.09 0.28 0.00 0.00 0.00 0.0 1.0 0.496total_savings 4055 2441.42 7232.39 0.00 0.00 2200.00 0.0 202998.0 0.320res_wage 4014 1361.68 1072.74 800.00 1100.00 1700.00 0.0 20000.0 0.786cent_dist 4055 5.91 2.57 3.76 5.31 7.57 2.5 12.7 0.269travel 4050 1.90 2.10 0.00 1.00 3.00 0.0 18.0 0.391written_agreement 4055 0.07 0.26 0.00 0.00 0.00 0.0 1.0 0.311cv_application 4055 0.28 0.45 0.00 0.00 1.00 0.0 1.0 0.701expect_offer 3812 1.44 2.13 0.00 1.00 2.00 0.0 60.0 0.084aspiration 3803 5820.25 5778.53 3000.00 5000.00 6000.00 0.0 99999.0 0.793network_size 4016 6.79 9.44 3.00 4.00 8.00 0.0 99.0 0.561respondent_age 4055 23.53 3.00 21.00 23.00 26.00 18.0 29.0 0.678present_bias 2768 0.13 0.34 0.00 0.00 0.00 0.0 1.0 0.563future_bias 2768 0.07 0.25 0.00 0.00 0.00 0.0 1.0 0.186life_satisfaction 4051 4.16 1.87 3.00 4.00 5.00 0.0 10.0 0.944
Table 12: Variables Used for Re-Randomisation
variable definition source (question number)
degree Dummy: Individual has finished a degree (bachelors orabove) at a recognised university
Dummy: b5=20 or b5=21
vocational Dummy: Individual has finished a course or vocationaltraining at an official vocational college or TVET
Dummy: b5 ∈ {9, . . . , 16}
work Individual has had any work for pay in the last 7 days Dummy: j1_1 = 1search Individual has taken any active step to find work in the
last 7 daysDummy: s0_2 = 1
post_secondary Individual has any kind of non-vocational post-secondary education (degree or diploma)
Dummy: b5 ∈ {17, . . . , 21}.
female Respondent is female Dummy: respon-dent_gender = 2
migrant_birth Respondent was born outside of Addis Ababa and mi-grated since birth
Dummy: b14!=10
amhara Respondent is ethnically Amhara Dummy: b21=1oromo Respondent is ethnically Oromo Dummy: b21=2work_wage_6months Individual has worked for a wage at any point in the last
6 monthsDummy: j2_1 =1
married Individual is married Dummy: b1 = 1live_parents Respondents lives with his/her mother or father Dummy: b22= 3 or b22= 4experience_perm Respondent has work experience at a permanent job Dummy: b22= 3 or b22=4search_6months Respondent has searched for work any time in the last 6
monthsDummy: s0_1 = 1
58

age Respondent age respondent_ageyears_since_school Years since the respondent finished school (any school
including university)Constructed from j0_3 (=2006− j0_3)
search_freq Proportion of weeks that individual searched for work(from the phone surveys)
Mean (over first 3 months ofcalls) of Dummy: p1_14 = 1
work_freq Proportion of weeks that the individuals worked (fromthe phone surveys)
Mean (over first 3 months ofcalls) of Dummy: p1_3 6= 0
59

Table 9: Assignment to Start and End Weeks of the Transport InterventionEnd Week (2014-2015)
Start Week (2014) 22-Dec 29-Dec 05-Jan 12-Jan 19-Jan 26-Jan Total
01-Sep 12 11 14 13 0 0 5008-Sep 12 21 38 29 0 0 10015-Sep 6 10 12 22 0 0 5022-Sep 10 15 27 24 0 0 7629-Sep 16 23 29 78 25 29 20006-Oct 0 0 0 53 51 46 15013-Oct 0 0 0 59 44 45 148
Total 56 80 120 278 120 120 774
Figure 20: Heterogeneous Impacts by Education: Reservation wages
60

Table 11: Predictors of Attrition(1)
Attrition
Transport -0.005 Respondent age -0.000(0.017) (0.0022)
Screening -0.023 Born outside Addis 0.040***(0.017) (0.014)
Spillover transport -0.010 Amhara -0.024(0.019) (0.015)
Spillover screening -0.014 Oromo -0.026(0.026) (0.017)
search freq -0.064** Wage empl (6m) 0.011(0.026) (0.015)
work freq -0.004 Married -0.028(0.018) (0.018)
Degree -0.034*** Years since school 0.000(0.012) (0.000029)
Worked (7d) -0.044*** Lives with parents -0.004(0.015) (0.014)
Searched job (7d) 0.021 Ever had permanent job 0.003(0.016) (0.018)
Female 0.022* Searched job (6m) -0.007(0.013) (0.018)
Observations 3,045 R-squared 0.021F-test (treatments) 0.560 F-test (covariates) 2.680Prob > F 0.690 Prob > F 0.000
61

Table 13: Effects on employment outcomes by job search at baselineTransport Job Application Workshop Control Mean
Outcome Low Search Intens. High Search Intens. F(p) Low Search Intens. High Search Intens. F(p) Low Search Intens. High Search Intens.
Worked 0.0420 0.0370 0.932 0.0590 -0.0120 0.243 0.554 0.569(.323) (.39) (.176) (.775)[.797] [.797] [.459] [.868]
Hours worked -0.777 1.202 0.565 0.610 -0.185 0.815 26.60 25.90(.738) (.593) (.804) (.929)
[1] [.977] [.868] [.868]
Formal work 0.0770 0.0420 0.417 0.0640 0.0400 0.605 0.203 0.241(.008)*** (.127) (.028)** (.197)
[.13] [.701] [.223] [.459]
Perm. work 0.0440 0.0260 0.647 0.0930 0.0390 0.198 0.157 0.182(.089)* (.311) (.002)*** (.159)[.63] [.797] [.023]** [.459]
Self-employed -0.0100 -0.0360 0.397 -0.00800 -0.00300 0.889 0.110 0.0827(.679) (.081)* (.747) (.878)
[1] [.63] [.868] [.868]
Monthly earnings 95.94 -73.46 0.234 205.1 -28.94 0.190 1103 1181(.375) (.447) (.118) (.803)[.797] [.797] [.459] [.868]
Satis. with work 0.0350 -0.0300 0.203 0.0670 -0.0110 0.117 0.229 0.243(.347) (.416) (.067)* (.756)[.797] [.797] [.369] [.868]
Note. In this table we report heterogeneous treatment effects for individuals that were searching above and below themedian number of weeks in the three months after being surveyed and before the start of the interventions. For each group,we report the intent-to-treat estimates of the direct effects of the transport intervention and the job application workshop onjob search outcomes. These are obtained by least squares estimation of equation (2). Below each coefficient estimate, wereport a p-value in parenthesis and a q-value in brackets. We correct standard errors to allow for arbitrary correlation at thelevel of geographical clusters. q-values are obtained using the sharpened procedure of Benjamini et al. (2006). In columns 3and 6 we report the p-value from F-tests of the null hypotheses that transport subsidies and the job application workshop,respectively, have the same effect for individuals with different levels of education. In the last three columns we report themean outcome in the control group for the different education categories. *** p< 0.01, ** p <0.05, * p<0.1.
62

Table 14: Effects on employment outcomes by experience in permanent employmentTransport Job Application Workshop Control Mean
Outcome Never Perm. Job Had Perm. Job F(p) never Perm. Job Had Perm. Job F(p) Never Perm. Job Had Perm. Job
Worked 0.0420 0.0210 0.798 0.0230 -0.00300 0.753 0.544 0.688(.182) (.767) (.473) (.972)[.773] [1] [1] [1]
Hours worked -0.0700 2.879 0.499 0.0520 0.803 0.872 25.60 30.40(.966) (.476) (.975) (.85)
[1] [1] [1] [1]
Formal work 0.0660 -0.00500 0.344 0.0540 0.0210 0.650 0.202 0.375(.001)*** (.941) (.008)*** (.761)[.017]** [1] [.056]* [1]
Perm. work 0.0440 -0.0440 0.231 0.0690 0.0170 0.488 0.150 0.313(.025)** (.514) (0)*** (.819)[.194] [1] [.005]*** [1]
Self-employed -0.0290 0.0230 0.299 -0.0120 0.0610 0.190 0.0985 0.0729(.093)* (.608) (.496) (.223)[.597] [1] [1] [1]
Monthly earnings -38.04 391.5 0.105 97.29 -55.85 0.526 1074 1639(.607) (.13) (.278) (.809)
[1] [.637] [1] [1]
Satis. with work 0.00100 -0.00200 0.964 0.0260 0.0270 0.987 0.224 0.323(.967) (.975) (.354) (.734)
[1] [1] [1] [1]
Note. In this table we report heterogenous treatment effects for individuals with and without experience in permanentemployment. For each group, we report the intent-to-treat estimates of the direct effects of the transport intervention and thejob application workshop on job search outcomes. These are obtained by least squares estimation of equation (2). Below eachcoefficient estimate, we report a p-value in parenthesis and a q-value in brackets. We correct standard errors to allow forarbitrary correlation at the level of geographical clusters. q-values are obtained using the sharpened procedure of Benjaminiet al. (2006). In columns 3 and 6 we report the p-value from F-tests of the null hypotheses that transport subsidies and thejob application workshop, respectively, have the same effect for individuals with different levels of education. In the lastthree columns we report the mean outcome in the control group for the different education categories. *** p< 0.01, ** p <0.05,* p<0.1.
63
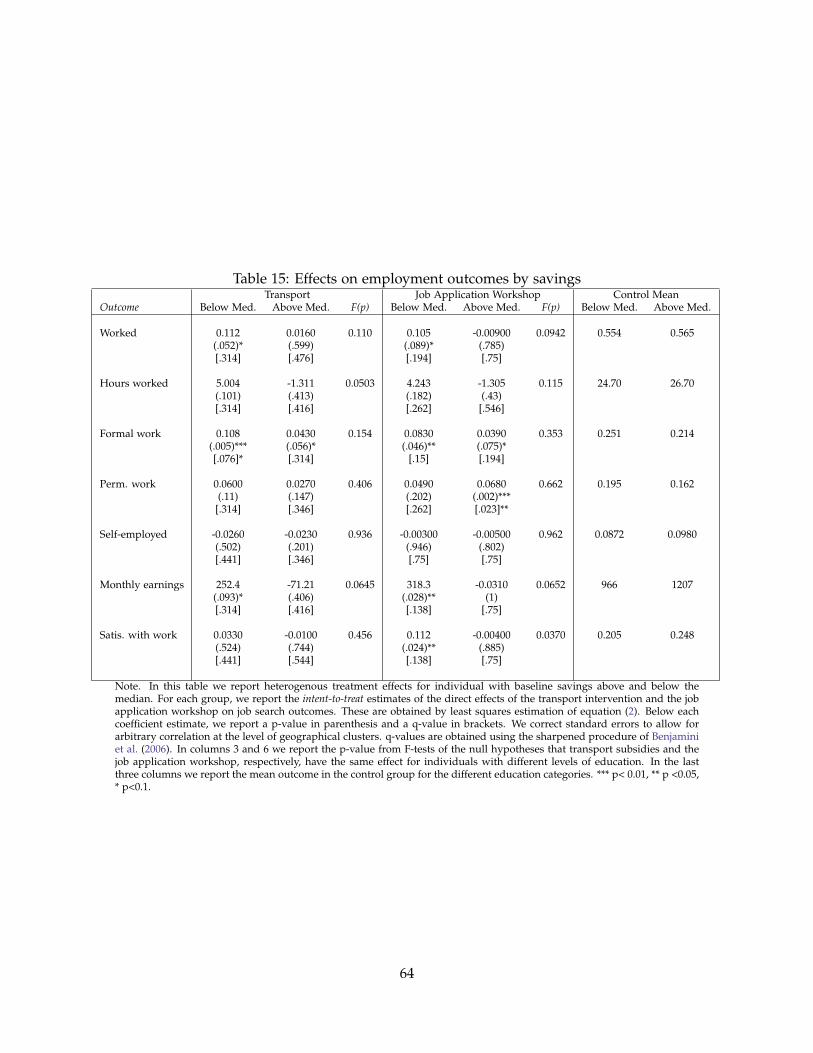
Table 15: Effects on employment outcomes by savingsTransport Job Application Workshop Control Mean
Outcome Below Med. Above Med. F(p) Below Med. Above Med. F(p) Below Med. Above Med.
Worked 0.112 0.0160 0.110 0.105 -0.00900 0.0942 0.554 0.565(.052)* (.599) (.089)* (.785)[.314] [.476] [.194] [.75]
Hours worked 5.004 -1.311 0.0503 4.243 -1.305 0.115 24.70 26.70(.101) (.413) (.182) (.43)[.314] [.416] [.262] [.546]
Formal work 0.108 0.0430 0.154 0.0830 0.0390 0.353 0.251 0.214(.005)*** (.056)* (.046)** (.075)*[.076]* [.314] [.15] [.194]
Perm. work 0.0600 0.0270 0.406 0.0490 0.0680 0.662 0.195 0.162(.11) (.147) (.202) (.002)***[.314] [.346] [.262] [.023]**
Self-employed -0.0260 -0.0230 0.936 -0.00300 -0.00500 0.962 0.0872 0.0980(.502) (.201) (.946) (.802)[.441] [.346] [.75] [.75]
Monthly earnings 252.4 -71.21 0.0645 318.3 -0.0310 0.0652 966 1207(.093)* (.406) (.028)** (1)[.314] [.416] [.138] [.75]
Satis. with work 0.0330 -0.0100 0.456 0.112 -0.00400 0.0370 0.205 0.248(.524) (.744) (.024)** (.885)[.441] [.544] [.138] [.75]
Note. In this table we report heterogenous treatment effects for individual with baseline savings above and below themedian. For each group, we report the intent-to-treat estimates of the direct effects of the transport intervention and the jobapplication workshop on job search outcomes. These are obtained by least squares estimation of equation (2). Below eachcoefficient estimate, we report a p-value in parenthesis and a q-value in brackets. We correct standard errors to allow forarbitrary correlation at the level of geographical clusters. q-values are obtained using the sharpened procedure of Benjaminiet al. (2006). In columns 3 and 6 we report the p-value from F-tests of the null hypotheses that transport subsidies and thejob application workshop, respectively, have the same effect for individuals with different levels of education. In the lastthree columns we report the mean outcome in the control group for the different education categories. *** p< 0.01, ** p <0.05,* p<0.1.
64

Table 16: Effects on employment outcomes by use of certificates at baselineTransport Job Application Workshop Control Mean
Outcome Not used CV/Cert Used CV/Cert F(p) Not used CV/Cert Used CV/Cert F(p) Not used CV/Cert Used CV/Cert
Worked 0.0350 0.0450 0.860 -0.0300 0.0740 0.0562 0.546 0.575(.42) (.216) (.48) (.046)**[1] [.761] [.725] [.318]
Hours worked -0.0410 0.557 0.856 -1.882 2.245 0.201 26.10 26.20(.986) (.788) (.434) (.249)
[1] [1] [.725] [.47]
Formal work 0.0690 0.0470 0.600 0.0450 0.0520 0.856 0.128 0.301(.014)** (.109) (.093)* (.085)*[.248] [.547] [.318] [.318]
Perm. work 0.0440 0.0240 0.554 0.0490 0.0770 0.462 0.116 0.215(.079)* (.332) (.068)* (.005)***[.547] [1] [.318] [.073]*
Self-employed -0.0410 -0.00400 0.264 -0.0140 0.00700 0.519 0.125 0.0716(.086)* (.852) (.56) (.743)[.547] [1] [.725] [.916]
Monthly earnings 22.31 -7.386 0.845 92.92 69.42 0.889 1051 1221(.839) (.942) (.472) (.526)
[1] [1] [.725] [.725]
Satis. with work -0.0140 0.0170 0.555 0.0150 0.0390 0.632 0.255 0.222(.728) (.633) (.698) (.247)
[1] [1] [.916] [.47]
Note. In this table we report heterogenous treatment effects for individuals who at baseline used certificates or CVs in jobapplications and individuals that did not use certificates or CVs. For each group, we report the intent-to-treat estimates ofthe direct effects of the transport intervention and the job application workshop on job search outcomes. These are obtainedby least squares estimation of equation (2). Below each coefficient estimate, we report a p-value in parenthesis and a q-valuein brackets. We correct standard errors to allow for arbitrary correlation at the level of geographical clusters. q-values areobtained using the sharpened procedure of Benjamini et al. (2006). In columns 3 and 6 we report the p-value from F-testsof the null hypotheses that transport subsidies and the job application workshop, respectively, have the same effect forindividuals with different levels of education. In the last three columns we report the mean outcome in the control groupfor the different education categories. *** p< 0.01, ** p <0.05, * p<0.1.
65

Table 17: Family indicesOutcome Transport Job App. Workshop Spillover 1 Spillover 2 Control Mean F N
Job Quality 0.569 0.482 -0.168 0.812 -0.218 0.889 3785(.315) (.448) (.821) (.456)
[1] [1] [1] [1]
Finan. Outcomes 0.188 0.153 0.104 -0.00600 -0.188 0.878 3785(.436) (.477) (.688) (.983)
[1] [1] [1] [1]
Expects and Asps -0.0910 0.104 -1.055 -0.358 0.215 0.759 2809(.897) (.86) (.083)* (.669)
[1] [1] [1] [1]
Mobility 0.105 -0.0420 -0.419 -0.801 0.145 0.821 3779(.865) (.951) (.578) (.324)
[1] [1] [1] [1]
Education/Skills -0.828 -1.175 0.0630 -1.070 0.394 0.612 3785(.215) (.124) (.936) (.291)
[1] [1] [1] [1]
Wellbeing 0.0480 0.185 0.0250 0.106 -0.0640 0.430 3781(.772) (.234) (.888) (.637)
[1] [1] [1] [1]
Networks -0.301 -0.353 -0.493 -0.228 0.111 0.883 3761(.375) (.332) (.198) (.604)
[1] [1] [1] [1]
Note. In this table we report the intent-to-treat estimates of the direct and indirect effects of the transport intervention andthe job application workshop on the summary indices for different families of outcomes. These are obtained by least squaresestimation of equation (1), weighting each observation by the inverse of the probability of being sampled. Below eachcoefficient estimate, we report a p-value in parenthesis and a q-value in brackets. We correct standard errors to allow forarbitrary correlation at the level of geographical clusters. q-values are obtained using the sharpened procedure of Benjaminiet al. (2006). In the last three columns we report the mean outcome for the control group, the p-value from a F-test of the nullhypothesis that transport subsidies and the job application workshop have the same effect, and the number of observations.*** p< 0.01, ** p <0.05, * p<0.1.
66

Table 18: Other job quality measuresOutcome Transport Job App. Workshop Spillover 1 Spillover 2 Control Mean F N
Received job by interview 0.0410 0.0440 0.0250 0.0710 0.167 0.860 3785(.009)*** (.015)** (.235) (.024)**[.046]** [.083]* [1] [.137]
Office work (7d) 0.0260 0.00200 -0.0180 0.00600 0.201 0.305 3785(.287) (.93) (.498) (.867)[.62] [1] [1] [1]
Skills match with tasks 0.00900 0.00500 0.0310 0 0.130 0.886 3785(.76) (.861) (.372) (.998)[.916] [1] [1] [1]
Overqualified 0.0380 0.0300 -0.0380 0.0620 0.291 0.797 3785(.279) (.384) (.304) (.22)[.62] [1] [1] [.783]
Underqualified -0.0160 -0.0120 -0.0130 -0.0200 0.0820 0.781 3785(.397) (.547) (.565) (.429)[.659] [1] [1] [1]
Note. In this table we report the intent-to-treat estimates of the direct and indirect effects of the transport intervention and thejob application workshop on secondary employment outcomes. These are obtained by least squares estimation of equation(1), weighting each observation by the inverse of the probability of being sampled. Below each coefficient estimate, we reporta p-value in parenthesis and a q-value in brackets. We correct standard errors to allow for arbitrary correlation at the levelof geographical clusters. q-values are obtained using the sharpened procedure of Benjamini et al. (2006). In the last threecolumns we report the mean outcome for the control group, the p-value from a F-test of the null hypothesis that transportsubsidies and the job application workshop have the same effect, and the number of observations. *** p< 0.01, ** p <0.05, *p<0.1.
67

Table 19: Financial outcomesOutcome Transport Job App. Workshop Spillover 1 Spillover 2 Control Mean F N
Expenditure (7d) 26.52 18.00 -7.040 -60.53 506.4 0.833 3785(.502) (.643) (.859) (.145)
[1] [1] [1] [.768]
Savings (total) 513.6 -772.0 -468.5 100.5 6907 0.616 1692(.849) (.566) (.746) (.951)
[1] [1] [1] [1]
0.490 0.240 0.467 0.527 -0.404 0.636 3785(.376) (.627) (.466) (.503)
[1] [1] [1] [1]
Note. In this table we report the intent-to-treat estimates of the direct and indirect effects of the transport intervention and thejob application workshop on financial outcomes. These are obtained by least squares estimation of equation (1), weightingeach observation by the inverse of the probability of being sampled. Below each coefficient estimate, we report a p-value inparenthesis and a q-value in brackets. We correct standard errors to allow for arbitrary correlation at the level of geographicalclusters. q-values are obtained using the sharpened procedure of Benjamini et al. (2006). In the last three columns we reportthe mean outcome for the control group, the p-value from a F-test of the null hypothesis that transport subsidies and the jobapplication workshop have the same effect, and the number of observations. *** p< 0.01, ** p <0.05, * p<0.1.
Table 20: Expectations, aspirations, reservation wagesOutcome Transport Job App. Workshop Spillover 1 Spillover 2 Control Mean F N
Offers expected (next 4m) -0.00700 0.268 -0.165 -0.194 1.421 0.0804 3521(.962) (.079)* (.263) (.16)
[1] [.366] [.652] [.333]
Reservation wage 3.910 -93.73 -12.69 143.6 2023 0.277 3319(.962) (.201) (.887) (.19)
[1] [.366] [1] [.333]
Aspiration wage (in 5y) 624.7 673.2 438.8 981.2 7097 0.957 3446(.37) (.404) (.517) (.206)[1] [.366] [1] [.333]
Weeks expected to be without permanent job 2.044 -4.518 -9.528 -5.373 30.23 0.0883 1809(.636) (.179) (.003)*** (.249)
[1] [.366] [.011]** [.333]
Note. In this table we report the intent-to-treat estimates of the direct and indirect effects of the transport intervention and thejob application workshop on expectations, aspirations and reservation wages. These are obtained by least squares estimationof equation (1), weighting each observation by the inverse of the probability of being sampled. Below each coefficientestimate, we report a p-value in parenthesis and a q-value in brackets. We correct standard errors to allow for arbitrarycorrelation at the level of geographical clusters. q-values are obtained using the sharpened procedure of Benjamini et al.(2006). In the last three columns we report the mean outcome for the control group, the p-value from a F-test of the nullhypothesis that transport subsidies and the job application workshop have the same effect, and the number of observations.*** p< 0.01, ** p <0.05, * p<0.1.
68

Table 21: MobilityOutcome Transport Job App. Workshop Spillover 1 Spillover 2 Control Mean F N
Trip to center (7d) 0.134 -0.0410 -0.136 -0.264 2.372 0.340 3347(.435) (.821) (.444) (.252)
[1] [.677] [1] [1]
Works away from home -0.0330 -0.0370 -0.0390 -0.0430 0.851 0.891 3785(.211) (.167) (.166) (.267)
[1] [.638] [1] [1]
Location of main occupation/activity changed 0.0270 -0.0330 0.0220 -0.0330 0.269 0.102 3785(.507) (.392) (.636) (.461)
[1] [.645] [1] [1]
Moved within Addis -0.00200 0.0240 0.00600 0.00800 0.0820 0.192 3785(.914) (.242) (.792) (.767)
[1] [.638] [1] [1]
Moved outside of Addis 0.00900 0.0120 0.00300 0.00300 0.00700 0.748 3785(.151) (.078)* (.668) (.661)
[1] [.638] [1] [1]
Note. In this table we report the intent-to-treat estimates of the direct and indirect effects of the transport intervention andthe job application workshop on outcomes related to mobility. These are obtained by least squares estimation of equation(1), weighting each observation by the inverse of the probability of being sampled. Below each coefficient estimate, we reporta p-value in parenthesis and a q-value in brackets. We correct standard errors to allow for arbitrary correlation at the levelof geographical clusters. q-values are obtained using the sharpened procedure of Benjamini et al. (2006). In the last threecolumns we report the mean outcome for the control group, the p-value from a F-test of the null hypothesis that transportsubsidies and the job application workshop have the same effect, and the number of observations. *** p< 0.01, ** p <0.05, *p<0.1.
69

Table 22: Education and trainingOutcome Transport Job App. Workshop Spillover 1 Spillover 2 Control Mean F N
In full-time education -0.00700 0 0.00300 0.0330 0.0210 0.379 3785(.363) (.975) (.803) (.131)[.694] [1] [1] [.212]
In part-time education -0.0480 -0.0330 -0.0130 -0.0210 0.142 0.431 3785(.016)** (.139) (.619) (.508)[.108] [.61] [1] [.439]
In informal training -0.0100 -0.0100 -0.00700 -0.0410 0.0380 0.995 3785(.512) (.498) (.655) (.001)***[.694] [.739] [1] [.009]***
Graduated (in past 12m) 0.0110 -0.0130 0.0160 -0.0190 0.0850 0.138 3785(.5) (.436) (.434) (.392)
[.694] [.739] [1] [.416]
Graduated from vocational degree (in past 12m) 0.0160 0.00600 0.00500 0.00200 0.0220 0.372 3785(.134) (.531) (.644) (.893)[.504] [.739] [1] [.807]
Graduated from training (in past 12m) -0.00100 -0.0220 0.0190 -0.0280 0.0480 0.0952 3785(.931) (.063)* (.238) (.024)**
[1] [.61] [1] [.064]*
Note. In this table we report the intent-to-treat estimates of the direct and indirect effects of the transport intervention andthe job application workshop on education and training. These are obtained by least squares estimation of equation (1),weighting each observation by the inverse of the probability of being sampled. Below each coefficient estimate, we reporta p-value in parenthesis and a q-value in brackets. We correct standard errors to allow for arbitrary correlation at the levelof geographical clusters. q-values are obtained using the sharpened procedure of Benjamini et al. (2006). In the last threecolumns we report the mean outcome for the control group, the p-value from a F-test of the null hypothesis that transportsubsidies and the job application workshop have the same effect, and the number of observations. *** p< 0.01, ** p <0.05, *p<0.1.
70

Table 23: Psychological outcomesOutcome Transport Job App. Workshop Spillover 1 Spillover 2 Control Mean F N
Life satisfaction (0-10) 0.166 0.155 0.199 0.330 4.798 0.934 3351(.207) (.248) (.19) (.143)
[1] [1] [1] [1]
Locus of control (0-10) 0.0200 -0.0280 -0.152 0.00200 6.207 0.871 3353(.946) (.922) (.648) (.994)
[1] [1] [1] [1]
Oneness with society -0.0310 0.0480 -0.0210 0.118 4.738 0.547 3353(.827) (.731) (.887) (.526)
[1] [1] [1] [1]
Trust in other people (1-4) 0.0780 0.0470 0.0260 -0.0250 2.027 0.725 3352(.338) (.608) (.767) (.81)
[1] [1] [1] [1]
Note. In this table we report the intent-to-treat estimates of the direct and indirect effects of the transport intervention andthe job application workshop on psychological outcomes. These are obtained by least squares estimation of equation (1),weighting each observation by the inverse of the probability of being sampled. Below each coefficient estimate, we reporta p-value in parenthesis and a q-value in brackets. We correct standard errors to allow for arbitrary correlation at the levelof geographical clusters. q-values are obtained using the sharpened procedure of Benjamini et al. (2006). In the last threecolumns we report the mean outcome for the control group, the p-value from a F-test of the null hypothesis that transportsubsidies and the job application workshop have the same effect, and the number of observations. *** p< 0.01, ** p <0.05, *p<0.1.
Table 24: Social networksOutcome Transport Job App. Workshop Spillover 1 Spillover 2 Control Mean F N
Number of people with who regularly -0.378 -0.592 -0.641 -0.454 5.242 0.558 3748shares information about job opportunities (.335) (.115) (.106) (.346)
[1] [.85] [.741] [.975]
Number of people with permanent jobs in job network 0.120 0.118 -0.0630 0.384 2.440 0.991 3383(.57) (.618) (.799) (.208)[1] [.859] [1] [.975]
Can access guarantor for job (in next month) -0.00300 -0.0640 -0.0240 -0.00200 1.220 0.232 3350(.955) (.231) (.69) (.974)
[1] [.85] [1] [.975]
Number of meetings of voluntary associations 0.00800 0.00700 -0.0330 -0.0550 0.0970 0.977 3785attended (past 30d) (.892) (.913) (.635) (.37)
[1] [.859] [1] [.975]
Note. In this table we report the intent-to-treat estimates of the direct and indirect effects of the transport intervention andthe job application workshop on social networks. These are obtained by least squares estimation of equation (1), weightingeach observation by the inverse of the probability of being sampled. Below each coefficient estimate, we report a p-value inparenthesis and a q-value in brackets. We correct standard errors to allow for arbitrary correlation at the level of geographicalclusters. q-values are obtained using the sharpened procedure of Benjamini et al. (2006). In the last three columns we reportthe mean outcome for the control group, the p-value from a F-test of the null hypothesis that transport subsidies and the jobapplication workshop have the same effect, and the number of observations. *** p< 0.01, ** p <0.05, * p<0.1.
71

Table 25: Lee boundsTransport Workshop
Permanent work Upper bound 0.032 0.068(0.076)∗ (0.000)∗∗∗
Lower bound 0.021 0.043(0.339) (0.047)∗∗
Written agreement Upper bound 0.061 0.061(0.004)∗∗∗ (0.004)∗∗∗
Lower bound 0.050 0.036(0.035)∗∗ (0.130)
Note. In this table we report the Lee bounds for the estimates of effects of the transport intervention and the job applicationworkshop on permanent work and written agreement. *** p< 0.01, ** p <0.05, * p<0.1.
Table 26: Predicted skills and employment outcomes: all workersWork Permanent work Written agreement Earnings(1) (2) (3) (4)
Predicted score .053 .047 .063 352.393(.022)∗∗ (.017)∗∗∗ (.019)∗∗∗ (102.618)∗∗∗
Workshop .036 .034 .041 56.538(.029) (.021) (.022)∗ (115.825)
Predicted score * workshop -.022 -.018 -.044 -35.074(.029) (.023) (.028) (141.522)
Const. .560 .171 .222 1132.593(.022)∗∗∗ (.016)∗∗∗ (.014)∗∗∗ (87.763)∗∗∗
Obs. 1463 1463 1463 1448
Note. In each column we report the results of an ordinary least squares regression of the outcome in the column heading onpredicted grades, a dummy for being invited to the job workshop and the interaction of these two variables. In parentheses,we report standard errors obtained through a bootstrapping procedure for generated regressors. The sample includes allindividuals in the control group and in the job application group. *** p< 0.01, ** p <0.05, * p<0.1.
Table 27: Predicted skills and employment outcomes: workers with at most secondaryeducation
Work Permanent work Written agreement Earnings(1) (2) (3) (4)
Predicted score -.042 -.039 -.0004 -134.476(.057) (.030) (.036) (202.789)
Workshop .016 .155 .056 202.050(.062) (.038)∗∗∗ (.039) (178.431)
Predicted score * workshop .035 .091 -.021 253.776(.077) (.053)∗ (.057) (334.006)
Const. .482 .037 .109 687.601(.042)∗∗∗ (.018)∗∗ (.025)∗∗∗ (114.227)∗∗∗
Obs. 452 452 452 448
Note. In each column we report the results of an ordinary least squares regression of the outcome in the column heading onpredicted grades, a dummy for being invited to the job workshop and the interaction of these two variables. In parentheses,we report standard errors obtained through a bootstrapping procedure for generated regressors. The sample includes allindividuals with at most a high school degree in the control group and in the job application group. *** p< 0.01, ** p <0.05,* p<0.1.
72