Embed Size (px)
Citation preview

NBER WORKING PAPER SERIES
EXIT, VOICE OR LOYALTY? AN INVESTIGATION INTO MANDATED PORTABILITY OF FRONT-LOADED PRIVATE HEALTH PLANS
Juan Pablo AtalHanming Fang
Martin KarlssonNicolas R. Ziebarth
Working Paper 23468http://www.nber.org/papers/w23468
NATIONAL BUREAU OF ECONOMIC RESEARCH1050 Massachusetts Avenue
Cambridge, MA 02138June 2017
We thank Christophe Courbage, Wanda Mimra, Martin Salm and seminar participants at the University of Oslo, the Gesundheitsökonomischer Aussschuß of the Verein für Socialpolitik as well as the World Risk and Insurance Economics Congress (WRIEC) 2015 for excellent comments. In particular, we thank Roland Eisen and Peter Zweifel for excellent discussions of this paper. We take responsibility for all errors in and shortcomings of the paper. Generous funding by the German Federal Ministry of Education and Research (FKZ: 01EH1602A) is gratefully acknowledged. We do not have financial interests that would constitute any conflict of interests with this research. The views expressed herein are those of the authors and do not necessarily reflect the views of the National Bureau of Economic Research.
NBER working papers are circulated for discussion and comment purposes. They have not been peer-reviewed or been subject to the review by the NBER Board of Directors that accompanies official NBER publications.
© 2017 by Juan Pablo Atal, Hanming Fang, Martin Karlsson, and Nicolas R. Ziebarth. All rights reserved. Short sections of text, not to exceed two paragraphs, may be quoted without explicit permission provided that full credit, including © notice, is given to the source.

Exit, Voice or Loyalty? An Investigation into Mandated Portability of Front-Loaded PrivateHealth PlansJuan Pablo Atal, Hanming Fang, Martin Karlsson, and Nicolas R. ZiebarthNBER Working Paper No. 23468June 2017JEL No. G22,I11,I18
ABSTRACT
We study theoretically and empirically how consumers in an individual private long-term health insurance market with front-loaded contracts respond to newly mandated portability requirements of their old-age provisions. To foster competition, effective 2009, German legislature made the portability of standardized old-age provisions mandatory. Our theoretical model predicts that the portability reform will increase internal plan switching. However, under plausible assumptions, it will not increase external insurer switching. Moreover, the portability reform will enable unhealthier enrollees to reoptimize their plans. We find confirmatory evidence for the theoretical predictions using claims panel data from a big private insurer.
Juan Pablo AtalDepartment of Economics3718 Locust WalkUniversity of PennsylvaniaPhiladelphia, PA [email protected]
Hanming FangDepartment of EconomicsUniversity of Pennsylvania3718 Locust WalkPhiladelphia, PA 19104and [email protected]
Martin KarlssonCINCH Health Economics Research Center Weststadttürme Berliner Platz 6-8 45127 Essen, [email protected]
Nicolas R. ZiebarthCornell UniversityDepartment of Policy Analysis and Management (PAM) 106 MVR,Ithaca, 14853 [email protected]

1 Introduction
Very few countries in the world organize their health insurance system around private health in-
surance markets. Even in the US, the leading example of a largely private system, public health
insurance accounts for an increasing share of overall spending. In addition, private health in-
surance has been increasingly regulated. For instance, the Affordable Care Act (ACA) prohibits
experience rating of premiums and pre-existing condition clauses. One major question of inter-
est is how to regulate private insurance markets in order to foster competition between insurers,
while containing premium growth and allowing for consumer choice.
Besides the US and Chile, Germany is one of the countries with an entirely private health
insurance market, not just a supplemental one.1 The existence of this individual private mar-
ket is due to historical reasons and allows the self-employed, civil servants, and high-income
earners to irreversibly opt out of the public system and insure their entire health risks privately
and individually. The German individual private market is in some respects less regulated than
the US market after the ACA. For example, there exists no guaranteed issue and pre-existing
condition clauses are legal. Furthermore, at the beginning of the contract period, premiums
are individually underwritten and risk-rated. After the initial risk-rating and in subsequent
periods—to avoid jumps in premiums due to health shocks—all premium increases are strictly
community-rated at the health plan level and guaranteed renewability exists.
One special feature of the German private market is the legal obligation of insurers to build
up old-age provisions for each enrollee. The rationale behind this regulation is to incorporate a
mandatory savings component in order to keep premiums stable over the life-cycle and to pre-
vent excessively high premiums for the elderly.2 Therefore, the premiums for the young exceed
their actuarially fair value, whereas they fall behind for the elderly. Old-age provision builds up
when the enrollee is young and is gradually exhausted as the enrollee ages. Furthermore, there
is no official enrollment period and enrollees remain insured until they actively decide to cancel
their contracts and switch insurers. Guaranteed renewability exists and, while the insured can
cancel contracts, insurers cannot cancel contracts as long as premiums are paid. This leads to a
one-sided insurer commitment and poses challenges for the insurer if good risks predominantly
lapse their contracts (Hofmann and Browne, 2013). Until 2009, this one-sided commitment was,
1 In contrast, there basically exists no private group market in Germany.2 In Germany, there exists no Medicare for the elderly which means that individuals are privately insured for the
rest of their life.
1

however, limited because old-age provisions were not transferable to competing insurers. Along
with the renewed risk-rating when lapsing contracts and switching insurers, the non-portability
of provisions and front-loading of premiums created a substantial lock-in effect because switch-
ing insurers typically entailed considerable financial losses. Currently, the average old-age pro-
vision is around $24,000 per policyholder (Association of German Private Healthcare Insurers,
2016). Consequently, effective 2009, the German legislature passed a bill that mandated old-age
provisions to be made portable (to a standardized extent). The intention of the bill was to reduce
switching costs, restore consumer confidence, and foster market competition.
The objective of this paper is to theoretically and empirically investigate the effects of this
2009 portability reform. First we develop a simple two-period model where consumers have
the option to keep their current long-term contract, renegotiate with the insurer and switch
internally, or lapse their contract and switch externally. Likewise, insurers derive value from
existing contracts, depending on how enrollees’ health has developed since its inception and
initial risk-rating. Due to the one-side commitment in the market, insurers can only decide to
renegotiate contracts or not, but consumers can also lapse. As a result of the reform, the model
predicts primarily an increase in contract renegotiations and internal switching rather than an
increase in lapsing and external switching. Moreover, the model suggests that the decrease in
switching costs and the increase in outside options enables sicker enrollees (than prior to the
portability reform) to renegotiate and switch internally or externally.
Next, we test whether real-word data are in line with our model predictions. We base our
empirical investigation on detailed claims panel data from one of the largest German individual
private health insurers. In total, we observe more than 300,000 policyholders from 2005 to 2011.
We not only know their diagnoses and claims but also have detailed information on their plan
choices and plan parameters such as cost-sharing amounts and benefit generosity.
In line with our model, our empirical findings provide only very modest evidence for an
impact of the reform on canceling contracts and switching insurers. However, again entirely
in line with our model, the likelihood of reoptimizing plans and switching internally increased
substantially. And we can also confirm our last theoretical prediction, namely that switchers
are more unhealthy post-reform. In the model context, these empirical patterns are explainable
with the increase in consumer bargaining power in interaction with insurer retention efforts to
keep some policyholders. The findings illustrate that regulatory efforts to strengthen consumer
sovereignty in the health care sector can enable consumer action and lead to a reoptimization of
2

health plan choices.
The issue of consumer lock-in effects is inherent in several markets (for theoretical deriva-
tions, see e.g. Klemperer, 1987; Beggs and Klemperer, 1992). Farrell and Klemperer (2007) iden-
tify lock-in effects that are caused by the incompatibility of products in a network market (net-
work effects), which explains the dominance of some companies in the software market (Werden,
2001). Initial investments are another source source of consumer lock-in. Zauberman (2003)
show that even small initial investments by customers can lead to long-term lock-in. Cognitive
lock-in is another area of research, mostly in the management and psychology literature (e.g.
Yang and Peterson, 2004; Bell et al., 2005).
In the broadest sense, the paper relates to the large literature on the design of private health
insurance markets (Fang and Gavazza, 2011; Starc, 2014; Bajari et al., 2014; Handel et al., 2015;
Hackmann et al., 2015; Einav et al., 2016) and markets with lock-in effects and one-sided com-
mitments (Cardon and Hendel, 2001; Crocker and Moran, 2003; Herring and Pauly, 2006; Viard,
2007; Bouckaert et al., 2010; Crocker and Snow, 2011; Biglaiser et al., 2013). Because the German
private health insurance market is comparable to life insurance markets in other countries—
well-known examples of front-loaded contracts—the paper contributes to a better understand-
ing of the functioning of front-loaded insurance markets and the issue of portability (Hendel
and Lizzeri, 2003; Grundl et al., 2006; Farrell and Klemperer, 2007; Fang and Kung, 2010; Mc-
Shane et al., 2010; Schmeiser et al., 2012; Fang and Kung, 2012; Eling and Kiesenbauer, 2014;
Schmeiser et al., 2015).3
In the narrowest sense, this paper is the first to evaluate the 2009 German portability reform
theoretically and empirically. In that sense, the following papers are closest in spirit to ours
because they all analyze switching behavior in the German PHI market: Using claims panel data
from a German private insurer, Hofmann and Browne (2013) empirically test several theoretical
hypotheses about enrollees’ switching behavior in front-loaded contracts. Their main results are
that front-loading creates a lock-in effect and that more front-loading is associated with lower
lapsing rates. Hofmann and Browne (2013) do not cover the 2009 reform but discuss the reform
as promising field for future research. Exploiting 2010 claims data of another German private
insurer, Christiansen et al. (2016) empirically study determinants of lapsing and switching and
3The paper also contributes to the literature studying health plan switching and switching costs (Buchmuellerand Feldstein, 1997; Cutler and Reber, 1998; Strombom et al., 2002; Schut et al., 2003; Nuscheler and Knaus, 2005;Abraham et al., 2006; Dijk et al., 2008; Dafny and Dranove, 2008; Bouckaert et al., 2010; Schram and Sonnemans,2011; Biglaiser et al., 2013; Grunow and Nuscheler, 2014; Boonen et al., 2015; Bunnings et al., 2017; Schmitz andZiebarth, 2017).
3

find that premiums play a crucial role. Eekhoff et al. (2006) discuss the possibility of portable
old-age provisions to increase competition in the German private health insurance market. And
Baumann et al. (2008) theoretically model the life-cycle premium development in the German
private market. Because the accumulated reserves rise fast enough at the beginning of a contract,
their simulations show that a considerable part of the old-age provisions could be made portable
between insurers without harming insurers; the latter was a typical pre-reform complaint by the
insurance industry.
The remainder of the paper is structured as follows. In Section 2 we present the institutional
background of the German health insurance system and the 2009 reform; in Section 3 we de-
scribe our model and generate theoretical predictions regarding the impact of the portability
reform of old age provisions; in Section 4, we describe the data and provide empirical evidence
for the model predictions; and in Section 5 we conclude.
2 Background
This section provides a brief overview of the German health care system. In particular, we
explain the German private health insurance market and the 2009 portability reform.
2.1 The German Individual Private Health Insurance Market
The German health insurance system consists of two co-existing markets: Statutory Health In-
surance (SHI) and Private Health Insurance (PHI). The default is SHI which insures 90% of the
population. SHI premiums are charged as income-dependent contribution rates. Currently the
contribution rate is 15.5% of the gross wage and split roughly evenly (by law) between employ-
ees and their employers. Non-working family members are covered by SHI family insurance
without extra costs. Social law regulates the 120 not-for-profit insurers (“sickness funds”). Es-
sential health benefits are generous in international comparison and deductibles or co-insurance
rates prohibited (Bunnings et al., 2017; Schmitz and Ziebarth, 2017).
Opting out of SHI. For historical reasons, select population sub-groups can opt out of SHI:
(a) the self-employed; (b) high income earners with gross labor incomes above a politically de-
fined federal threshold (2017: e 57.6K or about $60K p.a.); and (c) civil servants. Opting out of
SHI is essentially a lifetime decision: to avoid that individuals game the system, switching back
to SHI is only possible when enrollees are younger than 55 years and when their incomes fall4

below the income threshold.
In SHI and PHI, provider networks and managed care are unknown. Hence people can
freely choose their provider. In addition, in both SHI and PHI, reimbursement rates are centrally
determined and do not vary by insurers or health plans. In the first place, private insurers
customize health plans and process, scrutinize, and deny claims.
The PHI market consists of 44 private insurance companies that provide “comprehensive”
and “supplemental” insurance coverage. Comprehensive or “full” policies are solely sold as
individual non-group policies. In 2016, German private insurers provided 8.8 million compre-
hensive and 25.1 million supplemental policies (Association of German Private Healthcare In-
surers, 2017). The supplemental policies are mostly held by SHI enrollees who top up their SHI
essential benefit package by insuring dental care, glasses, or other non-essential SHI benefits.
This paper abstains from the supplemental private market.
One main consumer advantage of getting comprehensive PHI is choice. Compared to the
post-ACA era in the US, the German private individual market is less regulated. Applicants can
freely choose their level of coverage in terms of benefits and cost-sharing amounts. This results
in thousands of different health insurance plans among the 8.8 million policyholders, most of
which are sold across state lines and nationwide. The majority of private insurers operate na-
tionwide and are open to all applicants who opt out of SHI. Pre-existing condition clauses are
allowed and insurers can deny coverage.
Guaranteed Renewability and One-Sided Commitments. While insurers can initially deny
coverage to bad risks, insurers cannot cancel ongoing contracts and dump enrollees who ex-
perience health shocks or consume more health care than expected. In addition, whereas the
initial premium is risk-rated, all subsequent premium increases have to be community-rated at
the health plan level and guaranteed renewability exists. These regulations intend to ban active
cream-skimming on the insurer side. Because, after the initial screening, insurers are prohibited
from canceling contracts while policyholders can lapse and switch to a different insurer, it is a
market with a one-sided commitment. Also note that no fixed enrollment period exists in the
German PHI. Contracts are permanent and do not have to be renewed. After opting out of SHI
or leaving PHI family insurance and signing an individual contract, it is not uncommon that
enrollees remain insured with their carrier until they die (Medicare does not exist in Germany).
In our sample, the policyholders’ average age is 46 years and enrollees have been clients for an
average of 14 years (max. is 85 years).5

PHI Premium Calculation. In order to understand switching behavior and how switching
interacts with health risks, the premium calculation is crucial. When opting out of SHI and
first signing a private contract, the initial PHI premium is individually underwritten and risk-
rated.4 Premiums consist of several components whose calculations are regulated by the Kalku-
lationsverordnung (KalV). The specific actuarial calculations are carried out by the actuaries of
each insurer and have to be approved by the federal financial regulatory agency Bundesanstalt
fur Finanzdienstleistungsaufsicht (BaFin) : The basic premium components are:
1. Risk-rated actuarial part. It depends on age, sex, health status and the plan’s actuarial
value (benefits, cost-sharing, family vs. single plan).
2. Old-age provisions. They depend on enrollees’ age, the accumulated capital stock, and
(1). Adjustments are made continuously over the life-cycle.
3. Administrative loading factor. It includes a variety of different positions, from a “safety
charge” of at least 5% on top of the sums of (1) and (2) (§7 KalV) to the possibility to prorate
broker commissions (§8 KalV, see below).
4. Old-age provision loading factor. It is calculated as 10% of (2). (§12 4a Versicherungsauf-
sichtsgesetz (VAG)).
As mentioned, guaranteed renewability exists and premiums have to be community-rated at
the plan level after the initial risk-rating. However, when switching insurers, a new risk rating
is routinely carried out and the actuarial part (1) might change. This has been the case pre- and
post-reform.
Old-Age Provisions. One important and distinct characteristic of the market is the legal
obligation of insurers to build up old-age provisions, typically until around age 60 of the poli-
cyholder, constituting parts (2) and (4) above. Thus premiums are heavily front-loaded over the
individuals’ life cycles. Young enrollees’ premiums significantly exceed their expected health
care spending, while old enrollees’ premiums are significantly lower than their expected health
4 The only exception is the “Basic Plan” (Basistarif ). The Basic Plan has to be offered by all insurers and must bestructured after the SHI standardized health plan with the same set of essential benefits and actuarial values. for theBasic Plan, guaranteed issue exists for people above 55 or those who joined the PHI after 2009. The maximum pre-mium is capped at the maximum SHI premium (2017: e 683 per month). The legislature mandated the introductionof the Basic Plan in 2009 to provide an “affordable” private option for PHI enrollees who cannot switch back to SHI,are uninsured, would have to pay excessive premiums, or would be denied coverage. However, the demand for theBasic Plan is negligible which is why, henceforth, we will abstain from further considering it. In 2015, in the entirePHI, only 29,400 people or 0.3% were enrolled in the Basic Plan (Association of German Private Healthcare Insurers,2016). In our data, only 1,006 enrollees chose the basic plan in 2010.
6

care spending. The idea is to dampen age-related increases in health care spending (and thus
premiums) through old-age provisions and a capital stock. Ideally, real premiums would then
remain stable over enrollees’ life cycles. In 2015, total PHI old-age provisions amounted to
e 189 billion ($208 billion) for 8.8 million policies, or to e 21.5K ($23.7K) per policy (Association
of German Private Healthcare Insurers, 2016).
Pre-Reform Non-Portability. Pre-reform, when switching insurers, enrollees would lose
their entire capital stock, the sum of components (2) and (4) above over their tenure with the
insurer. Old-age provisions were not portable. Or, to be more specific, there was no porta-
bility mandate and insurers did not transfer them to competitors when consumers switched.
This resulted in high switching costs that created a lock-in effect and dampened competition.5
Choosing private insurers was essentially a life-time decision. Switching rates were very low.
Only young and healthy individuals would even consider switching insurers due to (i) the loss
of the capital stock, (ii) the associated age-related increase in premiums, (iii) the new risk-rating,
(iv) no guaranteed issue and the possibility of insurers to exclude pre-existing conditions or
deny coverage.
2.2 The Portability Reform of 2009
Effective January 1, 2009, old-age provisions (component (2) above) had to be made portable
when enrollees would cancel their contracts and switch to a competitor. However, after lob-
bying by the industry and to reduce the administrative burden for insurers, the portability of
provisions was standardized. The standardization follows the standard SHI plan which im-
plies that policyholders with more generous coverage lose parts of their old-age provisions.6
Hence, although external switching costs clearly decreased for basically all policyholders, they
remained (prohibitively) high for some enrollees, particularly for older people due to reasons (i)
to (iv) above.
The reform differentiated between two groups of policyholders. (a) First, for policyhold-
ers with existing contracts before January 1 2009 (the great majority), external switching and
portability was only possible in the six months period between January 1 and June 30, 2009.
To be specific, old-age provisions had to be made portable as long as the contract was canceled
5Another factor reinforces the lock-in effect and resembles the life insurance market: due to the very long averagecontract periods, insurance brokers receive a relatively high commission of typically six monthly premiums. Insurercan deduct these acquisition costs from the old-age provisions during the first years of the contract via the “Zillmer”method (§8 KalV). When switching insurers, typically commission has to be paid again.
6When the actuarial value is below the SHI plan, then insurers solely make the actuarial value portable.7

between January 1 and June 30, 2009 (§204, 2b, Versicherungsvertragsgesetz (VVG)).7
Our data do not identify when exactly the contract was canceled but we see when the old
contract formally ended and the new coverage began (which is typically at the beginning of a
calendar year). Thus, we assume that enrollees who canceled contracts and switched insurers
effective January 2010 had canceled their contract during the six months cancelation period
between January 1 and June 30, 2009.
(b) Second, for new policyholders whose coverage became effective after December 31, 2008,
standardized provisions have been always portable. However, because the minimum contract
period in our sample is two years8 and because our data only cover years up to 2011, we disre-
gard subgroup (b) and exclusively focus on the majority of existing policyholders (a). This has
the advantage that reform-induced selection into PHI is not a serious concern here.
3 Model
This section develops a simple two-period model to generate predictions of how enrollees’
switching behavior may change as a result of the portability reform described in Section 2.
Consider two periods, indexed by t ∈ {0, 1}, and two insurance companies, indexed by f ∈
{1, 2}. We consider individuals who are enrolled in one of the two companies in period 0, and
focus on the enrollees’ switching decisions in period 1. In period 1, enrollees have three options:
(i) keep the guaranteed-renewable contract that they purchased in period 0; (ii) renegotiate the
terms of the contract with their current insurer and switch internally; and (iii) switch externally
to a spot contract with a different insurer.
We denote by ht an individual’s expected health expenditures, i.e., her risk type. Since we
focus on the individual’s decision in period 1, we normalize h0 = 0 and we simply label h1 as
h. We assume symmetric learning in the sense that both the insurer and the enrollee know the
realization of h in period 1. Also, following the German institutional setting, this is a market
with one-sided commitment: the insurer cannot cancel the contract, but enrollees can switch
externally if the value of the current contract lies below the value of a new spot contract with a
competitor.
7Policyholders above 55 were exempt from the six month cancellation period as long as they switched to the(unpopular) Basic Plan, see footnote 4.
8This is part of private law and not regulated. Most insurers specify a minimum contract period of two years andsome of one year. When contracts are canceled before the two year minimum duration, the premiums for the entiretwo period have to be paid which is why canceling prior does basically not happen.
8

We use Y to denote a consumer’s total income, Pf the premium with insurer f , and θft the
preference parameter for insurer f at time t, which may change over time. We write
u(Y− Pf , θft ) (1)
as the individual’s indirect flow utility at time t from being enrolled in a plan with premium
Pf offered by company f . We assume that u (·, θ) is increasing and concave in consumption,
and u (c, ·) is increasing in θ. Throughout the model, we omit plan characteristics and assume
that plans provide full insurance. Without loss of generality, we consider individuals who were
insured with insurer 1 at the end of period 0. We normalize θ21 = 0, so that θ ≡ θ1
1 equals
individuals’ period-1 relative preference of company 1 over company 2.
Consider an individual who is currently insured with insurer 1 under a guaranteed-
renewable contract with premium P0 for both periods.9 Suppose her period-1 health realization
is h and her relative preference realization is θ. If she switches to insurer 2, she will be risk-rated
for a spot contract at an actuarially fair premium, which we denote by P∗ (h), assuming a per-
fectly competitive spot market in period 2. To simplify the exposition, we assume without loss
of generality that P∗(h) = h.
Let VI (h, θ) be the individual’s value of the contract at t = 1 relative to the outside option of
switching to a spot contract with insurer 2. This value is a function of her realized risk type h
and her realized preference shock θ in period 1, and is given by:
VI(h, θ) = u (Y− P0, θ)− u (Y− h, 0) . (2)
Since u (·, θ) is increasing and concave, we have ∂VI(h, θ)/∂h > 0 and ∂2VI(h, θ)/∂h2 > 0. Also,
by definition of θ, ∂VI(h, θ)/∂θ > 0.
Analogously, let VF(h) be firm 1’s value from keeping the customer, which is given by:
VF(h) = P0 − h
where P0 is the insurer’s premium revenue and h is the expected cost of insuring the consumer.
9Firm’s expected profits equal zero during the duration of the contract. Premiums are endogenously determinedby the firm’s zero-profit condition, taking into account endogenous lapsing. Because we study the short-term effectsof the portability reform on current customers, we take P0 as given.
9

The functions VI and VF are plotted in Figure 1, assuming h ∈ [hmin, hmax] and θ ∈ [θmin, θmax].10
[Figure 1 About Here]
Figure 1 shows that VF (·) is a monotonically decreasing function of the individual’s period-
1 risk realization h. VF (h) is equal to zero if h = P0, i.e., if the individual’s period-1 health
realization equals the risk-rated premium of period-0 (i.e., expected health risk) of the long-
term contract. Contrarily, VI (·) is a monotonically increasing function of h. If h equals P0, then
the enrollee is indifferent between keeping the contract and switching to a competitor—as long
as θ = 0, i.e., if the individual has no relative preference for insurer 1. A higher θ shifts the
VI (·, θ) curve upward.
3.1 Pre-Reform Switching
Whether the policyholder will (i) keep the current guaranteed renewable contract, or (ii) rene-
gotiate and switch internally to a new contract, or (iii) switch externally to a different insurer
depends on (a) the sign of the total value VI (h, θ) + VF (h) for both the individual and the firm,
and (b) the sign of VI (h, θ) for the individual. We can distinguish between three cases:
1. If VI (h, θ) ≥ 0, the individual will keep the current guaranteed renewable contract.
2. If VI (h, θ) < 0 but VI (h, θ) + VF (h) ≥ 0, the individual and the firm will renegotiate a
new contract, i.e., internal switching occurs.
3. If VI (h, θ) < 0 and VI (h, θ) + VF (h) < 0, the individual will switch to a different insurer,
i.e., external switching occurs.
In case (1), the individual is strictly better off by keeping the current contract (vs. switching),
given her realized (h, θ) . We assume that, in this case, the insurer does not consider it necessary
to renegotiate the contract to keep the enrollee. If the insurer does not observes the enrollee’s
preference for the insurer, θ, one may be concerned that the enrollee could pretend to have a
10Note that we have placed some parametric restrictions on preferences. This implicitly puts bounds on preferenceheterogeneity which is not essential for the analysis but made explicit here for the sake of clarity: First, we assumethat VI(hmin, θmax) < 0. This means that, under the most favorable health shock hmin, the individual is alwaysbetter off by switching insurers. This places an upper bound on preference heterogeneity because it implies that anindividual whose risk is reclassified very favorably in the spot market always prefers to switch insurers. Second, weassume that VI(hmax, θmin) > 0. This means that, under the most negative health shock hmax, the individual alwaysprefers to keep the current contract. This places a lower bound on preference heterogeneity because it implies thatan individual whose risk is reclassified very negatively in the spot market never wants to switch insurers.
10

large negative θ in order to negotiate a better contract. We abstract away from this type of
strategic behavior by assuming that consumers can only credibly prove that VI (h, θ) < 0 by
obtaining a quote from another insurer. Obtaining such a quote would reveal the individual’s
true health realization h through the risk-rating and would also be costly when the consumer is
not prepared to switch externally; as such, we rule this type of strategic behavior out.
In case (2), the individual is better off by switching to a different insurer (vs. keeping the
current contract). However, the incumbent insurer is willing to renegotiate the contract to ensure
that the individual is at least equally well-off by staying. The individual switches internally.
In case (3), the individual is better off by switching to a different firm (vs. keeping the current
contract), and the incumbent insurer is unwilling to renegotiate the contract. The individual
switches externally.
We denote the total value of the current contract for both the individual and the firm by
W (h, θ). It is given by
W(h, θ) ≡ VI(h, θ) + VF(h) = u(Y− P0, θ)− u(Y− h, 0) + P0 − h. (3)
Figure 2 plots W (·) as a function of h for different values of θ. Because u (·, θ) is concave in h,
W (·, θ) is concave in h for all θ. The concavity of W (·, θ) in h, together with the fact that W (h, ·)
is increasing in θ, implies that there exists a unique value θ∗ for which there is exactly one value
of h(θ∗) such that W(h(θ∗), θ∗
)= 0 and W (h, θ∗) > 0 for all h 6= h (θ∗).
[Figure 2 about here]
Moreover, for preference shocks satisfying θ > θ∗, it holds that W (h, θ) > 0 for all h. For
preferences shocks θ < θ∗, the concavity of W (·, θ) implies that there are two threshold values,
hl(θ) and hu(θ), such that W(h, θ) < 0 if and only if h ∈ [hl (θ) , hu (θ)]. When θ is sufficiently
small, hl (θ) equals hmin.
[Figure 3 about here]
The characterizations of VI (·, ·) in Figure 1 and W (·, θ) in Figure 2 allow us to depict VI (·, ·)
and W (·, ·) in the (h, θ)-space via iso-curves. Figure 3 graphs the loci in the (h, θ)-space for
W(h, θ) = 0 and for VI(h, θ) = 0. Note that both loci intersect at the point (h, θ) = (P0, 0), where
both the individual value and the total surplus are zero. Note that the iso-curve for W (h, θ) = 011

lies below θ = θ∗ because the axis for θ is inverted. The loci depicted in Figure 3 define three
relevant areas:
1. The iso-curve for VI (h, θ) = 0 defines the first area in the south-east part of the (h, θ)-
space where the value for the individual is positive, i.e., VI (h, θ) > 0. This area represents
individuals who are relatively sick and relatively attached to the insurance company, and
therefore do not want to switch plans.
2. The second area is defined by the conditions W(h, θ) > 0 and VI(h, θ) < 0 in the
south-west corner of the (h, θ)-space, where the total surplus is positive but the value
for the individual is negative. In such cases, the insurer and the policyholder negoti-
ate new contract terms and the enrollee optimizes her plan. This area defines the (h, θ)
combinations for which individuals will switch internally to a different plan. Formally:
Pr(Internal Switch) = Pr ((h, θ) : W(h, θ) > 0 and VI(h, θ) < 0).
3. The third area is defined by the conditions W(h, θ) < 0 and VI(h, θ) < 0 in the north-
west corner of the (h, θ)-space. In such cases, both the individual and the total surplus
are negative; hence, the parties are not able to negotiate better contract terms. This area
defines the (h, θ) combinations for which the individual and the firm will split, i.e., the
individual will switch externally to a different insurer. Formally: Pr(External Switch) =
Pr ((h, θ) : W(h, θ) < 0 and VI(h, θ) < 0).
3.2 Post-Reform Switching
Next we analyze the short-run effects of the portability reform through the lens of the simple
model developed above. Under the portability reform, an individual who has signed a long-
term contract in period 0 will be entitled to carry an old-age provision A if she decides to switch
to a different insurer in period 1. The value of A > 0 does not depend on the individual’s
realized value of h or θ.11
As in Section 3.1, we will analyze the individual’s value from switching to a different insurer
relative to renewing the current contract. If the individual switches externally to a different
insurer, her new premium will be rated at h, but now she will be entitled to receive the old-
age provision A > 0 from the current insurer. Thus, with old-age provision portability, the
11In practice, A depends on the individual’s tenure in the contract, the type of contract as well as demograph-ics. These factors are not explicitly considered in this basic model – which may be thought of as being implicitlyconditional on these baseline characteristics.
12

individual’s relative value of renewing the current long-term contract, now denoted by VI (h, θ),
is given by:
VI(h, θ) = u(Y− P0, θ)− u(Y− h + A, 0). (4)
Interestingly, because the portability reform mandates the incumbent insurer to make the age
provision A portable to the consumer when leaving the insurer, it increases the value of the
insurer of keeping the customer by an amount equal to A:
VF(h) = P0 − h + A. (5)
The total value of the relationship after the portability reform is therefore given by
W(h, θ) = VI (h, θ) + VF (h, θ) = u(Y− P0, θ)− u(Y− h + A, 0) + (P0 − h + A) (6)
Comparing VI (h, θ) and VI(h, θ) in equations (2) and (4), we obtain:
VI(h, θ) = VI (h− A, θ) , for all θ (7)
Similarly, comparing W (h, θ) and W(h, θ) in equations (3) and (6), we obtain:
W(h, θ) = W(h− A, θ), for all θ (8)
The relationships represented by equations (7) and (8) crystallize the impact of the portability
reform on the switching decisions. Analogous to Figure 3, we can now depict the iso-curves
for VI(h, θ) = 0 and W(h, θ) = 0 in the (h, θ)-space. Figure 4 shows graphically what we see in
equations (7) and (8): that VI(h, θ) = 0 and W(h, θ) = 0 are shifts of VI(h, θ) = 0 and W(h, θ) = 0
to the right by A.
[Figure 4 about Here]
Figure 4 also illustrates how the internal and external switching domains change as a result
of the portability reform:
Internal Switching. First, the model predicts that basically all (h, θ) combinations that led to
internal switching pre-reform are also included in the internal switching domain post-reform.13
Thus, the model predicts an increase of internal switching rates due to the reform. This is es-
pecially true for individuals with positive tastes for the insurer (θ > 0). The portability reform
reduces these individuals’ incentives to renew their long-term contract (case (1)). However,
because the total surplus of these individuals and the incumbent insurer exceeds the outside
option, both parties prefer to renegotiate a new contract (which creates higher utility for the in-
dividual) than parting ways. Individuals who are able to renegotiate with the insurer represent
relatively good risks so that the insurer would like to keep them. However, as seen in Figure 4,
post-reform, a share of less healthy enrollees are now also attractive for the insurer to keep as
customers; at the same time, these enrollees are less attached to their insurer.
External Switching. Second, the model predicts that there may be an increase in the mass of
(h, θ) combinations that switch externally. However, this increase of external switchers is con-
centrated among individuals with negative preference shocks for the insurer (θ < 0). However,
as we focus on consumers who are currently insured with the incumbent firm, by revealed pref-
erences, consumers with θ < 0 are likely underrepresented among the pool of existing enrollees.
In our data, external switching rates were low pre-reform, which indicates θ > 0.
Composition of Switchers. Third, the model predicts that both internal and external switch-
ers are less healthy after the reform. This is because, before the portability reform, unhealthy
individuals were locked in with the incumbent insurer. Mandated portability opens the possibil-
ity, even for relatively unhealthy individuals with weak preferences for the insurer, to credibly
threaten the insurer to leave (and then to switch internally or externally).
3.3 Summary of Testable Hypotheses
The framework above delivers the following testable hypotheses on the short-run effects of the
portability reform:
Hypothesis 1. Internal switching will (almost) unambiguously increase post-reform.
Hypothesis 2. External switching will be roughly constant post-reform (under plausible as-
sumptions).
Hypothesis 3. Both internal and external switchers will, on average, be in worse health post-
reform.
14

In addition, if h and θ are independent, then Figures 3 and 4 also predict that external switch-
ers will, on average, be healthier than internal switchers. This holds both before and after the
portability reform.
Hypothesis 4. The health status of internal switchers is, on average, worse than the health sta-
tus of external switchers, pre-and post-reform.
3.4 A Numerical Example
This section offers a numerical example to illustrate the workings of the model. We simulate
5,000 individuals whose period-1 health type h is drawn from U[0, 2]. Moreover, we set Y = 2,
and parameterize the flow utility as
u(Y− P, θ) = 2.5×√
2− P + θ
In addition, we set A = 0.5 and P0 = 1 and use two assumptions for the distribution of θ.
First, we assume that θ ∼ [−1, 1], the Uniform Case. This is an unrealistic assumption consid-
ering that θ is the preference for an insurer among existing enrollees. Hence, alternatively, we
assume a linear p.d.f for θ, such that f (θ) = 1+θ2 , the Triangular Case. This yields E(θ) = 1
3 .
[Table 1 about here]
Table 1 shows the simulated impact of the portability reform on the number of internal and
external switchers and their average health status. First, assuming θ was uniform and symmet-
ric around zero (Uniform Case), external switching rates would almost be three times higher
pre-reform (column (1)). As we will see below, this is inconsistent with our data. In column
(1), internal and external switching rates would increase substantially post-reform. The reform
would also worsen the average health status of internal and external switchers.
Second, assuming θ was triangular and had a positive mean (Triangular Case), internal and
external switching rates would be very similar pre-reform (column (3)). In this case, we also find
that the reform would have a much stronger effect on internal than on external switching rates.
Finally, post-reform, internal and external switchers would be in worse health than pre-reform.
These observations are all very consistent with our data.
15

4 Empirical Analysis
This section assesses whether the empirical observations are in line with the model predictions
as summarized in Section 3.3. To do so, we use claims panel data from a big private German
insurer and simple regression diagnostics.
4.1 Data
This section uses claims panel data from a large German non-group health insurer. The database
includes the universe of contracts and claims between 2005 and 2011, and therefore allows for
an evaluation of the 2009 portability reform. In total, we observe more than 300,000 unique
enrollees along with detailed information on plan parameters such as benefits and cost-sharing
amounts as well as claims and diagnoses. More details about the data and its descriptives are
provided by Karlsson et al. (2016).
Sample Selection. First, we disregard enrollees with missing observables and only focus
on actual policyholders, i.e., those who pay the premium and likely make switching decisions.
In other words, we disregard insured family members. Second, we ignore observations with
contract durations of less than three years, because the minimum contract period for enrollees
in our sample is two years. Only after this minimum contract period can a contract be lapsed.
This means that we disregard inflows after the 2009 reform, which entails the positive side-effect
of shutting down potential treatment-induced selection into PHI. It is also consistent with our
model which focuses on pre-reform enrollees. The final sample consists of 1,206,286 enrollee-
year observations. Table A1 in the Appendix shows descriptive statistics.
Outcome Measures. The main individual-level outcome measures are realized health plan
switches. First, we observe whether enrollees cancel their contract and switch insurers. Accord-
ingly, we generate a binary variable External Switch. Table A1 shows that an External Switch
occurs in 6.4% of all enrollee-year observations. Second, we also observe whether enrollees
switch within the insurer to a different health plan. Hence, we generate a second binary vari-
able Internal Switch which is one for 8.5% of all enrollees-year observations.
Risk Types. Two key predictions of the theoretical model regard h, the realized risk types, of
people who lapse their initial contract. This variable represents the extent to which the expected
costs in the current period deviate from the expectation, based on which the initial underwriting
was made. We construct two different empirical proxies for h. First, we exploit the fact that P0,
16

the premium of the existing contract, represents a sufficient statistic for the the initial estimate
h0 (which was assumed to be equal to zero in the theoretical model) after controlling for sex,
age, insurance plan, and age at entry.12 We thus estimated the auxiliary regression equation
Cit = βtP0 + ft (Ait, Fi, Iit, Mi) where Cit is enrollee i’s claims amount in year t, (Ait, Fi, Iit, Mi)
represent age, sex, plan, and age at entry, respectively.13 Our proxy for h is defined as the
residual from that regression: h1 = Cit − Cit.
Our alternative proxy for h, h2, is based on residuals from the regression Cit = ft (Ait, Fi, Iit),
which does not use the premium information but instead considers only age, sex, and the health
plan. This alternative proxy is thus more closely related to factors determining a person’s health
care demand, but reveals less about whether the client is profitable from the insurer’s point of
view (which requires using premium information).
Socio-Demographics. As displayed in Table A1, we know the age and gender of enrollees.
We also know their profession and the age when they first signed a contract with the current
insurer. The mean age is 46 years and 72% of all policyholders are male. Almost half of all
policyholders are high-income earners and the other half is self-employed. On average, poli-
cyholders have been clients of the insurer for 14 years and have been enrolled in their current
health plan for 8 years.
Inflation Adjustment. All monetary values are expressed in 2011 Euros. In order to ensure
internal comparability between different years, we derived the deflator from the data: we re-
gressed total annual claims per policyholder on all observables and plan parameters along with
year fixed effects. The year dummies were then used to purge the monetary variables.
Health Plan Parameters. As seen in Table A1, the average deductible is e 573 per year.
Policyholders’ average annual premium is e 4,263 ($4,900) and slightly lower than the aver-
age premium for a single plan in the US group market (Kaiser Family Foundation, 2014). Note
that premium is the total premium paid—including employer contributions for privately in-
sured high-income earners. Employers cover roughly one half of the total premium and the
self-employed pay the full premium.
In terms of the benefits covered, we simplify the rich data and focus on the main generosity
indicators provided by the insurer. These classify plans into Top, Plus, and Eco plans. About
12In order to see this, note that with actuarial premiums (and ignoring time discounting) E0 (ht) = TP0 +∑τ 6=t E0 (hτ) where T is the expected duration of the contract. T is a function of age and sex, and the relationshipbetween P0 and ht is also determined by the age at entry.
13Our specification for ft (Ait, Fi, Iit, Mi) includes year-specific fixed effects for insurance plan; age at entry; andsex times calendar age.
17

46% of all policyholders chose the Top plan, 32% the Plus plan, and 21% the Eco plan.
4.2 Descriptives
Before we turn to the regression analysis, this section provides graphical and descriptive evi-
dence on whether the theoretical predictions in Section 3.3 are in line with our data. We start
with the internal and external switching rates, and then carry on to possible changes in the
composition of switchers.
Switching Rates. Figures 5a and 5b show external and internal switching rates over time.
The pre-reform period from 2005 to 2008 is characterized by relatively smooth and stable switch-
ing rates without much trending. The internal and external switching rates are very similar, at
around 6.5%. As discussed in the previous section, this stylized fact is in line with the Triangular
Case in Table 1.
Without a natural control group and in a pure before-after estimation framework, the iden-
tifying assumption for a causal effect is the absence of significant changes in switching rates in
post-reform years in a world without a reform. The absence of major pre-reform trends makes
this assumption obviously more credible.
[Insert Figures 5a and 5b about here]
As for Figure 5a and external switches: we only observe a slight uptick in the switching rate
from 2009 to 2010. As discussed, this slight increase in cancelations was very likely triggered
in the first six months of 2009 when reserves were made portable in case of an external switch.
However, overall, it is hard to eyeball a substantial impact of the reform on the external switch-
ing rate. This is in line with Hypothesis 2 in Section 3.3 according to which the effect on external
switching should be small.
As for Figure 5b and internal switches: After a minor decrease between 2007 and 2008
(which could be interpreted as an anticipation effect), we observe a strong increase in the in-
ternal switching rate from 4.8% to 17.3% between 2008 and 2009. From 2009 to 2010, the internal
switching rate decreases again to 6.8% and pre-reform levels (recall that existing customers only
had the opportunity to switch once within a six months window). The observation of a poten-
tially strong reform-induced increase in the internal rather than the external switching rate is
entirely in line with our model predictions and Hypotheses 1 and 2.
18

Socio-demographics. Next, we investigate socio-demographics by switching status and the
pre- vs. post-reform period. Hypothesis 3 predicted that both internal and external switchers
would be in worse health post-reform. And Hypothesis 4 suggested than internal switchers may
be unhealthier than external switchers, both pre- and post-reform. Table 2 provides descriptives
along with information on how switchers are different pre- and post-reform (∆) and whether
such trends diverge compared to stayers (∆2).
Apparently, the stock of clients ages over the observation period. As seen in the first two
columns, the average age increases from 45.9 years to 47.7 years. However, most other socio-
demographics remain relatively stable for the non-switchers. The bottom of the panel reports
descriptives on our two health proxy indicators. These measure deviations in a person’s risk
type relative to initial expectations (Section 2). We use these to evaluate Hypotheses 3 and 4.
[Insert Table 2 about here]
Table 2 shows the following facts which are consistent with Hypotheses 3 and 4 : Internal and
external switchers are in worse health after the reform—and the change is of similar magnitude
in the two groups. In addition, internal switchers represent worse risks than external switchers,
pre- and post-reform: in both cases, the mean difference is betweene 300 ande 400 and for both
proxies of h.
4.3 Regression Analysis
The empirical section uses claims panel data from a big private non-group insurer. While these
data have great advantages, they do not easily lead to a natural control group. Identifying
causal reform effects absent a control group requires one additional assumption: namely, the
absence of significant changes in the outcome variable in post-reform years absent a reform.
Depending on the outcome variable of interest and the pre-reform trends, this may be a very
strong or a weak(er) assumption. In our case, Figures 5a and 5b suggests that the assumption
seems credible. Despite some minor trending, the pre-reform trends of our main variables are
relatively smooth and stable. A priori there is no reason to believe that, without the portability
reform, the switching rates would not have continued to be smooth and stable.
Econometric Model. The parametric model can be written as:
19

Yi =α + δpostre f orm
+ Xiβ + Ziθ + ρp + ψt + χr + εi (9)
where Yi is the outcome variable, Internal Switch or External Switch in our main models. Postre-
form is a binary indicator that yields the difference in switching rates in post as compared to
pre-reform years.14
The second row of equation (9) lists all control variables. Xi are socio-demographics (Table
A1) and include the age and gender of the policyholder as well as their employment type. More-
over, we control for health plan variables Zi like the length of the contract period, pre-existing
conditions, or premium mark-ups due to health risks. ρp represents 147 health plan fixed effects
which net out persistent differences between plans. ψt represents calendar year fixed effects,
and χr represents 96 region fixed effects based on the first two zip code digits. Standard errors
εi are routinely clustered at the health plan level.15
An additional model employs a more restrictive specification and includes individual fixed
effects as well as individual-level linear time trends:
Yi =αi + δpostre f orm + γit
+ Xiβ + Ziθ + ρp + ψt + χr + εi (10)
where αi represents the individual fixed effect and γit is the individual-level linear trend. Note
that these separate time trend parameters cannot be consistently identified. The other parame-
ters are still identified, including the key parameter δ. The key rationale of this extended spec-
ification is that controlling for individual time trends may better capture the underlying indi-
vidual heterogeneity as compared to just controlling for common year fixed effects. Including
individual time trends is feasible because we observe enrollees once a year, up to seven times.
Individual time trends are a more refined variant of individual fixed effects; basically one can
think of them as individual fixed effects with individual-specific slope parameters.
14Here we suppress the time index t since we essentially treat our unbalanced panel as a repeated cross-section inthe analysis.
15We estimate linear probability models but partial effects from Probit models generate very similar results.
20

Main Results. Table 3 presents our main estimates. The first three columns use External
Switch and the last three columns use Internal Switch as outcome variable. For both outcomes,
we increase the number of control variables from one specification to the next, and left to right.
This allows us to assess the relevance of correcting the sample with respect to these covariates.
The top panel is a regression based on year dummies for individual years, whereas the bottom
part summarizes the post-reform change in one parameter like in equation (9). Columns (3) and
(6) of the bottom part estimate models like in equation (10).
[Insert Table 3 about here]
Hypotheses 1 and 2. In line with Hypothesis 2, the regression results do not deliver much
evidence that making old-age provisions portable has led to a significantly higher share of pol-
icyholders who cancel contracts and switch insurers. The yearly estimates in the top half are
either negative or not statistically significant. The overall post-reform effect in the bottom half
shows: In column (1), just controlling for health plan and year fixed effects, we find a signif-
icantly negative estimate of 1.74 percentage points (ppt), relative to a baseline switching rate
of 6.5%. The effect entirely vanishes when adding demographic controls (column (2)) and is
estimated at -0.4ppt when we add individual trends (bottom model of Column (3)).
However, in line with Figure 5a and Hypothesis 1, columns (3) to (6) provide strong evidence
that the reform induced more internal switches—and this effect is robust and significant in sta-
tistical and economic terms. According to the overall post-reform effect in the bottom of column
(5), the internal switching rate increased by 6.5ppt in post-reform years. The baseline probability
to switch doubled from 6.5%. When the model considers individual trends as in equation (10),
the effect even increases to 10.4ppt in column (6). As seen in the top panel, this average post-
reform effect is entirely driven by the increase by about 11ppt in 2009. What is noteworthy is
the robustness of the estimated coefficient which barely increases or decreases once we include
sets of individual-level and health plan-level covariates. This suggests that health plan level and
socio-demographic adjusters are not significantly correlated with the increase in the switching
rate from 2008 to 2009.
Hypotheses 3 and 4. Next, we intend to test hypotheses three and four. To do so, we run
a model similar to equation (9) but use our health measures (h) as outcome variables. Because
we intend to measure changes in enrollees’ health relative to expectations to approximate the
model, we use the policyholders’ annual premium to construct a proxy for h, h1 (see Section21

4.1).In addition to using our first health risk proxy as dependent variable, the model adds the
binary indicators Internal Switch and External Switch in levels and in interaction with postre-
form as main regressors of interest to our model. The coefficient estimate of Internal Switch
should then indicate whether, pre-reform, internal switchers were healthier than everybody
else. The interaction term with postreform would indicate whether this relationship changed
post-reform.
[Insert Table 4 about here]
Table 4 shows the results. One observes that the main estimates remain relatively robust
when adding sets of covariates from left to right. When adding individual fixed effects in the
last column, the coefficients decrease but not significantly.
First, pre- and post-reform, internal and external switchers have been healthier than non-
switchers. Moreover, external switchers appear to be healthier than internal switchers. Second,
both internal and external switchers are more unhealthy post-reform. These findings largely
confirm the nonparametric evidence and are entirely in line with Hypotheses 3 and 4 of Section
3.3.
Table A2 (Appendix) shows a robustness check with the alternative proxy measure of h, h2
(where we regress individual annual claims on on our full set of covariates and then take the
difference between actual and predicted claims as a measure of the change in enrollees’ health).
As seen, the results are very robust and confirm Hypotheses 3 and 4 : External switchers are
healthier than internal switchers and, post-reform, switchers have become less healthy.
4.4 How Do Internal Switchers Optimize Health Plans?
The theory and empirics of this paper find more internal health plan switches as a result of
the new mandated portability requirements. Although our model does not make any direct
predictions about it, this final subsection empirically investigates how policyholders optimized
their health plans. Because we observe health plan characteristics after an internal switch pre-
and post-reform (Table 2), we can run the following model:
22

Yi,t+1 =α + γInternalSwitchit + δpostre f ormt + τ × InternalSwitchit × postre f ormt
+ Xitβ + Zitθ + ρp + ψt + χr + εi (11)
where Yi,t+1 now represents different health plan parameters. We consider the type of plan
(eco, plus, top) as well the deductible, the premium, and annual claims. All outcomes are mea-
sured in year t + 1 (in the year after a switch, if one occurred). Internal Switch elicits changes
in plan parameters after an internal switch in pre-reform years; the interaction term Internal
Switch×postreform elicits changes in plan parameters after an internal switch in post vs. pre-
reform years.
Table 5 presents the results of this exercise. Again, in each of the columns from left to right,
we add more control variables to the models. Each panel represents models with the health plan
parameter indicated in the panel header as dependent variable. With 1,125,310 observations, the
analysis sample is slightly smaller than in the previous specifications—due to the fact that we
use leads of the dependent variable.
[Insert Table 5 about here]
Starting with how health plans had been optimized by internal switchers in pre-reform
years, a clear pattern emerges: Internal switches were typically downgrades. A typical pre-
reform switch was associated with a reduced probability in choosing the most generous ’top
plan’ category by 22ppt, or by more than 50% (Panel A, Table 5). There is more evidence that
pre-reform switches resulted in less generous plans: The deductible increased by e 170 and an-
nual premiums decreased by almost e 700–1,000 (Panel C and D, Table 5). Annual claims even
decreased by between e 1,500 and e 1,800 (Panel E, Table 5).
Next, the interaction term contrasts internal switches in post-reform years with those in pre-
reform years. Again, a clear picture emerges: Whereas internal switches represented significant
downgrades pre-reform, post-reform switches entail much smaller generosity downgrades. Ob-
viously, consumers re-opimized but not systematically. Post-reform, the likelihood to choose the
most generous top plan category is 12ppt higher as compared to the pre-reform period (but over-
all still a negative -10ppt). Similarly, the likelihood to choose a higher deductible is significantly
lower post-reform; now the deductible remains quite stable when enrollees switch plans (Panel23

C, Table 5). Premiums still decrease by an average of e 300 per year, but by significantly less
than pre-reform (Panel D, Table 5). Claims are also still lower post-reform, but only by e 1,000
per year (Panel E). The finding that, post-reform, fewer internal switches are generosity down-
grades is consistent with our previous finding according to which internal switchers are, on
average, in worse health post-reform.
5 Conclusion
This paper is the first to theoretically and empirically evaluate a regulatory reform that man-
dated the portability of old-age provisions in the German non-group private health insurance
market. The German private health insurance market is characterized by a front-loading of
premiums over the life-cycle—in the form of a legal obligation of insurers to build up old-age
provisions. The idea is to include a mandatory savings component that dampens the premium
growth when enrollees become older. However, together with the newly experience rated pre-
miums when switching insurers, it also creates a strong lock-in effect and dampens market com-
petition. Making old-age provision portable was a regulatory attempt to reduce switching costs
and to strengthen consumers’ market position; the idea was to foster competition which may
eventually lead to lower premiums and more consumer choice.
The paper first developed a simple theory. We derived economic predictions that could
then be tested empirically. Obviously, the portability reform reduced switching costs for policy-
holders. According to our model, this reduction should induce a larger share of policyholders
to renegotiate their contract with their insurer. This is exactly what we find empirically: the
internal switching rate roughly doubled from a baseline of 6.5% in the first post-reform year.
Moreover, our theory predicts that, pre-reform, mostly healthy policyholders were in a position
to renegotiate contracts; and that, post-reform, less healthy consumers were enabled to renego-
tiate their contract conditions. This theoretical model prediction is also confirmed by our data.
In contrast, we do not find much empirical evidence that the newly mandated portability re-
quirement increased the lapsing and external switching rate. Our model can rationalize this
empirical fact with the assumption that preferences for insurance companies are persistent over
time.
Overall, our findings demonstrate that health care consumers do make active use of in-
creased sovereignty and bargaining power when policymakers enable them. Our findings also
24

demonstrate that consumer lock-in in insurance markets with long-term contracts can result
in low internal and external switching rates as individuals and insurers negotiate the contract
terms. Even though the German portability reform did not increase switching across insurers, it
enabled consumers to negotiate better contract terms.
References
Abraham, J. M., Feldman, R., Carlin, C., Christianson, J., 2006. The effect of quality informationon consumer health plan switching: Evidence from the Buyers Health Care Action Group.Journal of Health Economics 25 (4), 762–781.
Association of German Private Healthcare Insurers, 2016. Financial Report for PrivateHealthcare Insurance 2015. https://www.pkv.de/service/zahlen-und-fakten/archiv-pkv-zahlenbericht/zahlenbericht-2015.pdf, retrieved on March 14,2017.
Association of German Private Healthcare Insurers, 2017. Zahlen und Fakten. https://www.pkv.de/service/zahlen-und-fakten/, retrieved on March 14, 2017.
Bajari, P., Dalton, C., Hong, H., Khwaja, A., 2014. Moral hazard, adverse selection, and healthexpenditures: A semiparametric analysis. The RAND Journal of Economics 45 (4), 747–763.
Baumann, F., Meier, V., Werding, M., 2008. Transferable ageing provisions in individual healthinsurance contracts. German Economic Review 9 (3), 287–311.
Beggs, A., Klemperer, P., 1992. Multi-period competition with switching costs. Econometrica60 (3), 651–666.
Bell, S. J., Auh, S., Smalley, K., 2005. Customer relationship dynamics: Service quality and cus-tomer loyalty in the context of varying levels of customer expertise and switching costs. Jour-nal of the Academy of Marketing Science 33 (2), 169–183.
Biglaiser, G., Cremer, J., Dobos, G., 2013. The value of switching costs. Journal of EconomicTheory 148 (3), 935–952.
Boonen, L. H., Laske-Aldershof, T., Schut, F., 2015. Switching health insurers: the role of price,quality and consumer information search. The European Journal of Health Economics, 1–15.
Bouckaert, J., Degryse, H., Provoost, T., 2010. Enhancing market power by reducing switchingcosts. Economics Letters 109 (2), 131–133.
Buchmueller, T. C., Feldstein, P. J., 1997. The effect of price on switching among health plans.Journal of Health Economics 16 (2), 231–247.
Bunnings, C., Schmitz, H., Tauchmann, H., Ziebarth, N. R., 2017. How Health Plan EnrolleesValue Prices Relative to Supplemental benefits and Service Quality. Journal of Risk and Insur-ance forthcoming, –.
Cardon, J. H., Hendel, I., 2001. Asymmetric information in health insurance: Evidence from theNational Medical Expenditure Survey. RAND Journal of Economics 32 (3), 408–427.
Christiansen, M., Eling, M., Schmidt, J.-P., Zirkelbach, L., 2016. Who is changing health insur-ance coverage? empirical evidence on policyholder dynamics. Journal of Risk and Insurance83 (2), 269–300.
25

Crocker, K. J., Moran, J. R., 2003. Contracting with limited commitment: Evidence fromemployment-based health insurance contracts. RAND Journal of Economics 34 (4), 694–718.
Crocker, K. J., Snow, A., 2011. Multidimensional screening in insurance markets with adverseselection. Journal of Risk and Insurance 78 (2), 287–307.
Cutler, D. M., Reber, S. J., 1998. Paying for health insurance: The trade-off between competitionand adverse selection. The Quarterly Journal of Economics 113 (2), 433–466.
Dafny, L., Dranove, D., 2008. Do report cards tell consumers anything they don’t already know?The case of Medicare HMOs. The RAND Journal of Economics 39 (3), 790–821.
Dijk, M., Pomp, M., Douven, R., Laske-Aldershof, T., Schut, E., Boer, W., Boo, A., 2008. Con-sumer price sensitivity in Dutch health insurance. International Journal of Health Care Fi-nance and Economics 8 (4), 225–244.
Eekhoff, J., Jankowski, M., Zimmermann, A., 2006. Risk-adjustment in long-term health insur-ance contracts in Germany. The Geneva Papers on Risk and Insurance-Issues and Practice31 (4), 692–704.
Einav, L., Finkelstein, A., Schrimpf, P., 2016. The response of drug expenditure to non-linearcontract design: Evidence from Medicare Part D. Quarterly Journal of Economics 130 (2),841–899.
Eling, M., Kiesenbauer, D., 2014. What policy features determine life insurance lapse? An anal-ysis of the German market. Journal of Risk and Insurance 81 (2), 241–269.
Fang, H., Gavazza, A., 2011. Dynamic inefficiencies in an employment-based health insurancesystem: Theory and evidence. American Economic Review 101 (7), 3047–3077.
Fang, H., Kung, E., 2010. How does life settlement affect the primary life insurance market?NBER Working Paper Series 15761.
Fang, H., Kung, E., 2012. Why do life insurance policyholders lapse? The roles of income, healthand bequest motive shocks. NBER Working Paper Series 17899.
Farrell, J., Klemperer, P., 2007. Coordination and Lock-In: Competition with Switching Costs andNetwork Effects. In: Armstrong, M., Porter, R. (Eds.), Handbook of Industrial Organization,1st Edition. Vol. 3. Elsevier, Ch. 31, pp. 1967–2072.
Grundl, H., Post, T., Schulze, R. N., 2006. To hedge or not to hedge: Managing demographic riskin life insurance companies. Journal of Risk and Insurance 73 (1), 19–41.
Grunow, M., Nuscheler, R., 2014. Public and private health insurance in Germany: The ignoredrisk selection problem. Health Economics 23 (6), 670–687.
Hackmann, M. B., Kolstad, J. T., Kowalski, A. E., 2015. Adverse selection and an individualmandate: When theory meets practice. American Economic Review 105 (3), 1030–1066.
Handel, B., Hendel, I., Whinston, M. D., 2015. Equilibria in health exchanges: Adverse selectionvs. reclassification risk. Econometrica 83 (4), 1261–1313.
Hendel, I., Lizzeri, A., 2003. The role of commitment in dynamic contracts: Evidence from lifeinsurance. The Quarterly Journal of Economics 118 (1), 299–328.
Herring, B., Pauly, M. V., 2006. Incentive-compatible guaranteed renewable health insurancepremiums. Journal of Health Economics 25 (3), 395–417.
26

Hofmann, A., Browne, M., 2013. One-sided commitment in dynamic insurance contracts: ev-idence from private health insurance in Germany. Journal of Risk and Uncertainty 46 (1),81–112.
Kaiser Family Foundation, 2014. 2014 Employer Health Benefits Survey. http://kff.org/health-costs/report/2014-employer-health-benefits-survey/, retrieved onMay 14, 2015.
Karlsson, M., Klein, T. J., Ziebarth, N. R., 2016. Skewed, persistent and high before death: Medi-cal spending in Germany. Fiscal Studies 37 (3-4), 527–559.
Klemperer, P., 1987. The competitiveness of markets with switching costs. The RAND Journal ofEconomics 18 (1), 138–150.
McShane, M. K., Cox, L. A., Butler, R. J., 2010. Regulatory competition and forbearance: Evi-dence from the life insurance industry. Journal of Banking & Finance 34 (3), 522–532.
Nuscheler, R., Knaus, T., 2005. Risk selection in the German public health insurance system.Health Economics 14 (12), 1253–1271.
Schmeiser, H., Gatzert, N., Huber, C., 2015. How individuals choose health insurance: An ex-perimental analysis. The Journal of Risk and Insurance 82 (2), 401–432.
Schmeiser, H., Holzmuller, I., Gatzert, N., 2012. Creating customer value in participating lifeinsurance. The Journal of Risk and Insurance 79 (3), 645–670.
Schmitz, H., Ziebarth, N. R., 2017. Does framing prices affect the consumer price sensitivity ofhealth plan choice? The Journal of Human Resources 52 (1), 89–128.
Schram, A., Sonnemans, J., 2011. How individuals choose health insurance: An experimentalanalysis. European Economic Review 55 (6), 799–819.
Schut, F. T., Greß, S., Wasem, J., 2003. Consumer price sensitivity and social health insurer choicein Germany and the Netherlands. International Journal of Health Care Finance and Economics3 (2), 117–138.
Starc, A., 2014. Insurer pricing and consumer welfare: Evidence from Medigap. The RANDJournal of Economics 45 (1), 198–220.
Strombom, B. A., Buchmueller, T. C., Feldstein, P. J., 2002. Switching costs, price sensitivity andhealth plan choice. Journal of Health Economics 21 (1), 89–116.
Viard, V. B., 2007. Do switching costs make markets more or less competitive? The case of 800-number portability. The RAND Journal of Economics 38 (1), 146–163.
Werden, G. J., 2001. Network effects and conditions of entry: Lessons from the Microsoft case.Antitrust Law Journal 69 (1), 87–111.
Yang, Z., Peterson, R. T., 2004. Customer perceived value, satisfaction, and loyalty: the role ofswitching costs. Psychology & Marketing 21 (10), 799–822.
Zauberman, G., 2003. The intertemporal dynamics of consumer lock-in. Journal of ConsumerResearch 30 (3), 405–419.
27

Figures and Tables
Figure 1: Individual’s and Firm-1’s Continuation Values, VI (·; θ) and VF (·) as a Function of h
𝑉"(ℎ, 𝜃'())
𝑉"(ℎ, 𝜃'+,)
𝑉"(ℎ, 0)ℎ
𝑉.(ℎ)
𝑃0ℎ'()
𝑉", 𝑉.
Note: VF (h) is monotonically decreasing in h. VI (·; θ) is drawn for θ ∈ {0, θmin, θmax} . Note that when θ = 0,VI (h, 0) is zero when h = P0.
Figure 2: Total Surplus W (h, θ) = VI (h, θ) + VF (h) as a Function of h for θ ∈ {0, θmin, θmax}
1 ℎ, &'()
1 ℎ, 0
1 ℎ, &'+,
ℎ'()ℎ/0
1
1 ℎ, &∗
ℎ3(&∗)
Note: Own illustration.
28

Figure 3: Pre-Reform: Iso-Curves for VI (h, θ) and W (h, θ)
ℎ"#$
0
𝜃∗
𝑉( ℎ, 𝜃 = 0
𝑊 ℎ, 𝜃 = 0
𝑊 ℎ, 𝜃 < 0𝑉( ℎ, 𝜃 < 0
𝑉( ℎ, 𝜃 > 0
𝜃"/0
𝑊 ℎ, 𝜃 > 0𝑉( ℎ, 𝜃 < 0
𝜃"#$
ℎ"/0𝑃2
Note: Own illustration.
Figure 4: Post-Reform: Iso-Curves for VI (h, θ) and W (h, θ)
0
ℎ𝑚𝑖𝑛
0
𝜃∗
𝑊 ℎ, 𝜃 =0
𝜃𝑚𝑎𝑥
𝜃𝑚𝑖𝑛
ℎ𝑚𝑎𝑥𝑃0 + 𝐴𝑃0
𝑊 ℎ, 𝜃 > 0 𝑉𝐼 ℎ, 𝜃 < 0
𝑊 ℎ, 𝜃 < 0 𝑉𝐼 ℎ, 𝜃 < 0
𝑉𝐼 ℎ, 𝜃 >0
𝑉𝐼 ℎ, 𝜃 =0𝑉𝐼 ℎ, 𝜃 = 0
𝑊 ℎ, 𝜃 = 0
Note: Own illustration.
29

Figure 5: Share of Enrollees Who Switched by Year.
(a) External Switches (b) Internal Switches
30

Table 1: Simulated Effect of Portability Reform on Internal and External Switching
Uniform Case Triangular CasePre Post Pre Post(1) (2) (3) (4)
Internal switch 0.13 0.26 0.18 0.37External switch 0.33 0.45 0.16 0.22E [h|Internal Switch] 0.33 0.54 0.31 0.52E [h|External Switch] 0.67 0.92 0.61 0.89Own simulations. h is drawn from U[0, 2]. See Section 3.4 fordetails.
31

Table 2: Summary Statistics by Switcher Type
(1) (2) (3) (4) (5) (6) (7) (8) (9) (10) (11)
Non-Switchers Internal Switchers External Switchers
Pre Post ∆ Pre Post ∆ ∆2 Pre Post ∆ ∆2
Socio-DemographicsAge (in years) 45.9 47.7 1.8 46.3 46.2 -0.2 -2.0 38.3 39.1 0.8 -1.1Female 0.281 0.301 0.020 0.234 0.209 -0.026 -0.046 0.270 0.298 0.028 0.008Policyholder since (years) 8.1 8.5 0.4 8.2 7.7 -0.6 -1.0 5.9 5.9 -0.0 -0.4Client since (years) 14.2 15.4 1.2 13.7 13.1 -0.7 -1.9 8.0 7.9 -0.1 -1.3Employee 0.509 0.480 -0.029 0.494 0.429 -0.065 -0.035 0.349 0.325 -0.024 0.005Self-Employed 0.412 0.445 0.033 0.451 0.524 0.072 0.040 0.597 0.622 0.025 -0.008Premium Markup Health Risk 0.301 0.349 0.048 0.267 0.349 0.082 0.034 0.360 0.425 0.065 0.017Pre-Existing Condition Exempt 0.014 0.016 0.001 0.013 0.015 0.002 0.001 0.022 0.020 -0.001 -0.003
Health Plan ParametersTOP Plan 0.513 0.354 -0.159 0.772 0.462 -0.309 -0.150 0.396 0.224 -0.172 -0.013PLUS Plan 0.311 0.397 0.086 0.137 0.266 0.129 0.044 0.216 0.280 0.064 -0.021ECO Plan 0.176 0.250 0.074 0.092 0.272 0.180 0.107 0.388 0.496 0.108 0.034Annual premium (Euro) 4,365 4,078 -287 5,370 4,377 -993 -707 3,613 3,214 -399 -112Annual markup (Euro) 1,021 799 -222 2,391 1,840 -551 -329 2,430 2,045 -384 -162Deductible (Euro) 549 581 32 681 681 0 -32 597 616 19 -13Total Claims (Euro) 3,343 3,279 -65 2,980 2,537 -443 -378 1,183 1,168 -14 50
Client Typeh1 139.03 108.06 -30.97 -511.32 -331.37 179.95 210.92 -884.79 -710.12 174.67 205.64h2 163.54 167.26 3.72 -452.21 -251.95 200.26 196.54 -824.72 -627.50 197.23 193.51
N 666,551 359,743 49,362 53,345 49,372 27,913The table compares covariate means for non-switchers, internal, and external switchers pre- and post-reform. ∆ refers to thedifference between post- and pre-reform means, and ∆2 refers to the difference between pre-and post-means relative to the corre-sponding difference for non-switchers.
32

Table 3: External and Internal Switching Pre- and Post-Reform
(1) (2) (3) (4) (5) (6)
External Switch Internal Switch
Y2006 0.0012 0.0036 0.0070** 0.0015 0.0008 0.0019(0.003) (0.003) (0.003) (0.004) (0.004) (0.004)
Y2007 -0.0085*** -0.0031 0.0046 0.0200*** 0.0185*** 0.0200***(0.003) (0.003) (0.003) (0.007) (0.007) (0.007)
Y2008 -0.0218*** -0.0130*** -0.0016 -0.0107* -0.0130** -0.0114**(0.004) (0.004) (0.003) (0.006) (0.006) (0.005)
Y2009 -0.0320*** -0.0205*** -0.0057 0.1154*** 0.1126*** 0.1137***(0.007) (0.006) (0.005) (0.014) (0.014) (0.014)
Y2010 -0.0198*** -0.0063 0.0100** 0.0147* 0.0113 0.0126(0.006) (0.005) (0.004) (0.008) (0.009) (0.008)
R2 0.042 0.074 0.085 0.045 0.047 0.055
Postreform -0.0174*** -0.0004 -0.0038*** 0.0654*** 0.0645*** 0.1042***(0.004) (0.002) (0.000) (0.009) (0.009) (0.001)
Baseline 0.065 0.065 0.065 0.085 0.085 0.085R2 0.041 0.084 0.064 0.033 0.042 0.019Individuals 308,073 308,073 308,073 308,073 308,073 308,073Observations 1,206,286 1,206,286 1,206,286 1,206,286 1,206,286 1,206,286
Health Plan Fixed Effects X X X X X XYear Fixed Effects X X X X X XDemographic controls X X X XOther controls X X X XRegion Fixed Effects X X X XIndividual Time Trends X X
The table shows regression results from linear probability models. The sample excludes contracts withinthe minimum contract period of two years. Demographic controls are in Table 2 and include (amongothers) sex and age, years since joining the insurer, risk rating, and a dummy indicating whether pre-existing conditions restrict coverage. The 96 region fixed effects are based on the first two digits of thepolicyholder’s zip code. Individual time trends as depicted by equation (10) are included in all lower-panel models that only estimate one common postreform effect. The standard errors are clustered at theplan level. * p < 0.10, ** p < 0.05, ***p < 0.01
33

Table 4: Health Status of Switchers Pre- and Post-Reform
(1) (2) (3) (4)
Risk realization proxied using premiums (h1)
Internal Switch × Postreform 206.6408*** 203.9049*** 210.6489*** 175.0206***(40.587) (41.259) (41.161) (39.614)
Internal Switch -654.3279*** -663.9633*** -631.7414*** -366.7459***(28.493) (30.360) (30.262) (29.515)
External Switch × Postreform 208.4190*** 202.7226*** 201.8427*** 244.8460***(40.105) (40.694) (40.763) (40.343)
External Switch -1025.1433*** -1059.5529*** -1056.4985*** -987.4415***(25.005) (25.418) (25.568) (24.447)
SD(y) 6,705 6,705 6,705 6,705R2 0.001 0.001 0.004N 1,206,245 1,206,245 1,206,245 1,206,245
Year Fixed Effects X X X XHealth Plan Fixed Effects X X XDemographic Controls X X XAdditional controls X XRegion Fixed Effects X XIndividual Fixed Effects X
The table shows regression results from linear probability models. The sample does not exclude contractswithin the minimum contract period of two years. Demographic controls are in Table 2 and include(among others) sex and age, years since joining the insurer, risk rating, and a dummy indicating whetherpre-existing conditions restrict coverage. The 96 region fixed effects are based on the first two digits of thepolicyholder’s zip code. Individual time trends as in equation (10) are included in all lower-panel modelsthat only estimate one common postreform effect. The standard errors are clustered at the individuallevel. * p < 0.10, ** p < 0.05, ***p < 0.01
34
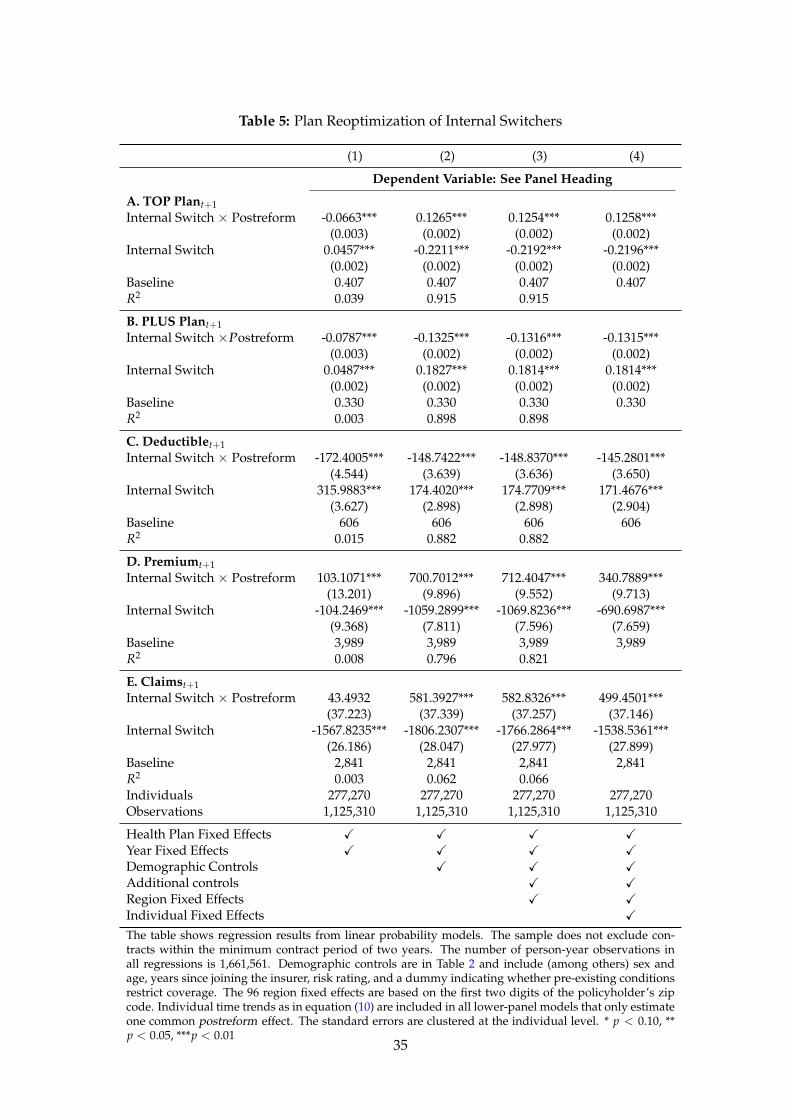
Table 5: Plan Reoptimization of Internal Switchers
(1) (2) (3) (4)
Dependent Variable: See Panel Heading
A. TOP Plant+1Internal Switch × Postreform -0.0663*** 0.1265*** 0.1254*** 0.1258***
(0.003) (0.002) (0.002) (0.002)Internal Switch 0.0457*** -0.2211*** -0.2192*** -0.2196***
(0.002) (0.002) (0.002) (0.002)Baseline 0.407 0.407 0.407 0.407R2 0.039 0.915 0.915
B. PLUS Plant+1Internal Switch ×Postreform -0.0787*** -0.1325*** -0.1316*** -0.1315***
(0.003) (0.002) (0.002) (0.002)Internal Switch 0.0487*** 0.1827*** 0.1814*** 0.1814***
(0.002) (0.002) (0.002) (0.002)Baseline 0.330 0.330 0.330 0.330R2 0.003 0.898 0.898
C. Deductiblet+1Internal Switch × Postreform -172.4005*** -148.7422*** -148.8370*** -145.2801***
(4.544) (3.639) (3.636) (3.650)Internal Switch 315.9883*** 174.4020*** 174.7709*** 171.4676***
(3.627) (2.898) (2.898) (2.904)Baseline 606 606 606 606R2 0.015 0.882 0.882
D. Premiumt+1Internal Switch × Postreform 103.1071*** 700.7012*** 712.4047*** 340.7889***
(13.201) (9.896) (9.552) (9.713)Internal Switch -104.2469*** -1059.2899*** -1069.8236*** -690.6987***
(9.368) (7.811) (7.596) (7.659)Baseline 3,989 3,989 3,989 3,989R2 0.008 0.796 0.821
E. Claimst+1Internal Switch × Postreform 43.4932 581.3927*** 582.8326*** 499.4501***
(37.223) (37.339) (37.257) (37.146)Internal Switch -1567.8235*** -1806.2307*** -1766.2864*** -1538.5361***
(26.186) (28.047) (27.977) (27.899)Baseline 2,841 2,841 2,841 2,841R2 0.003 0.062 0.066Individuals 277,270 277,270 277,270 277,270Observations 1,125,310 1,125,310 1,125,310 1,125,310
Health Plan Fixed Effects X X X XYear Fixed Effects X X X XDemographic Controls X X XAdditional controls X XRegion Fixed Effects X XIndividual Fixed Effects X
The table shows regression results from linear probability models. The sample does not exclude con-tracts within the minimum contract period of two years. The number of person-year observations inall regressions is 1,661,561. Demographic controls are in Table 2 and include (among others) sex andage, years since joining the insurer, risk rating, and a dummy indicating whether pre-existing conditionsrestrict coverage. The 96 region fixed effects are based on the first two digits of the policyholder’s zipcode. Individual time trends as in equation (10) are included in all lower-panel models that only estimateone common postreform effect. The standard errors are clustered at the individual level. * p < 0.10, **p < 0.05, ***p < 0.01
35

Appendix
Table A1: Summary Statistics
Mean SD Min Max N
External switch 0.064 0.245 0.000 1.000 1,206,286Internal switch 0.085 0.279 0.000 1.000 1,206,286
Socio-DemographicsAge (in years) 46.0 11.5 19.0 106.0 1,206,286Female 0.282 0.450 0.0 1.0 1,206,286Policyholder since (years) 8.1 4.6 2.5 40.0 1,206,286Client since (years) 14.1 10.9 1.0 85.0 1,206,286Employee 0.486 0.500 0.0 1.0 1,206,286Self-Employed 0.441 0.496 0.0 1.0 1,206,286Premium Markup Health Risk 0.322 0.467 0.0 1.0 1,206,286Pre-Existing Condition Exempt 0.015 0.122 0.0 1.0 1,206,286
Health Plan ParametersTOP Plan 0.462 0.499 0.0 1.0 1,206,286PLUS Plan 0.323 0.468 0.0 1.0 1,206,286ECO Plan 0.215 0.411 0.0 1.0 1,206,286Annual premium (Euro) 4,263 2,055 0.0 24,364 1,206,245Annual markup (Euro) 1,128 7,866 -2,118,099 18,192 1,206,245Deductible (Euro) 573 607 0.0 3,177 1,206,286Total Claims (Euro) 3,135 7,868 0.0 2,121,752 1,206,286
Client Typeh1 20.83 7,585 -26,847 2,113,455 1,206,245h2 62.32 7,605 -21,451 2,115,066 1,206,286Authors’ calculations and illustration.
36

Table A2: Health Status of Switchers Pre- and Post-Reform
(1) (2) (3) (4)
Risk realization relative to cell (h2)
Internal Switch × Postreform 183.2903*** 171.6464*** 175.0609*** 139.4084***(40.722) (41.372) (41.234) (39.646)
Internal Switch -617.3890*** -624.6657*** -581.4100*** -319.5123***(28.582) (30.452) (30.320) (29.536)
External Switch × Postreform 196.2986*** 151.5124*** 151.3980*** 197.9521***(40.172) (40.737) (40.785) (40.336)
External Switch -988.4288*** -1043.9324*** -1017.6816*** -947.1198***(25.042) (25.440) (25.573) (24.438)
SD(y) 6,723 6,723 6,723 6,723R2 0.001 0.002 0.006N 1,206,286 1,206,286 1,206,286 1,206,286
Year Fixed Effects X X X XHealth Plan Fixed Effects X X XDemographic Controls X X XAdditional controls X XRegion Fixed Effects X XIndividual Fixed Effects X
Demographic controls are dummies for sex and calendar age. Additional controls include the profes-sional group, years since joining the company, risk rating and a dummy indicating whether pre-existingconditions limit the service package. The regression always use the full sample, do not condition on con-tracts with less than three years. The number of person-year observations in all regressions is 1,661,561.The 96 region fixed effects are based on the first two digits of the client’s zip code. The standard errorsare clustered at the individual level. * p < 0.10, ** p < 0.05, ***p < 0.01
37


![Call Preservation for H.323 VoIP Calls. voice-class h323tag 4. call preserve [limit-media-detection] 5. exit 6. dial-peer voice tag voip 7. voice-class h323tag 8. exit DETAILED STEPS](https://img.dokumen.tips/doc/110x75/5b0835f17f8b9a520e8c411b/call-preservation-for-h323-voip-calls-voice-class-h323tag-4-call-preserve-limit-media-detection.jpg)