Embed Size (px)
Citation preview

NBER WORKING PAPER SERIES
DIVIDEND TAXES AND CORPORATE BEHAVIOR:EVIDENCE FROM THE 2003 DIVIDEND TAX CUT
Raj ChettyEmmanuel Saez
Working Paper 10841http://www.nber.org/papers/w10841
NATIONAL BUREAU OF ECONOMIC RESEARCH1050 Massachusetts Avenue
Cambridge, MA 02138October 2004
This paper is an updated and expanded version of “Do Dividend Payments Respond to Taxes? PreliminaryEvidence from the 2003 Dividend Tax Cut”, NBER Working Paper No. 10572. We thank Alan Auerbach,Malcolm Baker, Abhijit Banerjee, David Card, Dhammika Dharmapala, Martin Feldstein, John Graham, DayManoli, Igor Osobov, Francisco Perez-Gonzalez, James Poterba, John Quigley, Nikolai Roussanov, JeremyStein, Arnold Zellner, and numerous seminar participants for very helpful comments and discussions. BhuvanJain, Kory Kroft, Brandon Lehr, and especially Joe Rosenberg provided outstanding research assistance.Financial support from NSF Grant SES-0134946 and the Sloan Foundation is gratefully acknowledged. Theviews expressed herein are those of the author(s) and not necessarily those of the National Bureau ofEconomic Research.
©2004 by Raj Chetty and Emmanuel Saez. All rights reserved. Short sections of text, not to exceed twoparagraphs, may be quoted without explicit permission provided that full credit, including © notice, is givento the source.

Dividend Taxes and Corporate Behavior: Evidence from the 2003 Dividend Tax CutRaj Chetty and Emmanuel SaezNBER Working Paper No. 10841October 2004JEL No. H3, G3
ABSTRACT
This paper analyzes the effects of dividend taxation on corporate behavior using the large tax cut on
individual dividend income enacted in 2003. Using data spanning 1980 to 2004-Q2, we document
a sharp and widespread surge in dividend payments following the tax cut, along several dimensions.
First, an unprecedented number of firms initiated regular dividend payments after the reform. As a
result, the number of publicly traded firms paying dividends, after having declined continuously for
more than two decades, began to increase precisely in 2003. Second, many firms that were already
paying dividends prior to the reform raised regular dividend payments significantly. Third, special
dividends also rose. All of these effects are robust to introducing controls for profits and other firm
characteristics. Additional evidence for specific groups of firms suggests that the tax cut induced
increases in total payout rather than substitution between dividends and repurchases. The tax
response was confined to firms with lower levels of forecasted growth, consistent with an
improvement in capital allocation efficiency. The response to the tax cut was strongest in firms with
strong principals whose tax incentives changed (presence of large taxable institutional owners or
independent directors with large share holdings), and in firms where agents had stronger incentives
to respond (large executive ownership and low levels of executive stock-options outstanding). These
findings show that principal-agent issues play a central role in corporate responses to taxation.
Raj ChettyDepartment of EconomicsUniversity of California, Berkeley521 Evans Hall #3880Berkeley, CA 94720and [email protected]
Emmanuel SaezDepartment of EconomicsUniversity of California, Berkeley549 Evans Hall #3880Berkeley, CA 94720and [email protected]

1 Introduction
The taxation of dividend income has generated much interest and controversy both in the pub-
lic economics literature and among tax policy makers, largely because it creates a particularly
stark version of the equity-efficiency tradeoff. Dividend income, and especially taxable divi-
dend income, accrues very disproportionately to wealthy individuals.1 Hence, taxing dividends
seems desirable for redistributive reasons. However, taxing dividend income may also generate
large efficiency costs. Dividend taxes reduce the net return to investors, potentially reducing
savings and the capital stock in the economy. In addition, taxing dividend income at the indi-
vidual level could induce firms to reduce their tax burdens by retaining earnings rather than
distributing dividends. If agency problems lead to inefficient investment of retained earnings
(as suggested by e.g., Jensen 1986, Scharfstein and Stein 2000, LaPorta et al., 2000), dividend
taxation could reduce the efficiency of capital allocation in addition to distorting the amount
of investment.2 In view of this tradeoff, it is important to know firms’ behavioral responses
to taxation to evaluate optimal dividend taxation. Despite extensive research, the effects of
taxation on dividend policies and corporate behavior more generally remain disputed, largely
because of the lack of a sharp tax experiment, and therefore of a fully convincing research
design (see Auerbach (2003) and Allen and Michaely (2003) for recent surveys).
The Jobs and Growth Tax Relief Reconciliation Act of 2003 in the United States (hereafter,
the “2003 tax reform”) provides a unique opportunity to understand the effects of dividend
taxation on corporate behavior. One of the key provisions of the reform was to introduce
favorable treatment for individual dividend income whereby dividends are taxed at a rate of
15% instead of facing the regular progressive individual income tax schedule with a top rate of
35%.3 This tax change effectively gave to dividend income the same favorable tax treatment1 Individual Income Tax Statistics for year 2000 (U.S. Treasury Department, 2003) show that about two
thirds of taxable dividends are earned by the top 10% income taxpayers. More than half of American familiesnow hold stock through pension or college funds but returns on those assets are exempted from income taxesand hence not affected by the 2003 tax reform.
2 Indeed, Corporate America has traditionally lobbied for corporate tax reductions but not dividend taxreductions, suggesting that managers of large corporations might prefer to retain earnings rather than distributedividends.
3More precisely, taxpayers in the bottom two income tax brackets (facing a regular marginal tax rate of 10%or 15%) face a new dividend tax rate of only 5%, while taxpayers in the top four brackets (facing marginal taxrates of 25, 28, 33, or 35%) face a new dividend tax rate is 15%. Taxpayers on the Alternative Minimum Taxschedule (flat rate of 28%) benefit as well from the reduced 15% tax rate on their dividend income.
1

as realized capital gains income.4 The tax reform was officially signed into law at the end
of May 2003, but was first proposed by the Bush administration on January 7, 2003.5 The
tax cut on dividend income was made retroactive to the beginning of 2003. Therefore, during
the first two quarters of 2003, corporations knew that dividends would face lower taxes with
substantial probability. Starting in June 2003, this became certain. The tax cut is scheduled
to expire by 2009, but the actual duration is contingent on political developments.6
This paper uses the 2003 dividend tax cut to estimate the effect of dividend taxes on div-
idend payments by publicly traded corporations. The leading example for both the incentive
and distributional consequences of the tax cut is Microsoft, the company with the largest
accumulated cash holdings in the U.S. Microsoft initiated regular dividend payments for the
first time in 2003. In July 2004, Microsoft announced an additional special one-time dividend
payment of $32 billion to be paid in December 2004, an amount that far exceeds any dividend
payment previously made by a single U.S. corporation. The tax-savings associated with these
payments will clearly benefit wealthy taxpayers disproportionately, starting with Bill Gates
the richest person in the United States, but they might also affect the investment decisions
of Microsoft and other companies. The goal of this paper is to examine whether Microsoft’s
behavior is an anomaly or whether it is representative of a broader shift in payout policies
associated with the tax cut. We investigate this issue using data on dividend payments by
publicly traded corporations, currently available up to the second quarter of 2004 from the
Center for Research in Security Prices (CRSP).
We find that the level of total regular dividends has surged by approximately 20% since
the beginning of 2003, the point at which the lower tax rate was first proposed and ultimately
retroactively applied. We need to surmount two important econometric challenges in order
to identify a causal link between this change and the tax reform. First, dividend payments
are extremely concentrated. The top 20 payers account for more than half of total dividends4 Individual dividend income earned through tax favored instruments such as IRAs, 401(k)s and other pension
and college funds was not affected by the tax change. Dividend income earned by government agencies, nonprofitorganizations, and corporations was not affected either.
5Auerbach and Hassett (2004) discuss the timing of the tax reform legislative process in detail. They findthat the reduction of dividend taxation was not discussed seriously before the end of December 2002. It wasnot mentioned in the Bush 2000 campaign platform either, suggesting that there was no anticipation that sucha tax change would take place before the very end of 2002.
6 If President Bush wins again in 2004, the tax cut might well be made permanent. If Senator Kerry wins,as Congress is predicted to almost certainly remain Republican, gridlock and no further change is the mostplausible outcome.
2

paid out by publicly traded firms. Consequently, the level of total (or mean) dividends is
driven by a few big payers, making it difficult to make statistically robust inferences about
the effects of the tax change without analyzing other moments of the distribution that are less
sensitive to outliers. Second, the size and composition of our sample of firms listed on the
NYSE, AMEX, or NASDAQ exchanges fluctuates heavily in the years preceding the tax reform.
As a result, deliberate changes in dividend behavior are confounded with changes in sample
composition due to entry and exit.7 In view of these problems, we control for composition
effects by analyzing the properties of entrants and leavers, focusing on within-firm changes in
dividend payments. We also divide our analysis of the response to the tax reform into three
margins that are more robust to outliers than means: (1) the extensive margin (initiations and
terminations of regular dividend payments); (2) the intensive margin (frequency of increases
or decreases in payment amounts by firms already paying); and (3) special payments (one time
distributions). Our main findings are as follows.
First, we find an unprecedented large surge in dividend initiations exactly in the quarters
following enactment of the reform. This constitutes strong evidence that this change in be-
havior was tax driven. As a result and as the frequency of dividend terminations fell slightly
after the tax cut, the fraction of traded companies paying dividends, which had declined con-
tinuously over the last two decades (see Fama and French 2001), has increased significantly
from a low of 20% in 2002Q4 to almost 25% in 2004Q2. Second, dividend paying firms were
significantly more likely to increase their regular dividend payments after the reform. Third,
we find that the number of special (i.e., one time, non-recurring) dividend payments also in-
creased following the 2003 tax reform but the effects on special dividend amounts are driven
by a handful of large payers. All of these results are robust to controlling for a variety of
potential confounding factors such as levels and lags of profits, assets, cash holdings, industry,
and firm age.8 In addition, we provide robustness checks of the causality of the tax cut by
showing that there is no change in dividend initiations for U.S. corporations whose largest
shareholder is a non-taxable institution such as a pension fund, or for Canadian corporations.
By aggregating the changes in amounts along the extensive and intensive margins, we obtain7These two econometric issues explain the sharp differences between our results and the recent studies of
the 2003 tax cut by Blouin, Raedy, and Shackelford (2004) and Julio and Ikenberry (2004), which we discussin detail below.
8 Importantly, we find no pre-reform decline in dividends, suggesting that the reform was indeed unanticipatedand that our estimates are not biased by intertemporal substitution (re-timing) of dividend payments.
3

a relatively precise estimate of the change in total regular dividends due to the tax cut of
$5 billion per quarter (20%). This implies an elasticity of regular dividend payments with
respect to the marginal tax rate on dividend income of -0.5.
Having established a link between the tax cut and dividend payments, we explore the
mechanism of the tax response by analyzing the heterogeneity of the effect across firms. We
find that the dividend response was concentrated among firms with strong incentives for agents
to increase dividend payments or with powerful principals whose incentives to demand dividend
income changed significantly with the reform. Firms where top executives held more shares
and fewer unexercised stock-options were much more likely to initiate dividend payments,
revealing the importance of top executives’ self-interests in determining corporate responses
to taxation.9 In addition, firms with high taxable institutional ownership or large independent
shareholders on the board of directors were also more likely to raise dividends, especially when
top executives have weak incentives to do so. These findings indicate that agency issues
should be a central element in the analysis of optimal corporate tax policy, and call for a
tighter connection between traditional tax efficiency analysis in public economics and the
agency theory of the firm in corporate finance.
The heterogeneity of the tax response also provides suggestive evidence of an improvement
in capital allocation toward firms with better investment opportunities. Dividend initiations
and increases were confined to firms with moderate forecasted earnings growth. In contrast,
firms with high expected growth in earnings did not respond to the tax cut at all. Of course,
capital allocation could only have improved if total payout rose after the tax cut; if the surge
in dividend payments simply substituted for share repurchases, no net reallocation would
have occurred. We therefore explore the degree of substitution between share repurchases
and additional dividend payouts. Unfortunately, the volatility of share repurchases in the
aggregate makes it difficult to determine whether substitution occurred in the full sample of
firms. If we restrict attention to groups of firms where the tax response was strongest — e.g.,
those with high executive share ownership and high institutional ownership — we are able to
show that the fraction of firms using either share repurchases or dividends to pay out earnings
rose sharply after the reform. In addition, for those companies who initiated dividends after9These findings do not necessarily imply that managers are hurting shareholders by manipulating corporate
decisions. It is possible that managers contracts were written so that the management’s self-interest is alignedwith shareholders’ interests.
4
the reform, total payout (dividends plus share repurchases) increased significantly. Hence, the
tax reform does indeed appear to have induced an increase in total payout rather than simply
a “relabelling” of repurchases as dividends.
The remainder of the paper is organized as follows. Section 2 provides some background
on payout policies and previous work. Section 3 describes the data and defines the variables
of interest. Section 4 describes our methodology and presents the main results on the change
in dividend payments induced by the tax reform. Section 5 examines the heterogeneity of
the response, and section 6 investigates whether new dividend payments crowded out share
repurchases. Section 7 offers concluding remarks.
2 Background on Payout Policies and Existing Literature
2.1 Payout Policies
Corporations distribute profits to shareholders in two main forms: dividends and share re-
purchases. In a world without taxes and with perfect information, share repurchases and
dividends are equivalent. Under U.S. tax law, because realized capital gains have traditionally
been taxed more lightly than dividend income, share repurchases were a more tax efficient way
of distributing profits. Share repurchases started becoming more common in the early 1980s
following a SEC ruling in 1982 which clarified the rules under which corporations could legally
make share repurchases without being subject to dividend taxation (Grullon and Michaely,
2002). However, despite the rise in share repurchases, dividends have remained an important
conduit for distributing profits.10 The reason why dividends have not been entirely replaced by
share repurchases has been termed the “dividend puzzle,” and a number of theories and expla-
nations have been proposed to explain this phenomenon (see Michaely and Allen, 2003). The
2003 tax reform almost eliminated the tax disadvantage of dividends relative to repurchases.
There are two broad categories of dividend payments: regular dividends and special div-
idends. Regular dividends are periodic and recurrent (in general quarterly but sometimes
annual, semi-annual, or more rarely monthly). As noted by Fama and French (2001), the frac-
tion of publicly traded firms making these regular dividend payments is fairly low (less than10Over the last decade, total dividend payouts are about the same size as total share repurchases for publicly
traded U.S. corporations (see Michaely and Allen, 2003) and Section 6 below. Grullon and Michaely (2002)argue that share repurchases have, to some extent, crowded out dividend payments.
5

25%) in the recent past. It is fairly common for firms to increase regular dividend payments
— 11% of firms initiated or raised dividends in the average quarter. Decreases are much rarer
(less than 2% per quarter), consistent with DeAngelo and DeAngelo’s (1990) finding that only
severely distressed firms lower or terminate dividend payments. Regular dividends are thus
extremely persistent over time.11 Hence, an initiation of a regular payment (as by Microsoft
in 2003) is a strong signal that the firm intends to maintain a dividend payment of equal or
greater value permanently.
In contrast to regular dividends, special dividends are one-time, non-recurring events. Spe-
cial payments are made by very few firms (0.8% of our sample). Special dividends are also
generally of minor importance in terms of amounts relative to regular dividends, accounting
for less than 2.5% of total dividends on average.
2.2 Previous Work
Most of the early work on the effects of taxation on dividend payments used time series analysis
rather than focusing on a single tax reform. The evidence from this literature is controversial,
and is typically divided into the “old view” and the “new view.”12
The old view, implicit in Feldstein (1970), says that dividend taxes reduce the net return
on investment and hence reduce the supply of investment. Therefore, when taxes on dividends
are cut, individuals are more willing to save and invest their money in stocks, spurring business
investment, profits, and dividend distributions in the long run. Poterba and Summers (1985),
using time series evidence from the United Kingdom found that, consistent with the old view,
dividend payments and investment were higher when the tax rate on dividends was lower.
More recently, Poterba (2004) uses U.S. time series data from 1929 to 2002 and finds a negative
association between dividend payments and the dividend tax rates relative to taxes on capital
gains. His point estimates imply that the 2003 tax reform should increase dividend payments
by 20% in the long run, but that the adjustment process will be very slow, with only a quarter
of the long-run effect taking place within three years.13
11Section 3 gives formal definitions of initiations and terminations.12A large related literature studies the effects of taxes on other corporate behaviors such as investment
(Cummins et al. 1994, Desai and Goolsbee, 2004), capital structure (Gordon and Lee, 2001), and organizationalform choices (Gordon and MacKie-Mason, 1990, Goolsbee, 1998, 2004).13Our estimates also point toward a 20% increase in dividend payments but the response we document
happens much faster than the one predicted by Poterba’s estimates.
6

In contrast, the new view on dividend taxation, implicit among critics of the 2003 tax
reform, assumes that marginal investments are entirely financed by retained earnings rather
than new share issues (Auerbach (1979), King (1977), and Bradford (1981)). Under this
assumption, the tax on dividends should not affect the investment decisions of firms, and
profits and dividend payments therefore should not change either.14 In this case, the dividend
tax cut is irrelevant for corporate decisions and simply benefits individual investors by reducing
their tax burden. Using U.S. data from 1981 to 1998, Auerbach and Hassett (2003), show that
consistent with the new view, dividend payments are sensitive to changes in investment at
the firm level, suggesting that retained earnings are indeed the marginal source of investment
funds. Auerbach (2001) critically reviews the time series empirical literature and concludes
that the evidence for a large dividend payout response to dividend taxation is at best mixed.
In light of the difficulties with time series analysis, another strand of the literature has
attempted to use the variation in tax rates induced by the Tax Reform Act of 1986 (TRA-86)
to study these issues, but has also found mixed results. TRA-86 cut the top income tax rate
from 50% to 28% while increasing the tax rate on capital gains from 20% to 28%. Bolster
and Janjigian (1991) find no discernible effect of TRA-86 on aggregate dividend payments
by publicly traded firms. However, in an innovative study, Perez-Gonzalez (2003) showed
that there was a small response of dividend payments among a subsample of firms with large
individual shareholders, which is masked in the aggregate. Our analysis shows that TRA-86
generated a short-term spurt of special dividend payments concentrated among a very small
number of firms but, in contrast to the 2003 tax reform, had no discernible effect on regular
dividend payments.15 Consistent with Perez-Gonzalez’s (2003) evidence for TRA-86, we also
find that the response to the 2003 tax reform is larger for companies with large shareholders
on the board of directors or among top executives.
Finally, a few very recent studies have also investigated the effect of the 2003 tax reform on
dividend policies.16 We discuss how our study differs, complements, or disagrees with these14However, as pointed out by Auerbach and Hassett (2003), if the tax reform not only changes dividend
income taxation but also interest income taxation (as in the Tax Reform Act of 1986) or if the tax reform isnot permanent but temporary (as might be the case with the 2003 tax reform), then even under the new viewdividend payments may change following a dividend tax change.15We discuss reasons why TRA-86 may have had different effects than the 2003 reform in section 4.16With the exception of Blouin et. al (2004), these studies were completed at roughly the same time as our
own study, and were brought to our attention after we circulated our preliminary results in Chetty and Saez(2004).
7

concurrent studies in this subsection as well as in the context of our results in section 4.
First, Blouin, Raedy, and Shackelford (2004) examined dividend payments in the three
months immediately after the tax reform was passed (May 23 to August 22, 2003). They
compared dividend payments in this post-reform period with dividends in the same period in
2002 (May 23 to Aug. 22, 2002) and the three month period immediately preceding enactment
of the reform. Blouin et. al. concluded that virtually all the increase in dividend payments
after the tax reform was due solely to 17 firms who paid special dividends, and found no
statistically significant changes in regular dividend amounts. Their results differ from our
results for a number of reasons. First, they choose their sample by selecting all firms alive
from 2001-Q4 to 2003-Q3 that paid dividends in the three months after enactment. This
sample selection is based on the endogenous post-reform dividend choice and is likely to bias
their results. Second, they focus on the level of dividends payments (and then separate regular
and special dividends), rather than other moments of the distribution. As emphasized above,
analyzing the effect of the tax cut on regular dividend levels is a difficult statistical problem
because of the large outliers that drive the means.17 Indeed, when analyzing our data at
a monthly level, we find that the surge in the frequency of regular dividend initiations and
increases began precisely in the post-reform period studied by Blouin et. al. Third, they do
not look back at the historical data before 2002. Again, since aggregate regular dividends
are a noisy time series, it is difficult to assess the magnitude of the response induced by the
tax change without making further historical comparisons. Finally, three more quarters of
post-reform data have become available since their study. The additional data show that the
rapid growth in regular dividend payments that began during the period examined by Blouin
et. al. has continued in subsequent quarters.
Second, Julio and Ikenberry (2004) extend the influential time series analysis of Fama and
French (2001) up to the first quarter of 2004. They show that the secular downward trend
in the fraction of listed firms paying dividends makes a reversal starting in late 2000. Julio
and Ikenberry argue that the Bush dividend tax cut cannot explain the reversal, as it starts
well before tax reform occurred. They propose various explanations for the pre-tax rebound,
including corporate accounting scandals and the maturity of technology firms. In contrast,17Blouin et al. also find similar results for dividends per share, but this is not an economically relevant
normalization as the number of shares in public corporations is to a very large extent arbitrary.
8

we show that the reversal in 2000 in the fraction of publicly traded firms paying dividends is
entirely due to changes in the composition of the sample due to the de-listing of many young
technology firms during the stock market crash of 2000-2001. These firms generally did not
pay dividends, mechanically raising the fraction of payers. When controlling explicitly for
these entry and exit effects, we find that the reversal in the secular decline in the number of
payers takes place exactly in 2003. This result is not surprising in light of our finding that
initiations surge only in 2003 while terminations remain stable.18
Finally, Nam, Wang, and Zhang (2004) show that executive ownership is correlated with
dividend increases in 2003 but that there was no such relation in previous years. Their results
are consistent with our findings about the importance of principal-agent issues in determining
the tax response. However, Nam et. al. limit their analysis to executive share and stock-option
ownership compiled from Execucomp data for about 1,500 firms every year since 1992, and only
to firms already paying dividends.19 In this paper, we focus on the dividend initiation margin,
along which the tax response was by far the most striking. We also consider heterogeneity
along other dimensions, such as large shareholders (individual and institutional, taxable versus
non-taxable). We also collect executive share and stock-option ownership for a much larger
set of firms from proxy statements in order to obtain estimates for the full sample of publicly
traded firms. These additional data also allow us to provide results on interaction effects
between executive share ownership and the strength of principals that are not evident in the
selected sample of firms listed in ExecuComp.
3 Data
We use quarterly data from the CRSP, which reports dividend, stock price, and share infor-
mation for all companies listed on the NYSE, AMEX, and NASDAQ stock exchanges. The
data we use span 1980-Q1 to 2004-Q2, the last quarter for which data are currently available.
Following Fama and French (2001) and Auerbach and Hassett (2003), we exclude all foreign
firms and all firms whose most recent industry classification is in utilities (SIC codes between
4900 and 4949) or the financial sector (SIC code between 6000 and 6999) because these com-18Consistent with our results, Julio and Ikenberry (2004) also find that there was a surge in dividend initiations
only in 2003 and not at the time of the 2000 reversal.19More recently, Brown, Liang, Weisbenner (in progress, no draft yet available) have also noticed that exec-
utive ownership is related to dividend initiations and dividend increases after the tax reform.
9

panies are regulated and often have legal distribution requirements. Their dividend payments
may therefore be determined by law rather than by shareholder decisions.20 The sample of
firms that satisfy the preceding criteria constitute our “core sample.”
The number of firms in the core sample in each quarter varies between less than 4,000 in the
early 1980s and about 6,000 in the late 1990s (see Appendix Table A1 in and Figure 6, Panel
B for a graphical depiction). There are large variations in the number of listed firms because
of waves of new lists during some periods (in general during economic booms) and waves of
de-listing in some other periods (in general during recessions and stock market crashes). The
large variation over time in the number of firms in the core sample raises important issues in
the empirical analysis. As we show below, it is often useful for comparability to keep the same
number of firms in each quarter. To obtain the largest possible constant-size sample of firms,
we focus on a sample of the top 3,807 firms ranked by market capitalization in each quarter,
which we term the “constant number of firms” sample.21
For our regression and heterogeneity analysis, we merge our CRSP sample with the Com-
pustat database, losing some firms because not all firms listed in CRSP are covered by Com-
pustat. Compustat data were available only up to 2004-Q1 when this study was completed.
The left half of Table 1 gives summary statistics for the core and the constant number of firms
samples between 1981-Q3 and 2004-Q1.22 All dollar amounts in this and subsequent tables
and graphs are in real 2004 dollars (deflated using the Consumer Price Index). We also merge
our data with various other databases that contain other covariates of interest. The I/B/E/S
database gives analysts’ earnings forecasts for approximately 60% of the companies in our
sample. Execucomp provides detailed executive compensation, stock and stock-option owner-
ship for approximately one-third of the firms in our sample every year since 1992. Thompson
Financial database provides detailed institutional ownership information for most of the firms
in our sample. Dlugosz, Fahlenbrach, Gompers, and Metrick (2004) provide information on
large shareholders (individuals or entities who hold more than 5% of shares), collected from
proxy statements, for about 1,500 firms for the period 1996-2001. Because Execucomp and the
Dlugosz, et. al. database cover only about a third of the CRSP-Compustat firms, we augment20We also examined utilities and financial firms separately and our results for those firms are available upon
request.21 3,807 is the total number of firms which meet our selection criteria in 2004-Q2, the last quarter available.
For all previous quarters, the CRSP data always contains at least 3,807 firms.22Lagged data requirements for our subsequent analysis force us to begin with 1981-Q3.
10

these data sources for our principal-agent heterogeneity analysis by collecting some variables
directly from SEC proxy statements for an additional 347 firms, as described in Section 5.
We define regular dividends as monthly, quarterly, semi-annual, and annual taxable div-
idends in the CRSP data. We also reclassify “other frequency” taxable dividends as regular
dividend payments when those other-frequency payments are followed by regular payments of
similar magnitude.23 Some forms of liquidation can generate non-taxable dividend events that
we ignore in this study. We define all other taxable dividends besides regular distributions as
“special” dividends. More precisely, we define special dividends as the sum of special, one-time,
unspecified and other frequency dividends (those which were not followed by regular payments
of similar magnitude) in the CRSP data. Virtually all payments in our broader definition of
special dividends are accounted for by CRSP’s “special dividend” category.
We define a firm as initiating regular dividend payments in quarter t if it pays positive
regular dividends in quarter t and did not pay dividends in the previous four quarters. We
define a firm as terminating regular dividend payments in quarter t if it paid regular dividends
previously and stops paying from quarter t on. In practice, our definitions are slightly more
complex to accommodate the case of annual and semi-annual payers as well as the issue of
censoring (for terminations only) at the end of the sample. The exact definitions are presented
in appendix.
4 Effect of the Tax Cut on Dividend Payments
Our empirical analysis is organized as follows. The first subsection examines the change
in aggregate dividend amounts following the 2003 tax change and demonstrates the need to
examine other moments of the dividend distribution to make reliable inferences about the
effects of the tax reform. Subsections 2-4 provide such an analysis along three margins: (1) the
extensive margin (initiations and terminations of regular dividend payments); (2) the intensive
margin (increases or decreases in payment amounts by firms already paying); and (3) special
dividends. Subsection 5 shows that dividing the analysis into these margins allows a fairly
precise assessment of the contribution of each of the three margins to total dividend amounts,
and reports an elasticity of dividend payments with respect to the dividend tax rate using this23This other-frequency dividends are extremely rare and thus our results are not sensitive to the way we treat
them.
11

method. Finally, we discuss robustness checks of the causality of the tax cut in subsection 6.
4.1 Aggregate Dividends
Figure 1 plots aggregate regular dividends for the core sample between 1981-Q3 and 2004-Q2
in real 2004 dollars (using the CPI deflator). Total regular dividends rose from $25 billion
in 2002 to a peak of almost $30 billion at the end of 2003. Note that most of the increase
takes place in the last two quarters of 2003 after the tax cut was signed into law in July,
2003. These are the largest increases during the sample period. If the post-2003 increases in
aggregate dividends are due exclusively to the tax cut, these values suggest that the reform
raised regular aggregate dividends by about 20% in the six quarters after the reform relative
to the level in 2002-Q4 . Unfortunately, it is difficult to determine whether this surge in
aggregate dividends is tax-driven simply by examining changes in mean dividend amounts
paid by publicly traded firms. The econometric problem can be easily illustrated using data
in the years around the tax reform with regressions of the following form:
totdivi,t = α+ βrefdumi,t + γXi,t + εi,t (1)
The dependent variable is total dividends paid by firm i in quarter t. The regressor of interest
is the reform dummy: refdumi,t = 0 in the four quarters before discussion of the reform
(2002-Q1 to 2002-Q4), while refdumi,t = 1 in the four quarters after enactment (2002-Q1 to
2002-Q4).24 Without controls (no Xs), the OLS estimate of bβ = 1.58 (s.e. = 0.23).25 In
contrast, introducing a linear control for after tax earnings gives bβ = 0.62 (s.e. = 0.62), and
an additional control for assets changes the estimate to bβ = −0.06 (s.e. = 0.3).This fragility of the estimate of the tax response arises from the extreme concentration of
dividend payments. Figure 1, which also plots regular dividend amounts paid by the top 20
payers in each quarter, shows that the dividends from the top 20 payers account for half of all
dividends paid by all firms in our core sample. The fact that this concentration is the source
of the imprecision in bβ becomes evident when we change the dependent variable in (1) todividend yield (total dividends divided by mktcap). In the dividend yield regressions, which24For simplicity, we ignore all other quarters in this exercise. However, inclusion of the full data from 1980-Q1
to 2004-Q2 along with appropriate controls for year trends does not change our conclusions: the point estimatesof β remain statistically insignificant and fragile as soon as controls are introduced.25Standard errors reported here are clustered by quarter to allow for aggregate shocks. Standard errors
under the i.i.d. error assumption are even larger than those reported here.
12

are simply re-weighted versions of 1) with less weight on large firms, we obtain very stable
estimates of the β coefficient that are statistically significant at the 1% level, irrespective of
controls. Intuitively, mean dividends are driven in large part by very few top payers, creating
a small sample problem that makes statistical inference about the level of aggregate dividends
difficult. In view of this problem, we must turn to other moments of the dividend distribution
to obtain more credible evidence on whether the 2003 tax reform changed corporate payout
behavior.
4.2 Extensive Margin
One straightforward way of reducing the influence of very large payers is to examine a firm’s
decision to initiate or terminate dividend payments rather than looking at the amounts paid.
We first examine changes in initiations and terminations, and then discuss implications for the
overall fraction of dividend payers.
4.2.1 Initiations and Terminations
Figure 2 plots the fraction of initiations and terminations of dividend payments in the constant
number of firms sample. It is clear that the frequency of initiations rose when the reform
was proposed (2003-Q1) and surged very sharply after it was enacted. Strikingly, the number
of initiations in the three quarters following enactment (2003-Q3, 2003-Q4, and 2004-Q1) are
the three highest among the 80 quarters we consider (see Appendix Table A2 for the full
time series of initiations and other variables of interest). Importantly, there is no sign of a
decline in initiations prior to the reform, suggesting that the sharp surge in initiations reflects
real behavioral responses to an unanticipated change rather than a timing effect due to firms
that were delaying initiations in anticipation of the tax reform. Meanwhile, the number of
terminations remained very low and, if anything, fell slightly after the reform.
The initiations were widespread across industries and sizes of firms. Table 2 lists the
post-reform initiating firms among the largest 100 firms in our sample (ranked by market
capitalization in 2004-Q2). It shows that large initiators were not concentrated in a single
sector and that the dividend yields in the first year were not trivial, although lower than for
established payers among the top 100.
Table 3 summarizes the magnitude of the effect by comparing dividend initiations during
13

a short window around the reform-period. The pre-reform period is taken as the six quarters
before the reform 2001-Q3 to 2002-Q4 and the post-reform period includes the six post reform
quarters, 2003-Q1 to 2004-Q2. The first row of Table 3 shows that the average number of
initiations surged from 4.3 per quarter in the pre-reform period to 29 after the reform. The
difference is highly statistically significant (t-statistic over 10). Of course, the conclusion that
this change was entirely due to the tax reform is predicated on the assumption that no other
unobservable determinant of dividend payments changed contemporaneously. To examine
the validity of this assumption, we evaluate the robustness of our results to the inclusion of
a rich set of control variables identified as determinants of dividend policy by Lintner (1956)
and summarized more recently in Brav, Graham, Harvey, and Michaely (2002). We run the
following semi-parametric regression specification for initiations:
Initi,t =TXs=1
βs · 1(t = s) + µaai,t +8Xs=0
µsXi,t−s +8Xs=0
υSs SICsi,t + εi,t (2)
where Initi,t is an initiation dummy which takes value 1 if firm i initiates dividend payments
in quarter t and zero otherwise, 1(t = s) are a full set of quarter dummies. The additional
firm-level covariates are: (1) total current assets, ai,t; (2) the level and eight lags of quarterly
profits/assets, market capitalization/assets, and cash holdings/assets, (vector Xi,t); and (3)
First-digit SIC industry dummies, SICsi,t that indicate whether the first digit of firm i’s SIC
code is s in 2004.
Figure 3 shows that the surge in initiations is extremely robust to adding these controls by
plotting the {βs} coefficients from the regression along with the mean estimates of initiation
rates displayed in Figure 2.26 In addition, the fourth column of Table 3 shows that adding
controls does affect the estimate of the change in dividend initiations between the six-quarter
pre and post reform periods. The estimates reported in this column are from a regression
specification equivalent to (2) except that the quarter dummies are replaced with a single
post-reform dummy. Therefore, the surge in initiations cannot be explained by changes in
firms’ balance sheets or investment prospects in the post-reform period.27 We also examine26The regression estimates end in 2004-Q1 because Compustat data are not yet available for 2004-Q2.27The results are also robust to trends in mergers and acquisitions that could lead to changes in dividend
policy. Among all initiators in the post reform period, only one firm acquired another company just beforeinitiating dividends. In addition, controlling for forecasted growth prospects using I/B/E/S data on analysts’forecasts has no effect on the results.
14

whether the innovative “catering theory” of dividend initiations recently proposed by Baker
and Wurgler (2004a,b) may explain our results. We find that their leading measure of the
markets’ preference for the dividends — the dividend premium, which is defined as the log
difference in market to book ratios for dividend payers and non-payers — does not predict the
recent surge.28 These results confirm that observable trends are not responsible for the recent
surge in dividend initiations; we defer discussion of bias from unobservable trends to section
4.6.
To contrast our results with Blouin et al. (2004), who found no evidence of increases
along the regular dividend margin, we examine the data at a monthly frequency in the months
around the passage of the reform. Figure 4 plots the number of initiations per month between
2001 and 2004. It is clear that the surge in initiations occurred shortly after the reform was
enacted, during the three month period examined by Blouin et. al. Hence, although the
addition of three more quarters of data has made the increase in regular dividend payments
after the tax cut clearer, the primary reason that our conclusions differ from those of Blouin
et. al. is the difference in methodology. Changes in regular dividend amounts are difficult to
detect because of the extreme values problem, but changes in the number of payers are much
easier to see.
4.2.2 Fraction of Payers
We expect the surge in initiations in the post reform period accompanied with no increase in
terminations to lead to an increase in the fraction of firms paying dividends. This is confirmed
in Figure 5 which plots the fraction of dividend payers in the constant number of firms sample
between 1981-Q3 and 2004-Q2. As discussed in Fama and French (2001), the fraction of
dividend payers has declined steadily over the past two decades, from more than 40% in the
early 1980s to less than 20% in 2000.29 The decline in the fraction of payers stops precisely28This is because the dividend premium fell sharply during the dot-com boom and rose back to its original
level during the subsequent dot-com bust. We verify that this temporary fluctuation does not predict thesurge in initiations a year later by regressing the initiation rate on the dividend premium and finding that theresiduals from this regression spike up sharply after the tax reform. Note that we cannot directly include thedividend premium in the semi-parametric specification in (2) because there is no within-quarter variation inthe dividend premium.29DeAngelo, DeAngelo, and Skinner (2003) emphasize that while the number of payers among publicly traded
firms has fallen, dividends are not “disappearing” because total aggregate dividends have actually risen (asshown in Figure 1). This is because the distribution of dividend payments is more concentrated now than itwas in 1980.
15
until the last quarter of 2002, at which point the fraction of payers begins to rise. Figure 5 also
plots the tax preference parameter computed by Poterba (2004), which equals the net return
to investors from a dollar paid in dividends instead of capital gains.30 The largest change in
the tax preference parameter during the sample period occurs at the end of 2003, after which
dividend payments become start to become more common.
As mentioned in Section 2.2, a recent study by Julio and Ikenberry (2004) argues that the
reversal in the fraction of firms paying dividends takes place in late 2000 rather than in 2003,
and hence cannot be attributed to the tax reform. It is therefore critical to understand the
difference between their findings and ours. We start by reviewing Julio and Ikenberry’s (2004)
evidence. Figure 6, Panel A displays the fraction of regular dividend payers in the core CRSP
sample and for the top 1,000 firms (ranked by market capitalization in each quarter). Indeed,
in these two samples, the reversal takes place in 2001-Q1 and 2000-Q2 respectively.
Figure 6, Panel B displays the time series of the total number of firms as well as the total
number of regular dividend payers in the core CRSP sample. The total number of dividend
payers starts to increase (after a secular decline) only in 2003-Q1, exactly when the tax reform
takes place, and accelerates after enactment. However, the number of firms in the core sample
falls precipitously starting in 2000-Q4 (from 5,306 in 2000-Q3 down to 3,807 in 2004-Q4),
exactly at the time the early reversal takes place for the full sample on Panel A. Only 2% of
the 2,000 firms which exit the core CRSP sample from 2000-Q4 to 2004-Q4 are dividend payers.
Thus, what drives the pre-2003 reversal for the full sample is a fall in the denominator (total
number of firms) and not an increase in the numerator (number of payers). Therefore, this
early reversal cannot be attributed to active behavioral changes in corporate payout policy.
In the case of the top 1,000 firms, the denominator is fixed, and hence the preceding story
clearly cannot explain the early reversal effect for this sample. Figure 7 explores compositional
changes among the top 1,000 firms. It plots, for each quarter, the number of entrants into
the top 1000 which are regular dividend payers and the number of leavers which were regular
dividend payers. The graph shows that there are more dividend payers which leave the top
1,000 group in 1998 and 1999 than dividend payers which enter the sample. In 2000-2002 the30Formally, the tax parameter is defined as the dollar weighted average (across individual and institutional
investors) of (1−τdiv)/(1−τcg) where τdiv is the marginal tax rate on dividend income and τcg is the marginaltax rate on capital gains.
16

situation is reversed: more dividend payers enter the sample than dividend payers leave.31
Through these composition effects, the number of dividend payers among the top 1,000 falls
quickly in 1998 and 1999 and then recovers in 2000-2002, explaining the Julio-Ikenberry reversal
effect for the top 1000 depicted on Figure 6, Panel A.
Figure 8, Panel A makes this point more formally. The first curve depicts the number of
payers among the top 1,000. The “cumulative net payers listed” curve depicts the cumulative
difference (from 1982-Q1) between the number of regular dividend payers who entered the top
1,000 firms and the number of regular dividend payers who left the top 1,000 firms.32 This
curve captures the change in the number of dividend payers due to changes in the composition
of the top 1,000 firms sample over time. As described above, the cumulative net payers
listed falls in 1998 and 1999 and then rebounds in 2000-2002. The third “deliberate payers”
curve is simply the difference between the first two curves. This series reflects the number
of “deliberate” payers because movements in this series only come from active changes in
dividend policy by firms, given that entry and exits effects have been netted out. The number
of deliberate payers declines slowly until 2002-Q4 and starts increasing exactly in 2003-Q1, at
the time the reform takes place. The number of deliberate payers rises by 10% from 2002-Q4
to 2004-Q2.
Figure 8, Panel B graphs the number of deliberate payers for two other samples of interest:
the core sample (all firms in the CRSP which meet our criteria) and the constant number of
firms sample (the top 3,807 firms in each quarter ranked by market capitalization). For both
of these samples as well, once we control for composition effects, the number of payers starts
to increase in 2003-Q1, when the reform takes place, and the increase accelerates sharply in
2003-Q3, after enactment of the reform. The increase in the fraction of deliberate payers after
the reform is also around 10-12% for these groups.
These results show that the early reversal findings of Julio-Ikenberry are fully explained
by composition effects. Once these effects are controlled for, the reversal takes place exactly31Examining the characteristics of the entrants and leavers, we find that the spike in dividend leavers is due to
the surge in the stock prices in 1998 and 1999 of new technology firms that never paid dividends, which enteredthe top 1,000 and displaced older, more traditional firms (many of which paid dividends). Symmetrically, thespike in entrants is due to technology stock market crash in 2000-2002 during which new technology firms(predominantly less than 3 years old and with SIC 7370) are displaced by the original, older firms.32This graph is equal to the integral of the difference between the two graphs (dividend payers entering and
dividend payers leaving) depicted on Figure 7.
17

after the 2003 reform is implemented, implying that deliberate changes in corporate payout
behavior began only after the tax reform.33 Notably, for our constant number of firms sample
(the top 3,807 firms in each quarter), composition effects cancel out and the timing and size of
the surge in the number of payers and deliberate payers are almost identical.34 This justifies
our focus on this group as a simple but valid way to control for entry and exit effects.
4.3 Intensive Margin
Given the extreme values problem that plagues the analysis of levels, we begin our study of the
intensive margin by examining the effect of the tax cut on the probability that a firm increases
or decreases dividend payments by more than 20% in nominal terms.35 In order to avoid
double counting, initiations (terminations) are not counted as dividend increases (decreases).
The appendix gives the exact definition of increases and decreases we use.
Figure 9, Panel A, plots the fraction of firms in the constant number of firms sample that
increased or decreased dividends by 20% or more along the intensive margin. There is a sharp
surge in the number of firms which increase dividends when the tax cut is enacted in 2003-Q3.
The number of these large intensive margin increases jumped from 19 in the pre-reform period
(2001-Q3 to 2002-Q4) to 50 per quarter in the post-reform period (2003-Q1 to 2004-Q2), as
shown in Table 3. Analysis of the data at a monthly frequency (not reported) shows that the
pattern of dividend increases coincides very closely with the pattern of dividend initiations.
In particular, it began in the three month period immediately after the reform examined by
Blouin et. al., and remains strong through the end of the sample period. Meanwhile, the
frequency of dividend decreases remained small and essentially unchanged after the tax cut.
Figure 9, Panel B shows that controlling for observable variables from Compustat does not
modify our conclusion that this increase was tax-driven. The coefficients plotted in this Figure33An alternative way of purging composition bias is to control for firm fixed effects. Reassuringly, this
method also yields similar results (the increase in the fraction of payers coincides precisely with the reform).We focus on the “deliberate payers” approach here primarily because it is much more parsimonious, giving asimple illustration of why sample composition bias leads to a pre-tax reversal.34This can be seen formally in appendix Table A2 which displays the key quarterly series for the constant
number of firms sample, including the number of dividend payers among entrants and leavers.35Other cutoffs, such as 0%, 10%, or 50% also yield similar results. We focus on the 20% here cutoff because
these changes are both relatively frequent and sufficiently large that they are likely to signal a substantialshift in a corporation’s distribution policy. Note that Julio and Ikenberry (2004) argue that the number of0% increases started to rise in 2002, but this conclusion is fully driven by the functional form of their datasmoothing algorithm. Semi-parametric analysis shows that the surge in increases begins only after the reformwas enacted.
18
are obtained by running a regression analogous to (2) with an intensive increase dummy as
the dependent variable It should be noted, however, that the evidence of a tax effect on the
intensive margin is weaker than that for initiations because there were periods in the 1980s
where the fraction of firms increasing dividend payments was higher than in the post-reform
period. Table 3 shows that the change pre-post reform of intensive increases is also robust to
adding controls.
Figure 10 gives a more complete view of the changes in dividend behavior on the intensive
margin by displaying various percentiles of the dividend distribution among the top 3,807 firms
(including the zeros). The level of each percentile has been normalized to one in 1998-Q1.
There is clear evidence of a sharp increase in dividends for all percentiles below the percentile
99.5. The noise in the 99.5 percentile is so large that it is impossible to determine whether the
changes after the reform are anything more than a random fluctuation. But the 99.5 percentile
is very important for amounts, given the concentration of dividend payments: About half of
all dividends are paid out by the top 0.5% dividend payers (the top 19 payers in our constant
number of firms sample). The fact that the amounts are driven to a significant extent by a few
big payers whose aggregate dividend payments fluctuate sharply over time explains why it is so
difficult to obtain reliable estimates of the effect of taxes on mean levels. It also underscores
the importance of examining other, more stable moments of the dividend distribution.
4.4 Special Dividends
We now turn to special, one-time dividend distributions. Figure 1 plots the total amounts
of special dividends paid out. Special dividend amounts increased after enactment of the
2003 reform but there are other periods (such as the late 1980s) when special dividends were
substantially higher. Indeed, TRA-86 does appear to have generated a temporary surge in the
total amount of special dividends in the late 1980s much larger (and concentrated among very
few firms) than after the 2003 tax reform.36 Figure 11 plots the fraction of special dividend36 It is striking that TRA-86, a permanent tax change, created only a short-term response along the special
margin, while the 2003 tax change, whose duration remains somewhat uncertain, has generated substantialincreases in regular dividends that are likely to be long-term. Candidate explanations for the different responsesinclude: (1) TRA-86 changed the tax rate on interest and dividend income simultaneously, perhaps inducingbroader shifts in capital structure toward debt that necessitated large one-time distributions but made increasedregular dividends undesirable; (2) Average cash holdings were unusually high before the 2003 reform relativeto prior years, giving firms the resources necessary to raise dividends; (3) Highly publicized cases of corporatemismanagement such as Enron may have raised the signal value of dividends, giving firms a strong reason toraise dividends as soon as the cost of doing so was lowered. Further research is required to determine which of
19
payers in the constant number of firms sample. There is a clear surge in the fraction of special
payers immediately after the reform, and this change is robust to the inclusion of controls as
above. As shown in Table 3, an average of 18 firms per quarter paid special dividends after
the reform, significantly greater than the average of 7 in the six quarters before. However,
there are an average of 40 special dividend payments per quarter in the entire sample between
1981 and 2003. Hence, while the frequency of special payments rose after the reform relative
to the recent past, it does not exceed the level of special payments in earlier periods such as
the late 1980s and early 1990s.
4.5 Changes in Amounts and Elasticity Estimates
How much did each of the three margins discussed above contribute to the surge in aggregate
dividends? To obtain a statistically precise answer to this question, we focus on deliberate
changes in dividend amounts along each margin in the constant number of firms sample, and
exclude firms who acquired another company in the previous quarter in order to avoid imputing
dividend increases to the acquisition of a dividend paying company.
Figure 12A depicts the amounts (in real 2004 dollars) of regular dividends initiated in each
quarter from 1990-Q1 to 2004-Q2.37 The amounts raised from dividend initiations surged
sharply after the reform, from $13 million per quarter in the pre-reform period to an average
of $205 million per quarter after the reform (see Table 3). Strikingly, the 6 largest initiation
amounts since 1990 take place exactly in the last 6 post reform quarters. This difference is
highly significant and robust to introducing the rich set of controls used in (2), as shown in
Table 3. Note that there is no dip in the amount of dividends from initiations prior to the
reform, suggesting that our estimates are unlikely to be biased by re-timing effects.
Figure 12A also depicts the change in regular intensive dividends for firms previously paying
regular dividends. The change is estimated as the current payment less the previous regular
payment (initiations and terminations are excluded). If the firm did not exist in the prior
period, or drops out of the sample, the change is defined as 0. Defining changes in this way is
analogous to controlling for sample composition, because the change in the level of dividends
due to entry and exit effects is ignored. The series of aggregate changes along the intensive
these explanations is most relevant.37Annual dividends are divided by four and semi-annual dividends divided by two in order to normalize
changes at the quarterly level.
20

margin also displays a sharp increase in levels in the 6 quarters following the reform: 4 of the 5
largest intensive increases took place in the 6 post reform quarters. Table 3 shows that intensive
changes surged from $130 million per quarter on average before the reform to $740 million
after. As with the extensive margin, the change does not reflect intertemporal substitution of
dividend payments, since the series is flat in the years preceding the reform. The intensive
margin change is also statistically significant and robust to introducing controls.38 It follows
that once entry, exit and merging effects are controlled for, we can obtain relatively precise
estimates of the changes in the growth rate of dividend amounts along both the intensive and
extensive margin.39
Panel B depicts the cumulated (from 1990-Q1) amounts of regular dividend initiations
(integral of the initiation graph in Panel A) and the amounts of special dividends on the
left scale. Cumulated amounts (from 1990-Q1) of regular dividend intensive changes are
shown on the right scale (integral of the change in intensive margin dividends in Panel A).
This figure shows that the extensive margin has contributed about $1.2 billion to aggregate
quarterly dividends since the reform.40 Total cumulated dividends from the intensive margin
also surged sharply between 2002-Q4 and 2004-Q2. The graph displays a clear break in the
slope in the pre and post reform periods (the quarterly slopes are given by the levels in Panel
A). This figure and Table 3 show that by 2004-Q2, six quarters after the reform, $3.6 billion
in dividends have been raised from the intensive margin (subtracting out the trend in the
previous years).
Finally, special dividend payments are on average $0.6 billion per quarter higher in the
post-reform quarters relative to the six pre-reform quarters (see Table 3). However, this
increase is driven by a very small set of firms, as noted by Blouin et. al. (2004). More than
80% of the increase is accounted for by eight payers who made special dividend payments in
excess of $100 million in one of the quarters after the reform was enacted.41 Hence, if regular38The t-statistic for the intensive change is substantially lower than for the initiation amount, because dividend
changes along the intensive margin are much more concentrated than along the extensive margin.39 It is important to distinguish changes in levels from changes in the growth rate. As noted above, we cannot
directly obtain reliable estimates of the change in the level of dividends induced by the reform. However, asFigure 12 shows, the effect of the tax reform on the growth rate of dividends is clear once compositional biasesare eliminated. The importance of detrending the data is intuitive given that corporations take time to adjusttheir dividend policies after the change in tax regime.40Microsoft, the largest initiator, accounted for about 20% of the total effect but the rest of initiations are
not extremely concentrated, explaining the precision on the estimate in Table 3.41More than 30% of the increase is driven by telecommunications giant Southwestern Bell Corporation, which
21

dividend payments remain as persistent as they have historically, special dividend payments
are likely to be a short-term fluctuation in the time series relative to the change in regular
dividend amounts induced by the 2003 tax reform.42
The changes along the extensive and intensive margins add up to a total regular dividends
increase of $4.8 billion on average by 2004-Q2 (relative to the pre-reform trend). Starting
from a base of approximately $25 billion in 2002-Q4, total regular dividends have therefore
risen by roughly 20% for our sample of non-financial, non-utility publicly traded firms. Note
that the short-run increase in total dividends exceeds 20% because of the surge in special,
one-time distributions. According to calculations by Poterba (2004), the average tax rate on
dividends (including both taxable and non-taxable dividends distributed directly or indirectly
to individuals) fell from 29% to 17%, a 40% reduction. Therefore, the implied elasticity of
regular dividend amounts with respect to the dividend tax rate is roughly -0.5 as of 2004-Q2,
only one and a half years after the reform.43 This elasticity implies that the tax revenue from
dividend taxation that was lost because of the tax cut is only 50% of the revenue loss assuming
no behavioral response.44
It is interesting to note that the response to the tax change is far more rapid than that
predicted by “old view” time series estimates, which imply a slow adjustment process (Poterba
2004). Since firms have chosen to increase regular (rather than special) dividend payments,
which historically are rarely cut and extremely persistent, this sharp change is likely to reflect
a long-term shift in payout policies that may grow even larger over time as the adjustment
process continues.
4.6 Robustness Checks
Our identification strategy relies on the assumption that no other event apart from the tax cut
generated a surge in dividend payments exactly in 2003. One possible alternative story is the
exposition of several corporate scandals in 2001-2003. These scandals originated primarily
made two special dividend payments of approximately $335 million each in 2003-Q3 and 2003-Q4.42Of course, the $32 billion special dividend from Microsoft in 2004-Q4 will clearly create a short-lived blip
of unprecedented magnitude in the special dividend series.43Of course, the long-run response could be even larger, given that the adjustment process may not be
complete.44However, it is possible that the increase of dividends paid out reduces other forms of taxable income such
as realized capital gains from share repurchases. It is critical to assess the effect of the tax change on total taxrevenue (and not only revenue from taxing dividends) in order to assess the deadweight burden of taxation (seeGordon, Kalambokidis, and Slemrod, 2003 and Saez, 2004 for a recent exposition of this point).
22

from serious accounting fraud among well known corporations such as Xerox, Enron, and
WorldCom, and may have created distrust among shareholders about management of large
U.S. corporations in general. Shareholders may have therefore pressured management to
increase dividends even in the absence of the tax cut. The timing of the surge in initiations
suggests that the corporate scandals were not responsible for the surge in dividends because
they were first publicized much before 2003-Q2.45 Nonetheless, we conduct three additional
empirical tests to rule out this and other alternative stories about changes in unobservables.
First, and most important, we exploit the fact that only dividend income distributed to
individuals through non-tax-favored accounts was affected by the reform. For instance, divi-
dend income earned through pension funds was not affected by the tax change. Consequently,
if the tax cut was responsible for the surge in aggregate dividends, we would not expect to see a
response among firms who are controlled by such non-affected entities. To test this hypothesis,
we first isolate a subset of institutional investors that are definitely not affected by the reform
— pension funds, insurance companies, nonprofit organizations, non financial corporations, and
government agencies — in the Thomson financial institutional ownership database.46 We then
divide the sample of firms that are alive in our core sample in all quarters between 1998-Q1
and 2004-Q2 into two groups.47 The “control” group consists of firm-quarter pairs where the
largest institutional owner is a non-affected entity.48 The “treatment” group includes all other
firm-quarter pairs.
Table 4 reports the annual initiation rates among nonpayers in these two groups of firms in
the pre-reform period (1998-Q1 to 2002-Q4) and the post-reform period (2003-Q1 to 2004-Q2).
The initiation rate was very similar for both groups before the reform. However, the initiation45Enron’s scandal appeared in October 2001, WorldCom’s in March 2002, and Tyco’s in May 2002. While it
is unlikely that these scandals were solely reponsible for the surge in dividends, it is possible that they magnifiedthe extent of the response to the tax cut.46Most large institutional shareholders (e.g., Fidelity) are partly affected by the reform, because they manage
funds on behalf of taxable individuals as well as non-taxable clients such as individual retirement accounts,pensions, and nonprofits.47Details about the definition of this sample and more general breakdowns by size of institutional ownership
are given in section 5.2 below.48Previous papers such as Perez-Gonzalez (2003) and Blouin et. al. (2004) have used companies owned
by large institutional shareholders as control groups, without distinguishing non-taxable and partly taxableinstitutions as we do here. We find that only 15% of institutional owners (dollar weighted) are fully non-taxable. This point is particularly important because our analysis in Section 5 shows that firms with largerinstitutional ownership are much more responsive to the reform, implying that many institutions behave in theinterests of their individual taxable clients. Therefore, raw institutional ownership is clearly not a valid proxyfor nontaxable status when analyzing the effects of taxes on corporate behavior.
23

rate surged by a factor of 5 after the reform for the treatment group, while remaining virtually
constant for the control group. As a result, the post-reform initiation rates are significantly
different across the two groups, and the difference-in-differences estimate of the causal effect
of the tax cut is also highly statistically significant. These estimates are fully robust to
a regression with controls for assets, market capitalization, profits, and industry codes, and
interactions of these controls with a tax reform dummy, as in equation (3) below (with a t-
statistic of 4 for the difference-in-differences). In addition, the results cannot be explained
away by changing tax clienteles of shareholders: if we form the treatment and control groups
using institutional ownership data from one or two quarters prior to the current quarter, the
results remain very similar.49 The lack of change in the payout behavior of firms controlled
by non-affected entities during the reform strongly suggests that the recent surge in dividend
payments was entirely tax-driven, since there is no other obvious reason that dividend payout
patterns should have diverged across these two groups at exactly the time of the reform.
Second, we use Compustat data for Canadian corporations to perform a placebo test.
Canadian corporations are not affected by the tax cut unless they are owned by U.S. indi-
viduals. Although U.S. ownership of Canadian corporations is not trivial, it is likely to be
small relative to U.S. ownership of U.S. corporations.50 Figure 13 plots the fraction of U.S.
and Canadian firms initiating dividends in each quarter from 1994-Q1 to 2004-Q1. In sharp
contrast to the United States, Canadian firms do not display a surge in dividend initiations
around the 2003 reform. Therefore, if unobservable shocks such as corporate scandals affected
corporate behavior in Canada as in the U.S., the evidence from Figure 13 suggests that the
surge in dividends in the U.S. was indeed tax driven.
Finally, we also examine the press releases of the firms that initiated dividends after the
reform was enacted and find that more than a quarter of the firms explicitly cite the tax cut as
one of their motives for initiating dividends in their first announcement. This figure is likely49Changing clienteles could potentially pose a problem because taxable institutional holders might start to
purchase more shares of companies that initiated dividends after the reform because of the lower tax rate. Inthis case, we might find a difference in the initiations rates across our treatment and control groups even ifcorporate behavior was unchanged by the tax cut. The fact that pre-initiation institutional ownership predictsinitiation rates in the same way rules out this hypothesis.50Moreover, as we show in section 5 below, the tax response in the U.S. is confined primarily to firms with
high executive share ownership, whose personal tax incentives changed because of the reform. Since Canadiancorporations are unlikely to have top executives who are U.S. residents, we would not expect to see a taxresponse among these firms even if they have many diffuse U.S. based shareholders.
24

to greatly understate the actual number of tax-motivated dividend changes because firms have
strong incentives to avoid attributing their dividend decision to the tax cut, instead claiming
that they are raising dividends given signs of strong future earnings.51
5 Which Firms Responded to the Tax Change?
In this section, we document two important forms of heterogeneity in the dividend response
that shed light on the mechanism of the tax response. First, we show that the response
is heavily influenced by agents’ incentives and powerful principals’ interests. On the agent
side, firms with high executive share ownership and low executive stock-options holding were
most likely to initiate dividend payments. On the principal side, firms with large share
ownership among independent directors and high taxable institutional ownership responded
more strongly to the tax cut. When neither the high level agents nor principals have strong
incentives to push for a dividend policy change, the response to the tax cut is virtually zero.
Hence, existing “old view” and “new view” models of corporate taxation in the public finance
literature appear to miss a central determinant of the behavioral response to taxation by
abstracting from agency problems.
Second, we provide some suggestive evidence about the efficiency effects of the tax cut.
Of course, the fact that the tax cut caused a sharp surge in dividend payments does not itself
imply that the efficiency of capital allocation was improved. The ideal way to estimate the
efficiency effects of the tax cut would be to directly identify its effects on investment and
profits. Unfortunately, this approach is infeasible because both investment and profits are
very volatile, making it difficult to detect whether changes in behavior along those margins
are associated with the tax cut. We provide indirect evidence of the improvement in capital
allocation by showing that firms with high forecasted earnings growth did not respond to the
tax cut. This suggests that funds might have been channelled away from lower growth firms
toward those with better investment opportunities through external capital markets.
In addition to these cuts, we also briefly discuss heterogeneity along a large set of other
dimensions, such as profits, assets, cash holdings, age, and debt levels.51 Interestingly, 13% of nonpaying companies surveyed in Brav et al. (2004) said that they would initiate
dividend payments following the tax cut, a number consistent with our finding that up to 2004-Q2, about 10%of nonpaying firms have initiated dividends.
25

5.1 Self-interested agents: Executive share and stock-option ownership
A large literature in corporate finance has focused on the tension between principals’ (share-
holders) objectives and agents’ (executives) interests. One hypothesis that has received sub-
stantial attention is that high degrees of pay-for-performance sensitivity, e.g. from large ex-
ecutive stock and options holdings, can have significant effects on executives’ decisions about
corporate policy. In this subsection, we analyze the impact of executive share and options
holdings on the payout response to the tax cut.
We test for such an association without imposing strong functional form assumptions on
the data, since the relevant effects could be non-linear, and outliers could be very influential.
We use a semi-parametric strategy for classifying firms into quintiles based on executive share
and option ownership, and compare the size of the dividend response across the quintiles. As
in the preceding analysis of the overall dividend response, we must be careful to address biases
that arise from changing sample composition during the dot-com boom and bust. Therefore,
in this and all subsequent heterogeneity analyzes, we restrict attention to the set of 2,551 firms
in the core sample that are alive between 1998-Q1 and 2004-Q2.52
Our primary data source for the share ownership and options data is ExecuComp. The
shortcoming of ExecuComp data is that it covers only about one-third of the companies listed
in CRSP, and these companies are not a random subsample of the CRSP firms. In particular,
ExecuComp tends to cover only larger firms, which have a higher propensity to pay dividends
and differ from uncovered firms along many other dimensions (e.g. large shareholder own-
ership) as well. To improve the precision of our estimates and obtain results that apply to
the full universe of publicly traded firms, we expanded our data on share ownership by hand-
collecting data for an additional 347 firms from SEC proxy filings. The 347 firms include all
the firms that initiated dividends, which are of greatest interest for the present study, as well
as an additional 147 firms that constitute a 10% random sample of the non-Execucomp firms
that did not initiate dividends within our 1998-2004Q2 sample frame. Sampling probabil-
ity weights are used to account for the under-representation of non-Execucomp non-initiating
firms. The construction of the random sample is described in detail in the appendix.52We chose a relatively long pre-reform time frame (1998-2003) in order to make the total number of dividend
initiations in the pre-reform period similar to that in the post-reform period. We focus primarily on heterogeneityin dividend initiations here. Results for dividend increases are generally quite similar.
26

We begin by analyzing the relationship between executive shareownership and dividend
initiations. An executive who holds a large stake in his company experiences a large change
in his personal tax burden from a dividend payment, since a considerable fraction of the total
dividend payout would accrue to the executive himself.53 At the other extreme, the personal
tax incentives of an executive who owns no shares are unchanged by the 2003 reform. To
analyze whether the personal tax burden of executives has an impact on the tax response of
corporations, we classify firms into five quintiles of executive share ownership as follows. We
first identify the largest shareholder among the company’s executives in a given year. We then
define a stable set of quintiles using the average fraction of shares held by the largest executive
shareholder during our sample frame if the firm does not initiate dividends during this period,
and using share ownership as the time of initiation if the firm does initiate dividends. This
procedure ensures that firms do not move across quintiles over time. The advantage of having a
stable set of firms in each quintile is that it eliminates the bias that can arise if the distribution
of executive share ownership changes in a manner that is correlated with dividend behavior.
Figure 14A shows the frequency of initiations among non-payers across the five quintiles
of executive share ownership in the pre- and post-reform periods. The pre-reform period is
defined as 1998-Q1 to 2002-Q4 and the post-reform period is 2003-Q1 to 2004-Q2. Initiations
surged much more sharply in firms where at least one executive owned a substantial fraction
of the company’s shares.54 The post-reform annual initiation rate among firms in the highest
quintile of executive share ownership is 9.5%, in contrast with 3.5% in the lowest quintile. The
difference between the change in the initiation rate in the fifth quintile and the first quintile is
statistically significant with a p-value of 0.03 (see Appendix Table A3 for means and standard
errors for each quintile, as well as the difference between the change in initiation rates between
the first and fifth quintiles). The pattern for dividend increases (not reported) is also quite
similar.55
53 It can be difficult for top executives in publicly traded firms to obtain cash by selling shares because sharesales must be publicly reported and are likely to be interpreted as a negative signal by the market. Previousstudies have found mixed results on the correlation between large executive ownership and dividend payments.Rozeff (1982) found no correlation, but a recent study by Fenn and Liang (2001) found a positive correlation.Those studies, however, do not use tax changes to identify this link.54Both the dollar amount of shares held by the largest executive shareholder and the fraction of shares held
are positively associated with the size of the tax response. The share holdings of all other executives besidesthe largest executive shareholder are unrelated to the tax response.55 In independent work, Nam, Wang, and Zhang (2004) and Brown, Liang, and Weisbenner (in progress),
have also identified a relationship between executive ownership and dividend increases after the tax cut using
27

In order to control for other covariates that may also influence the dividend response to
the tax cut, we run a regression analogous to (2), linearly interacting each of the covariates
and the five quintile dummies of interest with a tax reform dummy, dT .56
Initi,t =1X
T=0
{5Xj=1
βT,jdT ∗ qjshrowni,t + dT ∗Xi,t}+ εi,t (3)
Here T = 0 denotes the pre-reform period and T = 1 denotes the post-reform period.
The set of covariates X consists of the following variables, which are averaged over the 1998-
2004Q2 sample frame: assets, cash/assets, debt/assets, profits/assets, mktcap/assets, percent
of shares held by institutions, largest executive unexercisable option holding as a percentage
of total shares outstanding, and largest executive exercisable option holding as a percentage of
total shares outstanding. In this regression, the {β1,j}5j=1 coefficients reveal the heterogeneityin the dividend response along the executive share ownership margin, conditioning on the
possible heterogeneity of responses along all the other observable margins. The estimates
of the {β1,j}5j=1 coefficients are reported in Appendix Table A4, along with the p-values anddifference-in-difference estimates of the change in initiation rates between the first and fifth
quintiles. The pattern and statistical significance of the regression coefficients is essentially
unaffected by the inclusion of covariates, suggesting that executive share ownership is indeed
causally associated with the dividend response to the tax cut.
Next, we examine the effect of unexercisable stock-options holdings by top executives on
the tax response. Lambert, Lanen, and Larker (1989) noted that executives with large options
holdings are hurt by dividend payments, because the strike prices of their options are typically
not adjusted for dividends.57 By paying money out of the firm and thereby reducing the
price of the shares outstanding, executives make their unexercised options less valuable. To
examine whether these incentives matter for the tax response, we follow the same methodology
ExecuComp data. Our hand-collected data permits a more precise characterization of the non-linear effectof executive share ownership on the tax response, and allows us to analyze the interaction between agent andprincipal incentives, as discussed in section 5.3.56Less parametric regressions with quintile dummies for all the covariates generally yield the same pattern
of coefficients; however, the large number of coefficients causes the standard errors to rise relative to our moreparsimonious linear specification for controls.57More recently, Fenn and Liang (2001) and Weisbenner (2000) have shown that there is a negative relation
between the number of stock options owned by management and dividend payments and a positive relationbetween options and share repurchases. This suggests that firms where top executives own many stock optionsare substituting dividends for share repurchases. Those studies, however, do not use tax changes to identifythose links.
28

as above and classify firms into five quintiles based on the unexercisable options holdings (as
a fraction of total shares outstanding) of the executive who owns the largest number of such
options.
Figure 14B shows that firms where one or more executives had a large unexercisable option
holding were significantly less likely to respond to the tax cut. The annual initiation rate
was 8.4% among firms whose executives were in the lowest quintile of options holdings, in
contrast with 4% in the highest quintile. These differences are statistically significant with
a p-value of 0.03 (Table A3). The pattern of the initiation rates is also robust to controls
based on a regression specification analogous to (3) that substitutes maximum executive share
ownership for unexercisable options ownership in the set of controls X (Table A4). Consistent
with the hypothesis that it is mainly unexercised option holdings that make dividend payments
unattractive, we find a much weaker and less robust relationship between executives’ exercisable
options holdings and the tax response (see Tables A3 and A4).
Table 5a illustrates the interaction between executive incentives through share and option
holdings by cross-tabulating the post-reform initiation rate by thirds of share ownership and
unexercisable options ownership. The importance of executive incentives is striking. Only
1.6% of the firms in the lowest third of share ownership and highest third of option ownership
initiated dividends in the six quarters after the reform. In contrast, 11.4% of the firms
at the other extreme — highest third of share ownership and lowest third of options — have
initiated dividend payments since that point. Despite the fact that the variation in share
and options holdings is purely cross-sectional, it is difficult to formulate a non-agency story
that would explain the share ownership, unexercisable options, and exercisable options results
simultaneously. In short, there is strong evidence that executives behave in a self-interested
(although not necessarily inefficient) manner when making decisions about corporate payout
policy for their shareholders.58
58While the evidence of self-interested behavior is consistent with the view that corporations cannot beexpected to maximize shareholder value, it does not necessarily imply that there is an inefficiency that ought tobe corrected. Since executives’ compensation and decision power is contracted upon with shareholders ex-ante,it is conceivable that such self-serving behavior emerges as the efficient ex-post outcome of an optimal contractthat is well understood by all parties.
29

5.2 Powerful principals: Institutional shareholders and directors
We now turn to the other side of the principal-agent relationship, and examine the effect of
having powerful principals on the response to the tax cut. An extensive literature in corporate
finance has found an association between the presence of large individual and institutional
shareholders and the degree to which firms behave in value-maximizing fashion (see Shleifer
and Vishny (1997) for a review). To analyze the impact of these variables on the dividend
response, we quantify the power of principals in two ways: the percent of shares controlled
by institutions (e.g. mutual funds, trusts, banks, etc.) and whether there is at least one
independent (non-officer) director with large share holdings (over 5% of shares).
We obtain data on institutional ownership from Thompson Financial’s Institutional Own-
ership database, which covers nearly 90% of the firms in our sample. Our primary data source
for the number of large shareholders is a dataset compiled by Dlugosz et. al. (2004) which
corrects a series of mistakes in Compact-Disclosure data on large shareholders compiled from
firms’ SEC filings. Since this dataset covers only the firms tracked by the Investor Respon-
sibility Research Center (roughly the 1,500 largest companies in the U.S.), we augment this
dataset by hand-collecting information from proxy statements for an additional set of firms.
We follow the same methodology as for the executive share ownership data, collecting data
for all the firms that initiated dividend payments and a 10% random sample of non-IRRC,
non-initiating firms. With appropriate sampling probability weights, these additional data
allow us to obtain estimates for the full universe of publicly traded firms in CRSP.
We begin by analyzing the impact of institutional ownership on the tax response. We
classify firms into five quintiles based on the average fraction of shares held by institutions
over the sample frame. Figure 15A shows that among firms previously not paying dividends,
those with higher institutional ownership are much more likely to begin paying after the
reform. The statistical significance and robustness of this conclusion to the usual set of
controls (excluding institutional share ownership) used in (3) are again confirmed in Tables
A3 and A4. Consistent with our results on taxable and non-taxable institutional holdings
reported in section 4.6, there is no association between the fraction shares held by non-taxable
institutions and the magnitude of the tax response (not reported). Only the fraction held by
partially or fully taxable institutional owners matters. These findings suggest that partially
30

taxable institutional owners increase their demand for dividends from the corporations in
which they invest after the tax reform, and that corporations respond to these demands,
perhaps because many institutions play an active role in influencing corporate boards. In
addition, the fact that only taxable institutions induce a response is consistent with related
studies in the corporate finance literature (reviewed in Shleifer and Vishny, 1997) showing that
powerful principals are themselves self-interested, potentially acting at the expense of more
diffuse minority shareholders who are less influential.
We now turn to the analysis of the impact of large-shareholding independent directors on
the tax response. We classify firms into two categories: those who never had an independent
large-shareholding director during the sample period, and those with at least one such director.
We also cut the data into two groups by institutional ownership (below or above the sample
median). Figure 15B shows that for firms with low institutional ownership, the presence of
a large-shareholding independent director significantly increases the probability of initiating
dividends. Table A3 shows that the director effect is significant at the 5% level without
controls. Table A4 shows that the magnitude of the director effect is larger with controls,
but the standard errors rise and make the difference marginally significant (p-value = 0.097).
In contrast with these results, for firms with high institutional ownership, the presence of
an independent director has no effect (right side of Figure 15B). Hence, quite intuitively,
powerful principals appear to substitute for each other: the presence of one powerful principal
with strong incentives to demand dividends reduces the marginal impact of other powerful
principals with similar interests.
Unlike directors and institutions, large “outside” (non-director) individual shareholders,
have no effect on the response to the tax cut, along either the extensive or intensive margins
(see Tables A3 and A4). The most likely reason for this is that dividend policy is set exclusively
by the board of directors and is not typically voted upon by shareholders. Hence, large external
individual shareholders may have less direct influence over the short-run payout decisions of
corporations.
Table 5b illustrates the interaction between executive incentives and the power of principals.
It cross-tabulates three groups ranked by top executive share ownership by three groups ranked
by total institutional ownership. This table shows that executive incentives and powerful
principals are also to some extent substitutes: Firms with neither executive incentives nor
31
powerful principals hardly respond to the tax change, while firms with one of the two elements
are 6-10 times more likely to initiate dividends in response to the tax cut. These findings
show that principal-agent issues play a first-order role in determining behavioral responses to
taxation, and should be included explicitly in models of optimal dividend taxation.
5.3 Capital allocation efficiency: Forecasted earnings growth
We now examine whether there is evidence of an efficiency improvement in capital allocation
associated with the 2003 tax reform. To do so, we test for an association between forecasted
growth prospects and the dividend response to the tax cut. We define forecasted growth
prospects using I/B/E/S data on analysts’ earnings forecasts as follows. We first compute the
expected change in earnings per share as the mean earnings per share forecast for a two year
forecast period minus the actual earnings per share in the current year. We then multiply
this figure by the total number of shares outstanding and divide by total assets to arrive at a
normalized measure of earnings growth per dollar of assets.59 Finally, we define five quintiles
of earnings growth over the sample of firm-quarter pairs where the firm was not previously a
dividend payer (and is therefore a candidate to initiate dividend payments).
Figure 16 shows the frequency of initiations among non-payers across the five quintiles
of forecasted earnings growth in the pre- and post-reform periods. The effect of forecasted
growth appears to be slightly non-linear, consistent with the hypothesis that firms that have
less need for cash respond more to the tax cut. Some of the firms in quintile 1 are in distress,
as their earnings are expected to fall sharply, so they respond less on average than those in
quintile 2, who have more moderate earnings forecasts. Firms with the best growth prospects
(quintile 5) responded very little to the tax cut. As shown in Table A3, the difference between
the fifth quintile and second quintile is highly statistically significant. The general pattern of
these estimates is robust to the inclusion of our standard set of covariates, as shown in Table
A4, although the magnitudes of the differences are slightly attenuated and the standard errors
are somewhat larger.60
59We obtain similar results when defining earnings growth as a simple percentage change in EPS; the advan-tage of normalizing by assets is that it permits us to include the many firms that have negative forecasted orcurrent EPS.60The fact that the inclusion of controls slightly weakens the effect of earnings growth on initiation rates is
not surprising in view of the fact that many of our controls are highly correlated with future earnings growth(e.g. mktcap/assets, profits/assets).
32

These results provide suggestive evidence that the dividend tax cut made the capital market
reshuffle funds out of lower growth firms.61 A large set of studies have argued that free
cash flow within such firms is not always put toward value-maximizing ventures because of
principal-agent problems (see e.g., Jensen 1986, Rajan, Servaes, and Zingales 2000, Scharfstein
and Stein 2000). Since the reduction in dividend taxes reduced executives’ incentives to hoard
earnings, the funds released from these lower-growth firms might have been redirected through
the external capital market toward other ventures with equal or greater expected value.62
These findings are a first step toward understanding the welfare implications of dividend
taxation. If the dividend tax cut had not induced payouts from lower-growth firms, it would
be hard to imagine that it yielded real gains in economic efficiency. The results therefore call
for further research on investment behavior to quantify the welfare benefits of the tax cut, as
we discuss in the conclusion.
5.4 Other Dimensions
We have also examined the heterogeneity of the tax response along several other dimensions,
following a quintile-classification and regression methodology analogous to that above. Some
of these results are summarized in Appendix Tables A3 and A4. Unsurprisingly, we find that
the tax response was stronger among firms that are in healthy, stable financial condition, i.e.,
those with higher levels of profits and assets and lower levels of debt. More interestingly, cash
holdings are unrelated to the dividend response. This contradicts the “new view” prediction
that firms with high levels of cash holdings, who presumably finance investment out of retained
earnings, should not have changed payout policies after the tax cut.
6 Substitution with Share Repurchases
As noted in Section 2.1, it is possible for companies to leave total payout unchanged while
raising dividends by reducing their share repurchases. If the tax cut simply induced firms to
substitute share repurchases by dividends without raising total payout, it would be unlikely
that the tax cut had large efficiency benefits because the total amount of capital recirculation61We show in section 6 that the dividend response appears to reflect an increase in total payout, not just
substitution between share repurchases and dividends.62We cannot directly document this transfer because cash holdings fluctuate tremendously over time, making
it impossible to determine whether the high growth firms obtained more funds after the reform.
33

would remain unchanged. It is therefore very important to understand the degree to which
share repurchases were crowded out by increased dividend payments.
Unfortunately, this exercise is again very difficult because of the volatility of share re-
purchases over time. Figure 17 illustrates the problem. Panel A depicts aggregate share
repurchases (along with aggregate regular dividend payments) by firms in the core sample
which have share repurchase information from Compustat from 1984-Q1 to 2004-Q1 (the most
recent quarter for which Compustat data are available). The figure shows that share re-
purchases have exceeded dividend payments since 1997, and that they vary much more from
quarter to quarter than dividends. This greater time variability makes it much harder to
estimate the effects of the 2003 reform on share repurchases.63 The figure shows that share
repurchases have increased substantially over the last 3 quarters but, in view of the historical
record, it is clearly possible that share repurchases could have increased even more absent the
tax change. Hence, it is impossible to draw any reliable conclusions about the effect of the
reform on total payout (total dividends + total repurchases) in the aggregate sample.
Panel B of Figure 17 shows that looking at other moments of the total payout distribution in
the full sample does not make the statistical inference problem any easier. Panel B displays the
total number of firms which repurchase more than 0.1% of their shares (along with the number
of firms paying regular dividends) in the core sample. The number of firms repurchasing shares
is also very noisy over time, making it impossible to infer the effect of the tax cut on the total
number of firms paying out in some form (either dividends or repurchases).
In order to make progress on the substitution question, we therefore focus on narrower
samples where the noise in repurchases is small relative to the change in dividend behavior.
From Section 5, one such sample is the set of firms with large executive share ownership,
which experiences a very large surge in dividend initiations. Panel A of Figure 18 displays the
fraction of regular dividend payers, the fraction repurchasing at least 0.1% of their shares, and
the fraction of firms paying out in some form (either paying regular dividends or repurchasing
at least 0.1% of their shares) from 2000-Q1 to 2004-Q1 for the sample of firms where a top
executive owns at least 20% of the shares, which represents 12% of our sample. The fraction
paying dividends in this group jumped from around 25% before the reform to over 35% by 2004-63Controlling for observable variables or removing the largest share repurchasers does not smooth the time
series of share repurchases.
34
Q1. Interestingly, the increase in the fraction of firms paying out (either through dividends or
share repurchases) is quite similar in magnitude, from around 45% before the reform to almost
55% by 2004-Q1. The fraction of firms repurchasing shares is fairly stable over the period
and falls modestly from 25% to 21% from 2002-Q3 to 2004-Q1. This graph suggests fairly
convincingly that firms with large executive ownership did not simply substitute dividend
payments for share repurchases after the reform, implying that the tax cut had real effects on
total payout.
Unfortunately, the series of amounts paid out in the form of repurchases is too noisy to
allow us to obtain a more precise estimate of the degree of substitution in amounts even for the
high response group in Panel A. Panel B therefore directly examines the sample of firms that
initiated dividends after the 2003 tax reform. It shows the amounts of dividends and share
repurchases of this subset of firms from 2000-Q1 to 2004-Q1.64 Unsurprisingly, the amount
of dividends is virtually zero before the reform and increases smoothly to almost $1 billion by
2004-Q1. The figure also shows that, for this group, the amounts of share repurchases actually
increased as well during the last 3 quarters, confirming that firms initiating dividends after the
reform are not reducing their share repurchase levels relative to the pre-reform level in order
to pay dividends. Furthermore, about 35% of the firms which initiated dividends after the
reform never repurchased shares in 2002. In addition, among the firms initiating dividends
after the reform, the fraction of firms repurchasing at least 0.1% of their shares fell only from
39% in the 2002 quarters on average to about 35% in 2004-Q1.
It should be noted that while the results from Panel B show that firms did not simply
“relabel” repurchases as dividends after the reform, they do not necessarily rule out more
general forms of substitution. This is because the selection of this group is endogenous (being
based on the choice of initiating dividends). It is conceivable that absent the reform, the firms
that initiated dividends would have repurchased more shares instead.
7 Conclusion
Aggregate quarterly dividend payments from publicly traded corporations surged by around
$5 billion, or 20%, during the six quarters following the 2003 tax reform. Unfortunately,
the time series of the level of dividend amounts is too noisy to immediately conclude that64The figure excludes the largest initiating firm, Microsoft, in order to obtain smoother time series.
35
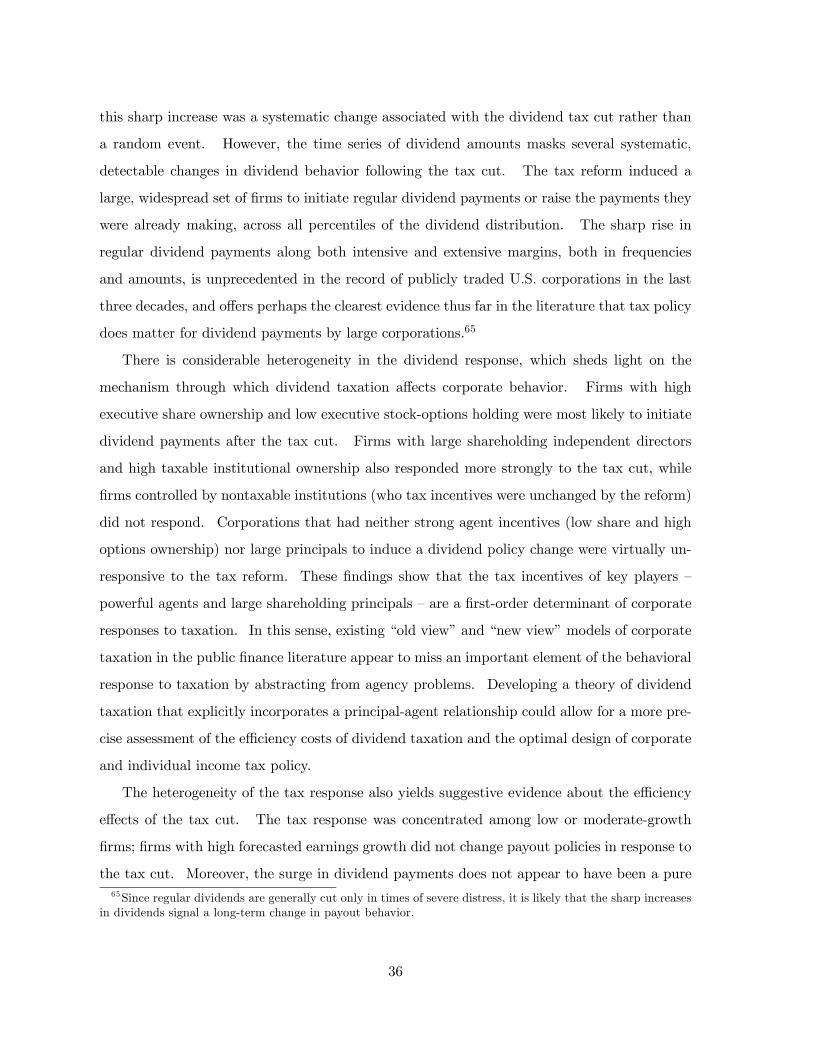
this sharp increase was a systematic change associated with the dividend tax cut rather than
a random event. However, the time series of dividend amounts masks several systematic,
detectable changes in dividend behavior following the tax cut. The tax reform induced a
large, widespread set of firms to initiate regular dividend payments or raise the payments they
were already making, across all percentiles of the dividend distribution. The sharp rise in
regular dividend payments along both intensive and extensive margins, both in frequencies
and amounts, is unprecedented in the record of publicly traded U.S. corporations in the last
three decades, and offers perhaps the clearest evidence thus far in the literature that tax policy
does matter for dividend payments by large corporations.65
There is considerable heterogeneity in the dividend response, which sheds light on the
mechanism through which dividend taxation affects corporate behavior. Firms with high
executive share ownership and low executive stock-options holding were most likely to initiate
dividend payments after the tax cut. Firms with large shareholding independent directors
and high taxable institutional ownership also responded more strongly to the tax cut, while
firms controlled by nontaxable institutions (who tax incentives were unchanged by the reform)
did not respond. Corporations that had neither strong agent incentives (low share and high
options ownership) nor large principals to induce a dividend policy change were virtually un-
responsive to the tax reform. These findings show that the tax incentives of key players —
powerful agents and large shareholding principals — are a first-order determinant of corporate
responses to taxation. In this sense, existing “old view” and “new view” models of corporate
taxation in the public finance literature appear to miss an important element of the behavioral
response to taxation by abstracting from agency problems. Developing a theory of dividend
taxation that explicitly incorporates a principal-agent relationship could allow for a more pre-
cise assessment of the efficiency costs of dividend taxation and the optimal design of corporate
and individual income tax policy.
The heterogeneity of the tax response also yields suggestive evidence about the efficiency
effects of the tax cut. The tax response was concentrated among low or moderate-growth
firms; firms with high forecasted earnings growth did not change payout policies in response to
the tax cut. Moreover, the surge in dividend payments does not appear to have been a pure65Since regular dividends are generally cut only in times of severe distress, it is likely that the sharp increases
in dividends signal a long-term change in payout behavior.
36

substitution for share repurchases. This suggests that funds may have been channelled away
from lower growth firms toward those with better investment opportunities through external
capital markets, potentially improving welfare.
Of course, in order to quantify the welfare consequences of the tax reform, it would be most
interesting to analyze the effect of the reform on investment behavior directly. Unfortunately,
this does not appear to be feasible because the time series of investment is extremely volatile
and of much larger magnitude than dividend payments. As a result, it is impossible to
estimate the effects of the tax reform on any moment of the investment distribution of publicly
traded corporations with reasonable confidence intervals using the flexible, semi-parametric
methods employed above. A promising avenue for future research is to study closely held
corporations and compare subchapter C firms (which face the corporate income tax on profits)
to subchapter S firms (which do not face the corporate tax and are unaffected by the 2003
reform). As the universe of such firms is much larger, and S-corporations offer a natural
control group, estimation of other behavioral responses such as investment and debt policy
might be possible.66
The sharp variations induced by the 2003 tax cut also offer the opportunity to revisit other
important questions in corporate taxation beyond those addressed in this paper. One issue
of particular relevance for distinguishing agency and signalling theories of dividends is the
market response to dividend announcements. Bernheim and Wantz (1995) show formally and
empirically that if dividends serve a signalling purpose, the market premium for increasing
or initiating dividends will be larger when the tax rate is higher. Bernheim and Wantz’s
empirical findings have been subsequently challenged by Bernhardt, Robertson, and Farrow
(1994) and Grullon and Michaely (2001), who found using different methods and data that
higher tax rates were actually associated with lower dividend announcement premiums. Much
of the dispute in this literature stems from the lack of sharp, credible variation in tax rates and
dividend behavior. In future work, we plan to examine whether the premium for announcing
dividends fell after the 2003 tax cut.66 In contrast to publicly traded corporations, closely held corporations are not required to publicly report their
accounting balance sheets and dividend payments. Therefore, such a project would require using non-publiccorporate tax return data, available through the Treasury or the Internal Revenue Service.
37

Appendix• Definition of Initiations and Terminations
We define a firm as initiating dividend payments in quarter t if it pays positive regular
dividends in quarter t and did not pay dividends in the previous four quarters (t−1, t−2, t−3,and t − 4). If the firm pays annual dividends in quarter t (or paid such an annual dividend
in quarter t − 5 or t − 6), we require in addition that the firm did not pay any dividends in
quarters t−5 and t−6 as well. We impose this condition to accommodate cases where annualdividend payers change the quarter in which they distribute their annual dividend payments,
which can create 5 or 6 consecutive quarters with no payments but with no materially relevant
interruption in regular dividend payments.
We define a firm as terminating regular dividend payments in quarter t if it pays positive
regular dividends in quarter t−1 and does not pay dividends in the next four quarters (t, t+1,t+2, and t+3).67 Because our data is censored after quarter 2004-Q2, we do not observe the
full vector of future dividend payments for observations from 2003-Q2 to 2004-Q2. To describe
how we handle these cases, let T denote the last quarter available in the data (2004-Q1). In
those cases where t ≥ 2003-Q2, we define a firm as terminating regular dividends if one of the
following three conditions hold: (1) the firm was a quarterly payer in quarter t − 1 and paiddividends in all quarters t−2, t−3, t−4, but does not pay in quarters t to T ; (2) the firm wasa semi-annual payer in quarter t − 1, but does not pay for at least two consecutive quartersstarting in t; or (3) the firm was an annual payer in quarter t−1, but does not pay for at leastfour consecutive quarters starting in t. This definition of termination is the closest prediction
we can obtain of actual terminations that would be observed if the data were not censored.
• Definition of Intensive Increases and Decreases
We define a firm as increasing its regular dividend payment on the intensive margin by
20% in quarter t if two conditions are met: (1) the firm is not initiating payments in quarter
t by the definition given above; (2) regular dividends in quarter t exceed regular dividends in
quarter t− 1 and quarter t− 4 by at least 20%.68 The definition for decreasing dividends by67 In the case of annual payers in quarter t − 1 (or quarters t + 4 or t + 5), we impose in addition that the
firm does not pay any dividends in quarters t+ 4 and t+ 5 as well, for the same reason as above.68The requirement that dividends in quarter t exceed dividends in quarter t − 4 ensures that annual or
semi-annual payers are not artificially classified as increasers every time they make a dividend payment.
38
20% on the intensive margin is analogous. Note that terminations are not counted as decreases
to avoid double counting, given their inclusion in the extensive analysis. Every firm is assigned
a value of 0 for both the increase and decrease dummy variables in their first four quarters
in the sample, since there is inadequate historical information to apply our definition in these
cases. Firms not paying or initiating dividends in period t are always assigned a value of 0
for both dummy variables.
• Supplementary data collected from SEC proxy filings
We collected data on executive stock and option ownership following the definitions in Ex-
ecucomp and large blockholder ownership (>5%) following the definitions in Dlugosz, Fahlen-
brach, Gompers, and Metrick (2004) for 347 additional firms not covered in these datasets.
These firms included 200 firms that initiated dividends between 1998-Q1 and 2004-Q2, for
whom we collected proxy data in the year of initiation. The remaining 147 firms are a ran-
dom sample of the non-initiating firms not covered by one of Execucomp or Dlugosz et. al.
We obtained this sample by randomly drawing the name of 10% of the firms (163 firms) in this
subset, along with a random date between 1998-Q1 and 2004-Q2 for which we collected proxy
data. In constructing the random sample of dates, we required that fifty percent of the dates
were chosen in the post-reform period (after 2003-Q1) given the importance of precision in the
post-reform period. We were unable to obtain proxy statements for 16 of the 163 firms in our
random sample, giving us an ultimate random sample size of 147. The under-representation
of firms in the non-Execucomp, non-Dlugosz, non-initiating group is corrected for in our het-
erogeneity analysis by probability weighting these observations by the sampling probability,
so that they receive more weight in all computations.
39

References
Allen, Franklin and Roni Michaely, 2003, “Payout Policy,” in Constantinides, George, MiltonHarris and Rene Stulz eds. Handbook of the Economics of Finance (Amsterdam: North-Holland)
Auerbach, Alan, 1979, “Wealth maximization and the cost of capital,” Quarterly Journal ofEconomics 93, 433-46.
Auerbach, Alan, 2003, “Taxation and Corporate Financial Policy,” in Auerbach, Alan andMartin Feldstein eds. Handbook of Public Economics, Volume 3, (Amsterdam: North-Holland)
Auerbach, Alan and Kevin Hassett, 2003, “On the Marginal Source of Investment Funds,”Journal of Public Economics 87(1), 205-232.
Auerbach, Alan and Kevin Hassett, 2004, “The Effects of the 2003 Dividend Tax Cut on StockPrices: An Event Study,” unpublished working paper, University of California at Berkeley.
Baker, Malcolm, and Jeffrey Wurgler (2004a), “Appearing and Disappearing Dividends: TheLink to Catering Incentives.” Journal of Financial Economics 73(2), 271-288.
Baker, Malcolm, and Jeffrey Wurgler (2004b), “A Catering Theory of Dividends.” Journal ofFinance 59(3), 1125-1165.
Bernhardt, Dan, J. Fiona Robertson and Ray Farrow, 1994, “Testing Dividend SignalingModels,” Working Paper, Queen’s University.
Bernheim, Douglas and Adam Wantz (1995), “A Tax-Based Test of the Dividend SignallingHypothesis”, American Economic Review 85(3), 532-551.
Blouin, Jennifer, Jana Raedy, and Douglas Shackelford (2004), “Did Dividends Increase Im-mediately after the 2003 Reduction in Tax Rates”, NBER Working Paper No. 10301
Bolster, Paul J. and Vahan Janjigian (1991), “Dividend Policy and Valuation Effects of theTax Reform Act of 1986”, National Tax Journal 44(4), 511-518.
Bradford, David F., 1981, “The incidence and allocation effects of a tax on corporate distrib-utions,” Journal of Public Economics 15, 1-22.
Brav, Alon, John R. Graham, Campbell R. Harvey, and Roni Michaely (2004), “Payout policyin the 21st century”, forthcoming Journal of Financial Economics.
Chetty, Raj and Emmanuel Saez (2004), “Do Dividend Payments Respond to Taxes? Prelim-inary Evidence from the 2003 Dividend Tax Cut”, NBER Working Paper No. 10572.
Cummins, Jason, Kevin A. Hassett, and R. Glenn Hubbard (1994), “A Reconsideration ofInvestment Behavior using Tax Reforms as Natural Experiments”, Brookings Papers on Eco-nomic Activity 25, 1-59.
DeAngelo, Harry, and Linda DeAngelo, 1990, “Dividend policy and financial distress: Anempirical examination of troubled NYSE firms,” Journal of Finance, 45, 1415-1431.
DeAngelo, Harry, Linda DeAngelo, and Doug Skinner, 2000, “Special Dividends and the Evo-lution of Dividend Signaling,” Journal of Financial Economics, pp. 309-354.
DeAngelo, Harry, Linda DeAngelo, and Doug Skinner, 2003, “Are dividends disappearing?Dividend concentration and the consolidation of earnings.” Journal of Financial Economics,
40
forthcoming.
Desai, Mihir and Goolsbee, Austan (2004), “Investment, Capital Overhang and Fiscal Policy”,forthcoming Brookings Papers on Economic Activity.
Dlugosz, Jennifer, Rudiger Fahlenbrach, Paul Gompers, and Andrew Metrick, (2004), “LargeBlocks of Stock: Prevalence, Size, and Measurement”, Wharton Business School WorkingPaper.
Fama, Eugene and Kenneth French, 2001, “Disappearing dividends: Changing firm character-istics or lower propensity to pay”, Journal of Financial Economics 60, 3-43.
Feldstein, Martin, (1970) “Corporate taxation and Dividend Behavior,” Review of EconomicStudies 37, 57-72.
Fenn, George W. and Nellie Liang, 2001, “Corporate payout policy and managerial stockincentives”, em Journal of Financial Economics, 60(1), 45-72.
Goolsbee, Austan (1998), “Taxes, organizational form, and the deadweight loss of the corporateincome tax”, Journal of Public Economics 69(1), 143-152.
Goolsbee, Austan (2004), “The Impact and Inefficiency of the Coporate Income Tax: Evidencefrom State Organizational Form Data,”, Journal of Public Economics 88(11), 2283-2299.
Gordon, Roger H., Laura Kalambokidis, and Joel Slemrod, (2003) “Do We Now Collect AnyRevenue From Taxing Capital Income?,” forthcoming Journal of Public Economics.
Gordon, Roger H. and Young Lee (2001), “Do taxes affect corporate debt policy? Evidencefrom U.S. corporate tax return data” Journal of Public Economics 82(2), 195-224.
Gordon, Roger H., and Jeffrey MacKie-Mason (1990), “Effects of the Tax Reform Act of 1986on Corporate Financial Policy and Organizational Form”, in J. Slemrod, ed., Do Taxes Matter?The Impact of the Tax Reform Act of 1986 (MIT Press: Cambridge), 91-131.
Grullon, Gustavo and Roni Michaely, 2001, “Asymmetric information, agency conflicts andthe impact of taxation on the market reaction to dividend changes,” Working paper, CornellUniversity, Ithaca NY.
Grullon, Gustavo and Roni Michaely, (2002) “Dividends, Share Repurchases, and the Substi-tution Hypothesis”, Journal of Finance, 57(4), 1649-1684.
Jensen, Michael C, 1986, “Agency costs of free cash flow, corporate finance and takeovers,”American Economic Review 76, 323-329.
Julio, Brandon, and David Ikenberry (2004) “Reappearing Dividends”, Working Paper Collegeof Business, University of Illinois.
King, Mervin A., 1977, Public Policy and the Corporation, (Chapman and Hall, London).
Lambert, Richard, William Lanen and David Larcker, 1989, “Executive stock option plansand corporate dividend policy,” Journal of Financial and Quantitative Analysis 24, 409- 425.
LaPorta, Rafael, Florencio Lopez-de-Silanes, Andrei Shleifer, and Robert Vishny, 2000, “Agencyproblems and dividend policies around the world,” Journal of Finance 55(1), 1-33.
Lintner, J., 1956. “Distribution of incomes of corporations among dividends, retained earnings,and taxes,” American Economic Review 46, 97-113.
41

Nam, Jouahn, Jun Wang, and Ge Zhang (2004), “The Impact of Dividend Tax Cut andManagerial Stock Holdings on Firm’s Dividend Policy”, unpublished mimeograph, BaruchCollege.
Perez-Gonzalez, Francisco, 2003, “Large shareholders and dividends: Evidence from U.S. taxreforms”, Working paper, Columbia University.
Poterba, James, 2004, “Corporate Payout Policy”, American Economic Review, 94(2), 171-175.
Poterba, James and Lawrence Summers, 1985 “The Economic Effects of Dividend Taxation”, inE. Altman and M. Subrahmanyam, eds., Recent Advances in Corporation Finance (Homewood,IL: Dow Jones-Irwin), 227-284.
Rajan, Raghuram, Henri Servaes, and Luigi Zingales, 2000, “The cost of diversity; The diver-sification discount and inefficient investment,” Journal of Finance 55, 35-80.
Rozeff, Michael S., 1982, “Growth, beta, and agency costs as determinants of dividend payoutratios”, Journal of Financial Research 5, 249-259.
Saez, Emmanuel (2004). “Reported Incomes and Marginal Tax Rates, 1960-2000: Evidenceand Policy Implications.” in ed. J. Poterba, Tax Policy and the Economy (MIT Press: Cam-bridge), 18, 117-173.
Scharfstein, David and Jeremy Stein, 2000, “The Dark Side of Internal Capital Markets:Divisional Rent-Seeking and Inefficient Investment,” Journal of Finance 55 (6).
Shleifer, Andrei and Robert Vishny, “A Survey of Corporate Governance,” Nobel Symposiumon Law and Finance, August, 1995, Journal of Finance, June 1997.
U.S. Treasury Department, Internal Revenue Service (2003) “Statistics of Income: IndividualIncome Tax Returns 2000”, U.S. Government Printing Office, Washington D.C.
Weisbenner, Scott (2000), “Corporate Share Repurchases in the 1990s: What Role Do StockOptions Play?” Federal Reserve Board Working Paper.
42
010
000
2000
030
000
Div
iden
ds (R
eal 2
004
$ m
il)
82-Q1 86-Q1 90-Q1 94-Q1 98-Q1 02-Q1Quarter
Total Regular and Special Dividends and Top Dividend PayersFigure 1
Proposed Enacted
Total Regular Dividends
Top 20 Regular Payers
Total Special Dividends
010
000
2000
030
000
Div
iden
ds (R
eal 2
004
$ m
il)
82-Q1 86-Q1 90-Q1 94-Q1 98-Q1 02-Q1Quarter
Total Regular and Special Dividends and Top Dividend PayersFigure 1
Proposed Enacted
Total Regular Dividends
Top 20 Regular Payers
Total Special Dividends
This figure depicts aggregate regular dividend payments, aggregate special dividend payments, andtotal regular dividend payments made by the largest 20 regular dividend payers for each quarter from1981-Q3 to 2004-Q2. The sample consists of all firm-quarters in the CRSP database that are nonfinancial, non utility, and non foreign in their last quarter (the “core” sample). Regular dividends aredefined as monthly, quarterly, semi-annual, annual taxable dividends. Regular dividends also includeother and unknown frequency taxable dividends that are followed by regular payments (see text). Spe-cial dividends are defined as special and all remaining other and unknown frequency taxable dividendslisted in CRSP. The solid vertical line (separating quarters 2003-Q2 and 2003-Q3) denotes the timeat which the 2003 tax reform was enacted (end of May 2003). The dashed vertical line (separatingquarters 2002-Q4 and 2003-Q1) denotes the time at which the lower tax rate on dividend income wasproposed and started (retrospectively) to apply.
43

0.2
.4.6
.81
1.2
Per
cent
of T
op 3
807
Firm
s
82-Q1 86-Q1 90-Q1 94-Q1 98-Q1 02-Q1Quarter
InitiationsTerminations
Dividend Initiation and Termination in Top 3807 FirmsFigure 2
0.2
.4.6
.81
1.2
Per
cent
of T
op 3
807
Firm
s
82-Q1 86-Q1 90-Q1 94-Q1 98-Q1 02-Q1Quarter
InitiationsTerminations
Dividend Initiation and Termination in Top 3807 FirmsFigure 2
This figure depicts the fraction of firms initiating and terminating regular dividend payments foreach quarter from 1984-Q1 to 2004-Q2. The data sample consists, in each quarter, of the top 3,807firms (ranked by market capitalization in each quarter) in the CRSP database which are non financial,non utility, and non foreign in their last quarter (constant number of firms sample). Initiation is definedas starting to pay regular dividends after having been in the sample and not paying regular dividendsfor at least four quarters. Termination is defined as stopping to pay regular dividend payments for atleast four quarters. Skipping a dividend payment is not considered a termination (see text for completedetails).
44

0.5
11.
5P
erce
nt o
f Firm
s
84-Q1 88-Q1 92-Q1 96-Q1 00-Q1 04-Q1Quarter
Percent Initiations: regression residuals, top 3807 samplePercent Initiations: means, top 3807 sample
Dividend Initiations Controlling for ObservablesFigure 3
0.5
11.
5P
erce
nt o
f Firm
s
84-Q1 88-Q1 92-Q1 96-Q1 00-Q1 04-Q1Quarter
Percent Initiations: regression residuals, top 3807 samplePercent Initiations: means, top 3807 sample
Dividend Initiations Controlling for ObservablesFigure 3
This figure depicts the fraction of firms initiating dividend payments with and without controlvariables for each quarter from 1984-Q1 to 2003-Q4 . In the case with no controls, the data sampleconsists as in Figure 2 of the firms in the constant number of firms sample. The no-controls curve reportsthe fraction of those firms initiating dividend payments. In the case with controls, the data sample issame with the additional requirement that variables assets, after-tax profits, cash from Compustat areavailable. The regression residuals curve reports the quarter dummy coefficients of an OLS regressionof the initiation dummy on a full set of quarter dummies, dummies for first digit industry code, assets,and levels and eight quarterly lags of after-tax profits/assets, marketcap/assets, and cash/assets (seespecification (2) in text).
45

05
1015
20N
o. o
f Ini
tiato
rs
Jan Feb Mar Apr May Jun Jul Aug Sep Oct Nov Dec
Regular Dividend Initiations Per Month 2001-2004Figure 4
2001 20022003 2004
Tax Cut Enacted in 2003
05
1015
20N
o. o
f Ini
tiato
rs
Jan Feb Mar Apr May Jun Jul Aug Sep Oct Nov Dec
Regular Dividend Initiations Per Month 2001-2004Figure 4
2001 20022003 2004
Tax Cut Enacted in 2003
This figure depicts the number of firms initiating dividend payments for each month from January2001 to June 2004. The data sample consists as in Figure 2, in each month, of the top 3,807 firms(ranked by market capitalization in each corresponding quarter) in the CRSP database which are nonfinancial, non utility, and non foreign in their last quarter (constant number of firms sample). Initiationis defined as starting to pay regular dividends after having been in the sample and not paying regulardividends for at least four quarters (see text for complete details).
46

.8.8
5.9
.95
Div
iden
d Ta
x Pr
efer
ence
1520
2530
3540
Per
cent
of F
irms
82-Q1 86-Q1 90-Q1 94-Q1 98-Q1 02-Q1Quarter
Percent Regular Payers (top 3807 firms)Dividend Tax Preference
Fraction of Top 3807 Firms Paying DividendsFigure 5
.8.8
5.9
.95
Div
iden
d Ta
x Pr
efer
ence
1520
2530
3540
Per
cent
of F
irms
82-Q1 86-Q1 90-Q1 94-Q1 98-Q1 02-Q1Quarter
Percent Regular Payers (top 3807 firms)Dividend Tax Preference
Fraction of Top 3807 Firms Paying DividendsFigure 5
This figure depicts the fraction of firms paying regular dividend payments for each quarter from1984-Q1 to 2004-Q2 (with scale on the left vertical axis). The data sample consists, in each quarter,of the top 3,807 firms (ranked by market capitalization in each quarter) in the CRSP database whichare non financial, non utility, and non foreign in their last quarter (constant number of firms sample).Regular dividends are defined as monthly, quarterly, semi-annual, annual taxable dividends. Regulardividends also include other and unknown frequency taxable dividends which are followed by regularpayments (see text). The figure also depicts (with scale on the right vertical axis) the dividend taxpreference parameter from Poterba (2004). This parameter is defined as the dollar weighted averageacross all investors (individuals and institutional) of (1− τdiv)/(1− τ cg) where τdiv is the marginal taxrate on dividend income and τ cg the average marginal tax rate on capital gains in the U.S. economy.
47

3040
5060
7080
Per
cent
of
Firm
s (to
p 10
00)
1520
2530
3540
Per
cent
of F
irms
(cor
e sa
mpl
e)
82-Q1 86-Q1 90-Q1 94-Q1 98-Q1 02-Q1Quarter
Core SampleTop 1000 Firms (right scale)
Fraction of Firms Paying Dividends (core sample and top 1000 firms)Figure 6a
3040
5060
7080
Per
cent
of
Firm
s (to
p 10
00)
1520
2530
3540
Per
cent
of F
irms
(cor
e sa
mpl
e)
82-Q1 86-Q1 90-Q1 94-Q1 98-Q1 02-Q1Quarter
Core SampleTop 1000 Firms (right scale)
3040
5060
7080
Per
cent
of
Firm
s (to
p 10
00)
1520
2530
3540
Per
cent
of F
irms
(cor
e sa
mpl
e)
82-Q1 86-Q1 90-Q1 94-Q1 98-Q1 02-Q1Quarter
Core SampleTop 1000 Firms (right scale)
Fraction of Firms Paying Dividends (core sample and top 1000 firms)Figure 6a
4000
4500
5000
5500
6000
Num
ber i
n S
ampl
e
050
010
0015
0020
00N
umbe
r of P
ayer
s
82-Q1 86-Q1 90-Q1 94-Q1 98-Q1 02-Q1Quarter
Number of Regular Payers
Number of Special Payers
Number of Firms in Sample (right scale)
Number of Firms and Number of Payers Paying Dividends (core sample)Figure 6b
4000
4500
5000
5500
6000
Num
ber i
n S
ampl
e
050
010
0015
0020
00N
umbe
r of P
ayer
s
82-Q1 86-Q1 90-Q1 94-Q1 98-Q1 02-Q1Quarter
Number of Regular Payers
Number of Special Payers
Number of Firms in Sample (right scale)
Number of Firms and Number of Payers Paying Dividends (core sample)Figure 6b
4000
4500
5000
5500
6000
Num
ber i
n S
ampl
e
050
010
0015
0020
00N
umbe
r of P
ayer
s
82-Q1 86-Q1 90-Q1 94-Q1 98-Q1 02-Q1Quarter
Number of Regular Payers
Number of Special Payers
Number of Firms in Sample (right scale)
Number of Firms and Number of Payers Paying Dividends (core sample)Figure 6b
Panel A depicts the fraction of firms paying regular dividend payments for each quarter from 1982-Q1 to 2004-Q2. In the first curve, the sample consists, in each quarter, of all firms in the CRSPdatabase which are non financial, non utility, and non foreign in their last quarter (core sample). Inthe second curve, the sample of firms is limited to the top 1,000 firms ranked in each quarter by marketcapitalization. Regular dividends are defined as in Figure 1.Panel B depicts the total number of firms (right scale) and the number of regular dividend payers
and special dividend payers (left scale) for each quarter from 1982-Q1 to 2004-Q2. For all three curves,the data sample consists, in each quarter, of all firms in the core sample.
48
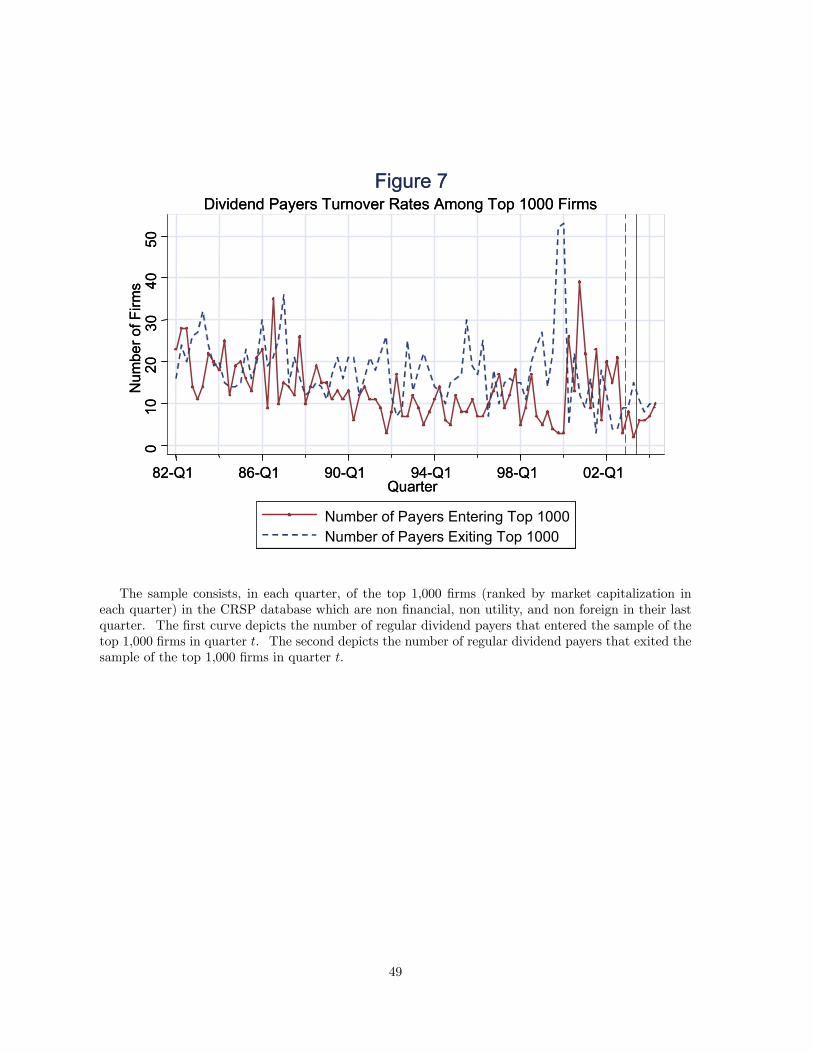
010
2030
4050
Num
ber o
f Firm
s
82-Q1 86-Q1 90-Q1 94-Q1 98-Q1 02-Q1Quarter
Number of Payers Entering Top 1000Number of Payers Exiting Top 1000
Dividend Payers Turnover Rates Among Top 1000 FirmsFigure 7
010
2030
4050
Num
ber o
f Firm
s
82-Q1 86-Q1 90-Q1 94-Q1 98-Q1 02-Q1Quarter
Number of Payers Entering Top 1000Number of Payers Exiting Top 1000
Dividend Payers Turnover Rates Among Top 1000 FirmsFigure 7
The sample consists, in each quarter, of the top 1,000 firms (ranked by market capitalization ineach quarter) in the CRSP database which are non financial, non utility, and non foreign in their lastquarter. The first curve depicts the number of regular dividend payers that entered the sample of thetop 1,000 firms in quarter t. The second depicts the number of regular dividend payers that exited thesample of the top 1,000 firms in quarter t.
49
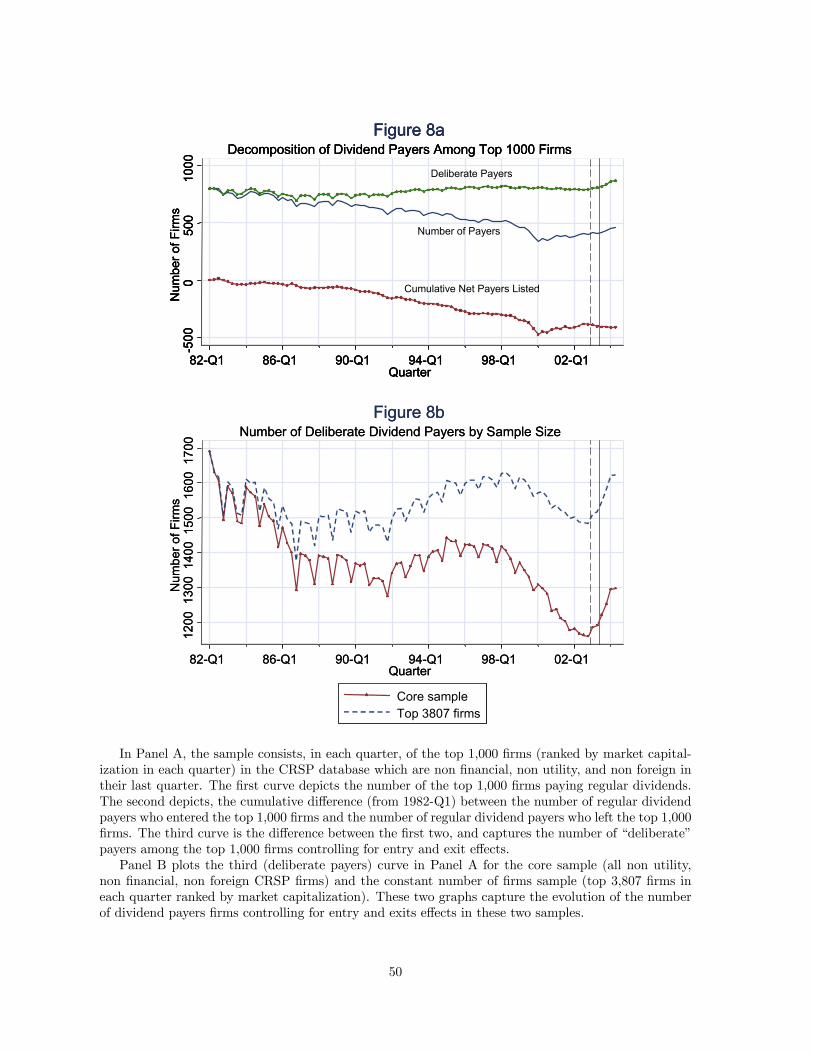
-500
050
010
00N
umbe
r of F
irms
82-Q1 86-Q1 90-Q1 94-Q1 98-Q1 02-Q1Quarter
Number of Payers
Cumulative Net Payers Listed
Deliberate Payers
Decomposition of Dividend Payers Among Top 1000 FirmsFigure 8a
-500
050
010
00N
umbe
r of F
irms
82-Q1 86-Q1 90-Q1 94-Q1 98-Q1 02-Q1Quarter
Number of Payers
Cumulative Net Payers Listed
Deliberate Payers
Decomposition of Dividend Payers Among Top 1000 FirmsFigure 8a
-500
050
010
00N
umbe
r of F
irms
82-Q1 86-Q1 90-Q1 94-Q1 98-Q1 02-Q1Quarter
Number of Payers
Cumulative Net Payers Listed
Deliberate Payers
Decomposition of Dividend Payers Among Top 1000 FirmsFigure 8a
1200
1300
1400
1500
1600
1700
Num
ber o
f Firm
s
82-Q1 86-Q1 90-Q1 94-Q1 98-Q1 02-Q1Quarter
Core sampleTop 3807 firms
Number of Deliberate Dividend Payers by Sample SizeFigure 8b
1200
1300
1400
1500
1600
1700
Num
ber o
f Firm
s
82-Q1 86-Q1 90-Q1 94-Q1 98-Q1 02-Q1Quarter
Core sampleTop 3807 firms
Number of Deliberate Dividend Payers by Sample SizeFigure 8b
In Panel A, the sample consists, in each quarter, of the top 1,000 firms (ranked by market capital-ization in each quarter) in the CRSP database which are non financial, non utility, and non foreign intheir last quarter. The first curve depicts the number of the top 1,000 firms paying regular dividends.The second depicts, the cumulative difference (from 1982-Q1) between the number of regular dividendpayers who entered the top 1,000 firms and the number of regular dividend payers who left the top 1,000firms. The third curve is the difference between the first two, and captures the number of “deliberate”payers among the top 1,000 firms controlling for entry and exit effects.Panel B plots the third (deliberate payers) curve in Panel A for the core sample (all non utility,
non financial, non foreign CRSP firms) and the constant number of firms sample (top 3,807 firms ineach quarter ranked by market capitalization). These two graphs capture the evolution of the numberof dividend payers firms controlling for entry and exits effects in these two samples.
50

0.5
11.
52
2.5
3P
erce
nt o
f Top
380
7 Fi
rms
82-Q1 86-Q1 90-Q1 94-Q1 98-Q1 02-Q1Quarter
Intensive Margin Dividend IncreasesIntensive Margin Dividend Decreases
Intensive Margin: Dividend Increases and Decreases in Top 3807 FirmsFigure 9a
0.5
11.
52
2.5
3P
erce
nt o
f Top
380
7 Fi
rms
82-Q1 86-Q1 90-Q1 94-Q1 98-Q1 02-Q1Quarter
Intensive Margin Dividend IncreasesIntensive Margin Dividend Decreases
Intensive Margin: Dividend Increases and Decreases in Top 3807 FirmsFigure 9a
01
23
4P
erce
nt o
f Firm
s
84-Q1 88-Q1 92-Q1 96-Q1 00-Q1 04-Q1Quarter
Percent Increases (>20%): regression residuals, top 3807 samplePercent Increases (>20%): means, top 3807 sample
Dividend Increases Controlling for ObservablesFigure 9b
01
23
4P
erce
nt o
f Firm
s
84-Q1 88-Q1 92-Q1 96-Q1 00-Q1 04-Q1Quarter
Percent Increases (>20%): regression residuals, top 3807 samplePercent Increases (>20%): means, top 3807 sample
Dividend Increases Controlling for ObservablesFigure 9b
Panel A depicts the fraction of firms increasing and decreasing regular dividend payments by morethan 20% in a given quarter in the constant number of firms sample. An increase in dividend paymentsby 20% in quarter t occurs when the firm (1) does not initiate dividend payments in quarter t, (2)pays dividends in quarter t larger in real terms by 20% than dividends paid in quarters t− 1 and t− 4.Decreases in dividends payments are defined in an analogous way. (see text for further details).Panel B depicts the fraction of firms increasing dividend payments in the core sample without
controls (as in Panel A), and the corresponding curve controlling for covariates. In the case withcontrols, the sample is the set of firms that satisfy the additional requirement that assets, post-taxprofits, market to book ratios, and cash from Compustat are available. The regression residuals curvereports the quarter dummy coefficients of an OLS regression of the >20% increase dummy on a full setof quarter dummies, dummies for first digit industry code, assets, and levels and eight quarterly lagsof after-tax profits/assets, marketcap/assets, and cash/assets (see specification (2) in text).
51

0.5
1D
ivid
ends
(Rea
l ind
ex =
1 in
199
8-Q
1)
98-Q1 99-Q1 00-Q1 01-Q1 02-Q1 03-Q1 04-Q1Quarter
80th
90th
95th
98th
99.5th
Percentiles of Dividend Distribution, base 1998-Q1 (top 3807 firms)Figure 10
0.5
1D
ivid
ends
(Rea
l ind
ex =
1 in
199
8-Q
1)
98-Q1 99-Q1 00-Q1 01-Q1 02-Q1 03-Q1 04-Q1Quarter
80th
90th
95th
98th
99.5th
Percentiles of Dividend Distribution, base 1998-Q1 (top 3807 firms)Figure 10
This figure depicts various percentiles of the regular dividend distribution at each quarter from1998-Q1 to 2004-Q2. The zeros (non dividend payers) are included in the distribution. The percentilesare normalized so that they are all equal to one in 1998-Q1. The sample consists, in each quarter, ofthe top 3,807 firms (ranked by market capitalization in each quarter) in the CRSP database which arenon financial, non utility, and non foreign in their last quarter (constant number of firms sample).
52

0.5
11.
52
2.5
Per
cent
of T
op 3
807
Firm
s
82-Q1 86-Q1 90-Q1 94-Q1 98-Q1 02-Q1Quarter
Special Dividend PayersFigure 11
0.5
11.
52
2.5
Per
cent
of T
op 3
807
Firm
s
82-Q1 86-Q1 90-Q1 94-Q1 98-Q1 02-Q1Quarter
Special Dividend PayersFigure 11
This figure shows the fraction of firms paying special dividends. Special dividends are defined asspecial and all remaining other and unknown frequency taxable dividends listed in CRSP. The sampleconsists, in each quarter, of the top 3,807 firms (ranked by market capitalization in each quarter) inthe CRSP database which are non financial, non utility, and non foreign in their last quarter (constantnumber of firms sample).
53

025
050
075
010
00In
itiat
ions
($ m
il)
90-Q1 92-Q1 94-Q1 96-Q1 98-Q1 00-Q1 02-Q1 04-Q1Quarter
Dividends from InitiationsChange in Intensive Margin Dividends
Change in Dividend Amounts on Intensive and Extensive MarginsFigure 12a
025
050
075
010
00In
itiat
ions
($ m
il)
90-Q1 92-Q1 94-Q1 96-Q1 98-Q1 00-Q1 02-Q1 04-Q1Quarter
Dividends from InitiationsChange in Intensive Margin Dividends
Change in Dividend Amounts on Intensive and Extensive MarginsFigure 12a
050
0010
000
1500
020
000
Inte
nsiv
e M
argi
n ($
mil)
050
010
0015
0020
00In
itiat
ions
and
Spe
cial
s ($
mil)
90-Q1 92-Q1 94-Q1 96-Q1 98-Q1 00-Q1 02-Q1 04-Q1Quarter
Cumulated Dividendsfrom Initiations
Special Dividends
Cumulated Intensive Margin Dividends (right scale)
Cumulated Intensive, Extensive, and Special Dividend AmountsFigure 12b
050
0010
000
1500
020
000
Inte
nsiv
e M
argi
n ($
mil)
050
010
0015
0020
00In
itiat
ions
and
Spe
cial
s ($
mil)
90-Q1 92-Q1 94-Q1 96-Q1 98-Q1 00-Q1 02-Q1 04-Q1Quarter
Cumulated Dividendsfrom Initiations
Special Dividends
Cumulated Intensive Margin Dividends (right scale)
Cumulated Intensive, Extensive, and Special Dividend AmountsFigure 12b
The sample consists of those firms in the constant number of firms sample that did not acquireanother company in previous quarter. Panel A depicts the amounts (in real 2004 dollars) of regulardividends initiated in each quarter and the change in regular dividends on the intensive margin forfirms paying regular dividends both in the current and previous quarter (initiations and terminationsare excluded from this series).Panel B depicts the cumulated (from 1990-Q1) amounts of regular dividend initiations (integral
of the initiation graph in Panel A) and the amounts of special dividends on the left scale. It alsoshows the cumulated amounts (from 1990-Q1) of regular dividend intensive changes on the right scale(integral of the change in intensive margin dividends in Panel A).
54

0.5
11.
5Fr
actio
n In
itiat
ing
(per
cent
)
94-Q1 96-Q1 98-Q1 00-Q1 02-Q1 04-Q1Quarter
Fraction Init.: Canada Fraction Init.: US
Fraction of Initiations in Canada and the United StatesFigure 13
0.5
11.
5Fr
actio
n In
itiat
ing
(per
cent
)
94-Q1 96-Q1 98-Q1 00-Q1 02-Q1 04-Q1Quarter
Fraction Init.: Canada Fraction Init.: US
Fraction of Initiations in Canada and the United StatesFigure 13
This figure depicts the fraction of firms initiating dividend payments in Canada and the UnitedStates. For Canada, the sample consists of Compustat Canada firms which are non financial, nonutility, and incorporated in Canada in the last quarter and which remain in the sample from 1994-Q1and 2004-Q2. For the United States, the data sample consists of CRSP firms which are non financial,non utility, and non foreign in the last quarter and which remain in the sample from 1994-Q1 and2004-Q2. Initiation of dividends is defined as in Figure 2.
55

02
46
810
Per
cent
of F
irms
Initi
atin
g pe
r Yea
r
<0.21% 0.21-0.73% 0.73-2.4% 2.4-9.3% >9.3%
Effect of Tax Cut on Initiations: Breakdown by Executive OwnershipFigure 14a
Pre-reform Post-reform
Percentage of Outstanding Shares Held by Top Executives
02
46
810
Per
cent
of F
irms
Initi
atin
g pe
r Yea
r
<0.21% 0.21-0.73% 0.73-2.4% 2.4-9.3% >9.3%
Effect of Tax Cut on Initiations: Breakdown by Executive OwnershipFigure 14a
Pre-reform Post-reform
Percentage of Outstanding Shares Held by Top Executives
02
46
8P
erce
nt o
f Firm
s In
itiat
ing
per Y
ear
<0.3% 0.3-0.6% 0.6-1% 1-15% >15%
Effect of Tax Cut on Initiations: Breakdown by Executive Option HoldingsFigure 14b
Pre-reform Post-reform
Largest Option Holding among Executives (percentage of outstanding shares)
02
46
8P
erce
nt o
f Firm
s In
itiat
ing
per Y
ear
<0.3% 0.3-0.6% 0.6-1% 1-15% >15%
Effect of Tax Cut on Initiations: Breakdown by Executive Option HoldingsFigure 14b
Pre-reform Post-reform
Largest Option Holding among Executives (percentage of outstanding shares)
In both panels, the sample consists of all firms present in CRSP in each quarter from 1998-Q1 to2004-Q2. All firms-quarters (i, t) for which firm i paid regular dividends in any of the previous fourquarters (t − 1, t − 2, t − 3, t − 4) are discarded from the sample (to focus only on firms not payingdividends previously).Panel A depicts the percentage of firms initiating dividends at an annualized rate pre-reform (from
1998-Q1 to 2002-Q4) and post-reform (from 2003-Q1 to 2004-Q2) by quintiles of executive ownership.Executive ownership is defined by the share of the company owned by the executive with the largestshare ownership. Executive share ownership is obtained from Execucomp data or directly collectedfrom SEC proxy filings, as described in the appendix. The horizontal axis shows, for each quintile, thepercentage range of shares owned by the largest executive owner.Panel B depicts the percentage of firms initiating dividends (as in Panel A) by analogous quintiles of
executive option holding. Executive option holding is defined by the fraction of shares of the companyowned in the form of unexercisable stock-options (options which have been granted but are not yetvested and hence cannot yet be exercised) by the executive who has the largest unexercisable optionsholdings.
56

02
46
810
Per
cent
of F
irms
Initi
atin
g pe
r Yea
r
<10% 10-26% 26-47% 47-70% >70%
Effect of Tax Cut on Initiations: Breakdown by Institutional OwnershipFigure 15a
Pre-reform Post-reform
Percentage of Outstanding Shares Held by Institutional Investors
02
46
810
Per
cent
of F
irms
Initi
atin
g pe
r Yea
r
<10% 10-26% 26-47% 47-70% >70%
Effect of Tax Cut on Initiations: Breakdown by Institutional OwnershipFigure 15a
Pre-reform Post-reform
Percentage of Outstanding Shares Held by Institutional Investors
02
46
8P
erce
nt o
f Firm
s In
itiat
ing
per Y
ear
Low Inst-No Dir Low Inst-Has Dir High Inst-No Dir High Inst-Has Dir
Effect of Tax Cut on Initiations: Breakdown by Large Ownership GroupsFigure 15b
Pre-reform Post-reform
02
46
8P
erce
nt o
f Firm
s In
itiat
ing
per Y
ear
Low Inst-No Dir Low Inst-Has Dir High Inst-No Dir High Inst-Has Dir
Effect of Tax Cut on Initiations: Breakdown by Large Ownership GroupsFigure 15b
Pre-reform Post-reform
For both panels, the sample is the same as in Figure 14. Panel A depicts the percentage of firmsinitiating dividends at an annualized rate pre-reform (from 1998-Q1 to 2002-Q4) and post-reform (from2003-Q1 to 2004-Q2) by quintiles of institutional share ownership. Institutional share ownership (fromthe Thomson financial database) is defined as the fraction of the firm owned by institutions such asmutual funds. The horizontal axis depicts, for each quintile, the percentage range of institutional shareownership.Panel B breaks down the initiation rates by institutional ownership and large-shareholding in-
dependent directors. The “low inst” category consists of all firms with below-median institutionalshareholding during sample period, and the “high inst” category consists of the rest. The “No Dir”category contains firms that do not have a large-shareholding independent director on their board; the“Has Dir” category contains the rest of the firms. The figure shows pre- and post-reform initiationrates for the four categories of firms across these two dimensions. Large-shareholding independentdirectors are defined as individuals on the board of directors who own at least 5% of the company andwho are not officers. Data on large shareholders is obtained from the Dlugosz, Fahlenbrach, Gompers,and Metrick (2004) database and also supplemented by data from SEC proxy statements as describedin the appendix.
57

05
1015
Per
cent
of F
irms
Initi
atin
g pe
r Yea
r
<11% 11-25% 25-43% 43-88% >88%
Effect of Tax Cut on Initiations: Breakdown by Expected Earnings GrowthFigure 16
Pre-reform Post-reform
Two-year Forecasted Earnings Growth
05
1015
Per
cent
of F
irms
Initi
atin
g pe
r Yea
r
<11% 11-25% 25-43% 43-88% >88%
Effect of Tax Cut on Initiations: Breakdown by Expected Earnings GrowthFigure 16
Pre-reform Post-reform
Two-year Forecasted Earnings Growth
This figure depicts the percentage of firms initiating dividends at an annualized rate pre-reform (from1998-Q1 to 2002-Q4) and post-reform (from 2003-Q1 to 2004-Q2) by quintiles of expected earningsgrowth. The sample is the same as in Figures 14. Expected earnings growth is defined using I/B/E/Sdata on analysts’ earnings forecasts as follows. We first compute the expected change in earnings pershare as the mean earnings per share forecast for a two year forecast period minus the actual earningsper share in the current year. We then multiply this figure by the total number of shares outstandingand divide by total assets to arrive at a normalized measure of earnings growth per dollar of assets.The five quintiles of earnings growth are defined over the sample of firm-quarter pairs (therefore, thequintiles are not constant overtime). The horizontal axis depicts, for each quintile, the percentage rangeof earnings growth forecast.
58

010
000
2000
030
000
4000
0500
00A
mou
nts
(Rea
l 200
4 $
mil)
84-Q1 88-Q1 92-Q1 96-Q1 00-Q1 04-Q1Quarter
Dividend Amounts Share Repurchases Amounts
Aggregate Dividends and Share RepurchasesFigure 17a
010
000
2000
030
000
4000
0500
00A
mou
nts
(Rea
l 200
4 $
mil)
84-Q1 88-Q1 92-Q1 96-Q1 00-Q1 04-Q1Quarter
Dividend Amounts Share Repurchases Amounts
Aggregate Dividends and Share RepurchasesFigure 17a
500
1000
1500
2000
Num
ber o
f Firm
s
84-Q1 88-Q1 92-Q1 96-Q1 00-Q1 04-Q1Quarter
Dividend Payers Share Repurchasers (.1%+)
Number of Dividend Payers and Share RepurchasesFigure 17b
500
1000
1500
2000
Num
ber o
f Firm
s
84-Q1 88-Q1 92-Q1 96-Q1 00-Q1 04-Q1Quarter
Dividend Payers Share Repurchasers (.1%+)
Number of Dividend Payers and Share RepurchasesFigure 17b
Panel A shows total regular dividend payments and total share repurchases (in real 2004-Q1 dollars).For regular dividends, the sample consists of all firm-quarters in the CRSP database which are nonfinancial, non utility, and non foreign in their last quarter (core sample). For share repurchases, thesample is same as above but with the additional requirement that the firm appears in the quarterlycompustat database and that the compustat variable share repurchase (item data93 in quarterly file:purchases of common and preferred stock) exists.Panel B depicts the total number of firms making regular dividend payments and total number of
firms repurchasing at least 0.1% of their shares from 1984-Q1 to 2004-Q2. The sample is the same asin Panel A.
59

1520
2530
3540
4550
55P
erce
nt o
f Firm
s
00-Q1 01-Q1 02-Q1 03-Q1 04-Q1Quarter
Fraction of Dividend Payers and Share Repurchases (High Ownership Sample)Figure 18a
Payers
Share Repurchasers (0.1%+)
Dividend Payers
1520
2530
3540
4550
55P
erce
nt o
f Firm
s
00-Q1 01-Q1 02-Q1 03-Q1 04-Q1Quarter
Fraction of Dividend Payers and Share Repurchases (High Ownership Sample)Figure 18a
Payers
Share Repurchasers (0.1%+)
Dividend Payers
050
010
0015
0020
0025
00M
illion
s of
Dol
lars
00-Q1 01-Q1 02-Q1 03-Q1 04-Q1Quarter
Dividend AmountsShare Repurchases Amounts
Dividend and Share Repurchase Amounts (Firms initiating after 2003)Figure 18b
050
010
0015
0020
0025
00M
illion
s of
Dol
lars
00-Q1 01-Q1 02-Q1 03-Q1 04-Q1Quarter
Dividend AmountsShare Repurchases Amounts
Dividend and Share Repurchase Amounts (Firms initiating after 2003)Figure 18b
Panel A depicts the fraction of regular dividend payers and the fractions of firms either payingregular dividends or repurchasing at least 0.1% of their shares for each quarter from 1998-Q1 to 2004-Q1. The sample consists of all firms in the core sample that are alive in all quarters from 1998-Q1 to2004-Q1 and have one or more top executives who own at least 20% of their company’s shares.Panel B depicts the amount of regular dividends paid and the amount of share repurchases for the
set of firms in the core sample who initiate regular dividend payments after the 2003 reform (between2003-Q1 to 2004-Q2), and which have Compustat data on share repurchases. Microsoft is excludedfrom the sample in order to obtain smoother series that are not driven by an outlier.
60
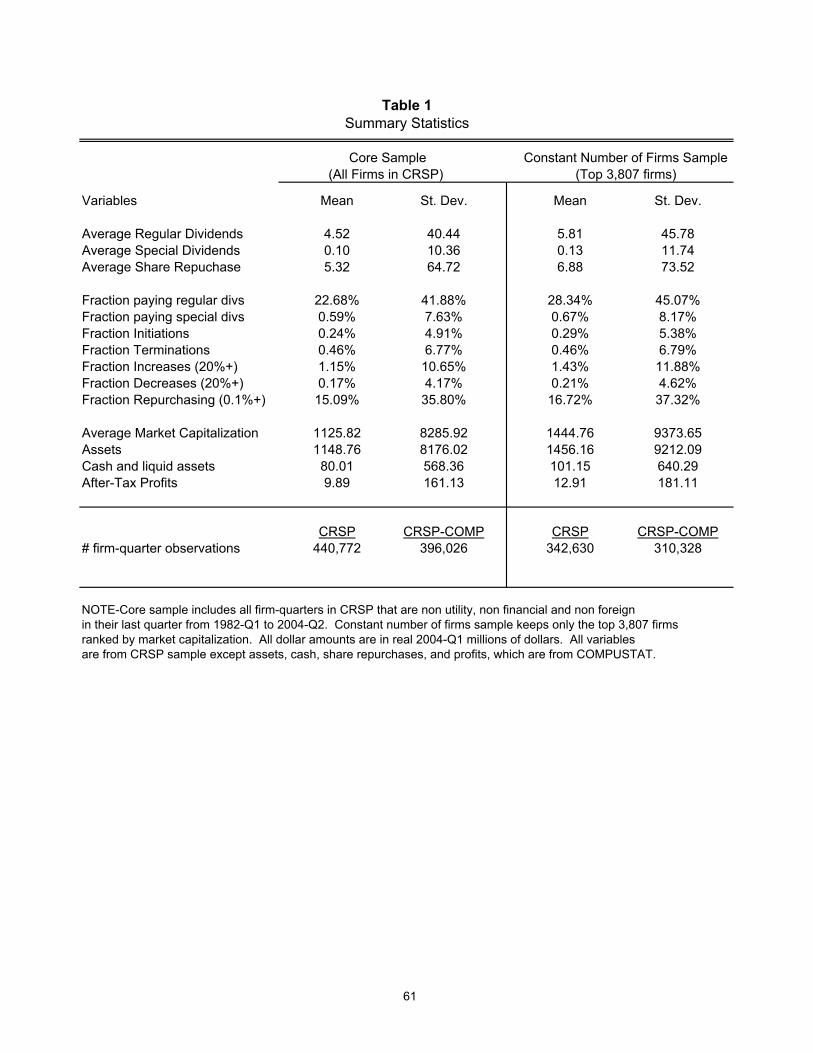
Variables Mean St. Dev. Mean St. Dev.
Average Regular Dividends 4.52 40.44 5.81 45.78Average Special Dividends 0.10 10.36 0.13 11.74Average Share Repuchase 5.32 64.72 6.88 73.52
Fraction paying regular divs 22.68% 41.88% 28.34% 45.07%Fraction paying special divs 0.59% 7.63% 0.67% 8.17%Fraction Initiations 0.24% 4.91% 0.29% 5.38%Fraction Terminations 0.46% 6.77% 0.46% 6.79%Fraction Increases (20%+) 1.15% 10.65% 1.43% 11.88%Fraction Decreases (20%+) 0.17% 4.17% 0.21% 4.62%Fraction Repurchasing (0.1%+) 15.09% 35.80% 16.72% 37.32%
Average Market Capitalization 1125.82 8285.92 1444.76 9373.65Assets 1148.76 8176.02 1456.16 9212.09Cash and liquid assets 80.01 568.36 101.15 640.29After-Tax Profits 9.89 161.13 12.91 181.11
CRSP CRSP-COMP CRSP CRSP-COMP# firm-quarter observations 440,772 396,026 342,630 310,328
NOTE-Core sample includes all firm-quarters in CRSP that are non utility, non financial and non foreignin their last quarter from 1982-Q1 to 2004-Q2. Constant number of firms sample keeps only the top 3,807 firms ranked by market capitalization. All dollar amounts are in real 2004-Q1 millions of dollars. All variablesare from CRSP sample except assets, cash, share repurchases, and profits, which are from COMPUSTAT.
(All Firms in CRSP) (Top 3,807 firms)
Table 1Summary Statistics
Core Sample Constant Number of Firms Sample
61

(1) (2) (3) (4) (5) (6)
Company Name Industry
Market Cap Rank in 2004-
Q2Market Cap. at Initiation ($mil)
Dividends in first year
($mil)
Annual Dividend
Yield
1. Microsoft Software 2 260,047 2610 1.00%2. Viacom Entertainment 28 67,162 392 0.58%3. Qualcomm Wireless Equipment 31 28,962 192 0.66%4. Clear Channel Com. Radio, Television 73 26,769 244 0.91%5. Guidant Medical Equipment 94 13,144 112 0.85%6. Costco Wholesale Discount Stores 96 17,728 182 1.03%7. Analog Devices Semiconductors 98 17,315 74 0.43%8. Best Buy Electronic Stores 100 18,764 196 1.04%
All dividend payers among top 100 companies 1.98%
NOTE-The table lists all the companies among the top 100 (ranked by market capitalizationin 2004-Q2) in the CRSP non financial, non utility, non foreign data which have initiated regular dividend payments from2003-Q1 to 2004-Q2.Annual dividend yield and annual dividends based on payments made during first four quarters after initiation.(payments are extrapolated based on current payments if less than 4 quarters of data are availableafter initiation). Average yield among top 100 companies is not weighted by market capitalization.
Post Reform Initiations among Top 100 Largest CompaniesTable 2
62

Pre-reform Post-reform Change
(01-Q3 - 02-Q4) (03-Q1- 04-Q2) with Controls
(1) (2) (3) (4)
# Regular dividend Initiations per quarter 4.33 29.00 24.67 26.82
(0.85) (2.19) (2.32) (2.87)
# Regular dividend increases (>20%) 19.00 49.83 30.83 29.66
(1.78) (2.86) (3.22) (3.83)
# Special dividend payers 6.83 17.83 11.00 9.50
(1.07) (1.72) (2.03) (2.30)
Change in regular dividends (per quarter) 13.22 205.39 192.17 232.39
due to initiations (real $ mil) (4.83) (48.35) (48.51) (66.34)
Change in regular dividends (per quarter) 126.65 739.48 612.82 560.70
due to intensive margin (real $ mil) (99.26) (127.43) (167.81) (217.01)
Special dividend amounts (per quarter) 112.50 729.94 617.44 371.21
(real $ mil) (45.98) (151.40) (203.48) (233.99)
This table reports the average value pre-reform (6 quarters from 2001-Q3 to 2002-Q4) and post-reform (from2003-Q1 to 2004-Q2), as well as the change post-pre reform (with no controls and with controls) for a number ofvariables of interest. The change with controls is obtained from an OLS regression including assets, levels andeight lags of profits/assets, cash/assets, mktcap/assets, and SIC dummies, as in specification (2) in the text. Standard errors are reported in parenthesis below the estimates. The sample is the top 3,807 firms in CRSP (ranked bymarket capitalization) in each quarter (excluding utilities, financial, and foreign). The number of regular dividend initiations is defined as firms starting to pay regular dividends after not having paid for 4 quarters (6 quarters if annual payer).The number of regular dividend increases is defined as those firms increasing regular dividend payments by at least 20% in nominal terms in quarter t (relative to the previous dividend payment). Dividend initiations are not counted as intensive increases or decreases. Change in regular dividends due to initiations defined as the dividend amount (normalized toquarterly) for regular dividend initiators. Change in regular dividends due to intensive margin defined as the change in dividend amount (normalized to quarter and relative to previous regular dividend payment) for firms paying dividends.
Table 3
Change
Summary of Results
63

Control Treatment Difference(Not Affected) (Affected) bet. Groups
(1) (2) (3)
Fraction payers 31.23% 27.24% -3.99%
Pre-reform 1.10 0.83 -0.27(1998-Q1 to 2002-Q4) (0.60) (0.16) (0.64)# obs. 1,822 27,977
Post-reform 1.02 5.11 4.09(2003-Q1 to 2004-Q2) (1.32) (0.28) (2.28)# obs. 394 8,065
Difference: -0.08 4.28 4.36Post-Pre (1.48) (0.32) (1.48)
NOTE-The sample is all CRSP firms present in all quarters from 1998-Q1 to 2004-Q2(excluding utilities, financial, and foreign).Control group (not affected) is defined as the firms whose largest institutionalowner is not affected by the reform (either a pension fund, an insurance company,a nonprofit organization, a non-financial corporation, or a government agency).The treatment group (affected) are all other firms.The table displays in row 1 the fraction of regular dividend payers among the two groups(average over the period).The table displays the annual regular dividend initiation rate (among non payers) per quarterbefore and after the reform for the two groups as well as the difference betweengroups and before and after the reform. Standard errors are in parenthesis.
Initiation Rates by Tax Status of Largest Institutional HolderTable 4
64

Interaction of Executive Incentives
Largest ShareholdingAmong Top Executives
< 0.5% 0.5-3.3% > 3.3%
Largest Unexercisable < 0.5% 5.00 3.31 11.42Option Holding 0.5-1.2% 4.95 2.76 7.04
Among Executives > 1.2% 1.58 4.65 6.38
Interaction between Agents and Principals
Percentage of Shares Held by Institutional Investors
< 35% 35-63% > 63%
Largest Shareholding <0.5% 1.21 1.24 6.66Among Top 0.5-3.3% 1.35 0.30 9.34Executives >3.3% 7.12 6.19 10.94
The tables report the annual dividend initiation rate after the reform (from 2003-Q1 to 2004-Q2) for firms alive from 1998-Q1 to 2004-Q2 in various groups. Groups are definedby size of option holdings and executive ownership in Panel A and executive ownershipand institutional ownership in Panel B. See Figures 14 and 15 for description of sampleand variable definitions.
Table 5a
Post-Reform Annual Initiation Rate by Share and Option Holding Groups
Table 5b
Post-Reform Annual Initiation Rate by Executive and Institutional Shareholding
65

(1) (2) (3) (4) (5) (6) (7) (8) (9) (10) (11) (12) (13) (14) (15) (16) (17) (18) (19) (20) (21)
Quarter
Poterba (2004) tax
pref. CPI
Regular dividends
($ mn)
Special dividends
($ mn)
Share repurchases
($ mn)Market Capit.
($ bn) # firms
# regular dividend payers
# special payers
# initiations
# terminations
# intensive increase (20%+)
# intensive decrease (20%+)
# share repurch. (0.1%+)
# entrants paying
dividends
# leavers who paid dividends
cumulative net change in payers
# deliberate dividend payers
Reg. Div. Initiations
($ mn)
Intensive changes in dividends
($mn)
1981-Q3 0.748 0.535 19,980 63 1,849 4,117 1,703 22 5 110 14 1,703 2 3691981-Q4 0.748 0.543 19,601 217 1,804 4,191 1,499 39 5 38 71 13 0 7 -7 1,506 3 4651982-Q1 0.800 0.550 20,131 265 1,638 4,190 1,676 91 20 44 109 22 2 10 -15 1,691 29 4131982-Q2 0.800 0.556 19,748 20 1,579 4,177 1,605 26 9 46 50 31 0 10 -25 1,630 7 1181982-Q3 0.800 0.564 19,243 11 1,577 4,158 1,570 19 6 43 45 41 0 11 -36 1,606 6 981982-Q4 0.800 0.571 18,766 34 1,900 4,185 1,452 36 4 40 56 52 3 9 -42 1,494 2 -1031983-Q1 0.811 0.576 18,793 190 2,096 4,206 1,540 56 16 37 86 56 0 8 -50 1,590 32 1191983-Q2 0.811 0.581 20,037 725 2,365 4,311 1,513 34 5 21 99 26 2 10 -58 1,571 11 4421983-Q3 0.811 0.588 17,974 12 2,357 4,470 1,426 16 16 36 93 11 0 5 -63 1,489 117 3071983-Q4 0.811 0.592 19,181 90 2,338 4,629 1,415 48 13 21 106 14 2 9 -70 1,485 9 5891984-Q1 0.821 0.599 19,853 207 8,435 2,245 4,728 1,518 55 18 21 120 13 331 3 2 -69 1,587 61 4721984-Q2 0.821 0.605 19,734 22 11,761 2,104 4,770 1,488 25 13 21 76 8 464 0 15 -84 1,572 77 -9721984-Q3 0.821 0.609 19,520 10 13,405 2,138 4,783 1,469 26 17 35 78 14 478 3 11 -92 1,561 35 3291984-Q4 0.821 0.613 19,200 96 10,204 2,127 4,775 1,378 52 14 39 73 11 545 1 8 -99 1,477 56 641985-Q1 0.824 0.620 19,351 382 15,627 2,285 4,725 1,433 73 12 39 80 11 402 0 7 -106 1,539 72 2301985-Q2 0.824 0.624 19,265 21 19,640 2,316 4,712 1,392 30 8 29 63 13 393 1 8 -113 1,505 9 4031985-Q3 0.824 0.628 19,034 15 13,237 2,294 4,702 1,370 21 8 30 51 14 427 4 12 -121 1,491 5 521985-Q4 0.824 0.633 18,446 68 16,350 2,400 4,709 1,288 48 12 34 51 15 483 0 8 -129 1,417 7 1091986-Q1 0.826 0.638 18,874 191 11,878 2,637 4,677 1,334 61 9 36 87 19 367 1 10 -138 1,472 113 3691986-Q2 0.826 0.638 18,847 943 8,174 2,887 4,771 1,287 30 8 49 63 21 365 4 6 -140 1,427 7 2971986-Q3 0.826 0.643 18,653 29 13,635 2,753 4,828 1,257 26 8 34 49 23 440 1 5 -144 1,401 7 2271986-Q4 0.826 0.648 18,393 154 19,598 2,774 4,879 1,138 47 5 34 50 15 607 1 11 -154 1,292 16 2001987-Q1 0.861 0.655 18,871 72 10,146 3,200 4,863 1,225 56 19 36 81 16 419 2 20 -172 1,397 99 3871987-Q2 0.861 0.661 18,830 2,354 12,734 3,334 4,917 1,214 37 19 24 56 8 432 3 8 -177 1,391 45 4841987-Q3 0.861 0.667 18,627 1,070 12,857 3,610 5,021 1,193 28 12 25 64 12 493 1 9 -185 1,378 36 3231987-Q4 0.861 0.673 18,573 3,339 28,852 2,601 4,969 1,118 41 18 26 58 11 1,143 0 8 -193 1,311 48 3351988-Q1 0.874 0.679 19,254 4,261 16,329 2,786 4,898 1,192 73 12 27 81 13 628 1 7 -199 1,391 16 4881988-Q2 0.874 0.686 19,765 207 14,044 2,818 4,863 1,183 48 26 33 56 5 515 0 7 -206 1,389 426 7441988-Q3 0.874 0.694 19,540 2,067 12,764 2,762 4,806 1,165 38 18 28 83 10 478 1 13 -218 1,383 16 2591988-Q4 0.874 0.701 19,343 3,240 18,207 2,752 4,752 1,085 66 14 25 49 11 606 3 9 -224 1,309 14 2741989-Q1 0.873 0.710 19,938 2,735 14,761 2,832 4,677 1,157 70 19 20 98 8 504 0 12 -236 1,393 13 7601989-Q2 0.873 0.719 20,431 2,535 13,726 3,003 4,625 1,145 46 21 19 78 10 447 0 7 -243 1,388 44 7131989-Q3 0.873 0.723 20,396 3,174 14,423 3,224 4,576 1,128 48 11 25 67 9 417 2 9 -250 1,378 26 1591989-Q4 0.873 0.729 20,313 991 14,314 3,145 4,549 1,064 67 17 29 42 10 552 0 3 -253 1,317 19 4281990-Q1 0.876 0.740 20,753 971 14,710 2,966 4,519 1,111 57 9 26 70 6 551 1 7 -259 1,370 6 6531990-Q2 0.876 0.748 20,886 1,103 10,048 3,114 4,531 1,101 45 13 23 57 7 502 2 4 -261 1,362 21 5051990-Q3 0.876 0.758 20,671 787 14,454 2,854 4,498 1,107 31 16 10 36 11 642 1 2 -262 1,369 20 1741990-Q4 0.876 0.767 20,732 370 9,457 2,691 4,442 1,043 49 5 22 35 13 701 3 5 -264 1,307 1 4041991-Q1 0.871 0.773 20,450 435 6,614 3,096 4,408 1,061 43 13 29 30 18 378 1 3 -266 1,327 28 -581991-Q2 0.871 0.777 20,151 66 7,478 3,256 4,455 1,060 20 10 19 42 25 307 0 1 -267 1,327 6 -1191991-Q3 0.871 0.783 19,993 417 5,100 3,372 4,471 1,051 27 7 18 28 21 323 1 2 -268 1,319 5 1691991-Q4 0.871 0.789 20,205 198 6,940 3,444 4,515 1,004 31 6 11 37 21 389 0 3 -271 1,275 6 3061992-Q1 0.871 0.795 20,281 242 8,302 3,650 4,579 1,068 31 26 16 40 19 325 1 2 -272 1,340 42 2081992-Q2 0.871 0.800 20,766 42 9,032 3,602 4,643 1,099 15 19 12 55 18 386 2 0 -270 1,369 36 5121992-Q3 0.871 0.806 20,739 315 9,781 3,601 4,599 1,100 14 12 13 42 21 431 1 2 -271 1,371 31 1741992-Q4 0.871 0.811 20,838 199 7,082 3,744 4,620 1,058 33 10 21 32 15 452 0 0 -271 1,329 40 1591993-Q1 0.860 0.815 20,410 179 14,313 3,859 4,692 1,091 22 9 17 67 25 361 1 0 -270 1,361 5 -1581993-Q2 0.860 0.820 20,643 1,171 8,869 3,889 4,775 1,118 21 20 14 48 13 400 0 4 -274 1,392 18 3081993-Q3 0.860 0.823 20,568 702 7,388 4,007 4,890 1,122 10 14 15 47 19 406 5 1 -270 1,392 13 -231993-Q4 0.860 0.828 20,647 651 9,047 4,208 5,061 1,078 26 6 21 36 17 450 2 1 -269 1,347 10 2151994-Q1 0.862 0.831 20,864 98 8,100 4,278 5,165 1,118 19 9 19 63 9 407 0 2 -271 1,389 4 3681994-Q2 0.862 0.835 21,226 22 9,596 4,090 5,275 1,132 12 14 14 50 5 497 0 0 -271 1,403 9 4651994-Q3 0.862 0.843 21,263 9 11,881 4,236 5,316 1,135 12 14 9 50 6 503 1 2 -272 1,407 8 2841994-Q4 0.862 0.847 21,545 120 16,141 4,252 5,369 1,101 21 18 14 44 5 617 0 4 -276 1,377 13 462
Aggregate Time Series for Core Sample
Table A1
66

1995-Q1 0.858 0.851 21,982 242 15,275 4,423 5,382 1,168 26 26 14 68 11 575 1 0 -275 1,443 54 5001995-Q2 0.858 0.855 22,459 139 26,157 4,812 5,431 1,156 17 16 21 64 11 525 0 1 -276 1,432 161 5741995-Q3 0.858 0.859 22,625 83 17,493 5,231 5,464 1,154 15 9 17 53 9 494 1 5 -280 1,434 22 4021995-Q4 0.858 0.863 22,930 180 18,130 5,499 5,570 1,110 25 8 16 53 10 624 1 2 -281 1,391 12 4251996-Q1 0.859 0.868 23,208 443 19,952 5,830 5,644 1,139 27 11 22 69 10 617 2 5 -284 1,423 57 5551996-Q2 0.859 0.874 23,774 71 22,517 6,263 5,784 1,132 16 8 19 49 12 608 1 8 -291 1,423 9 6391996-Q3 0.859 0.877 23,813 73 24,341 6,075 5,876 1,125 13 4 13 41 8 737 2 3 -292 1,417 2 2851996-Q4 0.859 0.883 24,072 141 27,126 6,591 5,985 1,089 23 8 17 44 5 774 4 9 -297 1,386 15 4551997-Q1 0.846 0.887 24,080 202 30,385 6,821 6,007 1,122 25 9 14 66 11 779 4 9 -302 1,424 4 3001997-Q2 0.846 0.889 25,131 99 31,387 7,338 6,021 1,112 19 5 11 48 12 865 0 7 -309 1,421 2 8581997-Q3 0.846 0.891 24,798 16 31,258 8,262 6,060 1,097 8 13 17 41 8 664 1 6 -314 1,411 27 4661997-Q4 0.846 0.894 25,252 199 43,447 8,256 6,076 1,052 16 7 18 52 9 820 4 12 -322 1,374 7 5231998-Q1 0.842 0.895 25,370 193 34,032 9,042 6,015 1,087 17 9 12 52 11 813 0 9 -331 1,418 34 4141998-Q2 0.842 0.896 25,920 32 40,261 9,659 5,996 1,074 14 10 22 44 8 851 2 3 -332 1,406 7 6891998-Q3 0.842 0.899 25,416 27 56,033 8,819 5,910 1,044 6 2 20 40 10 1,341 0 7 -339 1,383 1 1281998-Q4 0.842 0.903 25,834 131 38,026 9,950 5,763 997 9 2 18 33 13 1,253 0 6 -345 1,342 8 5341999-Q1 0.834 0.905 25,377 176 40,207 10,952 5,614 1,021 27 6 18 31 15 1,102 1 6 -350 1,371 17 5071999-Q2 0.834 0.911 26,412 218 38,110 11,566 5,544 986 20 5 29 29 14 1,029 0 14 -364 1,350 8 3901999-Q3 0.834 0.916 25,360 265 39,856 11,509 5,519 964 12 3 22 22 9 987 3 6 -367 1,331 9 2821999-Q4 0.834 0.921 26,371 163 47,491 13,089 5,475 910 18 6 23 21 14 1,120 1 17 -383 1,293 4 1152000-Q1 0.847 0.929 25,951 277 51,913 14,344 5,431 914 21 6 27 37 15 1,006 0 12 -395 1,309 17 1,3122000-Q2 0.847 0.934 25,566 146 37,725 13,978 5,413 901 11 8 17 22 7 950 1 3 -397 1,298 28 2992000-Q3 0.847 0.938 24,880 294 37,517 14,128 5,408 877 11 2 21 23 9 892 0 8 -405 1,282 0 -772000-Q4 0.847 0.942 26,588 35 39,967 12,305 5,306 815 11 3 26 16 7 1,004 2 16 -419 1,234 1 7202001-Q1 0.852 0.950 25,231 174 30,538 11,089 5,125 814 12 2 33 28 17 746 0 4 -423 1,237 2 802001-Q2 0.852 0.956 24,634 213 28,861 10,891 4,968 784 12 4 18 16 17 646 1 6 -428 1,212 2 1482001-Q3 0.852 0.957 24,974 161 35,401 9,778 4,772 773 8 3 18 22 13 845 1 4 -431 1,204 2 3242001-Q4 0.852 0.959 25,630 17 31,227 9,727 4,629 744 7 5 28 16 23 702 1 4 -434 1,178 22 1372002-Q1 0.863 0.961 25,111 58 26,747 9,849 4,497 743 14 2 19 18 20 512 0 4 -438 1,181 2 1362002-Q2 0.863 0.967 24,916 290 37,256 9,015 4,407 726 13 3 9 25 5 584 1 4 -441 1,167 2 3532002-Q3 0.863 0.972 24,965 31 40,367 7,473 4,300 721 9 2 6 19 7 818 0 2 -443 1,164 16 1132002-Q4 0.863 0.976 25,604 214 28,669 7,692 4,207 714 6 14 8 16 12 766 0 3 -446 1,160 38 3032003-Q1 0.930 0.983 26,700 149 27,402 7,190 4,092 735 10 14 7 27 4 734 0 4 -450 1,185 281 3942003-Q2 0.930 0.985 25,629 225 28,699 8,086 3,975 741 9 17 5 28 3 594 1 1 -450 1,191 66 7792003-Q3 0.930 0.989 26,269 874 34,071 8,646 3,902 772 24 46 9 40 7 500 1 0 -449 1,221 213 3382003-Q4 0.930 0.992 29,514 915 42,790 9,396 3,861 803 21 40 8 61 6 501 0 2 -451 1,254 379 1,0362004-Q1 0.930 1.000 28,357 826 43,363 9,802 3,812 843 26 33 4 77 6 485 1 3 -453 1,296 139 8332004-Q2 0.930 1.008 29,094 1,392 9,763 3,807 848 20 24 11 67 2 0 1 -454 1,302 158 1,136
Notes: Data sample consists all CRSP firms which are non financial, non utilities, and non foreign in their last quarter. For share repurchase variables, the firms must also have share repurchase information in COMPUSTAT (data93)Col. (2) is the tax preference parameter from Poterba (2004). It is defined as the average of (1-tdiv)/(1-tcg) where tdiv is marginal tax rate on dividend income and tcg is the marginal tax rate on capital gains.Col. (3) is the Consumer Price Index (base 1 in 2004-Q1). All amounts are expressed in real 2004-Q1 dollars. Col. (4) is the total amount of regular dividends. Col. (5) is the total amount of special dividends.Col. (6) is the total amount of share repurchases computed with data93 item in the COMPUSTAT quarterly data (purchases of common and preferred stock). Col. (7) is market capitalization (in $bn).Col. (8) is the number of firms, col. (9) is the number of regular dividend payers, col. (10) is the number of special dividend payers.Col. (11) is the number of regular dividend initiations defined as starting to pay regular dividends after not having paid for 4 quarters (6 quarters if annual payer).Col. (12) is the number of regular dividend terminations defined as stopping regular dividends payments (see text for details).Col. (13) (resp. (14)) are the number of intensive reg. div, increases (resp. decreases) by at least 20% in real terms in quarter t (relative to quarters t-1 and t-4). Dividend initiations are not counted as intensive increases or decreases. Col. (15) is the number of firms repurchasing at least 0.1% of their shares in the quarter.Col. (16) is the number of firms which enter the core sample and are paying regular dividends. Col. (17) is the number of firms leaving the core sample and which were regular dividend payers.Col. (18) is the cumulated difference between columns (16) and (17). Column (19) is col. (9) minus col. (18): it captures the number of payers controlling for entry and exit effects.Col. (20) is the amounts of regular dividend initiations defined as starting to pay regular dividends after not having paid for 4 quarters (6 quarters if annual payer).Col. (21) is the intensive change in regular dividend payments relative to previous payment (in $Mn) for firms present in the data and paying dividends currently and in previous quarter (initiations and terminations excluded).The solid line marks the time at which the tax reform was enacted (end of May 2003) and the dashed line the time at which the tax reform was retrospectively applied (January 1st, 2003)
67

(1) (2) (3) (4) (5) (6) (7) (8) (9) (10) (11) (12) (13) (14) (15) (16) (17) (18) (19) (20) (21)
Quarter
Poterba (2004) tax
pref. CPI
Regular dividends
($ mn)
Special dividends
($ mn)
Share repurchases ($ mn)
Market Capit. ($
bn) # firms
# regular dividend payers
# special payers
# initiations
# terminations
# intensive increase (20%+)
# intensive decrease (20%+)
# share repurch. (0.1%+)
# entrants paying
dividends
# leavers who paid dividends
cumulative net change in payers
# deliberate dividend payers
Reg. Div. Initiations
($ mn)
Intensive changes in dividends
($mn)
1981-Q3 0.748 0.535 19,951 63 1,849 3,807 1,695 21 5 109 13 1,695 2 3691981-Q4 0.748 0.543 19,595 216 1,803 3,807 1,489 37 5 29 70 13 1 16 -15 1,504 3 4651982-Q1 0.800 0.550 20,129 261 1,637 3,807 1,664 90 19 40 107 21 4 14 -25 1,689 29 4121982-Q2 0.800 0.556 19,746 20 1,578 3,807 1,596 23 8 44 50 31 2 13 -36 1,632 7 1181982-Q3 0.800 0.564 19,240 11 1,576 3,807 1,566 19 6 37 44 41 3 17 -50 1,616 6 981982-Q4 0.800 0.571 18,746 34 1,900 3,807 1,447 36 4 39 55 51 5 12 -57 1,504 2 -1031983-Q1 0.811 0.576 18,776 190 2,095 3,807 1,532 56 16 30 86 55 3 17 -71 1,603 32 1191983-Q2 0.811 0.581 20,036 725 2,364 3,807 1,505 34 5 18 99 26 2 12 -81 1,586 11 4421983-Q3 0.811 0.588 17,973 12 2,354 3,807 1,417 14 15 30 93 11 1 16 -96 1,513 117 3071983-Q4 0.811 0.592 19,180 87 2,333 3,807 1,396 43 12 16 105 13 2 17 -111 1,507 9 5891984-Q1 0.821 0.599 19,843 207 8,432 2,240 3,807 1,491 52 17 16 117 12 307 4 13 -120 1,611 61 4721984-Q2 0.821 0.605 19,728 22 11,749 2,099 3,807 1,463 23 12 16 76 8 420 2 18 -136 1,599 77 -9721984-Q3 0.821 0.609 19,514 9 13,397 2,133 3,807 1,452 23 14 25 78 14 443 5 19 -150 1,602 35 3291984-Q4 0.821 0.613 19,196 96 10,194 2,123 3,807 1,356 50 14 29 67 9 491 4 16 -162 1,518 56 641985-Q1 0.824 0.620 19,347 381 15,617 2,281 3,807 1,416 69 12 34 80 10 354 5 14 -171 1,587 72 2301985-Q2 0.824 0.624 19,263 18 19,633 2,313 3,807 1,375 28 7 22 63 12 356 3 14 -182 1,557 9 4031985-Q3 0.824 0.628 19,031 14 13,226 2,291 3,807 1,360 19 8 30 51 13 387 8 13 -187 1,547 5 521985-Q4 0.824 0.633 18,442 66 16,349 2,397 3,807 1,269 45 12 30 51 12 428 0 15 -202 1,471 7 1091986-Q1 0.826 0.638 18,872 190 11,861 2,633 3,807 1,321 58 9 27 86 19 329 1 15 -216 1,537 113 3691986-Q2 0.826 0.638 18,846 943 8,167 2,883 3,807 1,275 27 8 40 62 21 329 5 13 -224 1,499 7 2971986-Q3 0.826 0.643 18,652 28 13,626 2,748 3,807 1,248 21 8 26 49 23 399 2 14 -236 1,484 7 2271986-Q4 0.826 0.648 18,368 153 19,509 2,769 3,807 1,120 43 5 27 50 13 541 2 24 -258 1,378 16 2011987-Q1 0.861 0.655 18,854 71 10,127 3,195 3,807 1,208 52 18 26 80 14 362 2 28 -284 1,492 99 3861987-Q2 0.861 0.661 18,825 2,353 12,726 3,327 3,807 1,194 32 18 19 56 7 381 3 13 -294 1,488 45 4841987-Q3 0.861 0.667 18,624 1,070 12,835 3,602 3,807 1,179 25 11 19 64 10 441 2 14 -306 1,485 36 3231987-Q4 0.861 0.673 18,562 3,339 28,770 2,597 3,807 1,105 40 17 18 56 11 1,031 4 15 -317 1,422 48 3351988-Q1 0.874 0.679 19,253 4,260 16,283 2,781 3,807 1,186 68 12 25 81 12 574 4 9 -322 1,508 16 4881988-Q2 0.874 0.686 19,764 206 14,044 2,814 3,807 1,170 45 26 27 54 5 456 0 13 -335 1,505 426 7431988-Q3 0.874 0.694 19,538 2,064 12,756 2,758 3,807 1,159 35 18 24 83 10 434 2 17 -350 1,509 16 2591988-Q4 0.874 0.701 19,335 3,239 18,201 2,749 3,807 1,074 63 13 17 49 10 557 6 20 -364 1,438 14 2741989-Q1 0.873 0.710 19,935 2,733 14,740 2,829 3,807 1,155 67 19 15 97 8 459 3 12 -373 1,528 13 7601989-Q2 0.873 0.719 20,427 2,533 13,726 3,001 3,807 1,142 42 21 17 78 9 417 0 9 -382 1,524 44 7131989-Q3 0.873 0.723 20,357 3,173 14,424 3,222 3,807 1,127 43 11 19 67 8 392 2 13 -393 1,520 26 1991989-Q4 0.873 0.729 20,313 991 14,307 3,143 3,807 1,061 64 17 25 42 9 524 0 7 -400 1,461 19 4281990-Q1 0.876 0.740 20,740 970 14,709 2,965 3,807 1,109 53 9 21 70 6 528 1 13 -412 1,521 6 6531990-Q2 0.876 0.748 20,886 1,103 9,949 3,112 3,807 1,100 43 13 22 57 7 467 2 4 -414 1,514 21 5051990-Q3 0.876 0.758 20,670 785 14,452 2,852 3,807 1,105 28 16 9 36 11 615 1 4 -417 1,522 20 1741990-Q4 0.876 0.767 20,731 368 9,457 2,690 3,807 1,041 48 5 20 35 13 678 3 6 -420 1,461 1 4041991-Q1 0.871 0.773 20,433 434 6,613 3,095 3,807 1,059 39 13 28 30 17 353 1 3 -422 1,481 28 -581991-Q2 0.871 0.777 20,151 66 7,477 3,254 3,807 1,058 19 10 18 41 25 287 0 2 -424 1,482 6 -1191991-Q3 0.871 0.783 19,993 415 5,098 3,371 3,807 1,046 24 6 15 28 20 296 2 7 -429 1,475 5 1691991-Q4 0.871 0.789 20,203 198 6,904 3,442 3,807 998 31 5 10 37 21 367 0 5 -434 1,432 6 3061992-Q1 0.871 0.795 20,281 242 8,301 3,647 3,807 1,060 28 26 15 40 18 296 2 6 -438 1,498 42 2081992-Q2 0.871 0.800 20,765 42 9,024 3,599 3,807 1,088 14 19 11 55 16 341 2 2 -438 1,526 36 5121992-Q3 0.871 0.806 20,738 19 9,744 3,598 3,807 1,086 13 11 13 40 21 392 1 5 -442 1,528 31 1741992-Q4 0.871 0.811 20,836 199 7,099 3,741 3,807 1,042 31 10 14 32 13 411 0 9 -451 1,493 40 1591993-Q1 0.860 0.815 20,409 178 14,310 3,854 3,807 1,073 20 9 17 67 23 326 2 3 -452 1,525 5 -1581993-Q2 0.860 0.820 20,640 1,170 8,862 3,882 3,807 1,092 19 20 11 46 11 356 0 12 -464 1,556 18 3081993-Q3 0.860 0.823 20,564 696 7,375 3,997 3,807 1,088 9 10 11 44 18 346 6 8 -466 1,554 12 -231993-Q4 0.860 0.828 20,640 650 9,028 4,194 3,807 1,034 25 6 14 34 13 378 3 20 -483 1,517 10 2151994-Q1 0.862 0.831 20,856 95 8,084 4,261 3,807 1,064 13 8 15 61 8 342 2 13 -494 1,558 4 3681994-Q2 0.862 0.835 21,219 21 9,561 4,072 3,807 1,074 8 12 11 49 4 417 2 4 -496 1,570 9 4651994-Q3 0.862 0.843 21,254 7 11,849 4,218 3,807 1,077 9 13 8 48 4 410 4 5 -497 1,574 8 2841994-Q4 0.862 0.847 21,536 107 16,118 4,233 3,807 1,043 18 16 11 40 2 509 4 10 -503 1,546 13 461
Table A2
Aggregate Time Series for Constant Number of Firms Sample
68

1995-Q1 0.858 0.851 21,966 241 15,252 4,404 3,807 1,104 22 22 11 61 10 483 6 7 -504 1,608 47 5001995-Q2 0.858 0.855 22,445 139 26,127 4,791 3,807 1,094 14 13 12 61 9 443 3 10 -511 1,605 161 5741995-Q3 0.858 0.859 22,526 82 17,458 5,205 3,807 1,078 13 5 12 49 4 408 3 16 -524 1,602 21 4021995-Q4 0.858 0.863 22,905 179 18,081 5,471 3,807 1,035 22 8 10 47 9 518 5 12 -531 1,566 12 4241996-Q1 0.859 0.868 23,191 435 19,887 5,797 3,807 1,049 18 8 17 63 6 505 3 24 -552 1,601 57 5561996-Q2 0.859 0.874 23,742 71 22,438 6,218 3,807 1,030 12 6 12 45 10 489 2 30 -580 1,610 9 6381996-Q3 0.859 0.877 23,790 71 24,227 6,030 3,807 1,019 10 3 7 36 6 596 6 17 -591 1,610 2 2851996-Q4 0.859 0.883 24,046 140 24,654 6,542 3,807 985 20 6 8 38 4 600 12 19 -598 1,583 14 4541997-Q1 0.846 0.887 24,040 201 30,280 6,771 3,807 1,016 21 5 10 61 11 636 10 16 -604 1,620 3 3001997-Q2 0.846 0.889 24,952 90 31,312 7,290 3,807 1,020 12 4 9 43 11 678 10 5 -599 1,619 2 8581997-Q3 0.846 0.891 24,770 14 31,125 8,206 3,807 1,003 5 11 10 38 8 523 8 18 -609 1,612 26 4661997-Q4 0.846 0.894 25,229 194 43,155 8,198 3,807 966 11 6 6 47 8 643 10 24 -623 1,589 7 5231998-Q1 0.842 0.895 25,342 190 33,909 8,988 3,807 1,000 9 8 9 47 8 642 10 16 -629 1,629 34 4141998-Q2 0.842 0.896 25,895 5 40,078 9,603 3,807 993 8 8 11 41 6 680 4 14 -639 1,632 7 6901998-Q3 0.842 0.899 25,399 26 55,884 8,780 3,807 978 3 1 9 37 7 1,103 13 15 -641 1,619 1 2091998-Q4 0.842 0.903 25,788 124 37,861 9,917 3,807 935 7 2 11 31 12 986 7 17 -651 1,586 8 5341999-Q1 0.834 0.905 25,334 171 40,062 10,920 3,807 952 17 4 10 30 12 900 2 17 -666 1,618 2 5071999-Q2 0.834 0.911 26,386 119 37,974 11,533 3,807 923 9 5 15 28 10 817 1 24 -689 1,612 8 3901999-Q3 0.834 0.916 25,298 263 39,319 11,478 3,807 893 7 3 17 19 4 783 7 19 -701 1,594 9 2821999-Q4 0.834 0.921 25,949 129 47,326 13,057 3,807 837 13 4 17 20 13 877 2 28 -727 1,564 3 1152000-Q1 0.847 0.929 25,917 275 51,756 14,303 3,807 818 15 3 19 34 15 791 2 31 -756 1,574 16 1,3112000-Q2 0.847 0.934 25,407 108 37,534 13,945 3,807 826 6 7 11 19 4 744 12 7 -751 1,577 28 3072000-Q3 0.847 0.938 24,554 292 37,414 14,096 3,807 803 7 1 14 22 7 706 6 14 -759 1,562 0 -762000-Q4 0.847 0.942 26,499 27 39,529 12,285 3,807 766 9 2 18 15 4 804 16 21 -764 1,530 0 7202001-Q1 0.852 0.950 25,217 160 30,482 11,073 3,807 776 8 1 18 22 15 605 11 10 -763 1,539 2 792001-Q2 0.852 0.956 24,630 212 28,823 10,879 3,807 757 10 3 11 15 17 533 5 9 -767 1,524 2 1472001-Q3 0.852 0.957 24,972 74 35,372 9,770 3,807 753 4 2 16 22 13 739 8 5 -764 1,517 2 3242001-Q4 0.852 0.959 25,629 17 31,202 9,721 3,807 728 6 4 19 15 22 626 3 11 -772 1,500 22 1372002-Q1 0.863 0.961 25,102 52 26,737 9,845 3,807 726 9 2 16 18 20 468 3 9 -778 1,504 2 1362002-Q2 0.863 0.967 24,915 287 37,246 9,012 3,807 718 10 3 9 24 5 545 10 4 -772 1,490 2 3532002-Q3 0.863 0.972 24,964 31 40,361 7,471 3,807 717 6 1 5 19 7 794 4 3 -771 1,488 16 1132002-Q4 0.863 0.976 25,604 214 28,636 7,691 3,807 713 6 14 7 16 12 744 2 4 -773 1,486 38 3032003-Q1 0.930 0.983 26,700 149 27,388 7,189 3,807 734 9 14 7 27 4 725 0 4 -777 1,511 281 3942003-Q2 0.930 0.985 25,629 225 28,699 8,086 3,807 741 9 17 3 28 3 588 2 3 -778 1,519 66 7792003-Q3 0.930 0.989 26,269 872 34,071 8,646 3,807 772 23 46 9 40 7 500 1 0 -777 1,549 213 3382003-Q4 0.930 0.992 29,514 915 42,790 9,396 3,807 803 21 40 8 61 6 501 0 2 -779 1,582 379 1,0362004-Q1 0.930 1.000 28,357 826 43,363 9,802 3,807 842 25 33 4 76 6 485 1 3 -781 1,623 139 8322004-Q2 0.930 1.008 29,094 1,392 9,763 3,807 848 20 24 11 67 2 1 0 -780 1,628 158 1,136
Notes: Data sample consists top 3,807 CRSP firms (ranked by market capitalization) which are non financial, non utilities, and non foreign in their last quarter. Col. (2) is the tax preference parameter from Poterba (2004). It is defined as the average of (1-tdiv)/(1-tcg) where tdiv is marginal tax rate on dividend income and tcg is the marginal tax rate on capital gains.Col. (3) is the Consumer Price Index (base 1 in 2004-Q1). All amounts are expressed in real 2004-Q1 dollars. Col. (4) is the total amount of regular dividends. Col. (5) is the total amount of special dividends.Col. (6) is the total amount of share repurchases computed with data93 item in the COMPUSTAT quarterly data (purchases of common and preferred stock). Col. (7) is market capitalization (in $bn).Col. (8) is the number of firms, col. (9) is the number of regular dividend payers, col. (10) is the number of special dividend payers.Col. (11) is the number of regular dividend initiations defined as starting to pay regular dividends after not having paid for 4 quarters (6 quarters if annual payer).Col. (12) is the number of regular dividend terminations defined as stopping regular dividends payments (see text for details).Col. (13) (resp. (14)) are the number of intensive reg. div, increases (resp. decreases) by at least 20% in real terms in quarter t (relative to quarters t-1 and t-4). Dividend initiations are not counted as intensive increases or decreases. Col. (15) is the number of firms repurchasing at least 0.1% of their shares in the quarter.Col. (16) is the number of firms which enter the core sample and are paying regular dividends. Col. (17) is the number of firms leaving the core sample and which were regular dividend payers.Col. (18) is the cumulated difference between columns (16) and (17). Column (19) is col. (9) minus col. (18): it captures the number of payers controlling for entry and exit effects.Col. (20) is the amounts of regular dividend initiations defined as starting to pay regular dividends after not having paid for 4 quarters (6 quarters if annual payer).Col. (21) is the intensive change in regular dividend payments relative to previous payment (in $Mn) for firms present in the data and paying dividends currently and in previous quarter (initiations and terminations excluded).The solid line marks the time at which the tax reform was enacted (end of May 2003) and the dashed line the time at which the tax reform was retrospectively applied (January 1st, 2003)
69

Variable Period Diff-in-Diffs1 2 3 4 5 q5 vs. q1
Pre 0.20 0.29 0.62 0.58 1.91Largest Fraction of Shares (0.10) (0.12) (0.20) (0.19) (0.42)
among Executives Post 3.55 3.20 3.81 4.68 9.49 4.22(0.93) (0.82) (0.95) (1.09) (1.89) [0.0314]
Pre 0.88 0.94 0.41 0.43 0.73Largest Option (Unexercisable) (0.25) (0.25) (0.15) (0.16) (0.23)
Holding among Executives Post 8.43 5.91 4.41 2.87 3.96 -4.31(1.77) (1.26) (1.02) (0.83) (1.03) [0.0277]
Pre 1.13 0.66 0.73 0.54 0.31Largest Option (Exercisable) (0.28) (0.20) (0.23) (0.19) (0.14)Holding among Executives Post 8.38 5.42 3.07 4.62 4.22 -3.34
(1.68) (1.14) (0.82) (1.18) (1.08) [0.0813]Pre 0.76 0.76 0.56 0.85 0.65
Percentage of Shares (0.21) (0.20) (0.17) (0.21) (0.18)Held by Institutional Investors Post 2.73 3.05 3.55 4.64 10.72 8.09
(0.68) (0.71) (0.77) (0.89) (1.35) [0.0000]Pre 1.13 0.58 0.61 1.12 0.00
Two-year Forecasted (0.57) (0.41) (0.43) (0.56)Earnings Growth Post 10.64 13.54 6.66 5.06 1.53 -7.97
(2.69) (2.96) (1.98) (1.89) (1.08) [0.0003]Pre 0.00 0.15 0.51 1.29 1.67
Ratio of Profits to Assets (0.09) (0.16) (0.26) (0.29)Post 0.33 1.47 3.90 7.29 13.14 11.14
(0.24) (0.49) (0.79) (1.12) (1.50) [0.0000]Pre 0.84 0.60 0.65 0.85 0.71
Ratio of Debt to Assets (0.20) (0.17) (0.18) (0.21) (0.20)Post 8.23 3.27 4.28 4.57 4.94 -3.16
(1.19) (0.75) (0.85) (0.87) (0.89) [0.0345]Pre 1.06 0.80 0.80 0.65 0.35
Ratio of Cash to Assets (0.23) (0.21) (0.20) (0.18) (0.13)Post 5.67 4.04 5.73 4.46 5.35 0.39
(0.96) (0.81) (0.99) (0.87) (0.96) [0.7785]Pre 0.60 0.75 0.70 0.70 0.90
Assets (0.19) (0.19) (0.19) (0.19) (0.21)Post 2.03 3.22 4.40 5.10 10.62 8.29
(0.58) (0.74) (0.86) (0.92) (1.33) [0.0000]Pre 1.07 0.48 0.48 0.58 0.39
Number of Large Holding (0.22) (0.16) (0.34) (0.15) (0.24)Outside Shareholders Post 4.87 4.63 1.52 4.75 6.40 2.21
(0.91) (1.05) (1.07) (0.89) (2.20) [0.3419]Pre 0.62 1.13
Number of Large Holding (0.15) (0.37)Independent Directors Post 2.18 5.76 3.06
(0.50) (1.63) [0.0543]
NOTE-See Figures 14-16 and text for description of sample and quintile construction procedure. Pre-reform periodis 2001-Q3 to 2002-Q4; post-reform is 2003-Q1 to 2004-Q2. Standard errors clustered by firm reported in parens.Diffs-in-diffs column reports pre-post change in initiation rate in q5 minus corresponding change in q1, withp-values for F-test in square brackets. For earnings growth, diffs-in-diffs column compares q5 and q2. For indep.directors, q1 contains all firms with no large-shareholding indep directors and q5 contains all other firms.
Table A3Heterogeneity Results: Annualized Initiation Rates Pre and Post Reform by Quintile
Quintile
70

Variable Period Test: q5-q11 2 3 4 5
Pre 0.27 0.33 0.74 0.53 1.70Largest Fraction of Shares (0.27) (0.33) (0.74) (0.53) (1.70)
among Executives Post 3.79 3.20 4.44 5.19 10.37 5.14(1.08) (0.96) (1.06) (1.28) (2.05) [0.0222]
Pre 0.64 1.02 0.47 0.52 0.90Largest Option (Unexercisable) (0.32) (0.29) (0.18) (0.19) (0.32)
Holding among Executives Post 9.03 4.88 4.73 3.26 5.27 -4.02(1.91) (1.42) (1.22) (0.99) (1.29) [0.071]
Pre 0.88 0.76 1.03 0.44 0.44Largest Option (Exercisable) (0.36) (0.23) (0.28) (0.24) (0.20)Holding among Executives Post 6.96 4.95 3.95 4.54 6.68 0.16
(1.90) (1.15) (1.04) (1.39) (1.32) [0.9424]Pre 0.77 1.29 0.33 0.79 0.62
Percentage of Shares (0.35) (0.39) (0.18) (0.25) (0.22)Held by Institutional Investors Post 2.73 5.99 2.63 4.59 10.99 8.40
(1.42) (1.58) (0.97) (1.18) (1.82) [0.0003]Pre 0.95 0.24 0.24 0.52 0.08
Two-year Forecasted (0.65) (0.52) (0.39) (0.34) (0.18)Earnings Growth Post 4.76 6.36 1.26 0.31 0.70 -3.19
(3.60) (3.44) (2.48) (2.38) (1.50) [0.1350]Pre 0.15 0.10 0.42 1.42 1.39
Ratio of Profits to Assets (0.20) (0.14) (0.21) (0.37) (0.37)Post 3.15 1.71 4.26 6.67 11.33 6.94
(1.00) (0.76) (1.18) (1.73) (2.11) [0.0019]Pre 1.09 0.64 0.53 0.72 0.48
Ratio of Debt to Assets (0.30) (0.23) (0.23) (0.33) (0.31)Post 8.24 4.26 4.14 4.89 4.91 -2.72
(1.80) (1.07) (1.25) (1.61) (1.44) [0.2486]Pre 1.36 0.76 0.79 0.55 0.31
Ratio of Cash to Assets (0.38) (0.33) (0.27) (0.22) (0.22)Post 6.13 2.71 6.56 3.99 7.50 2.42
(1.63) (1.39) (1.57) (1.13) (1.79) [0.3427]Pre 0.52 0.98 0.33 0.62 1.17
Assets (0.43) (0.34) (0.20) (0.25) (0.31)Post 4.96 6.10 2.62 3.13 10.84 5.24
(1.90) (1.68) (1.09) (1.33) (1.91) [0.0808]Pre 0.92 0.51 0.67 0.71 0.80
Number of Large Holding (0.25) (0.21) (0.42) (0.20) (0.34)Outside Shareholders Post 6.53 3.84 -0.76 5.46 8.23 1.81
(1.30) (1.32) (1.60) (1.18) (2.85) [0.5595]Pre 0.12 0.83
Number of Large Holding (0.39) (0.41)Directors Post 1.73 6.59 4.16
(1.80) (2.24) [0.0971]
NOTE-Table reports annualized initiation rates by quinitle pre- and post-reform conditonal on observables,using regression specifications as in equation (3) in the text, with key variable of interest excluded from linearcontrol set. Standard errors clustered by firm reported in parentheses. Diffs-in-diffs column reports pre-postchange in initiation rate in q5 minus corresponding change in q1, with p-values for F-test in square brackets.For earnings growth, diffs-in-diffs column compares q5 and q2. See Table A3 for additional details.
Table A4Heterogeneity Results: Initiation Rates Pre and Post Reform by Quintile Conditional on Controls
Quintile
71


![A blended portfolio construction technique using ... · returns in a long run [Jorion,1986,Poterba and Summers,1988,Cuthbertson and Nitzsche, 2005, p.158]. Given the volatile nature](https://img.dokumen.tips/doc/110x75/5e684ae8de77ef20b1724bcd/a-blended-portfolio-construction-technique-using-returns-in-a-long-run-jorion1986poterba.jpg)