Embed Size (px)
Citation preview

NEUBERGER BERMAN
NB GLOBAL CORPORATE INCOME TRUST INCOME SECURITY DIVERSIFICATION

NB GLOBAL CORPORATE INCOME TRUST 1
NEUBERGER BERMAN
Source: Neuberger Berman, Factset. All information as of June 30, 2018, using an USD(US$):AUD($) exchange rate of 1.3504 as at June 30, 2018. Neuberger Berman data reflects the collective data for the various subsidiaries of Neuberger Berman Group LLC. 1Neuberger Berman’s funds under management includes US$103.3 billion in Equity assets, US$132.2 billion in Fixed Income assets and US$68.9 billion in Alternatives assets. Alternatives “AUM and Committed Capital” includes assets under management for non-Private Equity businesses and Committed Capital since inception for the Private Equity businesses. Committed Capital since inception reflects all contractual commitments, including those still in documentation, to fund investments, including those which have since been realized, advised by NB Alternatives Advisers LLC and its affiliates or predecessors (the oldest mandate of which was founded in 1981).
Local presence in Australia since 2007
Offices in Melbourne and Sydney
Overseeing $7.3Bn in assets for Australian clients
Clients include Sunsuper, First State Super and MLC
2,019 EMPLOYEES
WORLDWIDE
$411BN
FUNDS
UNDER
MANAGEMENT1
FOUNDED IN
1939
500 EQUITY PARTNERS
INVESTMENT TEAM INVESTS
ALONGSIDE CLIENTS
PRIVATE, INDEPENDENT,
EMPLOYEE-OWNED
100% 32
20 GLOBAL
COUNTRIES
OFFICES in

NB GLOBAL CORPORATE INCOME TRUST 2
Trust Name NB Global Corporate Income Trust
Manager Neuberger Berman Australia Pty Limited
Responsible Entity Equity Trustees Limited
ASX code NBI
Subscription Price per Unit $2.00
“Day 1” Pro Forma NAV per Unit1 $2.00
Pricing Daily
Management Costs 0.85%
Performance Fee None
Offer Costs Paid in full by Neuberger Berman (no charge back mechanism)
Minimum Offer Raise $150 million
Maximum Offer Raise $500 million (with discretion to accept oversubscriptions)
Target Distribution2 5.25% p.a. (net of fees and expenses), paid monthly
Offer Proceeds Invested Within 3 days
Foreign Currency Exposure Hedged to AUD
Leverage3 None
KEY OFFER DETAILS
1The Pro Forma Net Asset Value (“NAV”) backing per Unit is expected to be achieved at both the Minimum Offer Raise and the Maximum Offer Raise based on the unaud ited pro forma statements of financial information set out in Section 6 of the Product Disclosure Statement (“PDS”) for NB Global Corporate Income Trust (“NB GCIT”). The PDS was lodged with the Australian Securities and Investments Commission on 6 August 2018 and is available on NB GCIT’s website at www.nb.com/NBI.
2The Target Distribution is only a target and may not be achieved. Actual distributions will be monitored against the Target Distribution. The Target Distribution wil l be formally reviewed at least annually (as at the end of each financial year) and any reduction in Target Distribution will be notified by way of ASX announcement as required. Investors should review the “Risk Factors” set out in Section 8 of the PDS. Please refer to the PDS for full details of the terms of the Offer, including Section 10 for the fees and costs that apply. 3NB GCIT will not utilise leverage for investment purposes.

NB GLOBAL CORPORATE INCOME TRUST 3
AN OPPORTUNITY TO RECEIVE MONTHLY INCOME BY INVESTING IN THE BONDS OF GLOBAL COMPANIES
INCOME SECURITY DIVERSIFICATION
CREDENTIALS
• 20+ year track record
• Experienced investment team
• 56 dedicated investment professionals
• Managing over $60Bn in AUM
• Stable and consistent income
• Strong performance amidst rising rates
• Diversified portfolio: 250 - 350 companies
• Large, liquid companies: >US$100m earnings
• Strong emphasis on capital preservation
• Under-represented in an Australian portfolio
• $2.8T large, liquid market
• Global, by industry, country and credit quality
• Attractive return, lower volatility
Source: Neuberger Berman. All information as of June 30, 2018, using an USD(US$):AUD($) exchange rate of 1.3504 as at June 30, 2018. *The Target Distribution is only a target and may not be achieved. Actual distributions will be monitored against the Target Distribution. The Target Distribution wil l be formally reviewed at least annually (as at the end of each financial year) and any reduction in Target Distribution will be notified by way of ASX announcement as required. Investors should review the “Risk Factors” set out in Section 8 of the Product Disclosure Statement (the “PDS”) for NB Global Corporate Income Trust (“NB GCIT”). The PDS was lodged with the Australian Securities and Investments Commission on 6 August 2018 and is available on NB GCIT ’s website at www.nb.com/NBI. Please refer to the PDS for full details of the terms of the Offer. The companies referenced above are examples of the type of companies in which NB GCIT may invest.
5.25% p.a. (net)*
(PAID MONTHLY)

NB GLOBAL CORPORATE INCOME TRUST 4
INTRODUCING GLOBAL HIGH YIELD CORPORATE BONDS
SENIOR
DEBT
HYBRIDS
Lower
Risk
Higher
Risk
EQUITY
A LARGE, LIQUID MARKET DIVERSIFIED ACROSS INDUSTRIES STABLE AND CONSISTENT
INCOME
Mandatory
Coupon
Discretionary
Dividend
US High Yield
Corporate Bonds
$1.7T
European High Yield
Corporate Bonds
$520Bn
EM High Yield
Corporate Bonds
$560Bn
$2.8T
Sources: Bloomberg, Neuberger Berman. Data as of June 30, 2018, USD(US$):AUD($) exchange rate of 1.3504 as at June 30, 2018. Indices used : ICE BofAML Global High Yield Index. The companies referenced are taken from the index.
Coupon with
Risk of Deferral / Non-payment
SUBORDINATED
DEBT
SENIOR
SECURED DEBT Financial
14%
Energy 14%
Basic Industry 12%
Telecomm 9% Media
8%
Healthcare 8%
Capital Goods 5%
Services 4%
Retail 4%
Technology 4%
Real Estate 4%
Leisure 3%
Utilities 3%
Consumer 3%
Automotive 2%
Transportation 2%

NB GLOBAL CORPORATE INCOME TRUST 5
INVESTING IN LARGE, GLOBAL COMPANIES
$1,089
$836
$233
NB GCIT GHY ASX 200
Median Company Earnings* (millions)
$5,463
$4,884
$1,245
NB GCIT GHY ASX 200
Median Company Revenue (millions)
Sources: All data as of June 30, 2018, using, where applicable, an USD(US$):AUD($) exchange rate of 1.3504 as at June 30, 2018. • Neuberger Berman for NB Global Corporate Income Trust (“NB GCIT”) based on the proposed portfolio of companies in which NB GCIT may invest. Investors should review the “Overview of the Investment Strategy” set out in Section 4 of the
Product Disclosure Statement (“PDS”) for NB GCIT. The PDS was lodged with the Australian Securities and Investments Commission on 6 August 2018 and is available on NB GCIT’s website at www.nb.com/NBI. Please refer to the PDS for full details of the terms of the Offer.
• Bloomberg for GHY, represented by ICE BofAML Global High Yield Index, and the ASX 200. *Company Earnings is represented by EBITDA.

NB GLOBAL CORPORATE INCOME TRUST 6
INDICATIVE EXAMPLES OF PROPOSED PORTFOLIO COMPANIES
Source: Bloomberg. All information as of June 30, 2018. *ICR = Interest Coverage Ratio (EBITDA/Total Interest Expenses) ^ICR = Interest Coverage Ratio (EBITDA/Cash Interest Expenses) The companies referenced above are indicative examples of the type of companies in which NB Global Corporate Income Trust (“NB GCIT”) may invest. References to these companies are for illustrative purposes only and are intended to show a broad range of companies based on credit selection, industry and credit quality. The references to these companies are not intended as, nor do they constitute, a recommendation to investors. Investors should review the “Overview of the Investment Strategy” set out in Section 4 of the Product Disclosure Statement (the “PDS”) for NB GCIT. The PDS was lodged with the Australian Securities and Investments Commission on 6 August 2018 and is available on NB GCIT’s website at www.nb.com/NBI. Please refer to the PDS for full details of the terms of the Offer.
Location – United States
Market Cap – US$80.1Bn
Type – Senior Bond due 2028
Yield – 6.0%
FY2017 Revenue – US$41.6Bn
FY2017 EBITDA – US$15.6Bn
FY2017 ICR* – 5.0
Location – United Kingdom
Market Cap – N/A (Private Company)
Type – Secured bond due 2026
Yield – 6.5%
FY2017 Revenue – US$6.4Bn
FY2017 EBITDA – US$2.6Bn
FY2017 ICR* – 3.4
Location – United States
Market Cap – US$10.3Bn
Type – Senior Bond due 2026
Yield – 6.3%
FY2017 Revenue – US$3.8Bn
FY2017 EBITDA – US$1.2Bn
FY2017 ICR* – 3.4
Cable TV & landline provider Internet, mobile and landline provider Enterprise information/records
management
Location – United States
Market Cap – US$177.5Bn
Type – Senior Bond due 2028
Yield – 5.8%
FY2017 Revenue – US$11.7Bn
FY2017 EBITDA – US$949MM
FY2017 ICR* – 4.0
Location – United States
Market Cap – US$1.4Bn
Type –Secured Bond due 2022
Yield – 8.9%
FY2017 Revenue – US$8.8Bn
FY2017 EBITDA – US$3.5Bn
FY2017 ICR* – 2.3
Location – United States
Market Cap – US$25.3Bn
Type –Senior Bond due 2026
Yield – 5.3%
FY2017 Revenue – US$5.8Bn
FY2017 EBITDA – US$2.0Bn
FY2017 ICR^ – 4.5
Internet Media Company Car Rental Retail chain foodstore

NB GLOBAL CORPORATE INCOME TRUST 7
HIGH INCOME, ATTRACTIVE RETURN, LOWER VOLATILITY
2.4%
4.2%
4.3%
4.8%
6.4%
Global Equity
Aus Hybrids*
Aus REIT
ASX 20
Global HY
1. ATTRACTIVE YIELD
3. LESS VOLATILE (5YR)
12.3%
12.1%
9.1%
4.7%
2.8%
ASX20
Aus REIT
Global Equity
Global HY
Aus Hybrids
2.6%
6.0%
6.5%
7.3%
12.8%
ASX 20
Aus Hybrids
Aus REIT
Global HY
Global Equity
2. ATTRACTIVE RETURN (5YR)
N/A
-57.5%
-22.6%
-15.5%
17.5%
Aus Hybrids
Aus REIT
Global Equity
ASX20
Global HY
4. PERFORMANCE DURING THE GFC (2008-2009)
Source: Morningstar, Bloomberg. Indices used were the ICE BofAML Global High Yield Index (A$ hedged), Solactive Australian Hybrid Securities Index, S&P/ASX 20 TR, S&P/ASX 200 A-REIT and MSCI World (A$ hedged). Unless stated otherwise, all Index data as of June 30, 2018. * Source: NAB Originations, ASX Listed Bond and Hybrid Rate Sheet 1. Current Yield of respective indices (unfranked); Aus Hybrids yield is represented by yield-to-call. 2. 5 years annualised return of respective indices; 3. 5 years annualised standard deviation of respective indices; 4. Aus Hybrid not available as index data starts at 2/29/2012. Calculation Period: 2008-2009

NB GLOBAL CORPORATE INCOME TRUST 8
Economy is doing well Growth in earnings Improvement in
company fundamentals
Decrease in corporate
credit risk
Strong Return
WHAT HAPPENS WHEN RATES RISE…
WHEN RATES ARE RISING…
BEING LESS SENSITIVE TO RISING RATES
Higher
Coupon
Global
High Yield
6.1%
Australia
Bonds
2.5%
Global
Investment Grade
3.2%
COUPON PAYMENT1
Global
High Yield
4 yrs
Australia
Bonds
5 yrs
Global
Investment Grade
7 yrs
DURATION2
Shorter
Duration
Sources: Bloomberg and Neuberger Berman. All information as of June 30, 2018. Indices used are the ICE BofAML Global High Yield Index (USD Hedged); Bloomberg Barclays Global Aggregate Corporate Bond Index (USD Hedged); Bloomberg
Barclays AusBond Composite 0+ Years Index; and S&P U.S. Treasury Bond Current 5-Year Index.. 1Coupon Payment is represented by Yield-to-Worst 2Duration is represented by Modified Duration, Global High Yield is represented by Effective Duration.
HY CORPORATE BONDS GENERALLY PERFORM STRONGLY
0.90%
2.42%
-1.80%
3.07%
1.39%
Median U.S. TreasuryYield Increase
GlobalHigh Yield
Global InvestmentGrade
Median Return during periods of rising U.S. Treasury yields (2000 – 2016)
3 months’ return during period Immediate 3 months’ return after period

NB GLOBAL CORPORATE INCOME TRUST 9
1 DEFAULT
SINCE HY
STRATEGY
INCEPTION1
PORTFOLIO MANAGERS LOCATION OF TEAM
INVESTMENT TEAM
Thomas O’Reilly, CFA
Senior Portfolio Manager
29 years’ experience
Patrick Flynn, CFA
Senior Portfolio Manager
26 years’ experience
Vivek Bommi, CFA
Senior Portfolio Manager
20 years’ experience
Nish Popat
Senior Portfolio Manager
25 years’ experience
Jennifer Gorgoll
Senior Portfolio Manager
20 years’ experience
Source: Neuberger Berman. All information as of June 30, 2018. 1Neuberger Berman High Yield Strategy inception date is December 1, 1997
MANAGING
CORPORATE
BONDS
SINCE 1998
INVESTED IN
OVER 1,100
COMPANIES
Investment team of
professionals
Chicago
Atlanta
New York
London The Hague
Singapore
Shanghai
56

NB GLOBAL CORPORATE INCOME TRUST 10
INVESTMENT PROCESS
Focus on large, liquid companies 1
Diversified globally across industry,
country and credit quality 2
Avoid companies with deteriorating
fundamentals 3
INVESTMENT PROCESS KEY SELECTION CRITERIA
Investors should review the “Overview of Investment Process and Portfolio Construction” set out in Section 4 of the Product Disclosure Statement (the “PDS”) for NB Global Corporate Income Trust (“NB GCIT”). The PDS was lodged with the Australian
Securities and Investments Commission on 6 August 2018 and is available on NB GCIT’s website at www.nb.com/NBI.
Identify investment universe
Filter by company size
Conduct fundamental analysis
Select best ideas
NB Global Corporate Income Trust
Apply ESG score

NB GLOBAL CORPORATE INCOME TRUST 11
CREDIT QUALITY MANAGEMENT OTHER CHARACTERISTICS
• No equities
• No leverage
• No credit derivatives
• No structured products
• No local currency or sovereign EM Debt
• FX exposure hedged to AUD
Source: Neuberger Berman as of June 30, 2018. This information is intended as a broad overview of the proposed investment objectives, strategy and guidelines for NB Global Corporate Income Trust (“NB GCIT”), and is subject to change. Investors
should review the “Overview of the Investment Strategy” and “Risk Factors” set out in Sections 4 and 8, respectively, of the Product Disclosure Statement (the “PDS”) for NB GCIT. The PDS was lodged with the Australian Securities and Investments
Commission on 6 August 2018 and is available on NB GCIT’s website at www.nb.com/NBI. Please refer to the PDS for full details of the terms of the Offer.
*The Target Distribution is only a target and may not be achieved. Actual distributions will be monitored against the Target Distribution. The Target Distribution will be formally reviewed at least annually (as at the end of each financial year) and any
reduction in Target Distribution will be notified by way of ASX announcement as required.
PROPOSED PORTFOLIO INVESTMENT GUIDELINES
84.2
%
BB B BBB CCC
Focus on large, liquid
companies Opportunistic
TARGET DISTRIBUTION DIVERSIFIED BY ISSUER
AVERAGE NO. OF HOLDINGS
250 – 350
AVERAGE HOLDING SIZE
0.25 – 0.50%
5.25% p.a. (net)*
(PAID MONTHLY)

NB GLOBAL CORPORATE INCOME TRUST 12
INDICATIVE BREAKDOWN OF PROPOSED PORTFOLIO
CREDIT RATING BREAKDOWN COUNTRY BREAKDOWN
Source: Neuberger Berman as of June 30, 2018. This indicative breakdown information for the proposed portfolio of NB Global Corporate Income Trust (“NB GCIT”) is for illustrative purposes and is subject to change. Investors should review the “Overview
of the Investment Strategy” set out in Section 4 of the Product Disclosure Statement (the “PDS”) for NB GCIT. The PDS was lodged with the Australian Securities and Investments Commission on 6 August 2018 and is available on NB GCIT’s website at
www.nb.com/NBI. Please refer to the PDS for full details of the terms of the Offer and to the additional disclosures in the Appendix.
*Current Yield Hedged (gross), Hedged to AUD
Yield* 6.7% No. of Holdings 307
INDUSTRY BREAKDOWN
Duration 4.2 yrs
CCC 6%
BBB 1%
BB 55%
B 38%
Energy 14%
Media 13%
Financial 10%
Telecomm 10% Healthcare
9%
Basic Industry 9%
Utilities 6%
Services 5%
Retail 5%
Capital Goods 4%
Real Estate 4%
Technology 4%
Leisure 3%
Others 3%
EM 20%
EU 20%
US 60%

NB GLOBAL CORPORATE INCOME TRUST 13
STRONG EMPHASIS ON CAPITAL PRESERVATION
LARGE AND EXPERIENCED INVESTMENT TEAM
ALL OFFER COSTS PAID IN FULL BY NB
SUMMARY
STABLE AND CONSISTENT MONTHLY INCOME 1
HIGH INCOME, ATTRACTIVE RETURN; LOWER VOLATILITY 2
ADDITIVE TO AN AUSTRALIAN PORTFOLIO 3
4
5
6
NB GLOBAL CORPORATE INCOME TRUST 14
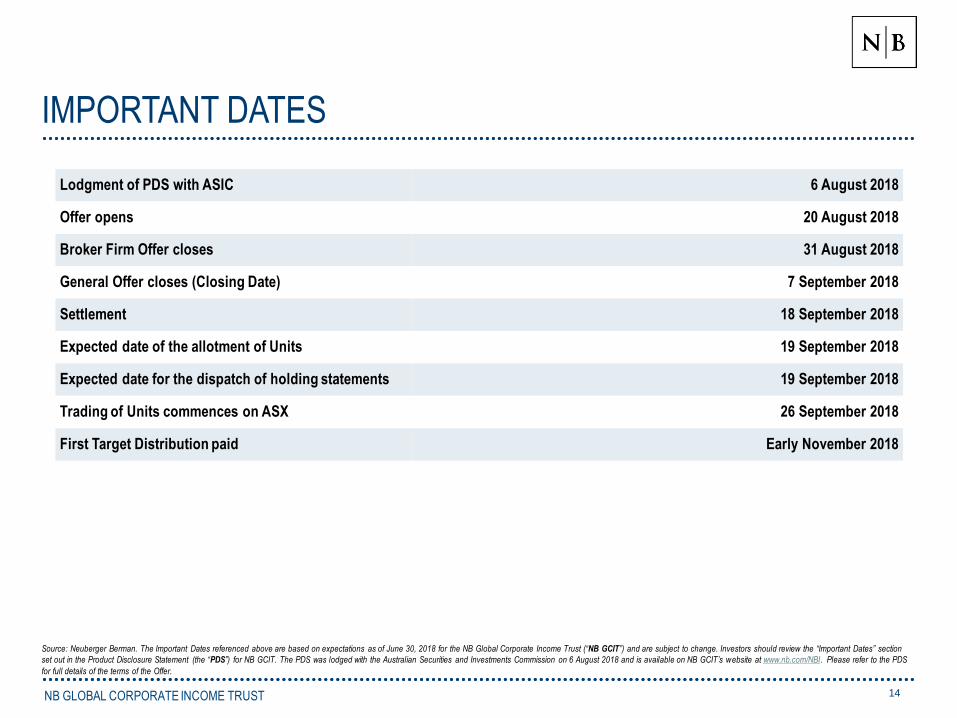
Lodgment of PDS with ASIC 6 August 2018
Offer opens 20 August 2018
Broker Firm Offer closes 31 August 2018
General Offer closes (Closing Date) 7 September 2018
Settlement 18 September 2018
Expected date of the allotment of Units 19 September 2018
Expected date for the dispatch of holding statements 19 September 2018
Trading of Units commences on ASX 26 September 2018
First Target Distribution paid Early November 2018
IMPORTANT DATES
Source: Neuberger Berman. The Important Dates referenced above are based on expectations as of June 30, 2018 for the NB Global Corporate Income Trust (“NB GCIT”) and are subject to change. Investors should review the “Important Dates” section
set out in the Product Disclosure Statement (the “PDS”) for NB GCIT. The PDS was lodged with the Australian Securities and Investments Commission on 6 August 2018 and is available on NB GCIT’s website at www.nb.com/NBI. Please refer to the PDS
for full details of the terms of the Offer.
NB GLOBAL CORPORATE INCOME TRUST 15
INVESTOR COMMUNICATIONS
Regular shareholder
emails
Website
www.nb.com/nbi
Half yearly national
investor presentations
Media
Daily NAV
Industry conferences
Monthly, Semi & Annual
financial results
Independent research

NB GLOBAL CORPORATE INCOME TRUST 16
CONTACT
Nick Hoar
Tel: +852 3664 8820
Adam Grotzinger
Tel: +65 6645 3793
Maxine Kraut
Tel: +61 3 9649 0916
Jason Henchman
Tel: +61 2 9239 3202
Lucas Rooney
Tel: +61 3 9649 0912
Vivian Sun
Tel: +61 3 9649 0901
Paul O'Halloran
Tel: +61 3 9649 0906
Angela Verco
Tel: +61 3 9649 0915
Lisa Murray
Tel: +61 3 9649 0910

APPENDICES

NB GLOBAL CORPORATE INCOME TRUST 18
INTEGRATION OF ESG ANALYSIS INTO THE INVESTMENT PROCESS
• ESG is a critical component of the fundamental
research process that determines Internal Credit Ratings
• ESG analysis is performed by the Non-Investment
Grade Credit research team
• Proactive engagement with issuers to enhance
disclosure, improve ESG analysis, and affect positive
change
• Performance attribution is monitored to determine the
impact of ESG analysis
PRI has awarded NB an A+ for our Fixed Income ESG integration
INTEGRATED ESG PROCESS
Investors should review the “Environmental, Social and Governance (“ESG”)” overview set out in Section 4 of the Product Disclosure Statement (the “PDS”) for NB GCIT. The PDS was lodged with the Australian Securities and Investments Commission on 6 August 2018 and is available on NB GCIT’s website at www.nb.com/NBI.
NEUBERGER BERMAN COLLABORATION IN ESG
Signatory of the UN-supported Principles for
Responsible Investment (PRI) since 2012
Founding member of the Sustainability Accounting
Standards Board (SASB) Alliance
Registered participant and committed to making the
United Nations Global Compact’s Ten Principles
Ally of the World Benchmarking Alliance and to
provide access to information that indicates how
companies are contributing to the Sustainable
Development Goals
NB INTERNAL CREDIT RATING
CAPITAL
STRUCTURE /
COVENANTS
BUSINESS
FUNDAMENTALS
NB
ESG SCORE
SCENARIO
ANALYSIS
NB ESG PROCESS

NB GLOBAL CORPORATE INCOME TRUST 19
DIVERSIFICATION BENEFITS OF GLOBAL HIGH YIELD
Global High Yield has historically had low correlation to
traditional fixed income asset classes
• Negative correlation to Australian government securities
• Low correlation to Australian Hybrids and Australian
Equity
• While correlation is highest to global equities, volatility
of global high yield is lower
Source: Morningstar, Bloomberg. Indices used were the ICE BofAML Global High Yield Index (A$ hedged), MSCI World (A$ hedged), Solactive Australian Hybrid Securities Index, Bloomberg AusBond Govt 0+ Yr Index and S&P/ASX 200. Unless stated otherwise, all Index data as of June 30, 2018. Past performance is not a reliable indicator of future performance.
CORRELATION TO AUSTRALIAN ASSET CLASSES
5 YEAR PERIOD (JUNE 2013 – JUNE 2018)
5 YEAR RISK / RETURN PROFILE
(JUNE 2013 – JUNE 2018)
Global HY
Global Equity
Aus Hybrid
Aus Govt Aus Equity
0
2
4
6
8
10
12
14
0 5 10 15
Global
HY
Global
Equity
Aus
Hybrid
Aus
Govt.
Aus
Equity
Global
HY 1.000
Global
Equity 0.707 1.000
Aus
Hybrid 0.570 0.585 1.000
Aus
Govt. -0.002 -0.073 0.001 1.000
Aus
Equity 0.501 0.667 0.681 0.034 1.000
Annualised Standard Deviation (%)
An
nu
alis
ed R
etu
rn (%
)

NB GLOBAL CORPORATE INCOME TRUST 20
RISING INTEREST RATE ENVIRONMENT
High yield bonds and senior floating rate loans performance in rising rate environment
Source: J.P. Morgan; ICE; S&P/LCD.
The table presented above represents performance when 5-Year Treasury yields rose 70 basis points (or more) during a 3-month period. High Yield Bond Return is represented by J.P. Morgan Domestic High Yield Index. High Yield Bond Returns
next 3 months represent the 3-month return of the J.P. Morgan High Yield Index for the 3-month period following the 3-months ending period, as listed in the first column of the table above. High Grade Bond Return represented by ICE BofAML US
Corporate Index (C0A0). Senior Floating Rate Loans Return prior to 2007 represents S&P Performing Loans, after 2007 Leveraged Loans are represented b y the J.P. Morgan Leveraged Loan Index.
See definitions of indices at the back of this presentation. Past performance is not a reliable indicator of future performance. As with any investment, there is the possibility of profit as well as the risk of loss. Historical trends do not imply, forecast, or
guarantee future results.
3-months
ending:
Increase in
5-year
Treasury
Yields
High Yield
Bond Spreads
Beg Month
(bps)
Spread
Tightening/
Widening (bps)
High
Yield
Bond
Return
High Yield Bond
Returns
next
3 months
High
Grade
Bond
Return
High Grade
Bond
Return next
3 months
Senior
Floating Rate
Loans
Return
S&P
500
Return
May-87 1.4% 425 -107 -2.8% 4.1% -4.2% 0.2% NA 2.9%
May-88 1.1% 458 -41 0.5% 1.0% -2.9% 3.3% NA -1.2%
Mar-90 0.8% 790 4 -2.6% 5.7% -0.7% 3.3% NA -3.0%
Mar-92 1.0% 729 -239 8.2% 2.5% -0.6% 4.4% NA -2.6%
Apr-94 1.6% 370 9 -4.8% 1.1% -5.7% 1.6% 2.3% -5.7%
Nov-94 1.0% 405 8 -0.8% 5.5% -1.9% 5.3% 1.8% -3.8%
Apr-96 1.2% 461 -80 0.9% 1.9% -3.9% 1.5% 1.9% 3.5%
Feb-99 0.7% 611 -32 0.2% 2.2% -1.0% -0.2% 0.7% 6.8%
Jan-00 0.7% 605 -65 2.3% -1.4% -0.6% 0.6% 2.3% 2.6%
Jan-02 0.9% 991 -171 4.0% 3.0% -0.9% 0.2% 2.6% 7.0%
Aug-03 1.2% 746 -152 3.3% 6.2% -3.6% 2.9% 2.1% 5.1%
Jun-04 1.0% 499 -47 -0.4% 4.4% -3.3% 4.1% 1.2% 1.7%
May-08 1.0% 765 -115 4.0% -3.4% -1.7% -0.5% 4.6% 5.8%
Jun-09 0.9% 1531 -512 22.5% 15.1% 10.8% 8.3% 20.4% 15.9%
Dec-10 0.7% 659 -82 3.2% 4.2% -1.6% 1.0% 3.2% 10.8%
Jul-13 0.7% 469 25 -1.1% 3.0% -4.9% 2.4% 0.6% 6.1%
Dec-16 0.8% 558 -82 2.6% 2.5% -2.9% 1.4% 2.2% 3.8%
Average 1.0% 651 -99 2.3% 3.4% -1.7% 2.3% 3.5% 3.3%
Median 1.0% 605 -80 0.9% 3.0% -1.8% 2.0% 2.2% 3.5%

NB GLOBAL CORPORATE INCOME TRUST 21
STRONG EMPHASIS ON CAPITAL PRESERVATION WHEN IT MATTERS MOST
Neuberger
Berman
U.S. High Yield
Composite
0 Defaults
Neuberger
Berman
U.S. High Yield
Composite
0 Defaults
_______________________
Source: Neuberger Berman as of June 30, 2018. 1The benchmark is the ICE BofAML U.S. High Yield Master II Constrained Index, which is designed to measure the performance of below investment grade US dollar-denominated corporate bonds publicly issued in the US domestic market, including
144A issues. The benchmark is calculated on a total return basis. Periods less than one year are not annualized. The performance presented is supplemental to the GIPS-compliant presentation included as part of this presentation in the back. Indices
are unmanaged, are not available for direct investment and are not subject to fees and expenses typically associated with managed accounts or investment funds. Please see additional notes and disclosures, which are required as part of this
presentation. Preliminary returns, based on unreconciled data.
Past performance is not a reliable indicator of future performance. As with any investment, there is the possibility of profit as well as the risk of loss. Historical trends do not imply, forecast or guarantee future results.
INTERNET
BUBBLE
BURSTS
GLOBAL
FINANCIAL
CRISIS
COMMODITY
COLLAPSE
RETURNS (%)1 1998 1999 2000 2001 2002 2003 2004 2005 2006 2007 2008 2009 2010 2011 2012 2013 2014 2015 2016 2017 YTD
2018
Neuberger Berman
U.S. High Yield Composite
(Net-of-fees)
7.6 5.6 -1.3 6.2 3.8 27.7 8.7 4.8 10.1 2.2 -17.8 52.6 15.2 4.1 15.6 7.7 2.0 -4.1 14.8 5.8 -0.1
Benchmark 2.9 2.4 -5.2 4.5 -0.5 28.0 10.9 2.8 10.8 2.5 -26.1 58.1 15.1 4.4 15.6 7.4 2.5 -4.6 17.5 7.5 0.1
Neuberger
Berman
U.S. High Yield
Composite
0 Defaults

NB GLOBAL CORPORATE INCOME TRUST 22
INVESTMENT PERFORMANCE DISCLOSURE STATEMENT U.S. High Yield Composite (Inception 12/01/1997)
Compliance Statement • Neuberger Berman Group LLC ("NB", "Neuberger Berman" or the "Firm") claims compliance with the Global Investment
Performance Standards (GIPS®) and has prepared and presented this report in compliance with the GIPS® standards. Neuberger Berman was independently verified for the period January 1, 2011 to December 31, 2016. The GIPS® firm definition was redefined effective January 1, 2011. For prior periods there were two separate firms for GIPS® firm definition purposes and such firms were independently verified for the periods January 1, 1997 to December 31, 2010 and January 1, 1996 to December 31, 2010, respectively. Verification assesses whether (1) the firm has complied with all the composite construction requirements of the GIPS® standards on a firm-wide basis and (2) the firm's policies and procedures are designed to calculate and present performance in compliance with the GIPS® standards. The NB Full Market High Yield composite has been examined for the periods January 1, 1998 to December 31, 2016. The verification and performance examination reports are available upon request.
Definition of the Firm • The firm is currently defined for GIPS® purposes as Neuberger Berman Group LLC, ("NB", "Neuberger Berman" or the
"Firm"), and includes the following subsidiaries: Neuberger Berman Investment Advisers LLC, Neuberger Berman Europe Ltd., Neuberger Berman Asia Ltd., Neuberger Berman East Asia Ltd., Neuberger Berman Singapore Pte. Ltd., Neuberger Berman Taiwan Ltd, Neuberger Berman Australia Pty. Ltd., Neuberger Berman Trust Company N.A., Neuberger Berman Trust Company of Delaware N.A. and NB Alternatives Advisers LLC.
Policies • Policies for valuing portfolios, calculating performance, and preparing compliant presentations are available upon
request. Composite Description • The U.S. High Yield Composite (the "Composite") includes the performance of all fee-paying U.S. High Yield portfolios,
with no minimum investment, managed on a fully discretionary basis by the Non Investment Grade Fixed Income team. The U.S. High Yield strategy is designed for investors who seek to achieve returns relative to a broad high yield bond index. The emphasis is on avoidance of credit deterioration, sector rotation and relative value bond selection. The
Composite creation and performance inception date is December 1997. A complete list of Neuberger Berman's composites is available upon request.
Primary Benchmark Description • The benchmark is the ICE BofAML U.S. High Yield Master II Constrained Index (the "Index"). The index is designed to
measure the performance of below investment grade US dollar-denominated corporate bonds publicly issued in the US domestic market, including 144a issues. The benchmark is calculated on a total return basis. Additional disclosures for complete benchmark descriptions are available upon request.
Reporting Currency • Valuations are computed and performance is reported in U.S. Dollars. Fees • Composite Gross of Fee returns are the return on investments reduced by any trading expenses incurred during the
period. Composite Net of Fee returns are the Gross of Fee returns reduced by investment advisory fees. Fee Schedule • The annual investment advisory fee, generally payable quarterly, is as follows: 0.55% on the first $50mn; 0.45% on the
next $250mn; 0.35% thereafter. Internal Dispersion • Internal dispersion is calculated using the asset-weighted standard deviation of annual gross returns of those portfolios
that were in the Composite for the entire year. Internal dispersion is not calculated if the Composite does not contain at least 6 portfolios for the entire year.
Annualized Standard Deviation • The three-year annualized standard deviation measures the variability of the Composite and the benchmark returns over
the preceding 36-month period. The standard deviation is not required for periods prior to 2011.
Composite Benchmark Composite 3 Year Standard Deviation
Total Return
(%, Gross
of Fees)
Total Return
(%, Net
of Fees)
ICE BofAML US
HY Master II
Constrained
Index (%)
No. of
Accounts
Market Value
($, m)
Total Firm
Assets
($, bn)
% of Firm
Assets
Internal
Dispersion
Composite
(%)
ICE BofAML US HY
Master II
Constrained Index
(%)
YTD Jun-
20180.07 -0.13 0.08 29 7,602.4 -- -- -- 4.73 5.42
2017 6.21 5.78 7.48 30 9,866.1 295.2 3.34 0.07 5.00 5.59
2016 15.22 14.76 17.49 25 8,222.6 255.2 3.22 0.17 5.59 6.01
2015 -3.73 -4.12 -4.61 24 6,392.1 240.4 2.66 0.17 5.63 5.26
2014 2.38 2.00 2.51 24 7,466.8 250.0 2.99 0.08 5.15 4.44
2013 8.09 7.72 7.41 24 7,630.5 241.7 3.16 0.10 7.41 6.43
2012 15.99 15.61 15.55 21 6,841.4 205.0 3.34 0.14 8.13 7.02
2011 4.54 4.11 4.37 21 6,777.4 193.1 3.51 0.32 11.05 10.96
2010 15.64 15.18 15.07 12 4,882.1 80.1 6.10 0.37 -- --
2009 53.11 52.64 58.10 11 3,587.6 75.8 4.73 2.54 -- --
2008 -17.47 -17.77 -26.11 11 2,249.9 78.8 2.86 0.73 -- --

NB GLOBAL CORPORATE INCOME TRUST 23
INDEX DEFINITIONS
ICE Bank of America Merrill Lynch U.S. High Yield Index: This index tracks the performance of US dollar denominated below investment grade corporate debt publicly issued
in the US domestic market. Qualifying securities must have a below investment grade rating (based on an average of Moody’s, S&P and Fitch), at least 18 months to final
maturity at the time of issuance, at least one year remaining term to final maturity as of the rebalancing date, a fixed coupon schedule and a minimum amount outstanding of $250
million.
ICE BofAML U.S. High Yield Master II Constrained Index: This index tracks the performance of below investment grade U.S. dollar-denominated corporate bonds publicly
issued in the U.S. domestic market, including 144a issues. Yankee bonds (debt of foreign issuers issued in the U.S. domestic market) are included in the index provided the
issuer is domiciled in a country having an investment grade foreign currency long-term debt rating (based on a composite of Moody’s and S&P). Qualifying bonds must have at
least one year remaining to maturity, a fixed coupon schedule and a minimum amount outstanding of $250 million. Qualifying bonds are capitalization-weighted provided the total
allocation to an individual issuer (defined by Bloomberg tickers) does not exceed 2%. Issuers that exceed the limit are reduced to 2% and the face value of each of their bonds is
adjusted on a pro-rata basis. Similarly, the face value of bonds of all other issuers that fall below the 2% cap are increased on a pro-rata basis.
The Bloomberg Barclays U.S. Aggregate Index: The Barclays U.S. Aggregate Index represents securities that are SEC-registered, taxable, and dollar denominated. The index
covers the U.S. investment grade fixed rate bond market, with index components for government and corporate securities, mortgage pass-through securities, and asset-backed
securities. These major sectors are subdivided into more specific indices that are calculated and reported on a regular basis.
S&P/LSTA Leveraged Loan Index: The S&P/LSTA Leveraged Loan index is a daily total return index that uses LSTA/LPC Mark-to-Market Pricing to calculate market value
change. On a real-time basis, the S&P/LSTA Leveraged Loan index tracks the current outstanding balance and spread over LIBOR for fully funded term loans. The facilities
included in the index represent a broad cross section of leveraged loans syndicated in the United States, including dollar-denominated loans to overseas issuers.
S&P/LSTA U.S. Leveraged Loan 100 Index: The S&P/LSTA Leveraged Loan 100 Index is a market value-weighted index designed to measure the performance of the U.S.
leveraged loan market. The index consists of 100 loan facilities drawn from a larger benchmark - the S&P/LSTA (Loan Syndications and Trading Association) Leveraged Loan
Index (LLI), which covers more than 900 facilities and had a market value of more than US$ 490 billion on June 30th, 2011. As of June 30, 2011, the S&P/LSTA U.S. Leveraged
Loan 100 Index had a total market value of US$ 183.4 billion.
J.P. Morgan Global High Yield Index: The J.P. Morgan Global High Yield Index consists of fixed income securities of domestic and foreign issuers with a maximum credit rating
of BB+ or Ba1.

NB GLOBAL CORPORATE INCOME TRUST 24
INDEX DEFINITIONS
Bloomberg AusBond Composite 0+ Yr Index: The Bloomberg AusBond Composite 0+ Yr Index is engineered to measure the Australian debt market and is a composite of
Treasury, Semi-Govt, Supra/Sov, and Credit indices. This is a legacy UBS index and is a subset of the Bloomberg AusBond Master Index. It is a rules-based, market value
weighted index which includes bonds maturing in 0+ years.
MSCI World Index: The MSCI World Index (Net) is a broad global equity benchmark that represents large and mid-cap equity performance across 23 developed markets
countries: Australia, Austria, Belgium, Canada, Denmark, Finland, France, Germany, Hong Kong, Ireland, Israel, Italy, Japan, the Netherlands, New Zealand, Norway, Portugal,
Singapore, Spain, Sweden, Switzerland, the United Kingdom, and the United States. It covers approximately 85% of the free float-adjusted market capitalization in each country
and does not offer exposure to emerging markets.
S&P 500 Index: The S&P 500 Index is a capitalization weighted index comprised of 500 stocks chosen for market size, liquidity, and industry group representation. The S&P 500
Index is constructed to represent a broad range of industry segments in the U.S. economy. The S&P 500 focuses on the large-cap segment of the market with over 80%
coverage of US equities. Criteria for inclusion include financial stability (minimize turnover in the index), screening of common shares to eliminate closely held companies and
trading activity indicative of ample liquidity and efficient share pricing. Companies in merger, acquisition, leveraged-buy-outs, bankruptcy (Chapter 11 filing or any shareholder
approval of recapitalization which changes a company’s debt-to-equity ratio), restructuring, or lack of representation in their representative industry groups are eliminated from
the index.
S&P/ASX 200 Index : The S&P/ASX 200 measures the performance of the 200 largest index-eligible stocks listed on the ASX by float-adjusted market capitalization.
Representative liquid and tradable, it is widely considered Australia's preeminent benchmark index. The index is float-adjusted. The index was launched in April 2000.
S&P/ASX 20 Index : The S&P/ASX 20 is designed to measure actively traded and highly liquid securities that are among the 20 largest securities listed on the ASX.
S&P/ASX 200 A-REIT Index: A sector subindex of the S&P/ASX 200, this index tracks the performance of Australian real estate investment trusts (A-REITs) and mortgage
REITs.
NB GLOBAL CORPORATE INCOME TRUST 25
INDEX DEFINITIONS
U.S. Treasury: 1-3 Year: Securities in the Treasury Index (i.e., public obligations of the U.S. Treasury) with a maturity from 1 up to (but not including) 3 years.
U.S. Credit Description: Publicly issued U.S. corporate and specified foreign debentures and secured notes that meet the specified maturity, liquidity, and quality requirements. To
qualify, bonds must be SEC-registered.
U.S. Treasury: Public obligations of the U.S. Treasury with a remaining maturity of one year or more. Exclusions:
• Treasury bills are excluded (because of the maturity constraint).
• Certain special issues, such as flower bonds, targeted investor notes (TINs), and state and local government series (SLGs) bonds are excluded.
• Coupon issues that have been stripped are reflected in the index based on the underlying coupon issue rather than in stripped form. Thus STRIPS are excluded from the index
because their inclusion would result in double counting. However, for investors with significant holdings of STRIPS, customized benchmarks are available that include STRIPS
and a corresponding decreased weighting of coupon issues.
• Treasuries not included in the Aggregate Index, such as bills, coupons, and bellwethers, can be found in the index group Other Government on the Index Map.
• As of December 31, 1997, Treasury Inflation-Protection Securities (Tips) have been removed from the Aggregate Index. The Tips index is now a component of the Global Real
index group.
U.S. Treasury Bills: 1-3 Months: The Barclays Treasury Bill Index includes U.S. Treasury bills with a remaining maturity from 1 up to (but not including) 12 months. It excludes
zero coupon strips.

NB GLOBAL CORPORATE INCOME TRUST 26
DISCLAIMER
Equity Trustees Limited (“EQT”) (ABN 46 004 031 298, AFSL 240975) is the Responsible Entity and issuer of Units in the NB Global Corporate Income Trust (ARSN 627 297 241)
(“NB GCIT”). EQT is a subsidiary of EQT Holdings Limited (ABN 22 607 797 615), a publicly listed company on the Australian Securities Exchange (ASX: EQT).
The invitation to acquire Units in NB GCIT (the “Offer”) is made through, and subject to, the Product Disclosure Statement (the “PDS”), which is issued by EQT. The PDS was lodged
with the Australian Securities and Investments Commission on 6 August 2018 and is available on NB GCIT’s website at www.nb.com/NBI. You should obtain a copy of the PDS and
consider its contents carefully before making a decision about whether to acquire or continue to hold units in NB GCIT.
EQT has no relationships or associations with any other related body corporate or product issuer that might reasonably be expected to influence EQT in providing financial services to
you other than being the responsible entity of NB GCIT. Neither EQT, nor any related body corporate nor any associate is paid an amount for the provision of any financial services to
you (which may be the provision of general financial product advice) other than the fee it receives for being responsible entity of NB GCIT as described in the PDS. EQT can be
contacted on +61 3 8623 5000.
This document, and the information contained herein, is not, and does not constitute, directly or indirectly, a public or retail offer or invitation to buy or sell, or a public or retail
solicitation or recommendation of an offer to buy or sell, any fund, units or shares of any fund or trust, security or other instrument (“Securities”), or to participate in any investment
strategy. This document is made available for informational and discussion purposes only. This document is not a prospectus, product disclosure statement or other offer document
under Australian law or under any other law. This document has not been filed, registered or approved by regulatory authorities in any jurisdiction. By reading this document, you
agree to be bound by the limitations set out in this document.
This document has been prepared to provide you with general information only. It is not intended to take the place of professional advice and you should not take action on specific
issues in reliance on this information. No recommendation or advice is being given as to whether any investment or strategy referred to in this document is suitable for you. It should
not be assumed that any investments in securities, companies, sectors or markets identified and described were or will be profitable. Investing entails risks, including possible loss of
principal. Past performance is not a reliable indicator of future performance. In preparing this information, we did not take into account the investment objectives, financial situation or
particular needs of any particular person. Before you act on the information in this document, consider its appropriateness, having regard to your investment objectives, financial
situation and needs.
NB GLOBAL CORPORATE INCOME TRUST 27
DISCLAIMER
Statements, opinions and information in this document are current only as at 30th June 2018 and are subject to change without notice. The information contained in this document is
for information purposes only and is an overview and does not contain all information necessary to make an investment decision or that would be required in a product disclosure
statement prepared in accordance with the requirements of the Corporations Act 2001 (Cth). The information contained in this document is of a general nature and does not purport to
be complete or verified by EQT, NB Australia or any other person. EQT, NB Australia and their respective officers, employees and affiliates and their advisers (“Limited Person”), do
not represent that such information is accurate or complete, and it should not be relied upon as such. Certain information contained in this document (including any forward-looking
statements and economic and market information) has been obtained from published sources and/or prepared by third parties and in certain cases has not been updated through the
date of this document. While such sources are believed to be reliable, the Limited Persons do not assume any responsibility for the accuracy or completeness of such information.
Any views or opinions expressed may not reflect those of the Limited Persons as a whole. In addition, nothing in this document constitutes legal, accounting or tax advice. None of the
Limited Persons have any responsibility or obligation to inform you of any matter arising or coming to their notice after the date of this document, which may affect any matter referred
to in this document.
None of the Limited Persons, make any guarantee, representation or warranty, express or implied, with respect to the fairness, correctness, accuracy, reasonableness or
completeness of any of the information, opinions, forecasts, reports, estimates and conclusions contained in this document (including, but not limited to, information obtained from
unrelated third parties). Each Limited Person expressly disclaims any and all responsibility or liability for any loss arising from the use or reliance on information contained in this
document, or in relation to the accuracy or completeness of the information contained in, arising out of or derived from, or omissions from, this document, including, without limitation,
any estimates or projections or implied representation or warranty with respect to such information.
Certain statements in this document constitute forward looking statements and comments about future events, including NB Australia’s expectations about the performance of NB
GCIT’s investments. Such forward looking statements involve known and unknown risks, uncertainties, assumptions and other important factors, many of which are beyond the
control of NB Australia and which may cause actual results, performance or achievements to differ materially from those expressed or implied by such statements. Forward looking
statements are provided as a general guide only, and should not be relied on as an indication or guarantee of future performance. Given these uncertainties, recipients are cautioned
to not place undue reliance on any forward looking statement. Subject to any continuing obligations under applicable law or any relevant listing rules of the ASX, the Limited Persons
disclaim any obligation or undertaking to disseminate any updates or revisions to any forward looking statements in this document to reflect any change in expectations in relation to
any forward looking statements or any change in events, conditions or circumstances on which any such statement is based. Nothing contained in this document nor any information
made available to you is, or shall be relied upon as, a promise, representation, warranty or guarantee as to the past, present or the future performance of NB GCIT. No Limited
Person makes any representation, or gives any assurance or guarantee that the occurrence of the events expressed or implied in any forward looking statements in this document will
occur.
Distribution of this document outside Australia may be restricted by law. Persons who come into possession of this document who are not in Australia should seek advice on and
observe any such restrictions. Any failure to comply with such restrictions may constitute a violation of applicable securities laws. No action has been taken to register any securities
outside Australia.