Embed Size (px)
Citation preview

“Navigator Holdings Ltd. (NYSE:NVGS)”
Navigator Gas
MLP & Energy Infrastructure Conference
May 2018

This presentation contains certain statements that may be deemed to be
“forward-looking statements” within the meaning of applicable federal
securities laws. Most forward-looking statements contain words that identify
them as forward-looking, such as “may”, “plan”, “seek”, “will”, “expect”, “intend”,
“estimate”, “anticipate”, “believe”, “project”, “opportunity”, “target”, “goal”,
“growing” and “continue” or other words that relate to future events, as
opposed to past or current events. All statements, other than statements of
historical facts, that address activities, events or developments that Navigator
Holdings Ltd. (“Navigator” or the “Company”) expects, projects, believes or
anticipates will or may occur in the future, including, without limitation,
acquisitions of vessels, the outlook for fleet utilization and shipping rates,
general industry conditions, future operating results of the Company’s vessels,
capital expenditures, expansion and growth opportunities, business strategy,
ability to pay dividends and other such matters, are forward-looking
statements. Although the Company believes that its expectations stated in this
presentation are based on reasonable assumptions, actual results may differ
any expectations or goals expressed in, or implied by, the forward-looking
statements included in this presentation, possibly to a material degree.
Navigator cannot assure you that the assumptions made in preparing any of
the forward-looking statements will prove accurate or that any long-term
financial goals will be realized. All forward-looking statements included in this
presentation speak only as of the date made, and Navigator undertakes no
obligation to update or revise publicly any such forward-looking statements,
whether as a result of new information, future events, or otherwise. In
particular, Navigator cautions you not to place undue weight on certain
forward-looking statements pertaining to potential growth opportunities or long-
term financial goals set forth herein.
2
3
TABLE OF CONTENTS
NAVIGATOR GAS
SHIPPING MARKET
EXPORT TERMINAL JV
FINANCIAL INFORMATION
APPENDIX

NAVIGATOR GAS HIGHLIGHTS
4
Operates the largest fleet of specialised handy sized LPG vessels – with a total fleet of 38 vessels.
While global in scope, LPG seaborne trade has been propelled by U.S. shale gas. Further growth in seaborne LPG trade is expected with the opening of additional export terminals. This year, the 275,000 bbls/day Mariner East 2 pipeline, extending from eastern Ohio to the Delaware River at Marcus Hook, is expected to be operational. The opening of the pipeline will free large volumes of LPG for east coast exports that are now stranded in the Marcellus/Utica producing fields.
Driven by low U.S. natural gas prices, domestic petrochemical capacity expansion has been impressive. Over the next couple of years, America’s capacity to produce ethylene is expected to increase by nearly 50%. Petrochemical export infrastructure will be critical to avoid product overcapacity.
Navigator and Enterprise Product Partners have formed a joint venture to build a world scale ethylene export terminal in Texas. The terminal is expected to be operational late 2019.
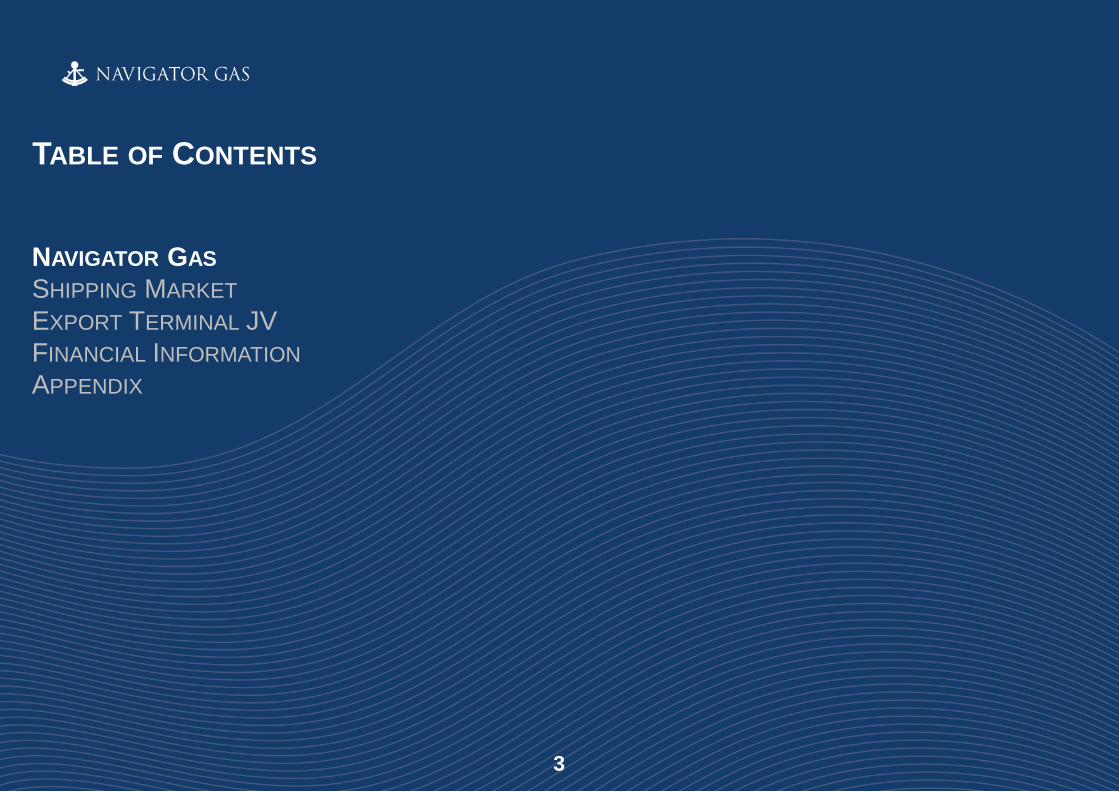
CARGO TYPES THAT CAN BE CARRIED: LPG; PETCHEMS & AMMONIA
5
LPG UseSource Cargo
Natural Gas (LNG) Production
Crude Oil Production
Shale Gas
Energy
Pet. Chem Feedstock
Agriculture
Liquefied Petroleum Gases (LPG)
A derivative from production of other fuels and LNG, used as
an energy source
Petrochemical Gases
Produced from saturated hydrocarbons and widely used in the chemical industry, e.g. in
producing polymers
Ammonia
Methane gas is used in producing ammonia, which is used e.g. in nitrogen-based
fertilizers
Engine Fuel

27%
7%
7%
1 36 7
18 18 20 2124 24
5 55
5 5
58
10 1010 10
2
4 4
2000 2008 2009 2011 2012 2013 2014 2015 2016 2017 2018
LPG Handy Ethylene Midsize Ethylene
6
NAVIGATOR AT A GLANCE
Annual US LPG Expot Capacity v US Export Global Trade Diversification
Other
*Europe 33% Africa & MEG 23% Asia 22% SAM 11% NAM 11%
* 2017 YTD Regional Cargo Volume
Leading Handysize Market Share ¦ Cargo Diversification Growing Together with Our Customers
Building for future markets
LPG
Petchems
•
2006: New
managementConsolidation Period
-
10,000
20,000
30,000
40,000
50,000
2012 2013 2014 2015 2016 2017 2018 2019 2020
KB
ls/m
on
th
Enterprise Products Partners, Houston Ship Channel Enterprise Products Partners New terminalTarga Resources, Galena Park Occidental Petroleum, Oxy Ingleside, Corpus Christi, TxMariner South Lonestar Sunoco Nederland terminal Boardwalk Moss LakeTrafigura, Corpus Christi Phillips 66 Freeport ExportSunoco/MarkWest, Marcus Hook Petrogas, FerndalePembina Watson Island Prince Rupert AltaGas,Ridley IslandUS LPG export
Source: ViaMar, 2018
27%
7
TABLE OF CONTENTS
NAVIGATOR GAS
SHIPPING MARKET
EXPORT TERMINAL JV
FINANCIAL INFORMATION
APPENDIX

12 - -
Source: Clarksons, 2018
GAS CARRIER FLEET OVERVIEW
8
Semi-Refrigerated /Pressure
Semi-Refrigerated / Pressure
Fully-RefrigeratedSemi-Refrigerated
Ethylene
Fully-RefrigeratedEthylene / Ethane
633 6 1%
332 16 5%
266425
--8
--
32%
9514
6-
6%-
284 37 13%

Market Share of existing handysize ethylene capable fleet
HANDYSIZE GAS FLEET OVERVIEW
Handysize Fleet Demographics
OwnerSemi Ref Fully Ref Total
Navigator Gas 17 6 23
Ultragas 9 - 9
Naftomar 4 3 7
Petredec 2 2 4
Beneleux 4 - 4
Pacific Carriers 4 - 4
Schulte 4 - 4
Stealth Gas 4 - 4
Yara - 3 3
Harpain 1 - 1
Other 15 12 27
Total 64 26 90
-6
-4
-2
0
2
4
6
8
10
12
19
82
19
83
19
84
19
85
19
86
19
87
19
88
19
89
19
90
19
91
19
92
19
93
19
94
19
95
19
96
19
97
19
98
19
99
20
00
20
01
20
02
20
03
20
04
20
05
20
06
20
07
20
08
20
09
20
10
20
11
20
12
20
13
20
14
20
15
20
16
20
17
20
18
20
19
20
20
Ethylene Non Ethylene Newbuilds ScrappingSolvang
Pacific Gas
Harpin
Petredec
Others
40%
OwnerExisting & Newbuild Total
Handysize Midsize VLEC
Navigator Gas 10 4 - 14
Evergas - 8 2 10
Solvang 8 - - 8
Reliance - - 6 6
Pacific Gas 5 - - 5
Petredec 4 - - 4
Harpain 4 - - 4
Ocean Yield - 2 - 2
Other 2 - - 2
Total 33 14 7 54
LPG Handysize Global Fleet Ethane/Ethylene Global Fleet
9

10
U.S. ETHYLENE FOCUS: COMPETITIVE FUNDAMENTALS
U.S. Gas Prices Underpins C2 Production Cash Cost
US Ethylene expansions 2017 – 2022 U.S. Ethylene production vs domestic demand
Structural Shift for Navigator Gas C2 exports: U.S. in focus
Source: ESI, Bloomberg, 2017, & IHS, 2016
2017 2018 2019 2020-22
Oxy 1,200
Westlake Calvert 100
Dow Freeport 3,300
Formosa 300
CP Chem 3,300
Exxon Baytown 3,300
Indorama 800
Formosa 2,500
Sasol 3,300
LACC 2,200
Shintech 1,100
Shell 3,300
Total/Nova 2,200
-
5
10
15
20
25
30
35
40
45
50
Existing (Jan2017)
New Capacity
Mts
Mill
ion
s
+50%
-
2
4
6
8
10
12
14
16
18
20
Jan-2013 Jul-2014 Jan-2016 Jul-2017 Jan-2019
USD
/MM
Btu
Mt. Belvieu ethane Henry Hub natural gas WTI crude -
20,000
40,000
60,000
80,000
100,000
120,000
140,000
160,000
2012 2013 2014 2015 2016 2017
Mts
Per
An
nu
m
Middle East Exports North AmericaExports

-
50,000
100,000
150,000
200,000
250,000
300,000
350,000
2000 2001 2002 2003 2004 2005 2006 2007 2008 2009 2010 2011 2012 2013 2014 2015 2016 2017
Mts
GREATER U.S TERMINAL EXPANSION BENEFITS NAVIGATOR
11
ETHYLENE

12
TABLE OF CONTENTS
NAVIGATOR GAS
SHIPPING MARKET
EXPORT TERMINAL JV
FINANCIAL INFORMATION
APPENDIX
13
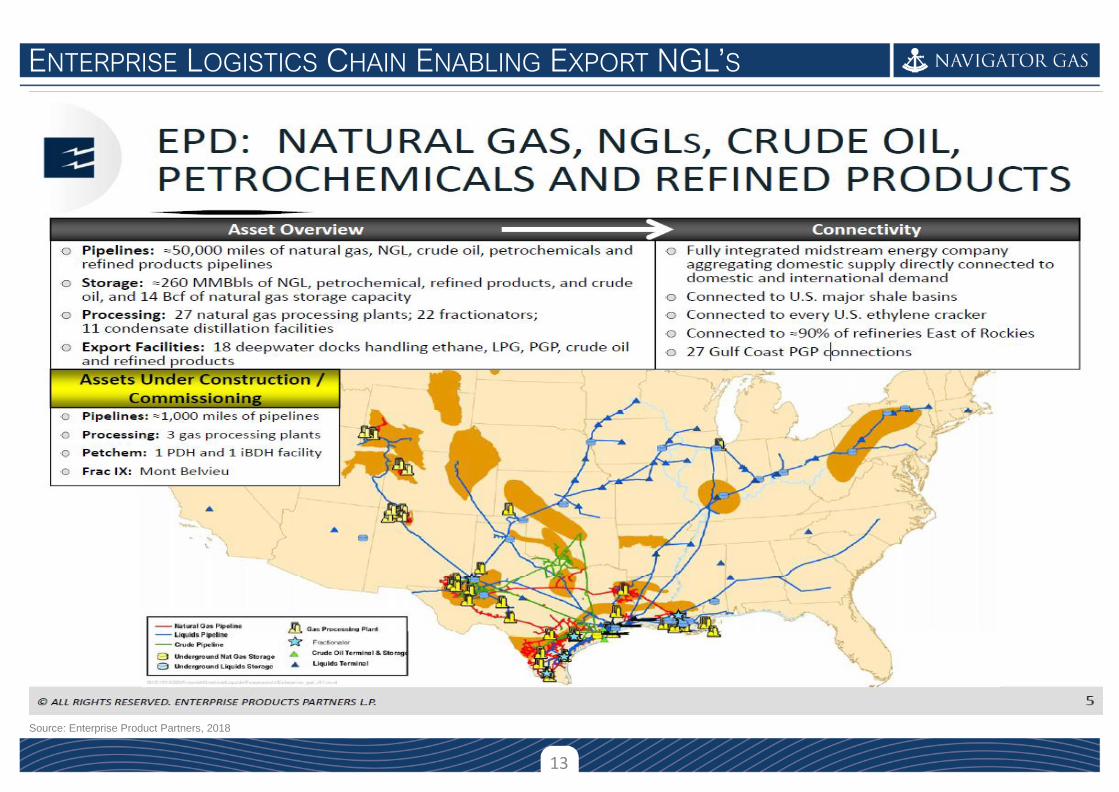
ENTERPRISE LOGISTICS CHAIN ENABLING EXPORT NGL’S
Source: Enterprise Product Partners, 2018

14
MONT BELVIEU SALT DOMES
Enterprise dedicated 600M pound of ethylene capacity in one Salt Dome storage cavern.
Injection/withdrawal of 420,000 pounds p/hour.
Pipeline connections to major ethylene producers.

15
MONT BELVIEU SALT DOMES
Mont Belvieu Caverns
Source: Enterprise Product Partners, 2017

16
ETHYLENE , STORAGE, TRANSPORT & EXPORT
Mt. Belvieu Caverns
& Storage
Ethylene pipeline
Shale fracking provides abundance NGL’s
Almost unlimited storage for NGL’s from natural salt domes.
Unrivalled pipeline connectivity to all major crackers in gulf coast.
Dedicated 30k ton refrigeration tank enable loading at 1k tons an hour.
Dedicated docks facilitating ethylene shipments to European and Asian consumers
US Gulf infrastructure set for NGL exports across the globe
17
TABLE OF CONTENTS
NAVIGATOR GAS
SHIPPING MARKET
EXPORT TERMINAL JV
FINANCIAL INFORMATION
APPENDIX

2018 3M HIGHLIGHTS
2018 3M HIGHLIGHTS
Gross Revenue EBITDA NET INCOME
US$77.8m US$30.5m US$0.7m
Vessels owned Avg daily charter rate Fleet Utilization
38 US$20,190 91.7%
18
$200
$700
$1,200
$1,700
$2,200
2008 2009 2010 2011 2012 2013 2014 2015 2016 2017 2018
Source: Clarksons Platou Gas 2017
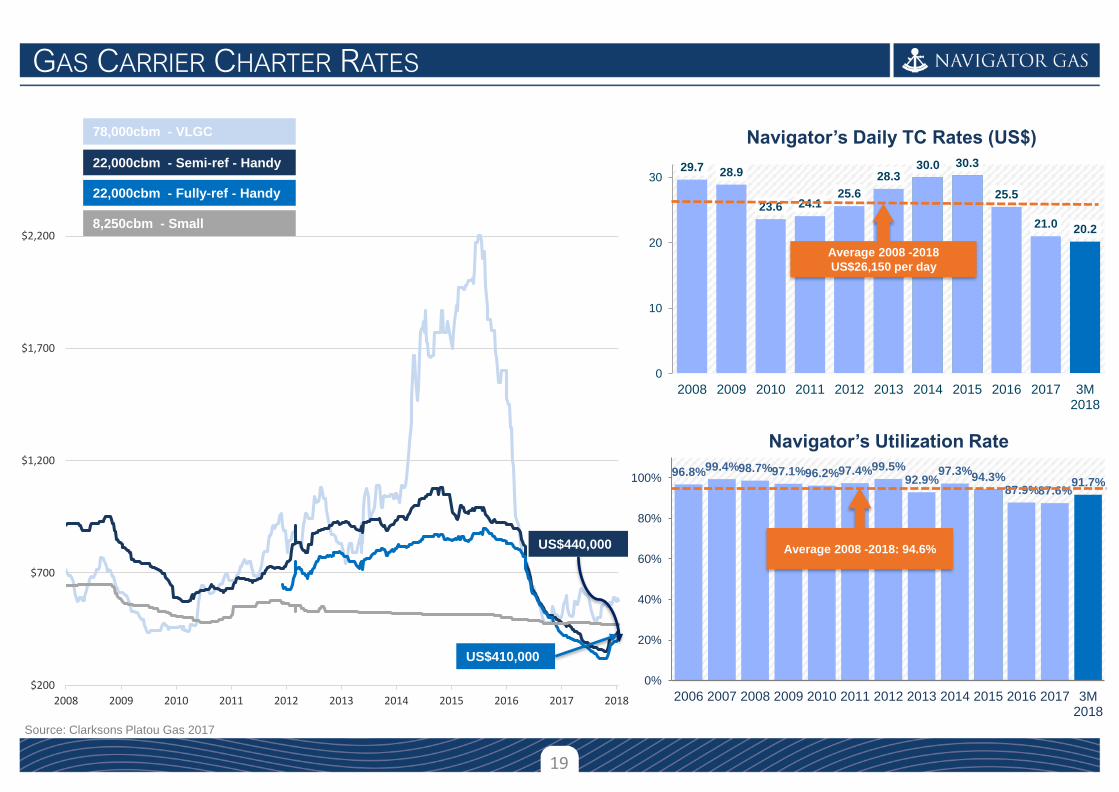
96.8%99.4%98.7%97.1%96.2%97.4%99.5%92.9%
97.3%94.3%
87.9%87.6%91.7%
0%
20%
40%
60%
80%
100%
2006 2007 2008 2009 2010 2011 2012 2013 2014 2015 2016 2017 3M2018
Navigator’s Utilization Rate
29.7 28.9
23.6 24.125.6
28.330.0 30.3
25.5
21.0 20.2
0
10
20
30
2008 2009 2010 2011 2012 2013 2014 2015 2016 2017 3M2018
Navigator’s Daily TC Rates (US$)
Average 2008 -2018
US$26,150 per day
Average 2008 -2018: 94.6%
GAS CARRIER CHARTER RATES
19
78,000cbm - VLGC
22,000cbm - Semi-ref - Handy
22,000cbm - Fully-ref - Handy
8,250cbm - Small
US$440,000
US$410,000

COMMITTED REVENUE
20
Total US$ 475.6M in committed revenue
Committed revenue for the Navigator fleet
Remaining 9M
of 20182019 2020 Total
Available days 10,363 13,656 13,661 37,680
Committed charter days1 4,497 4,692 2,866 11,055
Uncommitted days 5,866 9,964 10,795 26,625
Charter coverage 43.39% 27.04% 20.98% 29.34%
Committed revenue (US$’M) 212.74 89.54 77.31 273.223
Average committed TC equivalent rate (US$ / d) 23,654 24,252 26,975 24,715
Committed EBITDA2 (US$’M) 68.8 58.7 53.4 180.8
2021+
Committed Revenue EBITDA Average TCE Committed Revenue
US$273.2M US$180.8M US$24,715 US$202.4M
2018-2020
1) The committed revenue as at 31/03/2018, excluding the continuation of the charters in Indonesia and Venezula.2) Committed EBITDA calculated as contracted revenue less estimated vessel operating expenses based on average for FY 2017, excluding estimated broker
commissions and other charter-related fees and expenses, any non-charter related costs such as general and administrative costs, drydocking expenses and other costs.
3) The total committed revenue beyond 2021 of $202.4 is excluded, represented by 6 vessels on committed time charters which expire up to December 2026.

DAILY OPERATING EXPENSES
7,1027,316
7,632
7,9168,115 8,068
7,7797,925
7,6357,809
0
1,000
2,000
3,000
4,000
5,000
6,000
7,000
8,000
9,000
2009 2010 2011 2012 2013 2014 2015 2016 2017 3M 2018
(US$)
60%
3%
14%
0%
5%
3%
7%
8%
Crew Lubes & Stores Repairs
Upgrade Insurance Admin
Tech Mgt Other
21
Analysis of Operating ExpensesNavigator’s Daily Operating Expenses

22
BREAK EVEN ANALYSIS
Comments Break even and TCE rates
For the three months ended 31st of March 2018, the Company had a cash break even rate of US$ 10,054 per day per vessel, before interest expenses and debt repayment
Including interest expenses, the cash break even rate increases to US$ 13,131 per day per vessel
Including debt repayment, the cash break even rate increases to US$ 19,140 per day per vessel
Navigator has consistently obtained an average TCE equivalent significantly above the Company’s cash break even rate
Navigator gas committed revenue over the next three years at an average of US$ 24,715 per day for 29.3% of the fleet
12,932 13,386 13,456 13,57712,633
12,704 12,651 12,757 12,387 12,707 13,131
31,08130,282
29,561
27,233
22,97522,758
21,712 21,60120,226 20,586 20,190
-
5,000
10,000
15,000
20,000
25,000
30,000
35,000
Q3'15 Q4'15 Q1'16 Q2'16 Q3'16 Q4'16 Q1'17 Q2'17 Q3'17 Q4'17 Q1'18
USD/d
Operating expenses Brokerage commission G&A
Drydocking costs Interest expenses Average TCE rate

STRONG BALANCE SHEET & BANKING
RELATIONSHIPS
As of March 31, 2018 Actual
Cash 50.8
Debt
Secured term loan facilities 749.1
Unsecured Notes 100.0
Total Debt 849.1
Total Shareholders' equity 960.9
Total capitalization 1,810.0
Debt / Capitalization 46.9%
(US$'M)Current Lenders
23

INDEBTEDNESS
Lending Facilities Outstanding - end of year (US$’M)
100 100 100 100 100
201179
100 88
247
230
214197
109
93
77
60
44
132
116
99
83
66
200
788
718
589
529
410
2018 2019 2020 2021 2022
Bond facility US$278 million facility
US$290 million facility US$220 million facility
US$160.8 million facility US$200 million New facility
Current Facilities
▪ Senior Unsecured Notes maturing in February 2021.
▪ US$278 million Secured Term Loan expiring
between June 2020 and February 2023
▪ US$290 million Secured Term Loan expiring from
December 2022
▪ US$220 million Secured Term Loan expiring in
January 2024
▪ US$160.8 million Secured Term Loan expiring in
June 2023
▪ Assumed US$200 million secured Term Loan to
refinance $278 million and $290 million facilities in
2022.
Revolving Credit Facility
• US$220 million Revolving Credit Facility has $48.1
million available to drawdown
• US$160.8 million Revolving Credit Facility has $3.8
million available to drawdown
24

(US$'M) 2012 2013 2014 2015 2016 2017 3 Months 2018
Assets
Cash and cash equivalents 150.9 194.7 62.5 87.8 57.3 62.1 50.8
Other current assets 20.3 31.9 22.0 37.2 36.5 50.0 40.2
Vessels in operation (net) 586.7 1,026.3 1,145.1 1,264.4 1,480.4 1,740.1 1,722.6
Vessels under construction 20.1 60.2 131.4 170.8 150.5 - -
Investment in equity accounted joint venture - - - - - - 10.5
Other fixed assets 54.1 12.1 9.5 10.4 9.9 1.6 1.6
832.1 1,325.2 1,370.5 1,570.6 1,734.6 1,853.9 1,825.7
Liabilities and Stockholders' equity
Current liabilities 16.2 29.0 21.9 30.3 24.2 18.5 15.6
Secured term loan facilities 243.2 450.5 417.9 505.3 653.9 772.2 749.3
Senior unsecured bond 125.0 125.0 125.0 125.0 100.0 100.0 100.0
Common Stock - $0.01 par value; 400 million shares
authorized0.1 0.6 0.6 0.6 0.6 0.6 0.6
Additional paid-in capital 352.6 584.0 584.8 586.4 588.0 589.4 589.7
Accumulated other comprehensive income -0.1 -0.1 -0.3 -0.5 -0.3 -0.3 -0.3
Retained earnings 95.1 136.2 220.6 323.5 368.2 373.5 370.8
Total stockholders' equity 447.7 720.7 805.7 910.0 956.5 963.2 960.9
FINANCE: BALANCE SHEET
25

(US$'M) 2013 2014 2015 2016 2017 3 Months 2018
Net operating revenue 189.0 259.9 281.5 251.9 243.1 62.8
Operating expenses:
Address and brokerage commissions 5.5 6.7 7.0 5.8 5.4 1.1
Charter in costs 6.8 9.1 - 0.0 0.0 -
Vessel operating expenses 60.3 70.2 78.8 90.9 101.0 26.7
Depreciation and amortisation 36.6 45.8 54.0 62.3 73.6 19.4
General & administrative expenses 9.6 12.6 13.6 15.0 15.9 4.4
Sale of vessel 0.0 0.0 -0.6 0.0 0.0 -
Total operating expenses 118.8 144.4 152.8 174.0 195.9 51.7
Operating Income 70.2 115.5 128.7 78.0 47.2 11.2
Net interest expense -27.5 -26.9 -29.8 -32.1 -41.5 -10.4
Income before income and taxes 42.7 88.6 98.9 45.8 5.7 0.8
Income taxes -0.5 -0.9 -0.8 -1.2 -0.4 -0.1
Net Income 42.2 87.7 98.1 44.6 5.3 0.7
Earnings per share 0.9 1.5 1.8 0.8 0.8 0.1
Avg. number of shares in issue (millions) 46.0 55.3 55.4 55.4 55.4 55.5
EBITDA 106.8 161.3 182.1 140.2 120.8 30.5
FINANCE: INCOME STATEMENT
26

(US$'M) 2014 2015 2016 2016 2017 3 Months 2018
Net Income 87.7 98.1 44.6 44.6 5.3 0.7
Depreciation and amortisation 45.8 53.5 62.3 62.3 73.6 19.4
Drydocking payments -5.3 -11.6 -9.9 -9.9 -0.3 -1.5
Non cash movements 3.8 5.9 4.9 4.9 6.6 0.8
Change in working capital 1.1 3.6 -15.2 -15.2 -9.3 2.7
Net Cash from Operating Activities 133.1 149.5 86.7 86.7 75.9 22.1
Investment in fixed assets -231.9 -237.8 -238.2 -238.2 -183.0 -10.5
Proceeds from sale of fixed assets - 32.0 0.0 0.0 0.0 -
Net Cash for Investments -231.9 -205.8 -238.2 -238.2 -183.0 -10.5
Change in net debt -33.1 81.6 120.9 120.9 111.9 -22.9
Change in equity - - - - - -
Other -0.3 - - - - -
Net Cash from financing -33.4 81.6 120.9 120.9 111.9 -22.9
Change in cash balance -132.2 25.3 -30.5 -30.5 4.8 -11.3
FINANCE: CASH FLOW STATEMENT
27

STRATEGY & OUTLOOK
28
Maintain dominant position in the company's core handy LPG segment. Upgrade/renew fleet as necessary.
Secure long-term commitments on our mid-sized ethylene carriers. Build additional vessels, if required to
cover by new long-term contracts.
Complete construction of an ethylene export terminal on the US Gulf with our co-owner, Enterprise Product
Partners.
Be open to additional infrastructure investment opportunities that may be required to handle the anticipated
growth in petrochemical and LPG exports.
Maintain strong and flexible Balance Sheet.

29
TABLE OF CONTENTS
NAVIGATOR GAS
SHIPPING MARKET
EXPORT TERMINAL JV
NAVIGATOR FINANCIAL INFORMATION
APPENDIX

MANAGEMENT
David Butters
Chairman, President and Chief
Executive Officer
■ Chairman of the Board since August 2006
■ Former managing director at Lehman Brothers Inc, where he was employed for more than 37 years
■ Chairman of the board of directors of GulfMark Offshore, Inc. and a member of the board of directors of Weatherford International Ltd.
■ Mr. Butters holds a BA from Boston College and an MBA from Columbia University
Niall Nolan
Chief Financial Officer
■ Appointed Chief Financial Officer of Navigator Gas in August 2006
■ Worked for Navigator Holdings as a representative of the creditors’ committee during Navigator Holdings’ bankruptcy proceedings
■ Prior to that, Mr. Nolan was group Finance Director of Simon Group PLC, a U.K. public company
■ Mr. Nolan is a Fellow of the Association of Chartered Certified Accountants.
Øyvind Lindeman
Chief Commercial Officer
■ Appointed Chartering Manager of Navigator Gas in November 2007, before being appointed Chief Commercial Officer in January 2014
■ Employed for five years at A.P. Moeller-Maersk prior to joining Navigator Gas
■ Mr. Lindeman holds a BA with honours from University of Strathclyde and an Executive MBA with distinction from Cass Business School
Demetris Makaritis
Director of Commercial
Operations
■ Appointed Director of Commercial Operations in April 2016 having been an Operations & Vetting Manager as well as a Technical
Superintendent for the Company since joining in 2010
■ Prior to joining Navigator, Mr Makaritis worked as an operations supervisor for Zodiac Maritime Agencies Ltd. and as a naval architect
for SeaTec (V.Ships Group) in Glasgow
■ During his early career he sailed on board passenger ships as a junior engineer
■ Mr Makaritis holds a BEng (Hons) in Naval Architecture from Newcastle upon Tyne University, an MSc in Shipping, Trade & Finance
from Cass Business School, London and is a Chartered Engineer.
Paul Flaherty
Director of Fleet & Technical
Operations
■ Joined the Company as Director of Fleet and Technical Operations in December 2014
■ Prior to this Mr Flaherty was employed by JP Morgan Global Maritime as VP, Asset Management
■ Spent 17 years with BP Shipping Ltd as a Fleet and Technical Manager for both oil and gas vessels
■ Mr Flaherty is a Chartered Engineer and a Fellow of the Institute of Marine Engineers & Science Technicians (IMarEST).
30

31
Top 15 shareholders
■ Funds managed by WL Ross & Co Ltd represent a major
shareholder in the Company with 39.4% ownership share. WL Ross
& Co Ltd made their first investment in Navigator Holdings in
November 2011, and became the majority shareholder in May 2012
■ The CEO of the Company, David Butters, is the second largest
shareholder, owning 3.5% of the equity
LARGE SHAREHOLDERS
Name # shares ('000) Ownership
1 WL Ross & Co Ltd 21,864 39.4 %
2 David Butters 1,965 3.5 %
3 Spiros Milonas 1,555 2.8 %
4 Horizon Asset Management 1,388 2.5 %
5 Oppenheimer & Co. 1,196 2.2 %
6 Steinberg Asset Management 1,179 2.1 %
7 First Manhattan Co. 1,126 2.0 %
8 Paragon JV Partners 1,050 1.9 %
9 Hollow Brook Wealth Management 855 1.5 %
10 Emancipation Management 683 1.2 %
11 Gagnon Securities 630 1.1 %
12 Alpine Associates Management 606 1.1 %
13 Fort Washington Investment Advisors 590 1.1 %
14 Westfield Capital Management Co. 583 1.1 %
15 Jupiter Asset Management 579 1.0 %
Navigator Holdings was formed with the purpose of
building and operating a fleet of five semi-refrigerated,
ethylene-capable gas carriers
The Company’s initial vessels came into operation in
2000.
Navigator Holdings’ entire ownership and management
changed following the Company’s emergence from
Chapter 11. Lehman Brothers became the largest
shareholder.
W.L. Ross & Co, the Company’s largest shareholder,
made their first investment by acquiring 2.5m shares. W.L.
Ross became the majority shareholder in 2012 following
their acquisition of the Lehman Brothers shareholding.
The Company acquired 11 handysize gas vessels from
Maersk Tankers and gained the position as the world’s
largest operator of handysize gas vessels
Navigator Gas moved into the mid-sized market,
commissioning newbuild ethylene vessels with increased
capacity filling the needs of the Company’s business
partners
Initial Public Offering on the New York Stock Exchange
(NVGS).
Company Milestones1
99
72
00
02
00
62
01
12
01
22
01
32
01
62
01
7
Enterprise and Navigator execute a letter of intent to jointly
develop and ethylene marine export terminal.

NGT Services (UK) Limited
Verde Building
10 Bressenden Place
SW1E 5DH
United Kingdom
Tel: +44 (0) 20 7340 4850
Navigator Gas US, LLC
650 Madison Avenue
25th Floor
New York NY 10022
United States of America
Tel: +1 (212) 355 5893
www.navigatorgas.com