Embed Size (px)
Citation preview

Navigator Business Super■ Business Super
■ Employer Service
■ Personal Option
Trustee Annual Report 2007/2008
Life Insurance Investments Superannuation
FINALIST

Disclaimer
The Trustee has made every attempt to ensure the accuracy of the information included in this Annual Report and the 2007/2008 Annual Statement. However, some of the underlying information can change quickly and members should be aware their data may also change. In addition, the Trustee has in some cases, relied on information provided by third parties and the Trustee does not accept responsibility as to the accuracy and completeness of this information provided from another source.
The Trustee excludes, to the maximum extent permitted by law, any liability which may arise as a result of the contents, including but not limited to any errors or omissions.
The Annual Report does not constitute a recommendation or financial advice. The Annual Report has not been prepared to take into account the particular investment objectives, financial situation and particular needs of any particular person. Before acting on any information contained in the Annual Report a member needs to consider, with or without the assistance of a professional adviser whether the product is appropriate in light of their particular investment needs, objectives and financial circumstances.
You should read this Annual Report with your Annual Statement.
The Navigator Super Solutions (“the Plan”) incorporating the Navigator Super Solutions Employer Service and Navigator Super Solutions Personal Option are part of the Norwich Union Superannuation Trust (“NUST”), ABN 31 919 182 354. The Trustee of the Plan and issuer of interests in the Plan is NULIS Nominees (Australia) Limited ABN 80 008 515 633 Australian Financial Services Licence number (“AFSL number”) 236465 (the “Trustee”).
The Trustee currently invests wholly in, and all investment options are held through, an insurance policy issued by Norwich Union Life Australia Limited (ABN 34 006 783 295, AFSL number 241686) (“NULAL” or “the Administrator”). NULAL is:
• the administrator of the Plan
• the issuer of insurance policies held by the Trustee (not issuer of interests in the Plan), and
• the guarantor of the Norwich Union Capital Guaranteed Fund and the Norwich Union Cash Fund.
The Trustee, NULAL and Portfolio Partners Ltd (PPL) are part of the Aviva Australia group. The Group’s ultimate parent is Aviva plc, the world’s fifth largest insurance company. The Trustee has received permission from Navigator Australia Limited (ABN 45 006 302 987) AFSL number 236466 (“Navigator”), another member company of the Aviva Australia group, to use the name “Navigator” and the intellectual property associated with it in connection with the Plan. Note that Navigator Australia Limited, Aviva Australia Holdings Limited (ABN 38 095 045 784) and Aviva plc are not issuers of interests in the Plan and do not guarantee or underwrite the Plan.

1
Content
About Aviva ......................................................................2
Annual investment market review ..................................3
Investment market returns ..............................................5
Putting investment returns in perspective .....................6
Product enhancements .....................................................8
Investment information .................................................1 0
Investment performance ................................................1 5
Contributions ..................................................................5 0
Insurance......................................................................54
Payment of benefits .......................................................5 7
Fees and charges .............................................................6 0
Taxation ...........................................................................6 3
General information .......................................................6 6

2
Aviva – helping you to grow your investment portfolioAviva Australia is the local face of the global Aviva group (Aviva plc), the fifth largest insurer in the world. Aviva plc is the leading provider of life and pension products to Europe and has substantial businesses around the world.
The main activities are long term savings, fund management and general insurance with more than A$757 billion of assets under management as at 31 December 2007. The group has more than 57,000 employees and 45 million customers worldwide.
Aviva Australia provides investment, superannuation and life insurance products for more than 300,000 customers throughout Australia.
Your Annual Report for 2007/2008This Annual Report is designed to provide all the information you need to know about your investment and performance for the period 1 July 2007 to 30 June 2008.
You should read this report in conjunction with your Annual Statement for information on your individual investment.
If you have any enquiries about your investment including current details of investment strategies, contribution options or insurance cover please call our Client Services Team on 1800 814 899 (toll free).

3
EconomyThe 2007- 08 financial year saw share markets around the world impacted by continuing fall-out from the US sub-prime housing crisis, record high oil prices and fears of inflation.
Fear of more bad news threw the global financial system into a ‘credit crunch’, discouraging banks from lending to each other and threatening its stability.
Under the pressure of enormous debt, write downs engulfed almost every major investment bank, and credit ratings of major bond insurers were slashed.
In response the US Federal Reserve (Fed) has cut official rates aggressively by 350 basis points (3.5%) since last September to 2.0%. The Fed also offered an unprecedented package of measures to loosen and broaden open market operations functions. Other central banks pursued similar open market policies but without the aggressive rate cuts, although the Bank of England and the Bank of Canada cut rates by 75 basis points and 150 basis points respectively, both having actually increased rates by 25 basis points last July. The European Central Bank (ECB) left rates steady at 4.0% throughout the year but chose not to increase rates early on against earlier suggestions that they would.
Simultaneously, the period saw an unrelenting rise in oil prices, doubling from around $70 a barrel to around $140 by year end. This has found its way into headline inflation numbers everywhere. In the USA inflation has risen from 2.7% year on year
(yoy) to 4.2% yoy while in the Eurozone to 4.0% yoy from 1.9% yoy. Even Japanese inflation has risen from -0.2% yoy to 1.3% yoy. Core measures remain more muted but the clear worry is the flow on effect.
The ECB may well choose to lift official interest rates soon in line with recent more hawkish suggestions. The Fed has also signalled that interest rates cannot stay low forever but a near term change of direction or an actual increase seems some way off for now.
The key question seems ‘will slower growth deliver in a manner timely enough to cap emerging inflation worries?’ If not, the policy response may be to take back at least some of the accommodation delivered in the last year.
Australia’s economy slowed over the financial year and companies will be unlikely to grow their earnings at the rate previously enjoyed. Some have issued profit warnings and it’s likely there are many more to come.
Thanks to low inflation, policy makers had been given the luxury of allowing the economy to run somewhat above trend to deliver multi decade lows in unemployment and very high levels of capacity use. Skill shortages became a catch cry.
Unfortunately this luxury has passed us by. Australia’s inflation has accelerated like everywhere else. Headline numbers have moved from 2.2% yoy to 4.2% yoy but more worryingly preferred core measures, like the trimmed mean, have also accelerated lifting from 2.7% yoy to 4.2% yoy.
Section one
Annual investment market review

4
Remember, the Reserve Bank of Australia (RBA) mandate is 2% to 3% over the cycle, so clearly we are running well outside this band at the moment.
This explains why the RBA has been ‘out of sync’ with global peers and in fact lifted official rates 100 basis points (1%) for the year from 6.25% to 7.25%. Thanks to the global credit crisis, lending rates to consumers and borrowers have risen even more. It’s beginning to have the desired impact with both consumer and business confidence measures plummeting, retail sales stalling and respected leading indicators implying softer to sluggish growth into 2009.
The RBA cash rate rose 1% to 7.25% over the financial year as it focused on getting inflation back into its target range of 2 - 3%. However it left rates unchanged from February as economic data weakened.
The RBA points to the continued income boost to the economy from our surging terms of trade, but adds that softer domestic consumption is needed to ensure inflation and expectations remain in check. While the economy is slowing the RBA may view the inflation outlook more favourably and be able to leave interest rates alone. However, any uptick in consumption near term may well deliver further rate increases from the bank. The jury is out.
Sharemarkets The year just ended saw the market traverse volatile territory. The ASX 200 recorded its biggest fall in 26 years with a 13.4% decline, and this would have been greater had it not been for strength of key mining stocks.
Resources stocks rose 23.8% over the year, while Industrials lost 28.9% - their worst financial year since 1974.
BHP Billiton and Rio Tinto have been the mainstays for many of the top performing funds. Both companies continue to benefit from the record prices being paid for most base metals, iron ore and coal. Many companies that provide services to the mining sector have also experienced above market results.
PropertyWith listed property trusts carrying a high level of gearing, some overpaid for properties at the top of the market during the early part of the financial year. The Centro Property Group’s fortunes were a prime example, and its December share price plunge severely affected investor sentiment in this sector. Many have been shocked by the magnitude and speed of the share price falls after several years of standout performance.
Fixed Income In the US, the key 10-year note ended the year significantly lower at 3.97% down from 5.03% largely thanks to the aggressive easing from the Fed. The US 2-year note closed a whopping 2.24% lower at 2.62%. At the peak of the credit crisis back in mid-March the 10-year note touched as low as 3.31% and the 2-year note just 1.35%.
In the UK and Japan reasonable rallies also occurred with the UK 10-year Gilt down 0.33% to 5.13% and the Japanese 10-year bond down 0.28% to 1.60%. The exception was Germany where the 10-year Bund closed virtually steady, up a slim 0.05% to 4.62%, thanks largely to the hawkish rhetoric emanating from the ECB over the last month or so.
The notable exception was Australia where yields rose somewhat thanks to the inflation uptick and the RBA tightening policy 100 basis points (1%) for the year. In the wash-up the 90-day bank bill closed at 7.84% higher by 1.41%, the 3-year bond closed higher by 0.28% at 6.73% and the 10-year bond closed higher by 0.20% at 6.45%. For the year the benchmark UBS Composite Bond Index returned a modest but positive 4.42%.
It is worth remembering that Australian fixed income yields are at decade or more highs, now offering reasonable protection against a further rate rise and potentially poor equity returns. The benchmark universe yields circa 7.75%. Steady credit spreads and an RBA rate cut or two next year could easily deliver returns of 10% or more.

5
Section two
Investment market returns
Investment Market Returns 12 month return to 30 June 2008
Australian Cash UBSWA 90 Day Bank Bill Index
7.34%
Australian Fixed Interest UBSWA Composite Bond All Maturities Index
4.42%
Australian SharesS&P/ASX 200 Accumulation Index (Accumulation includes price movements plus dividends)
-13.40%
International SharesMSCI World Ex-Aust Accumulation Index ($A) (Accumulation includes price movements plus dividends)
-21.26%
International Fixed InterestJPM Global Govt Bond Index ($A hedged)
8.92%
Listed PropertyS&P/ASX 200 Property Accumulation Index (Accumulation includes price movements plus dividends)
-36.35%
Source: Aviva Research (July 2008)

6
Section three
Putting investment returns in perspective
The 2007/2008 financial year was a challenging year for all investment markets, in particular for the growth asset classes of shares and property.
After generating four consecutive years of over 20 per cent returns, the Australian equity asset class suffered a negative financial year return. The losses were broadly based, with the notable exception of the Energy and Resources sector. The S&P/ASX 200 Accumulation Index posted a negative 13.4% return for the financial year.
The domestic listed property sector was also dealt a reality check. This asset class has generated eight consecutive years of over 10 per cent returns, with the last four greater than 15 per cent. In a year that will be remembered for the global credit and liquidity crisis, the increased level of gearing by this sector was dealt with harshly by the market. The S&P/ASX 200 Property Accumulation Index posted a negative 36.4% return for the financial year.
Credit market concern and rising oil prices impacted heavily on the world economic outlook, resulting in deteriorating share markets across the globe. The MSCI World ex-Aust Accumulation Index unhedged ($A) posted a negative 21.3% return for the financial year.
Fixed income markets delivered respectable returns in the traditional bond categories, acting as a safe haven from the volatility of the sharemarket. However, funds with a primary focus on credit investment strategies were presented challenges via the tough credit conditions. This financial year the UBS Composite Bond Index returned a modest but positive 4.4%, whilst the Citigroup World ex Aust Govt Bond Index hedged in $A generated a positive 8.7%.
After a number of years of strong investment returns, diversified funds such as conservative, balanced and growth all suffered negative returns. In general, funds with a higher exposure to growth assets such as high growth funds suffered worst.
Year on year returns, in an absolute sense, can be unexpectedly rewarding or, conversely, they can also be very challenging. The critical element, in order to minimise disappointment, is for investors to take a longer term view when investing and diversify. This is particularly important when it comes to the more volatile assets that fit within the growth camp.

7
0
2
4
6
8
10
12
14
16
0
3
6
9
12
15
18
Australian Shares
Australian ListedProperty
Australian
Fixed IncomeInternationalFixed Income
International Equities
Cash
Australian Shares
Australian ListedProperty
Australian
Fixed IncomeInternationalFixed Income
International Equities
Cash
5 years
10 years
Retu
rn (
% p
.a.)
Vo
latilit
y (%
p.a
.)Asset Classes – Comparison Returns
As at 30 June 2008
Asset Classes – Comparison VolatilitiesAs at 30 June 2008
5 years
10 years
Over the long term, 5 to 10 years, Australian growth assets (equities and listed property) have outperformed both in returns (higher) but also risk sense (lower) – see above charts. The defensive assets have delivered modest returns with lower risk when compared against the growth assets, however this is their job. The principal factor to remember is maintaining a strategically allocated portfolio which matches the investor’s risk and return objectives. Keep in mind the old saying, “Don’t put all your eggs in one basket”.

8
Section four
Product enhancements
InsuranceWith effect from 1 March 2008, the Group Life offering made available through the Plan was enhanced in accordance with the following:
An increase in the maximum Death cover made ■
available in the Plan to $10,000,000
An increase in the maximum Total and ■
Permanent Disability (TPD) cover made available in the Plan to $3,000,000
An increase in the maximum Income Protection ■
cover made available in the Plan to $25,000 per month
An increase in the Automatic Acceptance Levels ■
(AAL’s) made available to participating employer Plan clients and their employee members. The maximum AAL now provided to a participating employer Plan client with 500 or more employee members is $900,000
Simplified and standardised eligibility ■
requirements for all employee members and for all Group Life benefits; death, TPD and Income Protection
The introduction of a market leading future ■
insurability benefit ensuring that members are availed increases in cover without the need for underwriting at different life stages
The introduction of an “own” occupation TPD ■
definition for AA rated occupations.
Ancillary Benefits*Since the issue of the 2007 Navigator Business Super Annual Report, the Administrator has significantly increased the availability of benefits outside the Plan. The Administrator has used the potential buying power of the Navigator Business Super membership base to arrange:
Access to Discounted Home Loans ■
(provided by Wizard)
Access to Discounted Credit Cards ■
(provided by GE Money)
Access to salary packaging solutions and fringe ■
benefits tax management where your employer engages the services of Salaris Consulting
Please note that the Plan continues to offer Discounted Rates on Health Insurance (provided by Manchester Unity)
* The Trustee is not responsible for and does not accept liability for any loss or damage incurred by the use of the products and services detailed here. Members should use their own judgement before taking up any product or service offered by a third party.

9
Dynamic Default Trustee investment option (“Dynamic Default”)**If you prefer not to make an investment choice, the Trustee will invest your money in the default investment option nominated by your employer. The default investment option applicable to you was listed on your Membership Certificate.
For all new employer Plan clients who commenced from 1 March 2008 who did not wish to nominate a default investment approach then the Trustee general default option – Dynamic Default – has been applied.
The Trustee Dynamic Default option can also be nominated by individual members at any time.
The Dynamic Default option is an active investment option that encourages you, throughout various life stages, to review your investment strategies.
The Dynamic Default strategy works with you to highlight your changing needs as you reach certain ages, to encourage you to review your asset class mix and consider reducing your exposure to more volatile growth asset classes.
The Dynamic Default option allocates members into certain Pre Select investment options depending upon their age:
Age Investment Option Investment manager charge p.a. as a percentage of your investment
Less than 35 Pre Select High Growth Fund
0.75%
Age 35 to less than 50
Pre Select Growth Fund
0.60%
50 and over Pre Select Balanced Fund
0.55%
** Note: If selecting this option your entire super account must be invested in this strategy.
Fees and CommissionsWith effect from 1 March 2008, there was a small change to fee type naming conventions.
To better align with the services provided for fees charged, the fee previously named the Adviser Service Fee was changed to the Adviser Review Fee.
The Adviser Review Fee provides you and your adviser additional scope in negotiating an appropriate fee for financial review that can be deducted from your superannuation account balance. It is important to note that this fee is still required to be agreed in advance with your financial adviser.
The Adviser Review Fee is limited to the to the lesser of 10% p.a. of your member account balance or $2,750.
Changes to Australian Equity Investment Management ApproachThere has been a change to the investment management approach for the Australian Equity fund and the Australian equity exposure that feeds into the diversified funds (Capital stable, Balanced and Growth funds) and Capital Guaranteed fund. It is important to note that there has been no change to the investment manager of the portfolio, the manager continues to be Aviva Investors (previously know as Portfolio Partners).
The new investment management approach essentially changes the Australian equity management style from a full active management approach, to a mix of 75% passive (index) and 25% actively managed Australian equity funds. The actively managed Australian equity funds replicate the Elite Opportunities Trust, High Growth Shares Trust, Dividend Builder, and the Emerging Shares Trust.
The key reasons to move to this new investment approach are to deliver a more attractive risk/return profile and consistency of outperformance for investors.

10
Section five
Investment information
Important investment information about your planThe range of investment choices available to you in the Plan provides you with the opportunity to tailor your future financial needs your way. With access to over 55 investment options from 22 leading investment managers - all in the one place. You are able to track and change your investments with minimal effort and time 24 hours a day, 7 days a week via the Navigator website, avivagroup.com.au
Navigator Super Solutions investment options are split into two investment approaches:
1. Pre Select2. Self Select
In addition we also have the Member Protected Portfolio to cater for small account balances.
1. Pre SelectYou can choose from a range of seven Pre Select funds – each one is carefully designed to suit different investment needs. You choose your investment style and the Trustee chooses the investment options and managers. Pre Select investing involves investing with a number of investment managers rather than investing with one or a number of single investment manager portfolios.
The Pre Select investment options are designed to deliver a level of diversification across:
asset classes ■
investment managers, and ■
investment management styles ■
The asset allocation and investment manager configuration
Changes to asset allocations, sector allocations, investment managers and investment style bias may be made within the Pre Select options by the Trustee without prior notification to members. Information shown in this Annual Report about the composition of the Pre Select options, while accurate at the time of preparation, is only a guide and the actual composition of a particular fund may differ from what is currently shown.
2. Self SelectSelf Select lets you design your own investment portfolio and tailor it to suit you.
Choosing this approach gives you access to an extensive range of options from some of the world’s leading investment managers. With this approach, you choose the investment option(s) and manager(s) and tailor your own investment portfolio.
Options range from diversified, such as capital stable, to sector specific, such as Australian shares. There is no limit to the number of combinations of options you can select for your portfolio, and you have the flexibility to switch your choices at any time.

11
Choosing your investment optionsThe Plan offers a range of investment options. The option(s) that suits each member best will depend on a number of factors, many of which are based on personal circumstances. Two important things to consider are:
Age and time horizon ■
Age and how much time until your retirement will impact investment choices. Superannuation is designed for retirement years and generally must be preserved until then.
Risk tolerance ■
Generally the greater the expected returns of an investment the higher the risk associated with it. Everyone has a different attitude and tolerance to risk. Each member should be comfortable with the level of risk associated with their selected investment portfolio.
This also means being comfortable with the likelihood that the value of investments may go up or down over shorter time periods.
The Trustee recommends that you review your investment goals, in consultation with your financial adviser, at least once a year to ensure the selected investment options are still appropriate.
Risk profile of the investment optionsThe relationship between the amount of risk that you are willing to take and the potential return on your investment is known as your ‘risk profile’. In general, investment options that earn high returns, such as growth, carry the highest risk. Not only can the rate of return fluctuate, but the value of your capital can rise or fall. For investment options that generally earn lower returns, such as capital stable, the capital value is likely to fluctuate less.
Diversification (spreading your investments across a number of asset classes) can also help to reduce the overall risk of your portfolio as one asset class may perform well while another is declining.
Guarantees on investment optionsThe Trustee offers two investment options that provide guarantees and NULAL is responsible for meeting these guarantees:
the Norwich Union Capital Guaranteed ■
Fund guarantees the return of both capital and declared interest (once allocated), net of switches, withdrawals, fees and tax (if applicable)
the Norwich Union Cash Fund offers a ■
guarantee ensuring that the unit price on withdrawal and switches into other options will always be at the highest price achieved during the term of the investment
As mentioned previously, there is a relationship between the amount of risk associated with an investment and the potential return on that investment in the long term. A capital guaranteed or cash fund generally provides a lower risk investment and therefore, tends to offer a lower but more consistent rate of return.
This may result in your benefit growing at a slower rate than benefits invested in other investment options that offer higher returns for a higher risk over the long term.
You may wish to compare the rates of return achieved by other investment options with your nominated Navigator Super Solutions options.
You should bear in mind that a capital guaranteed or cash investment offers protection for your capital investment.
Dynamic Default optionIf you have not chosen a valid investment option and you are not invested in the Member Protected Portfolio, the Trustee will invest your money in the default investment option nominated by your employer.
If your employer has not nominated a default investment approach then the Trustee default option – “Dynamic Default” - will apply.

12
The Trustee – Dynamic Default option can also be nominated by individual members at any time. If selecting this option your entire super account must be invested in this strategy.
The Dynamic Default option is an active investment option that encourages you, throughout various life stages, to review your investment strategies.
The Dynamic Default strategy works with you to highlight changing needs as you reach certain ages, to encourage you to review your asset class mix and consider reducing your exposure to more volatile growth asset classes.
The Dynamic Default option allocates members into certain Pre Select investment options depending on their age:
Age Investment Option Investment manager charge p.a. as a percentage of your investment
Less than 35 Pre Select High Growth Fund
0.75%
Age 35 to less than 50
Pre Select Growth Fund
0.60%
50 and over Pre Select Balanced Fund
0.55%
The default is “dynamic” because your benefits will remain in the default investment option applied at the time of joining until you are approaching the next age band. At this point the Dynamic Default will identify that you are moving into the next life stage. We will issue a letter to you advising of your pending investment reallocation. You will be given 30 days to either ‘opt out’ (remaining in the current investment option) or select an alternative investment option. Otherwise, the Dynamic Default will automatically transfer your benefits into the corresponding investment option according to your age.
The Dynamic Default has been designed to provide you with an interactive investment strategy. Prior to making a decision whether to switch in or out of the Dynamic Default option, you should seek professional advice from your Plan’s financial adviser.
The Trustee’s default option is regularly reviewed by the Trustee and may include investment funds managed by related bodies corporate of the Trustee. In formulating the default option, the Trustee will act at all times in the best interest of members.
Your Annual Statement will set out your investment allocation as at 30 June 2008.
How your benefits are calculatedThis depends on your investment options:
Norwich Union Capital Guaranteed Fund
Your total benefit is determined by the account balance at the date of withdrawal (less fees and taxes if applicable), including interest credited to date of payment.
Your Annual Statement account balance includes interest to 30 June from the previous 1 July (or entry to the Plan if later) at the last declared interest rate, applied to the daily account balance adjusted for all transactions (including any partial withdrawals) in that period.
For total withdrawals between 1 July and 30 June, an interim interest rate will apply.
Other investment options
This is determined by the number of units withdrawn multiplied by the unit price at the date of withdrawal.
Your benefit entitlement is the accumulated value in your account less any exit fees and taxes on payment. If your Navigator Super Solutions Employer Service has a vesting scale, the benefit arising from voluntary employer contributions will be calculated using the vesting scale.
On death or total and permanent disablement any insurance benefit payable will be added to the benefit entitlements determined above for the Member Protected Portfolio and other investment options. On temporary disablement, income protection benefits are determined entirely by the insurance cover you have.

13
Calculating investment returns
Unit prices
Each investment option (other than the Norwich Union Capital Guaranteed Fund) offered through the Plan has its own unit price. The Administrator calculates unit prices for each investment option daily.
The unit price for each investment option is calculated as follows:
1. The assets of the investment option are valued each Melbourne working day (or at a greater frequency if considered appropriate). The assets of each option are the units in the underlying investments held in that option. Their value is calculated by reference to the unit price (net of the investment manager’s fees) quoted by the relevant manager for that underlying investment. (Where a range of unit prices is quoted by the manager, the value will be no lower than the sell price.) This gives the asset value for the particular option.
2. The asset value calculated under 1 is then adjusted by deducting any liabilities of the Plan attributable to that option, any tax which may be payable (including tax on unrealised capital gains), and the annual management fee described on page 61. This gives the net asset value for the particular option.
3. The net asset value calculated under 2 is then divided by the total number of units on issue in that option, to arrive at a unit price for the option.
The value of units in an investment option may rise and fall. In exceptional circumstances the Administrator may be unable to calculate daily unit prices for one or more of the available investment options, or may decide that it is in the best interest of members not to do so. Switching, redemption and investment requests will not be processed while the Trustee has suspended calculation of the unit price for that option. NULAL has the right to withhold the declaration of daily unit prices in exceptional circumstances.
Interest rate: Norwich Union Capital Guaranteed Fund
The Norwich Union Capital Guaranteed Fund has its return calculated on an annual basis on 30 June. At this time, the Administrator will declare an interest rate that will apply to the preceding twelve month period. At any time in the future, the Administrator may change the frequency of declaring the interest rate on this option.
The declared rate is calculated as follows:
1. Firstly, the gross investment earnings are determined. This includes investment income, realised and unrealised investment gains and losses received over the declaration period.
2. Deductions from the gross investment earnings are made for Plan earnings tax (including tax on unrealised capital gains or losses), and the annual management fee described on page 61 to determine the net investment earning rate.
3. At the time of declaring a rate the Administrator will have regard to the following issues:
the net investment earning rate over the ■
declaration period
the size of the interest equalisation reserve ■
(see below) at the declaration date, and
the likely future economic outlook and likely ■
investment earning rate
Interest equalisation reserve
To smooth out the ups and downs of the rates over time, amounts are paid into or taken out of a reserve called the interest equalisation reserve. The reserve is topped up when the net earning rate exceeds the declared earning rate, and amounts are taken out when the net earning rate is below the declared earning rate. Therefore, over time all net earnings are attributable to continuing capital guaranteed policyholders.
Australian Prudential Regulation Authority (“APRA”) limits the size of this type of reserve. This, in turn, limits the amount of smoothing of declared rates when earning rates are volatile. The upper and lower limits of the reserve are prescribed so that the

14
aggregated capital guaranteed surrender value must not fall below 95% or rise above 103% of capital guaranteed policyholders’ assets.
The Administrator’s policy is not to declare a negative earning rate for the Member Protected Portfolio.
Interim interest
If a full withdrawal or full switch is made, interim interest is credited for the period since the last declaration date. When setting an interim rate the Administrator will have regard to similar issues as when setting the declared rate.
Interim rates are not guaranteed and may be changed at any time without prior notice. New interim rates apply from the last declaration date.
Cut-off times for allocation and redemption of investments
Unit linked investments
When a contribution or investment switch request is received by the Administrator before 5pm on a Melbourne working day, new units in the investment option will generally be acquired at the prevailing unit price for that option on the day after the request is received. Units will generally be redeemed at the prevailing unit price for that option for the day the transaction is processed. If applications or requests are incomplete, the unit price for the day the transaction is processed will be applied.
Contributions are normally processed within three days of receipt, and redemption requests within five days of receipt, but may take longer if required. The Administrator may delay acting on investment switch, redemption or investment requests and may postpone the allocation or redemption of units if such a delay is considered reasonably necessary to protect the interests of members or if:
it has not received an external manager’s unit ■
price
it has not received sufficient monies from an ■
external manager to process the redemption of units
documentation is not delivered to the ■
administrator by Australia Post (for example, if it is delivered electronically or in person), or
the amount of the transaction is over $500,000. ■
Norwich Union Capital Guaranteed Fund
Interest will be calculated using the same effective dates as for unit linked investments.
Restrictions
Restrictions may be placed on access to or switches into or out of certain investment options from time to time. Occasionally an investment option that you have selected may be closed. If that happens, you will be given (where appropriate) advance notice and the opportunity to choose an alternative. If you do not choose a valid alternative then your investment will be transferred to the option selected by the Trustee that most closely resembles the closed option.

15
Section six
Investment performance
Outlines the investment objective, asset allocation and performance of the investment funds offered.
Please refer to your enclosed Annual Statement which outlines your balance for each investment fund as at 30 June 2008.
Trustee objectives and strategiesThe Trustee of the Plan pre-determines the objectives and strategies for the Pre Select and Self Select options and then chooses investment funds and managers that best meet those objectives and strategies.
The Trustee maintains an ongoing review of the investment options for the fund. During the year the trustee objectives and strategies were reviewed by a research house and as such a number of these have been updated.
Details of these options are shown on the following pages. The investment funds available under each option are also detailed in this section.
CashInvestment objectives: To provide access to capital on 7 days notice. To provide certainty of capital at all times. To provide a higher return than bank deposit interest rates.
Investment strategy: Invest in cash deposits and short term securities with high security and high liquidity. The likelihood of a negative annual return is negligible.
Appropriate investor: An investor with a short term investment horizon who seeks capital security and is comfortable with a relatively low but secure return.
Time horizon: Less than 1 year.
MortgagesInvestment objectives: To provide security of capital on a three year basis and an income return greater than bank deposit rates.
Investment strategy: Invest in a portfolio of mortgages and/or mortgage backed securities, other fixed interest investments and cash, with moderate liquidity. The likelihood of the portfolio incurring a negative annual return in any particular year is moderate.
Appropriate investor: A conservative investor with an investment time horizon of at least 2 years.
Time horizon: Minimum of 2-3 years.
Fixed InterestInvestment objectives: To provide a higher return than bank deposit interest rates, while maintaining the capital value of the investment over a three year period.
Investment strategy: Invest in a portfolio of domestic fixed interest securities and bonds. The likelihood of the portfolio incurring a negative annual return in any particular year is moderate.

16
Appropriate investor: A conservative to moderate investor with an investment time horizon of at least 3 years.
Time horizon: Minimum of 3 years.
Diversified IncomeInvestment objectives: To provide an income stream through high exposure to fixed interest securities.
Investment strategy: Invest in fixed interest and growth assets with high liquidity. The likelihood of the portfolio incurring a negative annual return in any particular year is moderately low. Some capital growth may be provided through an exposure to growth assets of between 20-40% of total funds.
Appropriate investor: Medium term investor seeking stable returns.
Time horizon: Minimum of 3-4 years.
Diversified BalancedInvestment objectives: To provide a combination of income and moderate growth over the longer term.
Investment strategy: Invest in a diversified portfolio providing a balanced exposure to the major asset classes, including equities, fixed interest and property. The likelihood of the portfolio incurring a negative annual return in any particular year is moderate. Exposure to growth assets is expected to be between 40-60% of total funds.
Appropriate investor: An investor who is seeking to generate long-term capital growth and is prepared to tolerate a moderate level of investment volatility.
Time horizon: Minimum of 4-5 years.
Diversified GrowthInvestment objectives: To provide higher growth than the Diversified Balanced strategy via a diverse spread of growth assets, including equities and property.
Investment strategy: Invest in a diversified portfolio of the major asset classes, including equities, fixed interest and property with an
emphasis on equities and property providing high liquidity. The likelihood of the portfolio incurring a negative return in any particular year is high. Exposure to growth assets is expected to be 60%-80% of total funds.
Appropriate investor: An investor who is seeking to generate long-term capital growth and is prepared to tolerate a high level of investment volatility.
Time horizon: Minimum of 5 years.
Diversified AggressiveInvestment objectives: To provide high growth via a diverse spread of growth assets including equities and property.
Investment strategy: Invest in a diversified portfolio with a high weighting to growth assets such as equities. The likelihood of this portfolio incurring a negative annual return in any particular year is high. Exposure to growth assets is expected to be at least 80% of total funds.
Appropriate investor: An investor who is seeking to generate long-term capital growth and is prepared to tolerate a high level of investment volatility.
Time horizon: Minimum of 5 years.
Australian PropertyInvestment objectives: To provide a combination of income and growth over the long term.
Investment strategy: Invest in property trusts listed on the Australian Stock Exchange with a comparatively low exposure to direct property. The likelihood of a negative annual return in any particular year is high.
Appropriate investor: An investor who wishes to invest in property and property related assets and is prepared to tolerate a high level of investment volatility.
Time horizon: Minimum of 5 years.

17
Australian Shares – GrowthInvestment objectives: To significantly grow the value of capital via investment in Australian shares with potential for growth.
Investment strategy: To invest in Australian shares. The likelihood of the portfolio incurring a negative annual return in any particular year is high.
Appropriate investor: An investor who is seeking to generate high returns, over the longer term and is prepared to tolerate a high level of investment volatility.
Time horizon: Minimum of 5 years.
Australian Shares – ImputationInvestment objectives: To provide a tax effective income stream by the inclusion of Australian companies which pay franked dividends. To provide the potential for capital growth due to asset price appreciation.
Investment strategy: Invest in Australian listed shares, paying a relatively high level of franked dividends, the taxation benefits of which will be passed on to unit holders in the form of investment returns. The likelihood of the portfolio incurring a negative annual return in any particular year is high.
Appropriate investor: An investor who is seeking to generate high returns over the longer term and is prepared to tolerate a high level of investment volatility.
Time horizon: Minimum of 5 years.
Australian Shares – Smaller CompaniesInvestment objectives: To significantly grow the value of capital via investment in Australian equity assets with a high potential for growth.
Investment strategy: Investment in Australian equities biased towards those equities outside the Top 50 as measured by market capitalisation. The likelihood of this portfolio incurring a negative annual return in any particular year is high.
Appropriate investor: An investor who is seeking to generate high returns, over the longer term and is prepared to tolerate a high level of investment volatility.
Time horizon: Minimum of 5 years.
International Shares – GlobalInvestment objectives: To significantly grow the value of the investment over the long term via investment in international shares.
Investment strategy: Invest in international equities providing high liquidity. The likelihood of the portfolio incurring a negative annual return in any particular year is high.
Appropriate investor: An investor who is seeking to generate high returns over the longer term and is prepared to tolerate a high level of investment volatility.
Time horizon: Minimum of 5 years.
Ethical FundsInvestment objectives: To provide growth in the value of capital and provide competitive investment returns relative to funds that invest in the same sector of the market. To not invest in companies whose business activities or products may be considered morally unacceptable and to commonly target investment in companies who seek to enhance the environment and its sustainability.
Investment strategy: To invest in a diversified portfolio of ethical stocks by avoiding those that may be considered morally unacceptable and/or targeting those deemed to be more beneficial for the environment’s sustainability. The likelihood of the portfolio incurring a negative return in any particular year is high.
Appropriate investor: An investor who is seeking to generate high returns over the longer term and is prepared to tolerate a high level of investment volatility.
Time horizon: Minimum of 5 years.
Time horizons indicate the periods suggested for investing in each fund. The optimum period for investing in each fund may be more or less than the period shown. Investing for the time suggested does not eliminate the risk of loss.

18
Trustee policy on use of derivative securitiesIn formulating the investment strategies for the fund the Trustee has recognised the use of derivatives by authorised investments of the fund for the efficient risk management of a portfolio, or reduction of investment risk.
The Trustee relies on the provision of Derivative Risk Management Statements in respect of each authorised investment into which the fund invests to determine whether investment in derivatives is made under appropriate controls having regard to investment objectives, investment restrictions and risk profile.
Investment managersNavigator Super Solutions allows investment across a broad range of investment options managed by a selection of some of the world’s most experienced investment managers. The appointed investment managers are:
AllianceBernstein Australia LimitedABN 53 095 022 718
AMP Capital Investors Limited ABN 59 001 777 591
BT Investment Management (RE) Limited ABN 17 126 390 627
BlackRock Investment Management (Australia) LimitedABN 13 006 165 975
Challenger Managed Investments Limited ABN 94 002 835 592
Credit Suisse Asset Management (Australia) Limited ABN 57 007 305 384
Macquarie Investment Management Limited ABN 66 002 867 003
National Mutual Funds Management Ltd ABN 32 006 787 720
Navigator Australia Limited ABN 45 006 302 987
Perpetual Investment Management Limited ABN 18 000 866 535
Platinum Investment Management LimitedABN 25 063 565 006
Portfolio Partners Limited ABN 85 066 081 114
Russell Investment Management Ltd ABN 53 068 338 974
Vanguard Investments Australia LimitedABN 72 072 881 086
Note: AllianceBernstein Australia Limited manages the AXA funds. Portfolio Partners Limited manages the assets of Norwich Union Life Australia Limited. Portfolio Partners Limited acts as an investment manager in accordance with Aviva plc policy that group investments be managed by the group funds management operation subject to performing at an acceptable standard.

19
Pre Select options
Pre select
Conservative Fund
Pre select
Balanced Fund
Investment objective To provide medium returns higher than generally associated with cash and fixed interest securities, but providing lower volatility in short-term investment returns than funds with a greater proportion of equities and property.
To achieve returns over the medium to long term that are generally higher than those achievable by investing in capital guaranteed or capital stable funds.
Strategy To invest a high proportion of the fund’s assets in cash and fixed interest securities with the balance in growth assets. The likelihood of the portfolio incurring a negative annual return in any particular year is moderate.
To maintain a balanced spread of investment between growth and debt assets. The likelihood of the portfolio incurring a negative annual return in any particular year is moderate.
Appropriate investor A short to medium term investor seeking stable returns.
An investor who is not concerned about a moderate level of short term volatility of returns.
Investor time horizon Minimum 2-4 years. Minimum 3-5 years.
Performance percentage (%)
30/6/08 -3.42
30/6/07 7.71
30/6/06 5.46
30/6/05 7.52
30/6/04 4.67
Average 4.31
30/6/08 -7.34
30/6/07 11
30/6/06 8.75
30/6/05 8.75
30/6/04 7.21
Average 5.45
Investment manager charge 0.50% p.a. at 30/06/2008# 0.55% p.a. at 30/06/2008#
Target asset allocation benchmark as at 30 June 2008
Cash 20.0%
Australian Fixed Interest 25.0%
Australian Shares 13.0%
Property 4.0%
International Fixed Interest 25.0%
International Shares 13.0%
Cash 10.0%
Australian Fixed Interest 20.0%
Australian Shares 22.0%
Property 6.0%
International Fixed Interest 20.0%
International Shares 22.0%
Responsible Entity11 Navigator Australia Limited ABN 45 006 302 987
Navigator Australia Limited ABN 45 006 302 987
Underlying investment manager 11
AllianceBernstein, Barclays, BlackRock, Colonial First State, Credit Suisse, Macquarie, Perennial Real Estate, Perpetual, Portfolio Partners, Vanguard.
AllianceBernstein, Barclays, BlackRock, Colonial First State, Credit Suisse, Macquarie, Perennial Real Estate, Perpetual, Portfolio Partners, Vanguard.

20
Pre select
Growth Fund
Pre select
High Growth Fund
Pre select
Australian Equity Fund
Pre select
Australian Small Companies Fund
Pre select
International Equity Fund
Investment objective To produce higher returns than other managed funds with a level of risk within the commonly accepted range for funds with a high proportion of growth assets.
To provide higher returns than those expected from cash, capital stable, balanced and growth strategies over the long term
To provide higher returns than those expected from the cash, capital stable, balanced and growth strategies over the longer term.
Investors with a long term view seeking exposure to small capitalisation securities listed on the Australian sharemarket.
To provide higher returns than those expected from the cash, capital stable, balanced and growth strategies over the long term.
Strategy To maintain a high proportion of the fund’s assets in shares and property, in order to achieve high returns over the long term. The fund also invests in overseas assets to diversify investments and further manage risk. The likelihood of the portfolio incurring a negative return in any particular year is high.
Dominated by equity and property assets with a very low allocation to fixed interest and cash assets. The likelihood of the portfolio incurring a negative return in any particular year is high
To invest in a variety of Australian companies whose share price is expected to appreciate over time. These investments are made through specialist Australian equity investment managers. The likelihood of this portfolio incurring a negative annual return in any particular year is high
To achieve a return (before investment management fees) that exceeds CPI increases by at least 4.0% per annum over rolling five year periods.
To invest predominantly in international equities with a small cash balance. The likelihood of this portfolio incurring a negative annual return in any particular year is high.
Appropriate investor An investor who feels comfortable with a higher-than-average degree of volatility in order to achieve long term returns.
An investor seeking higher returns with a focus on long-term outcomes combined with little regard for short-term results including a higher incidence of capital loss.
An investor looking for a portfolio of Australian shares who can tolerate considerable short term fluctuations, including the risk of short term negative returns, and who is investing over a longer term.
Provides access to a range of Australian small companies share sector specialist managers of varying investment styles so that underperformance in one area may be offset by outperformance in another, and as a result, investment risk can be reduced. The likelihood of this portfolio incurring a negative annual return in any particular year is high.
An investor seeking an investment in a diversified portfolio of overseas shares who is prepared to accept potential capital losses over the short term from adverse movements in the price of shares as well as from currency fluctuations.
Investor time horizon Minimum 4-6 years. Minimum 7 years. Minimum 8 years. Minimum 8 years. Minimum 8 years.
Performance percentage (%)
30/6/08 -9.9830/6/07 14.4730/6/06 12.0130/6/05 9.8630/6/04 10.23Average 6.93
30/6/08 -11.5830/6/07 16.2930/6/06 13.9630/6/05 9.5930/6/04 9.41Average 7.04
30/6/08 -11.5330/6/07 25.5530/6/06 19.8830/6/05 21.9930/6/04 17.59Average 13.82
30/6/08 -14.14Fund first offered on 1 October 2006, so historical information is not available
30/6/08 -15.3630/6/07 13.2330/6/06 14.2830/6/05 3.530/6/04 10.78Average 4.66
Investment manager charge 0.60% p.a. at 30/06/2008# 0.75% p.a. at 30/06/2008# 0.70% p.a. at 30/06/2008# 1.10% p.a. at30/06/2008# 0.85% p.a. at 30/06/2008#
Target asset allocation benchmark as at 30 June 2008
Cash 2.0%
Australian Fixed Interest 14.0%
Australian Shares 32.0%
Property 6.0%
International Fixed Interest 14.0%
International Shares 32.0%
Australian Fixed Interest 7.5%
Australian Shares 40.0%
Property 5.0%
International Fixed Interest 7.5%
International Shares 40.0%
Australian Shares 100.0% Australian Shares 100.0% International Shares 100.0%
Responsible Entity11 Navigator Australia Limited ABN 45 006 302 987
Navigator Australia Limited ABN 45 006 302 987
Navigator Australia Limited ABN 45 006 302 987
Navigator Australia Limited ABN 45 006 302 987
Navigator Australia Limited ABN 45 006 302 987
Underlying investment manager 11
AllianceBernstein, Barclays, BlackRock, Colonial First State, Credit Suisse, Macquarie, Perennial Real Estate, Perpetual, Portfolio Partners, Vanguard.
AllianceBernstein, Barclays, BlackRock, Colonial First State, Credit Suisse, Macquarie, Perennial Real Estate, Perpetual, Portfolio Partners, Vanguard.
Adam Smith, Barclays, Perpetual, Portfolio Partners
Adam Smith, Portfolio Partners AllianceBerstein, BlackRock, Credit Suisse, Vanguard
Pre Select options (cont.)

21
Pre select
Growth Fund
Pre select
High Growth Fund
Pre select
Australian Equity Fund
Pre select
Australian Small Companies Fund
Pre select
International Equity Fund
Investment objective To produce higher returns than other managed funds with a level of risk within the commonly accepted range for funds with a high proportion of growth assets.
To provide higher returns than those expected from cash, capital stable, balanced and growth strategies over the long term
To provide higher returns than those expected from the cash, capital stable, balanced and growth strategies over the longer term.
Investors with a long term view seeking exposure to small capitalisation securities listed on the Australian sharemarket.
To provide higher returns than those expected from the cash, capital stable, balanced and growth strategies over the long term.
Strategy To maintain a high proportion of the fund’s assets in shares and property, in order to achieve high returns over the long term. The fund also invests in overseas assets to diversify investments and further manage risk. The likelihood of the portfolio incurring a negative return in any particular year is high.
Dominated by equity and property assets with a very low allocation to fixed interest and cash assets. The likelihood of the portfolio incurring a negative return in any particular year is high
To invest in a variety of Australian companies whose share price is expected to appreciate over time. These investments are made through specialist Australian equity investment managers. The likelihood of this portfolio incurring a negative annual return in any particular year is high
To achieve a return (before investment management fees) that exceeds CPI increases by at least 4.0% per annum over rolling five year periods.
To invest predominantly in international equities with a small cash balance. The likelihood of this portfolio incurring a negative annual return in any particular year is high.
Appropriate investor An investor who feels comfortable with a higher-than-average degree of volatility in order to achieve long term returns.
An investor seeking higher returns with a focus on long-term outcomes combined with little regard for short-term results including a higher incidence of capital loss.
An investor looking for a portfolio of Australian shares who can tolerate considerable short term fluctuations, including the risk of short term negative returns, and who is investing over a longer term.
Provides access to a range of Australian small companies share sector specialist managers of varying investment styles so that underperformance in one area may be offset by outperformance in another, and as a result, investment risk can be reduced. The likelihood of this portfolio incurring a negative annual return in any particular year is high.
An investor seeking an investment in a diversified portfolio of overseas shares who is prepared to accept potential capital losses over the short term from adverse movements in the price of shares as well as from currency fluctuations.
Investor time horizon Minimum 4-6 years. Minimum 7 years. Minimum 8 years. Minimum 8 years. Minimum 8 years.
Performance percentage (%)
30/6/08 -9.9830/6/07 14.4730/6/06 12.0130/6/05 9.8630/6/04 10.23Average 6.93
30/6/08 -11.5830/6/07 16.2930/6/06 13.9630/6/05 9.5930/6/04 9.41Average 7.04
30/6/08 -11.5330/6/07 25.5530/6/06 19.8830/6/05 21.9930/6/04 17.59Average 13.82
30/6/08 -14.14Fund first offered on 1 October 2006, so historical information is not available
30/6/08 -15.3630/6/07 13.2330/6/06 14.2830/6/05 3.530/6/04 10.78Average 4.66
Investment manager charge 0.60% p.a. at 30/06/2008# 0.75% p.a. at 30/06/2008# 0.70% p.a. at 30/06/2008# 1.10% p.a. at30/06/2008# 0.85% p.a. at 30/06/2008#
Target asset allocation benchmark as at 30 June 2008
Cash 2.0%
Australian Fixed Interest 14.0%
Australian Shares 32.0%
Property 6.0%
International Fixed Interest 14.0%
International Shares 32.0%
Australian Fixed Interest 7.5%
Australian Shares 40.0%
Property 5.0%
International Fixed Interest 7.5%
International Shares 40.0%
Australian Shares 100.0% Australian Shares 100.0% International Shares 100.0%
Responsible Entity11 Navigator Australia Limited ABN 45 006 302 987
Navigator Australia Limited ABN 45 006 302 987
Navigator Australia Limited ABN 45 006 302 987
Navigator Australia Limited ABN 45 006 302 987
Navigator Australia Limited ABN 45 006 302 987
Underlying investment manager 11
AllianceBernstein, Barclays, BlackRock, Colonial First State, Credit Suisse, Macquarie, Perennial Real Estate, Perpetual, Portfolio Partners, Vanguard.
AllianceBernstein, Barclays, BlackRock, Colonial First State, Credit Suisse, Macquarie, Perennial Real Estate, Perpetual, Portfolio Partners, Vanguard.
Adam Smith, Barclays, Perpetual, Portfolio Partners
Adam Smith, Portfolio Partners AllianceBerstein, BlackRock, Credit Suisse, Vanguard

22
Cash Option
Norwich Union Cash Fund
Mortgages Option
Challenger Howard Wholesale Mortgage Trust
Fixed Interest
Norwich Union Fixed Interest Fund
Fixed Interest Macquarie Master Fixed Interest Fund
Fixed Interest Portfolio Partners Premier Fixed Income Trust
Investment objective To achieve a secure positive return in the short term that is at least equal to that available in the short term money market, while providing an immediate and ongoing capital guarantee.
To provide investors with a diversified income producing portfolio that aims to provide regular income, capital stability as well as prompt and convenient access to their funds.
To outperform the UBS Australian Composite Bond Index over the medium term (before fees) by using an active investment strategy.
To outperform the UBS Australian Composite Bond Index over the medium term (before fees) by using an active investment strategy.
To outperform the Trust’s benchmark over the recommended investment timeframe by investing in a broadly diversified portfolio of fixed income securities (both Australian and international)
Fund manager trading ranges (%) at 30 June 2008
Cash 0-100 Cash 10-30
Mortgages 70-90
Cash 0-100
Fixed Interest 0-100
Cash 0-100
Aust Fixed Interest 0-100
Int’l Fixed Interest 0-25
Cash 0-20
Aust Fixed Interest 30-100
Int’l Fixed Interest 0-50
Performance percentage (%)
30/6/08 3.31
30/6/07 3.27
30/6/06 2.80
30/6/05 2.87
30/6/04 2.30
Average p.a. 2.91
30/6/08 4.22
30/6/07 3.94
30/6/06 3.40
30/6/05 1.90
Fund available from 18/10/2004
Average p.a. 3.37
30/6/08 0.96
30/6/07 1.65
30/6/06 0.91
30/6/05 4.73
30/6/04 0.07
Average p.a. 1.66
30/6/08 0.20
30/6/07 1.45
30/6/06 0.42
30/6/05 3.61
30/6/04 -1.25
Average p.a. 0.87
30/6/08 1.91
30/6/07 2.05
30/6/06 0.79
30/6/05 5.57
30/6/04 0.09
Average p.a. 2.06
Investment manager charge 0.30% p.a. at 30/06/2008 1.00% p.a. at 30/06/2008 0.30% p.a. at 30/06/2008 0.62% p.a. at 30/06/2008 0.36% p.a. at 30/06/2008#
Asset allocation at 30 June 2008
Cash 100% Cash 6.2%
Australian Fixed Interest 93.8%
Cash 6.2%
Australian Fixed Interest 93.8%
Cash 26.0%
Australian Fixed Interest 74.0%
Cash 0.8%
Australian Fixed Interest 74.4%
International Fixed Interest 24.8%
Self Select options

23
Cash Option
Norwich Union Cash Fund
Mortgages Option
Challenger Howard Wholesale Mortgage Trust
Fixed Interest
Norwich Union Fixed Interest Fund
Fixed Interest Macquarie Master Fixed Interest Fund
Fixed Interest Portfolio Partners Premier Fixed Income Trust
Investment objective To achieve a secure positive return in the short term that is at least equal to that available in the short term money market, while providing an immediate and ongoing capital guarantee.
To provide investors with a diversified income producing portfolio that aims to provide regular income, capital stability as well as prompt and convenient access to their funds.
To outperform the UBS Australian Composite Bond Index over the medium term (before fees) by using an active investment strategy.
To outperform the UBS Australian Composite Bond Index over the medium term (before fees) by using an active investment strategy.
To outperform the Trust’s benchmark over the recommended investment timeframe by investing in a broadly diversified portfolio of fixed income securities (both Australian and international)
Fund manager trading ranges (%) at 30 June 2008
Cash 0-100 Cash 10-30
Mortgages 70-90
Cash 0-100
Fixed Interest 0-100
Cash 0-100
Aust Fixed Interest 0-100
Int’l Fixed Interest 0-25
Cash 0-20
Aust Fixed Interest 30-100
Int’l Fixed Interest 0-50
Performance percentage (%)
30/6/08 3.31
30/6/07 3.27
30/6/06 2.80
30/6/05 2.87
30/6/04 2.30
Average p.a. 2.91
30/6/08 4.22
30/6/07 3.94
30/6/06 3.40
30/6/05 1.90
Fund available from 18/10/2004
Average p.a. 3.37
30/6/08 0.96
30/6/07 1.65
30/6/06 0.91
30/6/05 4.73
30/6/04 0.07
Average p.a. 1.66
30/6/08 0.20
30/6/07 1.45
30/6/06 0.42
30/6/05 3.61
30/6/04 -1.25
Average p.a. 0.87
30/6/08 1.91
30/6/07 2.05
30/6/06 0.79
30/6/05 5.57
30/6/04 0.09
Average p.a. 2.06
Investment manager charge 0.30% p.a. at 30/06/2008 1.00% p.a. at 30/06/2008 0.30% p.a. at 30/06/2008 0.62% p.a. at 30/06/2008 0.36% p.a. at 30/06/2008#
Asset allocation at 30 June 2008
Cash 100% Cash 6.2%
Australian Fixed Interest 93.8%
Cash 6.2%
Australian Fixed Interest 93.8%
Cash 26.0%
Australian Fixed Interest 74.0%
Cash 0.8%
Australian Fixed Interest 74.4%
International Fixed Interest 24.8%

24
Fixed Interest
Vanguard Australian Fixed Interest Index Fund
Diversified Income
Colonial First State Wholesale Conservative Fund 8
Diversified Income
Norwich Union Capital Stable Fund
Diversified Income
Intech Conservative Growth Trust
Diversified Income
BlackRock Wholesale Managed Income Fund1
Investment objective To match the total return of the UBS Australian Composite Bond Index before taking into account fees and expenses.
To provide a regular income stream while maintaining and potentially increasing the value of your capital over the medium term.
To provide over the medium term a higher return than is generally associated with cash and fixed interest securities alone, while providing lower volatility in short term investment returns than other more balanced investments (i.e. those with greater proportions invested in shares and property).
To provide investors with medium-term capital growth and income with the objective of earning a rate of return (gross of fees and tax) that exceeds CPI increases by at least 1% p.a. over rolling three year periods.
To provide investors with a regular monthly income and some capital growth. The fund aims to achieve this goal by outperforming the benchmark asset allocation returns over a rolling three year periods.
Fund manager trading ranges (%) at 30 June 2008
Fixed Interest 100 Aust’n Shares 15-19
Int’l Shares 8-12
Aust’n Property Securities 1-5
Fixed Interest & Cash 64-76
Cash 10-30
Fixed Int 45-55
Property 3-7
Aust’n Shares 10-20
Int’l Shares 8-12
Cash 15-35
Aust’n bonds 5-25
Int’l bonds 20-40
Aust’n Property Securities 0-15
Int’l Property Securities 0-14
Aust’n Shares 0-20
Int’l Shares Unhedged 0-20
Int’l Shares Hedged 0-10
Alternative Investments 0-25
Cash 0-20
Aust’n Fixed Int 20-40
Property Direct 0-15
Property Listed 0-10
Aust’n Shares 10-25
Int’l Shares 0-5
FRN’s 25-45
Infrastucture Shares 0-10
Performance percentage (%)
30/6/08 1.27
30/6/07 1.86
30/6/06 0.57
30/6/05 4.16
30/6/04 -0.54
Average p.a. 1.45
30/6/08 -3.08
Fund first offered in June 2007, so historical information is not available.
Average p.a. n/a
30/6/08 -4.52
30/6/07 6.32
30/6/06 5.40
30/6/05 6.80
30/6/04 4.49
Average p.a. 3.61
30/6/08 -3.26
Fund fisrt offered in June 2007, so historical information is not available.
Average p.a. n/a
30/6/08 -4.11
30/6/07 8.96
30/6/06 5.47
30/6/05 7.83
30/6/04 5.54
Average p.a. 4.63
Investment manager charge 0.29% p.a. at 30/06/2008# 0.76% p.a. at 30/06/2008 0.45% p.a. at 30/06/2008 0.75% p.a. at 30/06/2008# 0.85% p.a. at 30/06/2008#
Asset allocation at 30 June 2008
Cash 9.6%
Australian Fixed Interest 90.4%
Cash 1.6%
Australian Fixed Interest 53.5%
Australian Shares 15.7%
Property 3.2%
International Fixed Interest 16.7%
International Shares 9.3%
Cash 18.9%
Australian Fixed Interest 52.0%
Australian Shares 15.0%
Property 4.5%
International Shares 9.6%
Cash 22.0%
Australian Fixed Interest 15.3%
Australian Shares 9.8%
Property 7.9%
International Fixed Interest 24.7%
International Shares 10.0%
Alternative Assets 10.3%
Cash 8.1%
Australian Fixed Interest 66.0%
Australian Shares 20.7%
Property 5.2%
Self Select options (cont.)

25
Fixed Interest
Vanguard Australian Fixed Interest Index Fund
Diversified Income
Colonial First State Wholesale Conservative Fund 8
Diversified Income
Norwich Union Capital Stable Fund
Diversified Income
Intech Conservative Growth Trust
Diversified Income
BlackRock Wholesale Managed Income Fund1
Investment objective To match the total return of the UBS Australian Composite Bond Index before taking into account fees and expenses.
To provide a regular income stream while maintaining and potentially increasing the value of your capital over the medium term.
To provide over the medium term a higher return than is generally associated with cash and fixed interest securities alone, while providing lower volatility in short term investment returns than other more balanced investments (i.e. those with greater proportions invested in shares and property).
To provide investors with medium-term capital growth and income with the objective of earning a rate of return (gross of fees and tax) that exceeds CPI increases by at least 1% p.a. over rolling three year periods.
To provide investors with a regular monthly income and some capital growth. The fund aims to achieve this goal by outperforming the benchmark asset allocation returns over a rolling three year periods.
Fund manager trading ranges (%) at 30 June 2008
Fixed Interest 100 Aust’n Shares 15-19
Int’l Shares 8-12
Aust’n Property Securities 1-5
Fixed Interest & Cash 64-76
Cash 10-30
Fixed Int 45-55
Property 3-7
Aust’n Shares 10-20
Int’l Shares 8-12
Cash 15-35
Aust’n bonds 5-25
Int’l bonds 20-40
Aust’n Property Securities 0-15
Int’l Property Securities 0-14
Aust’n Shares 0-20
Int’l Shares Unhedged 0-20
Int’l Shares Hedged 0-10
Alternative Investments 0-25
Cash 0-20
Aust’n Fixed Int 20-40
Property Direct 0-15
Property Listed 0-10
Aust’n Shares 10-25
Int’l Shares 0-5
FRN’s 25-45
Infrastucture Shares 0-10
Performance percentage (%)
30/6/08 1.27
30/6/07 1.86
30/6/06 0.57
30/6/05 4.16
30/6/04 -0.54
Average p.a. 1.45
30/6/08 -3.08
Fund first offered in June 2007, so historical information is not available.
Average p.a. n/a
30/6/08 -4.52
30/6/07 6.32
30/6/06 5.40
30/6/05 6.80
30/6/04 4.49
Average p.a. 3.61
30/6/08 -3.26
Fund fisrt offered in June 2007, so historical information is not available.
Average p.a. n/a
30/6/08 -4.11
30/6/07 8.96
30/6/06 5.47
30/6/05 7.83
30/6/04 5.54
Average p.a. 4.63
Investment manager charge 0.29% p.a. at 30/06/2008# 0.76% p.a. at 30/06/2008 0.45% p.a. at 30/06/2008 0.75% p.a. at 30/06/2008# 0.85% p.a. at 30/06/2008#
Asset allocation at 30 June 2008
Cash 9.6%
Australian Fixed Interest 90.4%
Cash 1.6%
Australian Fixed Interest 53.5%
Australian Shares 15.7%
Property 3.2%
International Fixed Interest 16.7%
International Shares 9.3%
Cash 18.9%
Australian Fixed Interest 52.0%
Australian Shares 15.0%
Property 4.5%
International Shares 9.6%
Cash 22.0%
Australian Fixed Interest 15.3%
Australian Shares 9.8%
Property 7.9%
International Fixed Interest 24.7%
International Shares 10.0%
Alternative Assets 10.3%
Cash 8.1%
Australian Fixed Interest 66.0%
Australian Shares 20.7%
Property 5.2%

26
Diversified Income
Macquarie Master Capital Stable Fund
Diversified Income
Ventura Capital Stable (class A units)
Diversified Balanced Options
Norwich Union Balanced Fund
Diversified Balanced Options
Ventura Diversified 50 Fund (class A units)
Diversified Growth Options
Norwich Union Growth Fund
Investment objective To provide investors with exposure to a diversified portfolio of cash, fixed interest securities, Australian and international shares, Australian and global listed property and alternative assets.
To provide investors with some income and some medium-term capital growth with low volatility through exposure to a diversified investment portfolio.
To achieve returns over the medium to long term that are generally higher than those achievable by investing in capital guaranteed or capital stable funds.
To provide investors with a mix of both medium-term capital growth and income through exposure to a diversified investment portfolio.
To produce higher returns than other managed funds over the medium to long term with a level of risk within the commonly accepted range for funds with proportions of growth assets.
Fund manager trading ranges (%) at 30 June 2008
Cash 0-70
Aust’n Fixed Int 0-60
Int’l Fixed Int 0-20
Property 0-10
Aust’n Shares 0-20
Int’l Shares 0-20
Inflation Linked Bonds 0-10
Alternative Assets 0-8
Cash 6-12
Enhanced Cash 18-24
Australian Bonds 22-28
Australian Property Securities 2-8
Int’l Bonds - A$ hedged 12-18
Aust’n Shares 12-18
Int’l Shares 7-13
Cash 2.5-25
Fixed Interest 32.5-47.5
Property 3-7
Aust’n Shares 22.5-37.5
Int’l Shares 13-17
Cash 1.5-7.5
Cash Enhanced 7.5-13.5
Aust’n Bonds 19-25
Int’l Bonds - $A hedged 10-16
Aust’n Property Securities 2-8
Int’l Property Securities - $A hedged 2-8
Aust’n Shares 17-23
Int’l Shares 12-18
Int’l Shares - $A hedged 2-8
Cash 0-22
Fixed Interest 18-38
Property 3-7
Aust’n Shares 30-50
Int’l Shares 23-27
Performance percentage (%)
30/6/08 -3.70
30/6/07 7.47
30/6/06 5.43
30/6/05 5.70
30/6/04 -4.17
Average p.a. 2.02
30/6/08 -4.48
Fund first offered on 1 July 2005, so historical information is not available
Average p.a. n/a
30/6/08 -7.79
30/6/07 9.61
30/6/06 8.45
30/6/05 9.01
30/6/04 8.04
Average p.a. 5.24
30/6/08 -7.73
30/6/07 10.56
Average p.a. 1.42
30/6/08 -11.37
30/6/07 12.31
30/6/06 11.62
30/6/05 9.99
30/6/04 11.36
Average p.a. 6.36
Investment manager charge 0.82% p.a. at 30/06/2008# 1.31% p.a. at 30/06/2008 0.45% p.a. at 30/06/2008 1.31% p.a. at 30/06/2008 0.45% p.a. at 30/06/2008
Asset allocation at 30 June 2008
Cash 49.5%
Australian Fixed Interest 28.4%
Australian Shares 13.3%
Property 4.1%
International Fixed Interest 2.5%
International Shares 2.2%
Cash 31.0%
Australian Fixed Interest 25.1%
Australian Shares 14.9%
Property 3.8%
International Fixed Interest 15.1%
International Shares 10.1%
Cash 9.0%
Australian Fixed Interest 42.0%
Australian Shares 29.6%
Property 4.7%
International Shares 14.7%
Cash 14.8%
Australian Fixed Interest 23.1%
Australian Shares 21.9%
Property 5.4%
International Fixed Interest 13.3%
International Shares 21.5%
Cash 0.7%
Australian Fixed Interest 29.7%
Australian Shares 39.7%
Property 4.8%
International Fixed Interest 25.1%
Self Select options (cont.)

27
Diversified Income
Macquarie Master Capital Stable Fund
Diversified Income
Ventura Capital Stable (class A units)
Diversified Balanced Options
Norwich Union Balanced Fund
Diversified Balanced Options
Ventura Diversified 50 Fund (class A units)
Diversified Growth Options
Norwich Union Growth Fund
Investment objective To provide investors with exposure to a diversified portfolio of cash, fixed interest securities, Australian and international shares, Australian and global listed property and alternative assets.
To provide investors with some income and some medium-term capital growth with low volatility through exposure to a diversified investment portfolio.
To achieve returns over the medium to long term that are generally higher than those achievable by investing in capital guaranteed or capital stable funds.
To provide investors with a mix of both medium-term capital growth and income through exposure to a diversified investment portfolio.
To produce higher returns than other managed funds over the medium to long term with a level of risk within the commonly accepted range for funds with proportions of growth assets.
Fund manager trading ranges (%) at 30 June 2008
Cash 0-70
Aust’n Fixed Int 0-60
Int’l Fixed Int 0-20
Property 0-10
Aust’n Shares 0-20
Int’l Shares 0-20
Inflation Linked Bonds 0-10
Alternative Assets 0-8
Cash 6-12
Enhanced Cash 18-24
Australian Bonds 22-28
Australian Property Securities 2-8
Int’l Bonds - A$ hedged 12-18
Aust’n Shares 12-18
Int’l Shares 7-13
Cash 2.5-25
Fixed Interest 32.5-47.5
Property 3-7
Aust’n Shares 22.5-37.5
Int’l Shares 13-17
Cash 1.5-7.5
Cash Enhanced 7.5-13.5
Aust’n Bonds 19-25
Int’l Bonds - $A hedged 10-16
Aust’n Property Securities 2-8
Int’l Property Securities - $A hedged 2-8
Aust’n Shares 17-23
Int’l Shares 12-18
Int’l Shares - $A hedged 2-8
Cash 0-22
Fixed Interest 18-38
Property 3-7
Aust’n Shares 30-50
Int’l Shares 23-27
Performance percentage (%)
30/6/08 -3.70
30/6/07 7.47
30/6/06 5.43
30/6/05 5.70
30/6/04 -4.17
Average p.a. 2.02
30/6/08 -4.48
Fund first offered on 1 July 2005, so historical information is not available
Average p.a. n/a
30/6/08 -7.79
30/6/07 9.61
30/6/06 8.45
30/6/05 9.01
30/6/04 8.04
Average p.a. 5.24
30/6/08 -7.73
30/6/07 10.56
Average p.a. 1.42
30/6/08 -11.37
30/6/07 12.31
30/6/06 11.62
30/6/05 9.99
30/6/04 11.36
Average p.a. 6.36
Investment manager charge 0.82% p.a. at 30/06/2008# 1.31% p.a. at 30/06/2008 0.45% p.a. at 30/06/2008 1.31% p.a. at 30/06/2008 0.45% p.a. at 30/06/2008
Asset allocation at 30 June 2008
Cash 49.5%
Australian Fixed Interest 28.4%
Australian Shares 13.3%
Property 4.1%
International Fixed Interest 2.5%
International Shares 2.2%
Cash 31.0%
Australian Fixed Interest 25.1%
Australian Shares 14.9%
Property 3.8%
International Fixed Interest 15.1%
International Shares 10.1%
Cash 9.0%
Australian Fixed Interest 42.0%
Australian Shares 29.6%
Property 4.7%
International Shares 14.7%
Cash 14.8%
Australian Fixed Interest 23.1%
Australian Shares 21.9%
Property 5.4%
International Fixed Interest 13.3%
International Shares 21.5%
Cash 0.7%
Australian Fixed Interest 29.7%
Australian Shares 39.7%
Property 4.8%
International Fixed Interest 25.1%

28
Diversified Growth Options
BT Wholesale Balanced Returns Fund
Diversified Growth Options
Colonial First State Wholesale Diversified Fund
Diversified Growth Options
Credit Suisse Capital Growth Fund 8
Diversified Growth Options
ING Wholesale Balanced Trust
Diversified Growth Options
Intech Growth Plus Trust
Investment objective The Fund is an actively managed diversified portfolio that invests in Australian and International Shares, Australian and International Property securities, Australian and International Fixed Interest, Cash and Alternative Investments. The Fund has a higher weighting towards growth assets than defensive assets. The Fund aims to provide an overall return (i.e. a return before the deduction of management fees and expenses) that exceeds the return from its benchmark over five years or more.
To provide medium-to-long term capital growth, together with some income by investing in cash, fixed interest, property and shares.
To provide exposure to a range of sectors to achieve mostly capital growth over the long term with some income potential. There is no listed benchmark for this fund. The benchmark performance is based on the weighted average of the various sector benchmarks according to the benchmark asset allocation.
To achieve returns (before fees, charges and taxes) that on average exceed inflation by at least 4.5% pa, over periods of four years or more. The trust invests in a diversified mix of Australian and international assets with a balance of growth and defensive assets.
To provide investors with long-term capital growth and some income with the objective of earning a rate of return (gross of fees and tax) that exceeds CPI increases by at least 4% p.a. over rolling eight year periods.
Fund manager trading ranges (%) at 30 June 2008
Cash 0-20
Aust’n Fixed Int 5-32
Int’l Fixed Int 0-20
Aust’n Property 0-10
Aust’n Shares 23-43
Int’l Shares 10-30
Int’l Property 0-10
Alternative Assets 0-10
Cash & Fixed Int 20-40
Property - Aust’n 3-7
Property - Int’l 0-4
Aust’n Shares 32-38
Int’l Shares 20-26
Global Resources Shares 3-7
Aust’n Shares 25-50
Int’l Shares 15-40
Property 0-15
Aust’n Fixed Interest 0-30
Int’l Fixed Interest 0-25
Cash & Other 0-20
Alternative Investments 0-5
Cash 0-30
Diversified Fixed Int 5-35
Int’l Fixed Int 0-20
Property securities 0-10
Aust’n Shares 20-50
Int’l Shares 5-35
Global Property Securities 0-10
Alternative Assets (growth) 0-5
Alternative Assets (defensive) 0-10
Cash 0-15
Aust’n Bonds 0-20
Int’l Bonds Hedged 0-20
Aust’n Property Securities 0-15
Int’l Property Securities 0-16
Aust’n Shares 22-42
Int’l Shares Unhedged 7-27
Int’l Shares Hedged 1.5-21.5
Alternative Intestments 0- 5
Performance percentage (%)
30/6/08 -8.65
30/6/07 11.37
30/6/06 12.16
30/6/05 10.04
30/6/04 8.98
Average p.a. 6.47
30/6/08 -14.01
30/6/07 12.91
30/6/06 11.63
30/6/05 10.50
30/6/04 6.90
Average p.a. 5.07
30/6/08 -9.32
Fund first offered in June 2007, so historical information is not available.
Average p.a. n/a
30/6/08 -7.35
30/6/07 12.38
30/6/06 11.20
30/6/05 11.92
30/6/04 9.64
Average p.a. 7.28
30/6/08 -9.38
Fund first offered in June 2007, so historical information is not available.
Average p.a. n/a
Investment manager charge 0.92% p.a. at 30/06/2008# 0.95% p.a. at 31/03/2008# 0.72% p.a. at 30/06/2008 0.90% p.a. at 30/06/2008 0.87% p.a. at 31/03/2008#
Asset allocation at 30 June 2008
Cash 11.7%
Australian Fixed Interest 17.7%
Australian Shares 30.4%
Property 7.2%
International Fixed Interest 4.5%
International Shares 20.3%
Alternative Assets 8.2%
Cash 8.2%
Australian Fixed Interest 13.3%
Australian Shares 31.6%
Property 5.7%
International Fixed Interest 11.4%
International Shares 29.8%
Cash 7.4%
Australian Fixed Interest 9.5%
Australian Shares 43.0%
Property 3.4%
International Fixed Interest 10.2%
International Shares 26.5%
Cash 25.4%
Australian Fixed Interest 14.9%
Australian Shares 33.9%
Property 4.6%
International Fixed Interest 1.1%
International Shares 18.4%
Alternative Assets 1.7%
Cash 3.0%
Australian Fixed Interest 8.1%
Australian Shares 31.5%
Property 7.2%
International Fixed Interest 5.6%
International Shares 27.1%
Alternative Assets 17.5
Self Select options (cont.)

29
Diversified Growth Options
BT Wholesale Balanced Returns Fund
Diversified Growth Options
Colonial First State Wholesale Diversified Fund
Diversified Growth Options
Credit Suisse Capital Growth Fund 8
Diversified Growth Options
ING Wholesale Balanced Trust
Diversified Growth Options
Intech Growth Plus Trust
Investment objective The Fund is an actively managed diversified portfolio that invests in Australian and International Shares, Australian and International Property securities, Australian and International Fixed Interest, Cash and Alternative Investments. The Fund has a higher weighting towards growth assets than defensive assets. The Fund aims to provide an overall return (i.e. a return before the deduction of management fees and expenses) that exceeds the return from its benchmark over five years or more.
To provide medium-to-long term capital growth, together with some income by investing in cash, fixed interest, property and shares.
To provide exposure to a range of sectors to achieve mostly capital growth over the long term with some income potential. There is no listed benchmark for this fund. The benchmark performance is based on the weighted average of the various sector benchmarks according to the benchmark asset allocation.
To achieve returns (before fees, charges and taxes) that on average exceed inflation by at least 4.5% pa, over periods of four years or more. The trust invests in a diversified mix of Australian and international assets with a balance of growth and defensive assets.
To provide investors with long-term capital growth and some income with the objective of earning a rate of return (gross of fees and tax) that exceeds CPI increases by at least 4% p.a. over rolling eight year periods.
Fund manager trading ranges (%) at 30 June 2008
Cash 0-20
Aust’n Fixed Int 5-32
Int’l Fixed Int 0-20
Aust’n Property 0-10
Aust’n Shares 23-43
Int’l Shares 10-30
Int’l Property 0-10
Alternative Assets 0-10
Cash & Fixed Int 20-40
Property - Aust’n 3-7
Property - Int’l 0-4
Aust’n Shares 32-38
Int’l Shares 20-26
Global Resources Shares 3-7
Aust’n Shares 25-50
Int’l Shares 15-40
Property 0-15
Aust’n Fixed Interest 0-30
Int’l Fixed Interest 0-25
Cash & Other 0-20
Alternative Investments 0-5
Cash 0-30
Diversified Fixed Int 5-35
Int’l Fixed Int 0-20
Property securities 0-10
Aust’n Shares 20-50
Int’l Shares 5-35
Global Property Securities 0-10
Alternative Assets (growth) 0-5
Alternative Assets (defensive) 0-10
Cash 0-15
Aust’n Bonds 0-20
Int’l Bonds Hedged 0-20
Aust’n Property Securities 0-15
Int’l Property Securities 0-16
Aust’n Shares 22-42
Int’l Shares Unhedged 7-27
Int’l Shares Hedged 1.5-21.5
Alternative Intestments 0- 5
Performance percentage (%)
30/6/08 -8.65
30/6/07 11.37
30/6/06 12.16
30/6/05 10.04
30/6/04 8.98
Average p.a. 6.47
30/6/08 -14.01
30/6/07 12.91
30/6/06 11.63
30/6/05 10.50
30/6/04 6.90
Average p.a. 5.07
30/6/08 -9.32
Fund first offered in June 2007, so historical information is not available.
Average p.a. n/a
30/6/08 -7.35
30/6/07 12.38
30/6/06 11.20
30/6/05 11.92
30/6/04 9.64
Average p.a. 7.28
30/6/08 -9.38
Fund first offered in June 2007, so historical information is not available.
Average p.a. n/a
Investment manager charge 0.92% p.a. at 30/06/2008# 0.95% p.a. at 31/03/2008# 0.72% p.a. at 30/06/2008 0.90% p.a. at 30/06/2008 0.87% p.a. at 31/03/2008#
Asset allocation at 30 June 2008
Cash 11.7%
Australian Fixed Interest 17.7%
Australian Shares 30.4%
Property 7.2%
International Fixed Interest 4.5%
International Shares 20.3%
Alternative Assets 8.2%
Cash 8.2%
Australian Fixed Interest 13.3%
Australian Shares 31.6%
Property 5.7%
International Fixed Interest 11.4%
International Shares 29.8%
Cash 7.4%
Australian Fixed Interest 9.5%
Australian Shares 43.0%
Property 3.4%
International Fixed Interest 10.2%
International Shares 26.5%
Cash 25.4%
Australian Fixed Interest 14.9%
Australian Shares 33.9%
Property 4.6%
International Fixed Interest 1.1%
International Shares 18.4%
Alternative Assets 1.7%
Cash 3.0%
Australian Fixed Interest 8.1%
Australian Shares 31.5%
Property 7.2%
International Fixed Interest 5.6%
International Shares 27.1%
Alternative Assets 17.5

30
Diversified Growth Options
Legg Mason Diversified Trust
Diversified Growth Options
BlackRock Wholesale Balanced Fund
Diversified Growth Options
Perpetual’s Wholesale Balanced Growth Fund 8
Diversified Growth Options
Ventura Growth 70 Fund (class A units)
Diversified Growth Options
Zurich Managed Growth Fund 8
Investment objective To earn a before fees and tax return in excess of a benchmark constructed in accordance with the neutral asset allocations of the Trust.
To provide investors with the highest possible returns consistent with a “balanced” investment strategy encompassing:
- an orientation towards growth assets;
- a bias toward Australian assets; and- active asset allocation, security
selection and risk management.
The Fund aims to outperform its strategic benchmark over medium to longer term timeframes (ie. 3-5 years).
Aims to provide long term capital growth and income through investment in a diversified portfolio with an emphasis on Australian and international share investments.
To provide investors with medium-term capital growth and some income through exposure to a diversified investment portfolio.
To provide investors with capital growth over the medium to long term and a modest level of income. The Fund aims to outperform the performance benchmark over a period of five years.
Fund manager trading ranges (%) at 30 June 2008
Cash 0-15
Fixed Interest 15-35
Property 5-15
Aust’n Shares 25-45
Int’l Shares 20-30
Cash 0-25
Aust’n Fixed Int 0-35
Int’l Fixed Int 0-30
Property 0-15
Aust’n Shares 25-45
Int’l Shares 15-35
Aust’n Shares 25-60
Int’l Shares 5-30
Property 0-15
Fixed Interest 5-35
Mezzanine mortgages 0-10
Infrastructure 0-10
Cash 0-30
Cash 0-4.5
Cash Enhanced 0.5-6.5
Aust’n Bonds 12-18
Int’l Bonds - $A hedged 7-13
Aust’n Property Securities 2-8
Int’l Property Securities - $A hedged 0-6
Aust’n Shares 29-35
Int’l Shares - $A hedged 7-13
Int’l Shares 17-23
Aust’n Shares 20-46
Int’l Shares 10-38
Property Securities 0-12
Aust’n Fixed Interest 2-20
Int’l Fixed Interest 2-35
Cash 0-15
Performance percentage (%)
30/6/08 -14.27
30/6/07 14.48
30/6/06 12.00
30/6/05 9.10
30/6/04 10.01
Average p.a. 5.70
30/6/08 -4.76
30/6/07 13.39
30/6/06 14.17
30/6/05 10.19
30/6/04 12.95
Average p.a. 8.94
30/6/08 -7.15
Fund first offered in June 2007, so historical information is not available.
Average p.a. n/a
30/6/08 -10.44
30/6/07 12.43
Average p.a. 1.00
30/6/08 -6.68
Fund first offered in June 2007, so historical information is not available.
Average p.a. n/a
Investment manager charge 0.75% p.a. at 30/06/2008 0.86% p.a. at 30/06/2008# 1.04% p.a. at 30/06/2008 1.31% p.a. at 30/06/2008 0.87% p.a. at 30/06/2008
Asset allocation at 30 June 2008
Cash 3.9%
Australian Fixed Interest 11.2%
Australian Shares 40.1%
Property 10.4%
International Fixed Interest 11.4%
International Shares 23.0%
Cash 9.4%
Australian Fixed Interest 15.3%
Australian Shares 38.1%
Property 5.0%
International Fixed Interest 6.1%
International Shares 26.1%
Cash 20.2%
Australian Fixed Interest 13.0%
Australian Shares 36.9%
Property 4.1%
International Shares 25.4%
Alternative Assets 0.4%
Cash 6.1%
Australian Fixed Interest 15.8%
Australian Shares 31.5%
Property 6.5%
International Fixed Interest 10.4%
International Shares 29.7%
Cash 16.4%
Australian Fixed Interest 12.7%
Australian Shares 33.9%
Property 2.8%
International Fixed Interest 4.4%
International Shares 29.8%
Self Select options (cont.)

31
Diversified Growth Options
Legg Mason Diversified Trust
Diversified Growth Options
BlackRock Wholesale Balanced Fund
Diversified Growth Options
Perpetual’s Wholesale Balanced Growth Fund 8
Diversified Growth Options
Ventura Growth 70 Fund (class A units)
Diversified Growth Options
Zurich Managed Growth Fund 8
Investment objective To earn a before fees and tax return in excess of a benchmark constructed in accordance with the neutral asset allocations of the Trust.
To provide investors with the highest possible returns consistent with a “balanced” investment strategy encompassing:
- an orientation towards growth assets;
- a bias toward Australian assets; and- active asset allocation, security
selection and risk management.
The Fund aims to outperform its strategic benchmark over medium to longer term timeframes (ie. 3-5 years).
Aims to provide long term capital growth and income through investment in a diversified portfolio with an emphasis on Australian and international share investments.
To provide investors with medium-term capital growth and some income through exposure to a diversified investment portfolio.
To provide investors with capital growth over the medium to long term and a modest level of income. The Fund aims to outperform the performance benchmark over a period of five years.
Fund manager trading ranges (%) at 30 June 2008
Cash 0-15
Fixed Interest 15-35
Property 5-15
Aust’n Shares 25-45
Int’l Shares 20-30
Cash 0-25
Aust’n Fixed Int 0-35
Int’l Fixed Int 0-30
Property 0-15
Aust’n Shares 25-45
Int’l Shares 15-35
Aust’n Shares 25-60
Int’l Shares 5-30
Property 0-15
Fixed Interest 5-35
Mezzanine mortgages 0-10
Infrastructure 0-10
Cash 0-30
Cash 0-4.5
Cash Enhanced 0.5-6.5
Aust’n Bonds 12-18
Int’l Bonds - $A hedged 7-13
Aust’n Property Securities 2-8
Int’l Property Securities - $A hedged 0-6
Aust’n Shares 29-35
Int’l Shares - $A hedged 7-13
Int’l Shares 17-23
Aust’n Shares 20-46
Int’l Shares 10-38
Property Securities 0-12
Aust’n Fixed Interest 2-20
Int’l Fixed Interest 2-35
Cash 0-15
Performance percentage (%)
30/6/08 -14.27
30/6/07 14.48
30/6/06 12.00
30/6/05 9.10
30/6/04 10.01
Average p.a. 5.70
30/6/08 -4.76
30/6/07 13.39
30/6/06 14.17
30/6/05 10.19
30/6/04 12.95
Average p.a. 8.94
30/6/08 -7.15
Fund first offered in June 2007, so historical information is not available.
Average p.a. n/a
30/6/08 -10.44
30/6/07 12.43
Average p.a. 1.00
30/6/08 -6.68
Fund first offered in June 2007, so historical information is not available.
Average p.a. n/a
Investment manager charge 0.75% p.a. at 30/06/2008 0.86% p.a. at 30/06/2008# 1.04% p.a. at 30/06/2008 1.31% p.a. at 30/06/2008 0.87% p.a. at 30/06/2008
Asset allocation at 30 June 2008
Cash 3.9%
Australian Fixed Interest 11.2%
Australian Shares 40.1%
Property 10.4%
International Fixed Interest 11.4%
International Shares 23.0%
Cash 9.4%
Australian Fixed Interest 15.3%
Australian Shares 38.1%
Property 5.0%
International Fixed Interest 6.1%
International Shares 26.1%
Cash 20.2%
Australian Fixed Interest 13.0%
Australian Shares 36.9%
Property 4.1%
International Shares 25.4%
Alternative Assets 0.4%
Cash 6.1%
Australian Fixed Interest 15.8%
Australian Shares 31.5%
Property 6.5%
International Fixed Interest 10.4%
International Shares 29.7%
Cash 16.4%
Australian Fixed Interest 12.7%
Australian Shares 33.9%
Property 2.8%
International Fixed Interest 4.4%
International Shares 29.8%

32
Self Select options (cont.)
Diversified Aggressive Options
Colonial First State Wholesale High Growth Fund
Diversified Aggressive Options
Perpetual’s Wholesale Split Growth Fund
Australian Property Options
BT Wholesale Property Securities Fund 4
Australian Property Options
Challenger Wholesale Property Securities Fund11
Australian Property Options
Colonial First State Wholesale Property Securities Fund 8
Investment objective To provide long-term capital growth by investing in a diversified portfolio of Australian and global shares.
To provide long term capital growth through a mix of international shares and quality Australian industrial shares and other securities with lower risk than 100% exposure to either asset class.
The Fund is actively managed and primarily invests in listed property-related investments including listed property trusts, developers and infrastucture investments, both directly and indirectly. The Fund invests primarily in Australia but at times it may have some overseas exposure. Up to 15% of the Fund can be invested in international listed property-related investments. Around 5% of the Fund will generally also be invested in unlisted property investments.
To outperform its benchmark, the S&P/ASX 300 Property Trust Accumulation Index, over rolling three year periods, while providing a quarterly income stream with some capital growth over the medium-term.
To provide medium-to-long-term capital growth and income predominantly from a selection of listed property-related investments.
Fund manager trading ranges (%) at 30 June 2008
Cash 0-10
Aust’n Shares 37-43
Int’l Shares 37-43
Aust’n Small Company Shares 8-12
Global Resources 8-12
Cash 0-10
Int’l & Aust’n Ind’l Shares 90-100
Cash 0-20
Property Investments 80-100
Cash 0-100
Securities* 90-100
*The Securities asset allocation is broken down as follows:
Listed Property Related Companies 0 - 20
Listed Property Securities 80 - 100
Property Securities 90-100
Cash 0-10
Performance percentage (%)
30/6/08 -17.89
30/6/07 17.99
30/6/06 17.31
30/6/05 9.61
30/6/04 12.18
Average p.a. 6.92
30/6/08 -20.12
30/6/07 13.30
30/6/06 12.00
30/6/05 7.01
30/6/04 14.07
Average p.a. 4.35
30/6/08 -28.91
30/6/07 20.06
30/6/06 15.60
30/6/05 11.77
30/6/04 12.00
Average p.a. 4.31
30/6/08 -33.26
30/6/07 19.72
30/6/06 15.29
30/6/05 13.95
30/6/04 10.31
Average p.a. 2.98
30/6/08 -37.24
Fund first offered in June 2007, so historical information is not available.
Average p.a. n/a
Investment manager charge 1.15% p.a. at 30/06/2008# 1.16% p.a. at 30/06/2008# 0.65% p.a. at 30/06/2008# 0.90% p.a. at 30/06/2008# 0.80% p.a. at 30/06/2008
Asset allocation at 30 June 2008
Cash 3.4%
Australian Shares 45.6%
Property 2.4%
International Shares 48.6%
Cash 3.4%
Australian Shares 38.8%
Property 0.6%
International Shares 57.2%
Cash 2.7%
Property 97.3%
Cash 2.9%
Property 97.1%
Cash 3.3%
Australian Shares 1.6%
Property 95.1%

33
Diversified Aggressive Options
Colonial First State Wholesale High Growth Fund
Diversified Aggressive Options
Perpetual’s Wholesale Split Growth Fund
Australian Property Options
BT Wholesale Property Securities Fund 4
Australian Property Options
Challenger Wholesale Property Securities Fund11
Australian Property Options
Colonial First State Wholesale Property Securities Fund 8
Investment objective To provide long-term capital growth by investing in a diversified portfolio of Australian and global shares.
To provide long term capital growth through a mix of international shares and quality Australian industrial shares and other securities with lower risk than 100% exposure to either asset class.
The Fund is actively managed and primarily invests in listed property-related investments including listed property trusts, developers and infrastucture investments, both directly and indirectly. The Fund invests primarily in Australia but at times it may have some overseas exposure. Up to 15% of the Fund can be invested in international listed property-related investments. Around 5% of the Fund will generally also be invested in unlisted property investments.
To outperform its benchmark, the S&P/ASX 300 Property Trust Accumulation Index, over rolling three year periods, while providing a quarterly income stream with some capital growth over the medium-term.
To provide medium-to-long-term capital growth and income predominantly from a selection of listed property-related investments.
Fund manager trading ranges (%) at 30 June 2008
Cash 0-10
Aust’n Shares 37-43
Int’l Shares 37-43
Aust’n Small Company Shares 8-12
Global Resources 8-12
Cash 0-10
Int’l & Aust’n Ind’l Shares 90-100
Cash 0-20
Property Investments 80-100
Cash 0-100
Securities* 90-100
*The Securities asset allocation is broken down as follows:
Listed Property Related Companies 0 - 20
Listed Property Securities 80 - 100
Property Securities 90-100
Cash 0-10
Performance percentage (%)
30/6/08 -17.89
30/6/07 17.99
30/6/06 17.31
30/6/05 9.61
30/6/04 12.18
Average p.a. 6.92
30/6/08 -20.12
30/6/07 13.30
30/6/06 12.00
30/6/05 7.01
30/6/04 14.07
Average p.a. 4.35
30/6/08 -28.91
30/6/07 20.06
30/6/06 15.60
30/6/05 11.77
30/6/04 12.00
Average p.a. 4.31
30/6/08 -33.26
30/6/07 19.72
30/6/06 15.29
30/6/05 13.95
30/6/04 10.31
Average p.a. 2.98
30/6/08 -37.24
Fund first offered in June 2007, so historical information is not available.
Average p.a. n/a
Investment manager charge 1.15% p.a. at 30/06/2008# 1.16% p.a. at 30/06/2008# 0.65% p.a. at 30/06/2008# 0.90% p.a. at 30/06/2008# 0.80% p.a. at 30/06/2008
Asset allocation at 30 June 2008
Cash 3.4%
Australian Shares 45.6%
Property 2.4%
International Shares 48.6%
Cash 3.4%
Australian Shares 38.8%
Property 0.6%
International Shares 57.2%
Cash 2.7%
Property 97.3%
Cash 2.9%
Property 97.1%
Cash 3.3%
Australian Shares 1.6%
Property 95.1%

34
Self Select options (cont.)
Australian Property Options
Intech Australian Property Securities Trust 8
Australian Property Options
Macquarie Master Property Securities Fund
Australian Property Options
MLC Wholesale Property Securities Fund
Australian Property Options
Vanguard Property Securities Index Fund
Australian Shares - Growth Options
BT Wholesale Australian Share Fund
Investment objective To match and, where possible, enhance performance relative to the benchmark over rolling 3 year periods by investing predominantly in listed Australian property securities.
To outperform the S&P/ASX 200 Property Accumulation Index over the medium term (before fees) and provide a consistent level of income and some capital growth.
To provide an income stream and growth over time through investment in a range of listed property securities.
To match the total return of the S&P/ASX 300 Property Accumulation Index, before taking into account fund expenses.
To provide a return (before fees, costs and taxes) that exceeds the S&P/ASX 300 Accumulation Index over the medium to long term. The Fund is actively managed and invests directly and indirectly in primarily Australian shares that the manager believes are trading at significant discount to their assessed value.
Fund manager trading ranges (%) at 30 June 2008
Property 100 Cash 0-10
Property 90-100
Cash 0-5
Property 95-100
Property 100 Cash 0-20
Aust’n Shares 80-100
Performance percentage (%)
30/6/08 -30.57
Fund first offered in June 2007, so historical information is not available.
Average p.a. n/a
30/6/08 -36.55
30/6/07 21.52
30/6/06 14.59
30/6/05 14.69
30/6/04 10.43
Average p.a. 2.27
30/6/08 -28.64
30/6/07 19.68
30/6/06 15.36
30/6/05 13.63
30/6/04 11.66
Average p.a. 4.56
30/6/08 -33.41
30/6/07 20.34
30/6/06 15.03
30/6/05 14.30
30/6/04 8.69
Average p.a. 2.75
30/6/08 -8.57
30/6/07 23.41
30/6/06 21.28
30/6/05 23.55
30/6/04 19.42
Average p.a. 15.09
Investment manager charge 0.34% p.a. at 30/06/2008 0.72% p.a. at 30/06/2008# 0.87% p.a. at 30/06/2008# 0.34% p.a. at 30/06/2008# 0.79% p.a. at 30/06/2008
Asset allocation at 30 June 2008
Property 100.0% Cash 2.2%
Property 97.8%
Cash 3.9%
Property 96.1%
Property 100% Cash 3.7%
Australian Shares 95.3%
Property 1.0%

35
Australian Property Options
Intech Australian Property Securities Trust 8
Australian Property Options
Macquarie Master Property Securities Fund
Australian Property Options
MLC Wholesale Property Securities Fund
Australian Property Options
Vanguard Property Securities Index Fund
Australian Shares - Growth Options
BT Wholesale Australian Share Fund
Investment objective To match and, where possible, enhance performance relative to the benchmark over rolling 3 year periods by investing predominantly in listed Australian property securities.
To outperform the S&P/ASX 200 Property Accumulation Index over the medium term (before fees) and provide a consistent level of income and some capital growth.
To provide an income stream and growth over time through investment in a range of listed property securities.
To match the total return of the S&P/ASX 300 Property Accumulation Index, before taking into account fund expenses.
To provide a return (before fees, costs and taxes) that exceeds the S&P/ASX 300 Accumulation Index over the medium to long term. The Fund is actively managed and invests directly and indirectly in primarily Australian shares that the manager believes are trading at significant discount to their assessed value.
Fund manager trading ranges (%) at 30 June 2008
Property 100 Cash 0-10
Property 90-100
Cash 0-5
Property 95-100
Property 100 Cash 0-20
Aust’n Shares 80-100
Performance percentage (%)
30/6/08 -30.57
Fund first offered in June 2007, so historical information is not available.
Average p.a. n/a
30/6/08 -36.55
30/6/07 21.52
30/6/06 14.59
30/6/05 14.69
30/6/04 10.43
Average p.a. 2.27
30/6/08 -28.64
30/6/07 19.68
30/6/06 15.36
30/6/05 13.63
30/6/04 11.66
Average p.a. 4.56
30/6/08 -33.41
30/6/07 20.34
30/6/06 15.03
30/6/05 14.30
30/6/04 8.69
Average p.a. 2.75
30/6/08 -8.57
30/6/07 23.41
30/6/06 21.28
30/6/05 23.55
30/6/04 19.42
Average p.a. 15.09
Investment manager charge 0.34% p.a. at 30/06/2008 0.72% p.a. at 30/06/2008# 0.87% p.a. at 30/06/2008# 0.34% p.a. at 30/06/2008# 0.79% p.a. at 30/06/2008
Asset allocation at 30 June 2008
Property 100.0% Cash 2.2%
Property 97.8%
Cash 3.9%
Property 96.1%
Property 100% Cash 3.7%
Australian Shares 95.3%
Property 1.0%
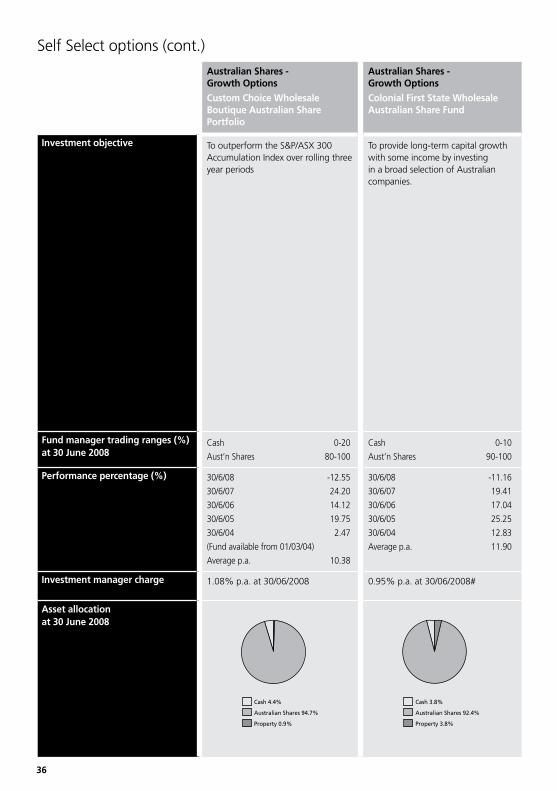
36
Self Select options (cont.)
Australian Shares - Growth Options
Custom Choice Wholesale Boutique Australian Share Portfolio
Australian Shares - Growth Options
Colonial First State Wholesale Australian Share Fund
Australian Shares - Growth Options
Intech Australian Shares Active Trust
Australian Shares - Growth Options
Portfolio Partners High Growth Shares Trust2
Australian Shares - Growth Options
Portfolio Partners Australian Equities Trust
Investment objective To outperform the S&P/ASX 300 Accumulation Index over rolling three year periods
To provide long-term capital growth with some income by investing in a broad selection of Australian companies.
To provide investors with investment returns above the benchmark over rolling five year periods by investing predominantly in listed Australian shares within a clearly defined risk profile.
The Trust’s objective is to significantly outperform its benchmark (S&P/ASX 200 Accumulation Index) over the long-term by investing in a diversified portfolio of Australian shares. It uses a range of investment techniques (such as short selling, active trading and enhanced long positions) aimed at providing investors with the opportunity to enhance returns. The aggregate of all short positions in the trust is limited to 25%, and the aggregate of all long positions is limited to 125% of the value of the trust’s net assets. The long and short positions provide investors with a gross exposure to the sharemarket of up to 150% and a net exposure of between 80 - 100%. This trust is actively traded and returns are taxed on a revenue basis. The risk profile of this option means that we suggest that you obtain financial advice before investing.
To outperform the Trust’s benchmark (S&P/ASX 200 Accumulation Index) over the long term.
To provide long term capital growth and some franked income through investment in an actively managed and broadly diversified portfolio of Australian shares.
Fund manager trading ranges (%) at 30 June 2008
Cash 0-20
Aust’n Shares 80-100
Cash 0-10
Aust’n Shares 90-100
Aust’n Shares 100 Cash 0-20
Aust’n Shares 80-100
Cash 0-20
Aust’n Shares 80-100
Performance percentage (%)
30/6/08 -12.55
30/6/07 24.20
30/6/06 14.12
30/6/05 19.75
30/6/04 2.47
(Fund available from 01/03/04)
Average p.a. 10.38
30/6/08 -11.16
30/6/07 19.41
30/6/06 17.04
30/6/05 25.25
30/6/04 12.83
Average p.a. 11.90
30/6/08 -11.87
Fund first offered in June 2007, so historical information is not available.
Average p.a. n/a
30/6/08 -3.84
30/6/07 21.03
30/6/06 14.15
30/6/05 18.45
30/6/04 25.31
Average p.a. 14.55
30/6/08 -10.81
30/6/07 23.44
30/6/06 19.09
30/6/05 18.37
30/6/04 21.99
Average p.a. 13.62
Investment manager charge 1.08% p.a. at 30/06/2008 0.95% p.a. at 30/06/2008# 0.85% p.a. at 30/06/2008# 1.05% p.a. at 30/06/2008 0.87% p.a. at 30/06/2008
Asset allocation at 30 June 2008
Cash 4.4%
Australian Shares 94.7%
Property 0.9%
Cash 3.8%
Australian Shares 92.4%
Property 3.8%
Australian Shares 100.0% Cash 6.4%
Australian Shares 93.6%
Cash 5.4%
Australian Shares 94.6%

37
Australian Shares - Growth Options
Custom Choice Wholesale Boutique Australian Share Portfolio
Australian Shares - Growth Options
Colonial First State Wholesale Australian Share Fund
Australian Shares - Growth Options
Intech Australian Shares Active Trust
Australian Shares - Growth Options
Portfolio Partners High Growth Shares Trust2
Australian Shares - Growth Options
Portfolio Partners Australian Equities Trust
Investment objective To outperform the S&P/ASX 300 Accumulation Index over rolling three year periods
To provide long-term capital growth with some income by investing in a broad selection of Australian companies.
To provide investors with investment returns above the benchmark over rolling five year periods by investing predominantly in listed Australian shares within a clearly defined risk profile.
The Trust’s objective is to significantly outperform its benchmark (S&P/ASX 200 Accumulation Index) over the long-term by investing in a diversified portfolio of Australian shares. It uses a range of investment techniques (such as short selling, active trading and enhanced long positions) aimed at providing investors with the opportunity to enhance returns. The aggregate of all short positions in the trust is limited to 25%, and the aggregate of all long positions is limited to 125% of the value of the trust’s net assets. The long and short positions provide investors with a gross exposure to the sharemarket of up to 150% and a net exposure of between 80 - 100%. This trust is actively traded and returns are taxed on a revenue basis. The risk profile of this option means that we suggest that you obtain financial advice before investing.
To outperform the Trust’s benchmark (S&P/ASX 200 Accumulation Index) over the long term.
To provide long term capital growth and some franked income through investment in an actively managed and broadly diversified portfolio of Australian shares.
Fund manager trading ranges (%) at 30 June 2008
Cash 0-20
Aust’n Shares 80-100
Cash 0-10
Aust’n Shares 90-100
Aust’n Shares 100 Cash 0-20
Aust’n Shares 80-100
Cash 0-20
Aust’n Shares 80-100
Performance percentage (%)
30/6/08 -12.55
30/6/07 24.20
30/6/06 14.12
30/6/05 19.75
30/6/04 2.47
(Fund available from 01/03/04)
Average p.a. 10.38
30/6/08 -11.16
30/6/07 19.41
30/6/06 17.04
30/6/05 25.25
30/6/04 12.83
Average p.a. 11.90
30/6/08 -11.87
Fund first offered in June 2007, so historical information is not available.
Average p.a. n/a
30/6/08 -3.84
30/6/07 21.03
30/6/06 14.15
30/6/05 18.45
30/6/04 25.31
Average p.a. 14.55
30/6/08 -10.81
30/6/07 23.44
30/6/06 19.09
30/6/05 18.37
30/6/04 21.99
Average p.a. 13.62
Investment manager charge 1.08% p.a. at 30/06/2008 0.95% p.a. at 30/06/2008# 0.85% p.a. at 30/06/2008# 1.05% p.a. at 30/06/2008 0.87% p.a. at 30/06/2008
Asset allocation at 30 June 2008
Cash 4.4%
Australian Shares 94.7%
Property 0.9%
Cash 3.8%
Australian Shares 92.4%
Property 3.8%
Australian Shares 100.0% Cash 6.4%
Australian Shares 93.6%
Cash 5.4%
Australian Shares 94.6%

38
Self Select options (cont.)
Australian Shares - Growth Options
UBS Australian Share Fund
Australian Shares - Growth Options
Ventura Australian Opportunities Fund (class A units)
Australian Shares - Growth Options
Ventura Australian Share Fund (class A units)
Australian Shares - Imputation Options
AXA Wholesale Australian Equity - Industrials Fund
Australian Shares - Imputation Options
BlackRock Wholesale Australian Share Fund 5
Investment objective To provide a total return (after total costs) in excess of the S&P/ASX 300 Accumulation Index when measured over rolling three year periods. This Fund is an actively managed portfolio of securities listed on the Australian Stock Exchange or those we reasonably expect to list within 6 months. The Fund may also invest indirectly in listed Australian securities via investments in other UBS managed funds, including the UBS Emerging Companies Fund which includes companies which may be listed in New Zealand but not in Australia - this exposure is likely to be negligible. The Fund may invest in financial derivatives to gain exposure to the Australian sharemarket or to manage investment risk. Normally the Fund will hold between 30 and 60 stocks/sub funds with at least 75% of the Fund invested in stocks that comprise the S&P/ASX 100 Index.
To provide exposure to a diversified portfolio of Australian shares and to significantly outperform the Fund’s benchmark (S&P / ASX 300 Accumulation Index) before costs and tax, over the long term.
To provide exposure to a diversified portfolio of Australian shares, and to provide a total return, before costs and tax, higher than the Fund’s benchmark (S&P/ASX 300 Accumulation Index) over the long term.
To outperform the S&P/ASX 300 Industrials Accumulation Index after costs, over rolling five year periods.
To achieve capital growth through investment in Australian shares and other securities and to provide investors with tax effective income. The fund aims to outperform the S&P/ASX 200 Accumulation Index over rolling five-year periods.
Fund manager trading ranges (%) at 30 June 2008
Cash 0-10
Aust’n Shares 90-100
Cash 0-3
Aust’n Shares 0-100
Cash 0-3
Aust’n Shares 0-100
Cash 0-5
Aust’n Shares 95-100
Cash 0-20
Aust’n Shares 80-100
Performance percentage (%)
30/6/08 -10.81
30/6/07 25.73
30/6/06 17.94
30/6/05 22.43
30/6/04 16.47
Average p.a. 13.53
30/6/08 -13.13
30/6/07 21.78
Average p.a. 4.33
30/6/08 -9.07
30/6/07 24.61
Average p.a. 7.77
30/6/08 -16.66
30/6/07 27.46
30/6/06 13.09
30/6/05 21.14
30/6/04 12.61
Average p.a. 10.38
30/6/08 -4.53
30/6/07 22.40
30/6/06 22.41
30/6/05 24.70
30/6/04 16.95
Average p.a. 15.84
Investment manager charge 0.80% p.a. at 30/06/2008# 1.15% p.a. at 30/06/2008 1.31% p.a. at 30/06/2008 0.85% p.a. at 30/06/2008# 0.85% p.a. at 30/06/2008
Asset allocation at 30 June 2008
Cash 1.9%
Australian Shares 94.1%
Property 4.0%
Australian Shares 100.0% Cash 0.3%
Australian Shares 99.7%
Cash 7.9%
Australian Shares 88.9%
Property 3.2%
Cash 2.6%
Australian Shares 97.0%
Property 0.4%

39
Australian Shares - Growth Options
UBS Australian Share Fund
Australian Shares - Growth Options
Ventura Australian Opportunities Fund (class A units)
Australian Shares - Growth Options
Ventura Australian Share Fund (class A units)
Australian Shares - Imputation Options
AXA Wholesale Australian Equity - Industrials Fund
Australian Shares - Imputation Options
BlackRock Wholesale Australian Share Fund 5
Investment objective To provide a total return (after total costs) in excess of the S&P/ASX 300 Accumulation Index when measured over rolling three year periods. This Fund is an actively managed portfolio of securities listed on the Australian Stock Exchange or those we reasonably expect to list within 6 months. The Fund may also invest indirectly in listed Australian securities via investments in other UBS managed funds, including the UBS Emerging Companies Fund which includes companies which may be listed in New Zealand but not in Australia - this exposure is likely to be negligible. The Fund may invest in financial derivatives to gain exposure to the Australian sharemarket or to manage investment risk. Normally the Fund will hold between 30 and 60 stocks/sub funds with at least 75% of the Fund invested in stocks that comprise the S&P/ASX 100 Index.
To provide exposure to a diversified portfolio of Australian shares and to significantly outperform the Fund’s benchmark (S&P / ASX 300 Accumulation Index) before costs and tax, over the long term.
To provide exposure to a diversified portfolio of Australian shares, and to provide a total return, before costs and tax, higher than the Fund’s benchmark (S&P/ASX 300 Accumulation Index) over the long term.
To outperform the S&P/ASX 300 Industrials Accumulation Index after costs, over rolling five year periods.
To achieve capital growth through investment in Australian shares and other securities and to provide investors with tax effective income. The fund aims to outperform the S&P/ASX 200 Accumulation Index over rolling five-year periods.
Fund manager trading ranges (%) at 30 June 2008
Cash 0-10
Aust’n Shares 90-100
Cash 0-3
Aust’n Shares 0-100
Cash 0-3
Aust’n Shares 0-100
Cash 0-5
Aust’n Shares 95-100
Cash 0-20
Aust’n Shares 80-100
Performance percentage (%)
30/6/08 -10.81
30/6/07 25.73
30/6/06 17.94
30/6/05 22.43
30/6/04 16.47
Average p.a. 13.53
30/6/08 -13.13
30/6/07 21.78
Average p.a. 4.33
30/6/08 -9.07
30/6/07 24.61
Average p.a. 7.77
30/6/08 -16.66
30/6/07 27.46
30/6/06 13.09
30/6/05 21.14
30/6/04 12.61
Average p.a. 10.38
30/6/08 -4.53
30/6/07 22.40
30/6/06 22.41
30/6/05 24.70
30/6/04 16.95
Average p.a. 15.84
Investment manager charge 0.80% p.a. at 30/06/2008# 1.15% p.a. at 30/06/2008 1.31% p.a. at 30/06/2008 0.85% p.a. at 30/06/2008# 0.85% p.a. at 30/06/2008
Asset allocation at 30 June 2008
Cash 1.9%
Australian Shares 94.1%
Property 4.0%
Australian Shares 100.0% Cash 0.3%
Australian Shares 99.7%
Cash 7.9%
Australian Shares 88.9%
Property 3.2%
Cash 2.6%
Australian Shares 97.0%
Property 0.4%

40
Self Select options (cont.)
Australian Shares - Imputation Options
MLC Wholesale IncomeBuilderTM
Australian Shares - Imputation Options
Perpetual’s Wholesale Industrial Fund
Australian Shares - Smaller Companies Options
Challenger Smaller Companies Fund 3
Australian Shares - Smaller Companies Options
Credit Suisse Australian Small Companies Fund
Australian Shares - Smaller Companies Options
INVESCO Wholesale Australian Smaller Companies Fund
Investment objective To deliver a growing tax advantaged income stream from a portfolio with a focus on Australian industrial shares that have the potential to provide future growth in dividends.
To provide long term capital growth and income through investment in quality Australian industrial shares.
To provide investors with a diversified portfolio of smaller Australian companies that aims to outperform the S&P/ASX Small Ordinaries Accumulation Index over rolling 3 year periods.
To invest primarily in small Australian companies with the potential for long-term capital growth.
To provide long term capital growth and distributions by investing in small companies listed on the Australian sharemarket, predominantly outside of the ASX/S&P 100 Index.
Fund manager trading ranges (%) at 30 June 2008
Cash & Fixed Int 0-5
Shares 95-100
Cash 0-10
Aust’n Ind Shares 90-100
Cash 0-20
Aust’n Shares 80-100
Cash 0-20
Aust’n Shares 80-100
Cash 0-10
Unlisted Aust’n Shares 0-10
Listed Aust’n Shares 90-100
Performance percentage (%)
30/6/08 -19.99
30/6/07 22.30
30/6/06 9.82
30/6/05 18.96
30/6/04 14.38
Average p.a. 7.89
30/6/08 -18.37
30/6/07 26.02
30/6/06 12.73
30/6/05 18.39
30/6/04 16.88
Average p.a. 9.92
30/6/08 -11.37
30/6/07 45.83
30/6/06 5.46
30/6/05 14.01
30/6/04 5.40
Average p.a. 10.37
30/6/08 -24.30
30/6/07 31.81
30/6/06 14.73
30/6/05 3.86
Average p.a. 6.53
30/6/08 -15.20
30/6/07 38.75
30/6/06 17.79
30/6/05 25.35
30/6/04 16.58
Average p.a. 15.16
Investment manager charge 0.97% p.a. at 30/06/2008# 0.99% p.a. at 30/06/2008# 0.95% p.a. at 30/06/2008 1.25% p.a. at 31/03/2008# 1.25% p.a. at 30/06/2008#
Asset allocation at 30 June 2008
Cash 5.1%
Australian Shares 86.2%
Property 8.7%
Cash 1.9%
Australian Shares 96.5%
Property 1.6%
Cash 14.4%
Australian Shares 85.6%
Cash 19.1%
Australian Shares 80.9%
Cash 5.7%
Australian Shares 94.3%

41
Australian Shares - Imputation Options
MLC Wholesale IncomeBuilderTM
Australian Shares - Imputation Options
Perpetual’s Wholesale Industrial Fund
Australian Shares - Smaller Companies Options
Challenger Smaller Companies Fund 3
Australian Shares - Smaller Companies Options
Credit Suisse Australian Small Companies Fund
Australian Shares - Smaller Companies Options
INVESCO Wholesale Australian Smaller Companies Fund
Investment objective To deliver a growing tax advantaged income stream from a portfolio with a focus on Australian industrial shares that have the potential to provide future growth in dividends.
To provide long term capital growth and income through investment in quality Australian industrial shares.
To provide investors with a diversified portfolio of smaller Australian companies that aims to outperform the S&P/ASX Small Ordinaries Accumulation Index over rolling 3 year periods.
To invest primarily in small Australian companies with the potential for long-term capital growth.
To provide long term capital growth and distributions by investing in small companies listed on the Australian sharemarket, predominantly outside of the ASX/S&P 100 Index.
Fund manager trading ranges (%) at 30 June 2008
Cash & Fixed Int 0-5
Shares 95-100
Cash 0-10
Aust’n Ind Shares 90-100
Cash 0-20
Aust’n Shares 80-100
Cash 0-20
Aust’n Shares 80-100
Cash 0-10
Unlisted Aust’n Shares 0-10
Listed Aust’n Shares 90-100
Performance percentage (%)
30/6/08 -19.99
30/6/07 22.30
30/6/06 9.82
30/6/05 18.96
30/6/04 14.38
Average p.a. 7.89
30/6/08 -18.37
30/6/07 26.02
30/6/06 12.73
30/6/05 18.39
30/6/04 16.88
Average p.a. 9.92
30/6/08 -11.37
30/6/07 45.83
30/6/06 5.46
30/6/05 14.01
30/6/04 5.40
Average p.a. 10.37
30/6/08 -24.30
30/6/07 31.81
30/6/06 14.73
30/6/05 3.86
Average p.a. 6.53
30/6/08 -15.20
30/6/07 38.75
30/6/06 17.79
30/6/05 25.35
30/6/04 16.58
Average p.a. 15.16
Investment manager charge 0.97% p.a. at 30/06/2008# 0.99% p.a. at 30/06/2008# 0.95% p.a. at 30/06/2008 1.25% p.a. at 31/03/2008# 1.25% p.a. at 30/06/2008#
Asset allocation at 30 June 2008
Cash 5.1%
Australian Shares 86.2%
Property 8.7%
Cash 1.9%
Australian Shares 96.5%
Property 1.6%
Cash 14.4%
Australian Shares 85.6%
Cash 19.1%
Australian Shares 80.9%
Cash 5.7%
Australian Shares 94.3%

42
Self Select options (cont.)
Australian Shares - Smaller Companies Options
Investors Mutual Future Leaders Fund 3
Australian Shares - Smaller Companies Options
Perpetual’s Wholesale Smaller Companies Fund7
Australian Shares - Smaller Companies Options
Portfolio Partners Emerging Shares Trust 6
International Shares - Global Options
AXA Wholesale Global Equity – Value Fund
International Shares - Global Options
Credit Suisse International Shares Fund
Investment objective To provide a total rate of return, before expenses and tax, superior to the S&P/ASX 300 Accumulation Index (excluding S&P/ASX 50 excluding property trusts) over a rolling 4 year period.
To provide long term capital growth and income through investment in quality Australian industrial and resources shares and other securities which, when first acquired, do not rank in the S&P/ASX 50 Index.
To outperform the Trust’s benchmark (S&P/ASX Small Ordinaries Accumulation Index) over the long-term by benefiting from the long-term growth of small emerging companies.
To provide unit holders with a long-term capital growth and to outperform the Morgan Stanley Capital International World Index (net dividends reinvested), in Australian dollar terms, after costs and over rolling five-year periods.
To provide exposure to primarily international shares with the potential for a high level of growth over the longer term, with the benefit of exposure to world growth opportunities.
Fund manager trading ranges (%) at 30 June 2008
Cash 0-20
Aust’n Shares 80-100
Cash 0-20
Aust’n Smaller Comp Shares 80-100
Cash 0-20
Aust’n Shares 80-100
Cash & Cash Securities 0-5
Int’l Shares 95-100
Cash 0-10
Int’l Shares 90-100
Performance percentage (%)
30/6/08 -25.32
30/6/07 33.37
30/6/06 11.83
30/6/05 22.74
30/6/04 15.19
Average p.a. 9.51
30/6/08 -17.54
30/6/07 43.75
30/6/06 14.78
30/6/05 16.29
30/6/04 24.83
Average p.a. 14.58
30/6/08 -5.02
30/6/07 40.12
30/6/06 17.94
30/6/05 21.80
30/6/04 29.17
Average p.a. 19.82
30/6/08 -25.08
30/6/07 15.49
30/6/06 18.58
30/6/05 4.59
30/6/04 13.12
Average p.a. 3.95
30/6/08 -17.24
30/6/07 4.88
30/6/06 17.90
30/6/05 -5.46
30/6/04 14.99
Average p.a. 2.16
Investment manager charge 0.97% p.a. at 30/06/2008 1.25% p.a. at 30/06/2008 0.98% p.a. at 30/06/2008 1.00% p.a. at 30/06/2008# 0.96% p.a. at 31/03/2008#
Asset allocation at 30 June 2008
Cash 13.1%
Australian Shares 86.9%
Cash 1.0%
Australian Shares 97.0%
Property 2.0%
Cash 11.7%
Australian Shares 88.3%
Cash 0.4%
International Shares 98.4%
Alternative Assets 1.2%
Cash 1.7%
International Shares 98.3%

43
Australian Shares - Smaller Companies Options
Investors Mutual Future Leaders Fund 3
Australian Shares - Smaller Companies Options
Perpetual’s Wholesale Smaller Companies Fund7
Australian Shares - Smaller Companies Options
Portfolio Partners Emerging Shares Trust 6
International Shares - Global Options
AXA Wholesale Global Equity – Value Fund
International Shares - Global Options
Credit Suisse International Shares Fund
Investment objective To provide a total rate of return, before expenses and tax, superior to the S&P/ASX 300 Accumulation Index (excluding S&P/ASX 50 excluding property trusts) over a rolling 4 year period.
To provide long term capital growth and income through investment in quality Australian industrial and resources shares and other securities which, when first acquired, do not rank in the S&P/ASX 50 Index.
To outperform the Trust’s benchmark (S&P/ASX Small Ordinaries Accumulation Index) over the long-term by benefiting from the long-term growth of small emerging companies.
To provide unit holders with a long-term capital growth and to outperform the Morgan Stanley Capital International World Index (net dividends reinvested), in Australian dollar terms, after costs and over rolling five-year periods.
To provide exposure to primarily international shares with the potential for a high level of growth over the longer term, with the benefit of exposure to world growth opportunities.
Fund manager trading ranges (%) at 30 June 2008
Cash 0-20
Aust’n Shares 80-100
Cash 0-20
Aust’n Smaller Comp Shares 80-100
Cash 0-20
Aust’n Shares 80-100
Cash & Cash Securities 0-5
Int’l Shares 95-100
Cash 0-10
Int’l Shares 90-100
Performance percentage (%)
30/6/08 -25.32
30/6/07 33.37
30/6/06 11.83
30/6/05 22.74
30/6/04 15.19
Average p.a. 9.51
30/6/08 -17.54
30/6/07 43.75
30/6/06 14.78
30/6/05 16.29
30/6/04 24.83
Average p.a. 14.58
30/6/08 -5.02
30/6/07 40.12
30/6/06 17.94
30/6/05 21.80
30/6/04 29.17
Average p.a. 19.82
30/6/08 -25.08
30/6/07 15.49
30/6/06 18.58
30/6/05 4.59
30/6/04 13.12
Average p.a. 3.95
30/6/08 -17.24
30/6/07 4.88
30/6/06 17.90
30/6/05 -5.46
30/6/04 14.99
Average p.a. 2.16
Investment manager charge 0.97% p.a. at 30/06/2008 1.25% p.a. at 30/06/2008 0.98% p.a. at 30/06/2008 1.00% p.a. at 30/06/2008# 0.96% p.a. at 31/03/2008#
Asset allocation at 30 June 2008
Cash 13.1%
Australian Shares 86.9%
Cash 1.0%
Australian Shares 97.0%
Property 2.0%
Cash 11.7%
Australian Shares 88.3%
Cash 0.4%
International Shares 98.4%
Alternative Assets 1.2%
Cash 1.7%
International Shares 98.3%

44
Self Select options (cont.)
International Shares - Global Options
Goldman Sachs JBWere International Wholesale Fund
International Shares - Global Options
Intech International Shares (Unhedged) Trust 8
International Shares - Global Options
BlackRock Wholesale International Share Fund
International Shares - Global Options
Perpetual’s Wholesale International Share Fund
International Shares - Global Options
Platinum International Fund
Investment objective To achieve medium to long-term capital growth by investing in international companies.
To maximise outperformance relative to the benchmark over rolling 5 year periods by investing predominantly in listed international shares.
To provide investors with capital growth over the medium to long-term by investing in a portfolio of international shares. The Fund aims to outperform the Morgan Stanley Capital International World Index ex-Australia (AUD) over rolling five year periods.
To provide long-term capital growth through investment in international shares and other securities.
To provide capital growth over the long term by searching out undervalued listed and unlisted investments from around the world. The portfolio ideally will consist of around 100 to 200 stocks that the manager believes to be undervalued by the market. Where undervalued stocks cannot be found, funds may be invested in cash. The manager may short sell shares that are considered to be overvalued. Typically the portfolio will have 50% or more net exposure to stocks.
Fund manager trading ranges (%) at 30 June 2008
Cash 0-20
Int’l Shares 80-100
Int’l Shares 100 Cash 0-10
Int’l Shares 90-100
Cash 0-10
Int’l Shares 90-100
Cash 0-100
Int’l Shares 0-100
*Derivatives maybe be used to increase the effective exposure of the fund to 150% of the fund’s net asset value.
Performance percentage (%)
30/6/08 -12.39
30/6/07 5.10
30/6/06 14.36
30/6/05 -3.46
30/6/04 16.42
Average p.a. 3.43
30/6/08 -21.13
Fund first offered in June 2007, so historical information is not available.
Average p.a. n/a
30/6/08 -10.35
30/6/07 8.12
30/6/06 11.64
30/6/05 -0.73
30/6/04 9.43
Average p.a. 3.29
30/6/08 -21.58
30/6/07 4.92
30/6/06 12.11
30/6/05 0.84
30/6/04 11.77
Average p.a. 0.78
30/6/08 -13.49
30/6/07 5.05
30/6/06 17.48
30/6/05 -0.02
(Fund available from 18/10/04)
Average p.a. 2.26
Investment manager charge 1.22% p.a. at 30/06/2008 0.85% p.a. at 30/06/2008 0.95% p.a. at 30/06/2008# 1.23% p.a. at 30/06/2008# 1.54% p.a. at 30/06/2008#
Asset allocation at 30 June 2008
Cash 2.7%
International Shares 97.3%
International Shares 100.0% Cash 2.8%
International Shares 97.2%
Cash 3.9%
International Shares 96.1%
Cash 16.9%
International Shares 83.1%

45
International Shares - Global Options
Goldman Sachs JBWere International Wholesale Fund
International Shares - Global Options
Intech International Shares (Unhedged) Trust 8
International Shares - Global Options
BlackRock Wholesale International Share Fund
International Shares - Global Options
Perpetual’s Wholesale International Share Fund
International Shares - Global Options
Platinum International Fund
Investment objective To achieve medium to long-term capital growth by investing in international companies.
To maximise outperformance relative to the benchmark over rolling 5 year periods by investing predominantly in listed international shares.
To provide investors with capital growth over the medium to long-term by investing in a portfolio of international shares. The Fund aims to outperform the Morgan Stanley Capital International World Index ex-Australia (AUD) over rolling five year periods.
To provide long-term capital growth through investment in international shares and other securities.
To provide capital growth over the long term by searching out undervalued listed and unlisted investments from around the world. The portfolio ideally will consist of around 100 to 200 stocks that the manager believes to be undervalued by the market. Where undervalued stocks cannot be found, funds may be invested in cash. The manager may short sell shares that are considered to be overvalued. Typically the portfolio will have 50% or more net exposure to stocks.
Fund manager trading ranges (%) at 30 June 2008
Cash 0-20
Int’l Shares 80-100
Int’l Shares 100 Cash 0-10
Int’l Shares 90-100
Cash 0-10
Int’l Shares 90-100
Cash 0-100
Int’l Shares 0-100
*Derivatives maybe be used to increase the effective exposure of the fund to 150% of the fund’s net asset value.
Performance percentage (%)
30/6/08 -12.39
30/6/07 5.10
30/6/06 14.36
30/6/05 -3.46
30/6/04 16.42
Average p.a. 3.43
30/6/08 -21.13
Fund first offered in June 2007, so historical information is not available.
Average p.a. n/a
30/6/08 -10.35
30/6/07 8.12
30/6/06 11.64
30/6/05 -0.73
30/6/04 9.43
Average p.a. 3.29
30/6/08 -21.58
30/6/07 4.92
30/6/06 12.11
30/6/05 0.84
30/6/04 11.77
Average p.a. 0.78
30/6/08 -13.49
30/6/07 5.05
30/6/06 17.48
30/6/05 -0.02
(Fund available from 18/10/04)
Average p.a. 2.26
Investment manager charge 1.22% p.a. at 30/06/2008 0.85% p.a. at 30/06/2008 0.95% p.a. at 30/06/2008# 1.23% p.a. at 30/06/2008# 1.54% p.a. at 30/06/2008#
Asset allocation at 30 June 2008
Cash 2.7%
International Shares 97.3%
International Shares 100.0% Cash 2.8%
International Shares 97.2%
Cash 3.9%
International Shares 96.1%
Cash 16.9%
International Shares 83.1%

46
Self Select options (cont.)
International Shares - Global Options
Ventura International Share Fund (class A units)
International Shares - Global Options
Zurich Global Thematic Share Fund8
Ethical Funds Options
AMP Capital Investors Responsible Investment Leaders International Share Fund Investors 9
Ethical Funds Options
Challenger Wholesale Socially Responsive Share Fund
Investment objective To provide exposure to a diversified portfolio of international shares, and to provide a total return, before costs and tax, higher than the Fund’s benchmark (MSCI World Net Dividends Reinvested Accumulation Index expressed in Australian dollars) over the long term.
To provide investors with long-term capital growth, with the benefits of global diversification. The Fund aims to outperform the MSCI World (ex-Australia) Accumulation Index in $A (net dividends reinvested) over periods of five or more years. The Fund will actively hedge up to 40% of the Fund’s exposure to international currency back to Australian dollars.
To provide high returns over the long-term, while accepting high levels of volatility by investing in shares listed on international stock exchanges around the world. The shares are managed using a Socially Responsible Investment approach.
To outperform the S&P/ASX 300 Accumulation Index over rolling three-year periods.
Fund manager trading ranges (%) at 30 June 2008
Cash 0-3
Int’l Shares 0-100
Int’l Shares 90-100
Cash 0-10
Cash 0-5
Int’l Shares 95-100
Cash 0-20
Aust’n Shares 80-100
Performance percentage (%)
30/6/08 -20.14
30/6/07 5.15
30/6/06 6.10
(Fund available from 12/7/5)
Average p.a. -2.96
30/6/08 -10.45
Fund first offered in June 2007, so historical information is not available.
Average p.a. n/a
30/6/08 -20.22
30/6/07 8.49
30/6/06 15.70
30/6/05 -1.40
30/6/04 10.60
Average p.a. 1.78
30/6/08 -21.48
30/6/07 26.21
30/6/06 14.70
30/6/05 21.54
30/6/04 9.39
Average p.a. 8.61
Investment manager charge 1.31% p.a. at 30/06/2008 0.98% p.a. at 30/06/2008 1.13% p.a. at 30/06/2008 1.15% p.a. at 30/06/2008
Asset allocation at 30 June 2008
Cash 0.1%
International Shares 99.9%
International Shares 100% Australian Shares 1.1%
International Shares 98.9%
Cash 3.3%
Australian Shares 96.7%

47
International Shares - Global Options
Ventura International Share Fund (class A units)
International Shares - Global Options
Zurich Global Thematic Share Fund8
Ethical Funds Options
AMP Capital Investors Responsible Investment Leaders International Share Fund Investors 9
Ethical Funds Options
Challenger Wholesale Socially Responsive Share Fund
Investment objective To provide exposure to a diversified portfolio of international shares, and to provide a total return, before costs and tax, higher than the Fund’s benchmark (MSCI World Net Dividends Reinvested Accumulation Index expressed in Australian dollars) over the long term.
To provide investors with long-term capital growth, with the benefits of global diversification. The Fund aims to outperform the MSCI World (ex-Australia) Accumulation Index in $A (net dividends reinvested) over periods of five or more years. The Fund will actively hedge up to 40% of the Fund’s exposure to international currency back to Australian dollars.
To provide high returns over the long-term, while accepting high levels of volatility by investing in shares listed on international stock exchanges around the world. The shares are managed using a Socially Responsible Investment approach.
To outperform the S&P/ASX 300 Accumulation Index over rolling three-year periods.
Fund manager trading ranges (%) at 30 June 2008
Cash 0-3
Int’l Shares 0-100
Int’l Shares 90-100
Cash 0-10
Cash 0-5
Int’l Shares 95-100
Cash 0-20
Aust’n Shares 80-100
Performance percentage (%)
30/6/08 -20.14
30/6/07 5.15
30/6/06 6.10
(Fund available from 12/7/5)
Average p.a. -2.96
30/6/08 -10.45
Fund first offered in June 2007, so historical information is not available.
Average p.a. n/a
30/6/08 -20.22
30/6/07 8.49
30/6/06 15.70
30/6/05 -1.40
30/6/04 10.60
Average p.a. 1.78
30/6/08 -21.48
30/6/07 26.21
30/6/06 14.70
30/6/05 21.54
30/6/04 9.39
Average p.a. 8.61
Investment manager charge 1.31% p.a. at 30/06/2008 0.98% p.a. at 30/06/2008 1.13% p.a. at 30/06/2008 1.15% p.a. at 30/06/2008
Asset allocation at 30 June 2008
Cash 0.1%
International Shares 99.9%
International Shares 100% Australian Shares 1.1%
International Shares 98.9%
Cash 3.3%
Australian Shares 96.7%

48
Small account balancesMembers may have their account balance transferred to the Norwich Union Capital Guaranteed Fund if their account balances are below $1,000 at the close of business on any 30 June following their first year of membership
Norwich Union Capital Guaranteed Fund10
Investment objective To avoid a decrease in the value of the fund’s assets in both the short and long term; to produce relatively low but steady income flows, and to maintain a high level of liquidity.
Strategy To invest a high proportion of the fund in fixed interest-bearing securities carrying a risk no higher than that associated with government bonds. Smaller amounts are invested in property and shares.
Appropriate investor Member with a low account balance.
Investor time horizon Up to 3 years.
Performance percentage (%) 30/6/08 0.1030/6/07 0.8530/6/06 1.0030/6/05 1.5030/6/04 1.00Average 0.89
Management fee % 5% (maximum) of the value of the fund per annum
Investment manager trading ranges at 30 June 2008
Cash 0-50 Fixed Interest 50-90Property 0-5 Shares 0-12.5
Asset allocations as at 31 May 2008
Cash 15.0%
Australian Fixed Interest 74.8%
Australian Shares 7.6%
Property 2.6%

49
General notes for investment performance options
NOTE: Past Performance should not be taken ■
as an indication of future performance.
Where the 30 June 2007 Investment Manager ■
Charge is shown, the Trustee believes this is a good estimate of the 30 June 2008 Investment Manager Charge.
Performance figures represent the investment ■
performance of the underlying assets of an investment option after the deduction of investment managers’ charges, the Plan’s maximum annual management fees and 15% tax on earnings.
The “Average p.a.” performance figure shown ■
for an option is the compound average value of the yearly performance figures, over the period for which yearly figures are shown.
A buy/sell margin applies to funds marked ■
“#”. The margin is not included in the quoted investment manager charge or charged separately, but is reflected in the Plan unit price and performance.
The investment objectives, trading ranges ■
(guideline only), investment manager charge and asset allocation for the Self Select investment options have been provided by the investment managers at the Trustee’s request. The fund’s investments may differ from the target asset allocations identified at any time. However, the funds will be rebalanced to the target asset allocation on a regular basis. The investment managers have consented to the information quoted in this Annual Report.
Specific notes for investment performance options (see specific footnote numbers in the relevant investment options)
1. Convertible notes marked “*” will be classified as growth or cash and fixed income depending on the characteristics of the individual asset. FRN’s = Floating Rate Notes, Infra Sh = Infrastructure Shares, Con Notes = Convertible Notes.
2. A performance fee equal to 20% of performance is payable if the Trust’s performance exceeds its performance hurdle defined as the benchmark plus 5%. The unit price is calculated and issued net of this fee. Any under performance must be recouped before the fee accrues. Any under performance against the performance hurdle at the end of the year will not be carried forward to the next.
3. This option was closed to new members and additional investment from 31 May 2004.
4. Formerly known as HSBC Property Securities Wholesale Fund.
5. Formerly known as Merrill Lynch Wholesale Imputation Fund.
6. This option was closed to new members and additional investment from 15 December 2003.
7. This option was closed to new members from 30 September 2002.
8. This option is closed to new members and addition investments from introduction on 11 June 2007 for transfer amounts for ex-AMSF members.
9. Formerly known as AMP Henderson Sustainable Future International Share Fund.
10. The trading ranges for the Norwich Union Capital Guaranteed Fund (Member Protected Portfolio) were adjusted in November 2003 to reduce the exposure to equities and property with a corresponding increase to Fixed Interest and Cash.
11. The responsible entity of the Pre Select options (Navigator Australia Limited) is associated with the Trustee and will receive ongoing fees from investments in these options. One of the fund managers of the Pre Select options, Portfolio Partners Limited (ABN 85 066 081 114, AFSL Number 234483), is also associated with the Trustee and will receive fees in connection with the management services they provide. Portfolio Partners Limited will also receive fees for providing administrative services to the responsible entity (but these fees will be paid out of the responsible entity’s fees, and are not addition fees payable by members.)

50
Section seven
Contributions
The Plan accepts both regular and one off contributions.
The Plan accepts:
employer Superannuation Guarantee (‘SG’) ■
and Award contributions. Superannuation law requires your employer to contribute at least 9% of your salary to your super up to age 70. SG obligations cease at age 70 but Award requirements may continue to apply.
additional employer contributions (above SG ■
and Award) including regular salary sacrifice contributions.
your personal contributions. This is in addition to ■
your employer’s contributions
rollovers or transfers from other funds including ■
family law payments splits
spouse contributions ■
contribution splitting payments ■
SG vouchers for superannuation shortfalls ■
(Please note: SG vouchers have been phased out but the Trustee will continue to accept these for our members)
superannuation co-contributions. ■
You need to provide the Australian Business Number (‘ABN’) of any superannuation fund to which you are rolling over benefits. Super Solutions is part of the Norwich Union Superannuation Trust (NUST). The ABN for the NUST is 31 919 182 354.
Eligibility
Under age 65
Superannuation contributions can be accepted ■
for members aged under 65. There are no restrictions.
Age 65 up to age 70
The following contributions can be accepted:
Mandated employer contributions, these are ■
made in satisfaction of the Superannuation Guarantee contributions and contributions made under an agreement certified, or an award made, by an industrial authority.
Personal contributions, spouse contributions, ■
salary sacrifice contributions and voluntary employer contributions where you have worked at least 40 hours in any 30 consecutive day period in a financial year. Once this condition is met, contributions can be made for the rest of the year.
Age 70 up to age 75:
The following contributions can be accepted:
Employer contributions made under an ■
agreement certified, or an award made, by an industrial authority.
Personal contributions, salary sacrifice ■
contributions and voluntary employer contributions where you have worked at least

51
40 hours in any 30 consecutive day period in a financial year. Once this condition is met, contributions can be made for the rest of the year.
Spouse contributions cannot be made in this age category.
Age 75 and over:
Once you have reached age 75, contributions can only be accepted where they are made by, or on behalf of, your employer and are required under an agreement certified or an award made by, an industrial authority.
If you do not meet the eligibility requirements for employer contributions described in the section above, any contributions made for you by your employer are required to be returned to your employer. Special regulations apply to determine the amount to be returned and the timing of such payments.
Important note:These conditions are important. If you no longer satisfy them, the Trustee can no longer accept your contributions. So, if your circumstances do change, you should notify Navigator Super Solutions on 1800 814 899.
Limits on contributionsFrom 1 July 2007 the Government has imposed caps on the amount of contributions you can make to superannuation in a financial year without incurring additional tax. The applicable limit depends on the type of contribution.
Concessional contributions
Concessional contributions generally include any contribution made by or on behalf of you that is included in the assessable income of the Plan and is taxed at 15%. This includes all:
contributions made on your behalf by your ■
employer (including salary sacrifice contributions)
personal contributions for which a deduction is ■
claimed (you may be able to do this if you leave your employer)
contributions made for you by a third party, ■
other than your spouse
any amount of a transfer from an overseas fund ■
that you elect to be taxed in the Plan (does not count towards the concessional contributions cap)
Concessional contributions are capped at $50,000 per financial year. This limit will be indexed to AWOTE (Average Weekly Ordinary Time Earnings) each year. However, the indexed amount will be rounded down to the nearest multiple of $5,000.
Transitional provisions apply allowing anyone currently aged 50 and over to be eligible for a $100,000 transitional cap until the financial year commencing 1 July 2012. If you turn 50 before 1 July 2012 you will be able to use this transitional cap from the financial year you turn 50. The transitional cap is not indexed.
If the total of concessional contributions in a financial year made by you or for you, to all your superannuation products, is in excess of the cap for these contributions, the excess concessional contributions are exposed to additional tax at 31.5%. You will receive an assessment specifically for this tax from the ATO, together with details of your options for paying it (see below under “Release Authorities” for further details).
Non-concessional contributions
Non-concessional contributions generally include any contribution made by you or on your behalf that is not included in the assessable income of the Plan. This includes:
personal contributions for which a deduction is ■
not claimed
spouse contributions ■
superannuation co-contributions (not counted ■
towards the non-concessional contribution cap)
any amount of a transfer from an overseas ■
fund that you do not elect to be taxed in the Plan (does count towards the non-concessional contributions cap)
Non-concessional contributions are capped at three times the current concessional contributions cap, that is, $150,000 for the 2007/08 financial year. Excess concessional contributions are included in the non-concessional contribution cap.

52
If the total of non-concessional contributions in a financial year made by you, for all your superannuation products, is in excess of the cap for these contributions, the excess non-concessional contributions are exposed to tax at 46.5%. You will receive an assessment specifically for this tax from the ATO, together with details of how you must pay it (see below under “Release Authorities” for further details).
If you are under age 65 at the start of a financial year, you can bring forward two years of non-concessional contributions cap so that the maximum non-concessional contributions you can make to all your superannuation in that financial year without incurring the tax described above is three times the current cap applying in that year – that is $450,000 for the 2007/08 financial year. Once you contribute more than the cap in a financial year, that sets your cap limit for 3 years. Example – if you contribute $160,000 in 2007-08, you have a total of ($450,000 - $160,000 =) $290,000 left that you can contribute over 2008-09 and 2009-10 without the contributions incurring tax as described above.
People age 65 or over at the start of a financial year will not be able to bring forward contributions and will be limited to the current year’s non-concessional contributions cap.
The Plan cannot accept single non-concessional contribution payments in excess of three times the current non-concessional cap (or the cap for members 65 or over at the start of the financial year). Any amount of a contribution made in excess of this limit will be returned to you.
Release Authorities
If the contributions caps are exceeded, the ATO will assess you personally for the tax owed (i.e. 31.5% for any excess concessional contributions and 46.5% for any excess non-concessional contributions). The ATO will issue you with a Release Authority allowing you to make a special withdrawal from the Plan to pay this tax. In the case of excess concessional contributions you have a choice – you can present the Release Authority to the Plan or you can pay the tax from your non-super money. However in the case of excess non-concessional contributions, you must present
this Release Authority to the Plan within 21 days in order to make a special withdrawal to pay this tax or to have the Trustee pay the tax from your super account on your behalf.
Superannuation co-contributionsIf you earn less than $60,342* a year and make personal contributions to your super from your after-tax pay, the Government will help boost your account with a co-contribution of up to $1,500 per year.
If you are self-employed you may now also be eligible for the co-contribution if you make personal contributions for which you do not claim a deduction.
For every dollar of eligible personal contributions you make to your super account, the Government will match it with $1.50, up to $1,500 per year if you earn $30,342* per year or less. The maximum co-contribution reduces by five cents per dollar of income over $30,342* and phases out altogether when your income reaches $60,342*.
Please note that if we do not have your TFN then we are obliged to return any non-concessional contributions to you and the superannuation co-contribution will not apply.
* These thresholds apply to the 2008/2009 financial year.
Contribution splittingMembers of some superannuation funds are able to transfer amounts of certain superannuation contributions made for them to their spouse’s superannuation by contribution splitting.
The Trustee will accept a contribution split from your spouse into this account and you are able to make a contribution split from this account to your spouse.
When can I apply?
Contributions made during the financial year can be split in the next financial year.
Special provisions apply when you want to start a pension or take all your benefit as a lump sum benefit, or rollover all your benefit to another superannuation arrangement. This means you will not still be a member of the plan after the next 30

53
June so you can apply for a contribution split to be done of current financial year’s contributions before your account is closed.
When can I split to my spouse?
You can split contributions to your spouse if you made contributions in a previous financial year and your spouse is an eligible spouse.
Eligible spouse includes de facto spouses but does not include same sex partners. Your spouse is an eligible spouse if at the time of your application to split they are:
under preservation age (currently 55), or ■
preservation age or older and not yet retired, but ■
under age 65.
If your spouse is age 65 or older you cannot make a contribution split to their superannuation. If you are age 65 or older, you can still make a contribution split to your spouse as long as they meet one of the above eligible spouse conditions.
What contributions can be split?
Members are no longer able to split untaxed contributions made on or after 5 April 2007 (other than untaxed employer contributions). The maximum amounts of contributions that can be split for any financial year are:
Taxed splittable contributions - up to a maximum of 85% of concessional contributions (including employer contributions, and personal contributions for which you have claimed a tax deduction)
Other maximums apply to the amount that can be split, depending on individual account balances and potential tax component values.
Where can I get more information?
You can contact your adviser, our Client Service Team or visit our website avivagroup.com.au.
Choice of superannuation fund for employer contributionsSince 1 July 2005 many employees are able to choose what superannuation fund their employer “superannuation guarantee” contributions are made to. Eligible employees are able to make a choice once a year.
Employers must offer choice of fund to all new eligible employees within 28 days of commencement of employment.
Contributions via BPAY®
Members are able to make personal after tax contributions to their superannuation fund via BPAY®. Please contact us if you did not receive a BPAY® reference number and Biller Code in your welcome letter when you joined and you wish to use this facility. Please note that BPAY® contributions cannot be made from credit cards.
® Registered to BPAY Pty Ltd ABN 69 079 137 518

54
Section eight
Insurance
Many people consider their greatest asset to be their home, contents or car. The reality is that these assets wouldn’t exist if you didn’t have a consistent, reliable income. Your ability to earn income is perhaps your greatest asset. Just like your house, contents and car, you should consider insuring this asset against the event of injury, sickness or death.
There are many benefits to arranging your insurance through your superannuation rather than buying it separately as a retail customer.
The rates are generally cheaper ■
The premiums are tax-free for you if your ■
employer is making contributions into your super
Hassle-free because the cost comes out of ■
your super
No need for medical evidence if Automatic ■
Acceptance Limits apply to you.
Click…On avivagroup.com.au to estimate how much insurance you need with our Insurance Needs Calculator.
While you’re there you can also find details of your current insurance cover by logging in to avivagroup.com.au with your ID and password. (These were sent to you with your welcome letter, but if you don’t have these handy, feel free to give us a call on 1800 814 899 and we can give you the details.)
Types of insurance cover availableBelow is a quick overview of the types of cover Navigator Business Super offers. See the Product Disclosure Statement (PDS) you received with your Welcome Kit for more details (such as the definitions for payment of disability insurance covers).
You can obtain a copy of the current PDS by calling our Client Services team on 1800 814 899, or by visiting avivagroup.com.au.
Death: insurance to add to benefit payment made to your beneficiaries or legal personal representative (your estate) in the event of your death.
If you are diagnosed by appropriate registered Medical Practitioners as being terminally ill, any proceeds of this insurance will be paid into your superannuation account and a benefit paid to you, subject to meeting a condition of release. (Regulatory conditions of release for benefits now include a specific terminal medical condition provision – see page 59.)
Total and Permanent Disablement (“TPD”): insurance to add to the benefit paid to you in the event of your total and permanent disablement due to illness, accident or injury.
Income Protection: (also called salary continuance cover) This insurance can provide regular monthly payments of up to 75% of your pre-disability income, plus an optional addition, payable to your super account, of up to 10% of your pre-disability income, in the event of you becoming totally or

55
partially disabled as a result of sickness or injury. So even during periods when you are unable to work, with the addition 10% option your super will still be added to with these payments from your insurance benefit.
Your employer may have already nominated cover for you which you are able to change to suit your needs – see your Annual Statement for details of your current cover. If you would like additional cover, you can apply for any of the following combinations:
Death Only ■
TPD only ■
Death & Income Protection ■
Death & TPD ■
TPD & Income Protection ■
Death, TPD & Income Protection ■
Income Protection ■
If you would like to apply to increase your cover, talk to your Plan’s financial adviser or complete the ‘Application for insurance cover’ form which can be obtained from avivagroup.com.au or by calling our Client Service Team.
How much does it cost?Your Annual Statement and our website provide information about the premiums that apply. Depending on the terms for your plan, premiums may be based on age, gender, smoking status and occupation or some aggregation of these rating factors.
From time to time, overall premium rates may change but you will always be advised of any change before it takes effect. Premiums are recalculated with effect from 1 July each year, and are shown on your Annual Statement.
Continuation of insurance
To the Navigator Business Super Personal Option
If you are a Business Super member and you leave your employment with your current employer, you (and your spouse if applicable) are automatically transferred to the Navigator Business Super Personal
Option. The great news is that you can continue to maintain your insurance cover provided you:
are under 65 years of age ■
did not leave employment as a result of TPD ■
submit an occupational questionnaire about ■
your new employment, and
for ‘standard’ TPD* or Income Protection cover ■
you are permanently and gainfully employed for at least 15 hours per week.
* otherwise a modified definition of TPD will apply
Your insurance premiums will change to those currently charged in our Navigator Business Super Personal Option. Details of the most current premiums for the Navigator Personal Option can be obtained by logging into our website avivagroup.com.au or by calling our Client Service Team on 1800 814 899.
On transfer you will be required to complete an occupational questionnaire which relates to your new employment. It is your responsibility to inform the Administrator of the details of your new occupation. If this is not done and a claim is lodged and your occupation is found to be one that is normally declined for cover, or one that should have been rated as a riskier occupational category, benefits will be denied or reduced.
From the Navigator Business Super Personal Option
NULAL and American International Group (Australia) Ltd (‘AIG Life’) ABN 79 004 837 861 provided insurance benefits for the Navigator Business Super and Personal Option until 31 December 2006.
From 1 January 2007, the provider of Death, TPD and Income Protection insurance for Navigator Super Solutions Employer Service and Personal Option (Business Super) changed from AIG Life to Norwich Union Life Assurance Limited (NULAL).
If you are a member of the Navigator Business Super Personal Option and have death cover with NULAL, then a continuation option (for Death benefits only) is available from NULAL if you apply within 30 days of ceasing to be a member of the Navigator Super Solutions Personal Option, provided that you are under the age of sixty years and ceased

56
to be a member other than as a result of Total and Permanent Disablement.
In these circumstances, you will not be required to provide any further evidence of insurability except for evidence of health regarding AIDS as required by NULAL. Where premiums or cover amount may be reduced depending on your smoking habits, a declaration by you will be required by NULAL.
During the thirty day option period your existing death cover will continue free of charge notwithstanding that you are no longer a member. If you are a member of the Navigator Super Solutions Personal Option and insured with NULAL, you are age 65 or older and have terminated Death cover under this policy due to the payment of a retirement benefit from the Plan, you may exercise an option to continue the same death cover with an insurance policy issued by NULAL. You should contact NULAL within three months of leaving the Plan.
Any individual policy issued to you will be subject to the terms and conditions available from NULAL at the time you leave the Plan. Your insurance cover under the Plan will cease from the date that NULAL processes your withdrawal benefit. This option does not apply if you selected cover on the basis of the dollar per week option or under any other circumstances.
Want to know more?For more information regarding the insurance options available to you, please speak to your Financial Planner, log onto our website avivagroup.com.au or call our Client Service Team on 1800 814 899.

57
Section nine
Payment of benefits
Preservation rulesYour Member’s Benefit Statement sets out the portions of your account balance which are preserved, restricted non-preserved and unrestricted non-preserved benefits. To access these parts of your account balance, the following rules apply:
Preserved benefits
Preserved benefits may only be cashed after satisfying particular conditions of release. The conditions of release which are most relevant to the Plan include:
retire permanently on or after preservation age ■
(age 55 to 60 depending on your date of birth)
commence a Transition to Retirement pension ■
(including an account based pension) on or after your preservation age (even if still working) – for pension payments only until you meet another condition of release
turn 65 ■
leave your current employer after the age of 60 ■
become totally and permanently disabled ■
are off work temporarily because of total ■
disability
die ■
are diagnosed with a terminal medical condition ■
meet the severe financial hardship conditions or ■
qualify under compassionate grounds
leave Australia, if you are a temporary resident ■
departing Australia permanently and you have entered Australia on an eligible temporary residents visa – does not apply to Australian and New Zealand citizens.
receive a release authority from the ATO for ■
payment of excess contribution tax.
Retirement benefits are normally paid as a lump sum. However, you can choose to roll over your entitlement into a retirement income stream or into another superannuation product.
Restricted non-preserved benefits
Access to restricted non-preserved benefits in cash is subject to satisfying a condition of release as detailed above or the termination of gainful employment with an employer who had at any time made contributions in respect of the restricted non-preserved monies.
Unrestricted non-preserved benefits
Your unrestricted non-preserved monies may be cashed at any time without having to satisfy a condition of release.
BenefitsIf you are a Navigator Super Solutions Employer Service member and you leave employment with your employer before retirement age your benefit entitlement will be the accumulated value in your account, less any fees and taxes. Once you leave your employment, your benefits will be

58
automatically transferred to the Navigator Super Solutions Personal Option. On transfer your existing investment selection will be carried across to the Navigator Super Solutions Personal Option. Any group discounts or rebates that you may have enjoyed (i.e. insurance premiums or management fees) as a member of the Plan will not be carried across, and insurance premiums and annual management fees will be calculated on individual rates rather than employer rates. Your insurance benefits may also be transferred provided that various conditions are met.
Your benefits can then stay in the Navigator Super Solutions Personal Option until you retire. If you are starting work with a new employer, you and your new employer can make further contributions to the Navigator Super Solutions Personal Option. You can also choose to roll over or transfer your benefits from the Navigator Super Solutions Personal Option at any time.
Benefits on permanent disablement are normally paid as a lump sum. However the benefits can be paid as an account based pension on request. Income protection benefits are always paid as an income stream.
You can arrange for insurance to provide for additional benefits on death, total and permanent disability, or temporary disability (‘income protection’). Please speak to your financial adviser to ensure that you have appropriate disability cover in place.
Death benefit
If a member dies while still a member of the Plan, the benefit payable will be their accumulated account balance, plus any insurance benefit, less the withdrawal fee. Lump sum tax may apply for some beneficiaries.
Taxation legislation provides for an automatic “anti-detriment” addition to death benefits paid to eligible dependants of a deceased member, to adjust the impact of tax on contributions. The amount and applicability of this addition varies from member to member.
The Trustee may pay a death benefit to a spouse (including a de facto spouse), child, a person with
whom you have an “interdependency relationship” (detailed below), financial dependant (which can include a former spouse) and/or a legal personal representative (that is, the person responsible for administering the estate).
Two persons have an interdependency relationship if:
a) they have a close personal relationship; and
b) they live together; and
c) one or each of them provides the other with financial support; and
d) one or each of them provides the other with domestic support and personal care.
(If they have a close personal relationship but either or both of them suffer from a physical, intellectual or psychiatric disability such that the disability is the reason that they cannot satisfy the other requirements above, they still have an interdependency relationship).
If you wish to nominate a person with whom you have an interdependency relationship as a beneficiary please contact your financial adviser or call Navigator Super Solutions Client Services Team on 1800 814 899 (toll free).
The payment of superannuation benefits is subject to superannuation law and the terms of the trust under which the benefits are held.
Normally the Trustee has sole discretion as to the payment of a death benefit and will make a decision after looking at individual circumstances. You can indicate to the Trustee how you would like the death benefit paid simply by completing a Death Benefit Nomination form or by contacting our Client Services Team. The Trustee may take these wishes into account when exercising its discretion, but is not bound to do so.
If you do not want the Trustee to have discretion as to who receives your death benefit you can make a binding nomination. A binding nomination determines in advance how benefits will be paid in the event of death. It will only be effective if the form has been completed according to its special requirements. If you do not choose to make a binding nomination then the payment of benefits will be at the Trustee’s discretion as outlined above.

59
Whether a binding nomination is appropriate depends on individual circumstances, and you should seek professional advice. Under a valid binding nomination, the Trustee must pay the persons nominated, provided they are still eligible to receive the benefits. For the death benefit to be distributed as part of the estate according to your will, then your legal personal representative must be nominated. The exercise of a binding nomination gives more certainty and control over how death benefits are paid. However, where a family situation is complex or changing, you may wish to leave it to the Trustee to determine how the benefit will be paid according to the circumstances at the time of death.
A binding nomination will, by law, expire after three years. You are notified of nominated beneficiaries in your annual statement, which will give you a chance to renew, revoke or amend nominations.
Please note that the Family Law splitting of superannuation benefits between spouses on separation and/or divorce may override the terms of a binding death benefit nomination.
Binding Nomination forms are available from our Client Services Team. When completing the form, you will need to ensure that:
it is signed and dated by two witnesses over ■
the age of 18 years who are present at the time the form is signed by you and who are not nominated beneficiaries
the people nominated to be paid the death ■
benefit fall within the description of those people to whom the Trustee can pay death benefits, as outlined above
if benefits are to go to more than one person, ■
the proportions specified add up to 100%.
Terminal Medical Condition
A new condition of release, Terminal Medical Condition, commenced on 16 February 2008 which allows terminally ill people to access their superannuation tax free. To meet this condition of release, members must satisfy the following;
two registered medical practitioners have ■
certified that the person suffers from an illness or has incurred an injury that is likely to result in death within a period (the certification period) no greater than 12 months;
at least one of the registered medical ■
practitioners must be a specialist practising in the area related to the illness or injury suffered by the person; and
for each of these certifications, the certification ■
period has not ended.
Once these conditions are met, the member’s entire superannuation benefit becomes unrestricted non-preserved and can be withdrawn tax-free at any time. This also applies to any contributions received for the member during the certification period.
These doctors’ certificates are also the requirement for no PAYG withholding amount to be deducted from benefit payments to members under age 60.
If a member has not satisfied these requirements at the time of payment, normal superannuation lump sum tax will apply (see page 65). However, if the member subsequently satisfies the definition within 90 days of the payment, the fund will pay the amount withheld for tax to the member.
These changes have now been backdated to 1 July 2007 and under transitional arrangements, members had until 30 June 2008 to meet the requirements in order to have PAYG withheld from benefits already paid refunded.
If you would like further information please call our Client Services team, or alternatively go to the ATO’s website www.ato.gov.au.
Small account balances
Members whose account balances are below $1,000 at the close of business on any 30 June following the first year of membership will be member protected. This means that the amount of charges that can be deducted from your benefits is limited to the amount of investment earnings.
These members may have their account transferred to the Norwich Union Capital Guaranteed Fund (for more information see page 48).

60
Section ten
Fees and charges
Plan fees and charges debited to members’ accountsThe following section summarises the fees and charges as at 1 July 2008. Each member’s certificate of membership outlines the fees and charges that specifically apply to their Plan.
Fees applicable to members who joined an Employer Plan, where that Employer Plan commenced on or after 1 March 2008*
Type Amount
Member fee Up to $3 per week deducted from your account balance. For members of the Personal Option it is up to $5 per week.
Adviser Services fee Up to 0.75% built into the investment option unit price.The Adviser Services fee is calculated daily and deducted before the unit prices are determined (based on total plan assets).See page 63 for details on increases or alterations in the charges.
Fees applicable to members who joined an Employer Plan, where that Employer Plan commenced prior to 1 March 2008*
Type Amount
Transfer/Rollover fee Up to 4% of amount transferred or rolled over ($0 to $40 per $1,000) into the Plan from another fund may be charged.
Contribution fee Up to 5% of contribution is charged on processing contributions to a member’s account, ($0 to $50 per $1,000 contribution).
Annual management fee
Up to 1.80% built into the investment option unit price.
Average daily Plan balance per month fee Annual management fee
First $150,000 Up to 1.80%pa
Next $150,000 Up to 1.60%pa
Next $200,000 Up to 1.40%pa
Over $500,000 Up to 1.20%pa
See page 62 for details on increases or alterations in the charges.The Annual management fee is calculated daily and deducted before the unit prices are determined (based on total plan assets).
Member fee Up to $5.92 per month deducted from account your balance. For members that have a member fee of $5.92 this fee will be waived when their account balance exceeds $30,000. Members who have a different member fee will need to refer to their membership certificate for any waiver that may apply to their account.

61
Fees applicable all members
Type Amount
Contribution transaction fee
$3.29 per transaction. Fee waived in the Navigator Business Super if your employer submits contributions using Aviva web-site, E-SuperLink or Superpay.
Termination fee Up to $77.18 will apply each time a benefit is wholly paid from a member’s account (i.e. rollover to non Navigator product or cash payment).
Switching charges Currently no charge is applied other than the early withdrawal fee that applies to investments in the Norwich Union Capital Guaranteed Fund. There is a provision for a charge of up to 1% to be charged on all switched amounts.
Adviser review fee Optional fee for additional advice agreed with the Plan’s Financial Adviser in relation to investment strategies, nomination of beneficiaries, increase in insurance benefits under the Plan and regulatory impacts on features of the Plan. This fee is restricted to not more than 10% p.a. of a member’s account balance with a maximum of $2,750 p.a.
Insurance premiums Insurance premiums are payable if a member has death, TPD or income protection (‘IP’) cover through the Plan.
* For members in the Navigator Business Super Personal Option the fees applicable are determined by the employer plan you joined the fund through prior to transferring to the Personal Option. If you joined the Personal Option directly then the fees applicable to employer plans that commenced prior to 1 March 2008 will apply to your account.
Note: For members who are invested in the Norwich Union Capital Guaranteed Fund refer to the page 48 for the fees that apply.
Underlying fund manager charges
The aforementioned annual management & adviser services fees do not include the investment manager charges.
The investment manager charges are levied by each investment manager in respect of the underlying funds, and are applied before the unit prices for the investment options are calculated for the Plan. Charges currently range from 0.29% pa to 1.54% pa.
The Plan does not charge a buy/sell margin but takes investment managers’ buy/sell margins into account, where applicable, when calculating unit prices for the investment options in the Plan.
Refer to pages 19 to 48 to see investment manager charges and which investment managers apply buy/sell margins. Note that where the selected investment option is invested in a fund managed by a member of the Aviva Australia group, associates of the Trustee receive an income derived from the investment manager charge.
How are your fees calculated?
The Norwich Union Capital Guaranteed Fund annual management fee is deducted prior to the
rate being declared. For all other investments the gross annual management fee is deducted daily at the base rate of 1.80% pa before the unit price is determined.
For members who joined the fund with an Employer plan that commenced from 1 March 2008, will receive a rebate 1.05% pa to your account at the end of each month. Further rebates may be applicable of up to 0.75% depending on the level of the Adviser Service fee.
Where a member who joined the fund with an Employer plan that commenced prior to 1 March 2008 and is entitled to a reduction in the level of management fee because the plan investment balance exceeds $150,000 a rebate of excess fees will be credited to your account at the end of each month.
Rebates will be credited in the same proportion as the investment balances held, and will be based on the average daily plan balance during the month of calculation.
Rebates are also generated where the levels of annual management fee for your particular plan are less than those shown above.
62
Other Management Costs and Total fees you paid
‘Other management costs’ is your estimated share of ‘common fund’ costs. These are the ongoing costs, fees and expenses that are deducted from your investments by either the Trustee or investment managers before the unit prices for your investments (or declared earning rate for a few investment options) are set.
‘Total fees you paid’ then adds together the costs charged to your account by transactions shown on your Statement, less any rebates shown, plus the amount of Other Management Costs – to give you a picture of the total costs and charges for your investment.
A snapshot of the total of all the direct and indirect fees you have paid in the year is shown in your annual statement as ‘Total fees you paid’.
The direct charges to your account described on page 61, and any rebates, to your account as described above in ’How are your fees calculated?’ are shown as transactions in your annual statements.
We also show an estimate* of the ”before unit price” annual management fee and underlying fund manager costs for your account in your annual statement, as ‘Other management costs’.
* This has been calculated following guidelines contained in relevant regulations.
Legislation for how these items were to be arrived at means that they will be estimated on a comparable basis by all investment managers and superannuation funds.
You will also see details of any contributions received during the year, helping you to confirm them.
Insurance charges
Insurance cover is funded by the payment of regular insurance premiums that are deducted from your account.
You can find the cost of cover on the certificate of membership and on your annual statement.
Naturally, uninterrupted cover depends on timely payment of premiums. If the amount in an account is insufficient to meet the payment of the premium then the member and their employer will be advised that the member’s insurance cover will cease unless
contributions sufficient to cover the premium are made so that the premium can be paid.
Premium rates may alter over time and members will be advised of any change taking effect.
Members whose cover is inclusive of account balance will have the level of cover and premium re-calculated each 1 July.
Increases or alterations in the charges
The Administrator will increase fees and thresholds in line with the Consumer Price Index (‘CPI’) or Average Weekly Earnings (‘AWE’)* on 1 July each year (unless the Trustee and Administrator agree not to proceed with the full increases or agree to postpone part of all of the increase). The fees shown on page 60 are effective from 1 July 2008.
The Administrator may increase the management fees in line with increases in its expenses, but any increases will be limited to a maximum of an additional 0.5% pa. The Administrator has no present intention to increase the fees.
Further information
The amounts deducted as indicated above before unit prices are determined or interest rates declared, for your annual management fee and investment management charges, are deducted on an indirect, ‘common fund’ basis and affect your investment returns.
Tax deduction for fees
All fees (except the Investment manager charges shown on pages 19 – 48) are paid from the investment-only life policy for the Plan. The Administrator benefits from tax deductions arising from these fees, and has set the levels of fees disclosed taking this benefit into account. There is no further benefit to members for the deductions.
Investment manager charges are paid from the underlying funds. The treatment of benefits arising from tax deductibility of these charges is determined by each investment manager and may vary between investment options.
Further information about these deductions, or other charges, can be obtained by contacting our Client Service team.

63
Section eleven
Taxation
Taxation limits and thresholds for your superannuationYour disclosure documents set out the tax treatment of your superannuation contributions and benefits. Some of these thresholds referred to in these documents are indexed annually. Below are the thresholds for the 2007/2008 and 2008/2009 years.
Important superannuation values 2007/2008 2008/2009
Concessional contributions cap
Up to 49 years $50,000 $50,000
Age 50 years or more $100,000 $100,000
Non-concessional contributions cap $150,000 $150,000
Tax free portion after preservation age of taxable component
Upper limit $140,000 $145,000
Superannuation Guarantee
Minimum contribution percentage 9% 9%
Maximum contribution base (quarterly limit) $36,470 $38,180
Tax deductions for contributions (2007/2008 financial year)From 1 July 2007 new legislation changes altered the deduction limits that can be made for superannuation contributions.
Employers are able to claim full deductions for all contributions made for an employee from 1 July 2007, until that employee reaches age 75.
Members who are eligible to claim personal contributions are able to claim full tax deductions for these contributions.
After the end of the financial year the Administrator sends a form (called an s290-170) to Navigator Super Solutions members who have only made
personal contributions to their Plan during the year. On that form they can indicate if they intend to claim a tax deduction for their personal contributions. The Trustee will then acknowledge the receipt of this Notice in writing, in order for the member to be able to claim a tax deduction.
Tax on contributionsEmployer contributions, taxable rollovers and deductible personal contributions made to superannuation funds are taxed at 15%.
Please note that you may be personally liable for excess contributions tax if your contribution caps are exceeded. (See page 51)

64
Taxation of superannuation lump sum benefit paymentsFrom 1 July 2007 any withdrawal from the Plan of a lump sum payment is a superannuation lump sum benefit, a component of which can form part of your assessable income (and may be subject to concessional tax treatment), unless rolled over to another complying superannuation fund or approved deposit fund. The Trustee may be required to make a PAYG withholding deduction from your superannuation lump sum benefit. The tax treatment of the components of a lump sum benefit are detailed in the above table. We will provide you with a superannuation lump sum benefit Payment Summary (2 copies) for the amount of the superannuation lump sum benefits paid, which contains details of any PAYG deducted and an assessable amount which need to be transferred into your next tax return.
Since 1 July 2007, the tax free component of each lump sum payment will be the same proportion that the whole of your total tax free component bears to your total account value.
Tax on death benefitsDeath benefits are tax free when paid to a death benefits dependant, which can be a spouse (including a de facto spouse), a former spouse where financially dependent, a child aged less than 18, a person with whom you have an interdependency relationship or a financial dependant. Adult children are not death benefit dependants for tax purposes unless they were financially dependent on, or in an interdependency relationship with the deceased member. Death benefits paid to an estate are also tax free provided they are distributed to one or more death benefit dependants.
Where the benefit is paid directly to a person who is not a death benefits dependant, it is taxed as a superannuation lump sum benefit received by them and PAYG withholding amounts are deducted. Any tax free component amount of the deceased member’s account is tax free to these beneficiaries in proportion to the amount of their benefits to the whole account. The balance is their taxable component and is taxed at not more than 15%, unless there is insurance included in the benefit, when there can be an amount taxed at not more than 30%. The Medicare levy also applies.
PAYG withholding instalments are not deducted by the Trustee on death benefits paid to the deceased member’s legal personal representative (their estate). This is the responsibility of the executor or Trustee of the estate.
Death benefits paid as a pension receive concessional tax treatment, but cannot be paid to a non-dependant. Restrictions apply for children.
You may wish to obtain further information and discuss the options for death benefits with your Plan’s financial adviser.
Tax on disablement benefitsPayments made as a result of temporary disablement (income protection) are taxed as normal income.
Payments made as a result of total and permanent disablement may qualify for concessional treatment.
Reasonable Benefit LimitsReasonable Benefit Limits were abolished from 1 July 2007 as part of the Better Super changes.
Age Tax free component Taxable component
Aged 60 and over Not subject to tax(and not assessable income)
Not subject to tax(and not assessable income)
Over preservation age and under age 60
Not subject to tax(and not assessable income)
First $145,000* is tax free and the balance is taxed at not more than 15%
Under preservation age Not subject to tax(and not assessable income)
Taxed at not more than 20%
* applicable for the 2008/2009 financial year and is increased each 1 July in line with AWOTE index rounded down to the nearest multiple of $5,000.
The Medicare levy is also payable on the amount included in your taxable income (1.5% for 2008/2009).

65
Contributions and Tax File Numbers (TFNs)We are required to advise the Australian Tax Office (ATO) of all contributions paid by you or for you.
Your employer is required to give us your TFN if you have quoted it to them for employment purposes after 30 June 2007 if they make a superannuation contribution to us on your behalf.
If you have not provided your TFN (or an employer has not provided your TFN), personal contributions you make are required to be returned to you within 30 days of the Trustee becoming aware that it does not hold a valid TFN for you. Special regulations apply to determine the amount to be returned and the timing of such payments.
If you or an employer has not provided your TFN before the end of the financial year in which an employer contribution is made for you, the Plan is required to pay an additional 31.5% tax on any concessional contribution made for you by your employer, which will be charged to your account (as well as the standard 15% “contributions tax”). If your TFN is supplied in the next 3 financial years, the amount deducted from your account may be claimed back from the ATO, and will then be re-credited to your account. In some cases the amount re-credited will include interest if your employer failed to pass your TFN to the Plan that resulted in you being charged the additional tax. The rate of interest set by legislation is typically a conservative rate of return.
There may be a significant delay before the Trustee recovers the additional tax from the ATO due to the timing of when the Trustee can notify the ATO
that it has received your TFN. After the end of the Plan’s income year, the Trustee must wait until the end of the following income year to inform the ATO that it has received a valid TFN. If you have left the Plan in the mean time, we will not claim a tax refund for you. These rules have been imposed by the Government and the Trustee is unable to speed up the process. In addition, any interest you receive due to the failure of your employer to pass on your TFN to the Trustee in most cases will not match the earning rates of the investments in the Plan.
If you or your employer does not supply your TFN in one of the next 3 financial years after the contribution is received, the Plan will not be able to claim the additional tax back.
Superannuation SurchargeThe surcharge ceased to apply to contributions from 1 July 2005. Surcharge assessments will continue to be received for some time by superannuation funds in respect to contributions made in previous years. For further information please consult your professional adviser.
The information in this publication reflects our understanding of existing legislation, rulings etc as at 1 July 2008. While it is believed the information is accurate and reliable, this is not guaranteed in any way. The information is not, nor is it intended to be, comprehensive or a substitute for advice on specific circumstances.
The information given in this document is of a general nature only and has not taken into account the investment objectives, financial situation or particular needs of any particular person. Before making an investment decision on the basis of the information above, you need to consider, with or without the assistance of a professional adviser whether the advice is appropriate in the light of your investment needs, objectives and financial circumstances.

66
Section twelve
General information
The TrusteeThe Trustee of the Norwich Union Superannuation Trust (the ‘Fund’) is NULIS Nominees (Australia) Limited ABN 80 008 515 633 AFSL number 236465, RSE Licence L0000741, an RSE licensee under the Superannuation Industry (Supervision) Act 1993 (“SIS”). The Norwich Union Superannuation Trust (RSE number R1004083) is a registrable entity registered with APRA, with an appropriate risk management plan in place.
During the year 2007 – 2008, the directors of the Trustee were:
Mr Charles (Sandy) Clark (Chairman)Ms Elizabeth FlynnMr David Trenerry Mr Sean PotterMr Bruce Hawkins, andMs Diana Taylor (from 29/05/2008)
Ms Diana Taylor was the Company Secretary until 29/05/2008.
Ms Anne Wright commenced as the Company Secretary from 29/05/2008.
As at the date of this report there have been no penalties imposed on the Trustee for any breach of the provisions of the Superannuation Industry (Supervision) Act 1993 (“SIS”) during the year 2007/2008.
One of the RSE licence conditions imposed on the Trustee is the requirement to have at least $5 million in net tangible assets, or to have secured a
bank guarantee for that amount. The Trustee has secured such a guarantee from Westpac Banking Corporation. This guarantee is held at the registered office of the Trustee, Level 6, 509 St Kilda Road, Melbourne Victoria 3004.
The Trustee and its Directors are entitled to be reimbursed from the Fund for any costs and expenses incurred in the management and administration of the Fund. They are also entitled to be indemnified from the Fund for all liabilities arising from the management and administration of the Fund except where the Directors have acted fraudulently, dishonestly, through wilful misconduct or have incurred a penalty for a breach under SIS. To help cover these potential liabilities and protect the assets of the Fund, indemnity insurance in excess of $20 million covers the Directors of the Trustee and its associated companies.
Trust Deed amendmentsMembers’ rights are governed by the provisions contained in the Trust Deed dated 16 December 1985 (as amended).
There were no amendments to the Trust Deed in the year 2007/2008. Amendments to the Trust Deed can only be made by the Trustee and must be made in accordance with the requirements of superannuation law.
If you would like to view the Norwich Union Superannuation Trust Deed, please contact Navigator Super Solutions toll free on 1800 814 899.

67
The AdministratorAdministration services are provided to the Plan by Norwich Union Life Australia Limited (“NULAL”).
The InsurerThe provider of Death, TPD and Income Protection insurance for Navigator Super Solutions Employer Service and Personal Option (Business Super) is Norwich Union Life Assurance Limited (NULAL).
Policy committees (Navigator Super Solutions Employer Service only)
Generally, a policy committee’s role is to raise matters relating to the Plan with the Trustee. This includes providing an avenue for members to make enquiries about the investment strategy and performance of the Plan, as well as assisting the Trustee to deal with complaints or enquiries about the Plan’s operation or management.
Information about how to establish a policy committee will be sent to all members of new plans of 50 or more members. For smaller plans (5 to 49 members), the Trustee will help establish a policy committee if at least 5 members request so in writing.
The Trustee will take all reasonable steps to ensure that a policy committee for your Navigator Super Solutions Employer Service is formed to comply with the equal representation rules under SIS.
If there is not currently a policy committee established at your place of employment and you wish to examine the benefits of forming a committee, please contact either your employer or the Trustee.
Keeping in touchIt is very important that you advise the Administrator if you change your personal details. While address details may be changed over the phone, other details such as beneficiary nominations must be changed in writing.
To ensure prompt service, please quote your plan membership number whenever you contact us.
Making enquiries or complaintsWe have set up formal internal procedures for dealing with complaints within 90 days. We may be able to solve the problem over the phone, but if not, we will ask you to put it in writing and send to the address below. Navigator Super Solutions Client Services phone number is 1800 814 899 (toll free).
Complaints OfficerNavigator Super SolutionsGPO Box 2567WMELBOURNE VIC 3001
Superannuation Complaints TribunalIf you are not satisfied with the handling of a complaint or its resolution, or if the Trustee or its delegate have not dealt with your complaint within 90 days, then the Superannuation Complaints Tribunal (“the Tribunal”) may be able to deal with your complaint. The Tribunal is an independent dispute resolution body set up by the Government to assist investors to resolve certain types of superannuation complaints that have not been resolved by the Trustee.
The Tribunal may be able to assist you to resolve a complaint, but only after you have made use of the Trustee’s own enquiries and complaints procedures. Once the Tribunal accepts a complaint it tries to conciliate the dispute by helping an investor and the superannuation trustee reach agreement. Where this is unsuccessful the Tribunal will formally review the matter and make a binding decision.
It is located in Melbourne and its contact details are:
Locked Bag 3060GPO Melbourne Victoria 3001Telephone: 1300 780 808Fax: 03 8635 5588Website: www.sct.gov.au
Information available on requestThe following information is available on request by writing to the Administrator:
the latest annual return, associated certificates ■
and notices

68
the Auditor’s Report and specified extracts from ■
actuarial reports where applicable
the latest set of audited financial statements ■
the relevant Trust Deed provisions ■
the investment strategies available under the ■
Plan
other (including details of benefits or fees and ■
charges)
privacy policy. ■
If you would like any further information about the Plan or your investment or you wish to inspect the Plan’s documents please contact Client Services on 1800 814 899 (toll free).
Lost members
If we are unable to contact you, the Trustee may be required to treat you as a ‘lost’ member and may, in future, elect to transfer your benefit to an Eligible Rollover Fund (“ERF”). Generally, a lost member is one where at least one member communication has been sent by the Trustee to the member’s last known address, and it has been returned unclaimed.
The Norwich Eligible Rollover Fund (“NERF”) is the nominated ERF of NUST. NULIS Nominees (Australia) Limited is the Trustee of the NERF.
The contact details for the NERF are:
The NERF AdministratorNorwich Union Life Australia LimitedGPO Box 2567WMELBOURNE VIC 3001Phone: 1800 814 899 (toll free)
Account balances of members in the NERF are ‘protected’. This means that once money is received by the NERF the account balance will never be less than the original amount transferred, except to pay tax (if any). Investments within the NERF are predominately invested in low risk and low return cash and short term fixed interest. Any insurance cover under your Navigator Super Solutions membership will cease on transfer to the NERF.
Each year the Trustee is required to notify the ATO of the details of those members with whom it has lost contact so that they can be included on the Lost Members’ Register.
If your benefit remains unclaimed by the date you reach age 65, and the Trustee of the Plan is unable to find you to pay you your benefit, it will transfer the benefit to the ATO.
Finding your lost super
If you’re like many other Australians, you may have changed jobs and perhaps moved house once or twice. With these changes, you may not have advised your super fund(s) of your new address or may have lost the details of super accounts you have with previous employers. For these reasons, many Australians have lost track of some of their super and together this equates to millions of dollars.
Navigator performs data matching exercises with the ATO to help track down lost super on behalf of members. To do this we forward your tax file number and other relevant personal information (eg. name and address) to the ATO. This information will only be used for the sole purpose of tracking down any lost super you may have. There is no charge for this service and you will receive notification if we recover money on your behalf.
Please note, searches of the ATO databases are administered according to Navigator’s Privacy Policy which is available from avivagroup.com.au or by contacting us.
If you do not consent to us tracking down your super on your behalf please let us know.
Financial information
The Trustee invests wholly in life policies issued by NULAL, with each investment option being invested with its fund manager(s) through the relevant NULAL policy. For regulatory purposes, the benefits paid to each member are wholly determined by reference to life insurance products.
Regulatory requirements to provide:
fund accounts or abridged financial information ■
and statements of assets, and,
details of investments in excess of 5% of total ■
assets,
do not apply to superannuation funds so structured, and accordingly the Trustee has not provided this information.

The Aviva Guiding Star program provides a way to actively support Australian charities through financial contributions and staff involvement to achieve lasting change and improvement in the community.
Through the Aviva Guiding Star community support program, we launched Camp Quality as our first flagship charity in May 2008. It was decided to target and focus our efforts, so that Aviva’s corporate support – combined with staff contributions – can make a bigger and lasting difference for our community partner.
Camp Quality is committed to bringing hope and happiness to every child living with cancer, their families and communities through ongoing quality recreational, educational, hospital and financial support programs. These programs focus on the power of fun and optimism to help children and their families overcome the challenges that cancer brings.
Aviva
Guiding Star
Aviva
Guiding Star
Aviva
Guiding Star
Aviva
Guiding Star
®
“ Being a socially responsible company is gaining increasing momentum in the Australian corporate landscape, with employees demanding more from a company than just a pay cheque, and business partners expecting commitment to this area. But most importantly, being a good corporate citizen is simply the right thing to do.”
Allan GriffithsAviva Australia Chief Executive Officer
® Camp Quality Laughter is the best medicine is a registered trademark and is used with the permission of Camp Quality Limited ABN 87 052 097 720.
Trustee: NULIS Nominees (Australia) Limited ABN 80 008 515 633 AFSL number 236465
Administrator: Navigator Australia Limited ABN 45 006 302 987 AFSL number 236466
Level 6, 509 St Kilda Road, Melbourne, Victoria 3004.
GPO Box 2567W Melbourne, Victoria 3001.
avivagroup.com.au

Aviva
Guiding Star
Aviva
Guiding Star
Aviva
Guiding Star
Aviva
Guiding Star
®
Proudly supporting
Camp Quality
® Camp Quality Laughter is the best medicine is a registered trademark and is used with the permission of Camp Quality Limited ABN 87 052 097 720.
NV
680B
090
8