Embed Size (px)
Citation preview

ANN model to predict the occupational stress of
Professional Educator’s
Naveen Kumar Pandey, Dr. Pranav Pandya, and Dr. Abhay Saxena
Abstract--Stress is common illnesses which can be easily
discover in every individual of society at present, excessive work
load, changing lifestyle, job insecurity and many glitches lead to
stress and other disorders. Every single field today Academics, IT,
banking are loaded with hampered of work and the employee
working over there suffering from various stress and other healthy
issues. Educators are the backbone of society and they guide the
future of nations but unfortunately these days the academicians of
different strata either from primary or higher education too suffering
from various health problems. Work overload, to manage different
teaching aids, management pressure and job insecurity specifically of
private sector leads them to psychotic and psychological disorder. In
this paper we are going to propose a model to examine and predict
the occupational stress of the professional educators through
Artificial Neural Network Techniques. The purpose of the study is to
find out the various factors of occupational stress and prediction of
stress level of the higher education teachers. Later with the help of
trained Neural network model we are able to predict the occupational
stress of the educators through various algorithm.
Keyword---Artificial Neural Network, Occupational Stress,
Professional Educators
Professional Educators: Educators impart in higher
education (College and University)
I. INTRODUCTION
N this modern era stress is a common ailment found in
every single. The reason for stress could be several and in
diverse fields it has different facets. Whether its Academics,
IT sector and Service sector every single soul is engrossed
with certain nature of mental and physical diseases. In the
field of academics as well the professional educators are also
gripped with certain stress low inner satisfaction regarding
policies and salary, management pressure, workload and
traumatic working environment which leads to psychotic and
physiological disorder. Occupational stress is one of the
foremost health threats of the modern workplace.
Occupational stress and stressful working atmosphere leads to
low productivity and absenteeism.
Naveen Kumar Pandey is Research Scholar, Dept. of Computer Science,
Dev Sanskriti Vishwavidyalaya, Shantikunj, Haridwar, Uttarakhand (M.N.
+918881442246, email- [email protected])
Dr. Pranav Pandya, is Honorable Chancellor, Dev Sanskriti
Vishwavidyalaya, Shantikunj, Haridwar, Uttrakhand, email-
Dr. Abhay Saxena Is Professor and Head in Dept. of Computer Science,
Dev Sanskriti Vishwavidyalaya, Shantikunj, Haridwar, Uttarakhand (M.N.
+919258369624, email- [email protected]
Diseases like OCD (obsessive compulsive disorder),
anxiety, stress and adjustment disorder affect your mind as
well as the entire body. If these ailments one can identify at
the right time then the problem will be cure formerly reaching
to the level of pinnacle. To eradicate this problem one has to
be aware about his/her health so that positive actions will be
taken before situation get more worse and leads to some major
physiological and psychological complaints.
After review of literature it had been found that many
researches have been done on the teacher’s occupational stress
in India but they are only based on statistical analysis and
psychological parameters, i.e. (Naina Sabherwal and Deeya
Ahuja Et.Al., 2015) has tried to find out the occupational
stress among faculty members in higher education institution
and the results showed that the determinants of stress among
the administrators are numerous and varied, with compilation
of results, time pressures, lack of infrastructure, student’s
indiscipline and poor pay prospects as a very high ranked
stressors[11]. (Chaly PE, Anand SPJ, Reddy et. al, 2014)
results showed, Out of 504 software professionals and 504
school teachers, for 23% of software professionals and 85% of
school teachers, stress was Not a Problem in their life. 71%of
software professionals and 15% of school teachers were in
Moderate Stress level [12]. (G. Lokanadha Reddy and R.
Poornima, 2012) the results revealed that majority of the
university teachers are experiencing moderate and high levels
of occupational stress and 86 percent of teachers have
professional burnout[13]. (Pandey, N.P, Saxena, A.,2015)
“teacher’s occupational stress: a review study in national &
international scenario” have conducted the review study and
find out factors of occupational stress[14].
We were not able to find any occupational stress
measurement through ANN technique during review of
literature. In this study we have tried to measure and predict
the Occupational Stress Level of educators by using Artificial
Neural Network techniques so that they can identify and cure
themselves on time before encountering with some major
chronic diseases. We do feel that this model would be
beneficial for the HR managers, Psychologist to keep their
human resources well and shaped.
Occupational stress: (Cincinnati, 1999) had defined
Occupational Stress as the “harmful physical and emotional
responses that occur when the requirements of the job do not
match the capabilities, resources, or needs of the worker”[1] in
another word we can state that Stress related with job or
occupation is called occupational stress. Occupational stress
refers to a condition where occupation associated factors
intermingle with employee to change, disrupts or enhance his
I
International Journal of Computer Science and Electronics Engineering (IJCSEE) Volume 3, Issue 4 (2015) ISSN 2320–4028 (Online)
324
psychological and physiological surroundings such that the
person is forced to deviate from normal functioning. The
person cannot work efficiently due to stress. An employee’s
job role is composed of quality work life and is responsible for
bringing in maximum amount of job satisfaction or minimum
amount of job stress & anxiety. As (P., 2012) finding states
that Occupational stress usually results from conflicting
incompatible or unclear expectation that is derived from work
environment [5]. (Cooper, 1983), has developed a concise yet
complete list of six sources of work stress, Job Conditions -
Quantitative & qualitative work overload, people decisions,
physical danger, and techno stress. Role Stress - Role
ambiguity, sex bias and sex-role stereotypes. Interpersonal
Factors - Poor work and social support systems, lack of
management concern for the worker, political rivalry,
jealousy, or anger. Career Development - Under promotion,
over promotion, job security, frustrated ambitions.
Organizational Structure - Rigid and impersonal structure,
political battles, inadequate supervision or training, non-
participative decision making. Home-work Interface -
Spillover, lack of support from spouse, marital conflict, dual
career stress [2].
Artificial Neural Network: The term neural network was
traditionally used which refers to a network or circuit of
biological neurons. The modern usage of the term often refers
to artificial neural networks, which are composed of artificial
neurons or nodes. Thus the term may refer to either biological
neural networks, made up of real biological neurons, or
artificial neural networks, for solving artificial intelligence
problems (Monterola, 2008)[4]. These artificial networks may
be used for predictive modeling, adaptive control and
applications where they can be trained via a dataset (Saxena
A. B., 2012)[7]. There are numerous fields where ANN
techniques are being applied i.e. medical field, education
sector, entertainment, games, security etc. Psychology is one
of the emerging fields where ANN techniques are being used
to assess human behavior, personality traits prediction and
prediction of stress level, Human capacity assessment through
time series prediction[8] (Saxena, Pandya, & Bhatt, 2012).
Assessment of Human Capacity based on Conjugated Gradient
Techniques using Artificial Neural Network (Saxena &
Pandya, 2013)[9] these researches are the best examples of
that.
II. RESEARCH METHODOLOGY
Input Parameter (Independent Variable): In this research
paper we have selected 12 input parameter which also denoted
as input variable, these parameter are Role Overload, Role
ambiguity, Role Conflict, Unreasonable Group and Political
Pressure, Under participation, Powerlessness, Poor peer
relations intrinsic, Impoverishment, Low status, Strenuous
working conditions, Unprofitability, Personal Problem/ Family
Problem
Output Parameter (Dependent Variable): Level of
Occupational Stress of the employee
Sample size- 50 (DSVV Academic Staff)
Sampling Techniques: Simple Random Sampling
Tools Used: MATLAB: Used to analyze data, develop
algorithms, and create models and applications. OSI:
Occupational Stress Index, Prepared By A.K. Srivastava & Dr.
A.P. Singh, BHU, The scale had 46 items each to be rated on
the five-point scale. Out of 46 items, 28 are “true keyed” and
the balance 18 is “false keyed”.
Artificial Neural Network Modeling Parameter:
Network Type- Feed Forward Backpropagation
Training Function – TRAINLM, TRAINGDM,
TRAINGDA, TRAINSCG, TRAINCGB, TRAINCGP,
TRAINCGF, TRAINGD, TRAINGDX, TRAINBFG
Adaption Learning Function – LEARNGDM
Performance function: MSE “Mean squared error” is a
network performance function. It measures the network's
performance according to the mean of squared errors.,
MSEREG “Mean squared error w/reg performance
function”, is a network performance function. It measures
network performance as the weight sum of two factors: the
mean squared error and the mean squared weight and bias
values.
Number of Layer – 2
Number of Neurons -10
III. RESULT ANALYSIS AND DISCUSSION
Performance Analysis chart of an ANN Models (Based on
MSE “Mean Squire Error”) TABLE I
SHOWS THE VALUE OF MSE OF THE DIFFERENT ANN MODELS
ANN
Model
Training
Function
MSE
value
Best
Validation
At
Epoch
Regression
value
Network 1 TRAINLM 0.0021 0.011784 6 0.99841
Network 2 TRAINGDM 0.0218 0.073831 1000 0.98517
Network 3 TRAINGDA 0.00686 0.0010781 107 0.9957
Network 4 TRAINSCG 0.0103 0.00133 2 0.96308
Network 5 TRAINCGB 0.285 1.6318 54 0.99622
Network 6 TRAINCGP 1.51 7.7242e 46 0.98228
Network 7 TRAINCGF 0.0293 0.0085791 3 0.96886
Network 8 TRAINGD 0.0253 1.5424e 53 0.988806
Network 9 TRAINGDX 0.0632 0.091017 36 0.9464
Network 10 TRAINBFG 0.689 0.025302 6 0.96729
Performance Graph and Regression Plot of the ANN
Models (Based on MSE Function):
Network 1: Training Function – TRAINLM, Network
Performance function is MSE and all parameters of the
network is same as mentioned in the NN Modeling Parameter
section.
International Journal of Computer Science and Electronics Engineering (IJCSEE) Volume 3, Issue 4 (2015) ISSN 2320–4028 (Online)
325

Fig. 1 (a) shows the best validation performance (b) shows
regression plot of the network
Network2: Training Function – TRAINGDM , Network
Performance function is MSE and all parameters of the
network is same as mentioned in the NN Modeling Parameter
section.
Fig. 2 (a) shows the best validation performance (b) shows
regression plot of the network
Netwok3: Training Function – TRAINGDA , Network
Performance function is MSE and all parameters of the
network is same as mentioned in the NN Modeling Parameter
section.
Fig. 3 (a) shows the best validation performance (b) shows
regression plot of the network
Network4: Training Function – TRAINSCG , Network
Performance function is MSE and all parameters of the
network is same as mentioned in the NN Modeling Parameter
section.
Fig. 4 (a) shows the best validation performance (b) shows
regression plot of the network
Network5: Training Function – TRAINCGB, Network
Performance function is MSE and all parameters of the
International Journal of Computer Science and Electronics Engineering (IJCSEE) Volume 3, Issue 4 (2015) ISSN 2320–4028 (Online)
326
network is same as mentioned in the NN Modeling Parameter
section.
Fig. 5 (a) shows the best validation performance (b) shows
regression plot of the network
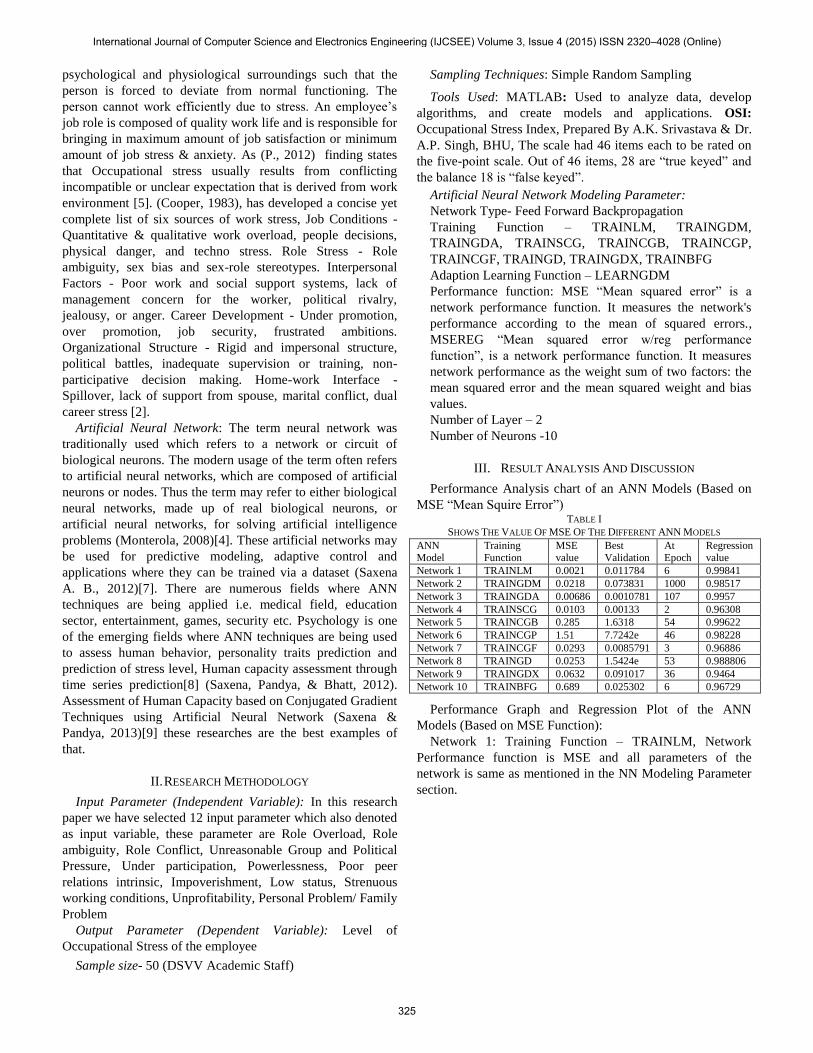
Network6: Training Function – TRAINCGP, Network
Performance function is MSE and all parameters of the
network is same as mentioned in the NN Modeling Parameter
section.
Fig. 6 (a) shows the best validation performance (b) shows
regression plot of the network
Network7: Training Function – TRAINCGF, Network
Performance function is MSE and all parameters of the
network is same as mentioned in the NN Modeling Parameter
section.
Fig. 7 (a) shows the best validation performance (b) shows
regression plot of the network
Network8: Training Function – TRAINGD, Network
Performance function is MSE and all parameters of the
network is same as mentioned in the NN Modeling Parameter
section.
Fig. 8 (a) shows the best validation performance (b) shows
regression plot of the network
Network9: Training Function – TRAINGDX, Network
Performance function is MSE and all parameters of the
International Journal of Computer Science and Electronics Engineering (IJCSEE) Volume 3, Issue 4 (2015) ISSN 2320–4028 (Online)
327
network is same as mentioned in the NN Modeling Parameter
section.
Fig. 9 (a) shows the best validation performance (b) shows
regression plot of the network
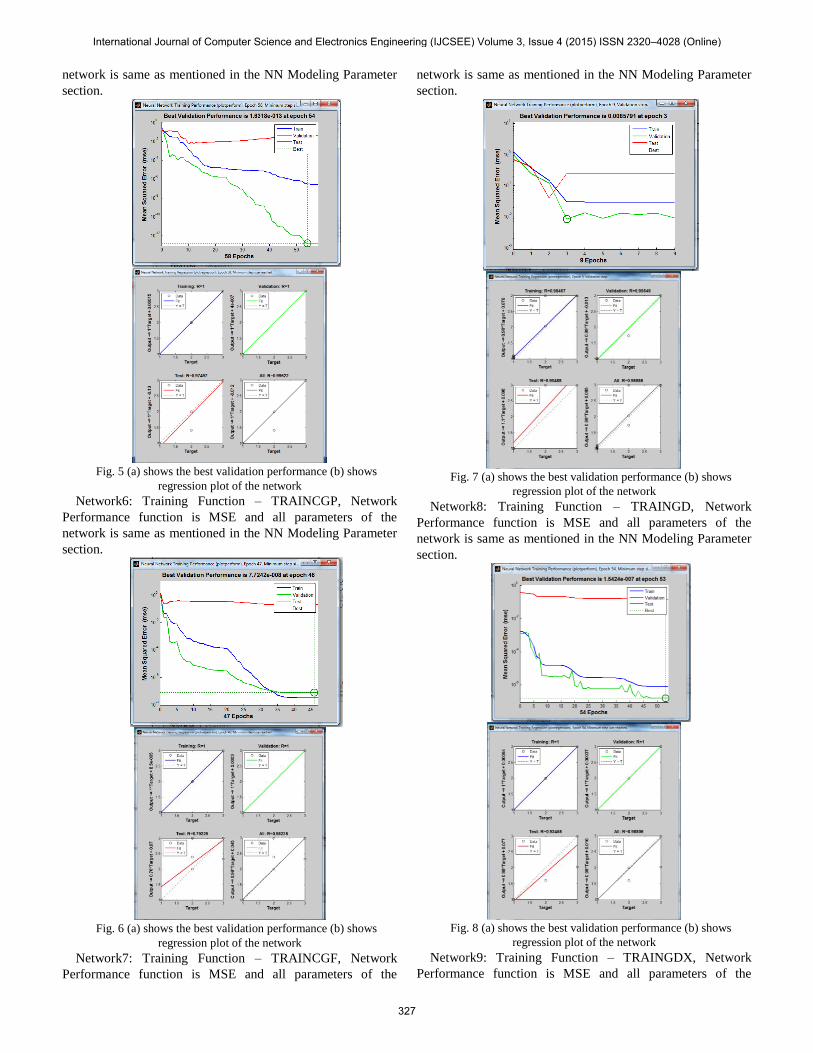
Network10: Training Function – TRAINBFG, Network
Performance function is MSE and all parameters of the
network is same as mentioned in the NN Modeling Parameter
section.
Fig. 10 (a) shows the best validation performance (b) shows
regression plot of the network
Performance Analysis chart of an ANN Models (Based on
MSEREG “Mean squared error w/reg performance function”):
for the generalization of the result we had generated MSEREG
value from selected Network Model which are mentioned in
the table.
TABLE II
SHOWS THE VALUE OF MSEREG OF THE SELECTED ANN MODELS
ANN
Model
Training
Function
Best Validation
MSEREG value
At
Epoch
Regression
value
Network 1
TRAINLM 0.64423 9 0.99945
Network
2 TRAINGDM 0.040285 764 0.98517
Network 3
TRAINGDA 0.028731 136 0.99294
Network
5 TRAINCGB 0.0050722 37 0.99145
Network 8
TRAINGD 0.12474 131 0.93556
Performance Graph and Regression Plot of the ANN Models
(Based on MSEREG Function):
Network1:
Fig.11 (a) shows the best validation performance (b) shows
regression plot of the network
International Journal of Computer Science and Electronics Engineering (IJCSEE) Volume 3, Issue 4 (2015) ISSN 2320–4028 (Online)
328
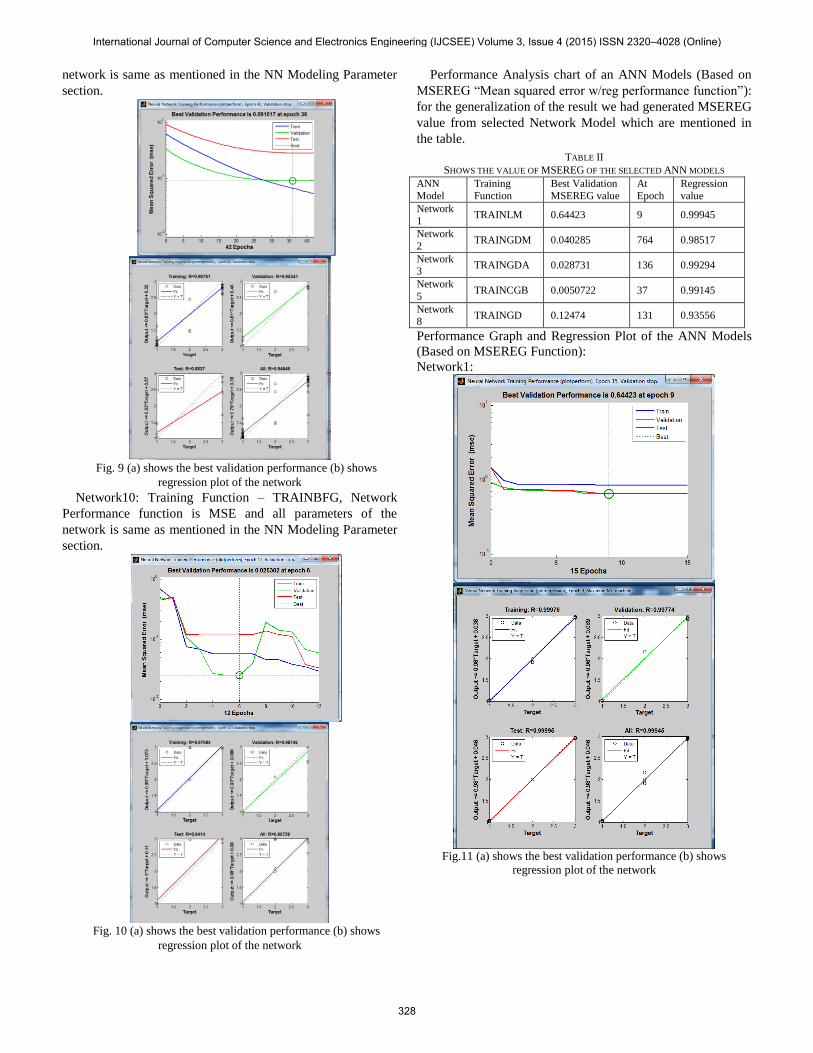
Network2:
Fig. 12 (a) shows the best validation performance (b) shows
regression plot of the network
Network3:
Fig. 13 (a) shows the best validation performance (b) shows
regression plot of the network
Network5:
Fig. 14 (a) shows the best validation performance (b) shows
regression plot of the network
Network8:
Fig. 15 (a) shows the best validation performance (b) shows
regression plot of the network
International Journal of Computer Science and Electronics Engineering (IJCSEE) Volume 3, Issue 4 (2015) ISSN 2320–4028 (Online)
329
IV. INTERPRETATION AND DISCUSSION
In this study we have created ten neural network model
(network 1, network2, network 3 ……network10) based on
different parameter. And tried to check the performance (using
MSE and MSEREG Performance Function) level of each
network and also tried to find out the best ANN model from
out them on the basis of Training, Validation, and testing
output. For the creation of network we have used MATLAB
nntool box. On the basis of Table1 the observation was that
“network1,2,3,5,8” have best result, like network 1 have MSE
value is 0.0021 and best validation is 0.011784 and overall
regression value is 0.99841 which is near to 1, as we all know
if regression value will reached to 1 that means machines
learned 100%. In the same way network2 and network3,5,8
have best result. Figure 1 to 10 shows the performance graph
and regression plot of the different neural network model.
After that the MSEREG value has been calculated for the
generalization of the result from the selected network. In this
paper we have selected only 5 network model based on their
performance (MSE value and regression). Table 2 shows that
the MSEREG value and regression value of the selected
network from this table we have tried to find out best ann
model for the prediction of occupational stress level of the
professional educatior’s. on the basis of table2 we find out that
“network1”and “network3” with training function TRAINLM,
TRAINGDA and performance function MSEREG is best
model because regression value of this model1 is 0.99945,
0.99294 which is very near to 1. And MSEREG value is
0.64423, 0.028731 which is very less than other network, so
we can say that this model is best suitable for the prediction of
occupational stress level.
V. CONCLUSION
After interpretation and discussion we can conclude that
Proper analysis through artificial neural network techniques
makes one attentive about their condition of occupational
stress level. This model helps to recognize one’s stress level so
that timely it can be cure by proper treatment and counseling.
After result analysis we have found that network1 and
network3 (Feed Forward Backpropagation network) with
Training Function TRAINLM, TRAINGDA has given best
performance. Sample size was 50. We are working on the
replica of this work on multi fold model with the large set of
data, combination of variables and the encouraging results are
showing accuracy around 92% in ANN prediction.
REFERENCES
[1] Cincinnati, O. (1999). Stress. National Institute for Occupational Safety
and Health.
[2] Cooper, C. (1983). Identifying Stressors at Work: Recent Research Developments. Journal of Psychosomatic Research, 369-376. 1
[3] Hanna, D. H. (2012). What is Stress? Retrieved 8 14, 2015, from The
American Institute of Stress: http://www.stress.org/what-is-stress/ [4] Monterola, C. R. (2008). Neural Networks. Retrieved 7 18, 2015, from
http://wiki.gis.com/: http://wiki.gis.com/wiki/index.php/Neural_network
[5] P., S. M. (2012). Occupational Stress Amongst Teachers of Professional Colleges in Punjab. Journal of Educational Research and Development.
[6] Regus. (2012, 9 6). Stress level rising among employees: Survey.
Retrieved 8 14, 2015, from The Economic Times:
http://articles.economictimes.indiatimes.com/2012-09-
06/news/33650170_1_stress-indian-respondents-madhusudan-thakur [7] Saxena, A. B. (2012). Assessment of Human Capacity with respect to
social values and professional attitude: An Artificial Neural Network
Based methodology. International Conference on Emerging Trends in Engineering and Technology. Moradabad: TMU.
[8] Saxena, A., & Pandya, P. (2013). Assessment of Human Capacity based
on Conjugated Gradient Techniques using Artificial Neural Network. Artifical Conciousness and Computer Science.
[9] Saxena, A., Pandya, P., & Bhatt, D. (2012). Human capacity assessment
through time series prediction. S & T Review an international journal on science and Technology , 2231-5160.
[10] Steber, W. (1998). Occupational Stress Among Frontline Corrections.
Menomonie: University of Wisconsin-Stout. [11] Sabherwal, Naina, & Ahuja, Deeya. (2015, March). A study on
occupational stress among faculty members in higher education
institutions in Pune. SIMS Journal of Management Research, Volume No. 1.
[12] Chaly, P. E., & Anand, S. P. J. (et. al.). (2014, July). Evaluation of
Occupational Stress among Software Professionals and School Teachers in Trivandrum. IJMDS, 3(2).
[13] Reddy, G. Lokanadha, & Poornima, R. (2012). Occupational Stress and
Professional Burnout of University Teachers in South India. International Journal of Educational Planning & Administration, 2(2),
109-124. ISSN 2249-3093.
[14] Pandey, N.P, Saxena, A.,(2015), teacher’s occupational stress: a review study in national & international scenario, International Journal of
Organizational Behaviour & Management Perspectives ,Pezzottaite Journals, Volume 4, Number 2, April, ISSN (Print):2279-0950,
(Online):2279-0969
International Journal of Computer Science and Electronics Engineering (IJCSEE) Volume 3, Issue 4 (2015) ISSN 2320–4028 (Online)
330
![Untitled-2 []€¦ · Organizing Chairman Dr. Banshi Saboo . Patron ... Dr. Dhiren Patel Dr. Abhay Dixit Dr. Pragnesh Vachhrajani . ... Gala Dinner . Prof. Roger Mazze](https://img.dokumen.tips/doc/110x75/5b391f2c7f8b9a600a8e094c/untitled-2-organizing-chairman-dr-banshi-saboo-patron-dr-dhiren.jpg)