Embed Size (px)
Citation preview

NAVAL POSTGRADUATE
SCHOOL
MONTEREY, CALIFORNIA
MBA PROFESSIONAL REPORT
Metric Development During the Reorganization of the
Supply Chain Management Center
By: Douglas W. Burkman
December 2003
Advisors: Kenneth H. Doerr Kenneth J. Euske
Approved for public release; distribution is unlimited.

THIS PAGE INTENTIONALLY LEFT BLANK

i
REPORT DOCUMENTATION PAGE Form Approved OMB No. 0704-0188
Public reporting burden for this collection of information is estimated to average 1 hour per response, including the time for reviewing instruction, searching existing data sources, gathering and maintaining the data needed, and completing and reviewing the collection of information. Send comments regarding this burden estimate or any other aspect of this collection of information, including suggestions for reducing this burden, to Washington headquarters Services, Directorate for Information Operations and Reports, 1215 Jefferson Davis Highway, Suite 1204, Arlington, VA 22202-4302, and to the Office of Management and Budget, Paperwork Reduction Project (0704-0188) Washington DC 20503. 1. AGENCY USE ONLY (Leave blank) 2. REPORT DATE
December 2003 3. REPORT TYPE AND DATES COVERED
MBA Professional Report
4. TITLE AND SUBTITLE: Metric Development During the Reorganization of the Supply Chain Management Center
6. AUTHOR(S) Douglas W. Burkman
5. FUNDING NUMBERS
7. PERFORMING ORGANIZATION NAME(S) AND ADDRESS(ES) Naval Postgraduate School Monterey, CA 93943-5000
8. PERFORMING ORGANIZATION REPORT NUMBER
9. SPONSORING / MONITORING AGENCY NAME(S) AND ADDRESS(ES) Supply Chain Management Center, Marine Corps Logistics Command, Building 3700, 814 Radford Blvd, Albany, GA 31704
10. SPONSORING / MONITORING AGENCY REPORT NUMBER
11. SUPPLEMENTARY NOTES The views expressed in this report are those of the author(s) and do not reflect the official policy or position of the Department of Defense or the U.S. Government.
12a. DISTRIBUTION / AVAILABILITY STATEMENT Approved for public release; distribution is unlimited
12b. DISTRIBUTION CODE
13. ABSTRACT (maximum 200 words)
This MBA Project documents a case study of an ongoing reorganization effort at the Supply Chain Management Center (SCMC), Marine Corps Logistics Command (MARCORLOGCOM), and their use of the Supply Chain Operations Reference (SCOR) Model and the Balanced Scorecard (BSC) to develop performance metrics based on sound processes. The primary focus was on the SCMC. In addition, the Source Management Department, one of SCMC’s subordinate units, was a secondary focus. Background information about SCOR and BSC were reviewed, as well as what has been implemented thus far with SCMC. Finally, considerations regarding the assessment and management of suppliers were offered as recommendations.
15. NUMBER OF PAGES
97
14. SUBJECT TERMS Supply Chain Management Center (SCMC), Supply Chain Operations Reference (SCOR) Model, Balanced Scorecard (BSC)
16. PRICE CODE
17. SECURITY CLASSIFICATION OF REPORT
Unclassified
18. SECURITY CLASSIFICATION OF THIS PAGE
Unclassified
19. SECURITY CLASSIFICATION OF ABSTRACT
Unclassified
20. LIMITATION OF ABSTRACT
UL
NSN 7540-01-280-5500 Standard Form 298 (Rev. 2-89) Prescribed by ANSI Std. 239-18

ii
THIS PAGE INTENTIONALLY LEFT BLANK

iii
Approved for pubic release; distribution is unlimited
METRIC DEVELOPMENT DURING THE REORGANIZATION OF THE SUPPLY CHAIN MANAGEMENT CENTER
Douglas W. Burkman Captain, United States Marine Corps B.S. Brigham Young University, 1994
Submitted in partial fulfillment of the requirements for the degree of
MASTER OF BUSINESS ADMINISTRATION
from the
NAVAL POSTGRADUATE SCHOOL December 2003
Author: _____________________________________ Douglas W. Burkman
Approved by: _____________________________________
Kenneth H. Doerr, Lead Advisor _____________________________________ Kenneth J. Euske, Support Advisor _____________________________________ Douglas A. Brook, Dean
Graduate School of Business and Public Policy

iv
THIS PAGE INTENTIONALLY LEFT BLANK
v
METRIC DEVELOPMENT DURING THE REORGANIZATION OF THE SUPPLY CHAIN MANAGEMENT CENTER
ABSTRACT
This MBA Project documents a case study of an ongoing
reorganization effort at the Supply Chain Management Center
(SCMC), Marine Corps Logistics Command (MARCORLOGCOM), and
their use of the Supply Chain Operations Reference (SCOR)
Model and the Balanced Scorecard (BSC) to develop
performance metrics based on sound processes. The primary
focus was on the SCMC. In addition, the Source Management
Department, one of SCMC’s subordinate units, was a
secondary focus. Background information about SCOR and BSC
were reviewed, as well as what has been implemented thus
far with SCMC. Finally, considerations regarding the
assessment and management of suppliers were offered as
recommendations.

vi
THIS PAGE INTENTIONALLY LEFT BLANK

vii
TABLE OF CONTENTS
I. INTRODUCTION ............................................1 A. PURPOSE ............................................1 B. SCOPE ..............................................1 C. METHODOLOGY ........................................2 D. ORGANIZATION .......................................3
II. OVERVIEW AND BACKGROUND OF THE SCOR MODEL ...............5 A. LIMITATIONS OF SCOR ................................5 B. THE BUILDING BLOCKS OF THE SCOR MODEL ..............9 C. PURPOSE OF THE SCOR MODEL .........................10 D. SOME KEYS TO SCOR .................................10
1. Supply Chains ................................10 2. Mapping the Process ..........................15 3. As-Is ........................................16 4. To-Be ........................................17
III. BACKGROUND ON METRIC PHILOSOPHIES ......................19 A. SCOR CARD .........................................19 B. BALANCED SCORECARD ................................23 C. CREATING A BALANCED SCORECARD .....................25
1. Defining the Measurement Architecture ........26 2. Building Consensus Around Strategic
Objectives ...................................26 3. Selecting and Designing Measures .............28 4. Building the Implementation Plan .............29
IV. REORGANIZING ...........................................31 A. IMPETUS FOR CHANGE ................................31 B. SCMC’S SCOR IMPLEMENTATION ........................34 C. MODEL DEVELOPMENT IN SOURCE MANAGEMENT DEPARTMENT .41 D. BALANCED SCORECARD IMPLEMENTATION .................46
V. RECOMMENDATIONS ........................................51 A. REALIGNMENT .......................................51 B. COLLABORATION .....................................54 C. SUPPLIER ASSOCIATIONS .............................57 D. ACQUISITION PROCESS ...............................58 E. CONCLUSION ........................................59
APPENDIX A. MARINE CORPS LOGISTICS ATTRIBUTES: (REF. 4) ....61 APPENDIX B. SWIM LANE PROCESSES (REF. 21) ..................69 LIST OF REFERENCES ..........................................79 INITIAL DISTRIBUTION LIST ...................................83

viii
THIS PAGE INTENTIONALLY LEFT BLANK
ix
LIST OF FIGURES
Figure 1. Supply Chain-level Mapping (From: Ref. 22).......6 Figure 2. Organization-Level Mapping (From: Ref. 22).......7 Figure 3. Three Levels of SCOR (From: Ref. 22).............8 Figure 4. Process Types and Definitions (From: Ref. 22)...11 Figure 5. Level Three Detail (From: Ref. 22)..............12 Figure 6. Level Four and More (From: Ref. 22).............13 Figure 7. Physical Map (From: Ref. 22)....................14 Figure 8 ILC’s Balanced SCOR card (From: Ref. 4).......20 Figure 9. Balanced Scorecard (After: Ref. 9).............25 Figure 10. SCOR Roadmap (From: Ref. 23)....................37 Figure 11. SCMC’s “As-Is” Organization.....................38 Figure 12. SCMC’s “To-Be” Organization.....................38 Figure 13. Procurement Buys Level Four Mapping and More
(From: Ref. 29).................................44 Figure 14. Level Three SMD (From: Ref. 29).................45 Figure 15. LOGCOM Mapping (From: Ref. 26)..................48 Figure 16. Objective, Measure, Target (From: Ref. 26).....49

x
THIS PAGE INTENTIONALLY LEFT BLANK

xi
ACKNOWLEDGMENTS
To the Supply Chain Management Center, LOGCOM, for
funding travel during this project and for your cooperation
in granting interviews and information about your SCOR and
metric development.
To Major Patrick S. McDoniel, USMC, Captain Todd A.
Fujimoto, USMC, MSgt Michael Lawrence, USMC (Ret.), and
many others for your extensive time given in explaining
SCOR, metric development, and what was actually occurring
at SCMC.
To my wife, Neesa, and our children, Spencer,
Benjamin, Sarah, and Hannah, for your tremendous patience
and sacrifice.

xii
THIS PAGE INTENTIONALLY LEFT BLANK

1
I. INTRODUCTION
A. PURPOSE
Before the current Supply Chain Management Center
(SCMC) reorganization effort, SCMC did not have a metric
system in place to measure supply chain performance. This
author explored two influences and initiatives, namely the
Supply Chain Operations Reference (SCOR) model and the
Balanced Scorecard (BSC), that are being pursued to correct
this deficiency.
This case study sought to clarify the “why” and “how”
of a reorganization process not yet well understood at many
levels of the supply chain within the Marine Corps, but
which will be greatly affected by such process changes.
This case study followed commonly accepted methodology, as
described in Yin (1994).
As the study was explanatory, particular attention was
paid to defining the scope and units of analysis. However,
while existing literature on the SCOR model and the
Balanced Scorecard were briefly reviewed, it was not the
intention of this study to validate any existing theory, or
support any particular proposition about SCOR, or the
Balanced Scorecard technique. Rather, the study focused on
the process of change, seeking to provide an understanding
through description of the transformation process as it was
undertaken by SCMC.
B. SCOPE
The scope of the study was limited to SCOR level
processes within SCMC, including the development of
performance metrics within the SCOR-based organizational

2
structure. The primary unit of analysis in this case study
was the SCMC. The intent was to develop an integrated
understanding of transformation as it affects SCMC as a
whole. Furthermore, the Source Management Department’s
SCOR and metric development was also reviewed briefly.
Finally, it must be emphasized from the outset that
SCMC’s SCOR and metric development are only partially
complete. As of November 2003, much work was still
continuing and will continue for the next several months or
so.
C. METHODOLOGY
Due to the significant causal relations between the
SCOR model and the BSC approach, the general strategy of
this case study was to describe that relationship, and how
it drove the reorganization of the SCMC. The SCOR model
led SCMC to both a physical and process reorganization.
Furthermore, SCMC hopes the BSC technique will help SCMC
frame its metric development, coinciding with the SCOR
model’s foundation. Within this strategy, explanation
building was the technique used to analyze the case.
Data was collected via personal/electronic mail
interviews and the study of related documents. Personal
interviews were conducted during four trips to SCMC,
located in Albany, Georgia. Two-day trips were completed
in June and July of 2003. Four-day trips were conducted in
September and October of 2003. The personal interviews
were both unstructured and semi-structured. Early
interviews were used mostly to develop a grounded framework
for the study of the SCOR level processes within SCMC.

3
Later, interviews were targeted at developing a full
description of the transformation effort at SCMC.
Interviews were recorded and transcribed. The
interviews were used to generate descriptions and develop
discussion in the report. However, transcriptions are not
provided in this report, nor was a permanent record of them
kept.
D. ORGANIZATION
First, the SCOR model is described. Second, Kaplan
and Norton’s Balanced Scorecard, as well as the Integrated
Logistics Concept (ILC) SCOR card are explained. Third,
the impetus for implementing such initiatives is clarified.
Fourth, SCMC’s implementation of the SCOR model down to the
Source Management Department is discussed. Fifth, SCMC’s
metric development is described. Finally, recommendations
are made to develop metrics for assessing supplier
performance.

4
THIS PAGE INTENTIONALLY LEFT BLANK

5
II. OVERVIEW AND BACKGROUND OF THE SCOR MODEL
The SCOR model was first developed and released by the
Supply Chain Council (SCC) in 1996. The most up-to-date
SCOR model version 6.0 was published in April 2003. The
SCC is an independent, global, not-for-profit corporation
comprised of practitioners across the manufacturing,
distribution, and retail industries as well as technology
suppliers and implementers, academicians, and government
organizations (e.g., Marine Corps). [Ref. 1: p. 1]
The Model uses the management process building blocks
of Plan, Source, Make, Deliver, and Return to describe
logistics chain processes. By using a common set of terms
and definitions, disparate industries and those of varying
complexities and sizes can all use the SCOR Model. The
Model is typically used to map five stages of the supply
chain process (i.e. the movement of products & information
from the suppliers of an organization’s suppliers to the
customer of their customers) as viewed in Figure 1. [Ref.
22: p. 3] It is also used to map the processes within a
single organization (Figure 2) [Ref. 1: p. 9], as will be
explained for SCMC later in the paper.
A. LIMITATIONS OF SCOR
The SCOR model has limitations within business
processes and within organizations. Activities not
addressed include: sales and marketing, product
development, and some areas of post-delivery customer
support. Also, the Model does not discuss human resources,
training, and quality assurance. The SCC agrees there are
other highly qualified organizations, which adequately
conduct programs in these areas that are either absent or

6
Figure 1. Supply Chain-level Mapping (From: Ref. 22)

7
Figure 2. Organization-Level Mapping (From: Ref. 22)

8
Figure 3. Three Levels of SCOR (From: Ref. 22)

9
minimized in the Model. Additionally, the SCOR model only
maps out processes through level three (see Figure 3).
Organizations still need to map out level four processes
and beyond, as each organization must address their own
unique activities. [Ref. 1: p. 3] Furthermore, the Model
does not address material repair activity, but the SCC is
working to incorporate this into the Model. [Ref. 2: p.
109] In the end, the flexibility already exists to adapt
the Model to an organization’s needs as the Marine Corps
has done in adding Maintain to be interchangeable with
Make.
B. THE BUILDING BLOCKS OF THE SCOR MODEL
Within the SCOR model, P depicts Plan, S depicts
Source, M depicts Make or Maintain, D depicts Deliver, R
depicts Return, and E depicts Enable. A letter with no
number represents a level one process. A combination such
as P1 represents a level two process. And, a notation such
as P1.1 represents a level three process. [Ref. 1: p. 5]
Level one is defined by the five core management
processes of plan, source, make, deliver, and return as
shown in Figure 4 [Ref. 22: p. 7]. For level two, three
process types also in Figure 4 further define the core
processes: planning (e.g., P2 Plan Source), execution
(e.g., S1 Source Stocked Product), and enable (e.g., ES
Enable Source). The examples given represent process
categories. In level three, the process categories are
delineated by distinct inputs, outputs, and a basic logic
flow of process elements as viewed in Figure 5 [Ref. 22: p.
10]. SCOR levels four and below describe the process
elements in even greater detail and are organization unique
as illustrated in Figure 6 [Ref. 22: p. 12].
10
C. PURPOSE OF THE SCOR MODEL
The Supply Chain Council created the SCOR model to
allow organizations to do the following: [Ref. 2: pp. 108-
109]
- Communicate by using common terminology and
standard descriptions
- Leverage metrics and benchmarking to determine
performance goals, set priorities, and quantify
the benefits of process change
- Understand practices that yield the best
performance
- Understand the supply chain management (SCM)
process and evaluate overall performance
- Identify the best software tools for their
process requirements
D. SOME KEYS TO SCOR
In this section, the author acknowledges the many
illustrations provided by SCMC’s SCOR evangelist (a term
commonly used by the SCC and SCMC), Mike Lawrence, to
enable further understanding.
1. Supply Chains
Ultimately, the primary purpose of SCOR is to describe
and model supply chains. But, an organization must first
establish how they will identify their supply chains.
[Ref. 1: p. 2] Supply chains may be categorized in
numerous ways, to include: product groupings, geography,
profit center/ cost center, organizational, customer, and
supplier. [Ref. 19: p. 54] This becomes more apparent to
an organization as they put individual product supply
chains on a physical map (Figure 7). [Ref. 22: p. 18]

11
Figure 4. Process Types and Definitions (From: Ref. 22)

12
Figure 5. Level Three Detail (From: Ref. 22)

13
Figure 6. Level Four and More (From: Ref. 22)

14
Figure 7. Physical Map (From: Ref. 22)

15
Considerations in determining supply chains should
include some of the following examples of thought-provoking
illustrative questions. If a circuit card can be shipped
in an envelope, but an engine must be shipped by tractor-
trailer with forklift support, should they be categorized
in the same supply chain and measured against one another
by the same standard? Likewise, should a circuit card and
engine be in the same supply chain and held to the same
standard when comparing Repair Cycle Time (RCT)? Should a
circuit card being shipped to Camp Pendleton, CA from
Albany, GA be in the same supply chain and held to the same
standard of delivery time as a circuit card being shipped
to Camp Lejeune, NC from Albany, GA? Finally, should a
truck shipped by tractor-trailer be in the same supply
chain and held to the same standard as a tank being shipped
by rail? Distinct shipping processes, geographical
locations, and transportation modes highlight some of the
unique characteristics to be considered in identifying
supply chains. [Refs. 1, 7, 19]
2. Mapping the Process
Having identified the supply chains, the
activities/processes within those supply chains need to be
mapped and described. A collaborative effort should
transpire from the top down in mapping the activities of
the supply chain to a flow chart, particularly levels three
and below. As this evolution takes place, further
characteristic analysis of the supply chain will also
occur. Many questions will arise. For example, who is the
supplier? Who is the supplier’s supplier? Are they the
sole source? Who is the customer? What is the customer’s
desire? What are the customer’s demands? Are there spikes

16
in the demands? These are just a few of many questions
that should be explored and drive the development in
mapping the processes. [Refs. 1, 7, 19]
3. As-Is
When the process mapping is completed, performance
metrics need to be identified. In order to identify the
“As-Is” performance level of a given metric, the
performance data must be visible and accessible. For
instance, if the metric identified is forecast accuracy and
the current performance is 50%, this represents the “As-Is”
state of the forecast accuracy process. [Refs. 1, 7, 19]
Sometimes, other considerations must be kept in mind
when determining the “As-Is”. For example, the inventory
of circuit cards for a particular radio may be very high
compared to the inventory required for a given service
level. Closer investigation reveals that the circuit card
supplier went out of business and the item manager
purchased the remaining inventory. With the larger
inventory of circuit cards, the item manager is seeking to
give himself some additional lead-time to find another
supplier of circuit cards or to find another solution.
Such information should be considered when determining the
“As-Is” state, so that such a situation is not overlooked.
This is just one example of the level of detail required in
calculating the “As-Is” state of the supply chain. [Refs.
1, 7, 19]

17
4. To-Be
After establishing the “As-Is”, a “To-Be” target or
objective should then be established. This target may be
based on a competitor’s performance, best in class, demands
of your customer, or several other possibilities. When
this target has been determined, an analysis of why there
is a difference between the “As-Is” and the “To-Be” should
take place. For example, if the “To-Be” target for
forecast accuracy was set at 85% and the “As-Is” had
already been determined at 50%, a gap analysis would then
be performed to identify what is causing the difference.
This analysis would be process and technologically-
oriented. The SCOR model offers suggestions of best
business practices and processes to be implemented for
success. These would enable the organization to implement
what needs to occur in order to achieve the “To-Be” target.
When identifying another organization as being responsible
for a discrepancy in the supply chain, an organization
should always ensure that their own processes are sound and
not contributing to the deficiency before seeking to
correct another member of the supply chain. [Refs. 1, 7,
19]
The analysis may also determine that the forecasting
model is sub-standard. In this case, the process should
remain the same, but the enabler would need to be upgraded
or replaced. In the end, base-lining work must be done to
establish an “As-Is” state, in order to set a “To-Be”
objective and begin the effort towards that accomplishment.
[Refs. 1, 7, 19]

18
In the end, not all items of each supply chain will
have all the same or similar characteristics. Hence, it
should be noted that not all items would perform at the
same standard, therefore the distinguishing characteristics
within a supply chain should always be considered during
supply chain performance analysis. Consequently, an
organization may have to make changes to a process for a
specific item within a supply chain to increase its
performance capability. [Refs. 1, 7, 19]

19
III. BACKGROUND ON METRIC PHILOSOPHIES
A. SCOR CARD
In 2002, when the Marine Corps began to use the SCOR
model to map its logistical processes, ILC began to work
with the SCC to develop a logistical scorecard based on the
performance attributes defined by the metrics within the
Model. To develop such a scorecard, the ILC followed a
specific four-step methodology in doing so. First, they
sought to understand the Marine Corps mission, the
priorities of the logistical enterprise, and the key
objectives of the leadership. The second step was to
define key characteristics of the logistics chain that were
aligned with the enterprise mission and objectives, and
identify level one metrics that would indicate performance
in those areas. Third, they prioritized the level one
metrics and decomposed them into a set of hierarchical
diagnostic metrics. The fourth step was to use those
metrics to develop and fine-tune business processes to
support the overarching enterprise goals and objectives.
[Ref. 5: p. 17]
The key identified characteristics of the logistics
chain were the five performance attributes of the SCOR
model and an additional DOD-unique attribute entitled
readiness (Figure 8). With the assistance of the SCC, the
six characteristics were defined and the representative
metric chosen as the following [Refs. 2, 3, 4]:

20
USMC Logistics
AssetsAsset Utilization
ReliabilityQuality Order Fulfillment
ReadinessOperational Availability
FlexibilityLogistics Chain Capacity
ExpensesTotal Logistics Chain
Expense
ResponsivenessTotal Logistics Chain
Cycle Time
Figure 8 ILC’s Balanced SCOR card (From: Ref. 4) -Reliability: -The performance of the logistics chain
in delivering the correct product to the correct place, at
the correct time, in the correct condition and packaging,
in the correct quantity, with the correct documentation,
and to the correct supported unit. This is an adapted
definition from the SCC’s SCOR model attribute of Supply
Chain Delivery Reliability. It is worth noting that this
is a somewhat unusual definition of reliability. Webster’s
New Collegiate Dictionary defines reliability as “the
extent to which an experiment, test, or measuring procedure
yields the same results on repeated trials.” And, in
measurement, reliability usually refers to a property of
repeatability and stability. [Ref. 43: p. 145] ILC and
the SCC have specifically stated that this attribute is a

21
measure of accuracy and timeliness. The tier-one metric
chosen was Quality Order Fulfillment (see Appendix A).
-Responsiveness: -The velocity at which a logistics
chain provides products to supported units from the time a
request is made to the time of delivery. The tier-one
metric selected was Total Logistics Chain Cycle Time (see
Appendix A).
-Flexibility: -The agility of a logistics chain when
responding to sudden changes in supported unit demand. The
tier-one metric identified was Logistics Chain Capacity to
handle sudden demand surges (see Appendix A).
-Readiness: -Equipment readiness captures how often
equipment is mission ready, but is only one of four
elements of readiness (the other three being
organization/personnel, force projection, and training).
Readiness is a military-unique metric and is typically
associated with a unit’s percentage of equipment not dead
lined, but has not yet been formally defined. Operational
Availability was identified as this attribute’s tier-one
metric (see Appendix A). It is noteworthy that this
situation introduces two quite problematic issues. Without
a definition of readiness, it is impossible to assess the
validity of the selected measure of the construct. [Ref.
44: pp. 17, 60] That is, it is impossible to assess
whether readiness, as the construct is defined, is an
appropriately explanatory term for the use we intend to
make of it (because it has not been defined); and,
secondly, it is impossible to assess whether Operational
Availability accurately reflects our definition of
readiness (again, because it has not been defined).

22
Operational Availability was identified as this attribute’s
tier-one metric (see Appendix A).
-Assets: -The effectiveness of an organization in
managing assets to support demand satisfaction. The tier-
one metric chosen was Asset Utilization (Appendix A).
-Expenses: -The expenses associated with operating the
Logistics chain. The tier-one metric selected was Total
Logistics Chain Expense (see Appendix A).
The specific tier-one metrics were identified by ILC
using a two-pronged approach referred to as primary
research and secondary research. Primary research was a
collaborative effort with Penn State University. Leading
firms in supply chain management were identified, after
which the list was screened for only those being most
relevant to the Marine Corps. Site visits and interviews
were then conducted with these selected firms to better
“understand why they excel in supply chain management, how
their different supply chain management processes work, the
tools and intelligence they use to make them a best-in-
class company, and the metrics they use.” [Ref. 4: p. 1]
Primary research also included an investigation of DOD and
Marine Corps use of metrics. The key element of secondary
research was a literature review of numerous books and
publications related to supply chain management. This
proved helpful in highlighting insights not yet covered by
the primary research. From the primary and secondary
research efforts, the best tier-one metrics were selected
as they fit among the SCOR attributes and then developed.
[Ref. 4: pp. 1-2]
In researching metrics, ILC discovered further
distinguishing characteristics of metrics. Tier-one

23
metrics are referred to as measurement metrics, or high-
level strategic metrics. Each measurement metric is built
from lower level metrics called diagnostic metrics. For
example, Total Fulfillment Cycle Time, a tier-one
measurement metric, is calculated by adding Request Cycle
Time and Order Fulfillment Cycle Time, two tier-two
diagnostic metrics. And, as the name implies, diagnostic
metrics are to be used for problem diagnosis and
correction. [Ref. 4: p. 8]
Upon determining the tier-one metrics, tier-two
metrics were identified to calculate the tier-one metrics.
Thereafter, a cascading effect took place: tier-three
metrics were identified to calculate the tier-two metrics
and so on. [Refs. 4: p. 9]
If this metric framework was mandated by the
Commandant of the Marine Corps and institutionalized
through a series of steps, all units in the Marine Corps
would participate in providing input for the computation of
these tier-one metrics. [Ref. 4: pp. 9-11]
B. BALANCED SCORECARD
In the 1980’s, sixteen distinguished researchers from
the Massachusetts Institute of Technology (MIT) examined
eight production industries within the United States and
came to the conclusion that the United States was losing
its dominant position in the world economy due to profound
defects in the country’s private sector culture. This
group subsequently recommended that industry develop
techniques to measure and improve the efficiency and
quality of the production process and to identify
opportunities for progressive improvements in its

24
performance. Specifically, they challenged manufacturers
to develop new measures on three performance criteria:
quality, cost, and delivery. [Ref. 10: p. xi]
In January 1989, Harvard University hosted a
colloquium wherein the conference delegates (academicians
and practitioners from more than 25 companies) identified
specific improvements needed to develop a valuable
performance measurement framework:
- Focus on the customer
- Forge tighter linkages between plant and local
department measures
- Be more dynamic, capable of changing when
customer expectations or strategies change
- Translate flexibility into specific measurements
- Link operations to financial results
With such an acknowledged challenge, various groups
present sought to develop a framework. [Ref. 10: p. xii]
During this period of time, Robert Kaplan and David Norton,
in working with dozens of companies, developed the most
prominent framework that would be used by hundreds of
companies and organizations over the next decade. [Ref.
12: p. 2]
In summarizing their framework, Kaplan and Norton
explain:
The Balanced Scorecard complements financial measures of past performance with measures of the drivers of future performance. The objectives and measures of the scorecard are derived from an organization’s vision and strategy. The objectives and measures view organizational performance from four perspectives: financial, customer, internal business process, and learning and growth. These four perspectives provide the

25
framework for the Balanced Scorecard. (Figure 9) [Ref. 9: p. 8]
Visionand
Strategy
Financial-Objectives-Measures-Targets-Initiatives
Internal Business Process-Objectives-Measures-Targets-Initiatives
Customer/Warfighter-Objectives-Measures-Targets-Initiatives
Learning and Growth-Objectives-Measures-Targets-Initiatives
Figure 9. Balanced Scorecard (After: Ref. 9).
C. CREATING A BALANCED SCORECARD
To create a balanced scorecard, an organization must
be able to translate their mission and strategy into
operational objectives and measures. This requires an
architect to frame and facilitate the process, and ensure
relevant information is used in the scorecard. The
architect is typically a senior staff manager in the
organization. To be successful, the senior executive
leadership (client) must actively sponsor and participate

26
in the process; otherwise, the effort will fail. This
should not be a staff-led initiative. “The client must be
totally engaged in the development process, since the
client will assume ultimate ownership of the scorecard and
will lead the management processes associated with it.”
[Ref. 9: p. 299] To create the scorecard, four primary
steps will occur. [Ref. 9: pp. 294-300]
1. Defining the Measurement Architecture
The appropriate organizational unit must first be
selected. A corporation is seen as too diverse for a
scorecard project. However, one of its strategic business
units (SBUs) is usually ideal. Typically, the SBU would
have products, customers, marketing, distribution channels,
production facilities, and possibly more in its spectrum of
activities. [Ref. 9: pp. 300-302]
The architect then begins learning about the SBU’s
relationship with other SBUs in the corporation. He
conducts interviews with senior executives regarding
financial objectives for the SBU, overriding corporate
themes, and linkages to other SBUs. Later in the process,
this knowledge helps the SBU not to optimize at the expense
of other SBUs. [Ref. 9: pp. 300-302]
2. Building Consensus Around Strategic Objectives
The architect conducts 90-minute interviews with the
senior executive team members (usually 6 to 12) to obtain
input on the SBU’s strategic objectives and tentative
proposals for Balanced Scorecard measures across the four
perspectives. Quite often one or two assistants to the
architect augment this interviewing process. In addition
to the input, the interviews serve as an opportunity to
better introduce the concept of BSC to these senior

27
managers, respond to their questions, and translate how
their input will be shaped into objectives and measures on
the scorecard. This task also provides the architect an
opportunity to learn about concerns and potential conflicts
from or among key personnel. [Ref. 9: pp. 302-305]
At the conclusion of the interviews, the architect and
his assistants reconvene to discuss the input. From this,
a tentative list of objectives and measures is put
together. The objectives within each of the four
perspectives are ranked according to those most commonly
mentioned during the interviews. Attached to each
objective will be anonymous quotes from the individual
executives explaining and supporting the objective, and
bringing up potential issues for the executive team to
solve. [Ref. 9: pp. 302-305]
The senior executive team now meets for their first
workshop. In the beginning, the architect facilitates a
discussion to gain consensus on the mission and strategy
statements. Then, the senior executive team discusses each
of the perspectives (customer, internal processes, learning
and growth, and financial). At this time, the team members
see all the proposed objectives, their rankings, and quotes
from the interviews. Each objective is then discussed and
compared with the other potential objectives. After all
have been discussed, the group votes to determine the top
three or four objectives in each perspective. A single
sentence or short paragraph description is created for each
objective, after which the team brainstorms for measures
supporting the objectives. Next, the executive team is
divided into four subgroups, each representing a

28
perspective. One executive is chosen to lead the subgroup
and additional key managers are brought in to augment the
subgroups. Soon after the meeting, the architect documents
and distributes to the subgroups the objectives, their
descriptions, and the potential measures. [Ref. 9: pp. 302-
305]
3. Selecting and Designing Measures
The architect now begins a series of meetings with the
subgroups to achieve four objectives. First, the subgroup
must further improve the wording of the strategic
objectives. Second, they must identify the measures that
best represent the intent of each objective. Third, the
subgroup must identify the information source for each
measure and address the actions that will be required to
access that information. Fourth, they must identify how
measures are linked to one another within a perspective and
how they are linked to measures in other perspectives. At
the conclusion of these meetings, the subgroups should have
completed a detailed description of each objective, a
description of each objective measure, an illustration of
how each measure is quantified and displayed, and a model
of how the measures and objectives within the perspective
and to those in other perspectives. With this
accomplished, the architect schedules the next workshop.
[Ref. 9: pp. 305-307]
At the second executive workshop, the lead executives
from each subgroup present the results of their subgroup
meetings. During these presentations, the proposals are
further discussed and the development of implementation
begins. Potential targets for the measures are also
discussed. [Ref. 9: pp. 305-307]

29
4. Building the Implementation Plan
The subgroup leaders then convene as the
implementation team to plan the linkage of measures to
databases and information systems, the communication of the
Balanced Scorecard to the organization, and the development
of second-level measures (building blocks for the top-level
measures) for subordinate units. [Ref. 9: pp. 308-309]
In the third executive workshop, the senior executive
team finalizes the objectives, measures, and targets.
Discussions also begin on the preliminary action plans to
meet the targets. At the end, the team should agree on an
implementation plan to communicate the BSC to the
employees, to integrate the scorecard into its management
philosophy, and to develop the information system required
to support the scorecard. [Ref. 9: pp. 308-309]
Finally, it is recommended that management begin using
the scorecard within 60 days of the final executive
workshop. Even as a phase in plan will be required, the
“best available “ data should be used until the information
system has been established. Rollout of the scorecard
project typically requires about 16 weeks. This includes
time for the senior executive team to contemplate and
reflect on the process that is occurring. [Ref. 9: pp. 308-
309]

30
THIS PAGE INTENTIONALLY LEFT BLANK

31
IV. REORGANIZING
A. IMPETUS FOR CHANGE
The Marine Corps’ logistical transformation effort
began in 1998 when respected personnel from within and
without the ranks of the Marine Corps came together to form
the Integrated Logistics Capability (ILC). After
significant analysis of best business practices in
industry, the Operational Architecture (OA) Team (ILC
sponsored) set out to reengineer the supply chain
management process in the Marine Corps using the SCOR
(Supply Chain Operations Reference) model as a framework.
[Refs. 5, 7, 18]] In April of 2001, the Supply Chain
Management Center (SCMC), Marine Corps Logistics Bases
Command (MARCORLOGBASES), was established to provide a
focal point for Marine Corps supply support. Previous to
this, SCMC was known as the Life Cycle Management Center
(LCMC) with an emphasis on weapons systems. The newly
named organization then focused on the supply chain.
SCMC’s mission declared that it would “plan, organize,
integrate, and manage Marine Corps worldwide supply chain
activities for Principal End Items (PEIs), Secondary Items,
and Consumable Items assigned to meet Marine Corps
operational requirements.” [Ref. 6: pp. 1-2]
Later, in June of 2001, Lieutenant General Gary
McKissock (then Deputy Commandant, Installations and
Logistics Headquarters, United States Marine Corps) stated,
“the mandate for the Marine Corps’ to change its logistical
system is driven by the need to provide operational support
to the Marine Corps’ emerging Expeditionary Maneuver
Warfare concept. This transformation, coupled with the

32
United States national industrial base modernization will
radically alter the way the Marine Corps does ‘worldwide
logistical business’ in the 21st century.” [Ref. 8: p. 5]
He would then go on to head a group of generals that
developed the Marine Corps Logistics Campaign Plan (MCLCP)
in 2002. [Ref. 11: p. 1] Within the plan, goals such as
“streamlining the logistics chain” and setting “high
standards of performance and striving to exceed them” were
established to drive transformation efforts. Moreover, the
Marine Corps Logistics Enterprise Integration guiding
principles supported the MCLCP goals. Some of these
principles included “developing an improved integrated
logistics chain; accomplishing organizational
transformation in the areas of Business Process
Reengineering; documenting, analyzing, and validating
Marine Corps logistics chain processes; and meeting user
needs for valid, timely, and accurate information.” [Ref.
8: p. 4]
Previous to, but in keeping with such identified goals
and principles, DOD logisticians proposed that the
“balanced scorecard” and the SCOR model be used to develop
and evaluate the metrics and processes of the supply chain.
[Ref. 2: p. 69] Balanced Scorecard would later be used by
LOGCOM, beginning in May 2003; to develop performance
metrics as will be described later in this document.
During its search for best business practices, the
Marine Corps (via ILC) selected the SCOR model to be used
to “identify gaps in its existing logistics chain systems
portfolio as well as a baseline to acquire and develop new
IT enablers or capability sets. It was chosen as the
foundation of the logistics Operational Architecture (AO)

33
because it better aligned with industry leaders.” [Ref. 8:
p. 5]
In April 2001, having previously worked with the
original OA Team and now leading the newly named supply
chain-focused SCMC, the director of SCMC saw the SCOR model
as a logical fit for the organization, so he began the
steps toward implementation. A key factor that heavily
influenced his decision was the fact that the OA Team’s
study of best business practices found that the SCOR model
was the industry standard for defining and mapping the
business processes/activities within an organization or
supply chain. [Ref. 18]
In the end, SCOR was chosen for three reasons. First,
it was being implemented to overcome the inefficiencies in
interface processes encountered by the previous SCMC/LCMC
organizations. Second, SCOR was being put into practice to
solve the poor overall customer satisfaction that has
characterized the Marine Corps logistics chain in the past.
Third, SCMC chose SCOR for its other benefits, primarily
improved cycle times and synchronized inventories
(Wholesale, Retail). [Ref. 24]
Brigadier General Richard S. Kramlich (previous
Commanding General, Marine Corps Logistics Bases) would
later affirm that the SCOR model would be employed as the
underlying foundation for establishing an enterprise-wide
supply chain network within the Marine Corps and as the
foundation for transforming and reorganizing the Supply
Chain Management Center into the Supply Chain Manager for
the Marine Corps. [Ref. 7: p. 2] In addition, this
management tool was mandated in the updated DOD Super Reg,
May 2003: “The DOD components shall use the supply chain

34
reference processes of Plan, Source, Make, Deliver, and
Return as a framework for developing, improving, and
conducting material management activities to satisfy
customer support requirements developed collaboratively
with the support providers.” [Ref. 3: p. 19]
B. SCMC’S SCOR IMPLEMENTATION
Previous to their efforts to fully implement SCOR
throughout its organization, the creators of SCMC’s
Centralized Secondary Reparable (SecRep) Project used the
SCOR model methodology to achieve its goal. Prior to Sec
Reps being centralized, the “As-Is” process for the
individual Reparable Issue Points (RIPs) throughout the
Marine Corps was to conduct their own P2 (Plan Source). To
improve the process, SCMC took over Sec Rep P2 for the
entire Marine Corps to support Fleet Marine Force (FMF)
requirements (P4). The result has been the reduction of
millions of dollars in inventory and of hundreds of dead
lined Principle End Items (PEIs) and backorders at the
RIPs. In completing the project, the Centralized SecRep
Maintenance Department was established. Consequently, “the
Centralized SecRep initiative served as a microcosm for the
entire organization” as SCMC began its SCOR development for
the organization as a whole. [Ref. 39] Since the
transition to a SCOR-based organizational structure, the
identified functions required for SecRep centralization
have been integrated into their respective departments.
The Supply Chain Planning Department now conducts all P2,
P3, and P5 activities. The Source Management Department
coordinates or conducts all M1 and S1 activities. Finally,
the Material and Distribution Management Department

35
coordinates all D1, SR1, DR2, and DR3 activities. [Ref.
39]
In October 2001, a Master Sergeant was sent by the
Director of SCMC to begin extensive SCOR training. He
would later assume the role of SCOR “evangelist” for SCMC
and perform the brunt of the facilitating within SCMC. In
July 2002, having then retired from the Marine Corps and
since converted to and been hired as a contractor by SCMC;
the evangelist began the facilitation process. [Refs. 14,
15]
At this time, the evangelist formed an Integrated
Product Team (IPT) consisting of all the directors of
SCMC’s “As-Is” departments and selected additional
participants. The primary focus of this IPT was the
alignment of people, processes, and systems in level four
of the SCOR Project Roadmap. Nevertheless, during their
weekly meetings, the IPT was led by the evangelist through
an overview of the first three levels of the Roadmap. In
order, each step of each SCOR level of the Project Roadmap
was discussed each week at the IPT meetings. [Refs. 15,
24, 39]
Additional SCOR-trained personnel also assisted in
facilitating during the IPT meetings, the IPT also
proceeded to map out the first three SCOR levels of SCMC’s
general organizational “As-Is” processes (given that supply
chains had still not been identified). In the future, this
would facilitate the execution of the SCOR Project Roadmap
as it more appropriately fit with supply chains. [Refs.
14, 15, 25, 39]
The IPT was also chartered to reorganize SCMC to be
built around the SCOR model processes. This type of

36
implementation structure supported the DOD’s most updated
logistics publication, DOD Material Management Regulation
4140.1-R, and the SCOR-based Global Combat Service Support
Marine Corps (GSCC-MC) system (the future Marine Corps
logistics Enterprise Resource Planning tool), which
supports the Operational Architecture being designed by
ILC. Even one of the stated assumptions of the Operational
Architecture is that the SCOR model will provide the basis
for definition of its detailed layout. [Refs. 14, 15, 25,
39, 40]
During this time, a series of recommendations was
developed and then culminated in a final recommendation
that was approved by SCMC’s Director in February 2003.
However, the impending focus on Operation Iraqi Freedom
proceeded to delay and slow down the implementation of the
final approved recommendation. Finally, on 22 August, the
“As-Is” organization (Figure 11) began to change as
personnel were moved and departments were physically
established for Plan, Source, Deliver, Data Management, and
Enabler. (Figure 12) The Make or Maintain function
continued to be managed by the Maintenance Directorate. In
reorganizing by process function, SCMC sought to be more
efficient and less redundant in their processes. Personnel
were specifically assigned to departments during the
earlier IPT meetings. As late as October, the departments
were still discussing ownership of the Returns process.
[Refs. 5, 7, 14, 15, 25]

37
Material FlowMaterial Flow
SCOR Level 1
Operations Operations StrategyStrategy
Analyze Basisof
Competition
SCOR Level 2
Configuresupply chain
AlignPerformance
Levels, Practices, and Systems
Implementsupply chain
Processes and Systems
Implementsupply chain
Processes and Systems
SCOR Project Roadmap•Competitive Performance Requirements•Performance Metrics•Supply Chain Scorecard•Scorecard Gap Analysis•Project Plan
•AS IS Geographic Map•AS IS Thread Diagram•Design Specifications•TO BE Thread Diagram•TO BE Geographic Map
InformationInformationand Work Flowand Work Flow
•AS IS Level 2, 3, and 4 Maps•Disconnects•Design Specifications•TO BE Level 2, 3, and 4 Maps
Develop, Develop, Test, and Test, and Roll OutRoll Out
•Organization•Technology•Process•People
SCOR Level 3
Figure 10. SCOR Roadmap (From: Ref. 23)

38
Figure 11. SCMC’s “As-Is” Organization
Figure 12. SCMC’s “To-Be” Organization
Director, SCMC
Deputy, SCMC
Material MgmtDept
Storage &Distribution Dept
Centralized SecRep Maintenance Mgmt Dept
Business MgmtDept
War ReserveDept
Director, SCMC
Deputy, SCMC
Supply ChainIntegration Dept (Enable)
Data Mgmt DeptSource Mgmt DeptSupply ChainPlanning Dept
Maintenance Directorate (Make orMaintain)
Material &Distribution Mgmt Dept(Deliver)

39
Soon after physical establishment of the departments,
some department IPTs began meeting to map out process
levels four and beyond. Currently, this level of
organizational mapping has been completed for some of the
processes in M1, S1, and P3. To map such processes, the
evangelist, other facilitators, and department supervisors
met one on one with personnel to gain more detailed
knowledge of the specific processes to be mapped. This
preparatory work completed prior to the IPT session
permitted a more fluid meeting to occur when actually
mapping the process. Involvement of the personnel directly
responsible for a process was a must. This was especially
important as SCOR terminology significantly diminishes
after level three. [Refs. 14, 15]
Thus far, in mapping the “As-Is” organizational
processes, the following disconnects and gaps have been
identified: [Ref. 7: p. 13]
- Supply chain planning activities were
decentralized throughout the organization
- SCMC lacked a coherent capability to measure
performance/execution of material management,
distribution, and the overall supply chain
- SCMC lacked a coherent capability to manage
supplier performance
- Customer relationship management was
decentralized throughout the organization
- Material management and storage/distribution
functions were not aligned
Again, it should be emphasized that SCMC, as of
November 2003, was still mapping the general processes of
its organization. Once completed, the organization’s

40
process mapping, acting as a baseline, will greatly
facilitate the efforts in mapping supply chains.
Furthermore, in mapping individual supply chains, SCMC will
be able to establish an “As-Is” baseline from which to work
toward the “To-Be” objective. At this time, SCMC only had
an aggregate data view of their inventory. In other words,
SCMC cannot measure the performance of individual supply
chains, only some of the performance of their entire
inventory as a whole. [Ref. 15]
In reviewing what has occurred so far with the SCOR
development process as of December 2003, SCMC has
identified some things that went well as well as things
that could have been done differently. Things that went
well include the following: [Refs. 42, 47]
- Leadership support
- Logistics of reorganizing (e.g., staffing,
physical movement)
- Documenting the “As-Is” processes
- Identifying metrics
- Applying the SCOR methodology to the recent
“global sourcing plan” (In October 2003, during
the reconstitution phase at the conclusion of
Operation Iraqi Freedom, SCMC’s departments
developed and have been executing a sourcing plan
to meet the Principal End Item (Class VII)
material shortfalls for seven Maritime
Prepositioning Force ships.)
On the other hand, things that could have been done
differently include the following: [Refs. 42, 47]
- Designed configuration of supply chains (e.g.,
trucks, suppliers, customers)

41
- Developed Corporate Supply Chain Strategy
- Established a shared information database
- Training (Supply Chain Management/Change
Management/Strategic Process Management)
Despite these problematic areas, SCMC has been
aggressively working to make the necessary adjustments and
improvements. Rapidly recognizing its crucial role within
SCMC, SCID has quickly adapted and recently formed a
“Supply Chain Process Management” capability.
Additionally, SCMC personnel have been actively
communicating their transformation effort to the operating
forces and the supporting establishment during all visits
and conferences. [Ref. 42]
C. MODEL DEVELOPMENT IN SOURCE MANAGEMENT DEPARTMENT
When SCMC personnel moved to their assigned
departments, a greater desire to map level four/five
processes emerged as personnel saw that the reorganization
had become a reality. The Source Management Department
began to press forward in this respect, drafting four/five
level process maps for two categories of S1 (Source Stocked
Product) and the Warranty process. One week’s worth of
effort was required to complete one of SMD’s level
four/five process maps. [Ref. 15]
The Source Management Department (SMD) has been broken
down into three branches: Source Enable and Assessment,
Depot Maintenance Management and Execution, and Source
Management and Contractor Logistics Support. Two of the
branches were further delineated into sections. The Source
Enable and Assessment Branch is comprised of the Source
Enable/Business Rules Section and the Source

42
Assessment/Relationship Management Section. The Source
Management/Contractor Logistics Branch consists of the
Retail Source Management Section, the Third Party Logistics
Management Section, and the Wholesale Sourcing Section.
[Ref. 16]
To conduct the more detailed process mapping, SMD used
the software program Microsoft Visio. Additionally, ISO
(International Organization for Standardization) 9000’s
Post Production Systems Management Standard Procedure
(PPSMSP) format was used to document the procedures of the
process. Microsoft Visio is a flow chart program that maps
the flow of activities within a process and puts the
activities in swim lanes. The swim lanes demonstrate which
department or organization is responsible for a given
activity within their lane. Solid lines represent primary
flows in a process; whereas, dashed lines represent
secondary flows. Figure 13 demonstrates how Visio was used
to map the draft version of Wholesale Sourcing (Procurement
Buys) for S1. The mechanisms in the bottom swim lane
indicate what technology or means were used to move from
one activity to the next in the flow chart. PPSMSP is a
common industry format used to capture procedures. The
paragraph numbers used in PPSMSP have been inserted in the
flow chart boxes in Visio for reference. The descriptions
of the corresponding paragraph numbers are found in the
draft version as shown in Appendix A. [Ref. 16]
For SMD’s Source Enable and Assessment Branch and
Source Management/Contractor Logistics Branch, the next
critical step will be to map the Enable Source level
four/five processes, to include: ES2 (Assess Supplier
Performance), ES7 (Manage Supplier) Network, and ES9

43
(Manage Supplier Agreements). A draft version showing
these level three processes can be seen in Figure 14. In
past years, these processes have not been a focused effort
and therefore are currently considered a vital disconnect
in optimizing supplier performance. This author was asked
by the Integration Department to provide recommendations
regarding the metric development of these key processes,
which will be addressed in the recommendations section
later in this document. [Refs. 15, 16, 17, 21]

44
Figure 13. Procurement Buys Level Four Mapping and More (From: Ref. 29)

45
Figure 14. Level Three SMD (From: Ref. 29)

46
D. BALANCED SCORECARD IMPLEMENTATION
In 2002, Marine Corps Material Command and Logistics
Bases Command began working separately with the Balanced
Scorecard framework. In May 2003, Logistics Command
(LOGCOM) was created with the merger of Material Command
and Logistics Bases Command. The development of the
Balanced Scorecard continued with LOGCOM. In July 2003, an
executive core team (GM-15s, Colonels, and many subordinate
leaders) convened to begin identifying objectives within
the four perspectives that supported LOGCOM’s vision and
mission. Objectives were defined and potential supporting
measurements were identified. After this session, the core
team members (lower-level subordinate leaders) and subject
matter experts were tasked with the following: [Ref. 41]
- Define the new measures and formulas
- Identify whether data is available to support the
measures and where the data will come from
- Propose a target for each measure
- Propose initiatives needed to reach the targets
- Present proposal to the Executive Team for
approval
Upon reconvening in August, the core team further
developed and refined the objectives, the mapping
relationships between the objectives, definitions of the
objectives, measurements and their definitions. [Ref. 13]
During the week of 8-12 September 2003, the Balanced
Scorecard Collaborative assisted LOGCOM in “developing the
reporting format and beginning the data collection
identification process.” [Ref. 13]
Throughout the remainder of September, then October,
and into the first half of November, the core team members
47
continued collaborating together and with subject matter
experts to better define strategic objectives, map
relationships between the objectives, define objectives,
and identify and define appropriate measurements and their
targets. On 17 November, with the CG of LOGCOM in
attendance, the executive core team reconvened for a second
time to review core team progress and receive further
guidance from the CG. From this meeting, the Director of
SCMC returned with guidance to his subordinates to begin
the data mapping, to revisit some of the strategic
objectives and measures, to begin sourcing the data, and to
brief him on these developments prior to the next executive
core team meeting in December. [Refs. 26, 27, 28]
In the end, when the CG of LOGCOM gives the core team
a “thumbs up” on their final Balanced Scorecard product, a
cascading effect will then occur. SCMC will establish a
core team to be responsible for delegating to the
departments the measures and data required to provide for
the scorecard. As this occurs across the various
departments and sections throughout LOGCOM, the subordinate
commands of LOGCOM will then begin providing data for the
measurements in support of the objectives identified on the
Balanced Scorecard mapping. The 14 November draft version
of the mapping relationships of LOGCOM’s objectives can be
seen in Figure 15. An example of an objective, its
measure, calculation, and target can be seen in Figure 16,
another 14 November draft version. [Refs. 26, 27]

48
Figure 15. LOGCOM Mapping (From: Ref. 26)

49
Figure 16. Objective, Measure, Target (From: Ref. 26).

50
THIS PAGE INTENTIONALLY LEFT BLANK
51
V. RECOMMENDATIONS
To address the sponsor’s request for recommendations
on assessing supplier performance and managing the supplier
network, the author offers the following. Note that while
these recommendations are informed by the research case
just reported, they do not necessarily all follow directly
from it. The goal of the research was an explanatory case
study of the current state of the change process at SCMC.
These recommendations are incorporated at the sponsor’s
request. The audience for the explanatory case study are
those outside SCMC who wish to know more about the
implementation of the SCOR model and the implementation of
the Balanced Scorecard at SCMC. The audience for the
recommendations is SCMC. Serving a dual audience in this
way (with a divided document) would be unusual in a
document whose sole focus was a research product (e.g., a
thesis). However, it is one of the strengths of an applied
MBA project that the project is more flexible; it can serve
in this case both a descriptive research requirement, and a
direct sponsor request.
A. REALIGNMENT
As SCMC has just been organized according to the SCOR
model’s five management process areas of plan, source,
make, deliver, and return, SCMC should more distinctly
transition into an organization based on supply chains,
using the SCOR model for its primary purpose as designed by
the SCC. In adapting to this organization, the Supply Chain
Integration and Data Management Departments would continue
as currently organized, to include SCID’s new “Supply Chain

52
Process Management” capability (an opportunity to maintain
functional integrity with plan, source, make, deliver,
return cells through the development of guidelines based on
current best practices and through the education of Weapon
System teams). [Ref. 46: p. 234] However, the remainder
of SCMC would be organized by Table of Authorized Material
Control Number (TAMCN)/Commodities into departments of
Alpha (Computer/Electronics), Bravo (Engineer Gear), Delta
(Motor Transport), and Echo (Ordnance). The departments
would be further broken down into Functional Area (FA)
sections. Finally, each FA would be composed of Weapon
System (WS) teams. The personnel currently working in the
SCOR-based management process departments (Supply Chain
Planning, Source Management, Material & Distribution
Management) would be integrated into cross-functional WS
teams. By transforming in such a way, SCMC would be more
aligned down through the Intermediate Maintenance
Activities (IMAs) to the weapon system owners (the
warfighters). For years, the IMAs have already been
organized by commodity: Motor Transport Maintenance
Company (MTM), Engineer Maintenance Company (EMC), Ordnance
Maintenance Company (OMC), and Electronics Maintenance
Company (ELMACO). Despite SCMC’s lack of jurisdiction,
SCMC should also seek for the intermediate supply
activities to also align themselves with the commodity-
based IMAs, similar to what the Material Readiness
Battalion in Okinawa has done.
Subsequent to this organization, the team leaders
would then cross-train their personnel in all management
process areas, as they now will have the resident expertise
available in the teams to do so, and build more multi-

53
skilled teams. [Ref. 31] Concurrently, the teams would map
the supply chains for their systems. This would align the
warfighter completely through to the Program Manager, as
well as the suppliers. In being assigned to a WS, these
teams will also identify early on all of their Principal
End Items (PEIs), Sec Reps, Consumables, and associated
suppliers, manufacturers, and warfighters.
As the Supply Chain Manager of the Marine Corps,
SCMC’s weapon system teams would take the lead in managing
the supply chain for their particular weapon system, to
include all plan, source, make, deliver, and return
management process activities. These teams will play a
proactive role in identifying and meeting the supply chain
needs of the warfighters, intermediate-level activities,
depot-level activities, and even those of the program
managers (especially as the PMs begin involvement in the
development, test, and evaluation phases of new weapon
systems).
To develop confidence in such a design, SCMC should
quickly form at least a couple of weapon system teams and
begin aggressive management of the supply chains of their
weapon systems. As already mentioned, this initially means
mapping their supply chains from suppliers completely
through to the warfighter. The teams must know everything
there is to know about their supply chains and be
intimately involved in coordinating all plan, source, make,
deliver, and return activities. These teams must also have
the authority to act and make decisions quickly. [Ref. 31]
This more apparent line of authority in the supply chain
will further create a supply chain of personnel more

54
accountable for their weapon system and its performance (an
opportunity to increase customer satisfaction among the
warfighters). Consequently, the Marine Corps Equipment
Readiness Information Tool (MERIT), which is currently
providing readiness information based on TAMCN and FA,
appears to be a logical medium through which to establish a
performance metrics framework. Furthermore, Chief Warrant
Officer-3 Chris Peterson has already begun working with
MERIT’s current developer, Concurrent Technologies
Corporation (CTC), to discover, map, and prioritize all
available supply and maintenance data; followed by
identifying gaps and then enabling the pulling of
information for subsequent performance measurements. [Ref.
32] In so doing, SCMC will then be better prepared to
measure supply chains and provide data for a BSC
“dashboard” (interface screen displaying the few key
metrics for an organization), as units at Camp Lejeune,
North Carolina have already successfully done with OROS
technology software. SCMC should look to learn more about
this implementation in order to potentially save themselves
significant amounts of time and money. [Ref. 36]
Finally, the WS teams should also manage the Sec Reps
participating in the 4th Echelon of Maintenance (EOM)
Outsourcing program (a program whereby the Reparable Issue
Point at the intermediate-level of supply sends dead lined
Sec Reps in need of 4th EOM through Raytheon [3PL
contractor] to an outsourced supplier to be remanufactured)
due to their specific supply chain ownership. [Ref. 32]
B. COLLABORATION
In the spirit of lean supply and the Collaborative,
Planning, Forecasting, and Replenishment (CPFR) process,

55
the WS teams should develop collaborative relationships
with the entire supply chain, most notably the suppliers,
in order to lay the foundation for success. [Refs. 31, 33]
To begin with, the WS team (working with the Contract
Directorate) and its suppliers would lay out the ground
rules in the form of a contract detailing price
determination, quality assurance, ordering and delivery,
proprietary rights, data to be shared, order minimums and
multiples, lead times, safety stock rules, emergency order
criteria, and order intervals, just to name a few.
Furthermore, this joint agreement would be developed as a
long-term contract of at least three to five years. This
contract would create the foundation for a collaborative
relationship facilitating future communication and
coordination across the supply chain, some principles SCOR
espouses in order to overcome inefficiencies. [Refs. 1,31,
33]
Second, the WS team would determine a demand forecast,
communicate it to the supplier, collaborate together on the
demand forecast, and then use it as a baseline for an order
forecast. The key, prior to communicating the forecast to
the supplier, would be to coordinate closely with the stock
control officers at the intermediate and depot-level
activities in order to receive the most valid demand
information. In turn, these activities must work closely
with the warfighters to most accurately create a demand
picture based on operational schedule and key variables
such as CAXs, deployments, and money; then provide demand
forecast input to the WS team. Thereafter, the WS team
would determine an order forecast following the same steps

56
as the demand forecast and then generate an order through
the supplier. [Refs. 31, 33]
During a recent visit to the Naval Post Graduate
School, the Director of the Defense Logistics Agency (DLA)
stated that the Army could not give DLA a demand forecast
prior to Operation Iraqi Freedom (OIF). This greatly
increased the risk realized by the buyer (Army) and the
seller (DLA). In the same light, SCMC’s WS teams and their
suppliers could greatly reduce risk by employing the CPFR
process, in addition to decreasing inventory levels across
the supply chain and increasing customer service
responsiveness. [Ref. 33]
As mentioned previously with the contractual
agreement, information should be shared and visible between
SCMC and its suppliers, as well as the remainder of the
supply chain. [Ref. 33] The MERIT system would likely be
a good medium to employ in sharing information from the
Marine Corps view, as all units can gain access to the
system; and the system is already organized by TAMCN, FA,
and WS.
Furthermore, the number of suppliers for a given
system or component should be minimized, but sole source
should be avoided except for highly complex components. In
making such decisions, the suppliers need to be graded
regularly according to predetermined performance metrics
agreed to in the collaborative contracts. CPFR offers
several potential metrics, which can be seen at their
website. [Ref. 34] The grades will be visible to all
suppliers, so they can view where they stand compared to
other suppliers. Where performance is sub-standard in a
57
multiple supplier situation, a percentage of work should be
shifted to another supplier until the sub-standard
supplier’s performance level has risen. This is done to
prevent the suppliers from letting down on quality or
deliver reliability. Again, these are all best practices
recommended by SCOR, designed to increase supplier
performance. [Refs. 1, 31]
Despite the minimal use of lean thinking and CPFR
throughout the DOD, many DOD suppliers have begun
implementing these principles. Moreover, the Office of
Supply Chain Integration, via their DOD Supply Chain
Management Implementation Guide, did include CPFR among its
recommended logistics strategies for implementation. [Ref.
2: pp. 83-85] And, CPFR is currently a prominent best
business practice in the SCOR model’s planning section.
[Ref. 1: pp. 15-16] SCMC should look to begin immediate
implementation of these principles with some designated
supply chains before following up with a complete rollout.
C. SUPPLIER ASSOCIATIONS
SCMC should consider creating a supplier association
for key supply chains. This organization would include all
of that supply chain’s primary suppliers and key suppliers-
of-suppliers. At least annually, SCMC would invite all
members of the association to come together for a week in
Albany, GA or another predetermined site. During this
week, suppliers would disseminate important concepts that
have helped make them successful, such as statistical
process control (SPC), total quality control (TQC), value
analysis, value engineering, and other cutting edge
concepts. This sharing of ideas would help the performance
of all suppliers. [Ref. 31]

58
D. ACQUISITION PROCESS
As many manufacturers and suppliers have discovered
through the application of lean principles (in use for
decades among Japanese automotive and electronics firms),
much of the supply chain success should begin during the
acquisition process when a new weapon system or PEI is
added to the Marine Corps inventory. Realizing this may be
beyond their control, the SCMC should still push the
program managers at Marine Corps Systems Command to more
fully consider logistics during the Integrated
Product/Process Development (IPPD). A reliable system that
does not break does not need to be repaired or spared.
[Refs. 31, 35]
During development and testing, engineers from the
various supplier tiers of the given system should be on
site to identify and fix problems early to maximize
reliability of the system and to save on life cycle costs
and spares later. Even after regular production and
distribution has begun, these engineers should be placed in
the depots and possibly the IMAs to further identify and
solve problems at the earliest possible time in the life
cycle. Furthermore, all engineering designs should be
shared early on throughout the tiers of suppliers to ensure
a better, more reliable system in the end. [Ref. 31]
The contractual agreement spoken of earlier by the
author would preferably be put in place during the
acquisition phase to facilitate a better product and
process from the beginning. [Ref. 31] This agreement
would also include “smart shutdown” procedures (e.g.,
accounting for and maintaining all design drawings,

59
production equipment, and additional information to restart
production). Given the Marine Corps’ difficulty in
obtaining repair parts for old and obsolete radios, this
would be a preferred tactic. [Ref. 35] Also, to further
prevent shutdown, the Marine Corps should be actively
looking for trusted Allies interested in procuring the PEIs
they use. In this way, continued production to meet
foreign military sales would enable greater access to
repair parts when they might typically be obsolete.
Currently, the Defense Acquisition University’s (DAU)
Research Fellows are researching and developing a “lean
practices implementation process”, due out in June 2004.
All Post-Graduate Acquisition students at the Naval Post-
Graduate School currently study the trilogy of “lean
thinking” books (the Logistics students study only the
second book), one of which has been referred to often in
this document. Therefore, the beginnings of a “lean
thinking” foundation, is being established among our
officers, which could have a considerable impact in the
future. SCMC should begin implementation of lean
principles within their own sphere of influence and then
push for our own Acquisition community to do the same when
DAU releases their “lean practices implementation process”
in June 2004.
E. CONCLUSION
Within this document, the SCOR model was introduced,
as well as ILC’s and Kaplan and Norton’s BSC. There is
significantly more literature that the reader would be
encouraged to research. Additionally, the impetus for
SCMC’s change initiatives was discussed. SCMC’s SCOR and
BSC implementation steps were described. Finally,

60
recommendations were proposed to establish a foundation for
successful metric development in assessing supplier
performance. In the end, with the implementation of SCOR
and BSC with the aforementioned recommendations, the three
goals for implementing SCOR will be met:
- Overcome inefficient processes
- Solve poor overall customer satisfaction
- Improve supply chain performance (e.g., improved
cycle times, synchronized inventories)
The author recommends that a study be conducted two
years hence to determine the effectiveness of SCOR and BSC
implementation in meeting those three goals.

61
APPENDIX A. MARINE CORPS LOGISTICS ATTRIBUTES: (REF. 4)
Where applicable and achievable, these six attributes
and their associated metrics are currently being used as
part of the Expanded Validation (EV) plan for ILC’s
Operational Architecture (OA). II Marine Expeditionary
Force (MEF) units are presently participating. The units
have been given guidance on what to measure, but not how.
The “how” will be documented throughout and assessed later.
As of 2003, the EV plan, which began in 2001, is still only
in the beginning phase. Furthermore, not all of the
identified metrics are being employed during the early part
of the EV plan and not all have been defined.
Nevertheless, as the EV plan progresses, the definitions,
calculations, and source collection processes for each
metric will be evaluated, documented, and adjusted where
necessary.
1. Reliability: Quality Order Fulfillment
QOF= [# Repair Orders * %QOF (Maintenance)] + [#
Requisitions * % QOF (Supply)]/[(# Repair Orders) + (#
Requisitions)]
The % QOF (Maintenance) and % QOF (Supply) are tier-two
metrics.
%QOF (Maintenance)= (# Orders Repaired Satisfactorily/ #
Repair Orders) * (# Repair Orders Delivered By Agreed Upon
Date/ # Repair Orders)

62
% QOF (Supply)= (#Orders Delivered Complete/ # Orders) * (#
Orders Delivered By Agreed Upon Date/ # Orders)
All metrics used in the formulas to calculate % QOF
(Maintenance) and % QOF (Supply) are tier-three metrics.
[Ref. 4: Annex B]
2. Responsiveness: Total Supply Chain Cycle Time
or Total Fulfillment Cycle Time (TFCT)
TFCT= (Request Cycle Time) + (Order Fulfillment Cycle Time)
Request Cycle Time (ReCt) and Order Fulfillment Cycle Time
(OFCT) are tier-two metrics.
ReCT= Time elapsed prior to approval of the request
ReCT= Request Approved Date/Time – Date/Time of Request
OFCT= (Order Management Section Cycle Time) + (Maintenance
Cycle Time) or (Purchase Cycle Time) or (Order and Shipping
Time) + (Transportation Time)
Order Management Section Cycle Time (OMSCT), Maintenance
Cycle Time (MCT), Purchase Cycle Time (PCT), Order and
Shipping Time (OST), and Transportation Time (TT) are tier-
three metrics.
OMSCT captures the time elapsed from when a request is
approved at the supported unit until a requisition or
repair order is created.

63
OMSCT= Requisition or Repair Order Created Date/Time –
Request Approved Date/Time
MCT is the difference in time from when a corrective
maintenance order is created and when the end item is ready
to send back to the supported unit.
MCT= Date Repair Complete – Date Repair Order Created
PCT measures the requisition fulfillment cycle time for all
requisitions that are not in stock when the order is
received, and must be sourced through commercial or
governmental agencies.
PCT= Date Requisition Ready to Ship – Date Requisition
Created
OST measures the requisition fulfillment cycle time for
requisitions that are in stock when the order was received.
OST= Date Requisition Receipted – Date Requisition Created
TT measures the time from when the product is ready for
shipment until the time that the supported unit receives
it.
TT= Date/Time of Delivery – Date/Time Ready to Ship

64
3. Flexibility: Logistics Chain Capacity
or Fulfillment Capacity (FC)
FC is the capacity to which production, sourcing, and
services can surge in order to meet a 20% increase in
demand due to unexpected requirements.
FC consists of four separate tier-three metrics: Upside
Make Capacity (UMC), Upside Warehouse Capacity (UWC),
Upside Purchase Capacity (UPC), and Upside Transportation
Capacity (UTC).
UMC measures the ability of the intermediate maintenance
organization to surge the maintenance effort on a daily
basis.
UMC= (Maximum Output – Output) / Maximum Output
UWC measures the ability of warehouse operators to surge to
meet an increase in supported unit requirements. It is
composed of two tier-four metrics: Upside Warehouse Space
Capacity (UWSC) and Upside Personnel Capacity (UPeC)
UWSC measures the amount of excess warehouse space
available for surge warehouse operations on a daily basis.
UWSC= Total Warehouse Space Empty / Total Warehouse Space
UpeC measures the amount of personnel time available for
surge warehouse operations on a daily basis.

65
UpeC= (Total Hours Personnel Available for Work – Actual
Hours) / Total Hours Personnel Available for Work
UPC measures the ability of the procurement management
center to cover supported unit demand for items not held by
the inventory manager.
UPC= [# of Line Items Required (Not Stocked)] – (# of Line
Items Not Stocked but Covered by Contract) / # of Line
Items Required (Not Stocked)
UTC is the percentage of transportation assets available to
meet an unexpected surge in transportation demand, measured
daily.
UTC= (Transportation Asset Hours Available – Transportation
Asset Hours Used) / Transportation Asset Hours Available
4. Readiness: Operational Availability (Ao)
Ao represents the percentage of equipment that is mission
ready.
Ao= Uptime / Total Time
or
Ao= Uptime / (Uptime + Downtime)
or
Ao= Uptime / (Uptime + TTR + SRT + DART)

66
Uptime and Downtime are tier-one metrics. TTR, SRT, and
DART are considered tier-three metrics.
PEIs= Principal End Items
Total Time= number of days in the month * Total number of
PEIs
Downtime= cumulative number of days PEIs had corrective
maintenance tasks opened
Uptime= Total Time – Downtime
TTR= Time To Repair (The time an end item spends in the
maintenance facility for corrective maintenance, and is not
awaiting parts.)
SRT= Supply Response Time (Measures the amount of time
maintenance waited for supply support.)
DART= Distribution and Administrative Response Time (The
portion of downtime not attributable to TTR or SRT.)
5. Assets: Asset Utilization (AU)
AU describes the physical resources available to provide
logistics supports.
AU is comprised of three distinct tier-two metrics:
Maintenance Asset Utilization (MAU), Supply Asset

67
Utilization (SAU), and Transportation Asset Utilization
(TAU).
Due to the metrics being separate components, close
monitoring needs to occur to observe compensation practices
and effects with the separate measures as they affect the
aggregate measure.
MAU= [Maintenance Personnel Utilization (MPU) + Maintenance
Workspace Utilization (MWU) + Maintenance Equipment
Utilization (MEU)] / 3
MPU measures the percentage of time maintenance Marines
spend doing maintenance activities.
MPU= Total Hours Spent on Maintenance / Total Hours
Available
MWU measures the amount of space available to perform
maintenance at any generic location.
MWU= Total Square Feet of Space Used / Total Square Feet of
Space Allocated
MEU measures the amount of maintenance equipment being used
against the total amount of maintenance equipment
MEU= Total Amount of Equipment Used / Total Amount of
Equipment On Hand

68
SAU= [Supply Personnel Utilization (SPU) + Warehouse Space
Utilization (WSU) + Inventory Utilization (IU)] / 3
SPU= Total Time Supply Marines Spend on Supply Tasks /
Total Time Available Based on Total Supply Marines
WSU= Total Square Feet of Warehouse Space Used / Total
Square Feet of Warehouse Space Available
IU= To Be Determined (Not yet defined, nor a calculation
determined)
6. Expenses: Total Logistics Chain Expense
or Total Logistics Expense (TLE)
TLE is captured to reflect how organizations apply
financial resources to the maintenance, supply sourcing,
and distribution efforts.
TLE is composed of Total Maintenance Expense (TME), Total
Supply Expense (TSE), and Total Transportation Expense
(TTE).
TME measures all financial resources applied to the
maintenance effort.
TSE measures all financial resources applied to inventory
management.
TTE measures all financial resources applied to
distribution management.

69
APPENDIX B. SWIM LANE PROCESSES (REF. 21)
Wholesale Sourcing (Procurement Buys)
Actionee
Action Note: This process supports MARCORSYSCOM life cycle management.
Commercial Source of Supply
4.6.1 Commercial organization responsible for accepting material and respond to directed requisitions to include; receive source requirement, provide status, deliver source product, issue billing adjustment.
4.6.1.1
Accept Contract – Upon solicitation and satisfactory quotes received by Contracts Department, proposals are submitted. Inputs – Solicitation, DD 1155 Outputs – Signed contract Mechanism – DD 1155
4.6.1.2
Deliver source product – The series of tasks including placing products onto vehicles, generating the documentation necessary to meet internal, customer, carrier and government needs, and sending the product to the customer in accordance with contract. Inputs – Shipping documents (DD 250) Outputs – Delivered product (with Government Bill of Lading (GBL)) Mechanism – DD 250, GBL Note: FOB/FOD will impact payment process.

70
4.6.1.3
Invoice & Receive Payment – A copy of the invoice is forwarded to DFAS for payment. Payment is received from DFAS upon payment authorization. Inputs – Sourced product shipping documentation Outputs – Payment Mechanism – Document
4.6.2 Establishes due-ins and receive secondary items shipped by Commercial sources of supply (SOS).
4.6.2.1
Establish due-in (DUS) - As buys are released from SCS, “DUS” transactions will load a due-in record to DLA. Inputs – DDS Outputs – Due-in record (DUS) Mechanism – DAAS, DSS
4.6.2.2
Receipt from Commercial SOS (DUS) – Material receipt. Inputs – Due-in record (DUS), Sourced product Outputs – Receipt verification (DD 250) Mechanism – DSS, Shipping document (Signed DD 250)
DLA
4.6.2.3
Provide Receiving Report – DLA is required to provide signed copy of receiving report to Contracts, Source Management Departments and DFAS. Inputs – Receipt verification (DD 250) Outputs – Delivered receipt verification (Signed DD 250) Mechanism – DD 250
Contracts Department
4.6.3
Receives source requirements, funding appropriation, executes and administer contracts.

71
4.6.3.1
Receives initiated source document – Data management department provides initial funding authorization, which authorizes the solicitation process. Inputs – Document (Name?) Outputs – Initial appropriation Mechanism – Document
4.6.3.2
Receives Source Requirement (ZBM) – Funds were validated and approved. Inputs – ZBM Outputs – Solicitation authorization Mechanism – SS05, Document
4.6.3.3
Request Funding Appropriation – Upon selection of supplier actual funding appropriation is requested. Inputs – Source selection Outputs – Request for funding Mechanism – Document
4.6.3.4
Contract Execution – Includes solicitation, evaluation, source selection and contract award. Inputs – Source selection Outputs – Contract award Mechanism – DD 1155
4.6.3.5
Contract Administration – Contract monitoring, problem resolution, and certifications. Inputs – Contract (DD 1155) Outputs – Performance review Mechanism – DD 1155
4.6.3.6
Closeout Contract Inputs – Certification Outputs – Closed contract Mechanism – DD 1155

72
4.6.4 Receives copies of contracts, invoices, automated issue and receipt transactions that records and accumulates all data required for vendor payments, financial analysis of inventory movement and the control and account for cash resources as well as financial inventory balances.
4.6.4.1 File Contract – Receives copy of contract in anticipation of making payment. Input – Copy of contract (DD 1155) Output – Contract on file Mechanism – DD 1155
DFAS
4.6.4.2 Authorize Payment – Receives invoice from contractor and makes payment in accordance with payment terms. Input – Certified invoice, Receiving report (DD 250) Output – Payment voucher Mechanism – TBD
4.6.5 Establishes courses of action over specified time periods that represent a projected appropriation of supply resources to meet sourcing plan requirements. Distributes source plan to Sourcing Department for execution, along with supporting documentation (i.e. special projects letter of requirements, justification and approval (J&A), phasing plan, etc.).
SCMC, Planning
4.6.5.1 Distribute Sourcing Plan Input – Planning decisions and policies (Phasing Plan) Output – Sourcing plan Mechanism – SCS, Excel spread sheet, Word document

73
4.6.6 Execute approved source plan (Procurement Buys), schedule product deliveries, request funding, monitor scheduled deliveries, monitor receipt transaction posting from storage activity, and as necessary manage exceptions.
4.6.6.1 Execute approved sourcing plan - Approved sourcing plan is received from Planning Department for execution. Ensure all necessary supporting documentation accompanies the Source Plan. Input – Source Plan check list Output – Validated Source Plan Mechanism – Excel Spread Sheet, Word Document
4.6.6.2 Schedule Product Deliveries (DDS) – In SCS a DDS transaction will be utilized when submitting Procurement buys. Input – Validated Source Plan, DDS induction Output – Pending “MA” controlled exception (Suspended DDS), Funding request Mechanism – Excel Spread Sheet, SCS, Printed copy “MA” exception
SCMC, Sourcing
4.6.6.3 Justification & Approval (J&A) Required – To procure using other than full and open competition. Technical and requirement certifications must be complete prior to submission. Input – J&A document Output – J&A accepted by Contracts Department Mechanism – Word Document
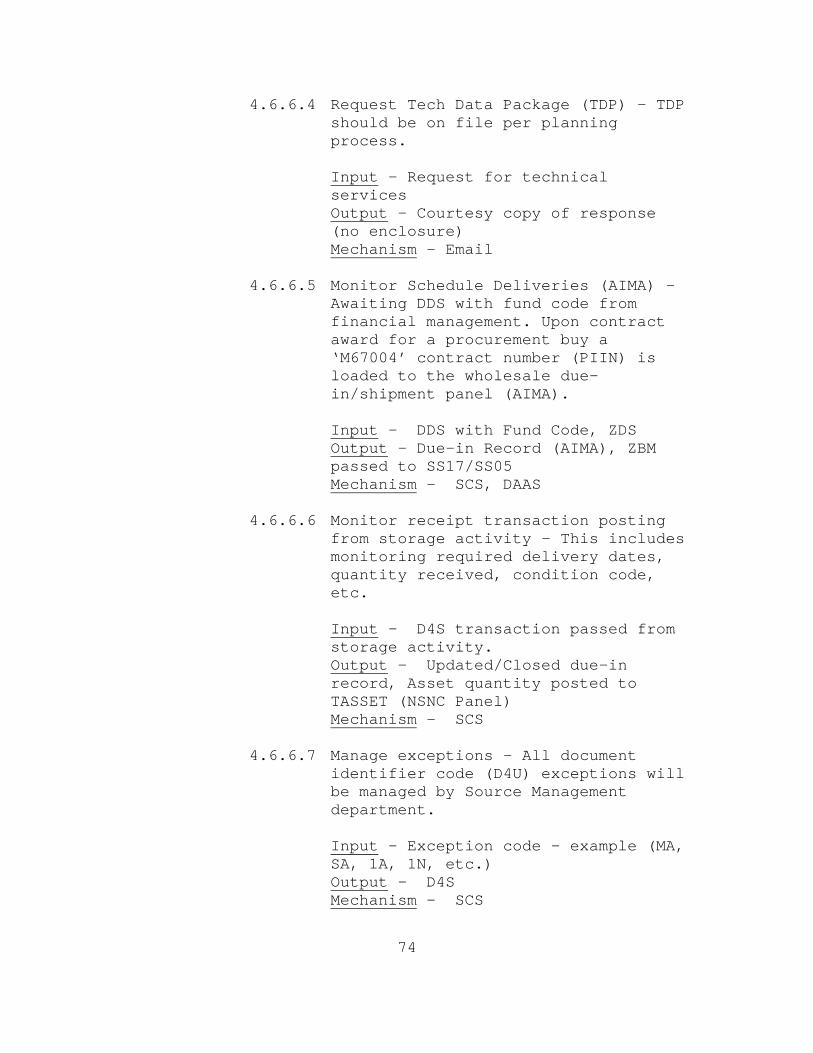
74
4.6.6.4 Request Tech Data Package (TDP) – TDP should be on file per planning process. Input – Request for technical services Output – Courtesy copy of response (no enclosure) Mechanism – Email
4.6.6.5 Monitor Schedule Deliveries (AIMA) – Awaiting DDS with fund code from financial management. Upon contract award for a procurement buy a ‘M67004’ contract number (PIIN) is loaded to the wholesale due-in/shipment panel (AIMA). Input – DDS with Fund Code, ZDS Output – Due-in Record (AIMA), ZBM passed to SS17/SS05 Mechanism – SCS, DAAS
4.6.6.6 Monitor receipt transaction posting from storage activity - This includes monitoring required delivery dates, quantity received, condition code, etc. Input – D4S transaction passed from storage activity. Output – Updated/Closed due-in record, Asset quantity posted to TASSET (NSNC Panel) Mechanism – SCS
4.6.6.7 Manage exceptions – All document identifier code (D4U) exceptions will be managed by Source Management department. Input – Exception code – example (MA, SA, 1A, 1N, etc.) Output – D4S Mechanism – SCS

75
4.6.7 Establishes due-ins with associated project code, receive, transfer secondary items shipped by Commercial sources of supply (SOS) for special projects.
4.6.7.1 Establish due-in (DDS w/ project code) – Dues are established for special project requirements per planning agreements. Inputs – Procurement document (i.e. contract, MIPR) Outputs – Due-in record (DDS) Mechanism – MOWASP
4.6.7.2 Receive Product (D4U w/ project code) – Material receipt (Commercial agency). Inputs – Due-in record (DUS), Sourced product Outputs – Receipt verification (DD 250) Mechanism – MOWASP, Shipping document
SCMC, Material and Distribution Management
4.6.7.3 Transfer accepted product to appropriate stocking location. Input – Inventory location Output – Special project inventory availability Mechanism – MOWASP
SCMC, Data Management
4.6.8 Responsible for initiating source document, retrieving technical data, providing technical data, processing funds appropriation request, recording obligations, monitoring stores receipt transactions, posting expense transactions, liquidating outstanding orders.

76
4.6.8.1 Initiate Source Document (DDS) – Initial source document passed to contracts department for the purpose of committing funds. Input – T-Report (DDS “MA” exception) Output – Initiated Source Document (Committed), ZBM Mechanism – Word document, SCS
4.6.8.2 Retrieve Tech Data Package – Tech data packages reviewed during the source planning process and retrieved upon source execution. Input – Retrieval request Output – Tech data package Mechanism – JEDMICS, Email, Document
4.6.8.3 Provide Tech Data Package – Tech data packages forwarded to Contracts Department to support procurements. Input – Tech data package Output – Tech data package acceptance Mechanism – JEDMICS, Email, Document
4.6.8.4 Process funds appropriation request – Fund request are submitted by Source Department in accordance with phasing plan. Input – Funds request from Contracts Department Output – Appropriated funds Mechanism – Document
4.6.8.5 Record Obligation – Obligations recorded upon award of contract. Input – OBL transaction Output – Recorded obligation (OBL) Mechanism – SABRS

77
4.6.8.6 Monitor Stores Receipt Transaction posting (D4_) – Receipt transactions monitored to ensure Stores Accounting System updated. Input – D4_ transaction Output – Updated Stores Account Mechanism – SABRS
4.6.8.7 Post Expense – Expense transactions identifies receipts to financial management system. Input – EXP transaction Output – Expense posted Mechanism – SABRS
4.6.8.8 Liquidation – Liquidations closes outstanding orders. Input – Matching obligation, Expense, Payment Output – Liquidation Mechanism – SABRS

78
THIS PAGE INTENTIONALLY LEFT BLANK

79
LIST OF REFERENCES
1. Supply Chain Operations Reference Model Version 6.0 Supply Chain Council, Pittsburgh, PA (2003).
2. DOD Supply Chain Management Implementation Guide. Logistics Management Institute. McLean, VA (2000).
3. Office of the Undersecretary of Defense for Logistics and Material Readiness. Department of Defense Regulation 4140.1-R, DOD Supply Chain Material Management Regulation. 23 May 2003.
4. Metric Study Document. United States Marine Corps, Integrated Logistics Capability, Quantico, VA (2002-2003).
5. United States Marine Corps Logistics Enterprise Integration. “Using a Balanced Scorecard to Facilitate Logistics Chain Effectiveness”, 2003 Submission for Supply Chain Council Awards for Excellence in Supply Chain Operations, February 2003.
6. Operations Order. Supply Chain Management Center, 7 May 2003.
7. Supply Chain Management Center. “Transformation from Weapon System to Supply Chain Management”, 2003 Submission for Supply Chain Council Awards for Excellence in Supply Chain Operations, February 2003.
8. Katie Kasper and Kevin McCormack. United States Marine Corps Logistics Chain Business Transformation and Integration. Supply Chain Council, 23 May 2003.
9. Robert S. Kaplan and David P. Norton. The Balanced Scorecard. Harvard Business School Press, Boston, MA 1996.
10. Richard L. Lynch and Kelvin F. Cross. Measure Up! Blackwell Publishers, Oxford, UK 1995.
11. Marine Corps Logistics Campaign Plan. http://www.hqmc.mil/ilweb.nsf November 2003.

80
12. Building the Balanced Scorecard-Quick Reference. Balanced Scorecard Collaborative, 2003.
13. McDoniel, Patrick S. Email to the Author. 4 September 2003.
14. McDoniel, Patrick S. Interview. 24 July 2003.
15. Lawrence, Mike. Interview. 23-26 September 2003.
16. Fujimoto, Todd. Interview. 24-26 September 2003.
17. McDoniel, Patrick S. Interview. 24-26 September 2003.
18. Rudolph, Michael. Interview. 24 September 2003.
19. Stephens, Scott. Supply Chain Operations Reference (SCOR) Model Workshop Slides Revision 5.0b. Supply Chain Council, August 2001.
20. SCMC Interview. 24 July 2003.
21. Fujimoto, Todd. Email to the Author. 16 October 2003.
22. Supply Chain Operations Reference Model Overview of SCOR Version 6.0. Supply Chain Council, Pittsburgh, PA (2003).
23. Supply Chain Operations Reference Model Overview Presentation. Supply Chain Council, Pittsburgh, PA (2003).
24. Lawrence, Mike. Email to the Author. 10 November 2003.
25. McDoniel, Patrick S. Email to the Author. 17 September 2003.
26. McDoniel, Patrick S. Email to the Author. 13 November 2003.
27. McDoniel, Patrick S. Interview. 22-24 October 2003.
28. McDoniel, Patrick S. Email to the Author. 20 November 2003.

81
29. Fujimoto, Todd. Email to the Author. 22 October 2003.
30. Commandant of the Marine Corps. Marine Corps Bulletin 3000. 10 January 2003.
31. James P. Womack, Daniel T. Jones, and Daniel Roos. The Machine That Changed the World. Harper Perennial, New York: Rawson Associates, 1990.
32. Peterson, Chris. Interviews. 24-26 September 2003 and 22-24 October 2003.
33. CPFR Nine-Step Process Model. http://www.cpfr.org/documents/pdf/CPFR_Tab_2.pdf 8 December 2003.
34. CPRF Key Performance Indicators. http://www.cpfr.org/documents/pdf/CPFR_TAB_6.pdf 8 December 2003.
35. Donald R. Eaton. Lectures for MN4470: Strategic Planning and Policy for Logistics Managers. 30 September 2003.
36. Nick Perkins. Marine Corps ABC Presentation. 8 December 2003.
37. Ron Ireland. “Collaborative Planning Forecasting and Replenishment”, Oliver Wight White Paper Series, Email from Ron Ireland 13 November 2003.
38. Ron Ireland and Robert Bruce. “CPFR: Only the Beginning of Collaboration”, Supply Chain Management Review, September/October 2000.
39. Lawrence, Mike. Email to the Author. 11 December 2003.
40. Overview and Summary AV-1. United States Marine Corps Integrated Logistics Capability, Quantico, VA (2002-2003).
41. McDoniel, Patrick S. Email to the Author. 29 July 2003.
42. McDoniel, Patrick S. Email to the Author. 13 December 2003.

82
43. T. W. Lee. Using Qualitative Methods in Organizational Research. Sage Publications, Thousand Oaks, CA 1999.
44. R. Rosenthal and R. L. Rosnow. Essentials of Behavioral Research: Methods and Data Analysis, Second Edition. McGraw-Hill, Boston, MA 1991.
45. Lean Enterprise: Current Projects. http://acc.dau.mil/simplify/ev.php?ID=10362_201&ID2=DO_TOPIC 16 December 2003.
46. James P. Womack and Daniel T. Jones. Managing the Value Chain: From Lean Production to the Lean Enterprise. Harvard Business Review. Harvard Business School Publishing, Boston, MA 2000.
47. Lawrence, Mike. Email to the Author. 17 December 2003.
48. James P. Womack and Daniel T. Jones. Lean Thinking. Simon & Schuster, New York, NY 1996.
49. Toshihuro Nishiguchi. Strategic Industrial Sourcing: The Japanese Advantage. The Wharton Business School. Oxford University Press, New York, NY 1994.
50. Toshihuro Nishiguchi. Knowledge Emergence. Oxford University Press, New York, NY 2001.
51. Ireland, Ron. Email to the Author. 13 November 2003 and 16 December 2003.

83
INITIAL DISTRIBUTION LIST
1. Defense Technical Information Center Ft. Belvoir, Virginia
2. Dudley Knox Library Naval Postgraduate School Monterey, California
3. Marine Corps Representative Naval Postgraduate School Monterey, CA
4. Director, Supply Chain Management Center Marine Corps Logistics Command Albany, GA
5. Director, Training and Education MCCDC, Code C46 Quantico, VA
6. Director, Marine Corps Research Center MCCDC, Code C40RC Quantico, VA
7. Marine Corps Tactical Systems Support Activity (Attn: Operations Officer) Camp Pendleton, CA