Embed Size (px)
Citation preview

NAVAL POSTGRADUATE SCHOOL00 Monterey, California00
SSTA rp,
~RADMU
TIIESISCONSTRUCTION OF A FORMAL METHODOLOGY TO
REFINE A SPARES SUITE USING TIGER
by
Steven Anthony Castillo
March 1989
Thesis Advisor: W. Max Woods
Approved for public release; distribution is unlimitedDTICE l C T E9MAY 1 8 8
H1

REPORT DOCUMENTATION PAGEI
Unclassified________________ _____
S- C - P -I (A. - -J
2n DEC-ASS C.AX0 ',C AZSC-h Approved for public release;distribution is unlimited
4 cl7z \)V C C)6 '' .C 7; \.*- %,~ V 5 VOV 0p' 0;XC 4 O Z 4 -- " RX z
6a NAVZE OF PE 'ORX ORGA'. :41 O% 6 ; O; C; SV3 7 a % A V- -' %-', DX %Q, PX C- 4,(if applicable)
Naval Postgraduate School 55 Naval Postgraduate School6c ADDRESS Cir State and ZIP code) ' ;ADDPE SS ,C'>) Stale and ZIP Co~e)
Monterey, California 93943-5000 Monterey, California 93943-5000
8 a 0\ z A~ j *., SCS'E S -CC syX XS 5. D F: .A OX 0". appicabI(e)
8c 4ADD ES$(City State a-rd ZIP Code) SC C) X ,
(Inc'>oe S c Class ,cat on;CONSTRUCTION OF A FORMAL METHODOLOGY TO REFINE A SPARES SUITE USING TIGER
2 1 sr; %XA - - -:,
CASTILLO, Steven Anthony'3a -: EC 5P14?A F PC,,- Year Mont a) 7 A
*Master's thesis POV TO __ 1989, March 74tes X~~O~~.,Lie views expressed in tis tesis are Eose or 7e
author and do not reflect the official policy or position of theDep~artment of Defense or the U.S. Government.
(3A C-S?'8 %BJECr TER'ZS 'Continue on reverse if nceCSSar, ana i,entf b b'9c( r~m:Ac'
SC C2
?- Cpc -Tiger, ACIM,"Simulation; Spares; GPS-5,Operational Availabilty,>,A0 ,> Reliability,
I Availability, COSAL9 ASOAContinue or reverse if necessary and identify by block numro.ir 1
This thesis proposes a method for setting inventory levels for asuite of spares for a ship subsystem. The method extends the one proposedby Judge and Leutjen -Ref-l] which uses a computer simulation modelcalled TIGER to modify the levels of shipboard spare parts determinted bya sparing model. By combining TIGER and the Availability CenteredInventory Model (ACIM) , one of the coordinated shipboard allowance list(COSAL) models currently used in the U.S. Navy, our method is able toachieve the same level of operational availability for ship systems at
*less cost. -
2', S D iA Atl -P A5~A ABSACT SEC A
22aXAV QI ~~) L~ 7 r-'l i'le Area Codr) 55WW. Max Woods 408 646-2743 5W
DD Form 1473, JUN 86 Previous feditons are, obsoleter A
S (1)-L -)12-(
Approved for public release; distribution is unlimited.
Construction Of A Formal Methodology ToRefine A Spares Suite Using TIGER
by
Steven A. CastilloLieutenant Commander, Supply Corps, United States NavyB.A., University of California at Los Angeles, 1978
Submitted in partial fulfillment of the
requirements for the degree of
MASTER OF SCIENCE IN OPERATIONS RESEARCH
from the
NAVAL POSTGRADUATE SCHOOLMarch 1989
Author: ___.
Steven A. Castillo
Approved by: $. Po "W. Max Woods, Thesis Advisor
Siriphong,. awphfngp~ahich, Second Reader
Peter-Purdue, ChairmanDepartment of Operations Research
Kneal -Dean of Information and'51h sciences
ii

ABSTRACT
This thesis proposes a method for settiing inventory levels
for a suite of spares for a ship subsystem. The method
extends the one proposed by Judge and Leutjen [Ref. 1] which
uses the TIGER computer simulation model to modify levels of
shipboard spare parts that have been determined by a sparing
model. By combining TIGER and the Availability Centered
Inventory Model (ACIM), a coordinated shipboard allowance list
(COSAL) model currently used in the U.S. Navy, our method is
able to achieve the same level of operational availability,
as that of ACIM alone, for ship subsystems at less cost.
Accesnion For
DTIS T hA&I
U: 'i: v':, "ed ci
Di sr~buti _n/
Av!Inahbllity Codes!,vra t i and/or
D.!3t [ ;p'Clal
_ _ ,
iii

TABLE OF CONTENTS
I. INTRODUCTION ....................................... 1
A. HISTORICAL BACKGROUND ......................... 1
B. PROBLEM DESCRIPTION ............................ 3
C. THESIS OBJECTIVE AND SCOPE ..................... 5
II. ACIM METHODOLOGY ................................... 8
A. MODEL INTRODUCTION ............................. 8
B. ALGORITHM DESCRIPTION .......................... 10
C. MODEL SHORTCOMINGS ............................. 17
D. SUMMARY ........................................ 18
III. TIGER SIMULATION .................................... 19
A. MODEL INTRODUCTION ............................. 19
B. CURRENT USAGE .................................. 19
C. ALGORITHM DESCRIPTION .......................... 22
D. TIGER OUTPUTS .................................. 23
E. SUMMARY ........................................ 25
IV. SPARING METHODOLOGY ................................ 27
A. HYPOTHESIS ..................................... 27
B. MEASURES OF EFFECTIVENESS ...................... 27
C. METHODOLOGY .................................... 28
V. GPS-5 RECEIVER SYSTEM .............................. 34
A. SYSTEM CHARACTERISTICS ......................... 34
B. SYSTEM CONFIGURATION ........................... 34
iv

VI. CONCLUSIONS AND RECOMMENDATIONS .................... 34
A. SIMULATION RESULTS ............................. 36
B. CONCLUSIONS .................................... 42
C. FUTURE STUDIES ................................. 43
APPENDIX A. AVAILABILITY CONCEPTS ....................... 44
APPENDIX B. THE NAVY INVENTORY SYSTEM ................... 47
APPENDIX C. CURRENT SPARING MODFLS ...................... 5±
APPENDIX D. GPS-5 SYSTEM PARAMETERS ..................... 56
APPENDI? E. GPS-5 SYSTEM CONFIGURATION ................... 57
APPENDIX F. ACIM STOCK LEVELS FOR GPS-5 SYSTEM ........... 58
APPENDIX G. FLSIP AND MOD-FLSIP STOCK LEVEL. ............ 59
APPENDIX H. ACIM STOCK LEVEL ADJUSTMENTS (PHASE 1) ...... 60
APPENDIX I. ACIM STOCK LEVEL ADJUSTMENTS (PHASE 2) ...... 61
LIST OF REFERENCES ....................................... 62
INITIAL DISTRIBUTION LIST ................................ 63
v

LIST OF FIGURES
Figure 1. ACIM Marginal Analysis Technique ............... 11
Figure 2. TIGER Run Diagram ............................. 20
Figure 3. Reliability Block Diagram ..................... 21
Figure 4. TIGER Program Flow Diagram .................... 24
Fiqure 5. Sparing Methodology Flow Diagram ............... 33
Figure 6. Current Sparing Cost Comparison ................ 37
Figure 7. TIGER Simulation Results, Rule 1 .............. 40
Figure 8. TIGER Simulation Results, Rule 2 .............. 41
Figure 9. U.S. Navy's Three Echelon InventoryStructure ..................................... 48
Figure 10. Poisson Distribution of Demand ................ 52
vi

LIST OF SYMBOLS, ACRONYMS AND ABBREVIATIONS
Ao - Operational availability defined as the probabilitythat an item will be capable of performing itsspecified function when called for at any random pointin time
Aom- Average Mission Operational Availability
ACIM - Availability Centered Inventory Model
CDU - Control Display Unit
COSAL - Coordinated Shipboard Allowance List
DC - Duty Cycle
DOD - Department of Defense
FLSIP - Fleet Logistics Support Improvement Program Model
FRPA-3 - GPS-5 Antenna Assembly
GPS-5 - Global Positioning System Radio Receiver
ICP - Inventory Control Point
MLDT - Mean Logistics Delay Time (a measure of supplysupport posture)
MOD-FLSIP - Modified FLSIP Model
MOE - Measure of Effectiveness
MSRT - Mean Supply Response Time, synonymous with MLDT
MTBF - Mean Time Between Failure (a measure of reliability)
MTTR - Mean Time To Repair (a measure of maintainability)
NAVSEA - Naval Sea Systems Command
NAVSUP - Naval Supply Systems Command
NSC / NSD - Naval Supply Center / Naval Supply Depot (overseas)
",ii

RBD - Reliability Block Diagram
RMA - Reliability, Maintainability and Availability
RPU - Receiver Processor Unit
SPCC - Ship's Parts Control Center
TIGER - Monte Carlo computer simulation model used in RMAanalysis
TRF - Technical Replacement Factor
viii

ACKNOWLEDGEMENTS
I am grateful to Dr. W. Max Woods, my thesis advisor, for
the consistently thorough guidance and assistance he provided
to me throughout the research and writing of this thesis. In
addition, I would like to express my appreciation to Dr.
Siriphong Lawphongpanich, my second reader, for the interest
he displayed in the subject and the assistance he provided
toward the completion of this thesis.
I am extremely grateful to my wife, Rochelle, for the
tremendous support and confidence she provided to me over
these past two years of study and for the patience she
displayed while I completed this thesis.
I hold myself solely responsible for any errors or
deficiencies in this thesis. I gratefully share any credit,
that this thesis may receive, with all who contributed to its
completion.
ix

I. INTRODUCTION
A. HISTORICAL BACKGROUND
During the past ten years, the Navy has conducted several
studies to evaluate and compare existing and new sparing
models which are used to manage the Navy's material
inventories. In the early inventory models, the Navy simply
modified those which existed in industry to meet its goal;
namely, to maximize effectiveness given a certain budget
constraint. For a long time, system and supply effectiveness
took on many related but different forms. Consequently, the
methods used to achieve those effectiveness goals were often
not uniformly understood. In addition, it is not clear that
improved supply effectiveness necessarily leads to improved
system effectiveness. It was inevitable that a measure of
effectiveness for material readiness needed to be formalized
throughout the Navy. NAVMATINST 3000.2 [Ref. 2] states that
operational availability, denoted as A,, "is the primary
measure of material readiness for Navy weapons systems and
equipment." In this instruction, A. is defined as "the
expected percentage of time that a weapon system or individual
equipment will be ready to perform satisfactorily in an
operating environment."

In 1981, a model called the Availability Centered
Inventory Model, ACIM, was recommended and approved for use
by the Navy in a single echelon environment. The estimate for
operational availability used within ACIM is the ratio of the
length of time a system is available and the length of a
mission (or the length of time the system must be
operationally available). In short,
A
A. UPTIME/ TOTAL TIME
= UPTIME / (UPTIME + DOWNTIME)
Anotber estimate for A0 which is widely used in the literature
and in Department of Defense applications is the following
(see, e.g., Ref. 3):
A = MTBF / (MTBF + MTTR)
where MTBF is the estimated mean time between failure and MTTR
is the estimated mean time tz1 repair given there is no waiting
time for the repair to begin. However, such an assumption is
inappropriate in the Navy, and the following estimate of Ao is
used in ACIM instead:
A A
S = MTBF / (MTBF + MTTR + MLDT) (1)
2

where MLDT is the estimated mean logistics delay time. (MLDT
is also referred to as estimated mean supply response time,
MSRT.)
B. PROBLEM DESCRIPTION
The U.S. Navy currently provides spare suites for ship
systems using several methods and coordinated shipboard
allowance list (COSAL) models. One of the methods employed
develops a set of spares for each individual system by
selecting the range and number of each spare (depth) which
will maximize the system's estimated operational availability
given a budget constraint. One such optimization model, ACIM,
is utilized to build spare suites for use at the unit level.
There are inherent problems in the ACIM model which prevent
it from selecting the optimal range and depth of spares at
minimal cost while relating the selected spares to the
intended system mission.
A
ACIM, while it links A0 with COSAL, does not consider the
operational mission or mission cycles which the component will
experience while in use. As further stated in NAVMATINST
3000.2, ". ..A0 does not depict the ability of the system or
equipment to continue to perform satisfactorily for the
duration of a specific mission cycle. That particular issue
is 'dependability' Dr 'mission availability' .... " Although
the procedure of using A0 for determining the correct mix and
3

quantity of spares to an operational unit is a step in the
right direction, the better measure of effectiveness is aA
combination of Ao and the probability of "mission success".
Ideally, the suite of spares that is positioned at an
operational unit should provide a sufficiently high
probability that a required system will be operational when
called upon and should be related to the intended operational
mission of the system. Additionally, the spares suite
provided should be one of minimal cost.
Although the U.S. Navy is not a "profit" oriented
organization, there is much concern today within the Supply
Corps for buying the right items and in the right quantities.
The procurement and placement of the correct set of spares on
a ship is a difficult and delicate issue with inherently many
trade-offs. Positioning less than the optimal range and
number of spares, for critical equipments, might lower Ao for
the equipments in question and possibly the ship. It is also
detrimental to position too many spares onboard the ship.
This scenario may cause:
(1) excessive inventory and inventory accuracy problems,
(2) increased requirement for storeroom space, and
(3) increased opportunity costs due to decreased availablebudget.
An effective method to determine system interactions is
through the use of simulation. Several reasons to simulate,
4

as stated by Banks and Carson [Ref. 3], which are relevant in
this case are:
(1) Simulation enables the study of, and experimentationwith, the internal interactions of a complex systemor of a subsystem within a complex system.
(2) By changing simulation inputs and observing theresulting outputs, valuable insight may be obtainedinto which variables are most important and howvariables interact.
(3) Simulation can be used to experiment with new designsor policies prior to implementation, so as to preparefor what may happen.
These three general statements have significant appeal
when discussing the use of simulation in building spare suites
for critical and highly expensive ship systems. The inherent
shortcomings of the ACIM model, due to model assumptions
discussed later in the thesis, and the fact that ACIM is not
directly related to operational missions support the
justification for simulation. Finally, the current widespread
availability of mainframe and micro computer equipments and
simulation languages makes operational simulation an excellent
and cost effective method to utilize in refining the Navy's
sparing methodology.
C. THESIS OBJECTIVE AND SCOPE
This thesis proposes a procedure which uses the TIGER
simulation model to refine a suite of spares for a ship
subsystem as determined by ACIM. This procedure takes the
output, the recommended range and depth of spares, from the

ACIM model and uses it as input into the TIGER simulation
model in order to establish a "bad actor" list (those parts
which cause the most downtime). This list will in turn be
used to modify the original set of spares as input for another
TIGER run to measure system availability. The precise
methodology follows the one originally proposed by Judge and
Luetjen [Ref. 1]. The procedure ensures attainment of a
target A. at minimum cost by structuring and refining the
sparing process. The complete iterative process uses the
sparing information from NAVSUP's sparing model along with the
simulation capabilities and output of NAVSEA's TIGER program.
The organization for the rest of the thesis is as follows.
Chapter II describes and discusses the assumptions and
techniques utilized in the ACIM. Chapter III describes the
TIGER simulation model, its current usage and capabilities
with respect to the sparing process. Chapter IV provides the
hypothesis, measures of effectiveness, and the proposed
sparing methodology. Chapter V describes the NAVSTAR global
positioning system radio receiver (GPS - 5), an example system
to illustrate the technique proposed herein. Chapter VI
provides the conclusions and recommendations concerning the
use of the TIGER simulation model in the proposed "refined"
sparing process. To supplement the presentation described
above, Appendix A provides an overview of availability
concepts and the complexity of estimating operational
6

availability, Appendix B provides an overview of the Navy's
inventory system with specific attention paid to the retail
(consumer) shipboard level, and Appendix C provides a brief
description of the sparing models currently utilized for
building COSALs.
7

II. ACIM METHODOLOGY
A. MODEL INTRODUCTION
ACIM is a stationary multi-echelon model based on Markov
process and queuing theory. It is capable of determining
spare suites for inventory at several levels of the system,
(i.e., wholesale, retail, etc.). However, its use in the Navy
is limited by the following CNO directives:
1. The model will be utilized to compute stockagequantities only at the consumer level foroperationally significant equipments,
2. Each application of the model must be approved byCNO (OP-41),
3. If it is concluded that increased supply supportwould improve A0 by at least five percentagepoints, and if at least five percentae points isrequired to achieve the CNO goal for A0, then theuse of ACIM can be considered, and
4. Controls will be established to ensure that thecontinued requirement for ACIM's use is reassessedannually.
In this thesis, ACIM will be utilized as a single level
inventory model to determine the level of sparing at the
consumer (retail) level. The assumptions of the ACIM model
are as follows:
1. External demands on supply are stationary andcompound-Poisson distributed.
8

2. For each spare part issued, one part is orderedas replacement.
3. If the same part appears in different locationsin a system, each part is treated as a unique itemin the model.
4. MTTR and MTBF are defined as constants. MTTRincludes all equipment repair related down timethat are not supply related.
5. Component failures are independent.
6. When a system fails due to a part failure, thesystem does not operate again until the failedpart is replaced.
ACIM uses an iterative marginal analysis of parts stocked
to minimize MLDT. ACIM is designed to minimize the time that
an equipment is not operational due to a lack of parts, thus
maximizing A0.1
1EMSO criticized the definition oc A in that by using the
"uptime divided by total time", Ao is affected by the length of
idle time, which is policy dependent, [Ref. 4]. A recommendedalternative definition for Ao depended only on estimates of5uantities inherent to the system. The recommended definition forAo was:
AAA
A o = MTOTBF / (MT+TBF + MTTR + MLDT)
where MTOTBF is the estimated Mean Total Operating Time BetweenA
Failures. Although this criticism of the definition of A0 wasacknowledged by higher authority, Equation (1) was chosen as theestimate of Ao to be used in DoD.
9

B. ALGORITHM DESCRIPTION
Rewriting ACIM's estimate of A,, Equation (1), we obtain:
Goal MLDT = (MTBF / A,) - MTBF - MTTR (2)
Note: If the Goal MLDT is less than 15 hours, it isdefaulted to 15 hours
The algorithm utilized by ACIM computes stocking levels
for system components which minimizes MLDT for a given budget.
During each iteration, the stocking level of the spare which
yields the largest marginal decrease in MLDT per dollar is
increased by one unit (See Figure 1). In the calculation of
the marginal decrease in MLDT, ACIM treats items with multiple
applications in a particular system as different items. This
allows ACIM to employ the common technique of "parts
counting", assuming that all parts operate in series. [Ref.
5]
The mathematical description of the model, as described
in the ACIM Handbook [Ref. 6], is provided below. The model
consists of the following definitions and equations in which
i denotes an arbitrary item in equipmerf a (i may be a itself)
and, u represents an arbitrary facility in the support system:
Miu= Diu + Tiu (3)
10

Hby read User Input t
ACompute A 0 with
zero spares
00
Se ec part wit hi hes
Rank prospective partsby relative benefit toAA ° per dollar invested
Select part with highestranking and increasespares suite by one
Compute new A 0
Figure 1. ACINI Marginal Analysis Technique
11

where
Miu = mean time to return a failed unit of item i atlocation u to a serviceable condition.
Diu = expected time delay per demand upon inventoryfor item i at location u.
Tiu = mean time to repair item i at user location u(for equipment repair).
In equation 3, the factor Tiu represents the marginal mean
time to repair item i through replacement from stock or repair
of failed subordinate parts. Included are all repair related
functions such as documentation, fault isolation, removal and
replacement and system checkout. These factors are assumed
to be given as constants.
D =l (x-SM )P(X;_M_ T) (u=0,1,2,...,U) (4)
j u x>S.M
Si= stock level of item i at location u.
X = expected number of demands upon inventory for itemin i at location u.
p(x;X ,Tiu) = probability of x units of stockreduction for item i at location u.
In equation 4, the summation term gives the expected
number of backorders for a stock of Siu. This is equivalent
to tne expected length of time the stock is in a backorder
status. Dividing by the expected number of demands per time
12

unit gives the expected delay in satisfying a demand. The
time unit in ACIM is days. Values for ) are assumed to be
given by input data in ACIM.
T. =y (L. +L' )+(1-y. )(R +R ) (5)
where
= probability that a demand for item i uponinventory at location u results in a loss (discardor sent elsewhere for repair) which must bereplaced through resupply.
Lm = average resupply lead time assuming stock is
available at the resupply source.
L = additional resupply lead time due to expectedshortages at the resupply source.
R.R = average shop repair cycle time assuming avail-ability of spares for items within i at the nextlower indenture level.
R = additional shop repair cycle time due to expectedshortages of spares for items within i at the nextlower indenture level.
In equation 5, the factors Y u are assumed given by input
data. The factors Liu and Riu are assumed to be given by input
data as constants for each location. The first term
(involving resupply lead times) represents losses from stock
due to scrap or units sent to higher level repair facilities.
The second term represents losses due to amounts cycling
through local repair.
13

L'lu = Diu (u =,2....U) (6)
L' = Div where v is the resupply sourcefor location u = 0.
= 0 if location 0 has no resupply source.
Equation 6 states that the additicnal delay in obtaining
resupply is equal to the expected delay per demand upon stocks
at the resupply source.
MX..M
jii
where j identifies items within i at the next lower
indenture level.
Ry = 0 if i has no subordinate parts.
Equation 7 states that the additional delay in repairing
an assembly is equal to the weighted average of expected
delays per demand upon stocks at the next lower indenture
level.
where
14

Aau = fraction of time equipment a is available foruse at location u (defined only for locationsu which operate the equipment).
au = expected number of demands upon inventory forequipment a at location u.
Equation 8 gives the operational availability of the
equipment in terms of factors defined by previous equations.
With proper interpretation of terms, this definition can be
A
translated into other expressions for A,.
The above definition of the model is recursive on "item"
within the parts hierarchy and "location" within the support
system hierarchy. If stock levels are given for all items at
all locations, a recursive procedure using the equations may
be applied to determine corresponding operational
availabilities of the equipment at all user locations. The
recursion starts with items at the bottom of the parts
hierarchy. For such items and locations, additional resupply
and repair times (equations 6) and 7)) are zero, and expected
delays can be calculated directly using equations 4) and 5).
These delays can be used in equations 6) and 7) to calculate
additional resupply and repair times. Expected delays for
these items and location can then be determined by equations
4) and 5).
The overall objective of the ACIM model is to determine
inventory levels for all items and all stockage facilities
15

such that the expected operational availability of the
equipment is maximized for a given inventory budget or,
conversely, to find inventory levels which achieve a given
operational availability at least cost. This objective can
be explicitly stated as, "Find values Sky for all items k in
equipment a and locations v in the support system which
minimize D = Dau for all user locations u subject to:
I k kk, v
where,
ck = unit cost of item k
B = given budget for spares procurement"
Equations 3) and 8) show that minimizing Diu is equivalent
to maximizing A8 U, the operational availability of equipment
a at user location u. A similar statement can be written for
the converse objective of achieving a given value of Aau at
least cost.
The ACIM optimal solution to the problem defined above is
found by an iterative procedA.ia based upon equations 3)
through 8). First, however, a subproblem is defined and a
solution procedure is given for the subproblem. An iterative
application of the subproblem is then used to solve the
original problem. Although not critical in the context of
16

this thesis, the specifics of the subproblem formulation and
solution are available in the ACIM Handbook.
C. MODEL SHORTCOMINGS
The model, in its current form, contains some inherent
shortcomings which need to be highlighted. First, ACIM
considers that all system components operate in series. That
is, when one part fails, the system is considered "down"
until the failed part is replaced with a guod part. Although
computationally simpler, this assumption often does not
reflect actual system characteristics. For example, when the
system components operate in parallel (standby), ACIM clearly
underestimates the operational availability. In addition,
systems which are capable of operating in a partial mode
(i.e., partial mission capable) are not accommodated by ACIM.
Second, spares selection is based solely on the use of
operational a-,ailability, utilizing the means (MTBF and MTTR)
of assumed distributions as constants. Moreover, ACIM
maximizes the operational availability without regard to a
ship's mission. It is more sensible that spare suites should
be stocked at a level which ensures a sufficiently high A,,
given the intended operational mission.
17

D. SUMMARY
ACIM provides a logical, systematic approach for
selecting spares for critical ship systems by using the
operational availability, A,, as a measure of effectiveness.
The model allows for the maximizing of the estimated A, given
a certain budget or achieving a target A0 while minimizing
costs. Because ACIM uses Ao exclusively as the measure of
effectiveness (MOE), without regard to the intended ship's
mission, there is nothing to link spares selection to mission
success. In Chapter III, we describe a procedure using the
TIGER simulation model to establish such a link.
18

III. TIGER SIMULATION
A. MODEL INTRODUCTION
TIGER is a family of computer simulation programs written
in ANSI 77 FORTRAN which was developed and is maintained by
NAVSEA (Code 05MR). The simulation is a discrete, event-
driven model which uses Monte Carlo techniques to estimate
system parameters given the estimated MTBF and MTTR of the
system components and a repair policy. Figure 2 provides an
overview of the TIGER run diagram.
B. CURRENT USAGE
NAVSEA (Code 05MR) uses the TIGER program to measure and
evaluate complex weapons systems in terms of the estimated
reliability, maintainability and availability (RMA)
characteristics of Navy systems. The RMA system analysis
begins early in the design and development stages to ensure
implementation of the most cost effective design which meets
or exceeds original system requirements. The TIGER program
makes use of numerical representations of the basic
reliability blocks in the form of reliability block diagrams
(RBD) which describe failure characteristics of a system.
Figure 3 compares a simple example of a RBD to a functional
diagram. The program has the ability to accommodate not only
19

EQUIPMENT PARAMETERS SYSTEM PARAMETERS
MTBF RELIABILITY
MTTR COMPUTER AVAILABILITY
PROGRAMDUTY CYCLE CRITICAL EQUIPMENT
TFIVFOPERATING RULES
ALLOWABLE MAINTENANCEDOWNTIME POLICY
MISSION LOGISTICTIMELINE MODEL
SYSTEM CONFIGURATION
l imune 2. TIGER Run Diagram [Ref. 7]
20

Fuel
System
C.81buqetor OqvEngine Geurs eMi t6L
Igntio El"rical* Spark System
* ihery
.. . . . ... .. . . ..... . ..
Funcllonal Diagram
Fuel Fuel
11ank UnitsB toE e l
GersDie Axis Wheat$jle
Rellablllty Block Diagram
Figure 3. Reliability Block Diagram [Ref. 8]
21

series configurations but also a variety of parallel systems
(i.e., cold and hot standby). In this way, the TIGER program
possesses a major advantage over many other mathematical
models. It can be used to evaluate large, complex systems
under a variety of configurations, operating rules, and
different scenarios.
C. ALGORITHM DESCRIPTION
TIGER uses Monte Carlo simulation techniques which
consist of, and are driven by, the following five events:
1. Beginning of Mission
2. Change of Equipment Configuration Requirementswithin the Mission
3. Equipment Failure
4. Equipment Repair
5. End of Mission
The beginning and ending mission times as well as
configuration change times are data input. The mission begins
with all equipment "up" and all stocks up to allowance (if
using the spares inventory model). With data input of
components' estimated MTBFs and MTTRs and a string of
uniformly distributed random numbers, times to system failures
and repairs are calculated. This is done using the assumption
of exponentially distributed event times with means of MTBF
22

and MTTR, respectively. Then, based on the configuration,
system "up" and "down" times are used to estimate system
performance. With the number of trials predetermined by the
user, the simulation is repeated with a different string of
random numbers for each trial and the simulation results are
then averaged. Figure 4 provides the TIGER program flow
diagram.
D. TIGER Outputs
TIGER output consists of a seven part file as provided
below:
1. User Input Echo
2. Simulation Progress Reports
3. Final Figure of Merit Reports
4. Equipment Performance Statistics
5. Critical Equipment Lists
6. Restricted Erlang Distribution Model (REDM)
7. Maintainability Report
Although several parts of the output file will be used in
the analysis, the most critical to the method used in this
thesis are the critical equipment lists and final figure of
merit reports. TIGER output offers five critical equipment
lists. They are:
23

fBEGI'N READ USER INPUT/
88 T A RT NJE W MI1 SI10NM TR911A L
START NEW PHASE
PROCESS NEXT EOUIPMEtNT iEVENT (SEE TEXT)
SCOLLECT EVENT STATISTICS
SCOLLECT PHASE STATISTICS
SCOLLECT TRIAL STATISTICS
Figure 4. TIGER Program Flow Diagram [Ref. 7]
24

1. Unavailability of Critical Equipment by Equipment Number
2. Unavailability of Critical Equipment by Equipment Type
3. Proportional Responsibility of Critical Equipment byEquipment Type
4. Unreliability of Critical Equipment by Equipment Number
5. Unreliability of Critical Equipment by Equipment Type
TIGER estimates average system availability, denoted by
A., and provides the value as part of the figures of merit.
Aom is estimated in TIGER as follows:
= TOTAL SYSTEM UPTIME IN ALL TRIALSTOTAL TIME
The values obtained will be compared with the desired Ao goal.
This value combined with the critical equipment lists will be
used to determine which (if any) of the parts within the
system should receive an adjustment to their initial, ACIM
computed stocking level. If adjustments are determined to be
desirable, they will be made and another set of simulation
trials will be performed.
E. SUMMARY
Although TIGER is currently used only to measure and
evaluate RMA characteristics of Navy systems, TIGER provides
several output options which expand its usefulness. In
25

particular, the critical equipment lists option provided by
the program allows for a thorough review of those
subcomponents which contribute the most to the system's
"unreliability." Thus, through their use and the use of
initial stocking levels, those levels can be adjusted either
up or down to meet or exceed the system's operational
availability goals.
26

IV. SPARING METHODOLOGY
A. HYPOTHESIS
ACIM, coupled with the iterative use of TIGER, provides
a refined sparing process which better approximates, at a
reduced cost, the sparing requirements necessary to achieve
a target system operational availability. Given the fact that
these models are already in use by the Navy, the method
proposed in this thesis is immediately implementable and has
the potential of providing a better allocation of spares for
critical and highly expensive ship systems.
B. MEASURES OF EFFECTIVENESS
The two measures of effectiveness utilized in this sparing
process are:
(1) A0 = MTBFMTBF + MrTR + ML'DT
(ACIM)
(2) Aom = TOTAL SYSTEM UPTIME IN ALL TRIALSTOTAL TIME
(TIGER)
These MOE's are described in Chapters II and III,
respectively.
27

C. METHODOLOGY
Assuming that the criteria, as described in Chapter II,
are met for using ACIM sparing for a particular ship system,
two major parts of the methodology will be the use of the two
models: ACIM and TIGER. Equally important to the method and
use of these models, is the critical preliminary review of the
system data prior to input into the models. Both models are
based on the assumption of exponential times to failure (and
repair). The "memoryless property" of the exponential
distribution makes it necessary to first manually review the
system component list and exclude any items which are known
to exhibit "wear-out" tendencies. Spares for these items
should be computed off-line with the use of historical data
and recommendations from maintenance personnel. Following the
guidelines set forth in the ACIM Handbook and using the
established estimated system parameters (i.e., technical
replacement factors (TRF), price, etc.), the next step is to
set the following parameters and perform an ACIM run:
1. A0 Goal
2. Cost Ceiling
3. Mission Time
4. MITR
5. MLDT
6. Duty Cycle
28

If the Ao goal has been met, the spare quantities obtained
using ACIM are those quantities which will be used as the
initial spares in the TIGER simulation(s). TRF is the number
of times per year an item will be requisitioned from the
supply system by an organizational user. If the TRF's are the
only figures provided with the spares information, off-line
computations must be made to obtain the associated MTBF which
is used by TIGER. The formula used to compute MTBF in this
thesis is as follows:
DCTRF = DC
MTBF
where,
DC = Duty Cycle in Hlours / YearMTBF = Mean Time Between Failure
= Operating Hours / # Failures
For this analysis, the TRF's used were based on a duty
cycle of 6000 operating hours per year (see Appendix D). The
next system information needed to perform the TIGER simulation
is the RBD of the system. Prior to 1980, only some selected
critical Navy systems were procured with RBD information.
This made the use of TIGER for COSAL sparing impossible if the
RBD could not be obtained or easily produced. This potential
problem was alleviated in 1980 with the publice'ion of MIL-
STD-785B which states, "As the design evolves, a reliability
29

block diagram shall be developed and maintained for the
system/subsystem with associated allocations and predictions
for all items in each reliability block:' [Ref. 9] Following
the guidelines in the TIGER Manual and the proposed method by
Judge and Leutjen [Ref. 1), Phase 1 of this methodology is
performed. A mission timeline and system operating rules are
developed and combined with the initial set of spares as
computed by ACIM. Utilizing the computed values for AO, the
target A, and the critical equipments list, a decision is made
concerning the spares levels. If the computed Aom is less
than the target A0 , one spare is added to the original suite.
The choice of which component level to adjust is found by
reviewing the critical equipment list and picking the item
which provided the most "unreliability" to system Aom.
Following this, another simulation is performed and the same
comparison of computed Aom and target A, is made. This
iterative process of TIGER simulations is continued until a
satisfactory estimated A, is .4tained. Similarly, if the
computed Aom exceeds the target Ao, then one spare is taken
away from the original spare suite. The component which
should have its level decreased is the one which provides the
least to system "unreliability", as provided by the critical
equipment list. When reviewing the critical equipment list
in this case, a check should be made to see that all
30

components on the original spares list are on the critical
equipment list. This is because components which did not fail
during the simulation would not show up on the list. A
component which did not fail and has an original spare
quantity greater than zero should have its original level
decreased by one. If there is more than one to choose from
in this category, the sparing level of the most expensive
component should be reduced. In the event that all spare
candidates appear on the critical equipment list, the
component which should have its original sparing level
(greater than zero) reduced by one is the one which has
contributed the least to system "unreliability." With Phase
1 now complete (i.e., initial ACIM computed levels adjusted
and computed A M meeting or exceeding target A0), Phase 2
begins. The process in Phase 2 is designed tc reduce the
stock levels obtained from Phase 1 without reducing the A
below the target A0, thus reducing the total cost of the
spares suite. Utilizing the "Summary of Spares Used" listing
from the final TIGER simulation from Phase 1, a review is made
of the decimal portion of the "Spares Used Per Mission"
listing. If this is greater than or equal to 0.10, the spares
used per mission value is rounded up. We will denote this
rounded value as "A". This value is then compared to the
modified stock level from Phase 1, which will be denoted as
31

"B" The new modified sparing levels for each system
component is then computed as the Min ("A", "B"). A final
TIGER simualtion should be performed to ensure that the
estimated AoM still meets or exceeds the target Ao . Figure 5
provides a flow diagram of the method.
32

Begin Phase 1 Run ACIM
A - Goal A
Increase spasenglevel f 'wost' Begin ase 2
Renige vie deia portion"nst
Decimal m nn
copoend bac ms recAntlyB
Figuree spre 5.. Sparil Endhoog Phloe Diga
33Bgn hs

V. GPS-5 RECEIVER SYSTEM
A. SYSTEM CHARACTERISTICS
"The NAVSTAR Global Positioning System (GPS) is an all-
weather, spaced-based navigation system" which was under
development by the Department of Defense (DoD) in 1985 and was
planned to attain full operational capability by the end of
1989. [Ref. 10] It is used to provide precise position,
velocity and time in a common reference system, anywhere on
or near the Earth on a continuous basis. The GPS-5, the
shipboard installed equipment used in the GPS system, consists
of three major units; the antenna assembly (FRPA-3), a
receiver processor unit (RPU) and a control display unit
(CDU).
B. SYSTEM CONFIGURATION
There are two configurations currently employed by the
Navy, the surface and sub-surface configurations. The surface
configuration includes two CDU's, one FRPA-3 and one RPU. The
sub-surface configuration consists of only one CDU and RPU
(i.e., no FRPA-3 antenna). The surface configuration is the
one used for the analysis in this thesis. Appendices D and
E provide the GPS-5 system parameters and configuration,
34

respectively. The primary objective during the design and
development phases was "to design and build a family of GPS
user sets at a minimum life cycle cost... ' Use of the TIGER
model will show that the life cycle costs of the GPS-5 can be
lowered, as compared to ACIM sparing, by providing a better
set of spares without reducing the estimated operational
availability.
35

VI. CONCLUSIONS AND RECOMMENDATIONS
A. SIMULATION RESULTS
Organizational stocking levels for the GPS-5 system were
computed using the ACIM model. The unit costs and quantities
for the spares are provided in Appendix F. Utilizing the
sparing information from the ACIM output (the ACIM, FLSIP and
Mod-FLSIP sparing levels), a TIGER simulation was performed
for each of the three sets of spares to compare their
estimated Aom and associated costs. Appendix G provides the
FLSIP and Mod-FLSIP sparing levels utilized. Figure 6
provides the cost per ship versus operational availability
showing the relative costs of each alternative, as measured
by TIGER. The simulation was performed with 1000 repetitions,
utilizing the system parameters provided in Appendix D with
an unlimited amount of spares at the intermediate level. It
should be noted that no depot level spares were required for
any of the simulations.
Expecting that the organizational spares reorder policy
utilized in the simulation would have a major impact on the
computed om, two sets of rules were established in TIGER for
the simulations. They are as follows:
36

TIGER SIMULATION RESULTS
Cost Per Ship (x $1000) vs A..
MOD-FLSIP Spares.0 CRAom 0.832
Cost =27.0
CL0
Cost =9.4
020 40 s0
Cost Per Site (x $1000)
Figure 6. Current Sparing Cost Comparison
37
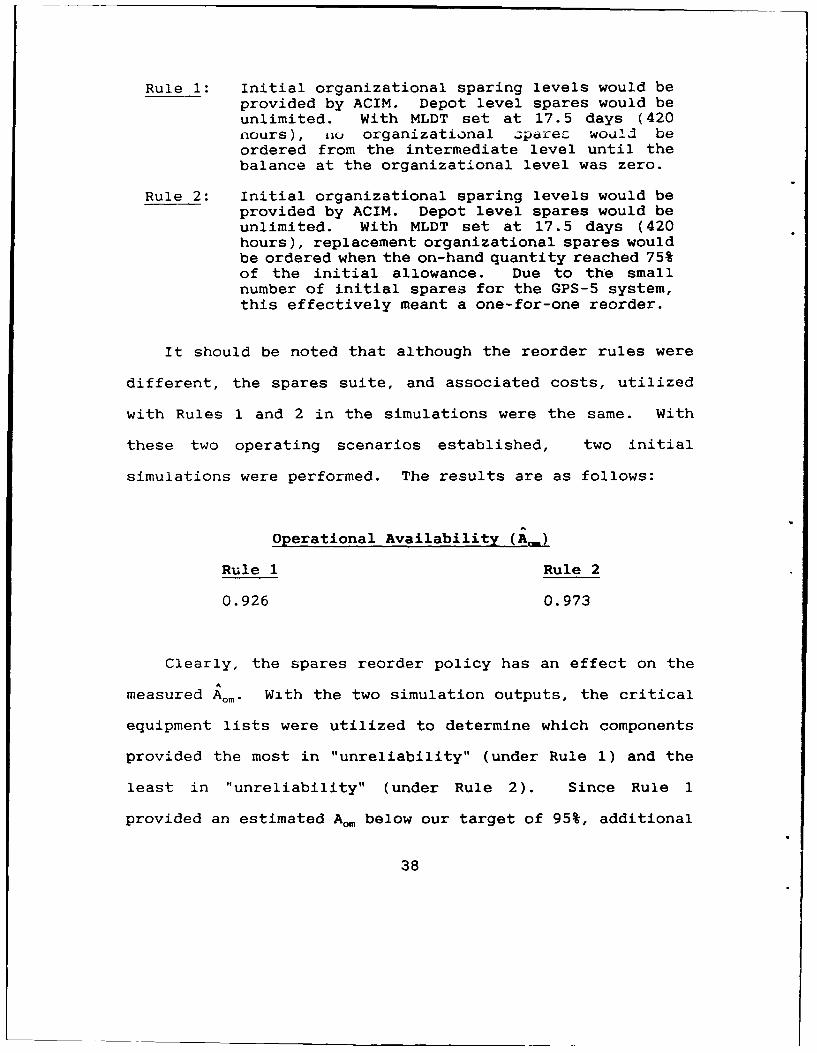
Rule 1: Initial organizational sparing levels would beprovided by ACIM. Depot level spares would beunlimited. With MLDT set at 17.5 days (420hours), niu organizational zparec wou!J beordered from the intermediate level until thebalance at the organizational level was zero.
Rule 2: Initial organizational sparing levels would beprovided by ACIM. Depot level spares would beunlimited. With MLDT set at 17.5 days (420hours), replacement organizational spares wouldbe ordered when the on-hand quantity reached 75%of the initial allowance. Due to the smallnumber of initial spares for the GPS-5 system,this effectively meant a one-for-one reorder.
It should be noted that although the reorder rules were
different, the spares suite, and associated costs, utilized
with Rules 1 and 2 in the simulations were the same. With
these two operating scenarios established, two initial
simulations were performed. The results are as follows:
Operational Availability (A,)
Rule 1 Rule 2
0.926 0.973
Clearly, the spares reorder policy has an effect on the
measured Aom. With the two simulation outputs, the critical
equipment lists were utilized to determine which components
provided the most in "unreliability" (under Rule 1) and the
least in "unreliability" (under Rule 2). Since Rule 1
provided an estimated AM below our target of 95%, additional
38

spares were needea to reach our goal. Similarly, since Rule
2 provided an estimated A.. which exceeded our target, the
number of spares could be reduced while still staying above
our 95% goal.
In performing the simulations with Rule 1, four iterations
of Phase 1 of the method were required before we reached our
goal of 95% operational availability. Figure 7 provides the
simulation results. With Rule 2, seven iterations of Phase
1 of the method were required to reduce the total cost of the
spare suite and still meet or exceed the operational
availability goal of 95%. Figure 8 provides those simulation
results. Appendix H provides the ACIM stock level adjustments
made during Phase 1 of the methodology. Since Rule 2 most
closely resembles the current method of ordering shipboard
spares, it was used in Phase 2 of the methodology. Utilizing
the method described in Chapter V, newly modified sparing
levels were computed by reviewing the "Spares Used Per
Mission" listing. The final recommendation GPS-5 spares suite
is provided in Appendix I along with the original ACIM sparing
levels for easy comparison. The final TIGER simulation was
performed with the Phase 1 and 2 modified 3paring levels and
Aan Aom = 0.949 was obtained. A summary of the methodology
results are provided below:
39

TIGER Simulation Results
ACIM Modif;--d Spares, Rule 1
ai Three Snares AddedA.m = 0.954Cost = 56.3
-
One Spare Addedt,-.o _ ./ A.m,- 0.9,37' -d _ Cost=65.0
Original SuiteAm - 0.926Cost = 64.4
I I I iI I I I I I
Q4.0 64.5 65.0 65.5 66.0 66.5Cost Per Ship (41000)
Figure 7. TIGER Simulation Results, Rule 1
40

TIGER Simulation Results
ACIM Modified Spores. Rule 2
One Spore Subtracted
C Original Suite
Cost -64.4
.2
LO
0OC1 Six Spares Subtracted6 Arm - 0.952
Cost =51.9
C68 64 so 56 52Cost Per Ship (x$1000)
Figure 8. TIGER Simulation Results, Rule 2
41

Methodology Results
A, Target A Achieved Cost
ACIM 0.95 0.973 $66,394.92
ACIM(Rule 2, Phase 1) 0.95 0.952 $51,862.39
ACIM(Rule 2, Phase 2) 0.95 0.949 $29,835.39
B. CONCLUSIONS
By utilizing the TIGER simulation program along with
establishing two sets of replenishment rules, it was possible
to display TIGER's potential in refining COSAL spares suites
computed by ACIM, adjusting the levels either up or down
depending on the need. In Rule 1, Phase 1, we did not attain
our target A. an' therefore used TIGER to determine which
sparing levels to increase to attain our goal. In Rule 2,
Phase 1, we exceeded out target A. and therefore utilized
TIGER to determine which sparing levels to decrease. In both
cases, the proposed methodology allowed for the:
(1) realistic simulation of a ship's operating timelineand its use of onboard spares,
(2) determination of the expected level of operationalavailability provided by those spares, and
(3) adjustment of stocking levels to attain A, goals, thusrefining the spares suite at the shipboard level.
Finally, utilizing Rule 2, Phase 2 of the methodology, a
spares suite was computed which essentially achieved our
42

target A. = 0.95 at a dramatically reduce cost as compared to
using ACIM alone. The above result with the GPS-5 system
clearly demonstrates that:
(1) ACIM as a sparing model is not cost effective, and
(2) the TIGER simulation program, when combined with ACIMin the manner described in this thesis, provides aneffective means of achieving the target operationalavailability at a reduced cost.
C. RECOMMENDATIONS
Recomnendations for further study of the use of TIGER in
the sparing process are as follows:
1. Modification of TIGER's computer code to build independence of failure times between system cor'ponentsto determine if dependent failure times willdramatically effect the sparing levels for a shipsystem.
2. Validation of TIGER's FLSIP and Mod-FLSIP sparesgenerator and evaluation of TIGER as a "stand alone"sparing model to determine if the initial use of asparing model such as ACIM is necessary for the methoddescribed in this thesis.
,3. Analysis of TIGER's use in (a) the process of buildingseparate spare suites for several critical shipsystems and (b) comparison of those levels with ashared pool of spares to determine if TIGER can beused to identify potential cost savings when buildinga combined COSAL.
4. Analysis of TIGER's use in the process of buildingspare suites using failure and repair times whosedistributions are other than that of theexponential (i.e., Gamma, Phase-type) to determineif there would be any difference in sparinglevels.
43

APPENDIX A
AVAILABILITY CONCEPTS
Availability has been defined as the probability that an
item will be capable of performing its specified function when
called for at any random point in time. The exact
mathematical equation for availability can be very complex.
Even when times to failure and repair are exponential, other
factcrs such as active/ passive standby, number of spares,
restricted/ unrestricted repair and failure detection make the
mathematics for instantaneous and steady state availability
very complex. Nearly all DoD documents that address
availability use an approximation to availability. Kozlov
and Ushakov [Ref. 11] have one of the most comprehensive
treatments of reliability of repairable systems and
availability. Their book provides approximately 50 tables
that give equations for system reliability, availability and
related quality indices for as many different descriptions of
system redundancy and repair capability.
NAVORD OD 43251 [Ref. 12] provides a derivation of steady-
state availability for the case of one item with no standby
and unrestricted repair capability. Pointwise availability,
A(t), defined as the instantaneous probability that a system
44

is up at time t is used to obtain the interval availability
AT during intervals of length T. The average value, assuming
that the probability distribution on demand time is U[O,T],
is then:
=T If A (t) dtT T0
If we further assume exponentially distributed failure and1 1
repair times with means - and - , respectively, failure
detection is immediate and initiation of repair is immediate,
the pointwise availability can be obtained by solving a first
order linear differential equation to give us:
A (0) +[1 -
Assuming A(O) = 1 and substituting this into the equation
for average availability gives:
A ___ [l-e(+)T1T- + 2T ±,+ (X+g) T
This expression includes a steady-state term and a
transient term. As T gets sufficiently large, it can be seen
that the interval availability approaches a constant, steady-
state availability: 1
i _ MTTR MTBFA =lim A = - =
T__> T + + + - MTBF+ MTTRMTBF MTrR45

Therefore, for a sufficient length mission, the steady-
state term is often used as an approximation to measure A,.
This fact allows for a simplified measurement of an estimate
for A0 . The steady state term derived in the NAVORD
publication is the approximation which ACIM uses to perform
its optimization techniques. In addition, TIGER's measure of
average operational availability uses a similar form.
For additional, indepth analysis of mathematical models
for operational availability, the reader is referred to Kozlov
and Ushakov [Ref. 11].
46

APPENDIX B
THE NAVY SUPPLY SYSTEM
A. OVERVIEW
The United States Navy's inventory system is divided into
three echelons or levels of inventory: wholesale, retail
intermediate, and retail consumer. DoD Directive 4140.1
defines these levels as follows:
- Wholesale inventory: wholesale inventory manager hasvisibility and control at the national level.
- Retail intermediate inventory: inventory required betweenthe consumer and wholesale levels to support a givengeographical area, including area resupply and consumerlevel maintenance.
- Retail consumer inventory: material held strictly for theunit's own use or consumption.
Figure 9 provides a general overview of the Navy's three
echelon inventory structure.
Due to the difficulty encountered in relating three
inventory levels in one model, the Navy currently uses
different mathematical models for calculating inventory levels
for the three echelons of support. This thesis focuses on the
retail consumer level and in particular, the shipboard
consumer.
47

Contol Xhe ion IASO Pints SPCCWholesale Sites
tchelon 11 -
Reta il,Intermediate(i.e., NSC, ?4SD)
Vche Ion III-Retail,Con sume r(i.e., Ships)
Figure 9. U.S. Navy's Three Echelon Inventory Structure
48

B. CONSUMER LEVEL
Recail inventory is the first echelon of support for the
customer. The management of that inventory is extremely
critical to A. in that the inventory levels at an operating
unit have immediate impact of the successful completion of its
mission. The objective of the Navy retail inventory manager
therefore, is to minimize the supply response time for
material under their cognizance. The inventory control point
(ICP) tasked with manaQing shipboard systems' inventory levels
is the Ship's Parts Control Center (SPCC). There are several
models used at SPCC to compute COSAL allowances. The COSAL
specifies the range and depth of the onboard repair parts to
be carried by the ship to sustain itself through maintenance
for a specified period of time, usually ninety days. The
three most common are known as FLSIP, Mod-FLSIP and ACIM.
COSAL allowance policies are known as the Fleet Logistics
Support Improvement Program (FLSIP), established in 1964 and
Modified-FLSIP, formulated in 1979. These two models are
classified as "fixed protection level" models. They use the
demand forecast to determine allowance levels and provide the
same level of protection for all demand based items. Mod-
FLSIP provides enhanced support for equipment related to a
ship's primary mission. ACIM is an "optimized protection
level" model used to compute COSAL levels for specific weapon
49

systems when the standard protection models cannot achieve the
readiness objective for those systems. Each specific
application of ACIM must be approved by CNO prior to its use.
While the analysis and methodology used in this thesis
will use the ACIM model, a general overview for the two fixed
protection models, FLSIP and Mod-FLSIP will be provided. The
overviews of the two models will illustrate that similar
reasons exist as with ACIM which make the use of simulation
desirable when building COSAL levels for critical ships'
systems. That is, the models do not address the issues such
as system usage, operational mission, maintenance guidelines,
etc. Therefore, the set of spares ldeveloped using these
models might not be optimal.
50

APPENDIX C
CURRENT SPARING MODELS
A. INTRODUCTION
The three basic models primarily used by the Navy in
building spare suites for COSALs are the FLSIP, Mod-FLSIP and
ACIM. These models do not attempt to address or optimize
operational mission availability as a measure of effectiveness
(MOE). However, each model is based on sound mathematics and
.odeling techn .u .-a, therefore, serves a useful purpose
in "building" towards an optimal spares suite.
B. FLSIP AND MOD-FLSIP
The FLSIP and Mod-FLSIP models are fixed level protection
models based on the assumption that the number of items in
demand in a specified time period has a Poisson distribution.
As stated by Tersine, "For items of low demand, the discrete
Poisson distribution is a very likely candidate for the demand
distribution." [Ref. 13] Figure 10 shows how the fixed level
protection model is used to obtain the number of spares
required. Tersine goes on to point out that if the average
demand is "large", the Poisson distribution is
indistinguishable from the normal distribution. The Navy's
FLSIP and Mod-FLSIP models make use of this fact by using a
51

Poisson Distribution of Demand
E 90% protection used in0 FLSIP & Mod-FLSIP models
0
( - 4
4 a 12 1
Units Demanded
Figure 10. Poisson Distribution of Demand
52

normal approximation for stockage quantities when the expected
annual demand is at least forty units.
The following general rules apply in determining COSAL
allowances using the FLSIP and Mod-FLSIP models:
1. FLSIP
- Parts candidates are limited to shipboard installableitems. The range of items is determined by thoseitems which have a predicted demand of at least onein four years.
- Levels are determined for an endurance support periodof ninety days.
- If a part is expected to be demanded four or moretimes annually, a fixed level of protection (generally90%) is set.
- If expected demand is at least forty in a 90 day
period, the approximation:
Allowance Qty = E[AD] / 4 + 1.28 * V(E[AD] / 4)
where, E[AD] (expected annual demand) is used to
compute allowance levels.
- Items vital to secondary ship's missions with:
1/4 <= E[AD] < 4
are stocked with a depth of one.
53

2. MOD-FLSIP
The rules which apply to Mod-FLSIP are the same as
above with the following additions:
- Items vital to primary ship's missions with:
2 <= E[AD] < 4
are stocked with a depth of two.
- Items vital to primary ship's missions with:
1/10 <= E[AD] < 2
are stocked with a depth of one.
C. ACIM
The ACIM optimization model determines allowance
quantities based on obtaining a specific A, while minimizing
cost or maximizing A. under a given budget constraint. By
doing so, it comes closer to the idea of directly connecting
supply levels to A. and mission dependability. As mentioned
earlier however, ACIM falls short in that mission
availability, the success rate for an entire mission duration,
is not reflected in ACIM level computations.
D. COMMENTS
The specifics of the FLSIP, Mod-FLSIP and ACIM model
computations are not as important as their relation or non-
relation to system availability. Specifically, fixed level
protection models and ACIM address neither the idea of
54

achieving a certain level of operational availability given
a ship's mission nor the mission success rate or
dependability.
55

APPENDIX D
GPS-5 SYSTEM PARAMETERS
Input Data
* Number of Systems Per Ship - 1
* Number of Operating Hours Per Year - 6000
* Number of Years Simulated - 1
* Mean Time To Repair (MTTR) - 1.5 Hours
* Mean Logistics Delay Time (MLDT) - 17.5 Days
* Duty Cycle - 100 Percent
56

APPENDIX E
GPS-5 SYSTEM CONFIGURATION
ISN PART NUMBER NAME TRF SHIPQTY
A195 R-2331/URN RECEIVER 0.0050 1A200 646-4237-001 CORRELATOR 0.1610 5A205 646-4238-001 SYNTHESIZER 0.0946 1A210 646-4239-001 IF PROCESSOR 0.2052 1A215 687-6516-001 RCVR PROCESSO 0.4951 1A220 659-5372-001 LOCAL BUS MEM 0.1726 1A225 687-7003-001 INTFC PROCESS 0.2135 1A230 646-4251-001 PTTI INTERFAC 0.1282 1A235 646-4247-001 INSTR INTERF 0.1811 1A240 646-4253-001 TEST INTERFAC 0.0613 1A245 646-4248-001 ARINC INTERF 0.1984 1A250 646-4252-001 NTDS INTERFAC 0.0981 2A255 646-4254-001 SYNCHRO INTER 0.0864 1A260 687-6506-001 CHASSIS 0.0200 1A265 277-0599-010 OSC XTAL CONT 0.2920 1A270 687-6510-001 POWER SUPPLY 0.1342 1A275 BA3042U BATTERY 0.5000 3 *A280 C-11702/UR CONTROL CONSOLE 0.0260 2 **A285 687-8683-002 CHASSIS 0.0059 2A290 687-1751-001 DEFLECT/VIDEO 0.0242 2A295 AqQ- 329-001 PROC/CHAR GEN 0.0841 2A300 687-8682-001 POWER SUPP 0.0500 2A305 687-9198-002 ASSY CRT 0.7999 2A310 687-9162-001 HV POWER SUPP 0.7000 2A315 687-8819-001 FRONT PANEL ASSY 0.2217 2A320 754-2000-001 PANEL, KEYBOARD 0.3245 2A325 MT-6486/SRN MTG BASE ELEC 0.0050 2A330 AM-7314/URN AMPLIFIER ANT 0.0350 1A350 01-01372-001 ANT FRPA-3 0.1314 1
• Due to the fact that the battery has historicallyexhibited "wear out" characteristics, it was excluded from theACIM sparing process and TIGER simulation.
** All items were considered critical for the GPS-5 systemto function with the exception of the control console. Thisitem only required one of two for the system to function(i.e., "cold standby spare") [Ref. 14]
57

APPENDIX F
ACIM STOCK LEVELS FOR GPS-5 SYSTEM
ACIMISN PART NUMBER NAME PRICE 95%Q=Y
A195 R-2331/URN RECEIVER 59317.00 0A200 646-4237-001 CORRELATOR 2330.00 3A205 646-4238-001 SYNTHESIZER 1047.00 1A210 646-4239-001 IF PROCESSOR 1980.00 2A215 687-6516-001 RCVR PROCESSO 3763.00 2A220 659-5372-001 LOCAL BUS MEM 1863.00 2A225 687-7003-001 INTFC PROCESS 3763.00 2A230 646-4251-001 PTTI INTERFAC 2375.00 1A235 646-4247-001 INSTR INTERF 1863.00 2A240 646-4253-001 TEST INTERFAC 2106.53 1A245 646-4248-001 ARINC INTERF 1251.00 2A250 646-4252-001 NTDS INTERFAC 1251.00 2A2'5 646-4254-001 SYNCHRO INTER 2379.00 1A260 687-6506-001 CHASSIS 5135.48 1A265 277-0599-010 OSC XTAL CONT 1633.00 2A270 687-6510-001 POWER SUPPLY 2454.97 1A280 C-11702/UR CONTROL CONSOLE 8524.00 0A285 687-8683-002 CHASSIS 5135.48 0A290 6b7-1751-001 DEFLECT/VIDEO 391.00 0A295 659-5329-001 PROC/CHAR GEN 864.59 0A300 687-8682-001 POWER SUPP 917.00 0A305 687-9198-002 ASSY CRT 579.77 2A310 687-9162-001 HV POWER SUPP 414.94 2A315 687-8819-001 FRONT PANEL ASSY 240.00 1A320 754-2000-001 PANEL, KEYBOARD 700.00 1A325 MT-6486/SRN MTG BASE ELEC 4090.00 0A330 AM-7314/URN AMPLIFIER ANT 2701.00 1A350 01-01372-001 ANT FRPA-3 568.00 2
58

APPENDIX G
FLSIP AND MOD-FLSIP STOCK LEVELS
ISN PART NUMBER NAME FLSIP MOD-FLSIP
A195 R-2331/URN RECEIVER 0 0A200 646-4237-001 CORRELATOR 1 1A205 646-4238-001 SYNTHESIZER 0 1A210 646-4239-001 IF PROCESSOR 1 1A215 687-6516-001 RCVR PROCESSO 1 1A220 659-5372-001 LOCAL BUS MEM 1 1A225 687-7003-001 INTFC PROCESS 1 1A230 646-4251-001 PTTI INTERFAC 0 1A235 646-4247-001 INSTR INTERF 1 1A240 646-4253-001 TEST INTERFAC 0 0A245 646-4248-001 ARINC INTERF 1 1A250 646-4252-001 NTDS INTERFAC 1 1A255 646-4254-001 SYNCHRO INTER 0 1A260 687-6506-001 CHASSIS 0 0A265 277-0599-010 OSC XTAL CONT 1 1A270 687-6510-001 POWER SUPPLY 0 1A280 C-11702/UR CONTROL CONSOLE 0 0A285 687-8683-002 CHASSIS 0 0A290 687-1751-001 DEFLECT/VIDEO 0 0A295 659-5329-001 PROC/CHAR GEN 0 1A300 687-8682-001 POWER SUPP 1 1A305 687-9198-002 ASSY CRT 1 2A310 687-9162-001 HV POWER SUPP 1 2A315 687-8819-001 FRONT PANEL ASSY 1 1A320 754-2000-001 PANEL, KEYBOARD 0 1A325 MT-6486/SRN MTG BASE ELEC 0 0A330 AM-7314/URN AMPLIFIER ANT 0 0A350 01-01372-001 ANT FRPA-3 0 1
59

APPENDIX H
ACIM STOCK LEVEL ADJUSTMENTS (PHASE 1)
RULE 1:
INITIAL MODIFIEDISN PART NUMBER NAME QTY QTY
A305 687-9198-002 ASSY CRT 2 3A310 687-9162-001 HV POWER SUPP 2 3A295 659-5329-001 PROC/CHAR GEN 0 1
RULE 2:
INITIAL MODIFIED
ISN PART NUMBER NAME QTY QTY
A260 687-6506-001 CHASSIS 1 0A240 646-4253-001 TEST INTERFAC 1 0A330 AM-7314/URN AMPLIFIER ANT 1 0A205 646-4238-001 SYNTHESIZER 1 0A350 01-01372-001 ANT FRPA-3 2 0
Note: The components are listed in the order that they were
added or deleted from the initial sparing suite.
60

APPENDIX I
ACIM STOCK LEVEL ADJUSTMENTS (PHASE 2)
ACIMISN PART NUMBER NAME ACIM MODIFIED
A195 R-2331/URN RECEIVER 0 0A200 646-4237-001 CORRELATOR 3 1A205 646-4238-001 SYNTHESIZER 1 0A210 646-4239-001 IF PROCESSOR 2 1A215 687-6516-001 RCVR PROCESSO 2 1A220 659-5372-001 LOCAL BUS MEM 2 1A225 687-7003-001 INTFC PROCESS 2 1A230 646-4251-001 PTTI INTERFAC 1 1A235 646-4247-001 INSTR INTERF 2 1A240 646-4253-001 TEST INTERFAC 1 0A245 646-4248-001 ARINC INTERF 2 1A250 646-4252-001 NTDS INTERFAC 2 1A255 646-4254-001 SYNCHRO INTER 1 1A260 687-6506-001 CHASSIS 1 0A265 277-0599-010 OSC XTAL CONT 2 1A270 687-6510-001 POWER SUPPLY 1 1A280 C-11702/UR CONTROL CONSOLE 0 0A285 687-8683-002 CHASSIS 0 0A2YJ 687-1751-001 DEFLECT/VIDEO 0 0A295 659-5329-001 PROC/CHAR GEN 0 0A300 687-8682-001 POWER SUPP 0 0A305 687-9198-002 ASSY CRT 2 2A310 687-9162-001 HV POWER SUPP 2 2A315 687-8819-001 FRONT PANEL ASSY1 1A320 754-2000-001 PANEL, KEYBOARD 1 1A325 MT-6486/SRN MTG BASE ELEC 0 0A330 AM-7314/URN AMPLIFIER ANT 1 0A350 01-01372-001 ANT FRPA-3 2 0
61

LIST OF REFERENCES
1. Judge, Samuel D. and Leutjen, P., "Determination ofShipboard Repair Parts Level," Naval Engineers Journal,April 1979
2. NAVMATINST 3000.2 of May 1983
3. Banks, J. and Carson, II, J.S., Discrete-Event SystemSimulation, Prentice-Hall, 1984, pp. 3-4
4. Fleet Material Support Office, Response Time TechnicalMemorandum 65
5. Conversation between LCDR S.A. Castillo and Dr. Irwin S.Tolins, Fleet Material Support Office (Code 93) of 8 June1988
6. CACI, Inc., Availability Centered Inventory Model (ACIM)Consumer Level Allowance Development Handbook, May 1983
7. Naval Sea Systems Command, TIGER User's Manual, Version8.21, September 1987
8. CACI, Inc., TIGER: An Equipment Availability Model forComplex Systems, 1 May 1987
9. MIL-STD-785B, Reliability Program for Systems andEquipment Development and Production, 15 September 1980
10. Proceedings, Positioning with GPS-1985, Vol I, U.S.Department of Commerce, May 1985
11. Kozlov, B.A. and Ushakov, I.A., Reliability Handbook,Holt, Rinehart and Winston, Inc., 1970
12. NAVORD OD 43251, Availability Evaluation Program Manual,6trategic Systems Project Office, 1 January 1970
13. Tersine, Richard J., Principles of Inventory and MaterialsManayement, 2nd Edition, North-Holland, 1982
14. Conversation between LCDR S.A. Castillo and Mr. Foster L.Carothers, Naval Sea Logistics Center of 10 June 1988
62

INITIAL viSTRIBUTIUI LIST
No. Copies
1. Defense Technical Information Center 2Cameron StationAlexandria, Virginia 22304-6145
2. Defense Logistics Studies Information ExchangeU.S. Army Logistics Management CenterFort Lee, Virginia 23801
3. Commander 2Naval Supply Systems Command (SUP-042)Washington, D.C. 20376-5000
4. Commanding Officer 2Navy Fleet Material Support Office (Code 93)P.O. Box 2010Mechanicsburg, Pennsylvania 17055
5. Commander 2Naval Sea Systems Command (Code 05MR)Washington, D.C. 20362-5101
6. Professor W. Max Woods 5Naval Postgraduate School (Code 55Wo)Monterey, California 93943-5000
7. Assistant Professor Siriphong Lawphongpanich 1Naval Postgraduate School (Code 55Lp)Monterey, California 93943-5000
8. Dudley Knox Library 2Naval Postgraduate School (Code 0142)Monterey, California 93943-5002
9. LCDR Steven A. Castillo, SC, USN 2Naval Supply Systems Command (SUP-042)Washington, D.C. 20376-5000
10. Operations Analysis Curricular OfficeNaval Postgraduate School, Code 30Monterey, California 93943-5000
63