Embed Size (px)
Citation preview

NAVAL
POSTGRADUATE SCHOOL
MONTEREY, CALIFORNIA
THESIS
Approved for public release; distribution is unlimited.
COMPARISON OF THE NAVY WORKING CAPITAL FUND AND MISSION FUNDING
AS APPLIED TO NAVY SHIPYARDS
by
Andrew M. Cain
June 2006
Thesis Co-Advisors: Jerry L. McCaffery John E. Mutty

THIS PAGE INTENTIONALLY LEFT BLANK
i
REPORT DOCUMENTATION PAGE Form Approved OMB No. 0704-0188 Public reporting burden for this collection of information is estimated to average 1 hour per response, including the time for reviewing instruction, searching existing data sources, gathering and maintaining the data needed, and completing and reviewing the collection of information. Send comments regarding this burden estimate or any other aspect of this collection of information, including suggestions for reducing this burden, to Washington headquarters Services, Directorate for Information Operations and Reports, 1215 Jefferson Davis Highway, Suite 1204, Arlington, VA 22202-4302, and to the Office of Management and Budget, Paperwork Reduction Project (0704-0188) Washington DC 20503. 1. AGENCY USE ONLY (Leave blank)
2. REPORT DATE June 2006
3. REPORT TYPE AND DATES COVERED Master’s Thesis
4. TITLE AND SUBTITLE Comparison of the Navy Working Capital Fund and Mission Funding as Applied to Navy Shipyards 6. AUTHOR(S) Andrew M. Cain
5. FUNDING NUMBERS
7. PERFORMING ORGANIZATION NAME(S) AND ADDRESS(ES) Naval Postgraduate School Monterey, CA 93943-5000
8. PERFORMING ORGANIZATION REPORT NUMBER
9. SPONSORING /MONITORING AGENCY NAME(S) AND ADDRESS(ES) N/A
10. SPONSORING/MONITORING AGENCY REPORT NUMBER
11. SUPPLEMENTARY NOTES The views expressed in this thesis are those of the author and do not reflect the official policy or position of the Department of Defense or the U.S. Government. 12a. DISTRIBUTION / AVAILABILITY STATEMENT Approved for public release: distribution is unlimited
12b. DISTRIBUTION CODE A
13. ABSTRACT (maximum 200 words)
The dramatic political and economic events, both globally and within the United States, during the early 1990s led to significant changes to the Navy shipyard organizational structure. As part of the Navy maintenance regionalization and consolidation program, the financial management system used to manage these commands has been changed. Specifically, the Navy has shifted two of its four shipyards, with authorization to shift the other two in FY07, from the Navy Working Capital Fund to mission funding through direct congressional appropriations.
This funding shift has raised questions about the advantages and disadvantages each financial system provides shipyards, the operating differences that occur due to the funding change, and the future financial consequences of funding Navy shipyards using direct appropriations.
This thesis identifies the advantages and disadvantages of the Navy Working Capital Fund and the mission funding model in the context of a Navy shipyard environment and determines whether the change in financial structure provides an overall benefit that should be pursued for all shipyards.
15. NUMBER OF PAGES
77
14. SUBJECT TERMS Navy Working Capital Fund, Mission Funding, Direct Appropriations, Depot Maintenance, Intermediate Maintenance, Navy Shipyards
16. PRICE CODE
17. SECURITY CLASSIFICATION OF REPORT
Unclassified
18. SECURITY CLASSIFICATION OF THIS PAGE
Unclassified
19. SECURITY CLASSIFICATION OF ABSTRACT
Unclassified
20. LIMITATION OF ABSTRACT
UL NSN 7540-01-280-5500 Standard Form 298 (Rev. 2-89) Prescribed by ANSI Std. 239-18

ii
THIS PAGE INTENTIONALLY LEFT BLANK

iii
Approved for public release; distribution is unlimited
COMPARISON OF THE NAVY WORKING CAPITAL FUND AND MISSION FUNDING
AS APPLIED TO NAVY SHIPYARDS
Andrew M. Cain Lieutenant, United States Navy
B.S., Rose-Hulman Institute of Technology, 1999
Submitted in partial fulfillment of the requirements for the degree of
MASTER OF BUSINESS ADMINISTRATION
from the
NAVAL POSTGRADUATE SCHOOL June 2006
Author: Andrew M. Cain
Approved by: Jerry L. McCaffery Co-Advisor
John E. Mutty Co-Advisor
Robert N. Beck Dean, Graduate School of Business and Public Policy

iv
THIS PAGE INTENTIONALLY LEFT BLANK

v
ABSTRACT
The dramatic political and economic events, both globally and within the United
States, during the early 1990s led to significant changes to the Navy shipyard
organizational structure. As part of the Navy maintenance regionalization and
consolidation program, the financial management system used to manage these
commands has been changed. Specifically, the Navy has shifted two of its four shipyards,
with authorization to shift the other two in fiscal year 2007, from the Navy Working
Capital Fund to mission funding through direct congressional appropriations.
This funding shift has raised questions about the advantages and disadvantages
each financial system provides shipyards, the operating differences that occur due to the
funding change, and the future financial consequences of funding Navy shipyards using
direct appropriations.
This thesis identifies the advantages and disadvantages of the Navy Working
Capital Fund and the mission funding model in the context of a Navy shipyard
environment and determines whether the change in financial structure provides an overall
benefit that should be pursued for all shipyards.

vi
THIS PAGE INTENTIONALLY LEFT BLANK
vii
TABLE OF CONTENTS
I. INTRODUCTION........................................................................................................1 A. OBJECTIVES ..................................................................................................1 B. SCOPE ..............................................................................................................2 C. METHODOLOGY ..........................................................................................2 D. ORGANIZATION ...........................................................................................3
II. BACKGROUND ..........................................................................................................5 A. DEPARTMENT OF THE NAVY MAINTENANCE
ORGANIZATION ...........................................................................................5 1. Maintenance Echelons .........................................................................6
a. Organizational-Level Maintenance..........................................6 b. Intermediate-Level Maintenance .............................................7 c. Depot-Level Maintenance.........................................................8
2. Maintenance Policy and Procedures ..................................................9 a. Preventative Maintenance ......................................................10 b. Corrective Maintenance..........................................................11
B. NAVY MAINTENANCE CHANGE............................................................12 C. CHANGE IMPLEMENTATION.................................................................13
III. MISSION FUNDING.................................................................................................17 A. ORIGINS OF DIRECT APPROPRIATIONS ............................................17 B. CONGRESSIONAL BUDGET PROCESS .................................................18
1. Authorization and Appropriation ....................................................19 2. Congressional Appropriations Subdivisions ...................................20
C. DEFENSE BUDGET PREPARATION.......................................................21 D. DIRECT APPROPRIATION RESTRICTIONS........................................25
1. Purpose Restrictions ..........................................................................25 2. Time Period Restrictions...................................................................26 3. Obligation Amount Restrictions.......................................................27
E. BUDGET EXECUTION FOR MISSION FUNDED ORGANIZATIONS .......................................................................................28
F. INTERMEDIATE MAINTENANCE FACILITY OPERATIONS ..........29
IV. NAVY WORKING CAPITAL FUND .....................................................................31 A. THE FORMATION OF THE DWCF..........................................................31 B. NWCF OBJECTIVES...................................................................................32 C. NWCF OPERATION ....................................................................................34
1. Cost Accounting for the NWCF........................................................35 a. Full Cost Recovery ..................................................................36
D. NWCF BUDGET PROCESS........................................................................36 E. NWCF MANAGEMENT ..............................................................................38 F. WORKING CAPITAL FUND RESTRICTIONS.......................................38
1. Cash Management Restrictions ........................................................39 2. Efficiency Limitations........................................................................39

viii
V. MISSION FUNDING VS. WORKING CAPITAL FUNDING .............................41 A. PUGET SOUND PROTOTYPE...................................................................43 B. PROBLEMS WITH USING SHIPYARD DATA.......................................44 C. ANALYSIS OF OPERATIONAL AND FINANCIAL FLEXIBILITY ...45
1. Personnel Flexibility ..........................................................................45 a. Personnel Cost.........................................................................45 b. Workforce Utilization..............................................................46
2. Financial Flexibility ...........................................................................46 a. Fiscal Year Flexibility.............................................................46 b. Maintenance Costs Exceed Appropriations...........................47
3. Decision Making Authority...............................................................48 D. ANALYSIS OF COST VISIBILITY............................................................49
1. Customer/ Provider Relationship.....................................................49 2. Private Business Practices.................................................................50
a. Cost Accounting ......................................................................50 b. Depreciation Expense .............................................................51
3. Cost Visibility for Senior Officials....................................................51
VI. CONCLUSIONS ........................................................................................................53 A. COST VISIBILITY .......................................................................................53
1. Cost Reporting ...................................................................................53 2. Business Practices ..............................................................................55
B. OPERATIONAL AND FINANCIAL FLEXIBILITY ...............................55 1. Operational Flexibility.......................................................................55 2. Financial Flexibility ...........................................................................56
C. FINAL RESULTS..........................................................................................57 D. RECOMMENDATIONS FOR FURTHER STUDY ..................................58
1. Naval Aviation Depots .......................................................................58 2. East Coast Shipyard Funding Shifts ................................................58 3. One Shipyard......................................................................................58
LIST OF REFERENCES......................................................................................................59
INITIAL DISTRIBUTION LIST .........................................................................................63

ix
LIST OF FIGURES
Figure 1. Congressional Budget Functions .....................................................................19 Figure 2. 2006 Defense Appropriations Act Language...................................................21 Figure 3. DoD Budget Preparation Process for PHNS & NIMF.....................................24 Figure 4. Mission Funding Budget Execution.................................................................30 Figure 5. MF vs. NWCF Organizational Relationships ..................................................33 Figure 6. Unit Cost Calculation.......................................................................................35 Figure 7. NWCF Budget/ Rate Setting Process ..............................................................37

x
THIS PAGE INTENTIONALLY LEFT BLANK

xi
LIST OF ACRONYMS
3M Maintenance and Material Management 2M Miniature and Micro-Miniature APN Aircraft Procurement Navy ABC Activity Based Costing AOR Accumulated Operating Result AOB Annual Operating Budget ASN (FM&C) Assistant Secretary of the Navy (Financial Management and Comptroller) BES Budget Estimate Submission BRAC Base Realignment and Closure BSO Budget Submitting Office BUMED Bureau of Medicine and Surgery CBM Condition Based Maintenance CBO Congressional Budget Office COMPACFLT Commander Pacific Fleet COMSUBLANT Commander Submarine Force, U.S. Atlantic Fleet COMSUBPAC Commander Submarine Force, U.S. Pacific Fleet CNI Naval Installations Command CNO Chief of Naval Operations CRA Continuing Resolution Authority CSMP Current Ship’s Maintenance Plan CSMP Consolidated Ship’s Maintenance Plan DBOF Defense Business Operations Fund DDMC Defense Depot Maintenance Council DLH Direct Labor Hour DoD Department of Defense DoN Department of the Navy DWCF Defense Working Capital Fund FAA Fund Administrating Activity FMA Fleet Maintenance Activity FMB Office of Budget FMR Financial Management Regulations FY Fiscal Year GAO Government Accountability Office (formerly General Accounting Office) IDTC Inter-Deployment Training Cycle IG Inspector General IMF Intermediate Maintenance Facility JCN Job Control Number JCS Joint Chiefs of Staff MCN Military Construction Navy MDS Maintenance Data System

xii
MF Mission Funding MILCON Military Construction MILPERS Military Personnel MIP Maintenance Index Page MJC Master Job Catalog MPN Military Personnel Navy MRC Maintenance Requirement Card MRMS Maintenance Resource Management System NAVFAC Naval Engineering Facilities Command NAVSEA Naval Sea Systems Command NETC Naval Education and Training Command NNS Norfolk Naval Shipyard NOR Net Operating Result NPC Naval Personnel Command NSY Naval Shipyard NWCF Navy Working Capital Fund OMN Operation and Maintenance Navy OMB Office of Management and Budget OPN Other Procurement Navy OPTAR Operating Target OSD Office of the Secretary of Defense PBD Program Budget Decision PHNS Pearl Harbor Naval Shipyard PMS Preventative Maintenance Schedule PNS Portsmouth Naval Shipyard POM Program Objectives Memorandum PPBE Planning, Programming, Budgeting and Execution System PSNS Puget Sound Naval Shipyard RCM Reliability Centered Maintenance RDT&E Research, Development, Testing and Evaluation RMC Regional Maintenance Center RMP Regional Maintenance Program SCN Shipbuilding and Conversion Navy SECNAV Secretary of the Navy SIMA Shore Intermediate Maintenance Activity SYMIS Shipyard Management Information System TRF Trident Refit Facility USD(C) Under Secretary of Defense (Comptroller) WPN Weapons Procurement Navy

1
I. INTRODUCTION
The rapid change in the national defense environment during the early 1990s, a
function of the collapse of the Soviet Union, resulted in widespread initiatives designed
to improve the efficiency and cost effectiveness of the Department of Defense (DoD).
One target of this initiative has been the Navy’s shipyard maintenance structure.
In 1994, the Chief of Naval Operations introduced the Regional Maintenance Plan
(RMP) for Navy shipyards, a consolidation of facilities aimed at reducing excess
infrastructure, improving maintenance processes, and combining supply and maintenance
functions across all levels of maintenance (GAO 1997, p.5). A byproduct of this
regionalization effort has been the consolidation of the financial management systems
used to govern these commands. Specifically, the Navy has shifted two of its four
shipyards from a working capital method of funding to a more direct mission funding
platform, and plans to restructure all of its shipyards in this fashion in the near future.
This change has raised questions about the advantages and disadvantages each
funding structure provides the shipyard, the operating differences that occur due to
funding changes, and the future financial consequences of mission funding.
This thesis will identify the advantages and disadvantages of the Navy Working
Capital Fund (NWCF) and the Mission Funding (MF) model for Navy shipyards and
determine whether the change in financial structure provides an overall benefit that
should be pursued for all shipyards.
A. OBJECTIVES
This thesis examines the differences between the Navy Working Capital Fund and
Mission Funding within the Navy shipyard maintenance environment. The goal of this
work is to determine how these two funding methods constrain shipyard managers, as
well as the aspects of each method that provide shipyard managers with opportunities
unavailable under the other method.

2
B. SCOPE The purpose of this research is to:
• Describe the reasons behind the Navy’s shipyard restructuring plans.
• Explain the operations of both funding methods.
• Identify the inherent differences between both funding methods and show
how these differences manifest themselves in Navy shipyard operations.
• Suggest which funding method best serves the Navy shipyards.
C. METHODOLOGY In researching this topic, the following were conducted:
• A literature review of the historical background and basis behind the
Navy’s decision to regionalize and consolidate its shipyards, as well as the
decision to favor Mission Funding over the Navy Working Capital Fund.
• Research into the Navy’s maintenance organizational structure and
processes.
• A literature review of the Federal budget process, from the perspective of
the Navy, the Department of Defense and Congress. Additionally, a
review of the budget execution process for Navy shipyards under each
funding model was conducted.
• A review of government reports from the Congressional Budget Office,
the Congressional Research Service, the General Accountability Office,
The Center for Naval Analysis, the DoD Comptroller and the DoD
Inspector General was conducted during the progress of this research.
Additionally, DoD directives and DoD and DoN Financial Management
Circulars and instructions were perused, as was the GAO Red Book for
authorities on Fiscal Law and procedures. Standard sources on
governmental accounting and periodical literature were consulted,
including publications of the U. S. Naval Institute.

3
• A study of the performance and cost reporting requirements for
organizations under each funding method and the information contained
therein.
• Personal interviews with Navy Material and Logistics Offices (N4) at
COMSUBPAC and COMSUBLANT were conducted to verify processes
and identify how each funding method affects everyday operations,
including numerous follow-up phone conversations.
D. ORGANIZATION This thesis is organized in the following manner:
• Chapter I is the Introduction.
• Chapter II describes the Navy maintenance processes and the factors that
led to the change in the Navy shipyard maintenance organizational
structure.
• Chapter III describes Mission Funding regulations, budgeting and
execution, restrictions and shipyard operation under this model.
• Chapter IV describes the Navy Working Capital Fund and its regulations,
budgeting and execution, restrictions and shipyard operation under this
model.
• Chapter V compares the two funding methods in the context of Navy
shipyard operations.
• Chapter VI gives conclusions and recommendations for further study.

4
THIS PAGE INTENTIONALLY LEFT BLANK

5
II. BACKGROUND
There is wide variety of subject matter to absorb before the issues concerning a
depot maintenance funding shift can be appreciated. This chapter provides an explanation
of the Navy’s maintenance organization, creating a foundation to apply to the structural
changes that have taken place within the realm of shipyard maintenance. Second, this
chapter describes the political inertia behind the changes this thesis examines and
provides an introduction to the Department of Defense and Navy policies that govern
how their shipyards were reorganized in the face of this transformation.
A. DEPARTMENT OF THE NAVY MAINTENANCE ORGANIZATION The Navy’s maintenance program defines and manages the required configuration
of each class of ship, along with the material condition of each individual ship. This
program encompasses servicing, repair, modification, modernization, overhaul,
conversion, rebuild, test, reclamation inspection and the determination of material
condition. Its purpose is threefold: To maintain the highest achievable level of material
readiness while supporting the ship’s mission and sustaining operational availability, to
maintain ships in a safe material condition, and to meet the highest possible shipboard
habitability standards possible for its sailors (OPNAVINST 4700.7K 2003, p.4).
Maintenance procedures and schedules for Navy ships and related equipment are
developed and performed using a methodology the Navy refers to as Condition-Based
Maintenance (CBM). CBM attempts to balance operational readiness, safety, and
equipment reliability with cost effectiveness, by conducting maintenance only when there
is objective evidence of actual or predictable failure of a ship’s installed systems or
components. It relies on the principles of Reliability Centered Maintenance (RCM) to
obtain this balance (OPNAVINST 4700.7K 2003, p.5).
Reliability-Centered Maintenance identifies maintenance tasks that are both
applicable and effective in maintaining the inherent reliability of systems or equipment at
an optimal cost. RCM principles determine what constitutes objective evidence of need
for maintenance, while also ensuring that a maintenance task is both applicable to the

6
need and effective in restoring the system. RCM-applicable methodology identifies the
maintenance tasks that are able to maintain or restore system or equipment reliability.
RCM-effective methodology optimizes variables such as system or equipment failure
consequences, safety of personnel, environmental impact, mission capability hindrance,
and minimal life cycle cost to ensure that maintenance tasks “pay for themselves”
(OPNAVINST 4700.7K 2003, Encl 7, p.7).
1. Maintenance Echelons As one would expect for systems and equipment as sophisticated and physically
imposing as a Navy vessel, the maintenance performed to ensure mission capability
consists of actions as simple as visual inspections and minor testing, as well as covering
such manpower and equipment intensive evolutions as nuclear refueling. To ensure all
work is performed at locations, and by personnel, best suited for proper accomplishment,
OPNAV Instruction 4700.7K separates ship maintenance into three echelons:
organizational, intermediate, and depot level. Each respective level provides a greater
degree of capability. It is the policy of the Navy to ensure all maintenance is done at the
correct echelon by qualified personnel.
a. Organizational-Level Maintenance Organizational-level maintenance represents the lowest echelon and
consists of all preventative and corrective maintenance actions within the capacity of
each individual ship’s operational forces. Each ship is expected to be self-sufficient to the
maximum extent possible, fostering a “do it yourself” attitude and maximizing the
mission capability of each ship (OPNAVINST 4700.7K 2003, p.8).
Typical organizational-level maintenance actions include:
• Facilities maintenance, such as cleaning and preservation.
• Routine systems and component preventive maintenance, such as
inspections, systems operability tests and diagnostics, lubrication,
calibration, and cleaning.

7
• Corrective maintenance, such as hull, mechanical, electrical, and
electronic troubleshooting down to the lowest replaceable unit level,
miniature and micro-miniature (2M) electronic repair, and minor repairs
to components to restore operation.
• Assistance to higher level maintenance activities.
• Verification and quality assurance of maintenance accomplished by
other activities.
• Documentation of all deferred and completed maintenance actions,
whether accomplished by ship's force or by other activities (OPNAVINST
4700.7K 2003, Encl 1, p.1).
b. Intermediate-Level Maintenance Intermediate-level maintenance requires a higher skill, capability or
capacity than can be supported by ship’s force on an organizational level. Intermediate-
level work includes the following:
• Preventive maintenance.
• Corrective maintenance.
• Tests and inspections.
• Provision of services such as electrical power, water, gas and air
replenishment, and tool issue.
• Installation of alterations.
• Work on electronic miniature/ micro-miniature printed circuit boards,
components, modules, subassemblies, and other equipment coded for
intermediate-level repair.
• Calibration and repair services for electrical and electronic test and
monitoring equipment; pressure, vacuum, and temperature measuring
devices; and mechanical measuring instruments.

8
• Technical assistance to ship's force in diagnosing system or equipment
problems and assistance in repairs, as necessary.
• Assistance in the emergency repair and manufacture of unavailable
replacement parts or assemblies (OPNAVINST 4700.7K 2003, Encl 2,
p.1).
This maintenance is performed primarily by Navy Fleet Maintenance
Activity (FMA) personnel, and can be accomplished at Intermediate Maintenance
Facilities (IMF), Shore Intermediate Maintenance Activities (SIMA), Trident Refit
Facilities (TRF), tenders, repair ships, aircraft carriers and Fleet support bases. These
facilities are equipped with space, machinery and diagnostic equipment not available to
ship’s force. Intermediate maintenance is conducted during upkeep periods, known as
availabilities, which typically span about one month in duration. (Ibid)
c. Depot-Level Maintenance Depot-level maintenance exceeds the capabilities of both organizational-
and intermediate-level activities. It typically takes much longer, often twelve months or
more, than intermediate availabilities. Activities performed at the Depot-level include:
• Preventative maintenance.
• Corrective maintenance.
• Test and inspections.
• Provision of services such as electrical power, water, gas and air
replenishment, and tool issue.
• Installation of alterations.
• Modernization, conversion, overhaul, and reclamation or rebuild of parts,
assemblies, sub-assemblies, components, equipment and weapons
systems.

9
• Manufacture of critical non-available parts.
• Providing technical assistance to IMAs (OPNAVINST 3120.32C 1994,
Encl 1, p.9-8).
This maintenance is typically conducted in fixed shore facilities, Navy
shipyards (NSY), private shipyards and by depot field teams. There are four NSYs
designated for depot-level maintenance: Norfolk Naval Shipyard (NNS) and Portsmouth
Naval Shipyard (PNS) which serve the Atlantic Fleet, and Pearl Harbor Naval Shipyard
(PHNS) and Puget Sound Naval Shipyard (PSNS) which serve the Pacific Fleet.
Additionally, six private shipyards also provide depot-level capability, as well as
performing all new ship construction: Avondale Operation (New Orleans, Louisiana),
Ingalls Operation (Gulfport, Mississippi), Newport News Shipyard (Newport News,
Virginia), Bath Iron Works (Bath, Maine), Electric Boat (Groton, Connecticut) and the
National Steel and Shipbuilding Company (San Diego, California). Avondale, Ingalls and
Newport News are owned by Northrup Grumman Ship Systems, while Bath Iron Works,
Electric Boat and the National Steel and Shipbuilding Company are owned by General
Dynamics.
2. Maintenance Policy and Procedures The Navy requires each class of ship to adhere to its own specific maintenance
program. Each program delineates all preventive maintenance actions for all maintenance
echelons, including their required periodicities. To improve the readiness capability of
each ship, each maintenance program also coordinates evolutions requiring significant
time in port, such as depot-level availabilities, with the ships’ Inter-Deployment Training
Cycle (IDTC) schedule. It includes the required frequency of intermediate–level
availabilities, as well as any special maintenance, maintenance support, or infrastructure
requirements. Each program is approved through the applicable CNO Ship’s Resource
Sponsor for that class of ship, and is developed and executed by the Naval Sea Systems
Command (NAVSEASYSCOM) (OPNAVINST 4700.7K 2003, p.7).

10
The management of maintenance and maintenance support is governed by the
Navy Ships’ Maintenance and Material Management System (3-M). The 3-M System
provides managers with the ability to access standardized data to aid in planning and
controlling manpower and resources requirements in conducting preventative and
corrective maintenance, as well as a channel to provide feedback and evaluation of
procedures and resource requirements. It is designed to optimize the performance of
current and future maintenance efforts by requiring uniform maintenance standards and
criteria, documenting and analyzing maintenance and maintenance support actions, and
providing a means to schedule, plan, manage and track maintenance actions. To further
improve efficiency in accurately maintaining the status of all ships, the 3-M System is
separated into two categories, preventative maintenance and corrective maintenance
(OPNAVINST 4790.4D 2004, p.2).
a. Preventative Maintenance Preventive maintenance actions are defined as those actions intended to
prevent or discover functional failures (OPNAVINST 4700.7K 2003, Encl 7, p.7). These
maintenance items are designed to prevent costly corrective repairs by preemptively
performing minor tests and inspections designed to restore optimal operation and to
discover parts in need of replacement prior to failure. Preventative maintenance is
controlled by the Planned Maintenance System (PMS), a subset of the 3-M System that
provides a standard means for planning, scheduling, controlling, and performing planned
maintenance on all equipment (OPNAVINST 3120.32C 1994, Encl 1 p.9-3). The PMS
System is divided into two levels, organizational and intermediate/ depot-level.
(1) Organizational Level Preventative Maintenance. All non-
nuclear1 organizational-level PMS actions are contained on Maintenance Requirement
Cards (MRC). MRCs provide detailed procedures for how preventive maintenance is to
be conducted, as well as information regarding resource requirements, man-hours
expected, and the periodicity for each action. Once an organization completes a PMS
1 All nuclear preventative maintenance is governed by NAVSEAINST C9210.30A, Nuclear Reactor Plant Preventive Maintenance and Tender Nuclear Support Facilities Preventive Maintenance on Ships. This program is similar to the PMS system, and differences are insignificant in the context of this thesis.

11
item according to the MRC, it is documented on a Maintenance Index Page (MIP). MIPs
are maintained onboard the ship as a reference for verification that all required
maintenance has been completed, as well a reminder of maintenance that is due but has
been deferred and remains outstanding (OPNAVINST 4700.7K 2003, Encl 4 p.2).
(2) Intermediate- / Depot-Level Preventative Maintenance The
maintenance process is the same for shipboard preventative maintenance performed by
intermediate or depot level organizations, however the documentation is slightly
different. Intermediate and depot level organizations utilize the Maintenance Resource
Management System (MRMS) instead of the PMS System. Detailed maintenance
descriptions, resource requirements and periodicities are maintained within the Master
Job Catalog (MJC) as MJC items. MJC item completion and outstanding maintenance are
also maintained within the MJC (Ibid).
b. Corrective Maintenance Corrective maintenance consists of actions intended to return or restore
equipment to acceptable performance levels. Decisions made about corrective
maintenance actions are made in accordance with the RCM principles described
previously, in an attempt to optimize reliability and cost considerations. The decision to
perform corrective maintenance is based solely on equipment condition (OPNAVINST
4700.7K 2003, p.6).
The subset of the 3-M System used to manage shipboard corrective
maintenance is the Maintenance Data System (MDS). This system allows personnel
onboard each ship, at any time, to input any changes to the status of their equipment.
Whenever an item is determined to need corrective maintenance, shipboard personnel
designate a Job Control Number (JCN) for identification, along with a description of the
problem, parts required to fix the problem, any accompanying technical data, priority and
availability type required to complete the maintenance (depot, intermediate, additional
technical assistance, organizational).
12
The compilation of all JCNs, and their accompanying data, is known as
the Current Ship’s Maintenance Plan (CSMP). These data can be easily transmitted from
the ship to its shore-based command, where further review of the problem and final
approval of the corrective action takes place. Work packages are created and
intermediate- and depot-level availabilities are coordinated around the contents of the
ship’s CSMP. A current, accurate CSMP provides the gauge for each ship’s material
condition (Ibid).
B. NAVY MAINTENANCE CHANGE The change in the funding structure for Navy shipyard depots to be examined by
this thesis was a byproduct of a larger decision to streamline the maintenance process and
to reduce the shipyard infrastructure, thus improving the efficiency and effectiveness of
shipyard operations. The driving force behind this decision was the end of the Cold War,
which caused a paradigm shift in how the nation prepared for war and how the nation’s
resources would be allocated to support national defense.
The U.S. military policy during the Cold war resulted in tremendous capability,
and as a byproduct, infrastructure to support its forces afloat. A lynchpin of President
Reagan’s strategy was the creation of a 600 ship Navy. In 1987, the Navy had reached
568 ships (O’Rourke 2002, p.2).
The prevailing view of the country’s strategic capability requirements began to
shift beginning with the fall of the Berlin Wall and the collapse of Communism
throughout Eastern Europe in 1989. Then in 1990, the idea of a new type of war against a
regional threat manifested itself when Iraq invaded Kuwait. This new war was not against
an ideological superpower, but rather against rogue leaders aimed toward regional
domination and in pursuit of nuclear, biological, and chemical weapons. How Desert
Storm was fought began a dramatic change in how our forces were structured (Aspen
1993). By 1991, the Navy ship inventory had dropped to 526, with planning estimates
placing the 1995 number at 451 (GAO 1992, p.3).
In 1992, the National Military Strategy of the United States officially shifted the
focus from containing the spread of Communism and deterring Soviet aggression to a

13
more flexible, regionally oriented strategy. This change aimed to allow the United States
the opportunity to meet threats at lower costs, without a large mobilization of forces
(GAO 1992, p.20). Immediately upon entering office, President Clinton began the Bottom
Up Review. The goal of this study was to identify how the changes in the military should
affect force structure, modernization and infrastructure. It also identified the lack of a
strong economy as an economic danger to national security. Subsequent to the release of
the report on the Bottom Up Review, President Clinton proposed a $60 billion cut to the
Defense budget over the next six years in an effort to reduce the 1992 $425 billion
operating deficit (Larson, et al. 2001, p.41-44).
In addition to essentially halting shipbuilding, the country’s ship support
infrastructure was quickly identified as an area that could be significantly reduced. In
1992, the Joint Chiefs of Staff Depot Consolidation Study estimated a 25-50% excess
capacity within the depot maintenance system. Subsequent testimony before the Armed
Forces congressional committee found the JCS study to be conservative (GAO 1993,
p.1). During the 1991, 1993 and 1995 Base Realignment and Closure (BRAC)
Commissions, the number of depot-level shipyards was cut in half, eliminating shipyards
in Philadelphia, Pa., Long Beach, Ca., Mare Island, Ca., and Charleston, SC. The Subic
Bay, Philippines facility was also closed, leaving only two remaining overseas ship repair
facilities. Without the Navy’s shipbuilding business, the private sector was forced to
make significant changes in its operations as well. Fourteen private shipyards possessed
the capability to construct warships in 1990. By 2003, there were only six (Truver 2004).
C. CHANGE IMPLEMENTATION
Whereas increased cost effectiveness was the goal of the shipyard infrastructure
reduction, an ever shrinking budget, even for the shipyards that remained in operation,
necessitated a shift toward improved operational efficiency as well. In 1990, the Office of
the Secretary of Defense (OSD) issued a memorandum titled, Strengthening Depot
Maintenance Activities, which directed each Service to seek cost savings through
improved efficiency of operations. Later that same year, OSD established the Defense
Depot Maintenance Council (DDMC) to review DoD maintenance policies, systems,
14
programs and activities, to advise OSD on cost reduction initiatives within depot
maintenance, and to provide a forum for maintenance commands to exchange
information and ideas (DoD Directive 5128.32).
Defense Management Report Decision (DMRD) 908, issued on 17 November
1990, was the first product of the new council. In it, the council targeted savings of $3.9
billion by FY 1995 through improved short- and long-term depot operations. The
following year, the DDMC outlined how this would be accomplished in its Corporate
Business Plan for FY 91-95. The council identified increased contract competitions,
further closures, workload realignment and inter-Service transfers as the mechanism by
which the savings could be achieved (Bachmann 1995, p.23).
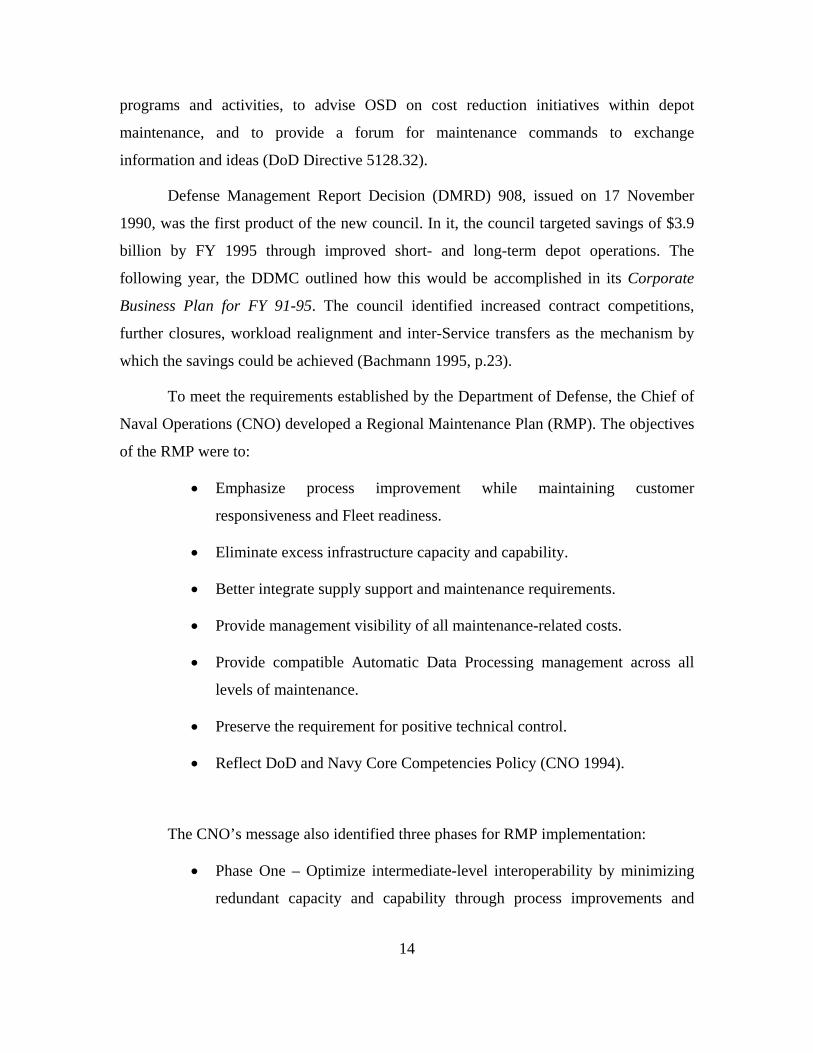
To meet the requirements established by the Department of Defense, the Chief of
Naval Operations (CNO) developed a Regional Maintenance Plan (RMP). The objectives
of the RMP were to:
• Emphasize process improvement while maintaining customer
responsiveness and Fleet readiness.
• Eliminate excess infrastructure capacity and capability.
• Better integrate supply support and maintenance requirements.
• Provide management visibility of all maintenance-related costs.
• Provide compatible Automatic Data Processing management across all
levels of maintenance.
• Preserve the requirement for positive technical control.
• Reflect DoD and Navy Core Competencies Policy (CNO 1994).
The CNO’s message also identified three phases for RMP implementation:
• Phase One – Optimize intermediate-level interoperability by minimizing
redundant capacity and capability through process improvements and

15
resource sharing, and develop prototype centers of excellence, called
Regional Repair Centers.
• Phase Two – Integrate intermediate- and depot-level activities and
establish Regional Maintenance Centers (RMC), consisting of a
confederation of Regional Repair Centers.
• Phase Three – Conduct Fleet maintenance using single maintenance
process supported by common business and production practices. (Ibid)
The RMP began to come to fruition in 1995, when the Pearl Harbor Shore
Intermediate Maintenance Activity consolidated with the Submarine Base Pearl Harbor
Intermediate Maintenance Activity, and later with a similar consolidation of the two
Puget Sound intermediate maintenance facilities. As part of these consolidations, the
Navy’s funding mechanism for its shipyards shifted from the NWCF to that of mission
funding. Chapters III and IV describe in detail the workings of these two financing
mechanisms and how they operate in the shipyard context.

16
THIS PAGE INTENTIONALLY LEFT BLANK

17
III. MISSION FUNDING
Mission funding is the term commonly used to describe the process of financing
all aspects of a Navy maintenance organization through a direct congressional
appropriation. This is the process used to fund the IMFs at the Pearl Harbor and Puget
Sound shipyards, as well as the process chosen to fund the entire shipyards once depot
and intermediate-level maintenance were combined under a single command. This
chapter describes the mission funding process, as well as its evolution and its impact on
Navy shipyards. It will also explain the intricacies of mission funded programs, to allow a
comparison with working capital funds (described in Chapter IV).
A. ORIGINS OF DIRECT APPROPRIATIONS All forms of government spending originate with a legislative appropriation. This
responsibility is articulated in Article 1, Section 9 of the Constitution:
No Money shall be drawn from the Treasury, but in Consequence of Appropriations made by Law; and a regular Statement and Account of the Receipts and Expenditures of all public Money shall be published from time to time.
The scope of this responsibility has changed dramatically since the penning of the
Constitution. Whereas early Congresses had no formal budget and were able to disperse
appropriations as individual line items, the growth of the country, both physically and
politically, has added significant complexity to the process of spending money.
The Budget and Accounting Act of 1921 established the framework for the
current budget process. This act gave the President the responsibility of establishing
central oversight for the nation’s spending priorities, requiring the President to submit a
consolidated budget request to the Congress each February. In addition, this act created
two government agencies to assist in the budget process: the Bureau of the Budget
(restructured in 1970 as the Office of Management and Budget [OMB]) was formed to
assist the President in this responsibility, and the General Accounting Office (now
Government Accountability Office [GAO]) was created to assist Congress as the
principle auditing agency of the federal government (Saturno 1996).

18
In 1974, the budget process evolved further with the passage of the Congressional
Budget and Impoundment Control Act. This legislation created the House and Senate
budget committees and provided for an annual concurrent budget resolution between the
two houses as a mechanism for facilitating a joint budgetary decision. This Act also
established the Congressional Budget Office (CBO) to support the budget committees
with independent budgetary information and expertise (Ibid). The combined result of
these two pieces of legislation essentially codified how the process works today.
B. CONGRESSIONAL BUDGET PROCESS Once the President has submitted his budget request, the House and Senate budget
committees hold hearings with analysts, staff, industry and the President’s administration
to better understand the proposal. The budget committees then submit their budgetary
estimates and overall opinion of how the budget should be constructed in a report, known
as a resolution, to be debated within their respective house of Congress.
After the entire House and Senate have had the chance to voice their opinions and
provide feedback to their respective budget committee, a budget resolution is drafted.
House and Senate conference committees then meet to resolve any differences, which
results in a composite budget resolution. This resolution is then returned to both houses
for an up or down vote. Upon being passed by both houses of Congress, this concurrent
resolution then establishes a ceiling for the respective appropriations committees in
structuring their appropriations. Although the resolution is not law, it acts as an internal
control for the rest of the budget process and can be enforced by a member of Congress if
attempted to be breached (Tyszkiewicz and Daggett 1998, p.31-32). The concurrent
resolution breaks the budget down into twenty budget functions (see Figure 1).

19
050 - National Defense 550 - Health 150 - International Affairs 570 - Medicare 250 - Space and Science 600 - Income Security 270 - Energy 650 - Social Security 300 - Natural Resources and Environment 700 - Veteran's Benefits 350 - Agriculture 750 - Justice 370 - Commerce and Housing Credit 800 - General Government 400 - Transportation 900 - Net Interest 450 - Community Development 920 - Allowances 500 - Education, Training, Employment 950 - Undistributed Offsetting Receipts
Figure 1. Congressional Budget Functions (From Author)
1. Authorization and Appropriation National Defense spending authority is typically granted by Congress through two
acts: The Defense Authorization Act and the Defense Appropriations Act. The
Authorization Act is used to set policy and authorize programs. This act provides the
legal authority for DoD to create, continue, change or abolish programs, activities and
entire agencies, as well as setting the conditions under which these functions can operate
(Ibid, p.34). The House and Senate Armed Services committees maintain jurisdiction
over the Defense Authorization Act, including the portion of the Defense Appropriation
to be allocated to Navy shipyard maintenance. The process of creating the Defense
Authorization Act is similar to the budget resolution process, except it is signed into law.
While the Authorization Act, in addition to determining which programs will be
executed, may also recommend spending levels for programs and activities, the sole
purpose of the Defense Appropriations Act is to provide funding for the authorized
agencies, programs, and activities. The annual appropriations process provides funding
for discretionary2 programs through eleven appropriations acts covering the budget
functions identified in Figure 1. The congressional appropriations process is similar to
that of the budget resolution and the authorization process. Both, the Defense
2 There are two types of government spending, Discretionary and Mandatory. Discretionary spending
requires an annual spending bill for its continued funding; whereas mandatory spending is spending that has been provided for by permanent law (e.g. Social Security and Medicare) and requires no additional legislation for its continued existence

20
Authorization Act and the Defense Appropriations Act, are passed in both houses of
Congress and are signed into law by the President.
2. Congressional Appropriations Subdivisions Congressional appropriations for the Department of Defense are divided into
seven major subdivisions, each specifically appropriated for the individual Services. The
following shows these subdivisions and the major activities the Navy funds under each:
• Military Personnel (MPN) – Includes pay and allowances for officers,
enlisted personnel and midshipmen, enlisted personnel subsistence,
permanent change of duty station travel and other personnel costs.
• Operations and Maintenance (OMN) – Includes maintenance for
operational forces, mobilization, training, recruiting, administration and
service wide support.
• Procurement – Includes Aircraft (APN), Weapons (WPN), Shipbuilding
and Conversion (SCN), Other (OPN) and ammunition procurement.
• Research, Development, Test and Evaluation (RDT&E) – Includes basic
and applied research, technology development, demonstration and
validation, engineering and manufacturing, RDT&E management support
and operational systems development.
• Revolving and Management Funds – Includes Supply Management, Depot
Maintenance, Naval Warfare Centers, Naval Research Laboratory,
Transportation, Public Work Centers and Naval Facilities Engineering
Commands.
• Other Defense Programs – Includes health care for Navy personnel.
21
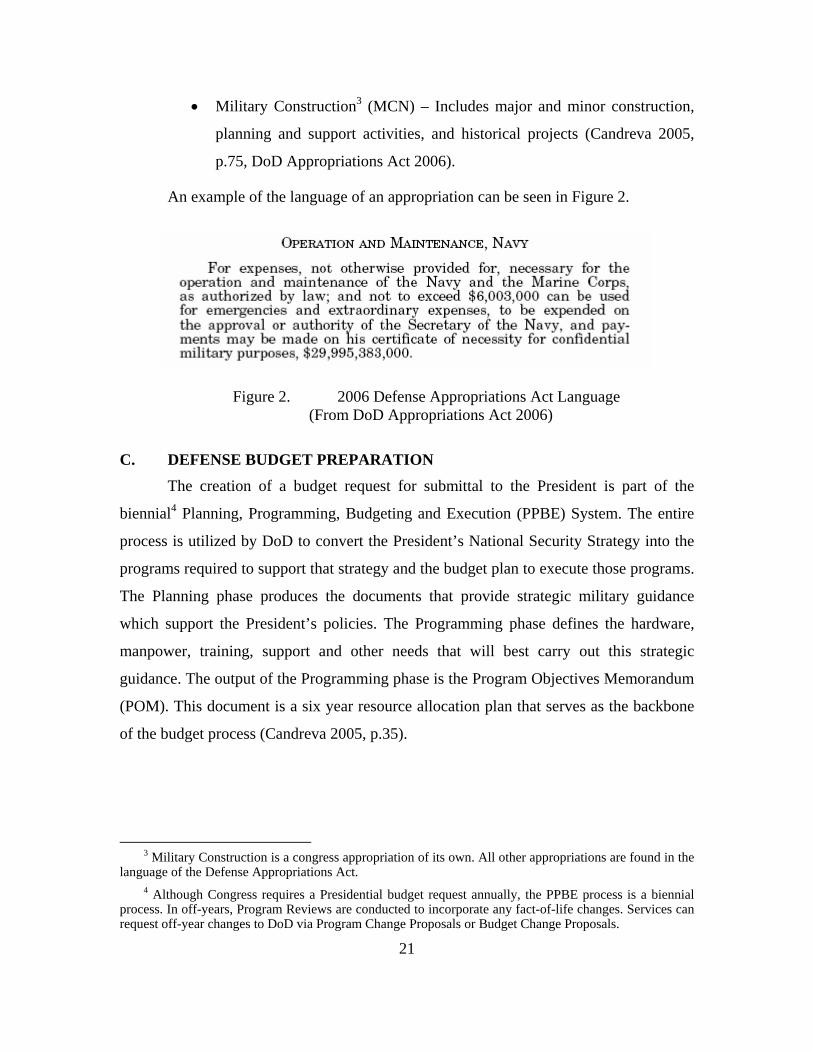
• Military Construction3 (MCN) – Includes major and minor construction,
planning and support activities, and historical projects (Candreva 2005,
p.75, DoD Appropriations Act 2006).
An example of the language of an appropriation can be seen in Figure 2.
Figure 2. 2006 Defense Appropriations Act Language (From DoD Appropriations Act 2006)
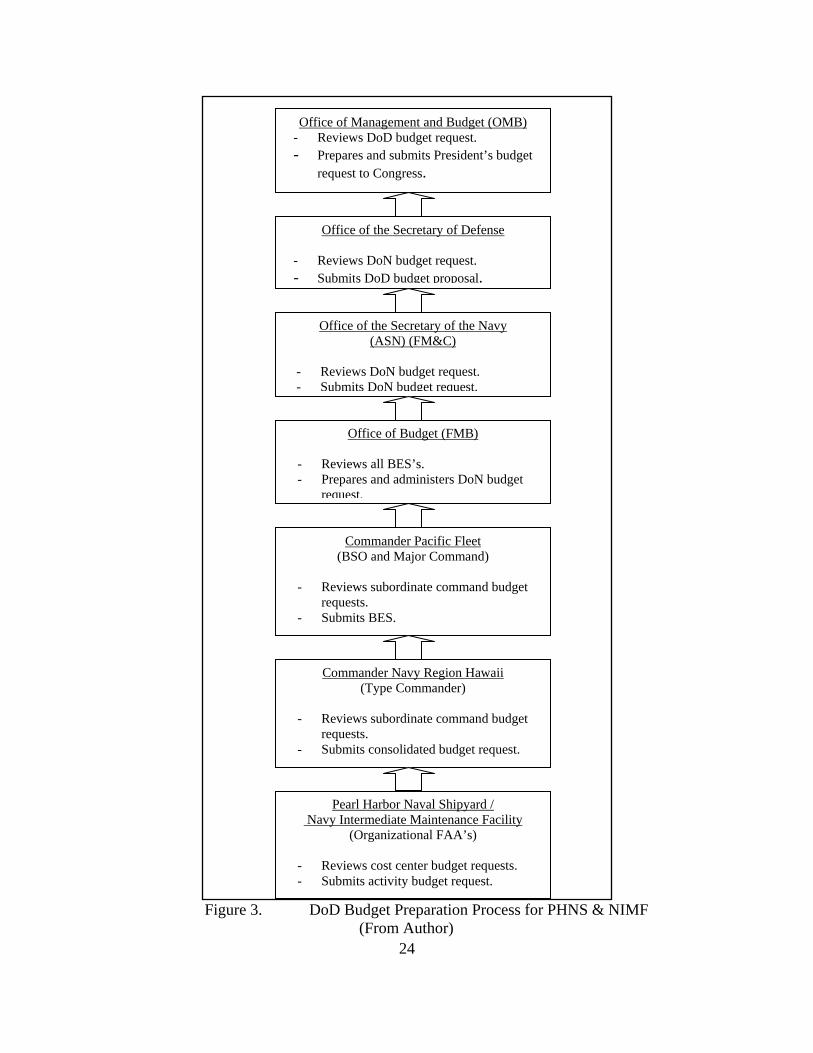
C. DEFENSE BUDGET PREPARATION The creation of a budget request for submittal to the President is part of the
biennial4 Planning, Programming, Budgeting and Execution (PPBE) System. The entire
process is utilized by DoD to convert the President’s National Security Strategy into the
programs required to support that strategy and the budget plan to execute those programs.
The Planning phase produces the documents that provide strategic military guidance
which support the President’s policies. The Programming phase defines the hardware,
manpower, training, support and other needs that will best carry out this strategic
guidance. The output of the Programming phase is the Program Objectives Memorandum
(POM). This document is a six year resource allocation plan that serves as the backbone
of the budget process (Candreva 2005, p.35).
3 Military Construction is a congress appropriation of its own. All other appropriations are found in the
language of the Defense Appropriations Act. 4 Although Congress requires a Presidential budget request annually, the PPBE process is a biennial
process. In off-years, Program Reviews are conducted to incorporate any fact-of-life changes. Services can request off-year changes to DoD via Program Change Proposals or Budget Change Proposals.

22
Budgets are built from the ground up at the Service level. The process begins at
the cost center level. A cost center is one of any number of departments within an
organization. It identifies its costs and provides this input to its organization’s Fund
Administrating Activity (FAA).
The FAA is responsible for the management of its cost centers’ resources. FAAs
evaluate and incorporate their unit’s budget requests into a consolidated organizational
budget request to submit to their assigned Type Commander, the next step in the Navy’s
operational command structure.
The budget is reviewed and refined as it is forwarded up the chain of command, to
the Budget Submitting Office (BSO), where all of a BSO’s subordinate budget requests
are consolidated into one Budget Estimate Submission (BES). This BES is then
forwarded to the Navy Office of Budget (FMB) where it is incorporated with all other
Navy BES’s into one consolidated budget request. It is approved by the Assistant
Secretary of the Navy (Financial Management & Comptroller), as well as the Secretary of
the Navy (SECNAV). Once the Navy completes its review, the budget request is sent to
the Office of the Secretary of Defense (OSD), where it undergoes another review and is
consolidated with the budgets of the other Services, becoming the DoD budget request.
Finally, the DoD budget request is sent to the Office of Management and Budget (OMB)
and is incorporated into the President’s budget (Ibid, p.49-54). Figure 3 provides an
example of the budget submission process for the mission funded Pearl Harbor Naval
Shipyard & Intermediate Maintenance Facility (PHNS & IMF).
Important to note about how the Navy prepares its budget is that, while its cost
centers provide ground level, accurate cost information, their budgets do not include the
entire cost of their organizations. In the same way Congress separates its defense
appropriation into subdivisions, the Navy also divides the responsibility for building its
budget. For example, a large portion of the government’s cost at PHNS & IMF is its
military personnel. However, this cost is not included in its budget request. Instead,
military personnel costs are budgeted on a Navy-wide level, by the BSOs that manage the
Navy’s personnel, such as the Naval Education and Training Command (NETC), the
Bureau of Medicine and Surgery (BUMED) and the Naval Personnel Command (NPC).

23
Similarly, regardless of where a building is constructed, all Navy construction is
budgeted by the Naval Engineering Facilities Command (NAVFAC) and the Naval
Installations Command (CNI) (Candreva 2005, p.37).
24
Figure 3. DoD Budget Preparation Process for PHNS & NIMF
(From Author)
Pearl Harbor Naval Shipyard / Navy Intermediate Maintenance Facility
(Organizational FAA’s)
- Reviews cost center budget requests. - Submits activity budget request.
Commander Navy Region Hawaii (Type Commander)
- Reviews subordinate command budget
requests. - Submits consolidated budget request.
Commander Pacific Fleet (BSO and Major Command)
- Reviews subordinate command budget
requests. - Submits BES.
Office of the Secretary of the Navy (ASN) (FM&C)
- Reviews DoN budget request. - Submits DoN budget request.
Office of Budget (FMB)
- Reviews all BES’s. - Prepares and administers DoN budget
request.
Office of the Secretary of Defense
- Reviews DoN budget request. - Submits DoD budget proposal.
Office of Management and Budget (OMB) - Reviews DoD budget request. - Prepares and submits President’s budget
request to Congress.

25
D. DIRECT APPROPRIATION RESTRICTIONS When the Defense Appropriations Act is signed into law by the President, the
contents of the act represent obligational authority in the amounts appropriated.
Obligational authority is the ability to enter into an agreement which will require the
government to make a payment, now or sometime in the future. For example, Figure 2
shows obligational authority for the Navy to spend $29,995,383,000 in government
money for OMN expenses. Congress does not issue this money to the Navy, but does
allow the Navy to incur expenses of this amount to be paid by the U.S. Treasury.
The obligational authority Congress grants the Navy is accompanied by rules
regarding its execution, specifically: the purpose of the expenditure, the time period in
which it is incurred and the amount available for obligation.
1. Purpose Restrictions The purpose of an appropriation can be as specific as a line item within the
Appropriations or Authorization Act. It can also be as broad as a lump sum amount for a
category like OMN. Two requirements must be met to ensure money is being obligated
for its designated purpose:
• If the purpose is included in the BES and is not otherwise prohibited by
law, it is legally available even if it is not specifically mentioned in an
appropriation.
• Likewise, if an item is otherwise prohibited by law, even if it is included
in the BES and appropriations are made available without mentioning the
item, the appropriation is not available to be obligated for that item.
To avoid requiring every minor expenditure item to be included in the BES,
agencies are given discretion concerning the purpose of their obligations under the
Necessary Expense Doctrine. If an expenditure is logically related to an appropriation, is
not prohibited by law and is not covered under a separate appropriation, it can legally be
obligated (Candreva 2005, p.73-74).

26
2. Time Period Restrictions When Congress appropriates funds for the execution of a program, it is not just
permission, it is a legal requirement. As such, appropriated funds are made available for a
set duration of time to ensure their timely execution and to prevent a stockpiling of
available funds by executive agencies.
The first period of time in the life of an appropriation is the obligation availability
period. For the duration of this period, funds are available to incur obligations. In other
words, the agencies who receive these appropriations may enter into contracts that will
require the payment of their allotted funds. This period varies for different appropriation
types. For example, due to the long term nature of a procurement account, they have three
to five year obligation availabilities, and are termed three (five) year accounts. OMN
accounts are one year accounts, which makes sense given the shorter time horizon in
funding periodic maintenance as well as the need to annually revisit the cost of funding
operational forces in light of changing world situations. Once the obligation availability
period is over, the account is considered expired and no further contracts can be incurred
under that appropriation (Ibid, p.72).
An additional requirement of an obligation availability period is that all
obligations must be used to meet a need that exists during that period. For example, if an
agency finds itself with an excess of OMN funds at the end of the fiscal year5, it is not
allowed to enter into a contract for a good or service that it does not currently need, but it
anticipates it will need during the next fiscal year. This is referred to as the Bona Fide
Needs Rule. Appropriations are available only to meet the bona fide needs of their
respective obligation availability period (Ibid, p.77).
The expiration of an appropriation’s obligation availability period does not mark
the end of its life. Although contracts must be entered into during the obligation
availability period to meet the needs arising in that period, the delivery of the goods and
services contracted does not have to be crunched into that time as well. Immediately
following the expiration of an obligation availability period begins an appropriation’s
5 All obligation periods coincide with the Federal fiscal year, from October 1 – September 30. For one year funds, the obligation availability period for that appropriation expires at the end of the fiscal year.
27
expenditure availability period. This period is five years in duration for all appropriation
types, and during this period the obligations incurred in the obligation availability period
are liquidated as the contracted goods and services are received (Ibid, p.72).
The end of the expenditure availability period marks the end of an open
appropriation. No further claims can be charged to its account and all outstanding
obligations are cancelled.
3. Obligation Amount Restrictions In addition to the congress restrictions placed on the use of funds and the periods
in which they are to be obligated and expended, there are also fiscal restrictions placed on
the amount of money available in an appropriation. The statute governing the over-
obligation of an appropriation is referred to as the Anti-Deficiency Act. Its first key
provision disallows obligations or expenditures from exceeding the amount available in
an appropriation. The second prevents the obligation of funds prior to an appropriation
being written into law (Ibid, p.79-80).
This may seem intuitively obvious, given the fact that a budget implies a
limitation on funds available to spend. However, when accompanied with time and
purpose restrictions, meeting this requirement can become tricky. If an obligation is
initially incorrectly charged to one account, in the process of correcting accounting
records it could be found that the correct account does not have the funds still available to
cover the expense of the obligation. In this example, a problem in determining the proper
purpose of an appropriation would result in the over-obligation of an appropriation,
creating an Anti-Deficiency Act violation. Problems can also occur if an obligation is
made and delivery occurs in a subsequent fiscal year, then it is determined that it was not
a bona fide need of the fiscal year in which it was obligated. In this example, the correct
funding would be from the next year’s appropriation. However, since there were no
appropriations yet authorized for the following fiscal year, the contract would be in
violation of the Anti-Deficiency Act, as it would have obligated funds prior to them being
legally available.

28
The previous scenario also displays how budgetary limitations on how long funds
are available for obligation can cause problems transitioning from one fiscal year to the
next. While the congressional budget cycle attempts to write the next fiscal year’s
Appropriations Acts prior to the end of the current fiscal year, often political differences
lead to delays. This can cause a period of time for mission funded activities where the
previous obligation availability period has expired, but no funds have been made
available for new obligations. As has been shown, managers are not allowed to enter into
contracts in the expectation of eventual funding. To combat this problem, Congress can
pass what is called a Continuing Resolution Authority (CRA). CRAs authorize
organizations to enter into new obligations at a designated spending rate until a new
Appropriations Act has been passed. Under a CRA, only programs that have previously
been authorized are allowed obligations. In other words, organizations are not allowed to
circumvent congressional review by starting new programs during a CRA period.
E. BUDGET EXECUTION FOR MISSION FUNDED ORGANIZATIONS
Once the Defense Appropriations Act is signed into law by the President, the flow
of funds follows a similar path as the budget request in the opposite direction. The
treasury first opens accounts for each appropriation in order to allow proper tracking of
the obligation made against them. It then passes this information to OMB in the form of
treasury warrants. The challenge for OMB is to then spend the funds in their entirety, for
the correct purpose, without overspending. To ensure deficiencies do not occur due to
overspending an account, Federal law requires OMB to regulate spending by distributing
funds in apportionments. In this format, spending authority is distributed incrementally,
typically quarterly. The objective is to ensure organizations have the funds necessary to
meet the full intent of the appropriation without running out of funds prior to the end of
the fiscal year.
OMB apportions funds to OSD, who then allocates funds to each Service.
Services distribute funds amongst their Major Commands. These funds are also
apportioned quarterly. The Major Commands issue spending plans, called allowances or

29
Operating Targets (OPTAR), to their subordinate commands. These FAAs are then
responsible for the execution of these plans according to their budget requests. This
process is shown in Figure 4.
F. INTERMEDIATE MAINTENANCE FACILITY OPERATIONS The two separate Intermediate Maintenance Facilities at Pearl Harbor operated as
mission funded organizations under the Pacific Fleet Command (COMPACFLT) prior to
the consolidation efforts at the PHNS. In submitting their budget proposals, the vast
majority of their costs centered on OMN expenses, which covered the costs associated
with maintaining their facilities, providing the materials and services necessary to support
the submarines and surface vessels they maintained, and paid their civilian salaries. All
military salaries were covered by the MILPERS budget requests, all new construction
requests were covered by the MILCON appropriation, and any capital expenditures were
submitted within various Procurement budget requests.
As primarily OMN budgets, IMFs utilized one year funds allotted quarterly by
their respective chain of command. Since the appropriations covering IMFs were paid for
directly through congressional appropriations, the beneficiaries of IMF work received a
free product. In other words, the applicable authorizations and appropriations designated
that the funds provided were to be used to perform a certain amount of maintenance on
ships under the supervision of the Pacific Fleet. COMPACFLT determined the
maintenance schedules and priorities, and this maintenance was conducted to the
maximum extent of their appropriations.
The financial operation of a shipyard under the NWCF varies significantly to one
receiving direct appropriations. Chapter IV explains the NWCF and its application to
Navy shipyards.

30
Figure 4. Mission Funding Budget Execution
(from Author)
Commander Navy Region Hawaii (TYCOM)
- Issues Operational Budgets to subordinates.
PHNS &NIMF (FAA)
- Issues OPTAR’s to cost centers.
Treasury Department
- Issues Appropriation Warrants to OMB.
Office of Mgt & Budget
- Apportions Funds to DOD.
Office of the Secretary of Defense USD (C)
- Allocates Funds to individual Services.
Office of the CNO (N82 Financial Mgt)
- Allocates Funds to Major Commands.
Commander Pacific Fleet (Major Command)
- Issues Operational Budget to subordinates.
Office of the Secretary of the Navy ASN (FM&C)
- Allocates Funds to CNO.

31
IV. NAVY WORKING CAPITAL FUND
Essentially all of the funding the Navy receives originates from the direct
appropriations, or mission funding (MF), written to support its mission. A unique form of
management used by specific organizations to execute this mission is the Defense
Working Capital Fund (DWCF). The DWCF is a revolving fund, it finances its own
operations by charging for the services it provides to the customers it supports. For the
organizations that utilize this financial strategy, it creates a pseudo-entity, which attempts
to adopt private business practices in meeting the needs of its customers.
A. THE FORMATION OF THE DWCF The Navy has managed various forms of revolving funds since the 1800s,
beginning with a General Account of Advances used to more effectively obtain and
distribute inventoried supplies to its sailors. Revolving funds were formally recognized
by Congress as part of the National Security Act Amendment of 1949. Prior to the formal
establishment of a DWCF, the Navy, along with the other services, maintained separate
revolving accounts in the form of stock funds and industrial funds. Stock funds managed
the procurement and distribution of inventory items and industrial funds managed
services and materials such as depot-level shipyard maintenance (Candreva 2005, p.91).
The renewed focus on the country’s economic well-being, which spurred the
defense changes discussed in Chapter II, also affected these revolving funds. In 1991,
Congress established the Defense Business Operations Fund (DBOF) to bring a business
approach to the operation of the Services’ revolving funds. The DBOF consolidated stock
funds and industrial funds from each service into a central Department of Defense (DoD)
level account. The purpose of the DBOF was to reduce the costs of operation for the
revolving fund activities by establishing increased cost visibility, thus allowing managers
to improve the quality of the products and services they provided, while also providing
those services in the most efficient and effective manner. It also allowed the overall cash
cushion to finance operations to be reduced, since the individual funds were now part of a
larger pool. Included in the DBOF were transportation, supply management, finance and

32
accounting and depot maintenance accounts. As a result of the reduction in cash levels,
problems arose in managing the cash flow for all the separate entities included in the
fund. In FY96, DoD again restructured its revolving funds to better manage the cash flow
within its account. It was divided into separate Defense Working Capital Funds (DWCF):
Navy, Army, Air Force, Defense-Wide, Defense Commissary and Other Defense. In
addition to easing the central DBOF’s cash flow management problems, this restructuring
also returned the responsibility to effectively manage these funds to the Services. The
current Navy Working Capital Fund (NWCF) is subdivided into five activity groups:
supply management, research and development, transportation, base support and depot
maintenance (OSD Comptroller iCenter).
B. NWCF OBJECTIVES The NWCF is not a congressional funding method, but a financial management
strategy for organizations that serve congressionally funded programs. Under mission
funding, a maintenance depot is run directly by the Fleet it serves. In contrast, shipyards
that operate under the NWCF are their own entities. In short, a working capital fund
changes the flow of resources and decision making for the activity utilizing its financial
structure. In the case of a Navy shipyard, without a working capital fund, the shipyard
receives funding from the appropriations process via the Fleet Command it serves.
Shipyard managers then provide maintenance to the Fleet at the level this funding can
support. From the Fleet’s perspective, once it has allocated obligation authority to the
shipyard, the maintenance it requests is prepaid. Under the NWCF, the funds from the
appropriation process are provided directly to the Fleet. The shipyard and the Fleet then
enter into a buyer/ seller relationship rather than a subordinate/ command relationship
(See Figure 5). The shipyard determines the total cost of doing business, including direct
costs, indirect costs, overhead and general and administrative expenses, and then bills the
Fleet for every job it performs (OSC Comptroller iCenter).

33
Figure 5. MF vs. NWCF Organizational Relationships (After: DOE 2003, p.4)
The goal of a NWCF within an organization is to streamline operations and
maximize resources. By establishing clear customer/provider relationships, adopting
private-sector techniques for resource management, consolidating key functions, and
using activity-based accounting policies to display full costs, NWCFs provide managers
with the cost and performance data required to make effective and efficient decisions. Its
total-cost awareness facilitates business-like processes and budget choices that are
responsive, unbiased, and mission-driven (OSD Comptroller iCenter). The NWCF
provides the following benefits:
• Identifies the total cost of DoD goods and services to Congress, military
users (buyers), and those who provide goods and services (sellers).
• Promotes more efficient and effective allocation and use of resources.
• Underlines the cost consequences of choices and allows purchases to be
made in anticipation of future funded orders.

34
• Provides managers with the financial authority and flexibility to procure
and use manpower, materials, and other resources more effectively.
• Improves cost estimates and cost control through comparison of estimates
and actual costs.
• Places customers in the position of critically evaluating purchase prices
and the quality of goods and services ordered.
• Allows for greater flexibility and security in decision making as there are
no fiscal year limitations.
• Establishes standard prices or stabilized rates and unit prices for goods and
services furnished by NWCF Business Areas, enabling customers to plan
and budget more confidently (Ibid).
C. NWCF OPERATION The term revolving fund is derived from the cyclical nature in which cash
revolves into and out of the account. Customers replenish the fund by purchasing goods
and services, while at the same time cash outflows finance the expenses necessary to
produce the desired goods and services. A key to effectively managing these accounts is
in accurately determining the total costs incurred in providing services and in forecasting
the level at which these services will be demanded. To be considered for management
using a NWCF, four criteria must be met:
• There must be identifiable goods and services provided.
• Customers requiring those outputs must also be identifiable.
• An approved accounting system must be utilized.
• An evaluation of the advantages and disadvantages of establishing a
buyer/ seller relationship must be conducted (Candreva 2005, p.93).
Once an activity group (e.g., Navy depot maintenance) is established under
NWCF management, a one-time appropriation or a transfer of funds from related
appropriations, which will be supported by the new NWCF account, are used to create the
initial pool of capital for the activity group. This capital is called a corpus. After funding

35
an activity group’s initial corpus, those activities are no longer subject to an
appropriation, but are solely reliant on customer orders to support the cost of their
operations (Ibid). This makes accurate accounting of the total costs for each activity
extremely important.
1. Cost Accounting for the NWCF NWCFs recover costs using the unit cost concept (OSD Comptroller iCenter). The
unit cost of an organization can be determined by dividing the total cost of its outputs by
the total units of output produced. In short, the unit cost is the average cost for an
organization to produce one unit of output. Figure 6 provides a simplified version of how
this is accomplished:
Figure 6. Unit Cost Calculation
(From Author)
Fleet Shipyard Incorporated (FSI) is a company that employs 100 workers and provides maintenance to keep its customers ships operational. Based on past experience and in talking with its customers, it anticipates it will incur the follow expenses in the upcoming year:
Labor Expense- (100 workers)*($100/hr)*(2000 hrs/yr) = $20,000,000 Expected Materiel expenses = $30,000,000 Overhead = $7,000,000 Depreciation = $3,000,000 Total Expected Expenses = $60,000,000
In this example, FSI expects to incur a total of $60,000,000 in expenses for 2007. This number represents its Annual Operating Budget (AOB). It has decided to allocate those expenses on a direct labor hour (DLH) basis; for every hour one person works on a job, a set price is charged to that job. FSI employs 100 workers who will work 2000 hours each this year. However, some time is spent on training, break periods, etc. and so it expects each employee to spend 1500 hours on direct labor for its customers this year. The total DLH’s available is:
(100 workers)*(1500 hours) = 150,000 DLH
To recover all of its expected costs, the following calculation determines the price FSI will charge to its customers:
($60,000,000 Expenses) / (150,000 DLH) = $400 / DLH
For every hour one person works on a job, the customer is billed $400. This represents the price, known as the stabilized billing rate, FSI will charge for the following year.

36
a. Full Cost Recovery An important difference between MF and NWCF is in calculating the total
cost of operations. As explained in Chapter III, organizations funded with direct
appropriations do not budget for many of the costs incurred by their activity; instead they
are funded by separate appropriations. For example, military personnel, funded through
the MILPERS appropriation, are separately funded assets. However, organizations that
operate under the NWCF are responsible for full cost recovery. Military personnel costs,
along with all other costs of doing business6, are required to be captured. This total cost
visibility is designed to link costs to outputs, providing managers with the information
necessary to establish causal relationships between costs and cost objects. This helps to
determine why costs were incurred, and to better provide services while minimizing the
cost associated with those services.
D. NWCF BUDGET PROCESS NWCF activities prepare an operating budget and a capital budget. The operating
budget includes all direct, indirect, and general and administrative expenses expected for
the budgeted year. The capital budget consists of the funding requested for investment
expenses such as software, infrastructure, equipment and minor construction. Similar to
the MF budget process, these cost estimates flow from the lowest organization level to
the highest. Individual activities forward their operating and capital budget information to
their activity group manager, who then forwards the collective information to the Service
level. Final adjustments are made for inflation, pay increases and other fact of life
changes. The Services also attempt to balance the NWCF budget forecast with the
maintenance budget requests for the customers the NWCF serves. The final NWCF
budget and unit cost information are then submitted to DoD as part of the overall DoD
BES (See Figure 7). DoD then issues a composite billing rate for each activity group. It is
important to note, however, that individual activities can utilize subsidiary rates that more
accurately track their costs as long as the collective sum of these individual rates meets
6 Some costs, such as war reserves, underutilized plant capacity, and mobilization costs are still funded
through direct appropriations. These items are deemed necessary for National Security, and are thus not included in the NWCF model (DoD FMR 2004, p.9-11).

37
the intent of the collective activity group rate (Candreva 2005, p.100). This allows
flexibility in assigning billing rates at separate activities, whose production levels may
vary significantly, and thus can spread fixed costs over a large customer base, helps to
minimize substantial profits or losses at individual organizations.
Figure 7. NWCF Budget/ Rate Setting Process (From Author)
Shipyard Composite Rate $$ / DLH
Department of Defense USD (C)
- Includes NWCF budgets in BES - Sets shipyard depot composite rates
Department of the Navy Office of Budget
- Make final adjustments - Balance NWCF and MF submissions
Naval Sea Systems Command (NAVSEA)
- Combines budget forecasts for all NWCF shipyards (activity groups)
Pearl Harbor Naval Shipyard Depot Maintenance Activity
- Estimates outputs and costs - Assigns unit costs
Individual Shipyards set Subsidiary Billing Rates to better match specific costs
$$ / DLH

38
E. NWCF MANAGEMENT
Looking again at Figure 6, if FSI were a private company, included in its unit cost
would be an amount above $400 to allow it to earn a profit on its investment. However,
DoD activities are not interested in making a profit, since they are not required to earn a
return to the providers of the capital they use. The difference between an activity group’s
costs and the revenue it collects on an annual basis is referred to as the Net Operating
Result (NOR). NWCFs seek to break even in their operations by achieving a NOR of
zero. Real life changes in items such as customer demand, actual billable DLHs, and
material costs can result in differences between actual revenue and expenses. Profits are
displayed as a positive NOR, and losses as a negative NOR. Over the life of an account
this difference is called the Accumulated Operating Result (AOR). To achieve a zero
AOR over the life of an account, positive or negative NORs are rolled into the future
billing rates an activity group charges (OSD Comptroller iCenter). An exception to this
for depot maintenance activities is that gains or losses of over $10M are required to be
resolved during the current FY (or the first quarter of the following FY if they occur
during the fourth quarter of a FY) (DoD FMR 2004, p.9-12).
F. WORKING CAPITAL FUND RESTRICTIONS As discussed in Chapter III, one of the biggest challenges of operating with
mission funded appropriations is meeting the restrictions Congress places on the
obligational authority it provides. MF organizations must ensure expenses meet their
authorized purpose, that they are obligated and liquidated within the allowable time
period, and that they do not spend more than the amount appropriated. NWCFs have no
such restrictions. While the customers they serve still must wrestle with these restrictions
in determining what services to request and when, a NWCF shipyard has no fiscal year
limitations in providing its services. NWCF organizations can provide their services at
any level desired, constrained only by the capacity of their facility and the demand of
their customers. Also, in the short term, by operating with a negative NOR, NWCFs
allow shipyards, by essentially under charging the price of their services, to provide the
Fleet with more maintenance than would otherwise be possible under MF. While this

39
method of operation can be seen as short sighted, since it sacrifices future maintenance
costs for those of today, it is additional operational flexibility that MF does not offer.
Despite the freedom from appropriations oversight, the NWCF does have
operating limitations to which managers must adhere.
1. Cash Management Restrictions The availability of cash is of extreme importance for the NWCF. Activities pay
their day to day expenses with the cash received from the services they provide; and
while the NWCF can operate at a loss (negative NOR), improper cash management can
result in insufficient funds to pay those expenses, which becomes an Anti-Deficiency Act
violation (DoD FMR 2004, p.9-3). To prevent this, DoD Financial Management
Regulations require NWCF activity groups to maintain cash levels to cover 7 to 10 days
of operational costs and 4 to 6 months of capital asset disbursements (Ibid, p.9-2). To
meet this requirement, plans are developed by activity groups to facilitate the cash flow
management process. These plans are created annually and submitted with the BES. They
coordinate collections, disbursements, appropriations, and estimates of other cash
transactions (Ibid, p.9-3). Since the responsibility of cash management is maintained at
the activity group level (NAVSEA for shipyards), scheduling changes and emergent
repairs must be coordinated at a higher level than the shipyard itself, which can cause
delays. Deviations in schedules can also have a ripple effect on the cash flow
management at the other NWCF shipyards controlled by NAVSEA.
2. Efficiency Limitations NWCFs are limited in the business aspects they promote. Shipyard managers do
not operate in a vacuum when making decisions about their operations. The maintenance
they perform is of the utmost importance for National Security. As a result, some costs
that might not make sense from a business perspective are still deemed necessary. This
can manifest itself in excessive inventory, contingent equipment, surge capacity and other
costs to protect against what if scenarios. Some of this expense is mitigated through a
separately funded appropriation; however, there are real limitations to business practices

40
in an environment where profit is not the sole purpose of the business. In addition, the
cost reduction incentive that exists in the private market is artificial within DoD.
Shipyards know their customer, and their customer is essentially tied to the shipyard for
their maintenance work. Thus, the pressures that cause cost improvements in the private
sector, the desire to keep or gain business and to earn a higher profit, are not present in a
public shipyard environment. Instead, the drive of vigilant management and the real
possibility of a future of dwindling defense funds must provide this incentive.

41
V. MISSION FUNDING VS. WORKING CAPITAL FUNDING
As discussed in Chapter II, the RMP undertaken by the CNO consisted of three
phases. Phase I aimed to optimize capacity and eliminate redundancy of effort by
establishing Regional Repair Centers. Phase II then integrated intermediate- and depot-
level activities into Regional Maintenance Centers (RMC). Phase III represented the end
state, the entire Fleet conducting its maintenance in a common way, capable of sharing
resources and operating as one shipyard.
The RMP began implementation in Pearl Harbor with the combination of its two
separate IMAs into one Navy Intermediate Maintenance Activity (Phase I). Subsequently,
the Navy consolidated the new IMA with the PHNS depot-level maintenance
organization (Phase II). This process was later repeated at the PSNS.
Phase II represented the more difficult of the two restructurings. Prior to the
regionalization effort, the PHNS operated under the control of NAVSEA and was
incorporated in the NWCF. Both IMAs were mission funded under the command of the
COMPACLFT, and the combined IMA operated in the same fashion. Full integration of
the two maintenance activities required the merger of separate chains of command as
well as different financial systems. It was decided to place the new PHNS and IMF under
the managerial control of COMPACLFT7, and to finance the entire organization using
direct appropriations. The funding decision was made so the Fleet could incorporate its
new organization into its already established funding structure (GAO 2001, p.25).
As PHNS was the first regionalized and consolidated maintenance activity of the
CNO’s RMP, and was thus a model for future consolidations, the Navy implemented the
Pearl Harbor Pilot in 1998 to assess the consolidation’s impact on cost, performance and
productivity. The metrics used to evaluate the consolidation were:
7 NAVSEA would still maintain control over the technical requirements and maintenance operating procedures for the ships, while the execution of those requirements fell under PACFLT

42
• Direct labor hour cost.
• Total shop labor hours required to deliver a customer direct labor hour (A
measure of personnel utilization).
• Productivity, measured by number of CSMP items completed
• Productivity, measured by CSMP backlog growth or reduction.
• Schedule adherence.
• Quality, measured by the number of deficiencies requiring rework.
• Efficiency, measured by the actual labor hours required to complete a job
compared to the budgeted labor hours expected to be required.
• Quality, measured by the number of failure reports within 6 months of
maintenance.
• Earned value, measured by the labor hours required to complete similar
work items (GAO 2001, p.26).
It is important to note that the purpose of the Pearl Harbor Pilot was not to
determine the superiority of one financing method over another, but to measure the
benefits of maintenance consolidation and to determine the worth of continuing with
further consolidations.
The effectiveness of the Pilot in measuring cost reductions and manpower
utilization improvements has been scrutinized twice by the GAO, first in 1999, and then
with a follow up report in 2001. Both, to varying degrees, evaluated the consolidations as
holding the potential for sustained maintenance improvements at Pearl Harbor, and across
Navy maintenance. The GAO also showed concern for the disagreement between the
Navy and the DoD regarding the appropriateness of choosing mission funding over
working capital funding as the preferred shipyard financing method. There were concerns
about the overall health of the rest of the NWCF if the shipyards were removed, but
specific to the shipyards, the following issues were identified:
• The potential loss of financial flexibility for shipyard managers due to the
fiscal year restrictions placed on directly appropriated funds.

43
• The loss of cost visibility for shipyards as they moved away from the
NWCF, which was designed, in part, to provide a funding mechanism that
mimicked the cost accounting and management principles of the private
sector.
• The loss of the buyer/ seller relationship between the shipyard and the
Fleet, which encouraged cost control and responsiveness to customer
requirements (GAO 1999, p.20-21).
A. PUGET SOUND PROTOTYPE Despite these concerns, the completion of the Pearl Harbor Pilot showed positive
results for the consolidation process, and in continuing with the RMP’s goal of a single
maintenance process, the Navy recommended shifting all shipyards to mission funding.
However, Program Budget Decision (PBD) 700C, “Navy Amended Budget Estimates
Submission,” January 7, 2003, created another pilot program; a two-year prototype at the
Puget Sound Naval Shipyard. This prototype integrated intermediate maintenance and
depot-level activities and financing operations with mission funding, as was done at Pearl
Harbor; the goal of the prototype was to determine the shipyard’s ability to display the
total cost visibility and performance accountability under mission funding as was
achieved by the NWCF (DoD IG 2005, p.2). The metrics used to demonstrate this ability
were:
• A document called a virtual 1307 report. This was based on NWCF
Accounting Report 1307, used to document the total cost of shipyard
operations.
• The ship availability schedule report, a measure of maintenance schedule
adherence.
• The post availability quality report.
• Customer appraisals of the quality of maintenance performed (Ibid.).

44
B. PROBLEMS WITH USING SHIPYARD DATA
The Puget Sound Pilot built upon the Pearl Harbor Pilot, in that it again displayed
the benefits of the RMP as a more efficient use of the Navy’s maintenance resources. The
additional goal of producing NWCF cost visibility in a mission funded environment,
however, uncovered the difficulty in identifying specific metrics and producing the data
that could positively confirm one financing method as superior to the other. The DoD
Inspector General was highly critical of the study, as it felt the Navy was using metrics
that built upon the Pearl Harbor Pilot showing the benefits of consolidation, but were
used to justify mission funding as the preferred method of shipyard financing. This
criticism identifies one of two major difficulties in examining data from either shipyard
to determine the better of the funding mechanisms. The combination of the IMAs and the
consolidation of the maintenance activities that occurred simultaneously with the change
in funding method, along with significant changes in shipyard maintenance requirements
due to the war on terror and other Navy and Defense initiatives, has made the effect of
changing the funding mechanism difficult to isolate. The Navy’s motivation for choosing
the metrics it used to evaluate the Puget Sound Prototype may have been to show its
consolidation plan in a positive light, but it is worth noting that when the CBO published
an interim report comparing the NWCF and MF at Navy shipyards, the metrics it
recommended for further study were also of an overall shipyard performance basis, not
an attempt to isolate the funding mechanism variable. They also included variances of
three of the four performance metrics used in the Puget Sound Prototype (CBO 2005,
p.15).
The other major problem in using shipyard performance to identify one method as
being preferable over another is that cost visibility, in and of itself, does not produce
savings; improved performance and increased savings are the result of management’s
ability to effectively employ the data they can collect. In other words, even the greatest of
metrics do not evaluate the NWCF vs. MF, but instead evaluate the shipyard managers
who use their available data to improve performance.
For these two reasons, the determination of which shipyard financial structure is
preferred should be made based on the examination of the potential advantages and

45
disadvantages of each method. The areas of cost visibility and operational and financial
flexibility were chosen since these were the cornerstones on which the arguments for
each method were made.
C. ANALYSIS OF OPERATIONAL AND FINANCIAL FLEXIBILITY
1. Personnel Flexibility
a. Personnel Cost One problem encountered after the west coast shipyards were shifted to
mission funding was that, during spikes in labor requirements, employing workers from
NWCF maintenance activities (i.e. borrowing workers from an east coast shipyard) came
at an incredible cost to the pocketbook of the mission funded activities. NWCF workers
require a funded customer order and are employed at the NWCF fully burdened DLH
rate. Conversely, if PHNS wanted to borrow workers from the mission funded PSNS, the
only cost was the incremental travel expense, since all other expenses had already been
paid through other appropriations.
From the standpoint of someone looking at the forest, and not the trees, in
this scenario the overall cost is the same under either method. However, the Fleet does
not get to operate with a big picture budget. Its funds are budgeted for nearly two years in
advance, and once set, are limited by a statutory ceiling. From their perspective, it is of
great advantage to have as much of the fixed costs associated with maintenance covered
by means other than the labor rate they are charged. Then, when mission changes
invariably occur (particularly increases), the corresponding incremental increase in their
expense to purchase more shipyard maintenance is as low as possible. This increases the
flexibility of the Fleet by allowing it to stretch its own pot of money further before it
must request a reprogramming of funds from other accounts or a supplemental
appropriation from Congress.

46
b. Workforce Utilization Since the revenue a NWCF shipyard receives is based on the number of
DLHs applied to a job, tracking this number is extremely important. As such, the Navy
has seen the administrative requirements and job cost repercussions of quickly moving
workers and assigning extra personnel to certain jobs as being a major cause of workforce
underutilization at the shipyards. Its documents showed approximately 100 to 200
workers were daily assigned to its excess labor shop as a result (GAO 1999, p.12). Under
MF, shipyard commanders can reassign workers immediately upon priority changes
without either administrative burdens or financial accounting considerations.
Although these advantages are very real, the same flexibility has been
achieved at the NNS by having the Fleet purchase a set number of labor days as a
separate expense item. Under this plan, they have had access to approximately 100
workers to generally assign to their IMF as needed (CBO 2005, p.13). Also, although the
shift to MF reduced the number of personnel assigned to excess labor to about 10 per day
at Pearl Harbor, the process for assigning workers has changed to the point that excess
workers are no longer identified by mission funded shipyards (GAO 2001, p.43). In this
case, it seems there was a clear tradeoff between accurate, relevant data and immediate
response capability. The 100 to 200 extra workers identified by the NWCF that were seen
as being underutilized could have possibly been unnecessary (if the production schedule
was not compromised by their absence), and could have eventually been eliminated.
Although personnel should not be viewed as a variable cost that can be changed annually
to adjust for demand, without tracking unused workers, personnel overcapacity will never
be able to be positively identified as a possible cost saving area.
2. Financial Flexibility
a. Fiscal Year Flexibility
As described in Chapters III and IV, the nature of direct appropriations
places significant fiscal year dependant restrictions on MF organizations that NWCF
activities do not face. These added restrictions have raised concerns regarding the ability

47
of a MF shipyard to provide maintenance service to the Fleet in the event of a funding
gap caused by a delay in an appropriation.
In theory, this is true. A shipyard operating under the NWCF is essentially
free from the fiscal year limitations imposed on MF, and can incur costs without the
written authorization of an appropriation. However, Navy shipyards do not operate in a
vacuum. In order to incur costs, they must receive revenue from their customers. The
only two customers Navy shipyards serve are the Fleet and NAVSEA, both of which are
MF organizations. This means that, in the event of a funding gap, although the shipyard
could incur costs without regard to appropriation delays, it would be illegal for their only
customers to purchase the maintenance they provide. Under either funding method,
shipyards would be permitted to continue projects that had been previously obligated but
not yet executed.
Funding gaps are not uncommon for government agencies, however most
are typically only a few days in duration and cause little disruption. The disruptions
caused by funding gaps, and even the additional restrictions placed on activities when
funding gaps are plugged by continuing resolutions, affect the obligation authority of the
customers buying the shipyards’ services and NWCF shipyards cannot divorce
themselves from the laws placed on appropriated funds.
b. Maintenance Costs Exceed Appropriations When budgets are formulated by shipyard customers and rates are set for
shipyard services, rates for materials, personnel expenses and other items must be
estimated as they cannot be known for sure in advance. For a MF organization, due to the
statutory ceiling on its spending authority, an increase in costs above what is budgeted for
results in fewer goods and services that can be provided. Fleet customers operating with a
NWCF shipyard have additional flexibility in this regard, however, due to the ability to
carry a negative NOR. In short, the Fleet can continue to pay the budgeted price and have
the shipyard eat the loss as it provides goods and services (if they have gone up in cost).
In this way, the Fleet can buy the same amount of service as it has budgeted for
regardless of price fluctuations.

48
This flexibility can be of advantage; however it does come at a price. One
year’s negative NOR is rolled into the following year’s rate, meaning the cost of the next
year’s services will include any real cost increases plus the cost increases absorbed by the
shipyard the previous year. As described in Chapter IV (p.56), NWCF shipyards can
adjust their rates quarterly to alleviate a large NOR. In this way, the Navy can choose
whether it wants to sacrifice future maintenance costs for additional service now, or if it
wants to buy its services at as close to the going rate as possible.
3. Decision Making Authority Under the NWCF, all shipyard operations are directly linked to the funding they
receive for customer orders. All operating expenses are covered with these funds, and for
this reason maintenance priorities are heavily influenced by the availability of funds,
whether from the Fleet or from NAVSEA. MF shipyards, since they receive their
operating budget from Congress, are out from under the requirement to perform the work
that has been paid for by individual customers and the burdens associated with shifting
priorities, administrative and financial. The Navy feels this organizational structure puts
maintenance decisions fully in the hands of the Fleet Commanders instead of Fleet
support activities (NAVSEA). In this way, the Navy is better able to perform its overall
mission (CBO 2006, p.9). It has been pointed out that unscheduled, emergent
availabilities have occurred and been successfully accomplished when all shipyards were
under the NWCF, and that quantitatively proving this increased responsiveness would be
extremely difficult (CBO 2005, p.14).
Even without being tied to individual customer orders, MF shipyards are not
completely free from making maintenance decisions based on financial realities. When
preparing their operating budgets, MF shipyards spread their costs between the OMN
work they plan to perform for the Fleet and the lower priority modifications and
overhauls requested by NAVSEA, for which they are reimbursed separately. If the
shipyard expected to receive 25% of their required funds from NAVSEA reimbursable
maintenance work, it would budget only for the remaining 75% to be allotted from the
Fleet. When executing its mission, the Fleet would maintain authority over which work is

49
performed and the priorities therein, but only to the point at which its 75% funding runs
out. At some point the shipyard must perform the reimbursable work to cover its annual
costs, regardless of what priority that maintenance represents (COMSUBPAC Official
Interview).
D. ANALYSIS OF COST VISIBILITY The NWCF is seen as advantageous by DoD because it creates a customer/
provider relationship, uses private business techniques to identify total cost and provides
managers with improved cost and performance data for more effective and efficient
decision making (OSD Comptroller iCenter). There are several reasons, however, why it
is difficult to operate a Navy shipyard in a private sector manner.
1. Customer/ Provider Relationship The benefit of a buyer/ seller relationship is the perceived pressure the customer
places on a business. If the service provided is not of good quality or is seen as too
expensive, the customer will buy the service elsewhere and the seller will suffer. This
provides a continual incentive for businesses to innovate and to operate efficiently and
effectively in order to provide a service which the customer sees as a value compared to
competitors. This does not exist in a shipyard environment. The lack of competition, due
to the shrinking of the U.S. shipbuilding industry, regulations regarding where certain
maintenance can be performed and the obvious convenience of performing maintenance
at the nearest shipyard (and cost of traveling elsewhere), has resulted in little, if any,
incentive to reduce the cost of operations (Trunkey and Choi 1996). There is certainly
incentive for NWCF organizations to account for their total cost of operations, since their
operations rely on positive cash flow, and negative annual NORs receive significant
scrutiny. A lack of consumer pressure, however, is evident in the fact that one year’s
operating loss can be immediately applied to the following year’s DLH rate, absorbed
entirely by the customer. Imagine the General Motors’ sales figures if they attempted to
write last year’s losses into the price of their new automobiles. Navy shipyards and the
Fleet that utilizes them are not providers and customers in the traditional sense. They are
two executive organizations that carry out congress policy.

50
2. Private Business Practices
a. Cost Accounting Activity Based Costing (ABC) is the term often used to describe the
method used by the NWCF to determine the true cost of its service and ensure full cost
recovery. The goal of ABC is to correctly assign every cost an organization incurs to the
proper product or service that caused that expense. It is useful in focusing an organization
on the profitability of each individual product or service provided rather than only being
able to judge an organization on its profitability as a whole. It can aid in pricing and is a
tool for determining the strategic direction a company should take (Garrison and Noreen
2003, p.314).
The depot level activities under the NWCF identify the process of
determining the DLH to charge as being ABC, but when the costs of every service and
maintenance item the shipyard produces are all lumped together and divided by the
number of hours worked, all that is achieved is an average price. This does not determine
the true cost of each of these services; nor does it correctly allocate the shipyard’s
expenses to the services that incur them. This system provides managers no more
information to make performance and cost decisions than is available from mission
funding budget justification materials. True ABC would determine the cost of each
individual process performed by the shipyard. The cost incurred by the shipyard to
perform preservative maintenance on a ship is not anywhere close to the cost of
performing seawater system maintenance on submarine hull penetrations. Being able to
distinguish these two services and make decisions about which to exploit or to stop
providing, and to attack specific inefficiencies are what can make ABC a very useful tool.
When every DLH is essentially assigned the same price, these tools are not available to
shipyard managers. Every ship’s maintenance availability is unique in job size and work
performed, so it becomes very difficult to find the inefficiencies from this one variable
(DLH), particularly when a DLH consists of an aggregate of all costs.
Also important to understand is, even when inefficiencies are discovered,
shipyard managers do not necessarily have the authority to reduce overhead or

51
manpower, to stop providing services that lose money, or to affect change in many of the
costs their commands incur (Trunkey and Choi 1996). The variables that a shipyard
manager does have control over are the personnel and resource utilization and other
variable costs, which are readily available under mission funding. The GAO cited this
fact when it noted that, although the mission funding system did not account for the cost
incurred by separate appropriations (which had been previously tracked under the
NWCF), it did not directly affect the shipyard commander’s ability to manage the
maintenance (GAO 2001, p.31).
b. Depreciation Expense Under the NWCF, all capital expenditures exceeding $100,000 (except for
major construction items) and having a useful life of greater than two years are approved
through the NWCF Capital Budget. These costs are then counted as assets and become a
depreciation expense charged to the customer throughout their useful life. (DoD FMR
2004, Vol. 2B p.9-4) Conversely, for MF organizations, the threshold is $250,000, above
which any capital expense is funded by the appropriate procurement account for that
expense (DoD FMR 2004, Vol. 2A p.1-12).
The NWCF method conforms more closely to that of a typical private
business. Including the costs of sustaining the infrastructure necessary to carry out the
services a shipyard provides displays the true cost to its customers. However, in the same
way as when personnel and other fixed costs are funded through other appropriations,
capital expenditures paid by procurement funds improve the financial flexibility of the
Fleet when priorities and maintenance levels change.
3. Cost Visibility for Senior Officials When a lack of cost visibility is cited as a being a negative aspect of MF, rather
than criticizing the performance capability of a shipyard under mission funding, the
concern has been with the cost reporting visibility available to senior Navy, OSD and
Congressional officials (GAO 1999, p.21/ GAO 2001, p.31/ DoD IG 2005, p.8/ CBO
2006, p.1). Under the NWCF, the Navy produced a quarterly and annual Financial
52
Statement detailing all costs, revenues and operating information for each individual
shipyard. Additionally, the NWCF has a separate section within the Navy BES which
outlines shipyard cost and performance information for each shipyard. While both reports
are also published for mission funded appropriations, the information is spread amongst
the separate appropriations that fund them and thus is not as readily available when
examining an individual shipyard. Again, this is of no effect to the operational and
decision making ability of the shipyard manager. It only changes the format of the reports
created for reviewing authority to the standard format of all other MF activities. The
decrease in cost visibility cited in the previous reports has been in regard to the difficulty
in pulling the information previously used to report the total cost of a shipyard under the
NWCF, all of which was controlled by the shipyard, from the various budget activities
that now control the funding of personnel, capital expenditures, etc. These activities
collect and track information in ways very different from the NWCF, which can make
some shipyard specific information difficult to obtain.

53
VI. CONCLUSIONS
To better utilize its resources and more effectively provide Fleet maintenance, the
Navy significantly changed its shipyard maintenance organizational model. As part of
this restructuring, it became clear that a common funding method was necessary at its
regional maintenance activities if the full benefits of consolidation were to be achieved.
Significant work has been done to analyze the outcome of the Navy’s consolidation
efforts, but this thesis sought to independently examine the merits of mission funding and
the Navy Working Capital Fund, as they apply to Navy shipyards. To do this, this thesis
laid aside the cost, productivity and worker utilization metrics that have been influenced
by factors other than funding method, and analyzed the implicit differences between the
two funding structures within the shipyard environment. The areas examined were those
of cost visibility and of operational and financial flexibility.
A. COST VISIBILITY In the area of cost visibility, the operational capability of Navy shipyards has not
suffered from the change to a MF structure. The necessary information required to make
managerial decisions that optimize a shipyard’s resources is available to the shipyard
commander. Indeed, if it could be shown that MF handicaps managerial effectiveness,
then an entire revamping of the appropriations process would be warranted to ensure
proper cost accountability. Shipyards are able to track their performance and costs in the
same manner as any other appropriated functions; and the personnel, overhead and other
costs incurred by shipyards, but funded through other organizations, can also be
effectively tracked by the commands who manage them.
1. Cost Reporting The cost visibility problems the Navy has encountered have been in reporting
total costs to senior Navy, OSD and Congressional officials in the same manner as was
previously reported under the NWCF (even though the shipyards are no longer
responsible for the governance of many of these costs). Since this problem does not affect

54
the shipyard operations, it should not be viewed as a disadvantage of MF compared to the
NWCF, but as an administrative reporting problem to be rectified with changes to future
reports. This correction was formally requested by Congress in the FY 2006 National
Defense Authorization Act (Section 322) and the Navy has responded with a
recommendation of the following changes to their budget justification materials:
• Modifications to the Ship Depot Maintenance exhibit that track workload
by individual shipyard and specific ships.
• A new comprehensive budget exhibit entitled Naval Shipyards.
• Modification of performance data to include the comparison of individual
shipyards.
• A new procurement line item entitled Shipyard Capital Investment. (CBO
2006, p.12)
Additionally the Navy has proposed changes to its Annual Budget Management
Report to better match the data previously available under the NWCF, including:
• The sum of the obligation authority provided from all appropriation
accounts used to support Navy shipyards.
• All shipyard costs consolidated into one exhibit.
• Information related to capital expenditures and military construction.
• Personnel and labor management performance data (Ibid, p.16-17).
These changes should provide for satisfactory analysis of the operational
effectiveness of each individual shipyard, and allow officials to compare shipyard data in
a manner similar to that under the NWCF, effectively neutralizing any perceived
advantages the NWCF maintained in cost reporting quality.

55
2. Business Practices The NWCF provides no clear advantage in terms of a shipyard commander’s
ability to effectively and efficiently manage his assets. The cost accounting tools utilized
do not advance the available financial data beyond that of mission funding performance
and budget reports, and the customer/ provider relationship touted as a being a driver for
continual cost and quality improvement is artificial at best. Shipyards do not serve the
Fleet in the way a private sector company serves its customers. It may be said that the
truest customers a shipyard serves are the Navy, DoD and Congress, which prepare
budgets and allocate resources to determine the amount of maintenance the Fleet will
conduct, and in this way purchase National Defense. Shipyards and the Fleet work
together to maximize the use of these appropriations for Fleet maintenance under either
funding method, but in a public setting, it seems that the most performance pressure a
shipyard would face is when it is placed under the authority of the Fleet it serves. The
nature of this relationship drives cost improvements and efficiency when the shipyard
must compete with other programs (during the budget formulation process) for its portion
of the Fleet’s limited resources.
B. OPERATIONAL AND FINANCIAL FLEXIBILITY
1. Operational Flexibility Due to the fact that most of the fixed costs associated with shipyard operations are
separately funded, mission funded shipyards have more financial flexibility when
schedule changes and emergent operations occur. These fixed costs, the costs that occur
annually, independent of the amount of maintenance performed, have already been
covered. Therefore, the cost to the Fleet to purchase additional maintenance consists only
of the incremental costs (the costs that are incurred because of the additional
maintenance) of the maintenance requested. Under the NWCF, fixed and variable costs
are both rolled into the DLH rate, the average rated required to recover all costs based on
the estimated number of billable hours the shipyard expects to work. Once this amount of
maintenance has been reached, all costs have been covered, and if additional maintenance

56
is requested, the only real cost is the variable costs associated with performing the
maintenance. However, the rate charged is still the original DLH rate. In this way, the
NWCF overcharges for maintenance performed above the level required to cover its fixed
costs, and prevents the Fleet from employing any excess shipyard capacity to the
maximum extent of its funding. Additionally, the worker tracking requirements of the
NWCF, to ensure proper cost recovery, hinder the shipyard commander’s ability to
reassign workers. These administrative financial accounting burdens disappear under MF,
further improving operational flexibility.
A negative aspect of this flexibility is that the ability to freely move workers has
come at the cost of effectively tracking personnel overcapacity. However, shipyard
commanders have little control over the manning strength of their activities, so it is not a
cost that can be managed on their level, but at the level of those who determine manning
requirements. Also, Congress and DoD have deemed it a necessary National security
investment to maintain excess shipyard capacity, to accommodate surge requirements
(U.S. Code Title 10, sec. 2464). It seems appropriate to allow those who operate the
shipyards the freedom to utilize this capacity as is seen fit rather than idling personnel
resources (in excess labor shops).
2. Financial Flexibility NWCF shipyards, in and of themselves, maintain significant financial freedom
compared to MF. They are bound by none of the fiscal year requirements MF
organizations must adhere to, and face no spending uncertainty during appropriations
delays. The caveat to this is that, since the only activities that utilize Navy shipyards are
MF, in order for any funds to reach the shipyards, they must first have met the regulations
from which the NWCF is supposedly free. Funding gaps prevent the Fleet from
purchasing maintenance shipyards could legally continue to provide.
Financial flexibility does exist for NWCF shipyards when the costs of services
vary, but even this is minimal. Although shipyards under the NWCF are permitted to
carry a negative NOR, thus allowing the Fleet to temporarily purchase more maintenance
than it can really afford, the statutory limit on this is $10 million, over which cost
57
differences must be recouped during the current fiscal year. This amount of leeway is not
enough to prevent a reprogramming of funds or the possibility of a supplemental
appropriation request in the event of a large unexpected Fleet maintenance requirement,
therefore the NWCF should not be seen as being more than minimally advantageous to
MF in terms of financial flexibility.
C. FINAL RESULTS Solid metrics to explicitly verify one funding method over another will probably
never be available. The many variables that exist make it extremely difficult to
effectively isolate the effects of funding method alone. Additionally, the differences in
work from one maintenance job to the next, along with ever changing Fleet readiness
requirements, muddle the picture even more. Furthermore, funding changes alone do not
produce results. Results stem only from management’s use of available information and
the ability to overcome the restrictions under which it is placed. To truly measure the
effects of the NWCF to MF, the same manager would have to operate the same shipyard
with the exact same maintenance requirements over a considerable period of time under
each funding method, which is clearly impractical and essentially impossible. While a
less stringent model could possibly provide an indication of the effects of a funding
change, the significant shipyard structural changes and maintenance requirement changes
that have coincided the funding shifts at Pearl Harbor and Puget Sound have prevented
this possibility.
Rather than looking at specific performance metrics (see p.55-56), this thesis
approached the question of which funding method best supports a Navy shipyard by
examining the funding structure differences between both methods and evaluating how
these differences provide exploitable opportunities for shipyard managers. Based on this
analysis, the mission funded environment provides clear operational advantages with
little, if any, financial capability drawbacks. This thesis supports the further
implementation of mission funding for the two remaining public shipyards (Norfolk, Va.
and Portsmouth, Me.) as is currently scheduled.

58
D. RECOMMENDATIONS FOR FURTHER STUDY This thesis has identified structural differences between the NWCF and MF that
affect how organizational managers utilize their resources. Several options exist for
continued study in this area.
1. Naval Aviation Depots The maintenance organization used to conduct aviation maintenance for the Navy
is very similar to that of a shipyard. However, there has been little discussion regarding a
shift from the NWCF to MF for these depots. An examination of whether any differences
between shipyards and aviation depots exist that could make the NWCF advantageous for
the aviation community, or if a push toward MF at aviation depots would be beneficial is
a topic to be considered.
2. East Coast Shipyard Funding Shifts The Norfolk Naval Shipyard and Portsmouth Naval Shipyard will be shifted to a
MF environment beginning in FY 2007. These two shipyards could provide a better
opportunity to examine the performance effects of a funding shift. The radical changes to
shipyard organization have already taken place, so year to year changes should be less
dynamic, allowing for better isolation of funding change effects.
3. One Shipyard Once the funding shifts at the final two shipyards takes place, it will allow for full
implementation of the One Shipyard maintenance concept. A future study of the benefits
achieved by this platform as well as possibilities for further alignment amongst the
Navy’s four shipyards could be extremely beneficial.

59
LIST OF REFERENCES
Aspin, Les, Secretary of Defense. Report on the Bottom Up Review. October 1993. Bachmann, Michael C. CAPT, USN. Depot Maintenance Restructuring and Weapon
System Support: The Essential Role of Program Management Teams. Program Manager. September-October 1995.
Candreva, Philip J., ed. Practical Financial Management: A Handbook for the Defense
Department Financial Manager. 6th Edition, Rev. 1. United States Naval Postgraduate School, Monterey, California, January 2005.
Garrison, Ray H. and Noreen, Eric W. Managerial Accounting. Tenth Edition. McGraw-
Hill. New York 2003.
Larson, E. V., Orletsky, D. T., Leuschner, K. Defense Planning in a Decade of Change: Lessons from the Base Force, Bottom-Up Review, and Quadrennial Defense Review. Rand publication MR-1387-AF. 2001. pp. 41-44.
O’Rourke Ronald. CRS Report for Congress. Navy Ship Procurement Rate and the
Planned Size of the Navy: Background and Issues for Congress. Report RS20535. 1 March 2002.
OSD Comptroller iCenter website. www.dtic.mil/comptroller/icenter/dwcf/htm Last
accessed 12 March 2006. COMSUBPAC Official Interview with Author. Various phone conversations from
January–March 2006. Saturno, James V. CRS Report for Congress, The Federal Budget Process: A Brief
Outline. 96-368 GOV. 26 April 1996.
Trunkey, R. Derek, and Jino Choi. 1996. The Defense Business Operations Fund (DBOF) Problems and Possible Solutions, Research Memorandum 95–196, Center for Naval Analyses, Alexandria, Va., March.
Truver, Scott. U.S. Shipyards Navigate Between a Rock and a Hard Place. Proceedings Magazine. March 2004. http://www.usni.org/proceedings/Articles04/PRO03truver.htm Last accessed 27 May 2006.
Tyskiewicz, Mary T. and Daggett, Stephen. CRS Report for Congress: A Defense Budget
Primer. CRS Report RL30002. 9 December 1998.
60
U.S. Congress: Congressional Budget Office. Comparing Working-Capital Funding and Mission Funding for Naval Shipyards: An Interim Report. 1 December 2005.
U.S. Congress: Congressional Research Service. Relationship Between Defense
Authorization and Appropriation Measures: In Brief. http://www.house.gov/hasc/about/pdfs/authapprops.pdf. Last accessed 12 February 2006.
U.S. Department of Defense Appropriations Act, 2006. H.R. 2863. U.S. Department of Defense. Defense Depot Maintenance Council. Directive 5128.32.
7 November 1990. U.S. Department of Defense Financial Management Regulation. Volume 2B, Chapter 9.
June 2004. U.S. Department of Defense Inspector General Report. Puget Sound Naval Shipyard
Mission-funded Prototype. D-2006-037. 9 December 2005. U.S. Department of Energy. Working Capital Fund: Guidebook for Creating and
Managing a Working Capital Fund Business. February 2003. www.wcf.doe.gov/guides/GrayGuidebook.pdf Last accessed 12 March 2006.
U.S. Department of the Navy: CNO Message. Regional Naval Maintenance Plan. 28
March 1994. U.S. Department of the Navy. Maintenance Policy for U.S. Navy Ships. OPNAVINST
4700.7K. 11 July, 2003. U.S. Department of the Navy. Ships’ Maintenance and Material Management (3-m)
System Policy. OPNAVINST 4790.4D. 23 January 2004. U.S. Department of the Navy. Standard Organization and Regulations of the U.S. Navy,
Chapter Nine: Ships Maintenance and Modernization. OPNAVINST 3120.32C. 11 April 1994.
U.S. General Accounting Office. Depot Maintenance: Issues in Management and
Restructuring to Support a Downsized Military (GAO/NSIAD-93-13). Washington, DC: U.S. Government Printing Office, May 1993.
U.S. General Accounting Office. Depot Maintenance: Key Financial Issues for
Consolidations at Harbor Pilot and Elsewhere Are Still Unresolved (GAO-01-19). Washington, DC: U.S. Government Printing Office, January 2001, pp. 9-20.

61
U.S. General Accounting Office. Depot Maintenance: Status of the Navy’s Pearl Harbor Pilot Project (GAO/NSIAD-99-199). Washington, DC: U.S. Government Printing Office, September 1999, pp. 3-23, 29-33.
U.S. General Accounting Office. Navy Maintenance: Fewer Shipyards May Be Needed
As Ship Repair Requirements Decline (GAO/NSIAD-93-23). Washington, DC: U.S. Government Printing Office, November 1992.
U.S. General Accounting Office. Navy Regional Maintenance: Substantial Opportunities
Exist to Build on Infrastructure Streamlining Progress (GAO/NSIAD-98-4). Washington, DC: U.S. Government Printing Office, November 1997.

62
THIS PAGE INTENTIONALLY LEFT BLANK

63
INITIAL DISTRIBUTION LIST
1. Defense Technical Information Center Ft. Belvoir, Virginia
2. Dudley Knox Library Naval Postgraduate School Monterey, California
3. The Honorable Richard Greco, Jr., Assistant Secretary of the Navy (FM&C) Navy Pentagon Washington D.C.
4. Professor Jerry McCaffery Naval Postgraduate School Monterey, California
5. Captain John Mutty, USN (Ret.) Naval Postgraduate School Monterey, California
6. Vice Admiral Thomas Hughes, USN (Ret.) Naval Postgraduate School Monterey, California
7. Professor Joseph San Miguel Naval Postgraduate School Monterey, California