Embed Size (px)
Citation preview

NAVAL POSTGRADUATE SCHOOLMonterey, California
LE~ 1981 j
. . THESIS._,NALYSIS OF RANDOMNRRORS IN
HORIZONTA SEXTANT ANGLES*
by
Gerald B ills:
/. September 098 0 '
Thesis Advisors: D. E. NortrupD. W. Leath
LLJ Approved for public release; distribution unlimited- /.. 81

S9CUP,?', CL ASSo VICATION 00 T041S PAGE (ho Dote ff,.,eEJ
RKAD INSTRUCTIf"NSREPORT DOCUMENTATION PAGE 89pOpg COUPLCT.pG FORMi REPORT IMU11mER1 GOVT ACCgSS@U NO:S RECIPIENT'S CAT ALOG NUMSER
Analysis of Random Errors inY MtersThesisocv~
Horizontal Sextant Angles Sepeme 1980INuSE
7. AuTN0fa I CONTRACT ORO*" GRN uuUEcr
Gerald B. Mills
S. P9010o0444wG @RG11ANIZATION IIAME AND ADDRESS SO- PROIN LM~ RJC.TIAE A 6 WORK UNIT NMS
Naval Postgraduate SchoolMonterey, California 93940
11 COlNTROLLING OFFICE WNE 41N0 ADDRESS It. REPORT CATE
Naval Postgraduate School September 1980Monterey, California 93940 72 umu r AE
14 MOwiTOOING AGENCY % aM, t A LOOUESSO I .feg..ao ftam C0011001111011 001100) 1S, SECURITY CLASS. (of hM.s .atem
Naval Postgraduate School UnclassifiedMonterey, Cal if ornia 93940Io.OCASPATN/WOAIN
SCHEDLEL
16. OISTRO~UTION STATEMENHT (of this Repout)
Approved for public release; distribution unlimit Acsinb
ris I RAI o
1-1aalouflced LJ
17. DISUI§UION STATEMEN4T (of tb. *&*trae n. entee tol 8110111 20 t1ff- h RG.e$) JII V 1 A%;1.1OL
ributI on/
IS. SUPPLEMENTARY NOTES Avail and/or
' ~Spec ial
0E ORS(C.~uoe ,,n.ielneapudId~oI~ p la mno. .~'..AJHydrographic Surveying; Sextant; Three-point Sextant Fix;Horizontal Sextant Angles; Horizontal Positioning
20, BTRC (CdAIIRe on evaee, side it 0106466MV dod .IIlP011I AW Wleek menWIa
The three-point sextant fix has been used for the horizontalpositioning of vessels in nearshore hydrographic surveys since1775. However, this method has only recently been modeledmathematically. The accuracy of the three-point fix depends onthe magnitude of the random and systematic errors in the anglemeasurements and the fix geometry. The random errors inhorizontal sextant measurements were investigated by analyzing
DOD 1473 01o IO CUIOaV 6S.S OVISOLITE(Page 1) S/N II-I.140
96URT CLASSIFICATION OF T"IS PAGE (We Dan0 Entred)4

64111 C66 I. FIC&Y@U TW 0m.4 0 P 60 NO fee f. m
over 1400 angles both at sea and on land. These random errorswere found to vary with the clarity of the signals beingobserved, the stability of the vessel and the experience of theobserver. The upper and lower bounds for one standard deviationwere found to be about 2.7 and 0.6 minutes of arc respectively.In addition, angular differences due to the direction ofrotation of the micrometer drum were examined as well as thevariability in the determination of sextant index error.
/
DD Foryo 1473 2S/r 0'110 13014-66eo1 suev aggAYOf 000 #atop"'~ ~*

Approved for public release; distribution unlimited
Analysis of Random Errors in HorizontalSextant Angles
by
Gerald B. MillsLieutenant Commander, NOAA
B.A., Washington State University, 1967
Submitted in partial fulfillment ofthe requirements for the degree of
MASTER OF SCIENCE IN OCEANOGRAPHY (HYDROGRAPHY)
from the
NAVAL POSTGRADUATE SCHOOLSeptember 1980
Author
Approved by: 4______________________CA__
Thesis Advisor
Co-Advisor
Char Dep, oe Oceanography
Dean of Scibnce and Engineering
3.

ABSTRACT
The three-point sextant fix has been used for the
horizontal positioning of vessels in nearshore hydrographic
surveys since 1775. However, this method has only recently
been modeled mathematically to quantify the effects of
various errors on fix accuracy. Positioning error in the
three-point fix depends on the magnitude of the random and
systematic errors in the angle measurements and the fix
geometry. Random errors in horizontal sextant measurements
were investigated by analyzing over 1400 angular observa-
tions, both at sea and on land. These errors were found to
vary with the clarity of the signals being observed, the
stability of the vessel and the experience of the observer.
The upper and lower bounds for one standard deviation
were found to be about 2.7 and 0.6 minutes of arc respec-
tively. In addition, systematic errors resulting from
angular differences due to the direction of rotation of the
micrometer drum were examined as well as the variability in
the determination of sextant index error.
'4

TABLE OF CONTENTS
I. INTRODUCTION ......... .................... 9
A. HISTORICAL BACKGROUND ...... ............. 9
B. THREE-POINT FIX METHOD AND POSITIONING ACCURACY. 11
C. OBJECTIVES ....... ................... .. 14
II. DATA COLLECTION METHODS ..... .............. 19
A. CRUISE DATA ....... .................. 19
B. STATIONARY DATA ...... ................ 25
C. INDEX ERROR AND INSTRUMENT ERROR DATA . ..... .. 26
III, DATA REDUCTION PROCEDURES ..... ............. 30
IV. RESEARCH RESULTS ....... .................. 34
A. ABILITY OF THE OBSERVER .... ............ 34
B. DISTINCTNESS OF SIGNALS .... ............ 36
C. PLATFORM STABILITY ...... ............... .38
D. DIFFERENCES DUE TO DIRECTION OF ROTATIONOF THE MICROMETER DRUM ..... ............. ..40
E. INDEX ERROR DETERMINATION .... ........... .41
F. CRUISE II SYSTEMATIC ERROR .... ........... .43
V. CONCLUSIONS ........ .................... 46
APPENDIX A. BLUNDERS AND SYSTEMATIC ERRORS AFFECTINGTHREE-POINT FIX POSITIONING ACCURACY .... 49
APPENDIX B. THEODOLITE INTERSECTION POSITION ERROR . . . 54
APPENDIX C. DATA SET STATISTICS ...... ............ 60
BIBLIOGRAPHY ......... ....................... .67
INITIAL DISTRIBUTION LIST ...... ................ 69

LIST OF TABLES
TABLE I - Previous Values for the Magnitude ofRandom Errors. ... ............. 15
TABLE II - List of Stations ..... .......... 21
TABLE III - Data Set Reference Code. ..... ...... 33
TABLE IV - Mean Differences Between SimultaneouslyMeasured Angles. ... ............ 35
TABLE V - Statistics for Inverse Distances Between MainThree-Point Fixes and Check Fixes. .. .... 36
TABLE VI - Comparison of Cruise Data to WharfNumber 2Data .. ............... 38
TABLE VII - Index Corrections from Thirty Observations. 42
TABLE VIII - Instrument Errors. ..... ......... 45
TABLE IX - Summary of Ranges of Sample StandardDeviations. ................. 46
TABLE B-i - Theodolite Positioning Errors at ThreeLociations. ... ............... 57
TABLE B-2 - Maximum Errors in Angular Best Estimates atThree Locations Due to Theodolite PositioningErrors. ................... 58
TABLE C-i - Cruise I and Cruise II Data. ... ...... 61
TABLE C-2 - Wharf Number 2 Data -Without Scopes . * .. 62
TABLE C-3 - Wharf Number 2 Data -With Scopes .. ..... 63
TABLE C-4 - Index Correction Differences ... ...... 64
TABLE C-5 - Abstract of Index Correctors from Cruise Data
and Wharf Number 2 Data. .. ......... 66
6

LIST OF FIGURES
Figure 1. Three-Point Fix Geometry ... ........... ... 12
Figure 2. Project Area and Station Locations ....... .20
Figure 3. Template, Sextant and Tribrac -Disassembled ...... ................. ... 28
Figure 4. Template, Sextant and Tribrac -Assembled ........ .................. .28
Figure 5. Data Distribution for 01 (Angle 110/205) -Cruise I (top) vs. Cruise II (bottom) . . . . 37
Figure 6. Distribution of Wharf Number 2 Data - WithoutScopes (top) vs. With Scopes (bottom) . . . . 39
Figure B-i. Angular Error at Position I Due to 2 drmsTheodolite Positioning Error of 0.594 Meters . 56
7

ACKNOWLEDGEMENTS
I would like to express sincere gratitude to my
classmates for collecting the data which made this study
possible and to LCDR Donald E. Nortrup and LCDR Dudley W.
Leath, my advisors, for their suggestions and assistance.
I would especially like to thank my loving wife B.J. for
typing the numerous versions of this thesis and for her
understanding and patience throughout its preparation.
8

I. INTRODUCTION
A. HISTORICAL BACKGROUND
Instruments for measuring the altitude of the sun or
stars have existed for over 2,000 years, but it was not
until 1730 that the forerunner of the modern marine sextant
appeared. Two inventors, John Hadley of England and Thomas
Godfrey of Philadelphia, simultaneously designed instruments
using one fixed mirror and one movable mirror to measure
angles [May 1963]. Both instruments allowed the movable
mirror to rotate through an arc of 4~50, but due to their
double mirror construction were able to measure angles up to
900.1 Hence, they were called quadrants, although octants
would have been a more proper name. These quadrants were
not readily adopted by navigators and it was 1750 before
Hadley's quadrant was in general use aboard vessels of the
East India Company [Cotter 1972].
The need to measure angles greater than 900 prompted
Captain Campbell R.N. in 1757 to suggest the enlargement of
the arc of Hadley's quadrant to 600 enabling the measurement
of angles up to 1200. Hence, the name sextant from the
Latin word sextans, "the sixth part" EBowditch 1977].
1 Bowditch (197?) discusses the optics of thisconstruction which is similar to the modern sextant.
9

Although the sextant was designed primarily for
measuring vertical angles, it can be held on its side to
measure horizontal angles as well. Rev. John Mitchell first
suggested the use of the sextant for measuring horizontal
angles in hydrographic surveying in February 1765 [Cotter
1972]. Mitchell's method of fixing a vessel consisted of
intersecting the line of position derived from a horizontal
angle between two known points2 and a position line obtained
from a compass bearing to one of the points- 1L, 1771, the
first Hydrographer to the Admiralty, Alexander Dalrymple,
suggested determining position by intersecting the lines of
position derived from horizontal angles between three or
more known points [Cotter 1972]. This principle had been
known by land surveyors since the early seventeenth century
but its application aboard ship was delayed due to the lack
of an accurate angle-measuring device.
The first application of Dalrymple's suggestion was made
by Murdoch Mackenzie II. He surveyed the channels off the
Kent coast of England between 1774 and 1777. Positions
could be plotted quickly by using a device called a three-
arm protractor or station pointer [ Admiralty Manual of
Hydrographic Surveying 19651. This method for positioning
2 A known point is a reference station whose geodetic
coordinates have been determined. Also called a horizontalcontrol point.
10

is called the three-point fix or resection method and is
used today worldwide for inshore hydrographic surveys.
There have been several changes in the equipment used
in the three-point fix method over the last 200 years. An
endless tangent screw for continuous tracking and a micro-
meter drum for increased accuracy were added to the sextant
during the twentieth century. The marine sextant is fitted
with darkened shade glasses for observation of the sun. A
specialized sounding sextant has been developed specifically
for hydrographic surveying using lighter weight materials
and more rugged construction [Inghamn 1975 ].In addition,
the sounding sextant has a wide angle low magnification
telescope and a micrometer graduated in minutes of arc. In
recent years an electronic digital sounding sextant was
developed to enter observed angles directly into a mini-
computer aboard a vessel [Umbach 1976] . Despite these
improvements in the sextant the most dramatic equipment
change has been in the area of position plotting. Shipboard
computers and automated plotters have largely replaced the
three-arm protractor resulting in increased accuracy.
B. THREE-POINT FIX METHOD AND POSITIONING ACCURACY
Figure 1 illustrates the geometry of a three-point fix.
The known stations are depicted by triangles and labelled A,
B and C. The vessel is located at point P and the observed
sextant angles are given by the symbols 01 and 02. The
4
b)
122

angle 01 and the points A and B define a locus of points
which is a circle through A, B and P. At any point on that
position circle, or line of position, the angle between A
and B is always e1. Similarly, there exists a position
circle for points B and C and angle 02. A third line of
position through points A and C is defined utilizing the
angle ( 01 + 02).
As can be seen in Figure 1, the three lines of position
intersect at point P. The accuracy of the position of P
depends on the errors in the measured quantities used for
position determination. Errors are classified into three
types: blunders, systematic errors and random errors.
Blunders are simply mistakes such as misreading a sextant
or improperly identifying a signal. 3 They are eliminated
from the data by comparison with redundant or related
observations and careful editing. Systematic errors follow
some mathematical or physical laws and therefore have a
fixed relation to a set of conditions. For example,
elevation differences in observed signals cause systematic
errors in sextant measurements. In this case the conditions
(the elevation differences) can be measured and the correc-
tions can be calculated and applied. However, the laws
associated with systematic errors are not always known.
3 A signal is a natural or artificial object located ata survey station (known point) which is used as a sightingpoint for sextant measurements.
13

Systematic errors from unknown sources can be minimized by
following sound measuring techniques and instrument
calibration procedures. Random errors are inherent in all
physical measurements and can not be removed from the data.
Their effects must be estimated statistically. An example
of random errors would be measuring a known 500 angle
several times and obtaining sextant readings between
49057.21 and 50002.81.
Blunders and systematic errors affecting the accuracy
of positions determined by the three-point fix method are
discussed in Appendix A. The random errors in horizontal
sextant measurements at sea are the subject of this paper.
C. OBJECTIVES
Until recently, there have been very few attempts to
quantify the accuracy of sextant positions. Several
formulas have been developed in the last decade to do this
using the magnitude of the random errors as one of the
parameters. Tozzi (1974) developed a series of equations
which included among other variables, the standard deviation
of the random error in measuring angles. Thomson (1977)
used the confidence intervals associated with the two angle
measurements of a three-point fix. The equation in
Bowditch (1977) includes the error in measurement of the
horizontal angles. H-einzen (1977) used the mathematical
notation for the standard deviation of the observed angles
14

in his development. Dedrick (1978) developed a formula for
the area of the error ellipse about some position given the
standard deviation of the sextant angle measurement error.
There seems to be no agreement among the various authors
as to the magnitude of these random errors. The table below
illustrates this.
Author Year Error
Goodwin 1973 6' 05.5"Ingham 1974 + 0.5'Ingham 1975 + 1.0'Thomson 1977 4'U.S. Coast Guard 1978 several minutesDedrick 1978 few to several
minutesBodnar 1978 0.7' - 1.3'
TABLE I. Previjous Values for the Magnitude of RandomErrors
The errors mentioned by Goodwin, Thomson, Dedrick and
Bodnar specifically refer to the standard deviation of the
random errors while Ingham and the U.S. Coast Guard do not.
It should also be noted that Tozzi (1974) used Goodwin's
standard deviation in his development and Heinzen (1978)
used Ingham's 1974 value. All of the above errors are
estimates arrived at through experience except those of
Goodwin and Bodnar. Goodwin arrived at his result by
calculating the standard deviation of 32 angular measure-
ments between two well defined stations. He had 32
experienced navigating officers each measure the angle once.
15

Bodnar's figures resulted from a one day experiment
aboard the NOAA Ship DAVIDSON while moored at a pier at
Lake Union in Seattle, Washington. Theodolite observations
were made from the ship to three easily identified objects
which were generally at the same elevation. Conditions of
extreme vessel stability due to tight mooring lines, little
wind and no tide enabled Bodnar to achieve agreement between
successive theodolite observations of about 0.5'. The two
angles (one of about 60 and the other about 500) were then
measured 30 times each by six officers. The means and
standard deviations were calculated for each of the 12 data
sets. All of the means were within 0.5' of the angles
determined by the theodolite measurements. The individual
standard deviations ranged from 0.7' to 1.5'. No cumula-
tive statistics were determined.
Dedrick (1978) attempted to use historical data to
arrive at his estimate. During a survey of south San
Francisco Bay between 1857 and 1858 it was common practice
to take full rounds of angles at a station. That is, angles
were measured between objects all around the horizon. He
studied 17 rounds of angles each consisting of four to
seven sextant angles. The disagreement between each round
and 3600 was generally between 10' and 20' of arc, but
ranged from 2' to 55' of arc. He states that "this data
would suggest that as an extreme upper limit, values of
of a few to several minutes of arc might be appropriate."
16

The main objective of this study was to quantify the
random errors in sextant angle measurements under varying
conditions. The factors upon which these errors are depen-
dent are: (1) the ability of the sextant observer,
(2) the visibility and distinctness of the signals, and
(3) the stability of the platform. The ability of the
sextant observer was analyzed by comparing more experienced
observers with those with less experience. All observations
were made across water on clear, somewhat windy days so that
horizontal refraction was at a minimum. The distinctness of
the signals was altered by using telescopes on the sextants
for some observations and not for others. Platform sta-
bility was analyzed by measuring angles under three
conditions: (1) vessel in moderate to heavy seas,
(2) vessel in calm seas, and (3) observer at a stationary
point on a wharf.
During the course of data collection a few other
questions arose which were related to random errors. Is
there a difference in angle measurement if the micrometer is
turned clockwise or counterclockwise? How much do individ-
uals vary when determining index error on the same sextant?
Are the manufacturer's stated instrument errors correct?
Answers to these questions and the analysis of the random
errors are discussed in later sections.
The scope of this paper does not include the positional
accuracy of three-point sextant fixes. Tozzi (197)4),
17

Heinzen (1978) and especially Dedrick (1978) covered this
subject in detail. No attempt was made to evaluate the
random errors while a vessel was underway as it would be
when running a hydrographic survey line. The data analysis
in this thesis corresponds to the use of the three-point fix
for calibrating or evaluating electronic positioning control.
18

II. DATA COLLECTION METHODS
Raw data for this study consists of sextant angle
measurements observed in the southern portion of Monterey
Bay, California. This area and the horizontal control
stations used during the project are shown in Figure 2.
All of the station positions were determined by third-order
methods or better by personnel of the National Ocean Survey.
These stations, their positions, elevations and station
numbers and the sources of this information are shown in
Table II. The data was collected both at sea and on land
and will therefore be discussed separately. All sextants
were checked each day for adjustable errors and were found
to be satisfactory.
A. CRUISE DATA
The 126-foot long research vessel ACANIA was used as
the observation platform for the anglemen (sextant
observers) during the two data collection cruises. The
position of the ship was determined for every sextant
cbservation by the standard theodolite intersection method
described by Umbach (1976). Briefly, this method consists
of occupying two horizontal control stations with
theodolites. Each theodolite operator measures the angle
between another known point and the object to be located.
19

121, 54*W 11 53-W
MUSSEL* (107).
AMERICAN CAN .
CO. STACKA(202)
3C637N .
KMBY MAST(203)
MONTEREY CO. DISK (301)
MONTEREY HARBOR LT. 6 (205)
FT. ORD SILVERWATER TANK (206)
MONTEREY
3e 36'N(10
NPGS TOWER A~I (302)
E~CRUISE I
CRUISE Ir
Figure 2. Project Area and Station Locations
20

C- \0 \0 N C
\O M0 -4 I N
0 H Z 0 z / 1 ' /
_: m 0 l 0 H 0 0
-4
2-400 -\ \0 7 0 \ 0 C\
U' -l\ N' '0 Hl
010
* 02
~~C\ .,IW CH- H~ co 00.,
H H9 H H H H H
E-4 0
H~~ '0 0rAC DU
' 0 0 '0 0 0 0 0 -4
0. 0 \0 0 0o \0 H
E-4
0p- 4\
En 01
z 04 P.4
-4 U2 0 = n
.cc 01El E-4 C\E-4 z E-4 V1 >'4 >4 -4z
0 W E 111
H10 w N 0 CV \0 n H4 C r-E- 0 0 0 0 0 0 H
21

Since the azimuth can be computed between any two known
points, the azimuth to the unknown point can be determined.
Therefore, the theodolite measurements from each station
produce lines of position, the intersection of which is the
location of the unknown point. To ensure the correctness
of the beginning azimuth, a check azimuth to a second known
point is usually observed.
Stations MUSSEL (107) and MONTEREY CO. DISK (301) were
occupied with Wild T-2 theodolites on both cruises. USE
MON (110) was observed to obtain the initial for MUSSEL
(107) and MONTEREY HARBOR LT 6 (205) was the azimuth check.
The theodolite observer at MONTEREY CO. DISK (301)
initialled on MUSSEL (107) and sighted on USE MON (11O) as
the azimuth check. (Subsequent references to these and
other stations will only be by the station numbers indicated
in Table II.) Both theodolite operators attempted to use the
center of the three anglemen as a target. However, since
this was not easily visible at all times, a bright orange
float, 2 feet in diameter, was tied to the ship's rail
beside the observers.
The sextant observers consisted of six individuals with
three levels of experience in measuring angles with sex-
tants. Two anglemen (1 and 2) had extensive horizontal
angle measurement experience. Two others (3 and 4) had
extensive experience with measuring vertical angles with a
sextant, but none with measuring horizontal angles. The
22
final two (5 and 6) had no prior sextant experience. The
six observers were divided into two groups of three. The
more experienced group consisted of the first two observers
and anglemen number 3. Each group of three measured angles
simultaneously from the aft portion of the upper deck of
ACANIA. The observers stayed within one meter of each other
to minimize the effects of eccentricity.
Observations from the ship were coordinated with those
ashore by using three portable CB radios. To reduce the
positioning errors caused by theodolite mispointings the
captain of ACANIA attempted to stay within a small area
about 450 meters NNW of the Coast Guard pier. This position
minimized the distance to the two theodolite locations and
gave an intersection angle of near 900. Unfortunately,
weather conditions made it impossible to maintain station.
Figure 2 shows the areas of operations for both cruises.
Cruise I took place under adverse weather conditions.
Winds were 20-25 knots from the WNW with seas of
approximately 5 to 8 feet. ACANIA, with its 126-foot length
and 22-foot beam, provided a very unstable platform. By
not using scopes on the sextants under these conditions of
poor platform stability, the largest value for the standard
deviation of the random errors was obtained.
Each angleman measured the angle between signals 110 and
205 a total of 32 times. In addition, the more experienced
group measured the angles required to compute ten pairs of
23

three-point fixes. Each pair of fixes was derived from a
left angle 01(110/205), a right angle 02(205/202) and a
right check angle 0 3 (205/107). The fix determined from
angles 01 and e2 was designated the main fix and the fix
computed from 01 and 0 3 was called the check fix. The
distance from the main fix to its corresponding check fix
was determined and is called the inverse distance. Blunders
in the horizontal angles can be detected by analyzing the
size of these inverse distances. If the values are less
than five meters, then the National Ocean Survey considers
that no blunders have been made. For the ten pairs of fixes
from Cruise I the mean inverse distance was 1.218 meters
with values ranging from 0.003 to 2.390 meters (standard
deviation = 0.80 meters). Planned operations to collect
additional angle data for three-point fixes were cancelled
due to worsening weather conditions and failing radios. A
total of 222 sextant angles were collected for analysis.
The weather conditions for Cruise II were much better
than those for Cruise I. The wind wF7 from the southwest
at 5 to 10 knots with no appreciable seas. However, long
period swells of 1 to 2 feet caused some vessel motion.
Scopes were used on the sextants in an attempt to determine
a reasonable least value for the standard deviation of the
random errors at sea. It was planned to also collect data
with no scopes, but a heavy rainstorm reduced visibility to
less than 1,000 meters.
24

On this cruise each angleman took 32 measurements of
the angle 110/205. As in Cruise I, angles were observed to
compute pairs of three-point fixes. The same signals were
used for both cruises. Each group measured a total of 96
angles resulting in 32 pairs of fixes. The mean inverse
distance was 0.749 meters with values ranging from 0.011
to 2.555 meters (standard deviation =0.61 meters). The
total number of angles measured for Cruise II was 384.
B. STATIONARY DATA
All of the data collected at sea was subject to possible
errors from the observers not being in the exact same
location and from the theodolite intersection method. These
errors are discussed in Appendices A and B respectively.
The random errors were also influenced by platform
stability. To evaluate the effects of this factor the
observers measured a series of angles from station 350 on
Wharf Number 2 at the Monterey Harbor. A T-2 theodolite was
used at 350 to measure the horizontal angles between 110 and
206 and between 110 and 302. These angles were measured
according to the third-order specifications prescribed by
Umbach (1976) which require four measurements with different
plate settings, all within 5 seconds of the mean.
Each of the 6 anglemen stood directly above 350 and
measured both angles 30 times with scopes and 30 times
without scopes. In addition, each 30 observation set was
25

divided such that 15 angles were measured with the
micrometer drum being turned clockwise or decreasing in
value and 15 angles were measured with counterclockwise
motion. Since the observed stations were not at the same
elevation as 350, the observed angles were not horizontal
angles. The equation from Umbach (1976) for converting
inclined angles to horizontal angles and vice versa is
given in Appendix A. The angular elevations of each object
at 350 were measured with a T-2 theodolite. Hence, the
horizontal angles 206/110 and 110/302 were converted to the
inclined angles that were observed by the sextants. The
errors were then calculated for each of the '20 sextant
angles.
C. INDEX ERROR AND INSTRUMENT ERROR DATA
Tests were conducted to determine if any systematic
errors were unaccounted for in the previous data. Each
individual determined index error for his sextant every
time he made a set of observations. However, there were
larger than expected differences of index error between
individuals using the same sextant. Individual deterinina-
tions also varied from day to day. Therefore, index errors
were studied by having each angleman make 30 measurements
of index error with each of the three sextants. The
procedure consisted of holding the sextant vertically,
observing the sea horizon and bringing the direct and
26
6

reflected images into coincidence. As before, 15
measurements were made with a clockwise micrometer drum
movement and 15 with a counterclockwise movement. A total
of 540 index error measurements were analyzed.
Instrument error was also analyzed for each sextant.
Recall that instrument error consists of graduation error
and centering error. This is determined for each instru-
ment by the manufacturer and the results are posted inside
the sextant case. Each of the three sextants used on this
project had posted correctors of 0.0 minutes for each 150
increment of' arc. To check some of these values a method
suggested by CDR. James Wintermyre of the NOAA Pacific
Marine Center's Operation Division in Seattle, Washington,
was used. He reasoned that to properly "calibrate" a
sextant or determine its instrument error for various
angles, accurate theodolite angles must first be observed
between objects. The sextant could then be used to measure
the same angles. To maximize the accuracy of this calibra-
tion the sextant must be perfectly horizontal and over the
identical point from which the theodolite angles had been
measured. To accomplish this he designed a sextant template
that would mount in a T-2 theodolite tri-brac and would
accommodate tZhree different makes of sextants. The template,
tri-brac and a sextant are shown in Figures 3 and 4.
Initially a temporary reference station was established
from which several objects at the same elevation could be
27

Figure 3. Template, Sextant and Tribrac - Disassembled
Figure 4. Template, Sextant and Tribrac Assembled
28

sighted on. The objects were the southwest edge of a
chimney, a flagpole on Wharf Number 2 and the southern edge
of the AMERICAN CAN CO. STACK (202). Their elevations were
determined to be the same as the theodolite by setting 900
on the vertical circle. The angles between the objects
were measured with the theodolite, again to third-order
specifications. Unfortunately, the theodolite did not
have a removable tri-brac. Hence the template was mounted
on another tri-brac which was centered over the station.
The "bull's-eye" level bubble of this new tri-brac was out
of adjustment. But since the proper vertical location on
each target was well determined by the theodolite, the
tri-brac was adjusted to allow sighting on these points
with the sextant. Each angle was measured 30 times with
each sextant - 15 times with a clockwise micrometer movement.
and 15 times in a counterclockwise direction. Thus, a total
of 180 angles were observed for analysis.
29

III. DATA REDUCTION PROCEDURES
All computer work for this project was done on the
IBM 360/67 system at the Naval Postgraduate School's W.R.
Church Computer Center. All programs were written in
FORTRAN IV. Program UCOMPS was used to determine positions
from three-point sextant fixes and T-2 theodolite inter-
sections. It was provided by the National Ocean Survey -
NOAA, Rockville, Maryland. Program INVERS was utilized to
compute the lengths and azimuths of lines between known
points. This program was obtained from the National
Geodetic Survey - NOAA, Rockville, Maryland. Library
routine HISTF was used for the statistical analysis of all
data for this project.
Error analysis requires that the best estimate of a
measured quantity be determined. Usually this value is the
mean of a number of measurements of a particular angle or
distance. However, the sextant angles observed during the
4 two cruises could not be treated in this manner since ACANIA
was always moving. Thus each angular measurement was a
unique and unrepeatable observation. Therefore, the best
estimate of each sextant angle observed aboard ACANIA was
derived utilizing the theodolite determined ship positions.
Inverses were computed from each position to the horizontal
control stations upon which the sextant observations were
30

made (station numbers 110, 205, 202 and 107). The
difference in forward azimuth to any two stations from the
ship's position was chosen the best estimate of that angle.
Likewise, the best estimates for the sextant angles observed
at Wharf Number 2 were the inclined angles derived from the
T-2 theodolite measurements there (see page 26).
Errors ( e ) were calculated for each observed sextant
angle (x) by subtracting the best estimate of the angle (X).
This is expressed mathematically as ei-,, xi Xi where
i is the number of the observation. The mean E ) of the
errors for each data set4 was then calculated as follows:ni; e./n where n is the total number of observations. If
the errors in the sextant angles are normally distributed
'and totally random, then by definition must be equal or
nearly equal to zero. If e does not equal zero for each
data set, then sampling errors and/or undetermined
systematic errors were present. The bounds of sampling
errors for a given probability are directly proportional to
the sample standard deviation of the data set and inversely
proportional to the square root of the number of errors
analyzed.
The sampling and systematic errors must be eliminated
when calculating the sample standard deviation ( a^) of the
4The errors determined for each observer under each
set of conditions are referred to as a data set.
31

random errors. This was done for each data set by using
the equation a Z jE(Ei )2/n)
It can be shown that Gis a measure of precision and E_ is
a measure of accuracy.
The mean of the errors ( )and the sample deviation
a ) for each data set and for some selected combination
of data sets were calculated. These results are discussed
in the next chapter and are summarized in Appendix C.
Graphs of the distribution of the errors for some of the
combined data sets are also shown. These graphs called
frequency polygons are formed by connecting the mid-points
of the tops of the bars in the histograms of the data.
A coding system was devised to simplify references to
various data sets or data set combinations. The code
consists of four or five characters and is shown in
Table III.
The fifth character of the code is used for the cruise
data if angle 01 was reobserved when collecting data for
three-point fixes. Hence, data set IN1 - 01 (2) would referA
to the second data set collected by observer 1 while mea-
suring angle 01 with no scope on Cruise I. Combinations
of data sets are referred to by the part of the data that
is common to all sets. For example, combination data set
IN - 01 would refer to all no scope observations of angle
01 on Cruise I.
32

(1) Data Origin:
I - Cruise I
II - Cruise II
W - Wharf Number 2 (Stationary)
B - Beach Lab (Index Error Data)
(2) Use of Scopes on Sextants:
N - no scopes
S - with scopes
(3) Observer Number (experience level decreases asthis number increases:
1 through 6
(4) Angle Designator:
01 - 110/205
02 - 205/202
03 - 205/107
04 - 206/110
E5 - 110/302
(5) Repeated Data Set (if necessary):
(1) first set
(2) second set
TABLE III. Data Set Reference Code
33

IV. RESEARCH RESULTS
The factors affecting the random errors in horizontal
sextant measurements are the ability of the sextant
observer, visibility and distinctness of the signals and
the stability of the platform. The effects of these factors
are not independent, and it is therefore impossible to
isolate the contribution of each error source. In addition,
errors induced by the theodolite intersection method and
errors due to eccentricity of the observers are included in
all of the data collected at sea. Statistics for all data
sets are summarized in Appendix C.
A. ABILITY OF THE OBSERVER
This factor is best evaluated by comparing the results
of the data sets for each observer under similar conditions.
The mean of the errors and the sample standard deviation are
denoted by E and a respectively. Cruise I data is
denoted by data sets beginning with IN in Table C-1. The
for observer six seems extremely large. This was likely
due to the seasickness that the individual experienced while
measuring angles. As mentioned before, the sea conditions
for Cruise I were extremely rough.
The data from Cruise II is shown in Table C-1 beginning
with code IIS. The strong positive bias of the P's will be
discussed in section F.
34t

The results of 24 data sets taken at Wharf Number 2
are indicated in Tables C-2 and C-3 by the codes beginning
with WN and WS. These data sets show no major differences
between the experienced and inexperienced observers.
Observer experience was also evaluated by comparing
simultaneously observed sextant angles. This eliminated
the effects of positioning error from the theodolite inter-
sections. The mean of the differences for each group is
shown below in Table IV for both cruises. Group 1 consisted
of observers 1-3 and group 2 of observers 4-6. Two angle
differences from group 1, Cruise I were rejected due to an
obvious blunder in one angle of 10' . All angle differences
involving observer 6, Cruise I were rejected due to their
unreliability. The values in parentheses indicate the
number of differences used to compute each mear. Some
error was introduced due to the eccentricity of the three
observers in each group. However, this error was assumed
to be the same for each group.
Cruise I Cruise II
Group 1 2.54 (19) 1.29 (96)
Group 2 3.10 (32) 1.66 (96)
TABLE IV. Mean Differences Between Simultaneously
Measured Angles (Minutes of Arc).
35

The agreement of' the group 1 observers was 0.3' to 0.5'
better than that of the group 2 observers. This was the
best indication of improvement in measuring horizontal
sextant angles due to increased experience.
B. DISTINCTNESS OF SIGNALS
The effect of' signal clarity or distinctness was
determined by comparing data collected without scopes
(Cruise I) on the sextants to that collected with scopes
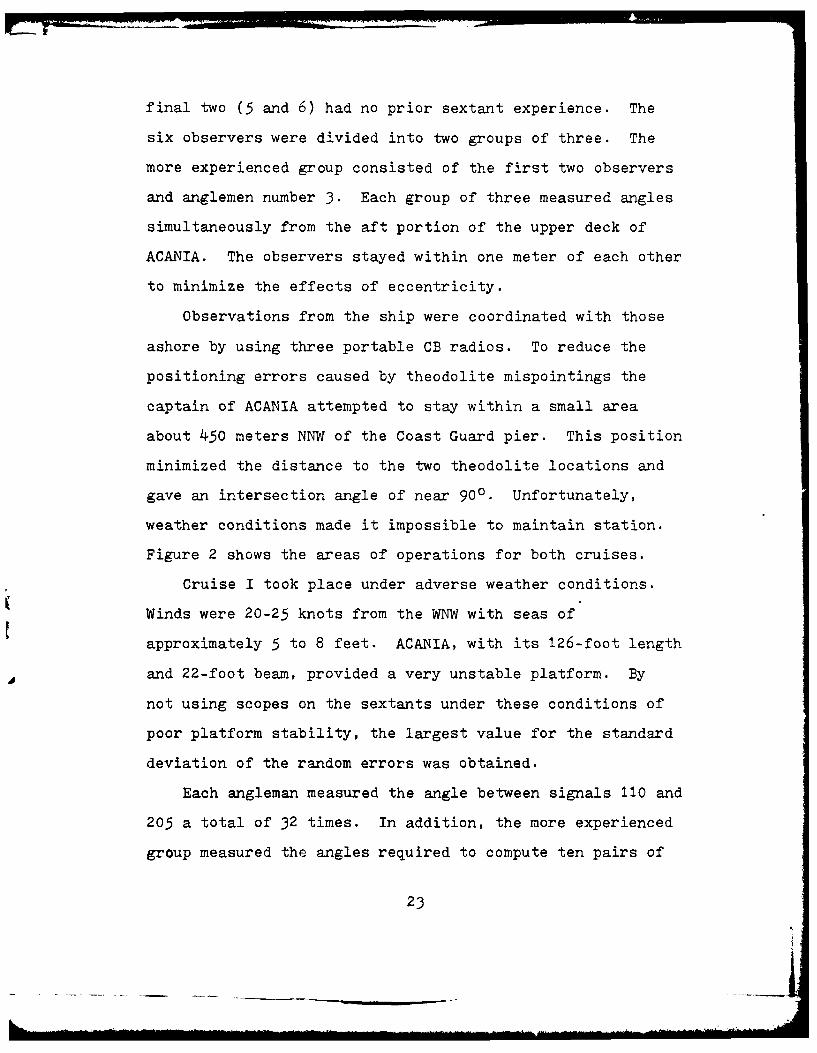
(Cruise II). The data f'or 01 (angle 110/205) f'rom Cruises
I and II are denoted by IN- 01 and IIS- 01, The cumula-
tive data f'rom these data sets is shown graphically in
Figure 5. This illustrates the increased dispersion of'
the Cruise I data compared to that of' Cruise II.
As a further comparison, inverse distances were
determined between the main three-point sextant fixes and
the corresponding check fixes. The results are shown
below in Table V. Again the number of observations used in
computing the statistics are shown in parentheses.
Cruise 1 (10) 11 (64)
1.22 0.75
0.80 0.61
TABLE V. Statistics for Inverse Distances Between MainThree-Point Fixes and Check Fixes (Minutesof Arc).
36
PL--I
0.4IN-9,
NP=167
L=-O. 320.3 &= 2.69
w.0.2i
0.1
0,0
-10.0 -5.0 0.0 5.0 10.0
ERROR (MINUTES)
0.4IIS-9,
NP=256'
e=+1.630.3
0 1.58
(,)
,,0. 2CD
U-
0.1
0.0-10.0 -5.0 0.0 5.0 10.0
ERROR (MINUTES)
Figure 5. Data Distribution for el(Angle 110/205) -Cruise I (top) vs. Cruise II (bottom)
37
__________

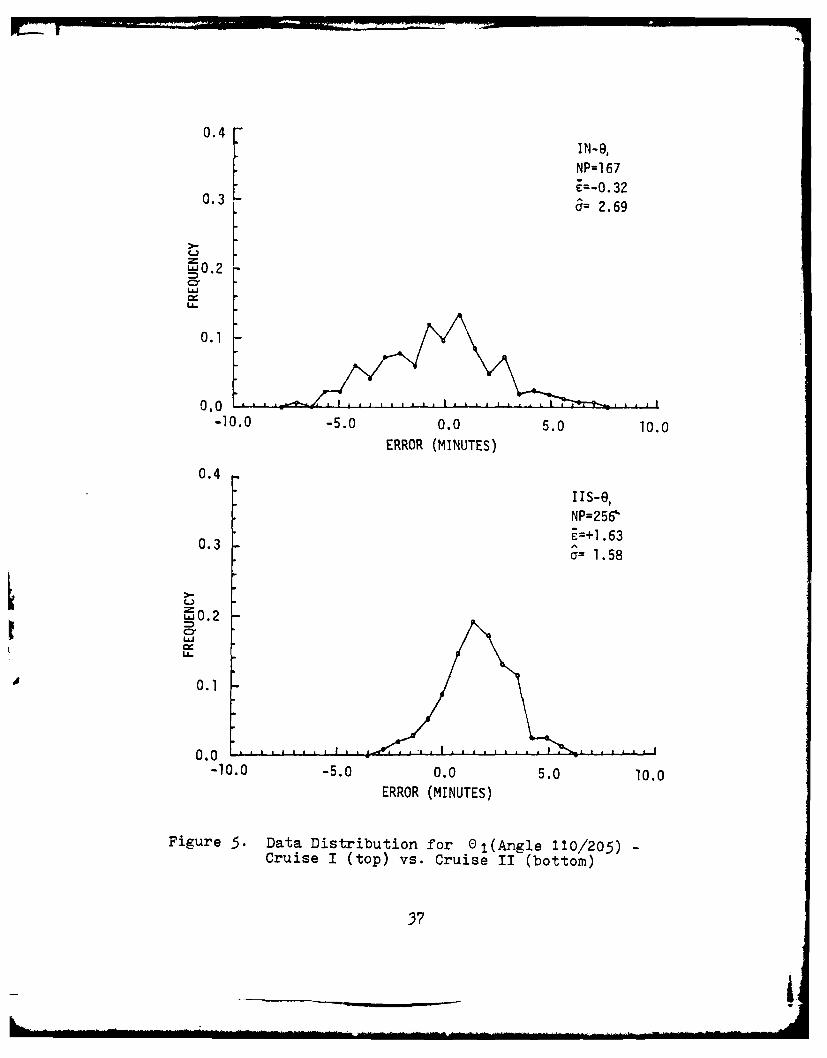
The decreased dispersion in the data from Cruise II
versus that from Cruise I is due not only to the use of the
scopes on the sextants, but also to the decrease in vessel
motion. The data at Wharf Number 2 eliminated vessel
motion completely. There were dramatic decreases in the
values of Z and a when scopes were added to the sextants.
The cumulative statistics of the data are illustrated in
Figure 6. Hence, the use of scopes on sextants decreases
the magnitude of random errors in horizontal sextant angle
measurement.
C. PLATFORM STABILITY
The effects of platform stability on random errors are
best evaluated by comparing the Cruise I data to the data
collected on Wharf Number 2 without scopes and comparing
the Cruise II data to the data collected with scopes on
Wharf Number 2. These four sets of data are shown inFigures 5 and 6. The statistics are summarized below in
Table VI.
AWharf 2 Wharf 2
Cruise I (No Scopes) Cruise II (Scopes)
-0.32 +0.89 +1.63 +0.20
2.69 2.07 1.58 0.64
TABLE VI. Comparison of Cruise Data to Wharf Number 2Data (Minutes of Arc).
38

0.4 - WN
NP=360E=+O.89
0.3 0 2.07
"0.2
0.1
0.0-10.0 -5.0 1,.0 5.0 10.0
ERROR (MINUTES)
0.4 WS
NP=360
E=+0.200.3*
03 0.64
)-
'0.2
0.1
0.0
-10.0 -5.0 0.0 5.0 10.0
ERROR (MINUTES)
Figure 6. Distribution of Wharf Number 2 Data - WithoutScopes (top) vs. With Scopes (bottom)
39
_____,,A

The increased dispersion of the cruise data is apparent
in the figures as well as the table. Hence, when vessel
stability is increased there is a significant reduction in
the magnitude of random errors.
D. DIFFERENCES DUE TO DIRECTION OF ROTATION OF THE
MICROMETER DRUM'
The differences in the Wharf Number 2 data created by
clockwise rotation of the micrometer drum versus counter-
clockwise motion are shown in Tables 0-2 and C-3.
Observations 1-15 were made with clockwise micrometer drum
movement and correspond to decreasing values. Counter-
clockwise rotation was used for observations 16-30. The
magnitude of the differences in sample standard deviations
is small - none are* greater than 0.20' for the data taken
with scopes and only 3 are greater than 0.40' for the no
* scope data. Observers 1, 3 and 5 seem to measure smaller
angles when using counterclockwise micrometer rotation.
These three all have negative i values with average Ae's
of -0.68', -0.60' and -0.50', respectively. The other
observers did not exhibit this tendency as strongly.
The procedure for collecting index error information
at the Beach Lab property was described on page 27. The
corresponding index correction (the negative of index
errors) are summarized in Table C-4. Scopes were used on
the sextants. As before, observations 1-15 were made with
clockwise micrometer drum movement and observations 16-30
4+0

with counterclockwise rotation. The magnitude of' the
dif'ferences in sample standard deviations is again small-
all are less than 0.13'. Observers 1, 3 and 5 again measure
slightly smaller angles when using counterclockwise micro-
meter rotation. Their average AE-'sare -0.20', -0.32' and
-0.48', respectively. In addition, observers 2 and 4 have
negative ti's. Theref'ore, the direction of' rotation of' the
micrometer drum may introduce some small systematic error
into sextant angle measurements.
E. INDEX ERROR DETERMINATION
Index errors were determined by each observer every day
bef'ore measuring angles. The index corrections f'or this
project are summarized in Table C-5. Each index correction
was derived using the method described by Umbach (1972).
This procedure consists of' holding the sextant vertically,
observing the sea horizon, bringing the direct and ref'lected
images into coincidence and reading the micrometer and
vernier. This is repeated several times, alternately
turning the micrometer drum clockwise and counterclockwise.
The results are averaged, and this average is the index
correction. From Table C-5 it is seen that index correc-
tions for the same sextant vary between individuals by as
much as two minutes. Even the same observer had differences
of up to 1.7 minutes from day to day.
41

Instead of this method of daily determination of index
corrections, the observations in Table C-4I can be averaged
for each observer. The results of this are shown below
in Table VII.
Observer 1 2 3 45 6
Sextant #2972 -0.50 -0.68 -0.86 -0.46 -0.50 -0.74
Sextant #2982 -0.44 -0.26 -0.44 -0.25 -0.32 -0.53
Sextant #3003 -0.39 -0.38 -0.64 -0.09 -0.50 -0.64
TABLE VII. Index Corrections from Thirty Observations(Minutes of Arc).
These results show differences from the index
corrections determined by the daily method of as much as
1.5' indicating a systematic error. If there were no
changes in index correction during the project the averages
in Table VII should be more accurate than the daily
determined correctors. Applying these newly determined
index correctors would alter the sample means of all the
previous data, but not the sample standard deviations.
These observations suggest that each angleman should
determine an index correction for his sextant by averaging
ten to fifteen measurements in each direction thereby
minimizing the magnitude of the systematic error.
42

F. CRUISE II SYSTEMATIC ERROR
Table C-1. showed that the observations of angle 110/205
during Cruise II had a positive bias of about 1.6'. Several
possible error sources for this systematic error were
considered and are described below:
(1) Mislocation of Signals 110 or 205: This did not
occur since the angles between these stations during Cruise
I showed no such positive bias.
(2) Consistent Errors in Theodolite Positioning: This
could only occur if the theodolites were mispointed on the
initial. This is highly unlikely due to the large number
of such pointings and the good agreement with the azimuth
check stations.
(3) Signals at Different Elevations: The excess angle
measured due to differing elevations ranged from 2.5" to
3.5" throughout the Cruise II work area. This was much
smaller than the 1.6' bias.
(4) Incorrect Index Corrections: It is very unlikely
that all six sextant observers could have made the same
large mistake.
(5) Collimation Error: This error occurs when the
scope is not parallel to the frame of the sextant and is
always positive. No detectable collimation error was found
when the sextants were examined using the method outlined
in The Admiralty Manual of }tydrographic Surveying (1962).
43

(6) Incorrect Instrument Error: This value is
determined for 15 degree increments of every sextant by
the manufacturer and is attached to the inside of each
sextant case. All three sextant cases had identical instru-
ment errors posted for each angle - 0.0'. This suggested
that the sextants should be checked for instrument errors.
The method suggested by CDR Wintermyre and described
earlier on page 27 was used in an attempt to evaluate the
instrument error of all three sextants. Thirty observations
were made with each sextant on two different angles. As
determined by theodolite, angle one was 28051.22' and angle
two was 47003.00'. The differences between the theodolite
measured angle and the sextant angle should only depend on
theodolite error, index error arnd instrument error if the
sexti.nts are in otherwise good adjustment. The set of four
theodolite measurements for each angle resulted in spreads
of 03.6' and 07.8" respectively. Hence, theodolite errors
were minimal. The mean index corrections that were deter-
mined from 180 measurements for each sextant were -0.40' for
sextant #2972, -0.35' for #2982 and -0.45' for #3003. The
index corrections arrived at by the author before using the
sextant template were -0.66', -0.34' and -0.54' for the
same three sextants. The difference between the theodolite
angles and the mean of the 30 sextant angles (corrected for
the author's index corrections) are shown in Table VIII.
44

Sextant Difference (Angle One) Difference (Angle Two)
2972 -0.72' -0.55'
2982 -0.65' -0.90'
3003 -0.91' -0.55'
TABLE VIII. Instrument Errors
It should be emphasized that the values in Table VIII are
errors, not corrections. Therefore, the angles measured by
the three sextants are 0.5' to 1.0' too small. This is
contrary to the results from Cruise II which showed the
sextant angles to be about 1.6' too large.
In summary, all the possible errors have been
considered. The 1.6' bias results from some unknown source.
Nevertheless, the standard deviation of the random errors
from Cruise II is not affected by this error in the sample
means.
45

V. CONCLUSIONS
The standard deviation of the random errors in
horizontal sextant measurements was found to vary mainly
with the clarity of the signals being observed and the
stability of the vessel. The differences due to observer
experience were quite small for both the cruise data and
the Wharf Number 2 data. Signal clarity was evaluated by
measuring angles both with and without scopes on the sex-
tants. This was isolated for only the Wharf Number 2 data.
The cruise data showed the combined effects of signal
clarity and platform stability and included some unknown
amount of error due to theodolite positioning.
The general range of the sample standard deviations
from the experimental data are summarized below in Table IX.
Platform Stability Scopes/No Scopes Sample Standard
Deviation
Unstable (Cruise I) No Scopes 2.3'-3.6,
Somewhat stable Scopes 1.3'-1.8,
(Cruise II)
Very Stable No Scopes 0.91-2.0'(Wharf Number 2)
Very Stable Scopes 0.3,-o.8,(Wharf Number 2)
TABLE IX. Summary of Ranges of Sample Standard
Deviations.
4i6
Although the above table illustrates the range of
values for all observers, the cumulative statistics for all
the data collected under each set of conditions give a
better estimate of the magnitude of the random errors. The
sample standard deviation for all angles measured with no
scopes on an unstable platform is 2.69' and represents the
probable upper bound. The lower limit for the sample
standard deviation was derived from the Wharf Number 2 data
with scopes and is determined to be 0.64'.
Index corrections for a given sextant may vary from
individual to individual, but probably not by more than
0.5'. Some individuals measure consistently smaller or
larger angles (by as much as 0.6') depending on the direc-
tion of rotation of the micrometer drum. Therefore, for
increased accuracy, index corre-ctions should be determined
by averaging ten or more measurements in each direction.
Some suggestions for further work in this area are
appropriate. By using three T-2 theodolites to obtain a
least square adjusted ship position, a more accurate set
of statistics could be obtained for angles measured at sea.
Various types of signals could be used at station locations
to further determine the dependency of random error on
signal clarity. The most variable quantity in attempting to
quantify the random errors in horizontal sextant measure-
ments is the ability of the observer. Although over 1400
horizontal angles were analyzed, only six sextant observers
47

were used. Further work with different observers would
give a broader data base. Nevertheless, this study does
present analytically derived values for the standard devia-
tion of random errors in horizontal sextant measurements
where only estimates existed before.
48

APPENDIX A: BLUNDERS AND SYSTEMATIC ERRORSAFFECTING THREE-POINT FIX POSITIONING ACCURACY
The potential blunders associated with three-point fixes
include the following:
(1) Misread Sextant: This blunder is not readily
identified for individual fixes. However, when conducting
a hydrographic survey, consecutive fixes fall in a straight
line if the vessel is carefully steered. A misread sextant
angle will cause the fix to deviate from this line. The
fix is then either rejected or an artificial position is
created using dead reckoning.
(2) Misplotted Fix: This generally occurs only with
manually plotted fixes and is identified by the same method
as the error above. It is corrected by simply replotting
the fix.
(3) Improper Identification of a Signal: This error,
like the above two errors, is not easily discovered when
only one fix is taken. Even along a carefully steered
survey line, it may go undetected if the same erroneous
signal is used throughout. But if the observer switches
from that signal to a correct signal while on line the
resulting fix will deviate from the straight line created
by the previous fixes. The sextant data may be retained
and the correct positions determined if the misidentified
signal can be properly identified.
49

The systematic errors that result in reduced accuracy
of three-point fixes are as follows:
(1) Weak Fix Geometry: Strong geometry exists for a
three-point fix when two of the three lines of position
intersect at right angles. A fix has weak geometry when
the three lines of positions approach coincidence. This
greatly increases the effect of other errors on positional
accuracy. Various fix geometries are discussed by Umbach
(1976), Bowditch (1977) and Dedrick (1978). The effects
of weak fix geometry are minimized by following the general
rule specified by these authors.
(2) Station Positions in Error: This error is similar
to misidentifying a signal and its detection is also similar
if the station position error is large. Small errors in
station positions will often be undetected and will alway-s
be present in any three-point fix. Heinzen (1977) and
Dedrick (1978) both discuss the three-point fix positional
errors caused by incorrect station positions.
(3) Phase Error: The apparent displacement of a
signal due to unequal illumination of its surface is called
phase error. It is dependent on the shape of the signal,
the angle of the sun with the line of sight, and the
intensity of the sunlight. Water tanks may be especially
susceptible to this kind of error. Formulas for correction
of phase are usually not practicable due to the numerous
factors upon which the correction depends [Gossett 1971].
50

(4i) Observer and Observed Signals Not at the Same
Elevation: The angle observed between signals with
elevations differing from that of the observer are called
inclined angles. This error is minimized by choosing
signals that are at the same elevation as the observer. If
this is not possible the inclined angle can be reduced to a
horizontal angle by using the following formula from
Umbach (1976):
Co = Cos 0 - sin~ht)sin"h)
C = the horizontal angle0 = the observed inclined angleh= the angular elevation of station 1 above the
observerh= the angular elevation of station 2 above the
observer
(5) Two-Observer Eccentric Error: This error is caused
by the angle observers not being at exactly the same point.k The magnitude is dependent on the distance between the
observers and the angle of intersection of the two lines of
position. Dedrick (1978) discusses this error and shows
that for a separation distance of 3.0 feet and a 50 0 angle
of intersection, the maximum error in the position is about
4.3 feet. It is minimized by selecting strong fix geometry
and by having the angle observers stand as close together
as possible.
(6) Horizontal Refraction: Differences in th'e density
of air along a line of sight can cause bending or refraction
51

of light rays. Vertical refraction is usually larger than
horizontal refraction due to the air being stratified with
denser layers near the ground. These layers are not hori-
zontal over terrain that is sloping or unevenly heated and
hence, horizontal refraction occurs. A line of sight pass-
ing partly over water and partly over land is an example of
unevenly heated terrain. Errors due to horizontal refrac-
tion can be as large as 10 to 18 seconds of arc [Gossett
1971).
(7) Sextant Parallax: This is caused by the separation
between the center of the index mirror and the line joining
the telescope axis and horizon glass (usually about 4 to 6
cm). It decreases as the range to the station increases.
For a separation of 4.3 cm the parallax correction decreases
from 0.49' of arc at 1000 feet to 0.05' of arc atl10,000
feet [Dedrick 1978].
(8) Sextant Errors: There are seven sources of error in
the modern sounding sextant - 4 adjustable and 3 nonadjust-
able [Bowditch 1977] . One nonadjustable error is called
prismatic error and results from the two faces of the mirrors
not being parallel. The other two nonadjustable errors are
graduation errors (due to the arc or micrometer being
improperly cut) and centering error (due to the index arm
not pivoting at the exact center of curvature). These are
usually combined into one error called instrument error for
which the manufacturer provides a correction table. The
52

adjustable errors are those resulting from nonperpendic-
ularity of (1) the frame and the index mirror, and (2) the
frame and horizon glass (side error) and the lack of
parallelism between, (3) the index mirror and horizon glass
at zero setting (index error), and (4) the telescope to the
frame (collimation error). Bowditch (1977) explains each
of these errors in detail and methods of adjustment to
minimize them.
53

APPENDIX B: THEODOLITE INTERSECTION POSITION ERROR
The best estimate for each sextant angle observed aboard
ACANIA was derived from the corresponding T-2 theodolite
determined position. Errors in these positions caused
inaccuracies in the best estimates of the angles. The
magnitude of these positional errors was dependent on the'
angular resolution of the theodolite arnd the distance from
the theodolite to the position. A well-trained observer
using a T-2 theodolite on a stationary target during day-
light hours can measure an angle within t2.5" ninety percent
of the time when sixteen plate settings are used [Cervarich
1966]. This yields a standard deviation of' 1.5". However,
for only one observation on a moving target such as ACANIA,
a larger value must be used. Heinzen (1977) states that the
angular error in measuring azimuths for hydrographic vessel
positioning is t36 seconds. He does not present the method
used to derive this value, what probability is associated
with it or to what instrument it applies. Experience
indicates that this value is quite large, but to derive the
largest expected error in theodolite positioning of a
moving target it was assumed that the standard deviation of
the T-2 theodolite measurements was 36 seconds. A more
reasonable value of 20 seconds was also used for comparison.
54

The theodolite positioning error had varying effects on
the computed best estimates used for the sextant angles. If
displacement was along the circular line of position deter-
mined by the ship and the two signals then the error in the
best estimate was zero. Displacement normal to this line
resulted in the maximum error. The maximum errors were
determined for three points chosen near the extremes of the
work area and are summarized in Tables B-i and B-2. The
derivation of the values in these tables follows.
The root mean square error (drms) of a position is the
square root of the sum of the squares of the standard
deviations along the major and minor axes of a probability
ellipse. This is given by the equation 1 drms = 02 + 0y
The values ax and ay are not the same as the standard
deviations of the errors in the lines of position which are
given by al and G2. However, for two independent lines of
position, they are related by the following two equations
from Bowditch (1977):
cy2 1 [ 2 +a2 + q(a2 + a2) - 4sin 2 a2° 2
02= a [ 2 + 2 - a2 + a2) - 4sin 2(2
Y 2sin 20 1 2 1 2 1 2
0 is the angle of cut or angle of intersection of the two
lines of position. The result of substituting these
equations into the formula for root mean square error is
1 drms 2in
55
........

For an azimuthal line of position the standard deviation
of the error is of the form ai - ri sina for small values
of a. ri is the range from the point to the theodolite
station and a is the angular resolution or the standard
deviation of the angular measurement. By substitution the
root mean square error for azimuthal systems is finally
given by 1 drms 2 . The probability
associated with root mean square error is not constant but
varies with the relationship between ax and ay. The
probabilities in Table B-i that result from the three values
of Gy/ ax were derived from Bowditch (1977).
The errors in the best estimates of the angles ( 01I,
0 2 and 03 ) in Table B-2 were derived by contouring the
errors which resulted from shifting the theodolite deter-
mined positions + 1 meter in latitude and longitude. An
example is shown below in Figure B-i.-1' o' +1'
-1.70 -0.18' +1.35'XX X
- 1 -.53 ' O '1 ' + 1.53'x- -
\ K
-1,35 0.18' +1.71'
Figure B-I. Angular Error at Position I Due to 2 drmsTheodolite Positioning Error of 0.594 Meters
56

POSITION 1 2 3
Latitude (N) 36037-09.825" 36036'48.222" 36037'07.210"Longitude (W) 121053'30.088" 121053'03.284" 121052'31.133"
rl 1064m 1933m 2520m
r2 1171m 715m 1701m
8 68.60 72.40 47.10
a1 20" 20" 20"
a1 .103m .187m .244m
a2 .114m 069m .165m
ax .137m .198m .374may .092m 069m .147may/0 x .674 .348 •393
1 drms .165m .210m .402m
Prob. (1 drms) 64.3% 67.4% 67.2%
2 drms .330m .420m .804m
Prob. (2 drms) 97.6% 96.3% 96.5%
a2 36" 36" 36"
a1 .186m .337m .440m
a2 .204m .125m .297m
ax .246m .356m .675may .166m .124m .264m
Cry/ox .674 .349 .392
1 drms .297m .377m .725m
Prob. (1 drms) 64.3% 67.4% 67.2%
2 drms .594m .754m 1.450m
Prob. (2 drms) 97.6% 96.3% 96.5%
TABLE B-I. Theodolite Positioning Errors at ThreeLocations
57
OI~i IA

POSITION 1 2 3
Latitude (N) 36037,09.825"1 36036'48.222" 36037'07.210o.Longitude (W) 121053130.088'' 12105303.284- 121052-31.133"
Ot 20" 20" 20"
2 drms 0.330m 0.420m 0.804m
e, error 0.5' 1.9' 1.2'
02 error 1.5' 2.1' 1.2'
0 error 1.7' 2.2' 1.3'3
a2 36" 36" 36"
2 drms 0.594m 0.754m 1.450m@I error 0.9' 3.5' 2.1'
02 error 2.7' 3.8' 2.1'
03 error 3.0' 3.9' 2.3'
TABLE B-2. Maximum Errors in Angular Best Estimates atThree Locations Due to Theodolite PositioningErrors.
58

The origin in the above figure represents position 1.
The grid around the origin are I meter shifts in latitude
and longitude. The value at each grid point is the differ-
ence in the angle 01 at that point compared to the origin.
By drawing the appropriate drms circle (in this case 2 drms
= 0.594m) the corresponding angular error can be found.
It can be seen from Table B-2 that the angular errors
induced by the theodolite positioning errors are not
insignificant. However, the precise amount of error in the
best estimates is indeterminant since the angular resolution
of the T-2 theodolite angles is not known. The average
distance between the theodolite determined positions and
the corresponding mean sextant fixes for both cruises was
1.05m. In conclusion, the random errors in the horizontal
sextant angles measured aboard ACANIA were made larger by
the errors due to theodolite positioning. Hence, the values
of standard deviation for the cruise data are the maximum
expected errors for sextant angles measured at sea.
59

APPENDIX C% DATA SET STATISTICS
The coding system used for the data sets is shown
below. All values shown are in minutes of arc.
(1) Data Origin:
I - Cruise I
II - Cruise II
W - Wharf Number 2
B - Beach Lab
(2) Use of Scopes on Sextanits:
N - no scopes
S - with scopes
(3) Observer Number (experience level decreases asthis number increases):
1 through 6
(4) Angle Designator:
G1- 110/205
02- 205/202
0 3 - 205/107
e4 - 206/110
e5- 110/302
(5) Repeated Data Set (if necessary):
(1) - first set
(2) - second set
6o

TOTAL INi -0 1 IN2-01 IN3-E0 IIN4-01 IN5 - 0 1 IN6e 1
(32) +6
+0.09 -0.83 -1.16 +0.36 -0.44 .37
o 2.25 2.63 2.62 3.33 2.34 3.59
TOTAL IN1-e1(2 ) IN2-02 IN3-e 3
(O)+0.08 +0.88 +1.26
O 3.84 2.55 3.44
TOTAL IISI-01 IIS2-01 IIs3-Oi IIS4-0 i IIS5-01 IIS6-Oi(32)+28
+.93 +1.31 +1.5 +1.78 +0.88 +2.18
a 1.28 1.76 1.25 1.61 1.67 1.28
TOTAL IIS1-01(2) I1S2-02 IIS3-0 3 IIS4- 3 IIS5-0 1(2) iIS6-02
(32) +
2 +2.40 -o.24 +1.48 -0.45 +1.74 -0.73
1 1.58 1.41 1.67 1.77 1.58 1.05
TABLE C-I. Cruise I and Cruise II Data.
61

CLOCKWISEMICROMETER (15) WNI-04 WN2-e4 WN3-e4 WN4-0 4 WN5-04 WN6-04
+2.88 +0.86 -0.26 -3.38 +0.63 +0.08a1.25 0.92 1.12 1.15 0.47 0.80
COUNTERCLOCKWISEMICROMETER (15)
+2.54 +1.88 -0.94 -2.64 +0.20 -1.260.96 0.78 1.38 0.64 1.17 0.82
TOTAL (30)
+2.71 +1.37 -0.60 -3.01 +0.42 -0.59a 1.11 0.98 1.28 0.99 0.90 1.05
AC -0.34 +1.02 -0.68 +0.74 -0.43 -1.34
CLOCKWISEMICROMETER (15) WNI-e 5 WN2-e 5 WN3-85 WN4-05 WN5-05 WN6-e5
+4.43 +1.79 +1.77 +2.35 -0.51 +0.92a 0.85 1.10 1.10 0.96 1.12 0.74
COUNTERCLOCKWISEMICROMETER (15)
A +2.62 +3.04 +0.48 +2.04 -0.90 +2.78a 1.15 0.71 0.69 0.91 0.48 1.06
TOTAL (30)
+3.52 +2.42 +1.13 +2.19 -0.70 +1.85a 1.35 1.11 1.12 0.93 0.87 1.31
-1.81 +1.25 -1.29 -0.31 -0.40 +1.86
TABLE C-2. Wharf Number 2 Data - Without Scopes.
62

CLOCKWISEMICROMETER (15) WSI-0 4 WS2-04 WS3-e4 Ws4-o4 wss-o4 ws6-o4
+1.04 +0.58 -0.43 +0.10 +0.83 +0.440.25 0.23 0.33 0.51 0.51 0.48
COUNTERCLOCKWISEMICROMETER (15)
+0.66 +0.41 -0.62 -1.16 +0.14 -0.030.27 0.21 0.32 0.44 0.31 0.57
TOTAL (30)
A +0.85 +0.50 -0.52 -0.53 +0.49 +0.21a 0.32 0.23 0.33 0.79 0.55 0.57
AC -0.38 -0.17 -0.19 -1.26 -0.69 -0.47
CLOCKWISEMICROMETER (15) WSI-0 5 WS2-e 5 WS3-_ 5 WS4-e 5 WS5-_ 5 WS6-e 5
+0.62 -0.37 +0.33 +0.04 +0.10 +0.660.18 0.24 0.14 0.42 0.28 0.46
COUNTERCLOCKWISEMICROMETER (15)
+0.44 +0.03 +0.10 -0.25 -0.36 +1.34a 0.30 0.32 0.25 0.23 0.22 0.45
TOTAL (30)+0.53 -0.17 +0.21 -0.10 -0.13 +1.00
. 0.26 0.35 0.23 0.36 0.34 0.57-0.18 +0.40 -0.23 -0.29 -0.46 +0.67
TABLE C-3. Wharf Number 2 Data - With Scopes
63

CLOCKWISE SEXTANT #2972MICROMETER (15) BSI(1) BS2(1) BS3(1) BS4(1) BS5(1) BS6(1)
-0.41 -0.59 -0.77 -0.35 -0.28 -0.910.28 0.25 0.21 0.25 0.24 0.44
COUNTERCLOCKWISEMICROMETER (15)
-0.59 -0.77 -0.94 -0.56 -0.71 -0.580.33 0.14 0.14 0.34 0.30 0.42
TOTAL (30)
-0.50 -o.68 -0.85 -o.46 -0.50 -0.75o.32 0.21 0.20 0.31 0.34 0.45
AE -0.18 -0.18 -0.17 -0.21 -0.43 +0.33
CLOCKWISE SEXTANT #2982MICROMETER (15) BSI(2) BS2(2) BS3(2) BS4(2) BS5(2) BS6(2)
-0.28 -0.04 -0.25 +0.09 -0.09 -0.67a 0.36 0.23 0.28 0.36 0.28 0.45
COUNTERCLOCKWISEMICROMETER (15)
-0.59 -0.47 -0.63 -0.59 -0.55 -0.390.34 0.24 0.16 0.35 0.25 0.34
TOTAL (30)
-0.43 -0.25 -0.44 -0.25 -0.32 -0.53a 0.38 0.32 0.30 0.49 0.35 0.42
-0.31 +0.01 -0.38 -0.68 -0.46 +0.24
TABLE C-4. Index Correction Differences
64

CLOCKWISE SEXTANT #3003MICROMETER (15) BSI(3) BS2(3) BS3(3) BS4(3) BS5(3) BS6(3)
-0.33 -0.19 -0.43 +0.39 -0.23 -0.63& 0.31 0.20 0.23 0.39 0.30 0.63
COUNTERCLOCKWISEMICROMETER (15)
-0.45 -0.57 -0.85 -0.57 -0.78 -0.640.37 0.22 0.22 0.30 0.40 0.50
TOTAL (30)
-0.39 -0.38 -0.64 -0.09 -0.50 -0.630.34 0.28 0.31 0.60 0.45 0.58
Ae -0.12 -0.38 -0.41 -0.96 -0.55 -0.01
TABLE C-4. Index Correction Differences (continued).
65

OBSERVER 1 2 3 4 5 6
WITH SCOPES
Sextant#2972 - -0.5 +0.1 +1.0 -1.0
-0.2 -1.0-0.4 -0.6
-0.5
#2982 -0.6 -0.5 -0.5 -0.5-0.2 -0.6-0.3 -0.2-1.0
#3003 -0.6 0.0 +0.4 0.0 +0.3-0.5 -0.5-0.5 -0.6-0.4 -0.5-0.7 -0.5
NO SCOPES
Sextant
#2972 +0.5 -0.5 +0.5 -0.2 - -1.0-0.5 -1.2 -1.0 -0.4
#2982 - -0.4 -1.0 -1.0 +0.6 +0.8-1.0 -0.8 +1.0
-1.0
#3003 -0.5 - - +0.4 -0.3 +0.2-0.5 -1.0-0.4 -0.5-o.6 -o.6-0.4
TABLE C-5. Abstract of Index Correctors FromCruise and Wharf Number 2 Data.
66

BIBLIOGRAPHY
Admiralty Manual of Hydrographic Surveying, v. 1,p. 297-307, Hydrographer of the Navy, London, 1965.
Army Engineer Geodesy Intelligence and Mapping Researchand Development Agency Report Number 30-TR, PracticalField Accuracy Limits for a Wild T-2 Theodolite, byP.J. Cervarich II, August
1966.
Blair, C., Coastal/Offshore Positioning by Optical Methods,paper presented at American Society of Civil EngineersConvention, Boston, Massachusetts, 2 April 1979.
Bodnar, A.N., NOAA - Pacific Marine Center, Seattle,private communications, December 1979 and June 1980.
Bowditch, N., American Practical Navigator, v. 1, DefenseMapping Agency Hydrographic Center, 1977.
Cotter, C.H., "A Brief History of the Method of Fixing byHorizontal Angles", Journal of Navigation, v. 25, no. 4,p. 528-534, October 1972.
Dedrick, K., Analysis of the Three-Point Fix, Report No.77-3, Sacramento, June 1978.
Goodwin, E.M. and Kemp, J. F., "Accuracy Contours forHorizontal Angle Position Lines", Journal of Navigation,v. 26, no. 4, p. 481-485, October 1973.
Gossett, F.R., Manual of Geodetic Triangulation, Coast andGeodetic Survey Special Publication No. 247, p. 134-136,U.S. Department of Commerce, 1971.
Heinzen, M.R., Hydrographic Surveys: Geodetic ControlCriteria, Master's Thesis, Cornell University, Ithaca,New York, 1977.
Ingham, A.E., Hydrography for the Surveyor and Engineer,p. 21-25, John Wiley & Sons, 1974.
Ingham, A.E., Sea Surveying, v. 1 and 2, p. 71-90, JohnWiley & Sons, 1975.
May, W.E., A History of Marine Navigation, Ist ed., p. 140,W.W. Norton & Company, 1973.
67

Mueller, I.I. and Ramsayer, K.H., Introduction to Surveying,p. 10-11, Frederick Ungar Publishing Co., 1979.
Umbach, M.J., Hydrographic Manual, 4th ed., U.S. Departmentof Commerce, National Oceanic and Atmospheric Adminis-tration, 1976.
University of New Brunswick-Department of SurveyingEngineering-Lecture Note No. 45, Hydrographic Surveying I,by D.B. Thomson and D.E. Wells, p. 65, November 1977.
U.S. Coast Guard, COMDTINST M 16500.1, Aids to NavigationManual, Positioning, p. 1-C, 1978.
U.S. Coast Guard Report No. CC-D-106-74, An Analysis of thePositioning Accuracy of Horizontal Sextant Angles, byJ.T. Tozzi and H.E. Millan, June 1974.
68
......

INITIAL DISTRIBUTION LIST
No. Copies
1. Defense Technical Information Center 2Cameron StationAlexandria, VA 22314
2. Library, Code 0142 2Naval Postgraduate SchoolMonterey, CA 93940
3. Chairman 1Department of Oceanography - Code 68Naval Postgraduate SchoolMonterey, CA 93940
4. Chairman IDepartment of Meteorology - Code 63Naval Postgraduate SchoolMonterey, CA 93940
5. LCDR Dudley Leath INaval Postgraduate School - Code 68LhMonterey, CA 93940
6. CDR Donald E. Nortrup ICommanding OfficerNOAA Ship Peirce439 West York St.Norfolk, VA 23510
7. LCDR Gerald B. Mills 3Naval Postgraduate School - Code 68MiMonterey, CA 93940
8. Director 1Naval Oceanography DivisionNavy Observatory34th and Massachusetts Avenue NWWashington, D.C. 20390
9. Commander 1Naval Oceanography CommandNSTL StationBay St. Louis, MS 39529
69
10. Commanding OfficerNaval Oceanographic OfficeNSTL StationBay St. Louis, MS 39529
11. Commanding OfficerNaval Ocean Research and DevelopmentActivity
NSTL StationBay St. Louis, MS 39529
12. Director (Code PPH)Defense Mapping AgencyBldg. 56, U.S. Naval ObservatoryWashington, D.C. 20305
13. Director (Code HO)Defense Mapping Agency Hydrographic
Topographic Center6500 Brookes LaneWashington, D.C. 20315
14. Director (Code PSD-MC)Defense Mapping SchoolFt. Belvoir, VA 22060
15. DirectorNational Ocean Survey (C)National Oceanic and Atmospheric
AdministrationRockville, MD 20852
16. Chief, Program Planning and Liaison(NC-2)
National Oceanic and AtmosphericAdministration
Rockville, MD 20852
17. Chief, Marine Survey and Maps (C3)National Oceanic and Atmospheric
AdministrationRockville, MD 20852
18. DirectorPacific Marine Center - NOAA1801 Fairview Avenue EastSeattle, WA 98102
19. DirectorAtlantic Marine Center - NOAA439 W. York StreetNorfolk, VA 23510
70

20. Commanding OfficerOceanographic Unit OneUSNS BOWDITCH (T-AGS21)Fleet Post OfficeNew York, NY 09501
21. Commanding OfficerOceanographic Unit TwoUSNS DUTTON (T-AGS22)Fleet Post OfficeSan Francisco, CA 96601
22. Commanding OfficerOceanographic Unit ThreeUSNS H. H. HESS (T-AGS38)Fleet Post OfficeSan Francisco, CA 96601
23. Commanding OfficerOceanographic Unit FourUSNS CHAUVENET (T-AGS29)FPO, San Francisco, CA 96601
24. CDR R. A. AnawaltChairman, Oceanography DepartmentU.S. Naval AcademyAnnapolis, MD 21402
25. LT Kenneth PerrinNOAA Ship Mt. Mitchell439 West York StreetNorfolk, VA 23510
26. LCDR Donald Winter105 Moreell CircleMonterey, CA 93940
27. Ms. Patricia Eaton300 Glenwood Circle #133Monterey, CA 93940
28. LCDR Francisco AbreuInstituto HidrograficoRua Das Trinas, 49Lisbon - 2Portugal
29. LTJG Luis FariaInstituto HydrograficoRua Das Trinas, 49Lisbon - 2Portugal
71

30. LT Ali KaplanBostanci KC6YCtGonen -Balikesir
Turkey
72