Embed Size (px)
Citation preview

NAVAL POSTGRADUATE
SCHOOL
MONTEREY, CALIFORNIA
THESIS
Approved for public release; distribution is unlimited
FUNCTIONAL FLOW AND EVENT-DRIVEN METHODS FOR PREDICTING SYSTEM PERFORMANCE
by
Victoria Steward
September 2015
Thesis Advisor: Kristin M. Giammarco Second Reader: Timothy H. Chung

THIS PAGE INTENTIONALLY LEFT BLANK
i
REPORT DOCUMENTATION PAGE Form Approved OMB No. 0704–0188 Public reporting burden for this collection of information is estimated to average 1 hour per response, including the time for reviewing instruction, searching existing data sources, gathering and maintaining the data needed, and completing and reviewing the collection of information. Send comments regarding this burden estimate or any other aspect of this collection of information, including suggestions for reducing this burden, to Washington headquarters Services, Directorate for Information Operations and Reports, 1215 Jefferson Davis Highway, Suite 1204, Arlington, VA 22202-4302, and to the Office of Management and Budget, Paperwork Reduction Project (0704-0188) Washington, DC 20503. 1. AGENCY USE ONLY (Leave blank)
2. REPORT DATE September 2015
3. REPORT TYPE AND DATES COVERED Master’s Thesis
4. TITLE AND SUBTITLE FUNCTIONAL FLOW AND EVENT-DRIVEN METHODS FOR PREDICTING SYSTEM PERFORMANCE
5. FUNDING NUMBERS
6. AUTHOR(S) Steward, Victoria 7. PERFORMING ORGANIZATION NAME(S) AND ADDRESS(ES)
Naval Postgraduate School Monterey, CA 93943-5000
8. PERFORMING ORGANIZATION REPORT NUMBER
9. SPONSORING /MONITORING AGENCY NAME(S) AND ADDRESS(ES) N/A
10. SPONSORING/MONITORING AGENCY REPORT NUMBER
11. SUPPLEMENTARY NOTES The views expressed in this thesis are those of the author and do not reflect the official policy or position of the Department of Defense or the U.S. Government. IRB Protocol number N/A .
12a. DISTRIBUTION / AVAILABILITY STATEMENT Approved for public release; distribution is unlimited
12b. DISTRIBUTION CODE
13. ABSTRACT (maximum 200 words) As technology continues to advance at an increasingly rapid pace and systems become more complex, evolving into systems of systems, the discipline of systems engineering will become a more important part of the entire system lifecycle. The scope of this thesis is to apply model-based system engineering principles to the system architecture of a system of systems, and to utilize behavior modeling capabilities to conduct an analysis of alternatives for a realistic design reference mission; the work in this thesis is based around a search and rescue mission.
Two models of the search and rescue system of systems were prepared utilizing two model-based system engineering approaches and tools. For functional flow the Innoslate tool (from Spec Innovations) was used, and for event-driven the Monterey Phoenix Analyzer tool (from Naval Postgraduate School) was utilized. The application of both approaches illustrated how difficult it is to model a system of systems, and this examination uncovered opportunities to improve both approaches. The ability to allow an asset to asynchronously proceed through a scenario would improve the flexibility of Innoslate. To improve the utility of Monterey Phoenix Analyzer for analyses of alternatives, the capability to automatically input the characteristics for assets should be incorporated.
14. SUBJECT TERMS Systems of systems, MBSE, functional flow, event-driven, Monterey Phoenix
15. NUMBER OF PAGES
119 16. PRICE CODE
17. SECURITY CLASSIFICATION OF REPORT
Unclassified
18. SECURITY CLASSIFICATION OF THIS PAGE
Unclassified
19. SECURITY CLASSIFICATION OF ABSTRACT
Unclassified
20. LIMITATION OF ABSTRACT
UU NSN 7540–01-280-5500 Standard Form 298 (Rev. 2–89) Prescribed by ANSI Std. 239–18

ii
THIS PAGE INTENTIONALLY LEFT BLANK

iii
Approved for public release; distribution is unlimited
FUNCTIONAL FLOW AND EVENT-DRIVEN METHODS FOR PREDICTING SYSTEM PERFORMANCE
Victoria Steward Civilian, Naval Undersea Warfare Center
B.S., Worcester Polytechnic Institute, 2002 M.S., Worcester Polytechnic Institute, 2003
Submitted in partial fulfillment of the requirements for the degree of
MASTER OF SCIENCE IN SYSTEMS ENGINEERING MANAGEMENT
from the
NAVAL POSTGRADUATE SCHOOL September 2015
Author: Victoria Steward
Approved by: Kristin M. Giammarco, Ph.D. Thesis Advisor
Timothy H. Chung, Ph.D. Second Reader
Ronald Giachetti, Ph.D. Chair, Department of Systems Engineering

iv
THIS PAGE INTENTIONALLY LEFT BLANK

v
ABSTRACT
As technology continues to advance at an increasingly rapid pace and systems become
more complex, evolving into systems of systems, the discipline of systems engineering
will become a more important part of the entire system lifecycle. The scope of this thesis
is to apply model-based system engineering principles to the system architecture of a
system of systems, and to utilize behavior modeling capabilities to conduct an analysis of
alternatives for a realistic design reference mission; the work in this thesis is based
around a search and rescue mission.
Two models of the search and rescue system of systems were prepared utilizing
two model-based system engineering approaches and tools. For functional flow the
Innoslate tool (from Spec Innovations) was used, and for event-driven the Monterey
Phoenix Analyzer tool (from Naval Postgraduate School) was utilized. The application of
both approaches illustrated how difficult it is to model a system of systems, and this
examination uncovered opportunities to improve both approaches. The ability to allow an
asset to asynchronously proceed through a scenario would improve the flexibility of
Innoslate. To improve the utility of Monterey Phoenix Analyzer for analyses of
alternatives, the capability to automatically input the characteristics for assets should be
incorporated.

vi
THIS PAGE INTENTIONALLY LEFT BLANK

vii
TABLE OF CONTENTS
I. INTRODUCTION........................................................................................................1 A. OVERVIEW .....................................................................................................1 B. RESEARCH QUESTIONS .............................................................................2 C. RESEARCH METHODOLOGY ...................................................................3
II. LITERATURE REVIEW ...........................................................................................5 A. MODELING BACKGROUND.......................................................................6
1. Object-Oriented Modeling ................................................................10 2. System-of-Systems Modeling ............................................................11
B. BEHAVIOR PREDICTION MODELING .................................................13 1. Functional Flow ..................................................................................13 2. Event-Driven ......................................................................................14
III. METHODOLOGY ....................................................................................................17 A. PROBLEM DEFINITION ............................................................................17 B. CASE STUDY: SAR MISSION ....................................................................18
1. SAR Mission Overview ......................................................................18 2. Operational Scenario Overview........................................................19 3. Design Reference Mission ..................................................................20 4. Operational Situations .......................................................................21 5. Mission Narrative ...............................................................................21 6. Command Structure ..........................................................................22
C. CONSTRAINTS AND ASSUMPTIONS .....................................................23 D. DEFINITION OF ALTERNATIVES ..........................................................23 E. TOOL CHOICE .............................................................................................29
1. Functional Flow—Innoslate ..............................................................29 2. Event-Driven—Monterey Phoenix ...................................................29
F. MODEL STRUCTURE .................................................................................30 1. Proposed Architecture .......................................................................31 2. Performance Prediction .....................................................................36
a. Innoslate—LML Action Diagram ..........................................36 b. Monterey Phoenix ...................................................................39
IV. RESULTS ...................................................................................................................41 A. FUNCTIONAL FLOW PERFORMANCE PREDICTION ......................41 B. EVENT-DRIVEN PERFORMANCE PREDICTION................................44
1. Initial Model Refinements .................................................................44 2. Final Refinements ..............................................................................47
C. SUMMARY ....................................................................................................53
V. CONCLUSIONS ........................................................................................................55 A. RECOMMENDATIONS ...............................................................................55 B. FUTURE WORK ...........................................................................................57
APPENDIX A. FUNCTION PARAMETERS FOR ALTERNATIVES ..........................59
viii
APPENDIX B. MONTEREY PHOENIX SAR SOS MODEL CODE .............................65
APPENDIX C. INNOSLATE SIMULATION RESULTS ................................................70
APPENDIX D. MONTEREY PHOENIX MODEL INITIAL EVENT TRACES ..........73
APPENDIX E. MONTEREY PHOENIX SAR SOS REVISED MODEL CODE WITH SEARCH LOOP IMPLEMENTED.............................................................79
APPENDIX F. MONTEREY PHOENIX SAR SOS MODEL CODE WITH SEARCH LOOP AND SAR_ASSETS SET IMPLEMENTED .............................85
LIST OF REFERENCES ......................................................................................................93
INITIAL DISTRIBUTION LIST .........................................................................................97

ix
LIST OF FIGURES
Figure 1. INCOSE MBSE roadmap (from Friedenthal and Sampson 2015). ...................6 Figure 2. Example FFBD (from Kustere 2006). ...............................................................8 Figure 3. Example EFFBD in Vitech CORE (from Giammarco 2014a, 27). ...................8 Figure 4. Example IDEF0 (from Giammarco 2014a, 11) and sequence diagram
(from Giammarco 2014a, 27). ...........................................................................9 Figure 5. Example of a simple finite-state machine (after Lavagno, Martin and Selic
2003, 6). ...........................................................................................................10 Figure 6. Pier-to-peer micro-pattern (after Lavagno, Martin and Selic 2003, 173). ......12 Figure 7. Container micro-pattern illustration (left) and UML representation (right)
(after Lavagno, Martin and Selic 2003, 174–175). ..........................................12 Figure 8. Layering micro-pattern illustration (after Lavagno, Martin and Selic 2003,
176). .................................................................................................................12 Figure 9. Operational concept for a SAR SOS (from Giammarco, Whitcomb and
Hunt 2015, 5). ..................................................................................................19 Figure 10. Generalized SAR mission layered control architecture (after Lavagno,
Martin and Selic 2013). ....................................................................................23 Figure 11. MH-60S Helicopter (from Sikorski Aircraft Corporation 2012). ....................24 Figure 12. Fire Scout MQ-8B (from Northrup Grumman Corporation 2015). .................26 Figure 13. Examples of UUVs (Kongsberg 2015; Virginia Tech 2011). ..........................27 Figure 15. Sequence diagram for SAR SOS concept from Innoslate. ..............................31 Figure 16. Functional decomposition for SAR SOS concept. ...........................................33 Figure 17. Second-level functional decomposition illustrating the individual SAR
assets that are part of the SAR SOS. ................................................................34 Figure 18. Individual SAR asset subsystem level functional decomposition (after
Giammarco 2015b). .........................................................................................35 Figure 19. LML action diagram for SAR SOS concept in Innoslate. ...............................37 Figure 20. Example Innoslate discrete event simulation timeline. ....................................41 Figure 21. Event Trace 1, no SAR mission. ......................................................................45 Figure 22. Event Trace 5, full SAR Mission with PID recovery. .....................................46 Figure 23. Event Trace 12. ................................................................................................48 Figure 24. Event Trace 23. ................................................................................................49 Figure 25. Dual SAR_Asset event trace with PID rescue. ................................................51 Figure 26. Dual SAR_Asset detailed view. .......................................................................52 Figure 27. Event Trace 1. ..................................................................................................73 Figure 28. Event Trace 2. ..................................................................................................73 Figure 29. Event Trace 3. ..................................................................................................74 Figure 30. Event Trace 4. ..................................................................................................75 Figure 31. Event Trace 5. ..................................................................................................76 Figure 32. Event Trace 6. ..................................................................................................77

x
THIS PAGE INTENTIONALLY LEFT BLANK
xi
LIST OF TABLES
Table 1. MH-60 Parameters (from Hunt 2015; from COMNAVAIR 2012; from Sikorski 2012) ..................................................................................................25
Table 2. Fire Scout MQ-8B Parameters (from COMNAVAIR n.d.) .............................26 Table 3. Notional UUV Parameters (from Virginia Tech 2011) ...................................27 Table 4. Notional USV Parameters ................................................................................28 Table 5. Innoslate Model Results ...................................................................................42 Table 6. Average mission time by alternative and per OPSIT distance. .......................43 Table 7. Function parameters for the Helicopter and UAV alternatives (from Hunt
2015; from COMNAVAIR 2012; from Sikorski 2012; from COMNAVAIR n.d.).........................................................................................60
Table 8. Function parameters for the UUV and USV alternatives (from Virginia Tech 2011). ......................................................................................................62

xii
THIS PAGE INTENTIONALLY LEFT BLANK

xiii
LIST OF ACRONYMS AND ABBREVIATIONS
AOA Analysis of Alternatives
AOR Area of Responsibility
AUV Autonomous Underwater Vehicle
C2 Command and Control
C4ISR Command, Control, Communications, Computers, Intelligence, Surveillance and Reconnaissance
DOD Department of Defense
DODAF Department of Defense Architecture Framework
DRM Design Reference Mission
EFFBD Enhanced Functional Flow Block Diagram
FFBD Functional Flow Block Diagram
HSC Helicopter Sea Combat
HSM Helicopter Maritime Strike
IDEF0 Integrated Definition for Function Modeling
INCOSE International Council on Systems Engineering
IT Information Technology
LKL Last Known Location
LML Life cycle Modeling Language
MBSE Model Based Systems Engineering
MDA Model Driven Architecture
MP Monterey Phoenix
COMNAVAIR Naval Air Systems Command
NPS Naval Postgraduate School
OMG Object Management Group
OO Object Oriented
OPSIT Operational Situation
OSA Other Search and Rescue Assets
OSC On-Scene Commander
OV-1 Operational View One
PID Person(s) in Distress

xiv
RHIB Rigid Hull Inflatable Boat
RTB Return to Base
SAR Search and Rescue
SE System Engineering
SITREP Situation Report
SOS Systems of Systems
SRU Search and Rescue Unit
SysML System Modeling Language
UAV Unmanned Aerial Vehicle
UML Unified Modeling Language
USCG United State Coast Guard
USV Unmanned Surface Vehicle
UUV Unmanned Underwater Vehicle

xv
EXECUTIVE SUMMARY
As technology continues to advance at an increasingly rapid pace and systems
become more complex, evolving into systems of systems (SOS), the discipline of systems
engineering (SE) will become a more important part of the entire system life cycle, not
just in the design phase. As SE becomes integral to the successful execution of system
design, product fielding, operations and sustainment, the teams responsible for executing
the development effort and managing the system over its useful life are becoming highly
diverse, multidisciplinary, and geographically distributed. These factors make keeping
open lines of communication, maintaining requirements traceability, capturing system
knowledge and sharing ever more important (Murray 2012). Due to these complications,
the SE community has been steadily moving toward implementing model-based systems
engineering (MBSE) as a replacement for the traditional document-based SE approach.
MBSE helps facilitate and improve the application of the SE principles in the
increasingly complex and diverse environment (INCOSE 2007).
This thesis applies MBSE principles to the system architecture of an SOS and
utilizes behavior-modeling capabilities found in MBSE tools to conduct an analysis of
alternatives (AOA) for a realistic design reference mission (DRM) for that SOS. This
analysis is done by answering two questions:
1. How do the performance predictions for SOS vary between the two MBSE modeling methodologies: functional flow oriented and event-driven?
2. Can unmanned vehicles/systems be utilized effectively to conduct or augment Search and Rescue (SAR) operations?
The definition of a SOS is “a set or arrangement of systems that results when
independent and task-oriented systems are integrated into a larger systems construct that
delivers unique capabilities and functions in support of missions that cannot be achieved
by individual systems alone” (Vaneman and Jaskot 2013, 491). This makes the
development of the model of the SOS architecture even more important as managing the
complexity of the problem becomes more and more difficult.
xvi
The context for answering the research questions asked in this thesis is the SAR
mission and the associated SOS required to execute the SAR mission. For this thesis the
goal for the SAR mission is to “minimize the loss of life, injury, and property damage or
loss at sea by finding or rendering aid to those in distress” (Contag et al. 2015, Chapter
1). Based on the National Search and Rescue Plan of the United States (United States,
2007), the lead coordinating SAR organization has the right to recruit support from
available SAR assets without any prior notice. This means that all U.S. military, U.S.
Coast Guard, commercial and civilian vessels and aircraft in region where the SAR
situation is occurring—the area of responsibility (AOR)—could become part of the SAR
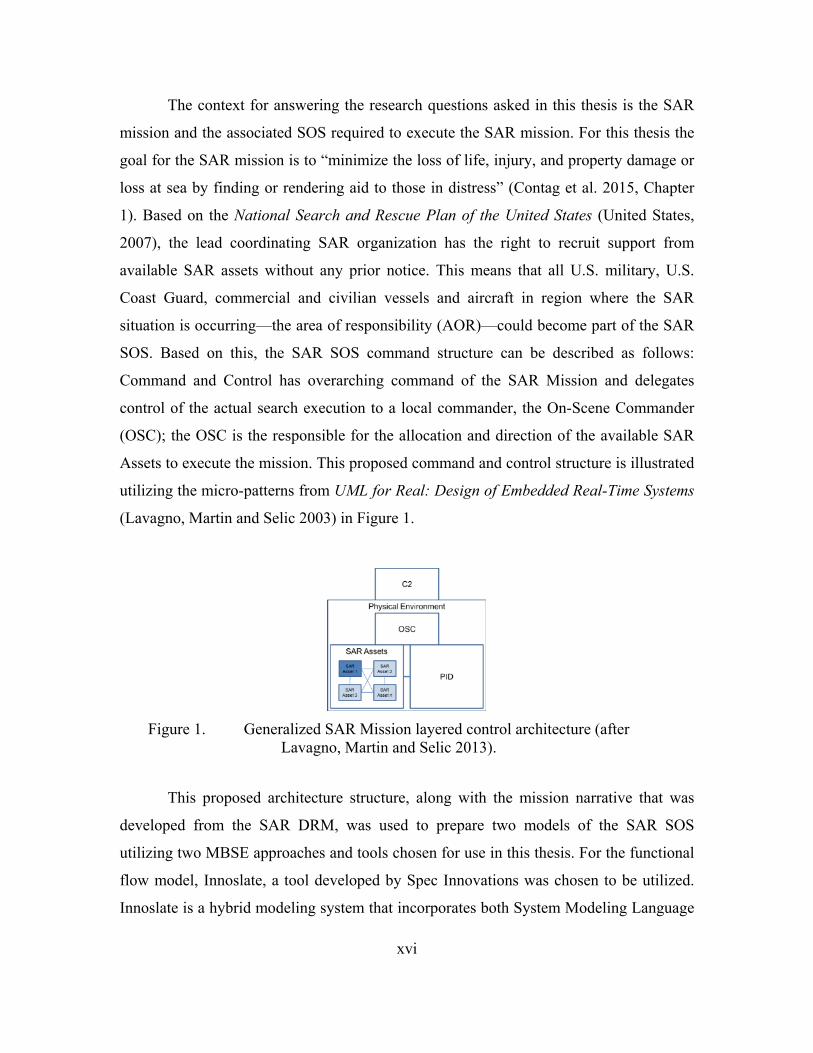
SOS. Based on this, the SAR SOS command structure can be described as follows:
Command and Control has overarching command of the SAR Mission and delegates
control of the actual search execution to a local commander, the On-Scene Commander
(OSC); the OSC is the responsible for the allocation and direction of the available SAR
Assets to execute the mission. This proposed command and control structure is illustrated
utilizing the micro-patterns from UML for Real: Design of Embedded Real-Time Systems
(Lavagno, Martin and Selic 2003) in Figure 1.
Figure 1. Generalized SAR Mission layered control architecture (after
Lavagno, Martin and Selic 2013).
This proposed architecture structure, along with the mission narrative that was
developed from the SAR DRM, was used to prepare two models of the SAR SOS
utilizing two MBSE approaches and tools chosen for use in this thesis. For the functional
flow model, Innoslate, a tool developed by Spec Innovations was chosen to be utilized.
Innoslate is a hybrid modeling system that incorporates both System Modeling Language

xvii
and Lifecycle Modeling Language diagrams and concepts. For the event-driven model
the Monterey Phoenix (MP) approach, developed at the Naval Postgraduate School, was
chosen. Models were prepared in both tools. The Innoslate action diagram was run
through discrete event simulations for four SAR Asset alternative platforms in an attempt
to prepare performance predictions for use in an AOA. The MP model was executed to
provide all of the possible event traces (use cases) for the SAR Mission.
The work done in this thesis was not able to fully answer the two research
questions being asked, but the results provided insight on what needs to be done to do so,
moving forward. For Innoslate, the main difficulty was with modeling concurrent
behaviors between assets to show teamwork within the SOS. It would be very valuable
for modeling SOS if an additional decision construct was included in the available library
of functions and constructs that could integrate the outputs of several assets while still
allowing for each asset to proceed through the mission without waiting for each of the
other assets to complete the previous function. With MP, the limiting factor is the manual
application of the system parameters. To do this manually potentially limits the accuracy
of the AOA being derived from the model developed event traces due to the added
opportunity to introduce human error. The ability to incorporate the parameters of the
systems and the environment directly into the model would allow for the event traces to
begin to fully describe all possible scenarios based on the assets available and the
environment being considered.
Even with the limitations to the modeling tools, the question of whether or not
unmanned vehicles can be useful for a SAR mission has been partially answered by the
Innoslate model. The model results showed that unmanned systems can be useful in the
execution of a SAR Mission, but based on the platforms considered in this thesis they
cannot be utilized as the only platform executing the SAR mission. It is expected that
unmanned systems will positively augment the performance of conventional platforms in
the execution of a SAR Mission but in order to prove this with modeling the additional
capabilities will need to be incorporated into the tools.

xviii
REFERENCES
Contag, George, Kristin Giammarco, Spencer Hunt, C. Johnston, K. Laing, K. Mastran, J. Pabon, N. Quijano, E. Rosenberg, M. Stevens, K. Tomasino, J. Tonello and Clifford Whitcomb. 2015. “A Lab Manual for Systems Architecting and Analysis.” Chapter 1 and Chapter 2. Naval Postgraduate School, Department of Systems Engineering. https://wiki.nps.edu/pages/viewpage.action?pageId=437387266.
INCOSE Technical Operations. 2007. Systems Engineering Vision 2020, version 2.03. Seattle, WA: International Council on Systems Engineering, Seattle, WA, INCOSE-TP-2004-004-02. http://oldsite.incose.org/ProductsPubs/pdf/SEVision2020_20071003_v2_03.pdf.
Lavagno, Luciano, Grant Martin, Bran Selic. 2003. UML for Real: Design of Embedded Real-Time Systems. Dordrecht, Netherlands: Kluwer Academic Publishers. http://site.ebrary.com.libproxy.nps.edu/lib/nps/reader.action?ppg=5&docID=10069615&tm=1437511359486.
Murray, Julia. 2012. Model Based Systems Engineering (MBSE) Media Study. http://www.syse.pdx.edu/program/portfolios/julia/MBSE.pdf.
Vaneman, Warren K. and Roger D. Jaskot. 2013. “A Criteria-Based Framework for Establishing System of Systems Governance.” Proceedings of the 7th Annual Systems Conference (SysCon), IEEE International: Orlando, FL (April): 491 - 496. http://dx.doi.org/10.1109/SysCon.2013.6549927.
United States, 2007. National Search and Rescue Plan of the United States. United Sates Coast Guard Office of Search and Rescue (CG-SAR). 2015. http://www.uscg.mil/hq/cg5/cg534/manuals/Natl_SAR_Plan(2007).pdf.
xix
ACKNOWLEDGMENTS
I sincerely thank Doctor Kristin Giammarco for the opportunity to work an
application of modeling that was not only mentally challenging and fun, but also
provided me a way to apply some of my own experiences into the thesis. The thesis
process was difficult and at times painful, but the modeling applications were something
that I thoroughly enjoyed working through and are something that I hope I will be able to
apply moving forward in my career.
I would also like to thank LT Spencer Hunt for his patience in answering all of
my Search and Rescue questions and for providing me with an excellent starting point for
my work with the design reference mission. Without his help, I would have been stuck
much longer trying to understand how things work in the real world.
I also sincerely thank Doctor Mikhail Auguston for his tutoring and coding
assistance with Monterey Phoenix. Without his time answering all my questions and
helping to massage the model code, I would never have gotten as far as I did in such a
short time. I very much enjoyed learning how to understand this modeling method.
Last but not least, I would like to thank my family for all the patience and moral
support that I have needed over the course of this two-year master’s program. I would
also like to especially thank my father, Mr. Ronald Steward, for being my first
proofreader and for providing his insights on the historical side of MBSE from his own
experiences.

xx
THIS PAGE INTENTIONALLY LEFT BLANK
1
I. INTRODUCTION
This document will present the work done in this thesis in five chapters. The
scope of the thesis will be presented in this chapter. The literature review will be
presented in Chapter 2. Based on the information the methodology executed in this thesis
will be discussed in Chapter 3. The results of the work done by following the
methodology and the discussion of these results will be covered in Chapter 4, and final
recommendations and future work will be covered in the conclusion, Chapter 5.
Additional detailed references can be found in the Appendices.
A. OVERVIEW
As technology continues to advance at an increasingly rapid pace and systems
become more complex, evolving into systems of systems (SOS), the discipline of systems
engineering (SE) will become a more important part of the entire system life cycle, not
just in the design phase. This becomes even more apparent as the time available for
system development continues to decrease due to customer demand (Ramos, Ferreira,
and Barceló 2011). As SE becomes integral to the successful execution of system design,
product fielding, operations and sustainment, the teams responsible for executing the
development effort and managing the system over its useful life are becoming highly
diverse, multidisciplinary, and geographically distributed. These factors make keeping
open lines of communication, maintaining requirements traceability, capturing system
knowledge and sharing ever more important (Murray 2012). Due to these complications,
the SE community has been steadily moving toward implementing model-based systems
engineering (MBSE) as a replacement for the traditional document-based SE approach.
MBSE helps facilitate and improve the application of the SE principles in the
increasingly complex and diverse environment (INCOSE 2007).
This thesis applies MBSE principles to the system architecture of a SOS and
utilizes behavior-modeling capabilities found in MBSE tools to conduct an analysis of
alternatives (AOA) for a realistic design reference mission (DRM) for that SOS. This
case study evaluates technical performance of three types of unmanned systems/vehicles

2
against the conventional manned helicopter in a search and rescue (SAR) operational
scenario. Additionally, two different MBSE modeling methodologies (functional flow
and event-driven) are compared. The goal of this effort is to demonstrate how the
architecture and behavior MBSE approaches can be used to prepare performance
predictions as part of an AOA, and to compare and contrast the process and results
obtained utilizing two current modeling schemes.
This research is enabled by another Naval Postgraduate School (NPS) Joint
Executive Systems Engineering Management (SEM-PD21) student, Spencer Hunt.
Hunt’s work, “Model-Based Systems Engineering in the Execution of Search and Rescue
Operations” (2015), focuses on the modeling of the DRM baseline: the execution of the
SAR mission by U.S. Navy, U.S. Coast Guard (USCG) air and surface assets. The work
for this thesis, however, focuses on being able to integrate the three types of unmanned
systems into the SAR mission:
1. Unmanned Aerial Vehicles (UAVs) 2. Unmanned Underwater Vehicles (UUVs) 3. Unmanned Surface Vehicles (USVs)
B. RESEARCH QUESTIONS
This thesis applied the MBSE processes and the SAR DRM to answer the
following two research questions:
1. How do the performance predictions for SOS vary between the two MBSE modeling methodologies: functional flow oriented and event-driven?
2. Can unmanned vehicles/systems be utilized effectively to conduct or augment SAR operations?
Models and analysis show that unmanned vehicles can be utilized for SAR
operations; however, the model results aim to determine to what extent and under what
limitations. Additionally, it was expected that the comparison of the modeling
methodologies would help determine the current strengths and weaknesses of the
methodologies and modeling tools that support their execution.
3
C. RESEARCH METHODOLOGY
The focus of the work done for this thesis was to develop and model the
architecture of an SOS in order to compare the two modeling methodologies: functional
flow and event-driven. Two MBSE tools were used to implement the methodologies for
the chosen DRM: the SAR mission. For the functional flow modeling Innoslate, a tool
developed by Spec Innovations for functional flow modeling, was used. To implement
the event-driven methodology Monterey Phoenix (MP), an approach and tool currently in
development at NPS, was utilized. The Innoslate model was used to conduct a
preliminary AOA based on the behavior predicted for a baseline SAR Asset, the
conventional manned helicopter, and three possible unmanned system alternatives: the
UAV, UUV and USV. The MP model works differently from the functional flow model
and provides an exhaustive set of use cases based on the model logic. The resultant use
cases were then analyzed to determine if the model was accurately representing the
behavior of the SAR SOS. The results of both models were then analyzed both to answer
the research questions defined in the previous section, and also to determine the current
state of both methods when applied to SOS modeling. Strengths and weaknesses of both
tools were identified and future work was proposed to improve the ability of both tools to
model SOS problems.

4
THIS PAGE INTENTIONALLY LEFT BLANK

5
II. LITERATURE REVIEW
The Department of Defense (DOD) has long been pushing for a more integrated
and MBSE approach once it became clear that information technology (IT) systems were
going to become the framework for most future systems (Buede 2009). To address this
need, the U.S. DOD Architecture Framework (DODAF) was developed into a
requirement for DOD systems being developed. The DODAF was initially created to
support Command, Control, Communications, Computers, Intelligence, Surveillance and
Reconnaissance (C4ISR) applications in the mid-1990s (Buede 2009). Because these
systems are SOS by definition, they required careful consideration during system
development to define the robust systems architectures needed to make the C4ISR
systems functional. As it became apparent that very few DOD systems would remain
standalone (without a requirement for connectivity between users and/or operational
commands), the DOD started to push for the utilization of DODAF for all development
efforts (Buede 2009; Ramos, Ferreira and Barceló 2011).
The International Council on Systems Engineering (INCOSE) definition of
MBSE “is the formalized application of modeling to support system requirements,
design, analysis, verification and validation activities beginning in the conceptual design
phase and continuing throughout development and later life cycle phases” (INCOSE
2007, 15). The goal for the application of MBSE is to create and utilize the overarching
models as an integrated part of the SE processes, allowing for a continued focus on high-
level system architecture management throughout the system lifecycle. Technology and
modeling languages continue to improve and standards are being developed to increase
the interoperability of MBSE tools (Murray 2012; INCOSE 2007). As the SE community
becomes more comfortable with utilizing MBSE methods, the models will begin to move
past the role of supporting engineering models and will begin to be utilized more for
“predictive and effects-based modeling” (INCOSE 2007, 23). The INCOSE MBSE path
of growth, as described in the INCOSE System Engineering Vision 2020 (2007, 23), is
shown in Figure 1. Within the bracket in the lower right corner of Figure 1, are the

6
various applications and areas in the system life cycle that INCOSE believes MBSE can
provide inputs to and support as the MBSE capability continues to grow through 2025.
Figure 1. INCOSE MBSE roadmap (from Friedenthal and Sampson 2015).
A. MODELING BACKGROUND
The definition of a model is a “is a representation of a selected part of the world,
the domain of interest, that captures the important aspects, from a certain point of view,
simplifying or omitting the irrelevant features” (Ramos, Ferreira, and Barceló 2011, 103).
Based on this definition, the purpose of a model, in any engineering field, is to help the
engineer/designer to better understand the system they are working on and to help the
engineer/designer to identify any problems with the system architecture before the full
system is built (Lavagno, Martin and Selic 2003). A model for engineering purposes can
be a physical representation of a system, technical drawings or almost anything that
represents the final system describing or illustrating the system in a way useful to the
user. The user of the model can be the design engineer, stakeholders and requirements
generators, the end user of the system, and the list can go on. The goal is to link the
concept or design for the system to the implementation of the real system in a way that
provides useful information for all parties (Vitech 2011).
7
A good model needs to be able to describe a system accurately without the
addition of extra details that are not relevant to the area of concern in the system design,
or the domain in which the system or systems will be operating (Lavagno, Martin, Selic,
2003). This can be especially difficult, as oversimplification and poor assumptions can be
detrimental to the accuracy of the system model, so careful consideration must be made
when determining which information to omit and what should be kept even if it could
potentially complicate things. Additionally, the model must be in a form that is easily
understood by a wide range of audiences and provide insights and data on the system
properties or performance that is of interest to all stakeholders in the system design and
implementation.
Systems Engineering is an interesting discipline because it applies to the full life
cycle of a system, which makes the area of responsibility highly interdisciplinary, and
this means that SE models have to understandable by all the engineering and logistic
disciplines that will be involved with the system throughout its useful life (Alford 1992).
In addition, the goal of SE is to start with the customer requirement, the problem, and
define the architecture to solve that problem without specifying a solution; this process
can be called “designing by allocation,” which is unique to SE (Alford 1992, 1).
Therefore, modeling for SE applications has some unique requirements as needs to
integrate the modeling done by many other disciplines into one model to ensure
traceability and to reduce the possibility of human error of manually attempting to
capture and trace errors or changes in a document-based SE process.
Modeling for SE began with the development of standardized conceptual
modeling schemes to capture the activities or processes that are needed for the system to
execute the required operations assigned to it. Diagrams were developed to graphically
represent this information for stakeholders and the engineers working on the system
development, the most classic system description utilized in SE is the functional flow
block diagrams (FFBDs). The FFBDs were developed in the 1950s and are
representations of systems utilized by systems engineers to show the system functions in
order of execution (Ramos, Ferreira and Barceló 2011; Auguston 2014; Buede 2009). An

8
example of a FFBD is shown in Figure 2, illustrating the sequential flow of each
function, one right after the other, through time.
Figure 2. Example FFBD (from Kustere 2006).
As systems became more complex, enhanced FFBDs (EFFBDs) were developed
to show the flow of information from one function to the other; it shows how each
function influences the follow-on functions either as input, output or as a required trigger
for the following function or functions (Giammarco and Auguston 2013). An example
EFFBD built in the Vitech CORE modeling tool from the “SE4150 System Architecture
and Design Lab Manual” (Giammarco 2014a) can be seen in Figure 3.
Figure 3. Example EFFBD in Vitech CORE (from Giammarco 2014a, 27).

9
In comparison to the FFBD from Figure 2, where only functional blocks are
shown one, Function 1.2, right after the other, Function 1.3, an addition of inputs,
outputs, and triggers for the functions are shown as the green ovals in Figure 3. These
inputs, outputs, and triggers provide additional information on what the system must do
before it can proceed to the next step, the next function.
In addition to EFFBDs, other architecture views were developed to provide more
detail and to allow for further functional and physical decomposition of the system. Two
of these diagrams are show in Figure 4.
Figure 4. Example IDEF0 (from Giammarco 2014a, 11) and sequence diagram
(from Giammarco 2014a, 27).
The left diagram is the integrated definition for functions modeling (IDEF0), and
the right diagram is an example sequence diagram for a system. Both of these diagrams
begin to link the physical components or subsystems to the functions that the system has
to be able to accomplish in order to meet the defined mission requirements. The sequence
diagram is used to describe the sequence of events being executed between system
components to perform an operation or the sequence of events being conducted between
systems and the environment in a SOS situation. For a larger sequence diagram see
Figure 15 later in this document. The IDEF0, on the other hand, is used to map the
functional interactions between the components or systems (in a SOS situation). For a
larger example of an IDEF0 see Figure 17. All of the these architecture diagrams were
useful in describing the system, but in order to provide the ability to analyze the

10
performance of the system or to identify problems within the proposed architectures, the
models had to be transformed from documentation into a dynamic form that allows for
the study of the system inputs, outputs and performance.
1. Object-Oriented Modeling
In software development, due to the inherent nature of software where it lacks any
physical representation and is only textual logic constructs, the software developers
needed a way to model and verify their logic prior to implementing it in a development
language similar to C and C++. This modeling began with the use of state machine
diagrams, Figure 5, which allows the developer to visually display the logic of the
functions that the software code will have to execute. Utilizing the state machine to refine
the logic of the code allowed the software designers to “move incrementally from a
simplified and highly abstract model of the software to its final fully specified form
without having to change the notation, the implementation medium, the tools, or the
method of work” (Lavagno, Martin, and Selic 2003, 7). This process allowed for the
evolution of the software model to its final state and became called model-driven
development. These individual functions that were being modeled in the state machines
became known as the “objects” in the object oriented (OO) software development. Not
only were these “objects” easier to verify and validate, but once they were, they could be
put into a library of basic functions for software developers to pull out and reuse
whenever needed.
Figure 5. Example of a simple finite-state machine (after Lavagno, Martin and
Selic 2003, 6).

11
As model-driven development became more standardized the Object Management
Group (OMG) developed the Model-Driven Architecture (MDA), a technology standard
aimed at providing a platform/tool/vendor neutral approach for developing and executing
software architectures (Lavagno, Martin and Selic 2003; OMG 2015a). Not only does a
standardized architecture approach allow for the interoperability between software
packages/systems, but it also makes it much easier to reuse well developed architectures
for follow on development efforts (OMG 2015b; Giammarco 2014b). OMG developed
the Unified Modeling Language (UML) standard to support the MDA and to provide
software developers with a way to “specify, visualize, and document models of software
systems, including their structure and design” (OMG 2015b) utilizing the OO structures
of class and structure.
The MDA and UML methods were so successful and widely applied for software
development that INCOSE determined that to support their MBSE Roadmap, Figure 1,
the SE community needed a standard to structure MBSE implementation for the SE
community. INCOSE worked with OMG to develop the Systems Modeling Language
(SysML) (Ramos, Ferreira, and Barceló 2011). The first SysML specification OMG
SysML v1.0 was released in September 2007, and took a subset of concepts from UML 2
and tailored them for the SE application (OMG 2015c). The SysML language provides a
way to graphically model “system requirements, behavior, structure and parametrics”
(OMG 2015c). The SysML language leveraged the OO structure and defined where each
function is modeled as a separate “object” with all the related inputs and outputs, these
objects are then linked to one another with those inputs and outputs. The current version
of the SysML standard is v1.4 which was accepted in March 2014, but is still in the Beta
version and the final release is in process (OMG 2015c).
2. System-of-Systems Modeling
The definition of a SOS is “a set or arrangement of systems that results when
independent and task-oriented systems are integrated into a larger systems construct that
delivers unique capabilities and functions in support of missions that cannot be achieved
by individual systems alone” (Vaneman and Jaskot 2013, 491). This makes the

12
development of the model of the SOS architecture even more important as managing the
complexity of the problem becomes more and more difficult.
In software development with UML, software architectures can be developed
based on a combination of just three “micro-patterns” (Lavagno, Martin and Selic 2003,
172). The most standard seen in all models is called a peer-to-peer interaction where two
or more standalone entities collaborate to get their tasks done, as in Figure 6. The second
is a container micro-pattern where a “part” (Lavagno, Martin and Selic 2003, 174) or
parts are housed inside a container. The parts feed the function of the container and the
container keeps the parts from having to interact with the environment; the container
handles the interaction with the surrounding environment as shown in Figure 7. The third
and final micro-patter is the layer, illustrated in Figure 8. What the layer construct allows
for is the dependency of the two layers, the upper layer cannot exist without the lower
layer, but the lower layer can exist without the upper (Lavagno, Martin and Selic 2003,
176).
Figure 6. Pier-to-peer micro-pattern (after Lavagno, Martin and
Selic 2003, 173).
Figure 7. Container micro-pattern illustration (left) and UML representation
(right) (after Lavagno, Martin and Selic 2003, 174–175).
Figure 8. Layering micro-pattern illustration (after Lavagno, Martin and
Selic 2003, 176).

13
The concept of micro-layers can be applied to the architectures of SOS especially
with the idea of control being applied between the actors in the architecture. Controls are
applied in software systems to do many tasks such as: determining what resource should
do what, monitoring for failures and determining how to manage those failures to not
impact the performance of the system as a whole (Lavagno, Martin and Selic 2003). The
idea of controls can be especially powerful when applied to the development of SOS
architectures since in a SOS there are always a chain of command (layers) that provides
direction (control) to the subordinate systems in that specific layer. Without control
layers incorporated into the model, there will be no way to capture key actions within the
SOS. In “Trends in Computer-Based Systems Engineering” (White et al. 1992), these key
actions can include:
• allocates resources to address the problem • determines with resources will receive what data and will execute which
functions • determines performance allocations • responds to fault detection and recovery (White et al. 1992)
B. BEHAVIOR PREDICTION MODELING
The main concern during system design is whether or not the system will operate
and execute the necessary functions to perform the designed actions necessary within the
operational environment; this brings to the fore why behavior and accurate architecture
models are so important (Auguston 2014). The use of these models begin to address the
challenge of understanding and predicting flaws in the architecture design as early in the
system life cycle as possible to reduce the cost and impact of correcting these defects
(Giammarco 2014b); this especially true since fixing the problems with the architecture
after the system design phase can be cost “from 10 to 10,000 time more” (Alford 1992,
5).
1. Functional Flow
One of the applications of SysML and object oriented modeling is to apply the
functional flow analysis described in the EFFBDs and in the SysML Activity diagram to
execute performance predictions by running simulations from the activity diagrams
14
developed as part of the model. This method focuses on assigning actions to individual
assets, which could be various systems in a SOS or subsystems in an individual system,
and then defining parameters for each function/action that will be executed by the system
or SOS. Once these parameters are defined, a time-based discrete event simulation can be
run to estimate the performance of the system or SOS. Once the model is verified and is
providing accurate results based on a known operational situation (OPSIT) then the
parameters for the functions of each asset can be changed to either:
1. Conduct an AOA for various system components/subsystems or to compare possible system choices as a part of a SOS analysis.
2. Conduct design trade off analysis to determine levels of performance required to meet the design parameters and requirements.
There are many tools available to systems engineers to prepare deterministic
models and conduct performance prediction analyses. The choice on which to use is
based on the availability of the tool, the type of SE methodology the model is based on
(such as top down, spiral, or onion) and the language being used for the model (SysML,
UML or others).
2. Event-Driven
Event-driven behavior modeling differs from functional flow modeling previously
discussed because this approach focuses on the system components and the interactions
between these individual components on a higher, more abstract level where the
behaviors of the individual system components are modeled separately from the
interactions between these components (Giammarco and Auguston 2013; Acheson, Dagli
and Kilicay-Ergin 2013; Auguston 2014; Giammarco, Farah-Stapleton and Auguston
2015). This separation of component behavior from interactions simplifies the model and
allows for all the components to interact with each other and their environment as defined
by the logic of the interactions. This allows the model to determine system behaviors in
general instead of linked to specific use cases that have been developed by the model
developer (Auguston 2014; Giammarco, Farah-Stapleton and Auguston 2015).
In MP (Auguston 2014; Giammarco, Farah-Stapleton and Auguston 2015), the
NPS developed event-driven capability, decoupling the model from specific use cases
15
provides a huge benefit as the model itself will develop the use cases automatically as
“event traces,” meaning that the analysis for the system can be done on all logical
scenarios and provides a way to see emergent system behavior that may have been hidden
otherwise (Giammarco, Farah-Stapleton and Auguston 2015; Paulo 2015). The
generation of the event traces makes it easier to identify critical paths in the architecture
design by manually applying event timing estimates and durations to the event traces
generated by MP (Auguston 2014). This allows for a comparison of component
utilization in the system since all of the possible use cases are identified and only the
individual component performance timings would need to be mapped to each trace.
This type of modeling is especially useful and applicable for SOS applications
due to the decoupling of the behaviors from the interactions. Due to the nature of the MP
application of event-driven modeling, it allows for the decoupling of the behavior of each
system from the other systems that make up the SOS and only links the systems together
with their interactions (Giammarco, Farah-Stapleton and Auguston 2015). This allows for
a more accurate description of how systems work together in an SOS situation. It also
makes the model more flexible to change and modification if design parameters need to
altered or if it is desirable to swap out systems completely as part of an AOA or due to
obsolescence issues.

16
THIS PAGE INTENTIONALLY LEFT BLANK

17
III. METHODOLOGY
The methodology used for the modeling and analysis done for this thesis initially
followed the structure outlined in “A Lab Manual for Systems Architecting and Analysis”
(Giammarco 2015a), and incorporated several MBSE and SE methodologies that were
found in articles read in compilation of the literature review (Giammarco 2014b; Ramos,
Ferreira, and Barceló 2011). The overarching steps of this methodology are:
1. Define and clearly state the problem to be solved. 2. Define the case study. 3. Define and document constraints. 4. Propose potential alternatives to be modeled. 5. Choose modeling tools. 6. Prepare model(s) in chosen tools. 7. Verify model outputs with the case study scenario. 8. Iterate the model with parameters for chosen alternatives. 9. Analyze results as an AOA and a comparison between the modeling
methodologies. 10. Document observations and provide conclusions and recommendations for
future work.
A. PROBLEM DEFINITION
The questions being addressed in this thesis were discussed in Chapter I;
however, they are summarized in this section. The two research questions considered in
this thesis are:
1. How do the performance predictions for SOS vary between the MBSE modeling methodologies: functional flow oriented and event oriented?
2. Can unmanned vehicles/systems be utilized effectively to conduct or augment SAR operations?
This means that there are two problems being addressed here. The first is to determine if
there is a better MBSE methodology and modeling tool to use for complicated SOS
applications. In order to reach an answer for this question, a case study had to be chosen
to be applied to each MBSE tool. For “A Lab Manual for Systems Architecting and
Analysis” (Giammarco 2015a), the SAR mission was chosen as the case study to model;
therefore, it will also be used for this thesis. Using the SAR mission as a case study

18
provides an opportunity for modeling to answer the question: Can unmanned vehicles
improve the performance of the SOS required in the execution of the SAR mission?
B. CASE STUDY: SAR MISSION
As discussed in the literature review, once the problem being solved by the
system or SOS is defined, the next step is to provide context for the problem. This
context is the operational scenario, the DRM, which will be used in the model as the
backdrop for the performance predictions of the system. The DRM and associated
OPSITs will be utilized to validate the model and provide the setting for the AOA being
done with the unmanned vehicles/systems.
1. SAR Mission Overview
For this thesis the goal for the SAR mission is to “minimize the loss of life, injury,
and property damage or loss at sea by finding or rendering aid to those in distress”
(Contag et. al 2015, Chapter 1). In order to accurately describe the architecture for a SAR
mission, all aspects of the operation have to be considered, and they will include:
• the parties in distress and needing rescue • the group(s) responsible for planning, coordination and execution of the
search and rescue evolution • the assets utilized for the actual search and/or rescue.
Based on the National Search and Rescue Plan of the United States (United States,
2007), the lead coordinating SAR organization has the right to recruit support from
available SAR assets without any prior notice. This means that all U.S. military, USCG,
commercial and civilian vessels and aircraft in region where the SAR situation is
occurring—the area of responsibility (AOR)—could become part of the SAR SOS. In
addition, if unmanned vehicles are found to be available and their capabilities deemed
useful to augment the SAR SOS they could also be added to the pool of available search
assets.

19
2. Operational Scenario Overview
Based on the general description of a SAR mission, the operational concept can
be illustrated in the DODAF high level concept graphic, operational view one (OV-1),
shown in Figure 9.
Figure 9. Operational concept for a SAR SOS (from Giammarco, Whitcomb
and Hunt 2015, 5).
Based on the overview shown in the OV-1 the actors required to conduct the SAR
mission were defined in “An Instructional Design Reference Mission for Search and
Rescue Operations” (Giammarco, Whitcomb and Hunt 2015) and are the following:
1. The physical environment where the SAR mission will be executed, also called the AOR
2. The party in distress requiring the rescue, persons in distress (PID) 3. The command and control (C2) center which will coordinate and direct the
overarching SAR mission execution 4. The available SAR Assets which can also be called the SAR units (SRU).
As illustrated in the OV-1, these can include any of the following: military/commercial/civilian vessels, military/commercial/ civilian aircraft, UAVs, UUVs and USVs.
During the course of the model development one additional actor was introduced
by Hunt, the On Scene Commander (OSC). According to Hunt, at the search area, a local
20
commander is appointed to coordinate the rescue operations between all the available on
scene SAR Assets (Spencer Hunt, 17 April 2015, email message to Kristin Giammarco).
The OSC is typically located on one of the manned SAR assets and will prepare the
search plan and direct the SAR Assets on their roles and responsibilities during the
search.
These five actors will be utilized as the high level assets in the model of the SAR
SOS architecture. The application and use of these assets is further described in the DRM
and associated OPSITs.
3. Design Reference Mission
A DRM is necessary to provide a bounded space for which to allow the model to
be developed and analyzed. If the DRM is too broad or complicated the model could
become unmanageable; the excessive complexity will hinder the ability to find any errors
and will make it more difficult to verify and validate the model. To begin with
developing a DRM, a capability needs statement has be chosen first: “Civilian and
defense agencies need a cost-effective means to search large areas of ocean and over-land
terrain in various environmental conditions in order to locate wreckage and survivors in
the shortest time possible” (Giammarco, Whitcomb and Hunt 2015, 11).
To keep consistency and to preserve the ability to integrate the models developed
in this thesis with the model Hunt prepared for his thesis, “Model-Based Systems
Engineering in the Execution of Search and Rescue Operations” (2015), the DRM used
for this thesis, was developed by Hunt. To keep the scope of the model and DRM to a
reasonable level, while still providing enough variation between missions to provide the
model with variation in the inputs, Hunt defined two OPSITs that will be the basis for the
missions modeled: (1) man overboard and (2) downed aircraft. To keep in the spirit of the
capability needs statement including both military and civilian applications for SAR,
Hunt defined both a U.S. Navy SAR OPSIT and a civilian scenario for each of the two
OPSITs. This gave Hunt four OPSITs to utilize in his modeling, and they were the
starting point for the OPSITs used in this thesis; however, additional simplifications and

21
generalizations were incorporated to provide a simpler comparison for the alternatives
being considered in the AOA.
4. Operational Situations
Hunt’s DRM (2015) described two overarching OPSITS with a total of four
breakout OPSITS. These OPSITs have been further simplified for the model in this thesis
into three OPSITs: (a) Near-Shore Rescue, (b) Medium-Distance Rescue and (c) Long-
Range Rescue. These three distances were chosen to be able to show the full range of
SAR missions and to provide the alternatives a range of missions to be compared. This is
important due to the large variation in capability between the available unmanned
platforms; using only one search scenario would not fully show the flexibility or
limitations of the alternatives being considered.
Near-Shore Rescue OPSIT: The near-shore rescue OPSIT is a simplification of
the U.S. Navy downed aircraft scenario where the helicopters and/or other SAR assets are
in the vicinity. In this case, all SAR assets will be 10 nautical miles (nm) from the initial
search area. This operational scenario would also apply to any recreational boating and/or
swimming SAR situations.
Medium-Distance Rescue OPSIT: The medium-distance rescue OPSIT is a
simplification of the U.S. Navy man overboard scenario. In this instance the SAR assets
will be starting 35nm from the initial search area. This distance could also be applicable
to any U.S. Navy littoral exercise or training accidents.
Long-Range Rescue OPSIT: The long-range rescue OPSIT is a simplification of
the civilian man overboard and downed aircraft scenarios. For this OPSIT, the SAR asset
will be located 200nm away from the initial search area.
5. Mission Narrative
The mission narrative that was used for this thesis was based on the initial
narrative found in the “An Instructional Design Reference Mission for Search and Rescue
Operations” (Giammarco, Whitcomb and Hunt 2015); however, as the work on the
architecture continued, the narrative was expanded by Hunt. To continue to ensure

22
consistency between models, the revised narrative was utilized for this thesis. In Hunt’s
thesis, “Model-Based Systems Engineering in the Execution of Search and Rescue
Operations,” he defined the narrative to be:
• Command and control (C2) either receives a distress signal from a person in distress (PID) or is notified of a missing person or vessel.
• If the general location information falls outside of the C2’s area of responsibility (AOR), the mission is assigned to the appropriate entity. If the general location is within the C2’s AOR, C2 initiates SAR protocol and passes mission information to available assets.
• Search and rescue units (SRUs) deploy to the search area as assigned by C2 and attempt to contact the PID or the missing person or vessel. If contact is made, SRU(s) requests a precise location and situation report (SITREP). If no contact is made, SRU(s) will periodically try again.
• Upon reaching the search area, datum or last known location (LKL), SRU(s) initiates a search pattern based on the mission situation to include environmental conditions, available assets, crew composition and time on station.
• SRU(s) conducts the search plan, scanning the environment for any signs of the PID or vessel and provides regular SITREPs to C2 and other SAR assets (OSA).
• If an SRU spots an object of interest, the SRU maneuvers for a closer inspection. If the object of interest appears to be wreckage, the SRU notifies OSA and C2 of the situation. If object of interest appears to be a PID, then the SRU notifies C2 and OSA and maneuvers to rescue or coordinates with another SRU to make the pickup. If the object of interest is not related to the SAR mission, the SRU resumes the search pattern until spotting another object of interest or conditions are reached for a return to base (RTB). (2015, 27–28)
6. Command Structure
As discussed in Section 2.A.2, the command structure of the SOS is an important
input into the architecture construct, and based on the narrative the proposed command
layering for the SAR Mission should be considered to be structured where:
• The C2 asset has overarching command of the SAR Mission it provides direction (control) to the local commander, the OSC.
• The OSC asset has overarching command to execute the local SAR mission with control of the SAR Assets: allocation of the SAR Assets, directing them where to conduct the search if the search area has been parsed into individual sectors, monitor search failures and implement back-up plans.

23
This proposed command and control structure is illustrated utilizing the micro-
patterns from UML for Real: Design of Embedded Real-Time Systems (Lavagno, Martin
and Selic 2003) in Figure 10.
Figure 10. Generalized SAR mission layered control architecture (after
Lavagno, Martin and Selic 2013).
C. CONSTRAINTS AND ASSUMPTIONS
Constraints
• Only one conventional SAR asset will be modeled, the manned helicopter; USCG/Navy ships, other military aircraft, civilian aircraft and boats will not be modeled as alternatives.
• There are many different available types of each unmanned system being considered; however, only one generalized solution for each platform will be modeled.
• The OSC can be located on the SAR Assets; however, the model will represent the OSC a separate entity from the SAR units.
Assumptions
• The SAR assets will be departing from the same location for each OPSIT: initial distance traveled will be constant.
• Weather conditions will not be included in this set of simulations. • The SAR missions being done for the three OPSITs will all be taking
place over water to allow for the utilization of the UUV and USV alternatives for all OPSITs. No overland rescues will be considered in this thesis.
D. DEFINITION OF ALTERNATIVES
Utilizing the mission narrative from the section 3.B, and the assumptions and
constraints defined in Section 3.C, the model for the SAR SOS case study can be built;

24
however, in order to execute the performance prediction simulations and AOA, the
alternatives being considered have to be defined. For this AOA, four alternative solutions
will be modeled. The manned helicopter will be used as the baseline for the analysis and
one notional platform will be utilized for each of the proposed unmanned vehicle
solutions.
Baseline: Helicopter
The helicopter parameters for the model will be based on the U.S. Navy
Helicopter Sea Combat (HSC) and Helicopter Maritime Strike (HSM) platforms the
Sikorski MH-60R/S Seahawk as both are utilized for combat SAR operations. Both
helicopters are based on the same airframe, their sensor suites and weapons systems vary
due to their different mission sets. The MH-60S variant is shown in Figure 11.
Figure 11. MH-60S Helicopter (from Sikorski Aircraft Corporation 2012).
The parameters that will be changing between platforms include: speed, search
coverage, and others (defined for the MH-60 in Table 1). All the parameters except speed
and travel distance were defined by Hunt (2015) in his thesis. All of the parameters used
for the model can be found in Appendix A, Tables 7 and 8.

25
Table 1. MH-60 Parameters (from Hunt 2015; from COMNAVAIR 2012; from Sikorski 2012)
Parameter Mean Value
Lead Time to Depart Base
Mean 30 min Distribution Normal
σ* 5 min
Travel Speed To AOR
Mean 120 knots Distribution Normal
σ for Travel Distance Near Shore 5 min
Medium Distance 5 min Long Range 15 min
Initial Scan Mean 0.07 min Distribution Exponential
Ability to Conduct Rescue YES
Rescue Maneuver Mean 0.1 min Distribution Exponential
Travel Speed From AOR
Mean 120 knots Distribution Normal
σ for Travel Distance Near Shore 5 min
Medium Distance 5 min Long Range 15 min
* σ = Standard Deviation
Option 1: Unmanned Aerial Vehicle
The Northrup Grumman MQ-8B variant of the U.S. Fire Scout UAV, Figure 12,
was chosen to as the example for the AUV alternative that will be modeled for the SAR
DRM OPSITs. The MQ-8B was chosen as the solution over other hand thrown or man
portable drone type UAVs due to the nature of the mission where higher speeds and
ranges are required. In addition, even though currently the MQ-8B cannot execute the
actual rescue component of the mission, a UAV of this size would be required if such a
capability was developed in the future. The parameters for the MQ-8B that will be
utilized in the model are shown in Table 2 and were retrieved from a Naval Air Systems
Command (COMNAVAIR) specification sheet for the MQ-8B and the much larger
follow on variant the MQ-8C (2015).

26
Figure 12. Fire Scout MQ-8B (from Northrup Grumman Corporation 2015).
Table 2. Fire Scout MQ-8B Parameters (from COMNAVAIR n.d.)
Parameter Mean Value
Lead Time to Depart Base
Mean 20 min Distribution Normal
σ 5 min
Travel Speed To AOR
Mean 85 knots Distribution Normal σ for Travel Distance Near Shore 5 min
Medium Distance 10 min Long Range 15 min
Initial Scan Mean 2 min Distribution Exponential
Ability to Conduct Rescue NO
Travel Speed From AOR
Mean 85 knots Distribution Normal σ for Travel Distance Near Shore 5 min
Medium Distance 10 min Long Range 20 min
Option 2: Unmanned Underwater Vehicle
UUVs in general are slow moving vehicles. Even the fastest variants, the torpedo
shape, Figure 13, rarely exceed a speed of 10 knots or have a very short mission duration
capability due to their high-speed capability. This low speed or short mission time will be
a hindrance for the SAR DRM, especially for the longer range OPSITs; however, to keep
from ruling out this type of vehicle without modeling, a vehicle based on the Virginia
Tech High Speed Autonomous Underwater Vehicle (AUV) (2011), which has a high-

27
speed of greater than 15 knots will be utilized as the UUV alternative in the model. The
parameters utilized in the model for the UUV alternative are listed in Table 3 and are
derived from the author’s personal experience with UUVs and based on the speed for the
High Speed AUV (Virginia Tech 2011).
Figure 13. Examples of UUVs (Kongsberg 2015; Virginia Tech 2011).
Table 3. Notional UUV Parameters (from Virginia Tech 2011)
Parameter Mean Value
Lead Time to Depart Base
Mean 20 min Distribution Normal
σ 10 min
Travel Speed To AOR
Mean 15 knots Distribution Normal σ for Travel Distance Near Shore 10 min
Medium Distance 15 min Long Range 30 min
Initial Scan Mean 20 min Distribution Exponential
Ability to Conduct Rescue NO
Travel Speed From AOR
Mean 15 knots Distribution Normal σ for Travel Distance Near Shore 10 min
Travel Speed From AOR
Medium Distance 15 min Long Range 30 min
Option 3: Unmanned Surface Vehicle
Based on author’s experience with USVs and due to the nature of the mission
where higher speeds and ranges are required and the ability to conduct rescue operations
would be preferable, a full size boat USV variant, Figure 14, will be the basis for the
USV modeled. The parameters utilized in the model for the USV alternative are listed in

28
Table 4 and are derived from the author’s personal experience with 7–11m rigid hull
inflatable boat (RHIB) USVs.
Figure 14. Examples of commercial USVs (from 5G International Inc. n.d.;
naval-technology.com 2015).
Table 4. Notional USV Parameters
Parameter Mean Value
Lead Time to Depart Base
Mean 20 min Distribution Normal
σ 10 min
Travel Speed To AOR
Mean 30 knots Distribution Normal σ for Travel Distance Near Shore 5 min
Medium Distance 15 min Long Range 20 min
Initial Scan Mean 5 min Distribution Exponential
Ability to Conduct Rescue YES
Rescue Maneuver Mean 5 min Distribution Exponential
Travel Speed From AOR
Mean 20 knots Distribution Normal σ for Travel Distance Near Shore 5 min
Medium Distance 15 min Long Range 30 min
29
E. TOOL CHOICE
1. Functional Flow—Innoslate
At the NPS, two main MBSE tools have been utilized in the SE curriculum:
Vitech CORE and Spec Innovations Innoslate. For the work being done in this thesis
Innoslate was the tool chosen to be utilized for the functional flow modeling. Innoslate is
a tool developed by Spec Innovations as a tool for the company to use internally for their
own MBSE applications (Spec Innovations 2015). Spec Innovations wanted Innoslate to
be able to integrate all of the utilities that previously they had needed multiple tools to
support. They designed Innoslate to be able to support the full system development life
cycle by providing a web based means of requirements and configuration management,
modeling the physical and behavior aspects of a system, simulations of system behavior,
be able to support the requirements of DODAF, and an easy to use interface that
promotes collaboration between users (Spec Innovations 2015).
In addition to incorporating all of the SysML diagrams, Spec Innovations has also
integrated two lifecycle modeling language (LML) diagrams into the capabilities of
Innoslate: Action (analogous to the SysML Activity) and Asset. One of the main
differences with LML based models is that decision points are assigned as functions
rather than as separate constructs. This allows for reducing the randomization of
decisions in the model flow. This hybrid approach to object and functional analysis
aspires to providing more realistic results without added levels of complexity (Dam
2015).
2. Event-Driven—Monterey Phoenix
At NPS an event-driven based approach is currently in collaborative development
between the Computer Science and SE departments, and the MP approach will be used in
this thesis. Monterey Phoenix is different from all other modeling approaches because it
decouples the system behavior and system interactions. This is especially important for
SOS applications, since per the SOS definition in section 2.B, the individual systems
should be independent from one another; the interactions between the systems are what
create the SOS scenario (Giammarco, Farah-Stapleton and Auguston 2014). This
30
decoupling makes it much easier to scale the model, allows the systems to more easily
interact with one another and the environment and allows for events to take place
concurrently (Auguston 2014).
Probably the most important thing that this decoupling and careful generalization
does is that it removes the requirement for the model architect from needing to build
exhaustive use cases; the MP algorithm builds the use cases automatically. Due to the
structure of MP, the model determines all the possible scenarios that can take place based
on the interactions and system behavior. These possible scenarios are provided as event
traces and the model will produce all the possible scenarios that can logically take place
up to a defined scope limit (Auguston 2014). For complex SOS architectures and/or
missions, this facet of MP is very helpful since it automatically generates a “super set”
(Giammarco, Farah-Stapleton and Auguston 2014) of use cases rather than the human
model developer having to define the use cases individually. These event traces are then
utilized to further analyze the behavior of the system(s) being modeled.
F. MODEL STRUCTURE
The treatment of the SAR mission as an SOS application has already been
introduced; however, the reason for this is that not only are the C2 and OSC their own
systems, but the SAR assets by definition are multiple systems working together.
Treating the SAR mission as an SOS is also critical if there is any hope of modeling
multiple platforms working together: more than one helicopter, more than one
UAV/UUV/USV or some combination of all four platforms. While in this thesis other
USCG, military and civilian vessels and aircraft are not being incorporated into the
analysis, if the model is structured correctly, in the future these additional assets should
be able to be added easily and a wide web of assets should be able to work together.
The illustrations of the system diagrams in this section will be from the Innoslate
model. Once the model architecture is developed and the action diagram and event traces
are prepared, the Innoslate and MP models will be compared in the Results chapter to
provide feedback on what additional views should be added to MP to make the
model/simulation outputs more flexible and useful for system architects and engineers.
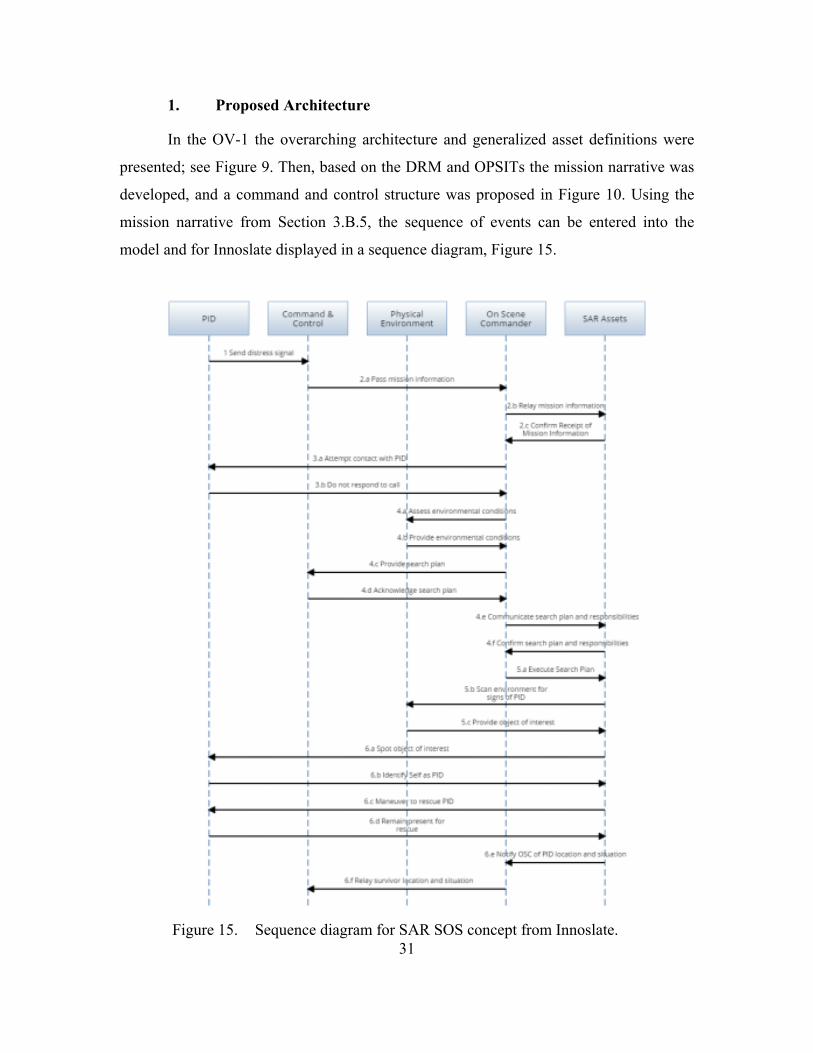
31
1. Proposed Architecture
In the OV-1 the overarching architecture and generalized asset definitions were
presented; see Figure 9. Then, based on the DRM and OPSITs the mission narrative was
developed, and a command and control structure was proposed in Figure 10. Using the
mission narrative from Section 3.B.5, the sequence of events can be entered into the
model and for Innoslate displayed in a sequence diagram, Figure 15.
Figure 15. Sequence diagram for SAR SOS concept from Innoslate.
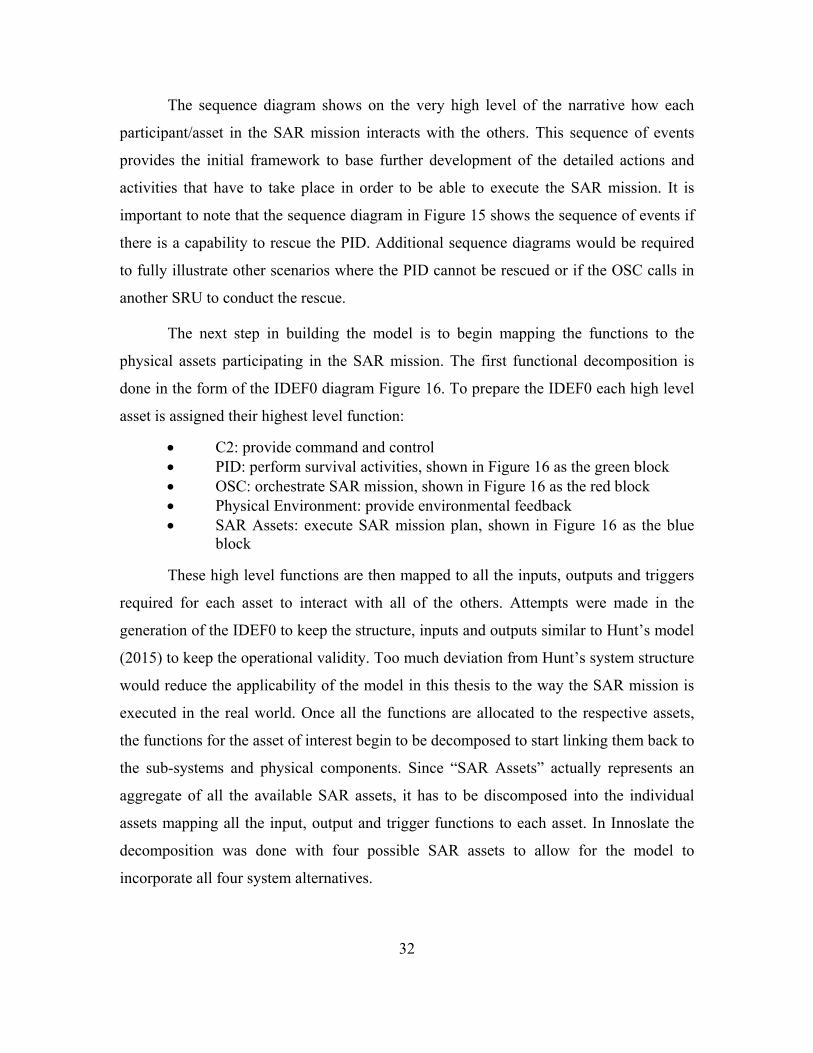
32
The sequence diagram shows on the very high level of the narrative how each
participant/asset in the SAR mission interacts with the others. This sequence of events
provides the initial framework to base further development of the detailed actions and
activities that have to take place in order to be able to execute the SAR mission. It is
important to note that the sequence diagram in Figure 15 shows the sequence of events if
there is a capability to rescue the PID. Additional sequence diagrams would be required
to fully illustrate other scenarios where the PID cannot be rescued or if the OSC calls in
another SRU to conduct the rescue.
The next step in building the model is to begin mapping the functions to the
physical assets participating in the SAR mission. The first functional decomposition is
done in the form of the IDEF0 diagram Figure 16. To prepare the IDEF0 each high level
asset is assigned their highest level function:
• C2: provide command and control • PID: perform survival activities, shown in Figure 16 as the green block • OSC: orchestrate SAR mission, shown in Figure 16 as the red block • Physical Environment: provide environmental feedback • SAR Assets: execute SAR mission plan, shown in Figure 16 as the blue
block
These high level functions are then mapped to all the inputs, outputs and triggers
required for each asset to interact with all of the others. Attempts were made in the
generation of the IDEF0 to keep the structure, inputs and outputs similar to Hunt’s model
(2015) to keep the operational validity. Too much deviation from Hunt’s system structure
would reduce the applicability of the model in this thesis to the way the SAR mission is
executed in the real world. Once all the functions are allocated to the respective assets,
the functions for the asset of interest begin to be decomposed to start linking them back to
the sub-systems and physical components. Since “SAR Assets” actually represents an
aggregate of all the available SAR assets, it has to be discomposed into the individual
assets mapping all the input, output and trigger functions to each asset. In Innoslate the
decomposition was done with four possible SAR assets to allow for the model to
incorporate all four system alternatives.

33
Figure 16. Functional decomposition for SAR SOS concept.
Figure 17 shows the inputs coming into each asset from the left (e.g., stores are
the furthest inputs on the left of the diagram), the triggers come in from the top (e.g., the
first is the SAR Mission Plan), and all the outputs generated by the SAR assets come out
of each asset and head off to the right (e.g., Aid and Waste). The SAR assets were chosen
to be decomposed further in this model due to the interest in comparing alternatives for
the SAR assets; however, any of the other functional assets could also be decomposed
further if that was of interest. The next step is to map each individual SAR Asset to the
functions it is responsible for, Figure 18.

34
Figure 17. Second-level functional decomposition illustrating the individual SAR assets that are part of the SAR SOS.

35
Figure 18. Individual SAR asset subsystem level functional decomposition (after Giammarco 2015b).
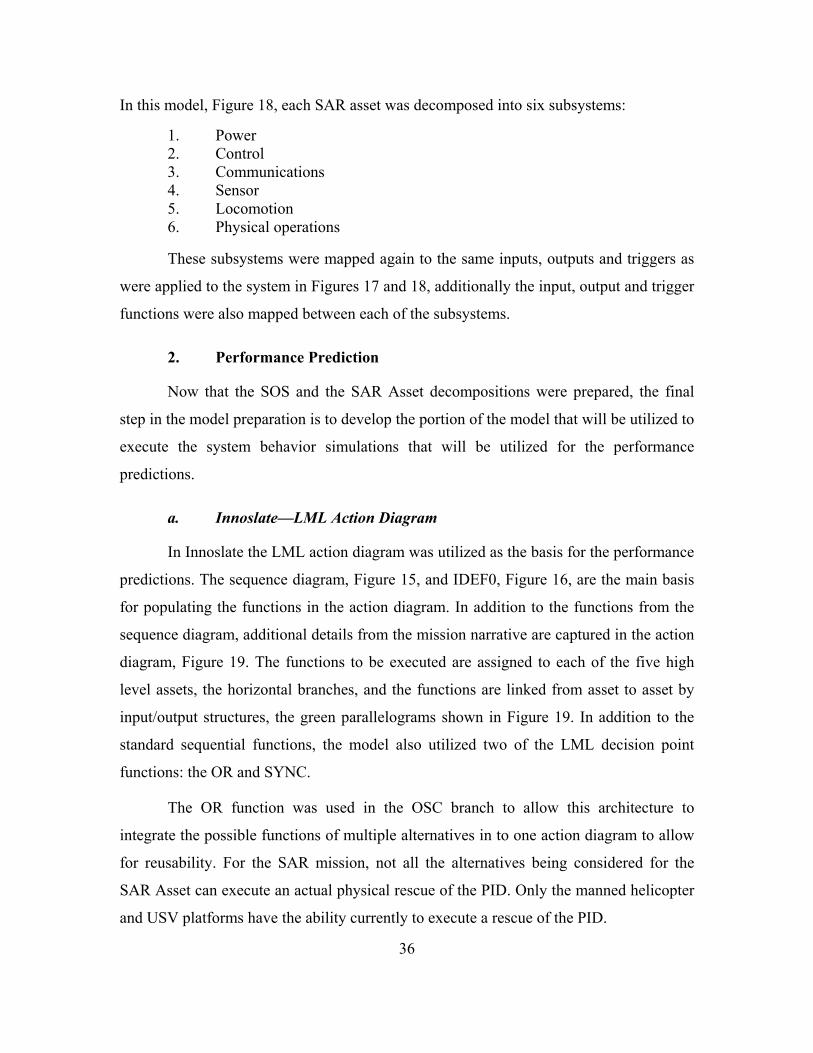
36
In this model, Figure 18, each SAR asset was decomposed into six subsystems:
1. Power 2. Control 3. Communications 4. Sensor 5. Locomotion 6. Physical operations
These subsystems were mapped again to the same inputs, outputs and triggers as
were applied to the system in Figures 17 and 18, additionally the input, output and trigger
functions were also mapped between each of the subsystems.
2. Performance Prediction
Now that the SOS and the SAR Asset decompositions were prepared, the final
step in the model preparation is to develop the portion of the model that will be utilized to
execute the system behavior simulations that will be utilized for the performance
predictions.
a. Innoslate—LML Action Diagram
In Innoslate the LML action diagram was utilized as the basis for the performance
predictions. The sequence diagram, Figure 15, and IDEF0, Figure 16, are the main basis
for populating the functions in the action diagram. In addition to the functions from the
sequence diagram, additional details from the mission narrative are captured in the action
diagram, Figure 19. The functions to be executed are assigned to each of the five high
level assets, the horizontal branches, and the functions are linked from asset to asset by
input/output structures, the green parallelograms shown in Figure 19. In addition to the
standard sequential functions, the model also utilized two of the LML decision point
functions: the OR and SYNC.
The OR function was used in the OSC branch to allow this architecture to
integrate the possible functions of multiple alternatives in to one action diagram to allow
for reusability. For the SAR mission, not all the alternatives being considered for the
SAR Asset can execute an actual physical rescue of the PID. Only the manned helicopter
and USV platforms have the ability currently to execute a rescue of the PID.

37
Figure 19. LML action diagram for SAR SOS concept in Innoslate.

38
The SYNC functions were used to coordinate the pairs of corresponding actions
for the SAR Assets and PID if a rescue was able to be done with the SAR Asset being
modeled or if the PID had to wait for another rescue asset to be assigned by the OSC. The
action diagram was then populated with parameters for the functions, Tables 8 and 9 in
the Appendix, and then a discrete event simulation was run for each set of parameters for
each OPSIT and SAR Asset alternative. Since the simulation results are random based on
the parameter distributions, each simulation was executed fifty times to provide a set of
numbers that could be averaged to provide a better approximation instead of just one
point value if the simulation was only ran once.
Two important notes for the model that was built in Innoslate:
1. First, no way was found to implement concurrent and asynchronous actions within the SAR asset branch to show the participation of multiple assets –all the branches must complete their actions synchronously before moving on to the next step.
2. The second is related to the first: if there was a way to implement multiple SAR Assets, there is no way to implement the layered control structure illustrated in Figure 11.
To expand on issue one, there is a way to show multiple participants/assets in an
asset branch in Innoslate, and this is done through the use of nested AND branches.
Unfortunately, this device would require that each sub-branch finish the execution their
respective functions before the timeline could move on to the next function after the
AND branch concludes. In some instances this would not be a problem, but the case of a
SOS where the SAR Assets will be working as a team, based on the search plan and
direction provided by the OSC, and the SAR Assets will need to be working concurrently
and asynchronously (performing their respective functions at different times) and the
mission should not be delayed due to a delay in the arrival of one of the SAR units or a
longer required time to do the initial search. The way the SOS should work is that all the
units would continue to the next function once one of the SAR Assets successfully
completed each function or in whatever pattern the OSC directs.
For the second limitation, the layered control for the OSC over the SAR Assets is
critical for being able to model the decision structure of how the OSC would allocate the
resources available to optimize the SAR mission execution. For example, the OSC would

39
direct the SAR Assets for various areas of the AOR to provide as much search coverage
area as possible at the start of the mission, additionally the OSC would direct the SAR
Assets as they arrive, the OSC would not wait to start the mission until all the SAR Asset
are in place. In addition, the model should be able to determine which SAR Assets have
the capability to provide the best performance for executing each function, or determine
which combination of available assets should be used to reduce mission time. For
example, potentially the UAV may be the best initial search tool, but even if the UAV
finds the PID first, another asset: the USV, manned helicopter, or USCG vessel, would
need to be sent out to conduct the physical rescue or recovery of the PID.
b. Monterey Phoenix
The differences between MP and Innoslate can be inferred from the descriptions
of both tools in Sections 2.B and 3.E but they are quickly summarized here now that an
example has been modeled in each. The first is that MP will generate all possible use
cases based on the logic of the model instead of requiring the model designer to prepare a
set of use cases to validate the model against. This is very advantageous for two reasons:
1. Problems and flaws in the model can be determined by reviewing the use cases. If there is missing logic the model will generate event traces that are not realistic and this can be used to correct and refine the model.
2. As stated in the literature review, having the model designer manually generate the use cases can introduce error into the model, or if a use case is missed and that is the problematic scenario, the system architecture can be deemed ready for implementation with a serious problem that will not be identified until after the system is built.
In addition to generating the use cases, it has been demonstrated in the MP
literature (Auguston 2014) that this approach allows for concurrent and parallel execution
of events by various assets. Being able to model concurrent and asynchronous events
allows the model to more accurately describe the system and therefore the system
performance.
One limitation of MP as compared with Innoslate is that the current version of MP
does not allow for the application of system parameters (event attributes) into the model.
The mission time and critical paths (Auguston 2014) can still be calculated, but they must
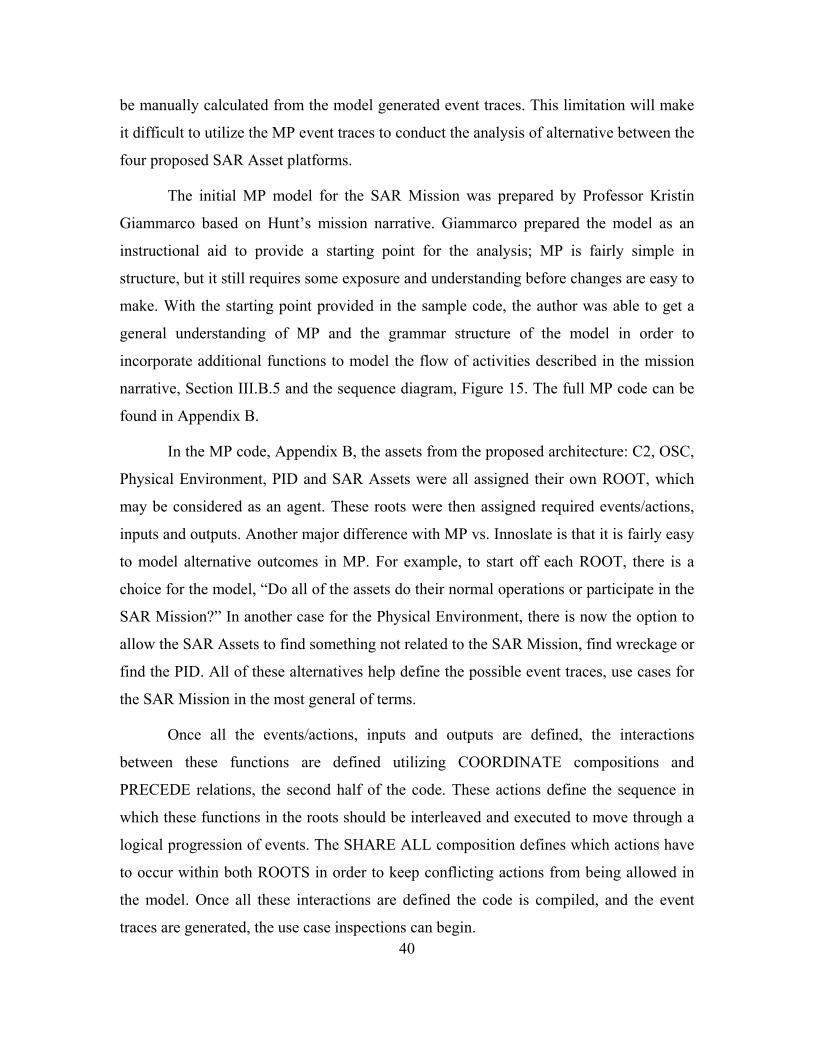
40
be manually calculated from the model generated event traces. This limitation will make
it difficult to utilize the MP event traces to conduct the analysis of alternative between the
four proposed SAR Asset platforms.
The initial MP model for the SAR Mission was prepared by Professor Kristin
Giammarco based on Hunt’s mission narrative. Giammarco prepared the model as an
instructional aid to provide a starting point for the analysis; MP is fairly simple in
structure, but it still requires some exposure and understanding before changes are easy to
make. With the starting point provided in the sample code, the author was able to get a
general understanding of MP and the grammar structure of the model in order to
incorporate additional functions to model the flow of activities described in the mission
narrative, Section III.B.5 and the sequence diagram, Figure 15. The full MP code can be
found in Appendix B.
In the MP code, Appendix B, the assets from the proposed architecture: C2, OSC,
Physical Environment, PID and SAR Assets were all assigned their own ROOT, which
may be considered as an agent. These roots were then assigned required events/actions,
inputs and outputs. Another major difference with MP vs. Innoslate is that it is fairly easy
to model alternative outcomes in MP. For example, to start off each ROOT, there is a
choice for the model, “Do all of the assets do their normal operations or participate in the
SAR Mission?” In another case for the Physical Environment, there is now the option to
allow the SAR Assets to find something not related to the SAR Mission, find wreckage or
find the PID. All of these alternatives help define the possible event traces, use cases for
the SAR Mission in the most general of terms.
Once all the events/actions, inputs and outputs are defined, the interactions
between these functions are defined utilizing COORDINATE compositions and
PRECEDE relations, the second half of the code. These actions define the sequence in
which these functions in the roots should be interleaved and executed to move through a
logical progression of events. The SHARE ALL composition defines which actions have
to occur within both ROOTS in order to keep conflicting actions from being allowed in
the model. Once all these interactions are defined the code is compiled, and the event
traces are generated, the use case inspections can begin.

41
IV. RESULTS
This chapter will discuss the results obtained from both models developed for this
thesis. The Innoslate model results and observations based will be covered first. The
second half of this chapter will review the MP results; a discussion of the model
refinements that were required due to the initial observations and results will be covered
in detail.
A. FUNCTIONAL FLOW PERFORMANCE PREDICTION
As described in the Methodology chapter, the Innoslate model action diagram,
Figure 20, was updated with a set of parameters for each of the functions, Tables 7 and 8
which can be found in Appendix A, and a discrete event simulation was run for each of
these parameter sets. The event simulation timeline, Gantt chart format, for the helicopter
near shore OPSIT is shown as an example in Figure 21 just to provide a visualization of
how the logic of the model has the system flow from one function to the next. The Gantt
chart output from Innoslate is very similar to that of Microsoft Project.
Figure 20. Example Innoslate discrete event simulation timeline.

42
The mission time results of the first three simulations for each OPSIT and
alternative, of the 50 that were run, are listed in Table 5, to give an example of the results
that were seen. The data from all 50 runs can be seen in Appendix C. The average results
for each alternative and OPSIT, based on the 50 simulations, are listed in Table 6. Based
on the initial numbers of the total mission time, it appears the UAV provides the best
support for the near shore and medium distance OPSITs with the helicopter in second
place. It is important to note that the UAV cannot conduct the physical rescue of the PID,
so this would not be a full solution to the SAR mission for these two OPSITs, but it could
be a good augmentation tool that would not hinder the SAR mission execution timeline.
Table 5. Innoslate Model Results
Near-Shore Medium-Distance Long-Range hrs min hrs min hrs min
Helicopter 2 18.29 3 25.43 6 18.17 2 9.67 2 29.73 5 22.30 2 24.90 3 7.97 5 55.97
UAV 1 50.18 2 34.73 5 58.25 1 50.32 2 35.38 6 49.25 1 47.13 2 51.33 6 24.60
UUV 3 15.53 7 2.00 28 24.08 3 26.38 6 5.80 27 39.87 2 45.47 6 27.83 28 28.60
USV 3 16.22 4 49.28 18 21.45 3 3.05 5 20.22 18 30.37 2 57.47 5 40.32 17 48.40
The results in Table 6show that the UUV and USV as standalone SAR Assets are
much slower than the helicopter and UAV; in a situation where time is of the essence,
they would not be usable alternatives. For the long-range OPSIT event, the helicopter
takes too long to reach the initial search area for this to be the best solution. Additional
alternatives would have to be considered for a scenario where the travel distance is on the
order of 200nm.

43
Table 6. Average mission time by alternative and per OPSIT distance.
Near-Shore Medium-Distance Long-Range hrs min hrs min hrs min
Helicopter 2 17.68 3 1.04 5 52.14 UAV 1 49.21 2 40.48 6 24.03 UUV 3 9.13 6 31.87 28 10.85 USV 3 5.57 5 16.61 18 13.41
After the initial cursory look at the results, a closer examination of the timelines,
the Gantt charts for each solution, each of the simulations run showed that even for the
shorter transit distance OPSITs: near shore and medium distance, there was an extended
delay in the initiation of the SAR Asset portion of the search, functions starting at “Scan
environment for signs of PID” and onward, due to the fact that the model ran the OSC
action “Execute Search Plan” was consistently showing as requiring 60 minutes ±10
minutes to execute as defined by the parameter assigned to this action, Tables 7 and 8
found in Appendix A. In discussions with Hunt this initial parameter definition was to
show that searches typically take an hour to execute until a trace of the PID is found.
However, in reality the SAR Assets are conducting their actions: arriving, scanning the
environment for objects of interest concurrently as part of executing the search plan. In
functional flow models, there is a way to execute actions concurrently and that is by
using an AND construct. The difficulty arises in that an AND construct is nested within
an asset line and does not apply among various assets. This means that an AND construct
could be used to show multiple SAR Assets doing the same search functions
concurrently, but cannot be used to allow for the OSC and SAR asset actions to happen
concurrently in a coordinated manner. This limitation to the model adds an artificial delay
for the helicopter and AUV for the two OPSITs where they can reach the initial search
location in in under an hour: the near shore and medium distance rescue.
As mentioned, the UAV showed to be the best solution for the near shore and
medium distance OPSITs; however, there are current limitations for the UAVs to execute
the actual rescue of the PID. If the UAV was one of the available SAR Assets, it would
need to work with one of the other assets that is able to conduct a rescue: the manned

44
helicopter or the USV. Since the model was built for a SOS architecture, the plan was to
execute a simulation utilizing each of the alternatives to see the best way to integrate the
unmanned vehicles with the manned helicopter. As discussed in the previous paragraph,
concurrent actions can be shown in a functional flow model using the AND construct;
however, there is no straightforward way to define the logic of the decision function to
choose the best alternative(s) for each action to optimize the execution of the mission.
Due to this limitation, the model where all four assets types executed the mission together
was not attempted in Innoslate.
B. EVENT-DRIVEN PERFORMANCE PREDICTION
At the end of the Methodology chapter, the MP model development for the SAR
Mission was discussed. The last step was to compile the code to produce the event traces
for all the possible use cases based on the logic provided in the code. As mentioned in
Section 3.E.1.b, the initial MP code was provided as a starting point, and the output of
that original model code produced eight event traces, but some of the traces were
outcomes that could not happen in the real world. The main two discrepancies were:
1. The model only showed the OSC returning to base. The local commander should not be able to leave the scene without also providing direction to the SAR Assets to RTB as well.
2. There were several event traces where there were no SITREPs sent to the OSC or C2. This would never happen in the real world, regardless what is going wrong in the mission, SITREPs should always be sent.
1. Initial Model Refinements
The model code was modified to correct these deficiencies, and six event traces
were produced. The final code for the model can be found in Appendix B. The general
description of the event traces are:
1. All assets continue executing normal operations; there is no SAR Mission, Figure 21.
2. SAR Mission initiates; SAR Assets conduct search but no objects of interest are found; SAR assets continue to scan but OSC aborts mission and all Assets RTB.
3. SAR Mission initiates; SAR Assets conduct search and find an object of interest; the object of interest is determined not to be related to the SAR, so the OSC aborts mission and all Assets RTB.

45
4. SAR Mission initiates; SAR Assets conduct search and find an object of interest; the object of interest is determined to be wreckage so the OSC aborts mission and all Assets RTB.
5. SAR Mission initiates; SAR Assets conduct search and find an object of interest; the object of interest is determined to be the PID; SAR Assets provides PID SITREP to OSC; PID is rescued; OSC concludes mission and all assets RTB, Figure 22.
6. SAR Mission initiates; SAR Assets conduct search and find an object of interest; the object of interest is determined to be the PID; SAR Assets provides PID SITREP to OSC; PID NOT rescued; OSC concludes mission and all assets RTB.
Figure 21. Event Trace 1, no SAR mission.
At the time of this writing, the current MP prototype tool requires the event traces
to manually be mapped to mission execution timings (Auguston 2014); there is currently
no way to enter the event and asset definitions or parameters into the model directly to
generate performance predictions for each event trace. As can be expected these manual
calculations will quickly become cumbersome and potentially complicated for a complex
SOS. Additionally, as mentioned previously, the current MP model requires additional
capabilities to fully model the SAR SOS. The ability to incorporate the available SAR
assets and their respective capabilities to allow for MP to provide additional event traces
based on the best combination of the available assets could be incorporated into the
algorithm. If this type of capability cannot be added into MP, a Gantt chart type output,
similar to what Innoslate provides, Figure 20, could prove helpful in adding the event
timings manually.

46
Figure 22. Event Trace 5, full SAR Mission with PID recovery.

47
2. Final Refinements
The first improvement was to expand the number of objects of interest the SAR
Assets could find. The previously discussed version of the model, only allows the SAR
Assets to find one object of interest, and if that object is not the PID, then the mission is
aborted. In reality, after the first object of interest is found not be the PID, the OSC would
redirect the individual SAR asset that found the object of interest to continue searching;
to finish searching the sector it was responsible for or moving that asset to search another
sector or to support another SAR Asset. This cycle should continue until the SAR SOS
finds the PID or runs out of mission time (such as low battery, low fuel, and crew rest).
The search loop was added to the model with the assistance of Professor Mikhail
Auguston. No restrictions were set on the number of loops allowed in the code; instead
the limitations were set by the scope selection in MP. With a scope of one, nine event
traces were generated without the SAR Assets acquiring more than one target, since only
one iteration of the code was allowed by the scope; however, when the scope was set to
two, 46 event traces were generated. The full code for this version of the model can be
found in Appendix E. Due to the high number of traces, the event traces will not be
included in an appendix as part of this thesis; however, the code in Appendix E can be
uploaded into the MP online public compiler: firebird.nps.edu, and executed to view all
of the traces.
Two examples showing the loop through finding multiple targets are shown in the
following figures. Event trace 12, Figure 23, shows the SAR Assets finding an object not
related to SAR initially and then finding wreckage; event trace 23, Figure 24, shows the
SAR Assets finding an object not related to SAR and then finding the PID. In these event
traces, to have MP run the SAR Assets through more than two objects of interest, the
person running the model will just keep increasing the scope to keep viewing the
expanded results based on the number of iterations being run though the code.
48
Figure 23. Event Trace 12.

49
Figure 24. Event Trace 23.
50
The second improvement to the model was the ability to begin to show the
behavior of the individual SAR Asset grouped under the parent SAR Assets. This was
done by defining the SAR Assets ROOT as a set composed of the individual SAR assets.
This was done utilizing the following MP syntax:
ROOT SAR_Assets: { + SAR_Asset + };
then the SAR_Asset was utilized to define all actions formerly within the SAR_Assets
ROOT. The other change to the code was the addition of the un-synchronized
COORDINATE function: COORDINATE <!>. This asynchronous coordination allows
for the individual SAR Asset(s) to execute the same functions concurrently but unlike
with the Innoslate model, without needing to be executed at the same time.
The number of the individual SAR_Asset(s) can be set utilizing the scope setting
in MP, or by adding a number of requested instances to override the general scope. In
order to test the set of assets, the set was fixed at two assets utilizing the following MP
syntax:
ROOT SAR_Assets: { + <1..2> SAR_Asset + };
With this addition of individual assets and the asynchronous coordination (see
Appendix F for the full code), MP generates 24 event traces at scope 1 that begin to show
the individual SAR_Asset(s) working together. Figure 25 shows an event trace where the
PID is found and rescued by the two SAR_Asset(s) in the mission. Since the scope was
set to one for this run, there are not multiple targets found by the two SAR_Asset(s)
executing this search. It was expected that if the model scope was set to two or higher,
the two assets should find multiple targets of interest; however, the connection with the
firebird.nps.edu server currently times out before the scope 2 results on this model are
delivered. Solutions for the MP Analyzer prototype to serve larger models over the
internet could be investigated, as well as modeling methodology improvements to reduce
the weight of the model and resulting traces.

51
Figure 25. Dual SAR_Asset event trace with PID rescue.
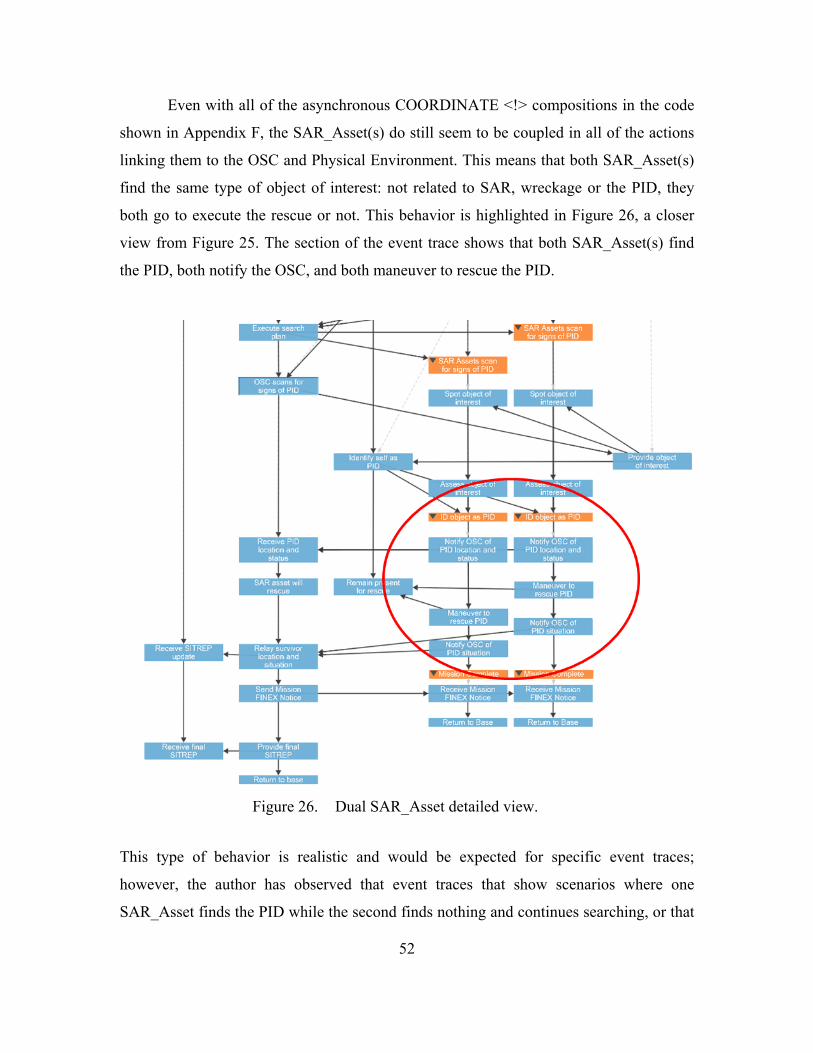
52
Even with all of the asynchronous COORDINATE <!> compositions in the code
shown in Appendix F, the SAR_Asset(s) do still seem to be coupled in all of the actions
linking them to the OSC and Physical Environment. This means that both SAR_Asset(s)
find the same type of object of interest: not related to SAR, wreckage or the PID, they
both go to execute the rescue or not. This behavior is highlighted in Figure 26, a closer
view from Figure 25. The section of the event trace shows that both SAR_Asset(s) find
the PID, both notify the OSC, and both maneuver to rescue the PID.
Figure 26. Dual SAR_Asset detailed view.
This type of behavior is realistic and would be expected for specific event traces;
however, the author has observed that event traces that show scenarios where one
SAR_Asset finds the PID while the second finds nothing and continues searching, or that

53
one SAR_Asset executes the rescue while the SAR_Asset continues to search, are not
generated by this MP model.
The fact that MP showed this behavior, or the lack of the expected behaviors, in
the generated event traces is an illustration of the value added of the MP approach; MP
provides a way to identify unwanted system behaviors contained within the model logic
that is being built for the system, or system of systems. As previously discussed in
Section 3.E.2, other executable modeling systems require the model builder or user to
develop individual use cases that will test the system model to find errors or unwanted
behaviors. Not only does this take time, but it is also very difficult for a human to capture
all the possible scenarios where something may cause the system to behave strangely. MP
provides automation for the modeler by generating all the possible scenarios that can
happen based on what was specified in the model, treating system behaviors and system
interactions as separate concerns. The review of all of the generated traces for errors or
unwanted behaviors still take time, but it is much easier to spot a mistake in a graphical
representation of the system behavior than it is without such visualizations.
C. SUMMARY
This chapter reviewed the results of the two models of the SAR Mission and
discussed the performance of the models based on what was desired as the outputs. Initial
discussion on model improvements was presented and is summarized in the following
and final chapter.

54
THIS PAGE INTENTIONALLY LEFT BLANK
55
V. CONCLUSIONS
The two research questions asked by this thesis were:
1. How do the performance predictions for SOS vary between the two MBSE modeling methodologies: functional flow oriented and event-driven?
2. Can unmanned vehicles/systems be utilized effectively to conduct or augment SAR operations?
The work done in this thesis is not able to answer these two questions fully but started a
process to answer these questions. Neither of the tools used for the two modeling
approaches utilized in this thesis, Innoslate for functional flow and MP for event oriented,
are currently equipped to fully model a SOS. In order to make both tools better able to
handle SOS modeling needs, some additional capabilities could be added.
A. RECOMMENDATIONS
For Innoslate, the main difficulty was with modeling concurrent behaviors
between assets to show teamwork within the SOS. It would be very valuable for
modeling SOS if Innoslate had the capability to allow each asset to proceed through the
mission asynchronously, without waiting for each of the other assets to complete its
previous function. Another way to implement this type of structure/methodology could be
by moving away from the standard “swim lane” diagrams that are limiting the amount of
interaction among the various assets. If a less rigid methodology could be implemented,
the more asynchronous interactions between the assets may be able to be modeled in the
functional flow model. Even if the model was still not able to optimize the utilization of
available SAR Assets, the model outputs could still be used to conduct AOA for the SOS
based on use case combinations created by the model users. Based on the application of
the SysML and LML in Innoslate, it seems to be appropriate to utilize more fully the
UML concepts from software development, especially something similar to the three
“micro-patterns” that were discussed in UML for Real: Design of Embedded Real-Time
Systems (Lavagno, Martin and Selic 2003, 172). This type of modeling hierarchy is
already in existence and the application to systems engineering applications will be key
to accurately modeling SOS architectures.

56
With MP, the limiting factor is the manual application of the system parameters.
To do this manually potentially limits the accuracy of the AOA being derived from the
model developed event traces due to the added opportunity to introduce human error. The
ability to incorporate the parameters of the systems and the environment directly into the
model would allow for the event traces to begin to describe more fully all possible
scenarios based on the assets available and the environment being considered. This
capability will also allow for users to search the generated scenarios for the best solution
out of the possible alternatives. Without this capability or a way to automate this
capability with inputs from MP, there is a limit to the types of analyses questions that can
be answered with just the event traces generated by MP. In addition to this increased
capability for the model, three additional recommendations can be made for improving
the performance of the MP Analyzer. The first two are linked to the firebird.nps.edu
server timeouts that were observed when running the SAR model at the scopes of two
and higher. A solution should be considered to allow the MP Analyzer prototype to better
serve larger models over the internet, or improvements to the modeling methodology
could be developed to reduce the weight of the model and the resulting traces. The
second is to incorporate better graphical visualizations into MP to allow for the better
capture of the precedence relationships in a more visually appealing manner and without
the requirement for manual manipulation of the event traces.
Even with the limitations to the modeling tools, the question of whether or not
unmanned vehicles can be useful for a SAR mission has been partially answered by the
Innoslate model. The results of the Innoslate model showed that the UAV could be a very
useful search tool that may be capable of shortening mission times; however due to the
current lack of rescue capability, the UAV would have to be paired with another type of
system that was recovery capable in order for the SAR mission to be completed
successfully. The USV alternative is capable of conducting rescue operations; however
due to limitation on transit speed, it is not a suitable choice for searches conducted at far-
range distances. The USV alternative could not be utilized for these missions without a
way to compensate for the late arrival, either by delivery by a faster mode of transport or
timing the arrival to support PID rescue not the search. These results show that unmanned
57
systems will be able to positively augment the performance of conventional platforms:
manned helicopters, U.S. Navy or USCG vessels, for a SAR Mission, but in order to
prove this with modeling, the additional capabilities discussed will need to be
incorporated into the tools. Until then, neither modeling approach can presently provide
the necessary information to fully answer the analysis of alternatives question.
B. FUTURE WORK
In addition to the improvements previously suggested for both modeling tools, the
models from this and Hunt’s thesis (2015) will be merged to create an integrated SOS
model that will be ready for integration into the Lab Manual for the NPS SE4150 System
Architecture and Design class as the DRM and example.
For Innoslate, the ability to model the SOS is limited by the lack of concurrent
and asynchronous actions and interactions between the various assets performing the
mission being modeled. If a way to perform concurrent/asynchronous actions was added
into the decision structure library or better methodological employment of existing
constructs it would allow for a better SOS modeling capability. Additionally, the ability
to provide the model with more definitive decision points would also be helpful. Similar
to the improvements being suggested for MP, if a capability was added to provide the
model with the information on each system in a way to allow for the logic of the model to
decide which SAR Asset should execute which part of the system actions (search or
rescue in this thesis), that would reduce the likelihood that unneeded constraints and
human bias is skewing the results of the model or AOA.
As previously mentioned, the ability to provide the MP model with the
characteristics/attributes of the agents/roots/assets would be of significant benefit the
users of MP because this would allow for a better way to integrate the actual system
performance prediction into the model. The ability to provide the model with actual
performance parameters for the systems being modeled, or even mission parameters like
AOR related information: weather, travel distance, and search area size, could potentially
allow for the model to make decisions on how to best utilize the assets available. The MP
model could answer questions on how to optimize the mission, or feed the MP generated

58
event traces into a tool designed for this type of optimization analysis, since operations
can be conducted concurrently determining how to allocate the available resources to
provide the largest coverage area for the search over the full AOR, and potentially
answering many other operational questions. While automatic OPSIT generation for the
given architecture is valuable in its own right, the ability to include performance
requirements and system specifics will allow for the development of far more thorough
analyses of alternatives.

59
APPENDIX A. FUNCTION PARAMETERS FOR ALTERNATIVES
SEE FOLLOWING PAGE

60
Table 7. Function parameters for the Helicopter and UAV alternatives (from Hunt 2015; from COMNAVAIR 2012; from Sikorski 2012; from COMNAVAIR n.d.).
Description UC.1 Helicopter UC.2 UAV
Distribution Mean μ, min
STD Dev. σ, min
Lambda λ Distribution Mean
μ, min STD Dev.
σ, min Lambda
λ Send Distress Signal Exp 2.00 0.5 Exp 2.00 0.5 Pass mission information Exp 3.03 0.33 Exp 3.03 0.33 Relay mission information Exp 1.00 1 Exp 1.00 1 Confirm receipt of mission information Exp 5.00 0.2 Exp 5.00 0.2
Depart from base Normal 30.00 5 Normal 20.00 5 Proceed to mission area (Near Shore, 10 nm) Normal 10.00 5 Normal 7.06 5
Proceed to mission area (Med Distance, 35 nm) Normal 17.50 5 Normal 24.71 10
Proceed to mission area (Long Range, 200 nm) Normal 100.00 15 Normal 141.18 15
Attempt contact with PID Exp 0.50 2 Exp 0.50 2 Do not respond to call Exp 5.00 0.2 Exp 5.00 0.2 Assess environmental conditions Exp 0.07 15 Exp 0.07 15 Provide environmental conditions Exp 0.10 10 Exp 0.10 10 Provide search plan Exp 0.20 5 Exp 0.20 5 Acknowledge search plan Exp 5.00 0.2 Exp 5.00 0.2 Communicate search plan and responsibilities Exp 0.50 2 Exp 0.50 2
Confirm search plan and responsibilities Exp 2.00 0.5 Exp 2.00 0.5
Conduct search plan Normal 60.00 10 Normal 60.00 10 Scan environment for signs of PID Exp 0.07 15 Exp 2.00 0.5

61
Description UC.1 Helicopter UC.2 UAV
Distribution Mean μ, min
STD Dev. σ, min
Lambda λ Distribution Mean
μ, min STD Dev.
σ, min Lambda
λ Provide object of interest Exp 5.00 0.2 Exp 5.00 0.2 Spot object of interest Exp 3.03 0.33 Exp 3.03 0.33 Identify self as PID Exp 2.00 0.5 Exp 2.00 0.5 Able to conduct rescue? Value YES Value NO Maneuver to rescue PID Exp 0.10 10 Exp 5.00 0.2 No Rescue Exp 0.50 2 Exp 0.50 2 Remain present for rescue Exp 5.00 0.2 Exp 5.00 0.2 Await rescue instructions from OSC Exp 5.00 0.2 Exp 5.00 0.2 Rescued or Waiting Value 0.00 Value 0.00 Notify OSC of PID location and situation Exp 2.00 0.5 Exp 2.00 0.5
Return to Base (Near Shore, 10nm) Normal 5.00 1.5 Normal 7.06 5 Return to Base (Med Distance, 35nm) Normal 17.50 5 Normal 24.71 10
Return to Base (Long Range, 200nm) Normal 100.00 15 Normal 141.18 20
Relay survivor location and situation Exp 2.00 0.5 Exp 2.00 0.5
Receive SITREP update Exp 5.00 0.2 Exp 5.00 0.2

62
Table 8. Function parameters for the UUV and USV alternatives (from Virginia Tech 2011).
Description UC.3 UUV UC.4 USV
Distribution Mean μ, min
STD Dev. σ, min
Lambda λ Distribution Mean
μ, min STD Dev.
σ, min Lambda
λ Send Distress Signal Exp 2.00 0.5 Exp 2.00 0.5 Pass mission information Exp 3.03 0.33 Exp 3.03 0.33 Relay mission information Exp 1.00 1 Exp 1.00 1 Confirm receipt of mission information Exp 5.00 0.2 Exp 5.00 0.2
Depart from base Normal 20.00 10 Normal 20.00 10 Proceed to mission area (Near Shore, 10 nm) Normal 40.00 10 Normal 20.00 5
Proceed to mission area (Med Distance, 35 nm) Normal 140.00 15 Normal 70.00 15
Proceed to mission area (Long Range, 200 nm) Normal 800.00 30 Normal 400.00 20
Attempt contact with PID Exp 0.50 2 Exp 0.50 2 Do not respond to call Exp 5.00 0.2 Exp 5.00 0.2 Assess environmental conditions Exp 0.07 15 Exp 0.07 15 Provide environmental conditions Exp 0.10 10 Exp 0.10 10 Provide search plan Exp 0.20 5 Exp 0.20 5 Acknowledge search plan Exp 5.00 0.2 Exp 5.00 0.2 Communicate search plan and responsibilities Exp 0.50 2 Exp 0.50 2
Confirm search plan and responsibilities Exp 2.00 0.5 Exp 2.00 0.5
Conduct search plan Normal 60.00 10 Normal 60.00 10 Scan environment for signs of PID Exp 20.00 0.05 Exp 5.00 0.2 Provide object of interest Exp 5.00 0.2 Exp 5.00 0.2 Spot object of interest Exp 3.03 0.33 Exp 3.03 0.33

63
Description UC.3 UUV UC.4 USV
Distribution Mean μ, min
STD Dev. σ, min
Lambda λ Distribution Mean
μ, min STD Dev.
σ, min Lambda
λ Identify self as PID Exp 2.00 0.5 Exp 2.00 0.5 Able to conduct rescue? Value NO Value YES Maneuver to rescue PID Exp 15.00 0.0667 Exp 5.00 0.2 No Rescue Exp 0.50 2 Exp 0.50 2 Remain present for rescue Exp 5.00 0.2 Exp 5.00 0.2 Await rescue instructions from OSC Exp 5.00 0.2 Exp 5.00 0.2
Rescued or Waiting Value 0.00 Value 0.00 Notify OSC of PID location and situation Exp 2.00 0.5 Exp 2.00 0.5
Return to Base (Near Shore, 10nm) Normal 40.00 10 Normal 30.00 5 Return to Base (Med Distance, 35nm) Normal 140.00 15 Normal 105.00 15
Return to Base (Long Range, 200nm) Normal 800.00 30 Normal 600.00 30
Relay survivor location and situation Exp 2.00 0.5 Exp 2.00 0.5
Receive SITREP update Exp 5.00 0.2 Exp 5.00 0.2

64
THIS PAGE INTENTIONALLY LEFT BLANK.

65
APPENDIX B. MONTEREY PHOENIX SAR SOS MODEL CODE
/* Actors */ SCHEMA WideRangeSearch ROOT Command_and_Control: ( Perform_C2_normal_operations |
Initiate_SAR_mission ); Initiate_SAR_mission: Receive_distress_signal
Pass_mission_information Acknowledge_search_plan [ Receive_SITREP_update ] Receive_final_SITREP;
ROOT On_Scene_Commander: ( Perform_OSC_normal_operations |
Lead_SAR_mission ); Lead_SAR_mission: Receive_mission_information
Depart_from_base Relay_mission_information Attempt_contact_with_PID OSC_assesses_environmental_conditions Provide_search_plan Communicate_search_plan_and_responsibilities OSC_scans_for_signs_of_PID (* Receive_updates_for_OSC *) [ Receive_PID_location_and_situation
Send_PID_Rescue_Instructions Relay_survivor_location_and_situation ]
Send_Mission_FINEX_Notice Provide_final_SITREP Return_to_base;
ROOT PID: ( Is_not_in_distress | Is_in_distress ); Is_in_distress: Send_distress_signal
[Identify_self_as_PID Receive_PID_Rescue_Instructions Remain_present_for_rescue];
ROOT Physical_Environment: ( + Provide_environmental_conditions + ); Provide_environmental_conditions: [ OSC_assesses_environmental_conditions ]
[ OSC_scans_for_signs_of_PID ] (* Provide_object_of_interest

66
( Indicate_not_related_to_SAR | Indicate_wreckage |
Identify_self_as_PID ) *); ROOT SAR_Assets: ( Perform_SAR_Assets_normal_operations | Participate_in_SAR_mission ); Participate_in_SAR_mission: Proceed_to_mission_area
Confirm_receipt_of_mission_information Confirm_search_plan_and_responsibilities ( + SAR_Assets_scan_for_signs_of_PID + ) ( Mission_Complete );
SAR_Assets_scan_for_signs_of_PID:
( Spot_object_of_interest Assess_object_of_interest | Keep_scanning );
Assess_object_of_interest:
( ID_object_as_not_SAR_related Provide_updates_to_OSC| ID_object_as_wreckage Provide_updates_to_OSC | ID_object_as_PID );
ID_object_as_PID: Notify_OSC_of_PID_location_and_situation
Maneuver_to_rescue_PID;
Mission_Complete: Receive_Mission_FINEX_Notice Return_to_Base;
/* Interactions */ COORDINATE $a: Send_distress_signal FROM PID,
$b: Receive_distress_signal FROM Command_and_Control DO ADD $a PRECEDES $b; OD;
COORDINATE $a: Pass_mission_information FROM Command_and_Control,
$b: Receive_mission_information FROM On_Scene_Commander

67
DO ADD $a PRECEDES $b; OD; COORDINATE $a: Relay_mission_information FROM On_Scene_Commander,
$b: Proceed_to_mission_area FROM SAR_Assets DO ADD $a PRECEDES $b; OD;
COORDINATE $a: Confirm_receipt_of_mission_information FROM SAR_Assets,
$b: Attempt_contact_with_PID FROM On_Scene_Commander DO ADD $a PRECEDES $b; OD;
On_Scene_Commander, Physical_Environment SHARE ALL OSC_assesses_environmental_conditions; COORDINATE $a: Provide_search_plan FROM On_Scene_Commander,
$b: Acknowledge_search_plan FROM Command_and_Control DO ADD $a PRECEDES $b; OD;
COORDINATE $a: Acknowledge_search_plan FROM Command_and_Control,
$b: Communicate_search_plan_and_responsibilities FROM On_Scene_Commander DO ADD $a PRECEDES $b; OD;
COORDINATE $a: Communicate_search_plan_and_responsibilities FROM On_Scene_Commander,
$b: Confirm_search_plan_and_responsibilities FROM SAR_Assets DO ADD $a PRECEDES $b; OD;
On_Scene_Commander, Physical_Environment SHARE ALL OSC_scans_for_signs_of_PID; COORDINATE $a: Provide_object_of_interest FROM Physical_Environment,
$b: Spot_object_of_interest FROM SAR_Assets DO ADD $a PRECEDES $b; OD;
COORDINATE $a: Indicate_not_related_to_SAR FROM Physical_Environment,
$b: ID_object_as_not_SAR_related FROM SAR_Assets DO ADD $a PRECEDES $b; OD;
COORDINATE $a: Indicate_wreckage FROM Physical_Environment,
$b: ID_object_as_wreckage FROM SAR_Assets
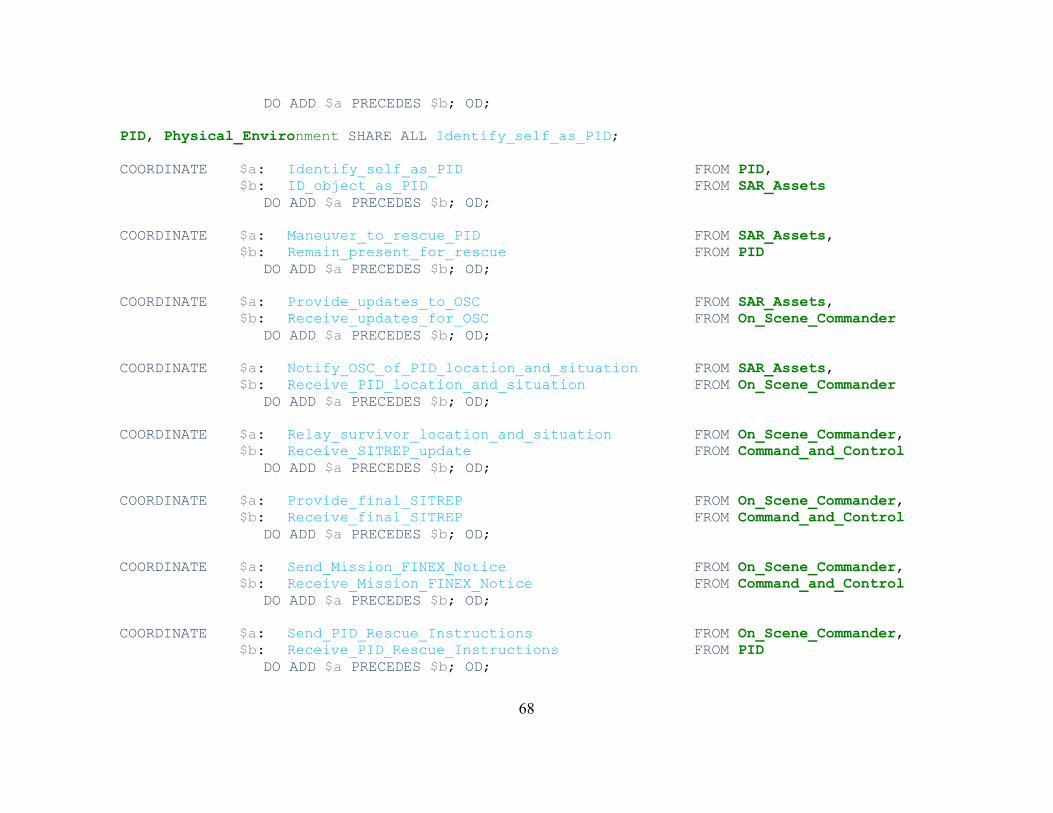
68
DO ADD $a PRECEDES $b; OD; PID, Physical_Environment SHARE ALL Identify_self_as_PID; COORDINATE $a: Identify_self_as_PID FROM PID,
$b: ID_object_as_PID FROM SAR_Assets DO ADD $a PRECEDES $b; OD;
COORDINATE $a: Maneuver_to_rescue_PID FROM SAR_Assets,
$b: Remain_present_for_rescue FROM PID DO ADD $a PRECEDES $b; OD;
COORDINATE $a: Provide_updates_to_OSC FROM SAR_Assets,
$b: Receive_updates_for_OSC FROM On_Scene_Commander DO ADD $a PRECEDES $b; OD;
COORDINATE $a: Notify_OSC_of_PID_location_and_situation FROM SAR_Assets,
$b: Receive_PID_location_and_situation FROM On_Scene_Commander DO ADD $a PRECEDES $b; OD;
COORDINATE $a: Relay_survivor_location_and_situation FROM On_Scene_Commander,
$b: Receive_SITREP_update FROM Command_and_Control DO ADD $a PRECEDES $b; OD;
COORDINATE $a: Provide_final_SITREP FROM On_Scene_Commander,
$b: Receive_final_SITREP FROM Command_and_Control DO ADD $a PRECEDES $b; OD;
COORDINATE $a: Send_Mission_FINEX_Notice FROM On_Scene_Commander,
$b: Receive_Mission_FINEX_Notice FROM Command_and_Control DO ADD $a PRECEDES $b; OD;
COORDINATE $a: Send_PID_Rescue_Instructions FROM On_Scene_Commander,
$b: Receive_PID_Rescue_Instructions FROM PID DO ADD $a PRECEDES $b; OD;

69
THIS PAGE INTENTIONALLY LEFT BLANK

70
APPENDIX C. INNOSLATE SIMULATION RESULTS
Run # UC.1 Helo UC.2 UAV UC.3 UUV UC.4 USV Near Med Far Near Med Far Near Med Far Near Med Far
1 2.557 3.662 5.420 2.522 2.254 5.979 3.053 6.353 27.688 3.060 5.020 18.366 2 2.403 2.596 6.353 2.072 2.687 6.147 3.778 7.371 29.839 3.215 5.962 18.217 3 2.293 2.830 5.019 1.956 2.307 7.038 3.209 6.876 28.919 3.462 5.658 17.631 4 2.229 2.628 4.896 2.125 3.635 6.506 3.026 7.089 30.300 3.454 4.729 18.956 5 2.156 2.668 5.217 1.919 2.865 6.479 2.808 7.007 28.283 3.154 4.911 17.916 6 2.131 2.293 5.187 2.471 2.893 6.325 3.648 6.254 28.743 3.454 4.939 18.591 7 2.734 2.764 5.758 2.025 2.556 6.857 3.790 7.043 29.168 2.784 5.076 19.160 8 2.616 2.904 6.262 2.694 2.829 6.001 2.972 7.541 30.058 3.026 3.888 18.253 9 2.397 2.439 5.512 1.951 2.870 6.855 2.522 6.794 27.198 3.100 4.611 18.505 10 2.579 2.503 5.440 2.429 2.300 6.723 3.325 7.059 28.963 2.888 4.586 17.801 11 2.631 2.524 5.162 2.274 2.797 5.975 3.444 5.727 27.821 2.958 4.764 19.399 12 2.875 2.813 5.899 2.383 2.758 6.409 3.045 7.148 29.310 2.955 5.349 18.818 13 2.684 2.392 6.174 2.636 2.529 6.046 3.737 6.982 27.975 3.044 4.958 18.569 14 3.427 2.279 5.707 2.496 2.504 6.455 3.040 6.765 30.330 3.116 5.326 18.515 15 2.413 2.757 5.629 1.896 3.447 6.294 3.871 6.957 29.491 3.056 4.800 19.101 16 2.518 3.269 5.809 2.112 2.574 6.271 4.984 6.347 30.293 3.103 5.064 18.451 17 2.668 2.822 5.433 3.033 3.218 6.120 3.210 6.929 29.208 3.003 5.457 18.622 18 2.784 2.756 5.786 1.964 2.566 7.202 2.814 6.576 28.946 3.299 4.894 18.858 19 2.449 2.851 5.390 2.230 2.470 6.814 3.499 6.174 28.376 3.182 4.696 19.185 20 2.220 2.479 5.208 2.195 3.173 6.156 3.924 6.179 28.766 2.956 4.192 18.415 21 2.418 2.997 5.333 2.447 2.881 6.198 4.431 6.041 28.024 3.247 4.191 19.316 22 2.583 2.793 4.827 1.856 2.888 7.639 3.896 6.075 28.782 3.130 5.214 19.345 23 2.097 3.513 5.638 2.350 2.340 5.983 3.089 7.139 28.129 2.972 4.325 18.347 24 2.657 3.166 5.384 1.753 2.479 6.699 3.574 6.623 28.956 5.997 5.569 18.568
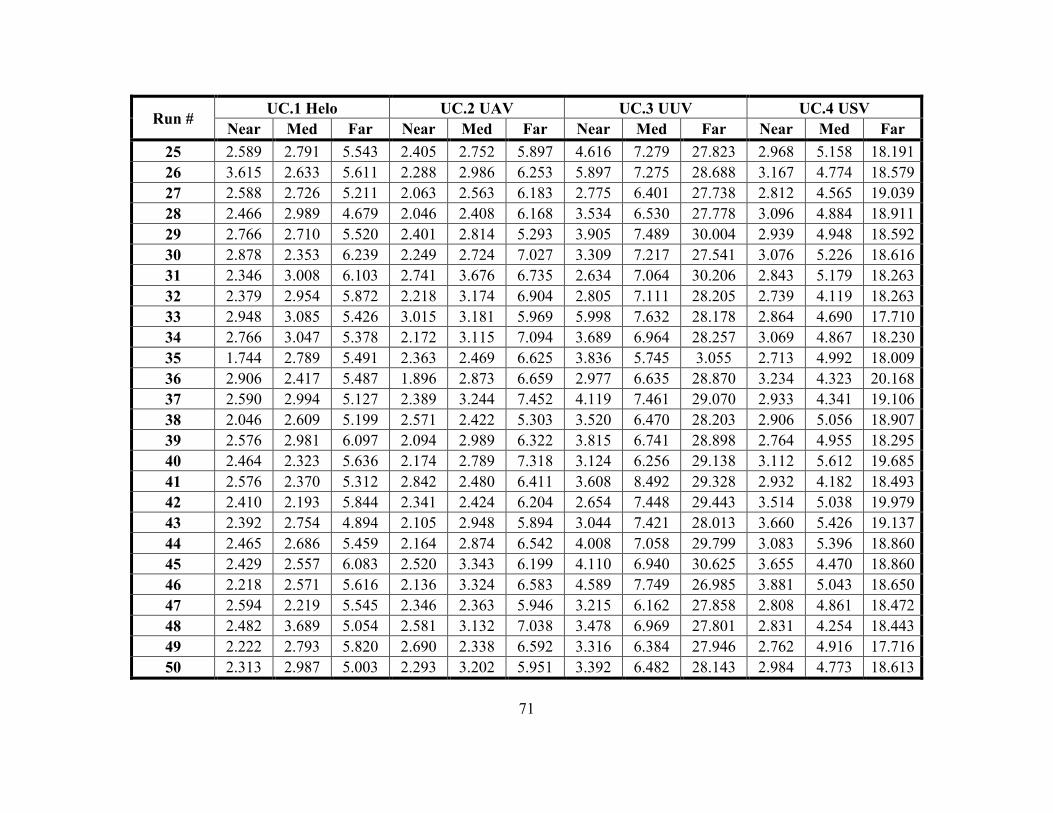
71
Run # UC.1 Helo UC.2 UAV UC.3 UUV UC.4 USV Near Med Far Near Med Far Near Med Far Near Med Far
25 2.589 2.791 5.543 2.405 2.752 5.897 4.616 7.279 27.823 2.968 5.158 18.191 26 3.615 2.633 5.611 2.288 2.986 6.253 5.897 7.275 28.688 3.167 4.774 18.579 27 2.588 2.726 5.211 2.063 2.563 6.183 2.775 6.401 27.738 2.812 4.565 19.039 28 2.466 2.989 4.679 2.046 2.408 6.168 3.534 6.530 27.778 3.096 4.884 18.911 29 2.766 2.710 5.520 2.401 2.814 5.293 3.905 7.489 30.004 2.939 4.948 18.592 30 2.878 2.353 6.239 2.249 2.724 7.027 3.309 7.217 27.541 3.076 5.226 18.616 31 2.346 3.008 6.103 2.741 3.676 6.735 2.634 7.064 30.206 2.843 5.179 18.263 32 2.379 2.954 5.872 2.218 3.174 6.904 2.805 7.111 28.205 2.739 4.119 18.263 33 2.948 3.085 5.426 3.015 3.181 5.969 5.998 7.632 28.178 2.864 4.690 17.710 34 2.766 3.047 5.378 2.172 3.115 7.094 3.689 6.964 28.257 3.069 4.867 18.230 35 1.744 2.789 5.491 2.363 2.469 6.625 3.836 5.745 3.055 2.713 4.992 18.009 36 2.906 2.417 5.487 1.896 2.873 6.659 2.977 6.635 28.870 3.234 4.323 20.168 37 2.590 2.994 5.127 2.389 3.244 7.452 4.119 7.461 29.070 2.933 4.341 19.106 38 2.046 2.609 5.199 2.571 2.422 5.303 3.520 6.470 28.203 2.906 5.056 18.907 39 2.576 2.981 6.097 2.094 2.989 6.322 3.815 6.741 28.898 2.764 4.955 18.295 40 2.464 2.323 5.636 2.174 2.789 7.318 3.124 6.256 29.138 3.112 5.612 19.685 41 2.576 2.370 5.312 2.842 2.480 6.411 3.608 8.492 29.328 2.932 4.182 18.493 42 2.410 2.193 5.844 2.341 2.424 6.204 2.654 7.448 29.443 3.514 5.038 19.979 43 2.392 2.754 4.894 2.105 2.948 5.894 3.044 7.421 28.013 3.660 5.426 19.137 44 2.465 2.686 5.459 2.164 2.874 6.542 4.008 7.058 29.799 3.083 5.396 18.860 45 2.429 2.557 6.083 2.520 3.343 6.199 4.110 6.940 30.625 3.655 4.470 18.860 46 2.218 2.571 5.616 2.136 3.324 6.583 4.589 7.749 26.985 3.881 5.043 18.650 47 2.594 2.219 5.545 2.346 2.363 5.946 3.215 6.162 27.858 2.808 4.861 18.472 48 2.482 3.689 5.054 2.581 3.132 7.038 3.478 6.969 27.801 2.831 4.254 18.443 49 2.222 2.793 5.820 2.690 2.338 6.592 3.316 6.384 27.946 2.762 4.916 17.716 50 2.313 2.987 5.003 2.293 3.202 5.951 3.392 6.482 28.143 2.984 4.773 18.613

72
Run # UC.1 Helo UC.2 UAV UC.3 UUV UC.4 USV Near Med Far Near Med Far Near Med Far Near Med Far
MEAN 2.526 2.758 5.514 2.309 2.808 6.435 3.573 6.848 28.223 3.139 4.885 18.654 STDDEV 0.315 0.337 0.394 0.292 0.362 0.494 0.729 0.548 3.740 0.484 0.442 0.542 STDDEV,
Min 18.887 20.229 23.632 17.519 21.731 29.647 43.734 32.877 224.412 29.034 26.515 32.548

73
APPENDIX D. MONTEREY PHOENIX MODEL INITIAL EVENT TRACES
Figure 27. Event Trace 1.
Figure 28. Event Trace 2.
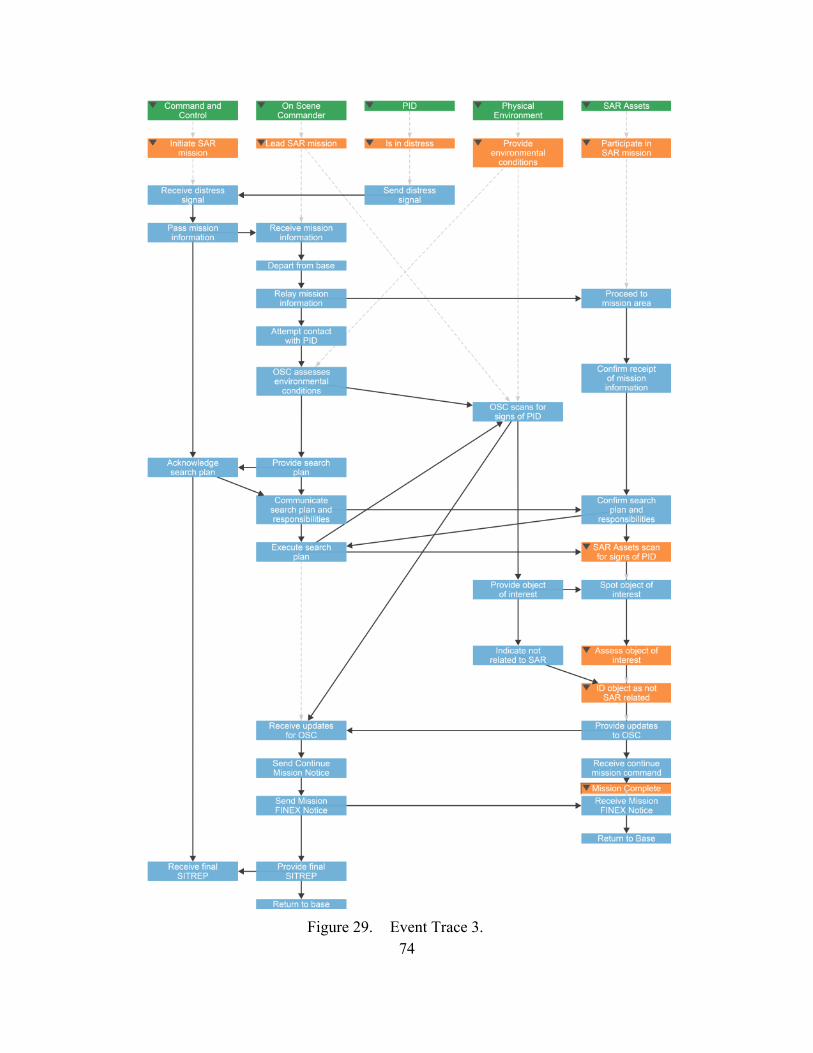
74
Figure 29. Event Trace 3.
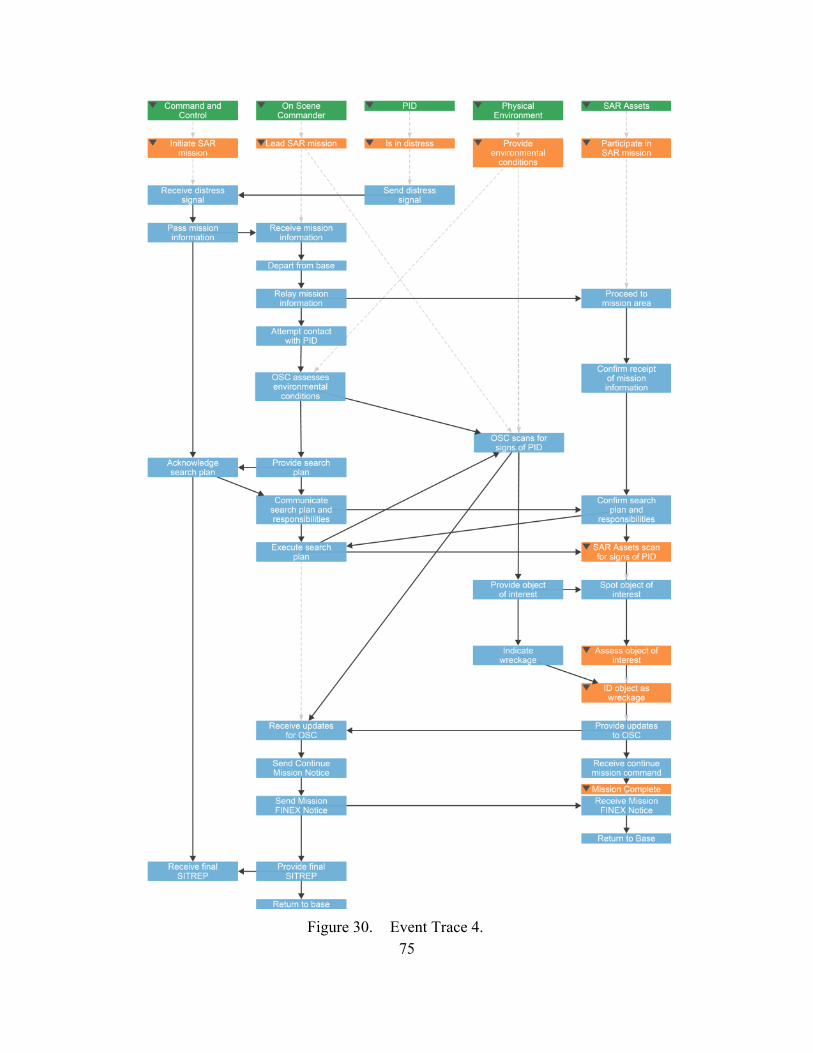
75
Figure 30. Event Trace 4.
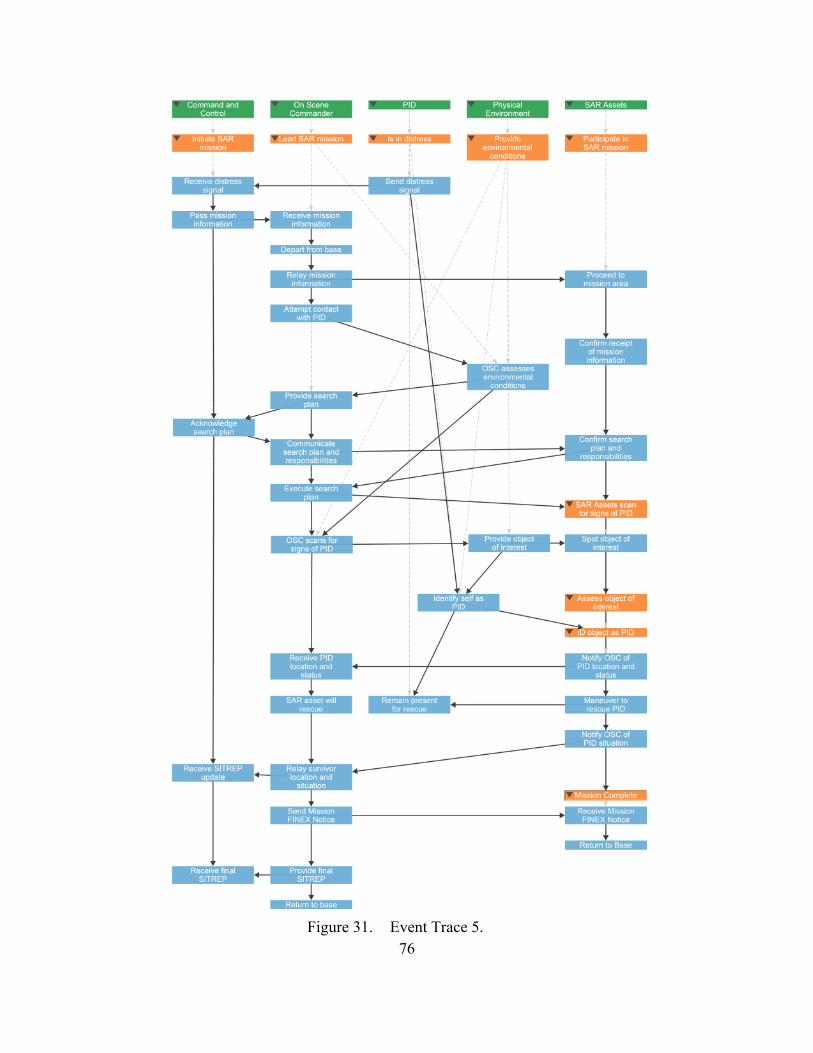
76
Figure 31. Event Trace 5.
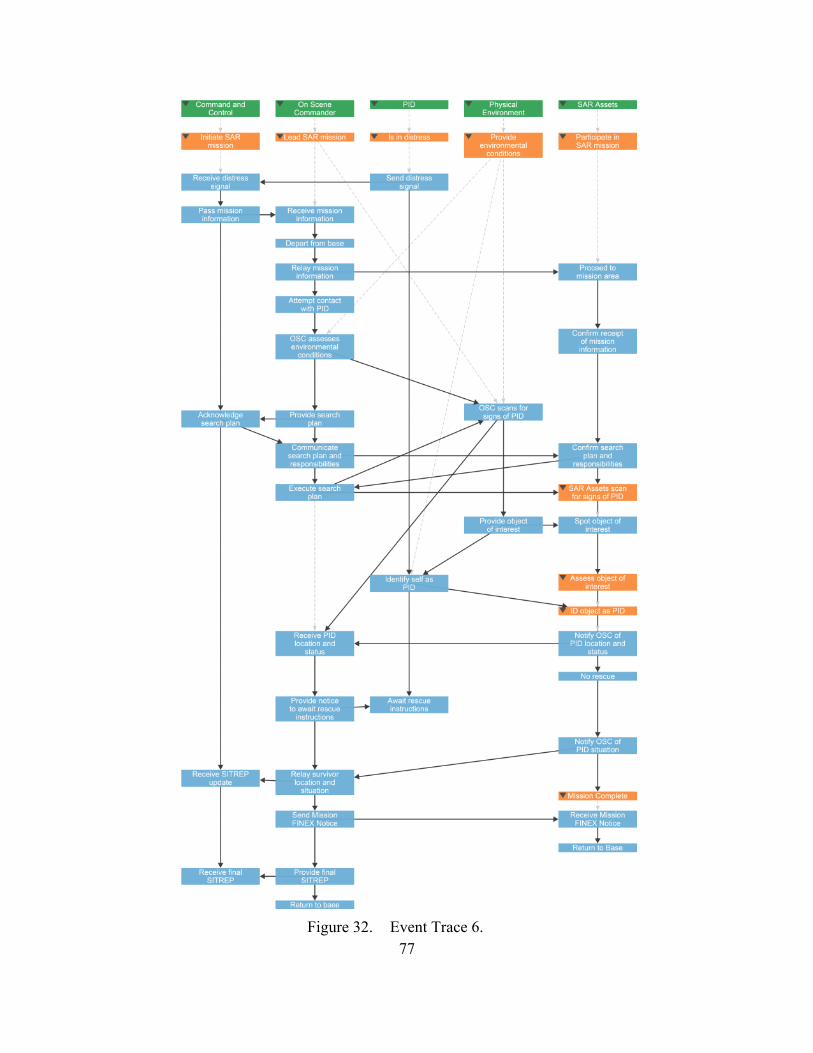
77
Figure 32. Event Trace 6.

78
THIS PAGE INTENTIONALLY LEFT BLANK

79
APPENDIX E. MONTEREY PHOENIX SAR SOS REVISED MODEL CODE WITH SEARCH LOOP IMPLEMENTED
SEE FOLLOWING PAGE

80
/* Actors */ SCHEMA WideRangeSearch ROOT Command_and_Control: ( Perform_C2_normal_operations |
Initiate_SAR_mission ); Initiate_SAR_mission: Receive_distress_signal
Pass_mission_information Acknowledge_search_plan [ Receive_SITREP_update ] Receive_final_SITREP;
ROOT On_Scene_Commander: ( Perform_OSC_normal_operations |
Lead_SAR_mission ); Lead_SAR_mission: Receive_mission_information
Depart_from_base Relay_mission_information Attempt_contact_with_PID OSC_assesses_environmental_conditions Provide_search_plan Communicate_search_plan_and_responsibilities Execute_search_plan OSC_scans_for_signs_of_PID (* Receive_updates_for_OSC Send_Continue_Mission_Notice *) [ Receive_PID_location_and_status
( SAR_asset_will_rescue | Provide_notice_to_await_rescue_instructions ) Relay_survivor_location_and_situation ]
Send_Mission_FINEX_Notice Provide_final_SITREP Return_to_base;
/* interactions */ COORDINATE $a: Pass_mission_information FROM Command_and_Control,

81
$b: Receive_mission_information FROM On_Scene_Commander DO ADD $a PRECEDES $b; OD;
COORDINATE $a: Provide_search_plan FROM On_Scene_Commander,
$b: Acknowledge_search_plan FROM Command_and_Control DO ADD $a PRECEDES $b; OD;
COORDINATE $a: Acknowledge_search_plan FROM Command_and_Control,
$b: Communicate_search_plan_and_responsibilities FROM On_Scene_Commander DO ADD $a PRECEDES $b; OD;
COORDINATE $a: Relay_survivor_location_and_situation FROM On_Scene_Commander,
$b: Receive_SITREP_update FROM Command_and_Control DO ADD $a PRECEDES $b; OD;
COORDINATE $a: Provide_final_SITREP FROM On_Scene_Commander,
$b: Receive_final_SITREP FROM Command_and_Control DO ADD $a PRECEDES $b; OD;
/*-------------------------------------------------------*/ ROOT PID: ( Is_not_in_distress |
Is_in_distress ); Is_in_distress: Send_distress_signal
[Identify_self_as_PID ( Remain_present_for_rescue | Await_rescue_instructions ) ] ;
/* interactions */ COORDINATE $a: Send_distress_signal FROM PID,
$b: Receive_distress_signal FROM Command_and_Control DO ADD $a PRECEDES $b; OD;
COORDINATE $a: Provide_notice_to_await_rescue_instructions FROM On_Scene_Commander,
$b: Await_rescue_instructions FROM PID

82
DO ADD $a PRECEDES $b; OD; /*--------------------------------------------------------*/ ROOT SAR_Assets: ( Perform_SAR_Assets_normal_operations |
Participate_in_SAR_mission ); Participate_in_SAR_mission: Confirm_receipt_of_mission_information
Depart_from_base Proceed_to_mission_area Confirm_search_plan_and_responsibilities SAR_Assets_scan_for_signs_of_PID Mission_Complete;
SAR_Assets_scan_for_signs_of_PID:
( * Keep_scanning [Spot_object_of_interest
Assess_object_of_interest ( ID_object_as_not_SAR_related | ID_object_as_wreckage ) Provide_updates_to_OSC Receive_continue_mission_command] *)
[ Spot_object_of_interest Assess_object_of_interest ID_object_as_PID ];
ID_object_as_PID: Notify_OSC_of_PID_location_and_status
( Maneuver_to_rescue_PID | No Rescue ) Notify_OSC_of_PID_situation;
Mission_Complete: Receive_Mission_FINEX_Notice
Return_to_Base; /* interactions */ COORDINATE $a: Relay_mission_information FROM On_Scene_Commander,
$b: Confirm_receipt_of_mission_information FROM SAR_Assets
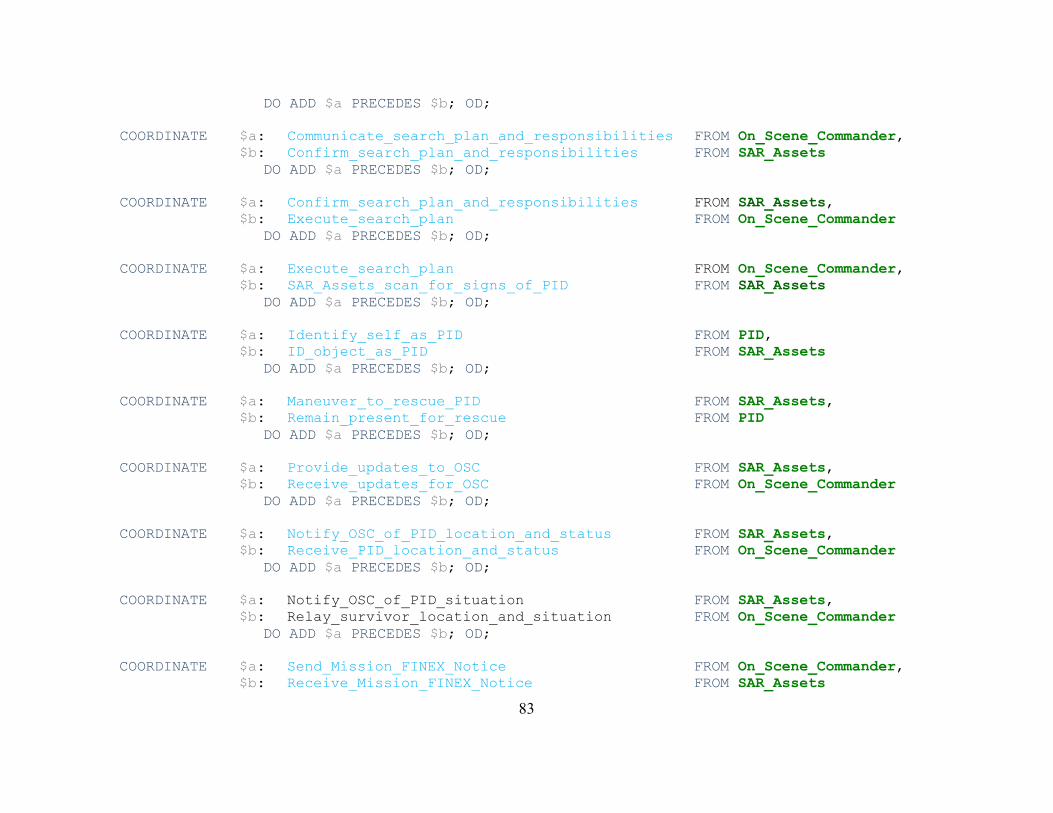
83
DO ADD $a PRECEDES $b; OD; COORDINATE $a: Communicate_search_plan_and_responsibilities FROM On_Scene_Commander,
$b: Confirm_search_plan_and_responsibilities FROM SAR_Assets DO ADD $a PRECEDES $b; OD;
COORDINATE $a: Confirm_search_plan_and_responsibilities FROM SAR_Assets,
$b: Execute_search_plan FROM On_Scene_Commander DO ADD $a PRECEDES $b; OD;
COORDINATE $a: Execute_search_plan FROM On_Scene_Commander,
$b: SAR_Assets_scan_for_signs_of_PID FROM SAR_Assets DO ADD $a PRECEDES $b; OD;
COORDINATE $a: Identify_self_as_PID FROM PID,
$b: ID_object_as_PID FROM SAR_Assets DO ADD $a PRECEDES $b; OD;
COORDINATE $a: Maneuver_to_rescue_PID FROM SAR_Assets,
$b: Remain_present_for_rescue FROM PID DO ADD $a PRECEDES $b; OD;
COORDINATE $a: Provide_updates_to_OSC FROM SAR_Assets,
$b: Receive_updates_for_OSC FROM On_Scene_Commander DO ADD $a PRECEDES $b; OD;
COORDINATE $a: Notify_OSC_of_PID_location_and_status FROM SAR_Assets,
$b: Receive_PID_location_and_status FROM On_Scene_Commander DO ADD $a PRECEDES $b; OD;
COORDINATE $a: Notify_OSC_of_PID_situation FROM SAR_Assets,
$b: Relay_survivor_location_and_situation FROM On_Scene_Commander DO ADD $a PRECEDES $b; OD;
COORDINATE $a: Send_Mission_FINEX_Notice FROM On_Scene_Commander,
$b: Receive_Mission_FINEX_Notice FROM SAR_Assets

84
DO ADD $a PRECEDES $b; OD; /*---------------------------------------------------------------*/ ROOT Physical_Environment: ( * Provide_environmental_conditions * ); Provide_environmental_conditions: OSC_assesses_environmental_conditions
OSC_scans_for_signs_of_PID (* Provide_object_of_interest
( Indicate_not_related_to_SAR | Indicate_wreckage |
Identify_self_as_PID ) *); /* Interactions */ On_Scene_Commander, Physical_Environment SHARE ALL OSC_scans_for_signs_of_PID; COORDINATE $a: Provide_object_of_interest FROM Physical_Environment,
$b: Spot_object_of_interest FROM SAR_Assets DO ADD $a PRECEDES $b; OD;
COORDINATE $a: Indicate_not_related_to_SAR FROM Physical_Environment,
$b: ID_object_as_not_SAR_related FROM SAR_Assets DO ADD $a PRECEDES $b; OD;
COORDINATE $a: Indicate_wreckage FROM Physical_Environment,
$b: ID_object_as_wreckage FROM SAR_Assets DO ADD $a PRECEDES $b; OD;
PID, Physical_Environment SHARE ALL Identify_self_as_PID; On_Scene_Commander, Physical_Environment SHARE ALL OSC_assesses_environmental_conditions;
85
APPENDIX F. MONTEREY PHOENIX SAR SOS MODEL CODE WITH SEARCH LOOP AND SAR_ASSETS SET IMPLEMENTED
SEE FOLLOWING PAGE

86
/* Actors */ SCHEMA WideRangeSearch ROOT Command_and_Control: ( Perform_C2_normal_operations | Initiate_SAR_mission ); Initiate_SAR_mission: Receive_distress_signal
Pass_mission_information Acknowledge_search_plan [ Receive_SITREP_update ] Receive_final_SITREP;
ROOT On_Scene_Commander: ( Perform_OSC_normal_operations | Lead_SAR_mission ); Lead_SAR_mission: Receive_mission_information
Depart_from_base Relay_mission_information Attempt_contact_with_PID OSC_assesses_environmental_conditions Provide_search_plan Communicate_search_plan_and_responsibilities Execute_search_plan OSC_scans_for_signs_of_PID (* Receive_updates_for_OSC Send_Continue_Mission_Notice *) [ Receive_PID_location_and_status
( SAR_asset_will_rescue | Provide_notice_to_await_rescue_instructions ) Relay_survivor_location_and_situation ]
Send_Mission_FINEX_Notice Provide_final_SITREP Return_to_base;
/* interactions */ COORDINATE $a: Pass_mission_information FROM Command_and_Control,
$b: Receive_mission_information FROM On_Scene_Commander DO ADD $a PRECEDES $b; OD;
COORDINATE $a: Provide_search_plan FROM On_Scene_Commander,

87
$b: Acknowledge_search_plan FROM Command_and_Control DO ADD $a PRECEDES $b; OD;
COORDINATE $a: Acknowledge_search_plan FROM Command_and_Control,
$b: Communicate_search_plan_and_responsibilities FROM On_Scene_Commander DO ADD $a PRECEDES $b; OD;
COORDINATE $a: Relay_survivor_location_and_situation FROM On_Scene_Commander,
$b: Receive_SITREP_update FROM Command_and_Control DO ADD $a PRECEDES $b; OD;
COORDINATE $a: Provide_final_SITREP FROM On_Scene_Commander,
$b: Receive_final_SITREP FROM Command_and_Control DO ADD $a PRECEDES $b; OD;
/*-------------------------------------------------------*/ ROOT PID: ( Is_not_in_distress | Is_in_distress ); Is_in_distress: Send_distress_signal
[Identify_self_as_PID ( Remain_present_for_rescue | Await_rescue_instructions ) ] ;
/* interactions */ COORDINATE $a: Send_distress_signal FROM PID,
$b: Receive_distress_signal FROM Command_and_Control DO ADD $a PRECEDES $b; OD;
COORDINATE $a: Provide_notice_to_await_rescue_instructions FROM On_Scene_Commander,
$b: Await_rescue_instructions FROM PID DO ADD $a PRECEDES $b; OD;
/*--------------------------------------------------------*/ ROOT SAR_Assets: { + <1..2> SAR_Asset +}; SAR_Asset: ( Perform_SAR_Assets_normal_operations | Participate_in_SAR_mission );

88
Participate_in_SAR_mission: Confirm_receipt_of_mission_information Depart_from_base Proceed_to_mission_area Confirm_search_plan_and_responsibilities SAR_Assets_scan_for_signs_of_PID Mission_Complete;
SAR_Assets_scan_for_signs_of_PID:
( * Keep_scanning [Spot_object_of_interest
Assess_object_of_interest ( ID_object_as_not_SAR_related | ID_object_as_wreckage ) Provide_updates_to_OSC Receive_continue_mission_command] *)
[ Spot_object_of_interest Assess_object_of_interest ID_object_as_PID ];
ID_object_as_PID: Notify_OSC_of_PID_location_and_status
( Maneuver_to_rescue_PID | No Rescue ) Notify_OSC_of_PID_situation;
Mission_Complete: Receive_Mission_FINEX_Notice
Return_to_Base; /* interactions */ COORDINATE <!> $a: SAR_Asset FROM SAR_Assets
DO COORDINATE $p: Relay_mission_information FROM On_Scene_Commander,
$b: Confirm_receipt_of_mission_information FROM $a DO ADD $p PRECEDES $b; OD; OD;
COORDINATE <!> $a: SAR_Asset FROM SAR_Assets
DO COORDINATE $p: Communicate_search_plan_and_responsibilities FROM On_Scene_Commander,

89
$b: Confirm_search_plan_and_responsibilities FROM $a DO ADD $p PRECEDES $b; OD; OD;
COORDINATE <!> $a: SAR_Asset FROM SAR_Assets
DO COORDINATE $p: Confirm_search_plan_and_responsibilities FROM $a, $b: Execute_search_plan FROM On_Scene_Commander
DO ADD $p PRECEDES $b; OD; OD;
COORDINATE <!> $a: SAR_Asset FROM SAR_Assets
DO COORDINATE $p: Execute_search_plan FROM On_Scene_Commander,
$b: SAR_Assets_scan_for_signs_of_PID FROM $a DO ADD $p PRECEDES $b; OD; OD;
COORDINATE <!> $a: SAR_Asset FROM SAR_Assets
DO COORDINATE <!> $p: Identify_self_as_PID FROM PID, $b: ID_object_as_PID FROM $a
DO ADD $p PRECEDES $b; OD; COORDINATE <!> $a: SAR_Asset FROM SAR_Assets
DO COORDINATE <!> $p: Maneuver_to_rescue_PID FROM $a, $b: Remain_present_for_rescue FROM PID
DO ADD $p PRECEDES $b; OD; OD;
COORDINATE <!> $a: SAR_Asset FROM SAR_Assets
DO COORDINATE $p: Provide_updates_to_OSC FROM $a, $b: Receive_updates_for_OSC FROM On_Scene_Commander
DO ADD $p PRECEDES $b; OD; OD;

90
COORDINATE <!> $a: SAR_Asset FROM SAR_Assets DO COORDINATE <!> $p: Notify_OSC_of_PID_location_and_status FROM $a,
$b: Receive_PID_location_and_status FROM On_Scene_Commander
DO ADD $p PRECEDES $b; OD; OD;
COORDINATE <!> $a: SAR_Asset FROM SAR_Assets
DO COORDINATE <!> $p: Notify_OSC_of_PID_situation FROM $a, $b: Relay_survivor_location_and_situation FROM On_Scene_Commander
DO ADD $p PRECEDES $b; OD; OD;
COORDINATE <!> $a: SAR_Asset FROM SAR_Assets
DO COORDINATE $p: Send_Mission_FINEX_Notice FROM On_Scene_Commander,
$b: Receive_Mission_FINEX_Notice FROM SAR_Assets DO ADD $p PRECEDES $b; OD; OD;
/*---------------------------------------------------------------*/ ROOT Physical_Environment: ( * Provide_environmental_conditions * ); Provide_environmental_conditions: OSC_assesses_environmental_conditions
OSC_scans_for_signs_of_PID (* Provide_object_of_interest
( Indicate_not_related_to_SAR | Indicate_wreckage |
Identify_self_as_PID ) *); /* Interactions */ On_Scene_Commander, Physical_Environment SHARE ALL OSC_scans_for_signs_of_PID; COORDINATE <!> $a: SAR_Asset FROM SAR_Assets

91
DO COORDINATE <!> $p: Provide_object_of_interest FROM Physical_Environment,
$b: Spot_object_of_interest FROM $a DO ADD $p PRECEDES $b; OD; OD;
COORDINATE <!> $a: SAR_Asset FROM SAR_Assets
DO COORDINATE <!> $p: Indicate_not_related_to_SAR FROM Physical_Environment,
$b: ID_object_as_not_SAR_related FROM $a DO ADD $p PRECEDES $b; OD; OD;
COORDINATE <!> $a: SAR_Asset FROM SAR_Assets
DO COORDINATE <!> $p: Indicate_wreckage FROM Physical_Environment,
$b: ID_object_as_wreckage FROM $a DO ADD $p PRECEDES $b; OD; OD;
PID, Physical_Environment SHARE ALL Identify_self_as_PID; On_Scene_Commander, Physical_Environment SHARE ALL OSC_assesses_environmental_conditions;

92
THIS PAGE INTENTIONALLY LEFT BLANK

93
LIST OF REFERENCES
5G International Inc. n.d. “2015 Model Line Up of Robotic Unmanned Surface Vessels (USVs).” Accessed 01 July 2015. http://www.5gmarine.com/unmanned-surface-vessels-usvs/.
Acheson, Paulette, Cihan Dagli, and Nik Kilicay-Ergin. 2013. “Model Based Systems Engineering for System of Systems Using Agent-based Modeling.” Procedia Computer Science 16, Conference on Systems Engineering Research (CSER’13). edited by Christian J.J. Paredis, Carlee Bishop, and Doublas Bodner, 11–19, March 19–22. Atlanta, GA: Elsevier B.V. https://dx.doi.org/doi:10.1016/j.procs.2013.01.002.
Auguston, Mikhail. 2014. Behavior Models for Software Architecture (NPS-CS-14-003). Monterey, CA: Naval Postgraduate School. http://hdl.handle.net/10945/43851.
Baker, Loyd, Paul Clemente, Bob Cohen, Larry Permenter, Byron Purves, and Pete Salmon. 1996. “Model Driven System Design Working Group: Foundational Concepts for Model Driven System Design.” INCOSE International Symposium Vol. 6, 1179–1185. http://dx.doi.org/10.1002/j.2334-5837.1996.tb02139.x
Buede, Dennis. M. 2009. The Engineering Design of Systems: Models and Methods. 2nd ed. Hoboken, NJ: John Wiley & Sons.
Commander, Naval Air Systems Command. 2012. “MH-60S Seahawk.” NAVAIR Aircraft and Weapons. http://www.navair.navy.mil/index.cfm?fuseaction=home.displayPlatform&key=A1C74EA2-3917-416B-81C6-9CEB537C0594.
Commander, Naval Air Systems Command. N. n.d. “MQ-8 Fire Scout.” NAVAIR Aircraft and Weapons. Accessed 01 July 2015. http://www.navair.navy.mil/index.cfm?fuseaction=home.display&key=8250AFBA-DF2B-4999-9EF3-0B0E46144D03.
Contag, George, Kristin Giammarco, Spencer Hunt, C. Johnston, K. Laing, K. Mastran, J. Pabon, N. Quijano, E. Rosenberg, M. Stevens, K. Tomasino, J. Tonello and Clifford Whitcomb. 2015. “A Lab Manual for Systems Architecting and Analysis.” Chapter 1 and Chapter 2. Naval Postgraduate School, Department of Systems Engineering. https://wiki.nps.edu/pages/viewpage.action?pageId=437387266, https://wiki.nps.edu/pages/viewpage.action?pageId=437387276.
Dam, Steven H. 2015. “Decision Points in Model-Based Systems Engineering (MBSE) Analyses” (SPEC Innovations Whitepaper). Manassas, VA: SPEC Innovations. http://www.specinnovations.com/resources/decision-points-in-mbse-analyses.

94
Friedenthal, Sanford, Mark Sampson. 2015. “Model-based Systems Engineering (MBSE) Initiative Overview.” INCOSE. Accessed 12 July 2015. http://www.omgwiki.org/MBSE/lib/exe/fetch.php?media=wiki:mbse_initiative_overview-111209.pptx.
Hunt, Spencer S. 2015. “Model-Based Systems Engineering in the Execution of Search and Rescue Operations.” Master’s thesis, Naval Postgraduate School.
INCOSE Technical Operations. 2007. Systems Engineering Vision 2020, version 2.03 (INCOSE-TP-2004-004-02). Seattle, WA: International Council on Systems Engineering, Seattle.http://oldsite.incose.org/ProductsPubs/pdf/SEVision2020_20071003_v2_03.pdf.
Giammarco, Kristin M. 2014a. SE4150 System Architecture and Design Lab Manual. Monterey, CA. Naval Postgraduate School.
———. 2014b. “A formal method for assessing architecture model and design maturity using domain-independent patterns.” Procedia Computer Science 28, Conference on Systems Engineering Research (CSER 2014). Edited by Azad M. Madni, Barry Boehm, Michael Sievers, and Marlee Wheaton, 555–564, March 21–22. Redondo Beach, CA: Elsevier B.V.
———. 2015a. “A Lab Manual for Systems Architecting and Analysis.” Naval Postgraduate School, Department of Systems Engineering. https://wiki.nps.edu/display/MP/Lab+Manual
———. 2015b. “A Lab Manual for Systems Architecting and Analysis.” Chapter 4. Naval Postgraduate School, Department of Systems Engineering. https://wiki.nps.edu/display/MP/Chapter+4%3A+Creating+Abstract+Functional+Views+of+the+Architecture.
———. 2015b. “Systems Architecting with Model Based Systems Engineering (MBSE) Automation.” Lecture, Engineering Management and Systems Engineering Graduate Seminar, Missouri University of Science and Technology, 22 April 2015. http://msmovie.mst.edu/public/misc/EMSE/Spring_2015/EMSE_Grad_Seminar_042215-Giammarco.wmv
Giammarco, Kristin M. and Mikhail Auguston. 2013. “Well, you didn’t say not to! A Formal Systems Engineering Approach to Teaching an Unruly Architecture Good Behavior.” Procedia Computer Science 20, Complex Adaptive Systems, Publication 3. edited by Cihan H. Dagli, 277–282. Baltimore, MD: Elsevier B.V. http://dx.doi.org/doi:10.1016/j.procs.2013.09.273.
Giammarco, Kristin M., Monica Farah-Stapleton, and Mikhail Auguston. 2014. “Behavioral Modeling of System Architectures.” Lecture, INCOSE System of

95
Systems Working Group Webinar, 17 January 2014. https://wiki.nps.edu/display/MP/MP+Presentation.
Giammarco, Kristin, Clifford Whitcomb, Spencer Hunt. 2015. An Instructional Design Reference Mission for Search and Rescue Operations. Naval Postgraduate School, Department of Systems Engineering. Monterey, CA.
Kable. 2015. “Fleet-Class Common Unmanned Surface Vessel (CUSV), United States of America.” naval-technology.com. http://www.naval-technology.com/projects/fleet-class-common-unmanned-surface-vessel-cusv/.
Kongsberg. 2015, “REMUS AUVs: 100, 600, 6000.” Hydroid, Inc. http://www.km.kongsberg.com/ks/web/nokbg0397.nsf/AllWeb/82C0D4915CE64FEAC1257A23002BECC5/$file/REMUS-brochure.pdf?OpenElement.
Kustere. 2006. “Functional Flow Block Diagram (FFBD).” Graffletopia LLC. 2015. https://assets.graffletopia.com/production/canvases/146/1983/1400528269/original.png?1400528269.
Lavagno, Luciano, Grant Martin, Bran Selic. 2003. UML for Real: Design of Embedded Real-Time Systems. Dordrecht, Netherlands: Kluwer Academic Publishers. http://site.ebrary.com.libproxy.nps.edu/lib/nps/reader.action?ppg=5&docID=10069615&tm=1437511359486.
Murray, Julia. 2012. Model Based Systems Engineering (MBSE) Media Study. http://www.syse.pdx.edu/program/portfolios/julia/MBSE.pdf.
Northrup Grumman Corporation. 2015. “Fire Scout.” http://www.northropgrumman.com/Capabilities/FireScout/PublishingImages/pageImages/ai_Fire_Scout2.jpg, http://www.northropgrumman.com/Photos/pgS_MQ-10027_001.jpg.
naval-technology.com. 2015. “Fleet-Class Common Unmanned Surface Vessel (CUSV), United States of America.” Kable. http://www.naval-technology.com/projects/fleet-class-common-unmanned-surface-vessel-cusv/.
Object Management Group. 2015a. “OMG Model Driven Architecture.” Object Management Group, Inc. http://www.omg.org/mda/.
———. 2015b. “Introduction To OMG’s Unified Modeling Language® (UML®).” Object Management Group, Inc. http://www.omg.org/gettingstarted/what_is_uml.htm.
———. 2015c. “OMG Systems Modeling Language.” Object Management Group, Inc. http://www.omgsysml.org.

96
Orgren, Igmar. 2000. “On Prinicples for Model-Based Systems Engineering.” System Engineering 3, no. 1 (2000): 38–49. http://dx.doi.org/10.1002/(SICI)1520-6858(2000)3:1<38::AID-SYS3>3.0.CO;2-B.
Paulo, Eugene. 2015. “Modeling and Simulation (M&S) Overview: Important Terms and Concepts, DOD M&S Governance.” Lecture, SE4930 Model-Based Systems Engineering, Naval Postgraduate School, 17 July 2015. https://cle.nps.edu/xsl-portal/site/31ea0541-378a-4bf1-a44b-c005c43bb2b8/page/c7ff2e49-30f9-4205-a666-ff1e0601836e.
Ramos, Anna L., Jose V. Ferreira, and Jaume Barceló. 2011. “Model-Based Systems Engineering: An Emerging Approach for Modern Systems.” IEEE Transactions on Systems, Man, and Cybernetics, Part C: Applications and Reviews 42, no.1 (January 2012): 101–111. http://dx.doi.org/10.1109/TSMCC.2011.2106495.
Sikorski Aircraft Corporation. “MH-60S.” 2012. Lockheed Martin. http://www.mh-60.com/mh-60s/, http://www.mh-60.com/wp-content/gallery/mh-60s/368867.jpg, http://www.mh-60.com/wp-content/gallery/mh-60s/130418-n-gc639-354.jpg.
Spec Innovations. 2015. Innoslate. Accessed 14 July 2015. https://www.innoslate.com/.
United States, 2007. National Search and Rescue Plan of the United States. United Sates Coast Guard Office of Search and Rescue (CG-SAR). 2015. http://www.uscg.mil/hq/cg5/cg534/manuals/Natl_SAR_Plan(2007).pdf.
Vaneman, Warren K. and Roger D. Jaskot. 2013. “A Criteria-Based Framework for Establishing System of Systems Governance.” Proceedings of the 7th Annual Systems Conference (SysCon), IEEE International: Orlando, FL (April): 491 - 496. http://dx.doi.org/10.1109/SysCon.2013.6549927.
Virginia Tech. 2011. “High Speed AUV.” Autonomous Systems and Controls Laboratory, Virginia Tech Department of Electrical and Computer Engineering. http://www.ascl.ece.vt.edu/HSAUV.html.
White, Stephanie, Mack Alford, Brian McCay, David Oliver, Colin Tully, Julian Holtzman, C. Stephen Kuehl, David Owens and Allan Willey. 1992. “Trends in Computer-Based Systems Engineering.” Proceedings of the IEEE 1992 International Conference on Computer Design: VLSI in Computers and Processors, IEEE International: Orlando, FL (October): 12–15. http://dx.doi.org/10.1109/ICCD.1992.276215.

97
INITIAL DISTRIBUTION LIST
1. Defense Technical Information Center Ft. Belvoir, Virginia 2. Dudley Knox Library Naval Postgraduate School Monterey, California