Embed Size (px)
Citation preview

8/9/2019 nature12909(1)
http://slidepdf.com/reader/full/nature129091 1/16
LETTER doi:10.1038/nature12909
A metal-free organic––inorganic aqueous flow battery Brian Huskinson1*, Michael P. Marshak1,2*, Changwon Suh2, Suleyman Er2,3, Michael R. Gerhardt1, Cooper J. Galvin2,
Xudong Chen2
, Alan Aspuru-Guzik2
, Roy G. Gordon1,2
& Michael J. Aziz1
As the fraction of electricity generation from intermittent renew-ablesources—such as solar or wind—grows,the abilityto store largeamountsof electrical energy is of increasing importance. Solid-electrodebatteries maintain discharge at peak power for far too short a time tofully regulate wind or solar power output1,2. In contrast,flowbatteriescan independentlyscale thepower (electrodearea) andenergy (arbit-rarily large storagevolume) components of the system by maintaining all of the electro-active species in fluid form3–5. Wide-scale utiliza-tion of flow batteries is,however, limited by theabundance and costof these materials, particularly those using redox-active metals andprecious-metal electrocatalysts6,7. Here we describea class of energy
storage materials that exploits the favourable chemical and electro-chemical properties of a family of molecules known as quinones.Theexample we demonstrate is a metal-free flow battery based on theredox chemistry of 9,10-anthraquinone-2,7-disulphonic acid (AQDS).AQDS undergoes extremely rapid and reversible two-electron two-protonreduction on a glassycarbon electrode in sulphuric acid. Anaqueous flow battery with inexpensive carbon electrodes, combin-ing the quinone/hydroquinone couple with the Br 2/Br 2 redox cou-ple, yields a peak galvanic power density exceeding 0.6 W cm22 at1.3Acm22. Cycling of this quinone–bromide flow battery showed.99 percent storage capacity retentionper cycle.The organic anthra-quinone species can be synthesized from inexpensive commodity chemicals8. Thisorganicapproach permits tuning of importantprop-erties such as the reduction potential and solubility by adding func-
tional groups: forexample,we demonstrate that theaddition of twohydroxy groups to AQDS increases the open circuit potential of thecell by 11% and we describe a pathway for further increases in cell
voltage.The use of p-aromaticredox-active organic moleculesinsteadof redox-active metals represents a new and promising direction for realizing massive electrical energy storage at greatly reduced cost.
Solutions of AQDS in sulphuric acid (negative side) and Br2 in HBr(positiveside)were pumpedthrougha flow cell as shown schematically in Fig. 1a. The quinone–bromide flow battery (QBFB) was constructedusing a Nafion 212 membrane sandwiched between Toray carbon paperelectrodes (six stacked on each side) with no catalysts; it is similar to acell described elsewhere (seefigure2 in ref. 7). We report the potential–current response (Fig. 1b)and the potential–power relationship (Fig. 1cand d) for various states of charge (SOCs; measured with respect to
the quinone side of the cell). As the SOC increased from 10% to 90%,the open-circuit potential increased linearly from 0.69 V to 0.92 V. Inthe galvanic direction, peak power densities were 0.246 W cm22 and0.600W cm22 at these same SOCs, respectively (Fig. 1c). To avoidsignificant water splitting in the electrolytic direction, we used a cut-off voltage of 1.5 V, at which point the current densities observedat10%and90%SOCswere22.25Acm22 and20.95Acm22, respect-ively, with corresponding power densities of 23.342Wcm22 and21.414Wcm22.
In Fig. 2 wereportthe results ofinitialcyclingstudies for this battery,to test for consistent performance over longer timescales. Figure 2ashows cycling data at 60.2Acm22 using 50% of the total capacity of
the battery. Thecycles are highlyreproducible and indicate thatcurrentefficiencies for the battery are around 95%. Figure 2b shows constant-currentcycling data, collectedat60.5Acm22, using voltagecut-offs of 0 V and 1.5 V. These tests were done using the identical solutions usedin the battery for Fig. 1b–d. The galvanic discharge capacity retention(that is, the number of coulombs extracted in one cycle divided by thenumber of coulombs extracted in the previous cycle) is above 99%,indicating the battery is capable of operating with minimal capacity fade and suggesting that current efficiencies are actually closer to 99%.Full characterization of the current efficiency will require slower cyc-ling experiments and chemical characterization of the electrolyte solu-
tions after extended cycling.To gain a better understanding of the quinone half-reaction on
carbon, AQDS was subjected to half-cell electrochemical measure-ments. Cyclic voltammetry ofa 1 mMsolution ofAQDSin 1 M sulphuricacidon a glassycarbon disk working electrodeshowscurrent peaks cor-respondingto reduction and oxidation of the anthraquinone species9–11
(Fig. 3d, solid trace). Thepeak separationof 34 mV is close to thevalueof 59 mV/n, where n is the number of electrons involved, expected fora two-electron process. Rotation of this disk at a variety of rates yieldsmass-transport-limited currents (Fig. 3a) from which the AQDS dif-fusion coefficient (D53.8(1)31026cm2 s21) canbedetermined; through-
out this paper, the numbers reported in parentheses indicate thestandard deviation in the last reported digit. Koutecky ´–Levich analysisat low overpotentials (Fig. 3b) can be extrapolated to infinite rotation
rateand fittedto theButler–Volmer equation (Extended Data Fig.3a) togive thekineticreduction rate constantk057.2(5)31023 cm s21.Thisrate constant is greater than that found for other species used in flow batteries such as V31/V21, Br2/Br2 andS4
22/S222 (seetable2 inref. 3).
It implies that thevoltage loss dueto the rate of surface electrochemicalreactions is negligible. The high rate is apparently due to an outer-sphere two-electron reduction into the aromatic p system requiring little reorganizational energy. The electrochemical reversibility of thetwo-electron redox reaction was confirmed by fitting the slope to theButler–Volmer equation (Extended Data Fig. 3a), giving the transfercoefficient a50.474(2), which is close to the value of 0.5 expected foran ideally reversible reaction. The Pourbaix diagram (Extended DataFig. 4) confirms that a two-electron, two-proton reduction occurs inacidic solution, and yields approximate pK a values of 7 and 11 for the
reduced AQDS species11.Functionalization of the anthraquinone backbone with electron-
donating groups such as hydroxy can be expected lower the reductionpotential of AQDS (E 0), thereby raising the cell voltage12. Hydroxy-substituted anthraquinones are synthesized through oxidation reac-tions that may be performed at minimal cost. They are also naturalproducts that have been extracted for millennia fromcommon sourcessuch as rhubarb and could even provide a renewable source for futureanthraquinone-based electrolyte solutions.
Quantum chemical calculations of un-substituted and hydroxy-substituted AQDS were performedto predict howsubstitution patternswould change both E 0 of the quinone/hydroquinone couples (Fig. 3c)
1Harvard School of Engineering and Applied Sciences, 29Oxford Street, Cambridge, Massachusetts02138, USA. 2Department of Chemistry and Chemical Biology, Harvard University, 12 Oxford Street,
Cambridge, Massachusetts 02138, USA. 3Molecular Materials and Nanosystems, Eindhoven University of Technology, PO Box 513, 5600 MB Eindhoven, The Netherlands.
*These authors contributed equally to this work.
9 J A N U A R Y 2 0 1 4 | V O L 5 0 5 | N A T U R E | 1 9 5
Macmillan Publishers Limited. All rights reserved©2014

8/9/2019 nature12909(1)
http://slidepdf.com/reader/full/nature129091 2/16

8/9/2019 nature12909(1)
http://slidepdf.com/reader/full/nature129091 3/16
DHAQDS was also found to have faster reduction kinetics (k05
1.56(5)31022 cm s21), possibly due to intramolecular hydrogen bonding of the2OH to the ketone (Extended Data Fig. 3b).
The organic approach liberates battery redox chemistry from the con-straints of the limited number of elemental redox couples of the peri-odic table. Although quinones have been used previously in batteriesusing redox-active solids13–15, their incorporation into all-liquid flow batteries offers the following advantages over current flow-batterytech-nologies. First,scalability:AQDScontains onlythe Earth-abundant atomscarbon, sulphur, hydrogen and oxygen, and can be inexpensively manu-factured on large scales. Because some hydroxy-anthraquinones arenaturalproducts, there is alsothe possibility thatthe electrolyte materialcan be renewably sourced. Second, kinetics: quinones undergo extre-mely rapid two-electron redox on simple, inexpensive carbon electro-des and do not require a costly precious-metal catalyst. Furthermore,thiselectrode permitshigher charging voltages by suppressing the para-sitic water-splitting reactions. Third, stability: quinones should exhibitminimal membrane crossover owing to their relatively large size andchargein aqueoussolution as a sulphonate anion. Furthermore, althoughbromine crossover is a known issue in zinc-bromine, vanadium-brom-ineand hydrogen-brominecells, AQDS is stableto prolonged heating inconcentrated Br2/HBr mixtures (Extended Data Figs 5 and 6), and theQBFB canbe cycledin HBrelectrolyte solutions (Extended Data Fig.9).Fourth, solubility: AQDS has an aqueous solubility greater than 1 M atpH 0, andthequinone solution canthus be storedat relativelyhigh energy density—volumetric and gravimetric energy densitiesexceed 50 W h l21
and 50 W h kg 21, respectively. Last, tunability: the reduction potentialand solubility of AQDS can be further optimized by introduction of functional groups such as2OH. Use of DHAQDS is expected to lead
to an increase in cell potential, performance and energy density.
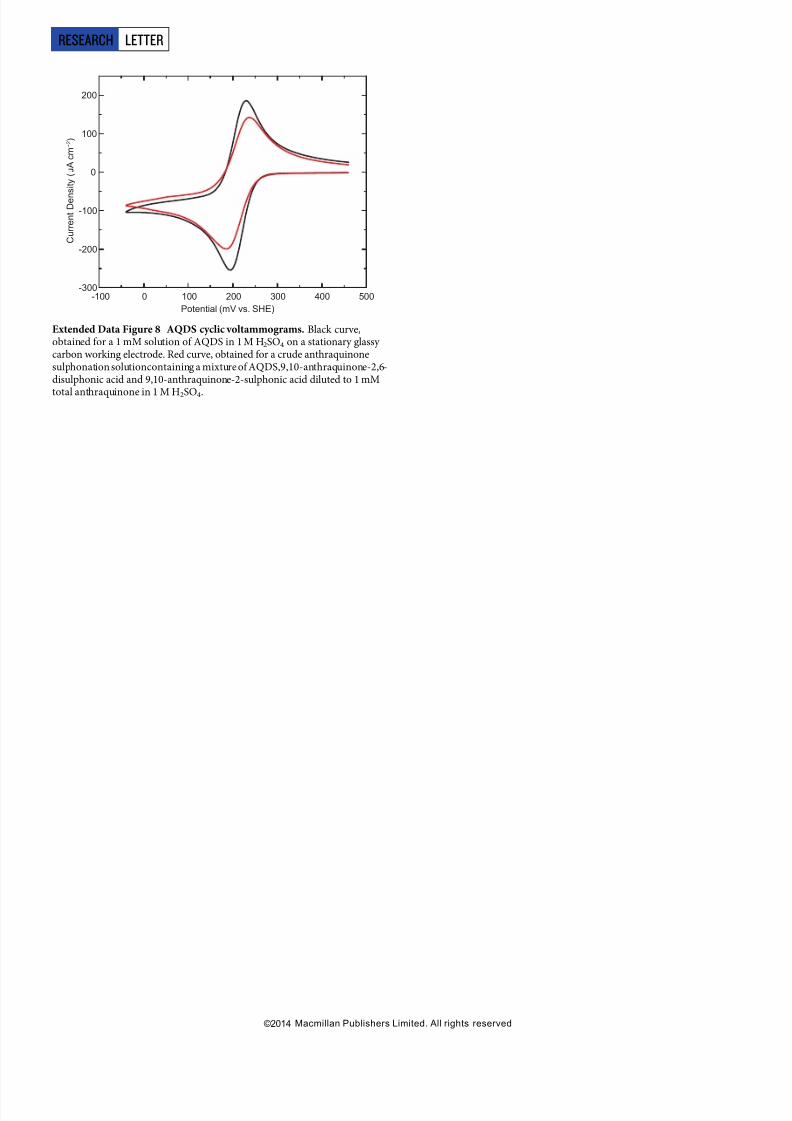
These features lower the capitalcost of storagechemicals perkilowatthour, which sets a floor on the ultimate system cost per kilowatt hourat any scale. The precursor molecule anthracene is abundant in crudepetroleum and is already oxidizedon large scale to anthraquinone. Sul-phonated anthraquinonesare used on an industrial scalein wood pulpprocessing for paper16, and they can be readily synthesized from thecommodity chemicals anthraquinone and oleum8. In fact, a cyclic vol-tammogram of the crude sulphonationproduct of these two reagents is
virtually identical to that of pure AQDS (Extended Data Fig. 8). Basedon this simple electrolyte preparation that requires no further productseparation,we estimatechemicalcostsof $21perkilowatt hour forAQDSand $6 per kilowatt hour for bromine17 (see Methods for informationon cost calculations). The QBFB offers major cost improvements over
vanadium flow batteries with redox-active materials that cost $81 per
kilowatt hour (ref.18). Optimization of engineering and operating para-meters such as the flow field geometry, electrode design, membrane sepa-rator and temperature—which have not yet even begun—should leadto significant performance improvements in the future, as it has for
vanadium flow batteries, which took many years to reach the powerdensities we report here6. The use of redox processes in p-aromaticorganic molecules represents a new and promising direction for cost-effective, large-scale energy storage.
METHODS SUMMARYThe QBFB comprised a mixture of commercially available and custom-madecomponents. Pretreated 2cm2, stacked (36) Toray carbon paper electrodes (eachofwhichis about7.5mm uncompressed)wereusedon both sidesof thecell.Nafion212(50mm thick)was used as a proton-exchange membrane,and PTFE gasketing was used to seal the cell assembly. On the positive side of the cell, 120 ml of 3 M
HBrand0.5MBr2 wereused as theelectrolyte solutionin the fully dischargedstate;
–100 0 100 200 300 400
–300
–200
–100
0
100
200
50 100 150 200 250 300
Currentdensity( μ Acm–2)
–1,400
–1,200
–1,000
–800
–600
–400
–200
0
Potential (mV vs SHE)
200 r.p.m.
3,600 r.p.m.
0.00 0.04 0.08 0.12 0.16 0.20 0.240
–10
–20
–30
–40
–50
–60
–300 –200 –100 0 100 200 300
0
1
2
3
4
5
6
AQDS
DHAQDS
Potential (mV vs SHE)Potential (mV vs SHE)
(Rotation rate)–1/2 (s1/2 rad–1/2 )
Currentdensity( μ Acm–2)
Numberof−OHgroups
i–1(mA–1)
a
η (mV)
13 18
23 28 33 38 363
b
c d
O
O
SO3HHO3S
OH OH
O
O
SO3HHO3S
AQDS
DHAQDS
500
Figure 3 | Half-cell measurements and theory calculations. a , Rotating diskelectrode (RDE) measurements of AQDSusing a glassy carbon electrodein1 M H2SO4 at 11 rotation rates ranging from 200 r.p.m. (red) to 3,600r.p.m.(black). b, Koutecky ´–Levich plot (current21 versus rotation rate21/2) derivedfrom a at seven different AQDS reduction overpotentials, g. c, Calculated
reduction potentials of AQDS substituted with –OH groups (black), calculatedAQDS and DHAQDS values (blue), and experimental values for AQDS andDHAQDS (red squares). d, Cyclic voltammogram of AQDS and DHAQDS(1mM) in 1 M H2SO4 on a glassy carbon electrode (scan rate5 25mVs21).
LETTER RESEARCH
9 J A N U A R Y 2 0 1 4 | V O L 5 0 5 | N A T U R E | 1 9 7
Macmillan Publishers Limited. All rights reserved©2014

8/9/2019 nature12909(1)
http://slidepdf.com/reader/full/nature129091 4/16
on the negative side, 1M 2,7-AQDSin 1 M H2SO4 was used. AQDS disodium saltwasflushedtwicethrougha column containing Amberlyst15H ion-exchangeresinto remove the sodium ions. Half-cell measurements were conducted using a Ag/AgCl aqueous reference electrode (3 M KCl filling solution), a Pt wire counterelectrode anda 3-mm-diameter glassy carbon diskelectrode. For theoretical calcu-lations, the total free energies of molecules were obtained from first-principlesquantum chemical calculations within density functional theory at the level of the generalized gradient approximation (GGA) using the PBE functional. Three-dimensionalconformerstructures foreachquinone/hydroquinone moleculewere gen-
eratedusing the ChemAxon suite withup to 25 generatedconformers per moleculeusing the Dreidingforce field. Generatedconformers wereused as input structuresforthe densityfunctionaltheorygeometryoptimization employedfor determining the formation energy, which in turn is used to evaluate the reduction potential. Inthe QBFB cost calculation, a price of $4.74 per kilogram (eBioChem) was used foranthraquinone. To get the sulphonated form actually used here, anthraquinonemust bereactedwitholeum(H2SO4/SO3), whichaddsa negligiblecost atscale; thiscost is not included here. The price of bromine was $1.76 per kilogram, based onestimates from the US Geological Survey 17. The cell voltage used to calculate costshere was 0.858 V.
Online Content Any additionalMethods, ExtendedData display items and SourceData are available in the online version of the paper; references unique to thesesections appear only in the online paper.
Received 26 June; accepted 25 November 2013.
1. Rugolo,J. & Aziz, M.J. Electricity storagefor intermittentrenewable sources. Energy Environ. Sci. 5, 7151–7160 (2012).
2. Yang, Z. et al. Electrochemical energy storage for green grid. Chem. Rev. 111,3577–3613 (2011).
3. Weber, A. Z. et al. Redox flow batteries: a review. J. Appl. Electrochem. 41,1137–1164 (2011).
4. Leung,P. et al. Progress in redox flow batteries, remaining challenges and theirapplications in energy storage. RSC Adv. 2, 10125–10156 (2012).
5. Nguyen, T. & Savinell, R. F. Flow batteries. Electrochem. Soc. Interface 19, 54–56(2010).
6. Skyllas-Kazacos, M.,Chakrabarti,M. H.,Hajimolana, S. A., Mjalli, F. S. & Saleem,M.Progress in flow battery research and development. J. Electrochem. Soc. 158,R55–R79 (2011).
7. Huskinson, B., Rugolo, J., Mondal, S. K. & Aziz, M. J. A high power density, highefficiency hydrogen–chlorine regenerative fuel cell with a low precious metalcontent catalyst. Energy Environ. Sci. 5, 8690–8698 (2012).
8. Crossley, M. L. The separation of mono-b , 2,6- and 2,7-sulfonic acids ofanthraquinone. J. Am. Chem. Soc. 37, 2178–2181 (1915).
9. Conant,J. B., Kahn,H. M.,Fieser, L. F.& Kurtz, S.S. Anelectrochemical studyof thereversible reduction of organiccompounds. J.Am. Chem.Soc.44,1382–1396(1922).
10. Kelsall, G. H. & Thompson, I. Redox chemistry of H2S oxidation by the British GasStretford process. Part III: Electrochemical behaviour of anthraquinone 2,7disulphonate in alkaline electrolytes. J. Appl. Electrochem. 23, 296–307 (1993).
11. Forster,R. J. & O’Kelly, J. P. Protonation reactions of anthraquinone-2,7-disulphonic acid in solution and within monolayers. J. Electroanal. Chem. 498,127–135 (2001).
12. Song, Y. & Buettner, G. R. Thermodynamic and kinetic considerations for thereactionof semiquinoneradicals to formsuperoxide andhydrogen peroxide. FreeRadic. Biol. Med. 49, 919–962 (2010).
13. Xu, Y. et al. in World Non-Grid-Connected Wind Power and Energy Conference 1–4(IEEE, 2009).
14. Wang, W. et al. Anthraquinone with tailored structure for a nonaqueous metal-organic redox flow battery. Chem. Commun. 48, 6669–6671 (2012).
15. Yao, M. et al. High capacity organic positive-electrode material based on abenzoquinone derivativefor use in rechargeablelithium batteries. J. PowerSources195, 8336–8340 (2010).
16. Gordon, O. W., Plattner, E. & Doppenberg, F. Production of pulp by the soda-anthraquinone process (SAP) with recovery of the cooking chemicals. US patent5,595,628 (1997).
17. USGeologicalSurvey2010MineralsYearbook:Bromine (2010);available at http://minerals.usgs.gov/minerals/pubs/commodity/bromine/myb1-2010-bromi.pdf .
18. US Geological Survey Vanadium Mineral Commodities Summary (2013); availableat http://minerals.usgs.gov/minerals/pubs/commodity/vanadium/mcs-2013-vanad.pdf.
Acknowledgements This work was partially fundedthroughUS Department ofEnergy ARPA-E Award DE-AR0000348 and partially funded through the HarvardSchool of Engineering and Applied Sciences. Theoretical work was funded in partthrough the Extreme Science and Engineering Discovery Environment (XSEDE),
which is supported by National Science Foundation grant number OCI-1053575.B.H. was supported by an NSF Graduate Research Fellowship. S.E. performed workas partof theFellowshipsfor YoungEnergyScientists programme of theFoundation forFundamentalResearch on Matter (FOM),whichis partof theNetherlands OrganizationforScientificResearch(NWO).We thank T.Betley, L. Hartle,R. Burtonand R.Duncanfordiscussions.
Author ContributionsB.H.and M.P.M. contributedequally tothis work. B.H.andM.P.M.designed and tested the battery, with direction from M.J.A. Both M.P.M. and M.R.G.conducted electrochemistry experiments, with direction from M.J.A. M.P.M. and C.J.G.synthesized chemicals withdirection from R.G.G.Theoreticalcalculationswere donebyC.S. and S.E., with input from M.P.M. and R.G.G. and direction from A.A.-G. X.C.contributed NMR results. B.H., M.P.M., C.S., M.R.G., S.E., A.A.G., R.G.G. and M.J.A. allcontributed to writing the manuscript.
Author Information Reprints and permissions information is available atwww.nature.com/reprints. The authors declare competing financial interests: detailsare available in the online version of the paper. Readers are welcome to comment onthe online version of the paper. Correspondence and requestsfor materialsshould beaddressed to M.J.A. ([email protected]).
RESEARCH LETTER
1 9 8 | N A T U R E | V O L 5 0 5 | 9 J A N U A R Y 2 0 1 4
Macmillan Publishers Limited. All rights reserved©2014
8/9/2019 nature12909(1)
http://slidepdf.com/reader/full/nature129091 5/16
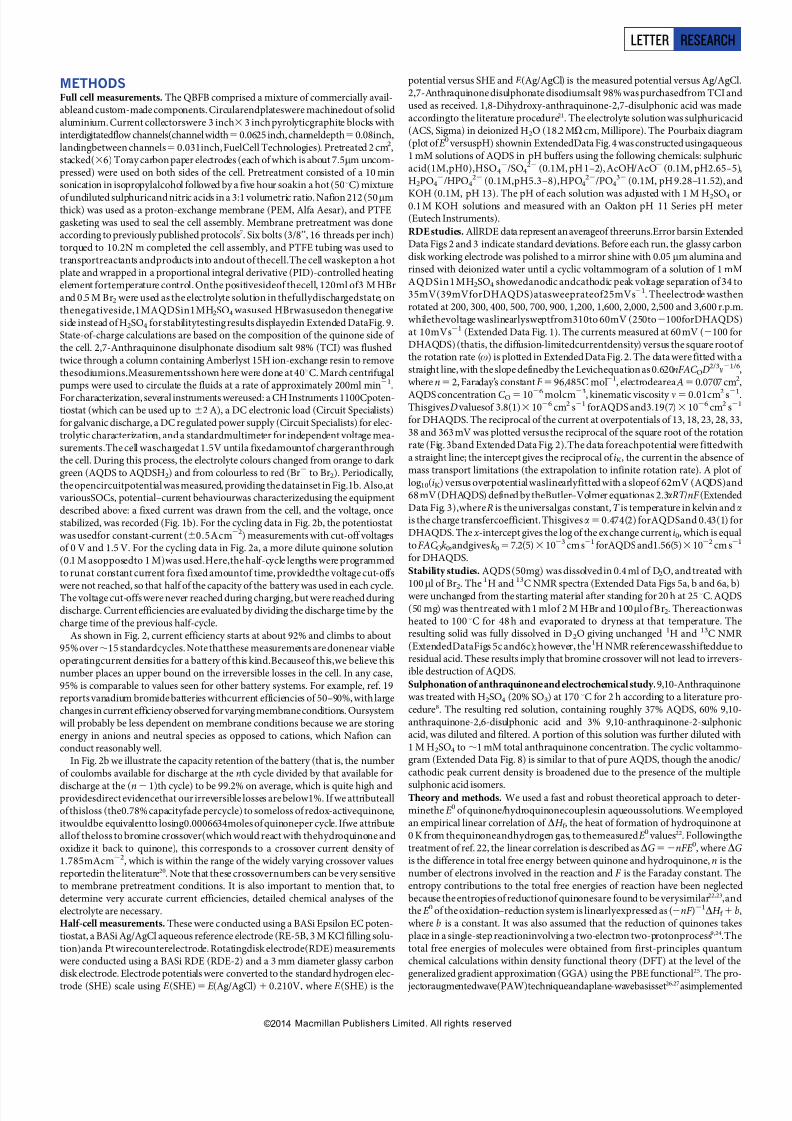
METHODSFull cell measurements. The QBFB comprised a mixture of commercially avail-ableand custom-made components. Circularendplateswere machinedout of solidaluminium. Current collectorswere 3 inch3 3 inch pyrolyticgraphite blocks withinterdigitatedflow channels(channelwidth50.0625 inch, channeldepth50.08inch,landingbetween channels5 0.031inch, FuelCell Technologies). Pretreated 2 cm2,stacked(36) Toray carbon paper electrodes (each of which is about 7.5mm uncom-pressed) were used on both sides of the cell. Pretreatment consisted of a 10 minsonication in isopropylalcohol followed by a five hour soakin a hot (50uC) mixture
of undiluted sulphuricand nitric acids in a 3:1 volumetric ratio. Nafion 212 (50mmthick) was used as a proton-exchange membrane (PEM, Alfa Aesar), and PTFEgasketing was used to seal the cell assembly. Membrane pretreatment was doneaccording to previously published protocols7. Six bolts (3/8’’, 16 threads per inch)torqued to 10.2N m completed the cell assembly, and PTFE tubing was used totransportreactants andproducts into andout of thecell.The cell waskepton a hotplate and wrapped in a proportional integral derivative (PID)-controlled heating element fortemperature control. Onthe positivesideof thecell, 120ml of3 M HBrand 0.5 M Br2 were used as the electrolyte solution in thefullydischargedstate; onthenegativeside,1MAQDSin1MH2SO4 wasused. HBrwasusedon thenegativeside instead of H2SO4 for stabilitytesting results displayedin Extended DataFig. 9.State-of-charge calculations are based on the composition of the quinone side of the cell. 2,7-Anthraquinone disulphonate disodium salt 98% (TCI) was flushedtwice through a column containing Amberlyst 15H ion-exchange resin to removethesodiumions.Measurementsshown here were done at 40uC. March centrifugalpumps were used to circulate the fluids at a rate of approximately 200ml min21.Forcharacterization, several instruments wereused: a CH Instruments 1100Cpoten-tiostat (which can be used up to 62 A), a DC electronic load (Circuit Specialists)for galvanic discharge, a DC regulated power supply (Circuit Specialists) for elec-trolytic characterization, and a standardmultimeter for independent voltage mea-surements.The cell waschargedat 1.5V untila fixedamountof chargeranthroughthe cell. During this process, the electrolyte colours changed from orange to dark green (AQDS to AQDSH2) and from colourless to red (Br2 to Br2). Periodically,the opencircuitpotential was measured, providing the datainset in Fig.1b. Also,at
variousSOCs, potential–current behaviourwas characterizedusing the equipmentdescribed above: a fixed current was drawn from the cell, and the voltage, oncestabilized, was recorded (Fig. 1b). For the cycling data in Fig. 2b, the potentiostatwas usedfor constant-current (60.5Acm22) measurements with cut-off voltagesof 0 V and 1.5 V. For the cycling data in Fig. 2a, a more dilute quinone solution(0.1 M asopposedto 1 M)was used.Here,the half-cycle lengths were programmedto runat constant current fora fixed amountof time, providedthe voltage cut-offs
were not reached, so that half of the capacity of the battery was used in each cycle.The voltage cut-offs were never reached during charging, but were reached during discharge. Current efficiencies are evaluated by dividing the discharge time by thecharge time of the previous half-cycle.
As shown in Fig. 2, current efficiency starts at about 92% and climbs to about95% over,15 standardcycles. Note thatthese measurements are donenear viableoperatingcurrent densities for a battery of this kind.Becauseof this,we believe thisnumber places an upper bound on the irreversible losses in the cell. In any case,95% is comparable to values seen for other battery systems. For example, ref. 19reports vanadium bromide batteries withcurrent efficiencies of 50–90%, with largechanges in current efficiency observed forvarying membraneconditions. Oursystemwill probably be less dependent on membrane conditions because we are storing energy in anions and neutral species as opposed to cations, which Nafion canconduct reasonably well.
In Fig. 2b we illustrate the capacity retention of the battery (that is, the numberof coulombs available for discharge at the nth cycle divided by that available for
discharge at the (n2 1)th cycle) to be 99.2% on average, which is quite high andprovidesdirect evidencethat our irreversible losses are below1%. If we attributeallof thisloss (the0.78% capacityfade percycle) to someloss of redox-activequinone,itwouldbe equivalentto losing0.0006634moles of quinoneper cycle. Ifwe attributeallof theloss to bromine crossover(which would react with thehydroquinone andoxidize it back to quinone), this corresponds to a crossover current density of 1.785mAcm22, which is within the range of the widely varying crossover valuesreportedin the literature20. Note that these crossovernumbers can be very sensitiveto membrane pretreatment conditions. It is also important to mention that, todetermine very accurate current efficiencies, detailed chemical analyses of theelectrolyte are necessary.Half-cell measurements. These were conducted using a BASi Epsilon EC poten-tiostat, a BASi Ag/AgCl aqueous reference electrode (RE-5B, 3 M KCl filling solu-tion)anda Pt wirecounterelectrode. Rotatingdisk electrode(RDE) measurementswere conducted using a BASi RDE (RDE-2) and a 3 mm diameter glassy carbondisk electrode. Electrode potentials were converted to the standard hydrogen elec-
trode (SHE) scale using E (SHE)5E (Ag/AgCl)1 0.210V, where E (SHE) is the
potential versus SHE and E (Ag/AgCl) is the measured potential versus Ag/AgCl.2,7-Anthraquinone disulphonate disodiumsalt 98% was purchasedfrom TCI andused as received. 1,8-Dihydroxy-anthraquinone-2,7-disulphonic acid was madeaccordingto the literature procedure21. The electrolyte solution was sulphuricacid(ACS, Sigma) in deionized H2O (18.2 MV cm, Millipore). The Pourbaix diagram(plot of E 0 versuspH) shownin ExtendedData Fig.4 was constructed usingaqueous1 mM solutions of AQDS in pH buffers using the following chemicals: sulphuricacid(1M,pH0),HSO4
2/SO422 (0.1M, pH 1–2), AcOH/AcO2 (0.1M, pH2.65–5),
H2PO42/HPO4
22 (0.1M,pH5.3–8),HPO422/PO4
32 (0.1M, pH 9.28–11.52), and
KOH (0.1M, pH 13). The pH of each solution was adjusted with 1 M H2SO4 or0.1 M KOH solutions and measured with an Oakton pH 11 Series pH meter(Eutech Instruments).
RDE studies. AllRDE data represent an averageof threeruns.Error barsin ExtendedData Figs 2 and 3 indicate standard deviations. Before each run, the glassy carbondisk working electrode was polished to a mirror shine with 0.05 mm alumina andrinsed with deionized water until a cyclic voltammogram of a solution of 1 mMAQDSin1MH2SO4 showedanodic andcathodic peak voltage separation of 34 to35mV(39mVforDHAQDS)atasweeprateof25mVs21. Theelectrode wasthenrotated at 200, 300, 400, 500, 700, 900, 1,200, 1,600, 2,000, 2,500 and 3,600 r.p.m.whilethevoltage waslinearlysweptfrom310to 60mV (250to2100forDHAQDS)at 10mVs21 (Extended Data Fig. 1). The currents measured at 60mV (2100 forDHAQDS) (thatis, the diffusion-limitedcurrentdensity) versus the square root of the rotation rate (v) is plotted in Extended Data Fig. 2. The data were fitted with astraight line, with the slope definedby the Levichequation as 0.620nFAC OD
2/3n21/6,where n5 2, Faraday’s constantF 596,485C mol21, electrodearea A50.0707 cm2,
AQDS concentration C O5 1026 molcm23, kinematic viscosity n5 0.01cm2 s21.ThisgivesD valuesof 3.8(1)3 1026 cm2 s21 forAQDS and3.19(7)31026 cm2 s21
for DHAQDS. The reciprocal of the current at overpotentials of 13, 18, 23, 28, 33,38 and 363 mV was plotted versus the reciprocal of the square root of the rotationrate (Fig. 3band Extended Data Fig. 2).The data foreachpotential were fittedwitha straight line; the intercept gives the reciprocal of iK, the current in the absence of mass transport limitations (the extrapolation to infinite rotation rate). A plot of log 10(iK) versus overpotential waslinearlyfitted with a slopeof 62mV (AQDS)and68 mV (DHAQDS) defined by theButler–Volmer equationas 2.3aRT /nF (ExtendedData Fig. 3),whereR is the universalgas constant,T is temperature in kelvin anda
is the charge transfercoefficient. Thisgives a5 0.474(2) forAQDSand 0.43(1) forDHAQDS. The x -intercept gives the log of the exchange current i0, which is equaltoFAC Ok0,andgivesk057.2(5)31023 cm s21 forAQDS and1.56(5)31022 cm s21
for DHAQDS.
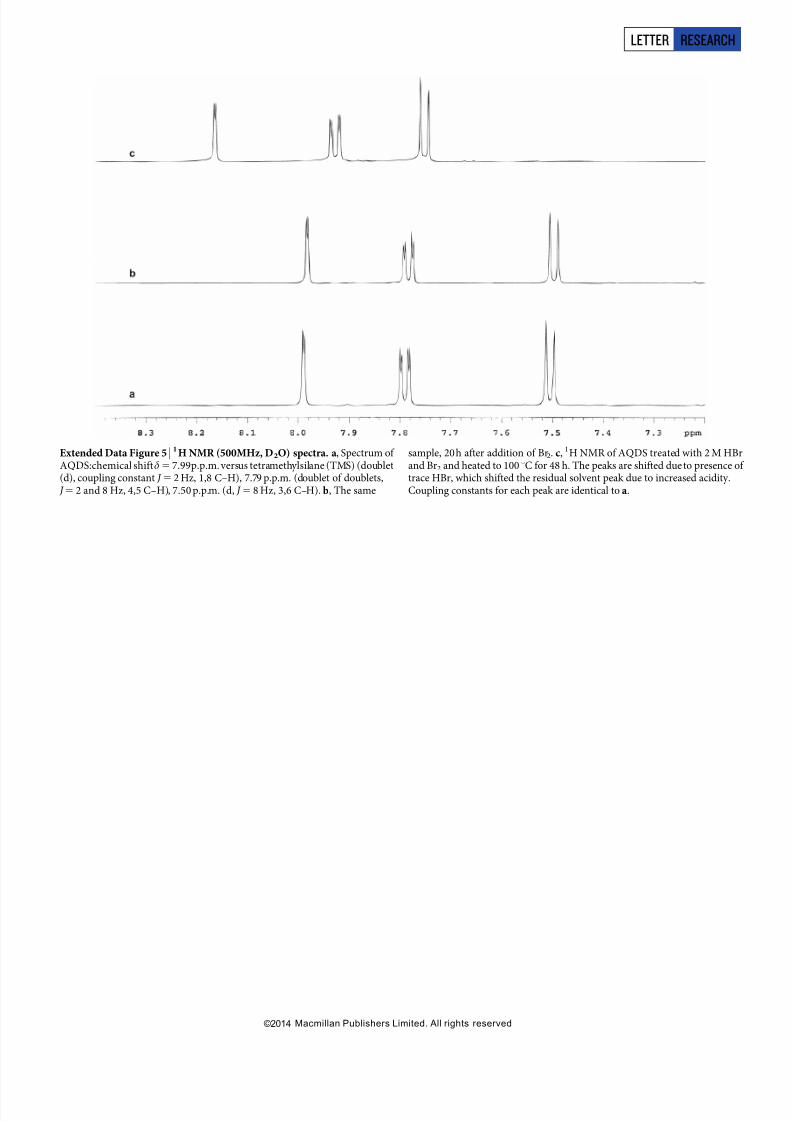
Stability studies. AQDS (50mg) was dissolved in 0.4 ml of D2O, and treated with
100m
l of Br2. The
1
H and
13
C NMR spectra (Extended Data Figs 5a, b and 6a, b)were unchanged from the starting material after standing for 20 h at 25uC. AQDS(50 mg) was thentreated with 1 mlof 2 M HBr and 100mlof B r2. Thereactionwasheated to 100 uC for 48 h and evaporated to dryness at that temperature. Theresulting solid was fully dissolved in D2O giving unchanged 1H and 13C NMR (ExtendedDataFigs 5c and6c); however, the1H NMR referencewasshifteddue toresidual acid. These results imply that bromine crossover will not lead to irrevers-ible destruction of AQDS.
Sulphonation of anthraquinone and electrochemical study.9,10-Anthraquinonewas treated with H2SO4 (20% SO3) at 170 uC for 2 h according to a literature pro-cedure8. The resulting red solution, containing roughly 37% AQDS, 60% 9,10-anthraquinone-2,6-disulphonic acid and 3% 9,10-anthraquinone-2-sulphonicacid, was diluted and filtered. A portion of this solution was further diluted with1 M H2SO4 to,1 mM total anthraquinone concentration. The cyclic voltammo-gram (Extended Data Fig. 8) is similar to that of pure AQDS, though the anodic/cathodic peak current density is broadened due to the presence of the multiple
sulphonic acid isomers.Theory and methods. We used a fast and robust theoretical approach to deter-minethe E 0 of quinone/hydroquinonecouplesin aqueoussolutions. We employedan empirical linear correlation of DH f , the heat of formation of hydroquinone at0 K from thequinoneandhydrogen gas, to themeasuredE 0 values22. Followingthetreatment of ref. 22, the linear correlation is described asDG52nFE 0, where DGis the difference in total free energy between quinone and hydroquinone, n is thenumber of electrons involved in the reaction and F is the Faraday constant. Theentropy contributions to the total free energies of reaction have been neglectedbecause the entropies of reductionof quinonesare found to be verysimilar22,23,andtheE 0 of the oxidation–reduction system is linearlyexpressed as (2nF )21DH f 1 b,where b is a constant. It was also assumed that the reduction of quinones takesplace in a single-step reactioninvolving a two-electron two-protonprocess9,24.Thetotal free energies of molecules were obtained from first-principles quantumchemical calculations within density functional theory (DFT) at the level of thegeneralized gradient approximation (GGA) using the PBE functional25. The pro-
jectoraugmentedwave(PAW)techniqueandaplane-wavebasisset26,27asimplemented
LETTER RESEARCH
Macmillan Publishers Limited. All rights reserved©2014

8/9/2019 nature12909(1)
http://slidepdf.com/reader/full/nature129091 6/16
in VASP28,29 were employed. The kinetic energy cut-off for the plane-wave basiswas set at 500 eV, which was sufficient to converge the total energies on a scale of 1 meV per atom. To obtain the ground-state structures of molecules in the gasphase, we considered multiple initial configurations for each molecule and opti-mized them in a cubic box of 25 A using C-point sampling. The geometries wereoptimized without any symmetry constraints using the conjugate gradient (CG)algorithm, and the convergence was assumed to be complete when the totalremaining forces on the atoms were less than 0.01eV A21.
The search forconformationalpreference through theoretical calculations for each
hydroxylatedquinone is crucial because of the significant effects of intramolecularhydrogen bonds on the total free energies of the molecules 30. Three-dimensionalconformerstructures foreachquinone/hydroquinonemoleculewere generatedusing the ChemAxon suite (Marvin 6.1.0 by ChemAxon, http://www.chemaxon.com)with up to 25 conformers generated per molecule using the Dreiding force field31.The conformers generated were used as input structures for the DFT geometry optimization employed for determining DH f , which in turn is used to estimate E 0
and G0solv .
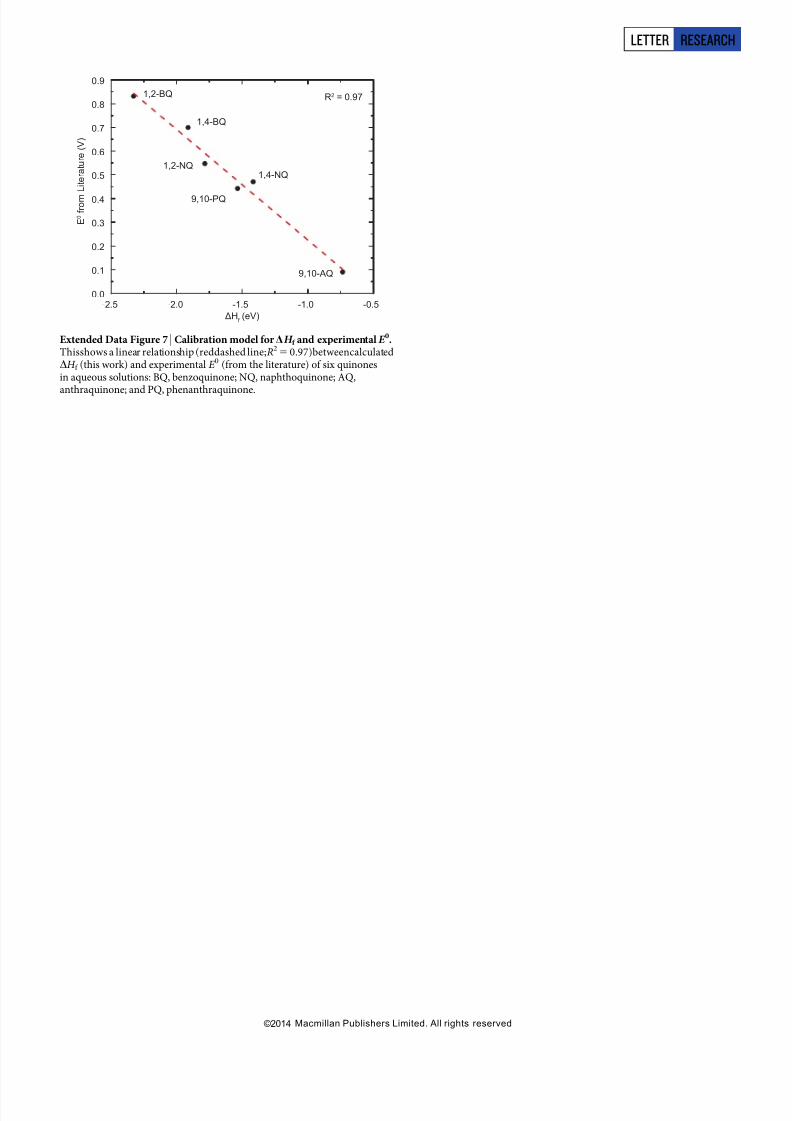
To calculate the E 0 of the hydroxy-substituted AQDS molecules (Fig. 3c), thecorrelation betweenDH f andE 0 was calibratedfrom experimental dataon six well-characterizedquinones32. Specifically,we usedthe experimentalvalues of theaqueousE 0 and computedDH f of 1,2-benzoquinone,1,4-benzoquione, 1,2-naphthoquinone,1,4-naphthoquinone, 9,10-anthraquinone and 9,10-phenanthrene33. The training set ensures thatthe calibration plotaddresses mostclassesand aspects of quinones,includingtwo quinones eachfrom 1-ring (benzoquinone),2-ring (naphthoquinone)and 3-ring (anthraquinone and phenanthrene) structures. In addition, the experi-
mental values of E 0 of the training set spanned 0.09 V (9,10-anthraquinone) to0.83 V (1,2-benzoquinone), providing a wide range for E 0 (Extended Data Fig. 7).The linear calibration plot for E 0 yields an R2
50.97 between the calculated DH f and E 0 (Extended Data Fig. 7).
The G0solv values of the quinones in water were calculated using the Jaguar 8.0
program in the Schrodinger suite 2012 (Jaguar, version 8.0, Schrodinger). Thestandard Poisson–Boltzmann solver was employed34,35. In this model, a layer of charges on the molecularsurfacerepresents the solvent.G0
solv wascalculatedas thedifference between thetotalenergy ofthe solvated structureandthe total energyof themoleculein vacuum. A more negative value forG0
solv corresponds to a quinonethat is likely to have a higher aqueous solubility. An absolute prediction of thesolubility is not readilyavailable,as theaccuratepredictionof the moststableformsof molecular crystal structures with DFT remains an open problem36.Cost calculations.Thesewere doneusing the following formula:C 5 (3.63103)3(PM )/(nFE ), whereC isthe cost inUS dollars ofthe compoundper kilowatt hour,P is the cost in US dollars per kilogram, M is the molecular mass of the compound,F is Faraday’s constant (96,485 C mol21), n is the number of moles of electronstransferred per mole of storage compound (two for the QBFB) and E is the open-circuitvoltage (V) of thestoragedevice.In calculatingthe price fortheanthraquinone-brominebattery,a price of $4.74 perkilogram(eBioChem)was used foranthraquinone
(note that, to get the sulphonated form actually used here, anthraquinone must bereacted with oleum (H2SO4/SO3), which adds a negligible cost at scale; this cost isnot included here). The price of bromine was $1.76 per kilogram, based on esti-matesfrom the US Geological Survey 17. Thecellvoltageusedto calculate costsherewas0.858 V.For vanadium, costswere calculated from USGS pricesfrom201118 of
vanadium pentoxide at $14.37 per kilogram, and the cell voltage used was 1.2 V.Balance-of-system costs have not been estimated because the technology is tooimmature.
19. Skyllas-Kazacos, M., Milne, N. A. & Kazacos, G. C. Membrane properties and
behavior in the Generation 2 vanadium bromide redox flow batteries. MaterialsForum 32, 72–77 (2008).
20. Yeo, R. S. & McBreen, J. Transport properties of Nafion membranes inelectrochemically regenerative hydrogen/halogen cells. J. Electrochem. Soc. 126,1682–1687 (1979).
21. Haase, J., Baudys, J., Obruba, K. & Panek, J. Dihydroxyanthraquinone disulfonicacids. Czechoslovakian patent 148,977 (1973).
22. Dewar, M. J. S. & Trinajstic, N. Ground states of conjugated molecules-XIV: redoxpotentials of quinones. Tetrahedron 25, 4529–4534 (1969).
23. Pullman, B. & Pullman, A. Quantum Biochemistry 475 (Interscience, 1963).24. Guin, P. S., Das, S. & Mandal, P. C. Electrochemical reduction of quinones in
different media: a review. Int. J. Electrochem. 816202 (2011).25. Perdew, J. P., Burke, K. & Ernzerhof,M. Generalized gradientapproximationmade
simple. Phys. Rev. Lett. 77, 3865–3868 (1996).26. Blochl, P. E. Projector augmented-wave method. Phys. Rev. B 50, 17953–17979
(1994).27. Kresse, G. & Joubert, D. From ultrasoft pseudopotentials to the projector
augmented-wave method. Phys. Rev. B 59, 1758–1775 (1999).
28. Kresse,G. & Hafner,J. Ab initio molecular dynamicsfor liquid metals. Phys.Rev.B47, 558–561 (1993).29. Kresse, G. & Furthmuller, J. Efficient iterative schemes for ab initio total-energy
calculations using a plane-wave basis set. Phys. Rev. B 54, 11169–11186 (1996).30. Qu, R., Liu, H., Feng, M., Yang, X. & Wang, Z. Investigation on intramolecular
hydrogen bond and some thermodynamic properties of polyhydroxylatedanthraquinones. J. Chem. Eng. Data 57, 2442–2455 (2012).
31. Mayo, S. L., Olafson, B. D. & Goddard, W. A. III Dreiding: a generic force field formolecular simulations. J. Phys. Chem. 94, 8897–8909 (1990).
32. Wang,J. & Hou,T. Recentadvances on aqueoussolubilityprediction. Comb.Chem.High Throughput Screen. 14, 328–338 (2011).
33. Johnsson Wass,J. R. T., Ahlberg,E., Panas, I. & Schiffrin,D. J. Quantumchemicalmodelingof thereductionof quinones. J. Phys.Chem. A 110, 2005–2020(2006).
34. Tannor, D. J. et al. Accurate first principles calculation of molecular chargedistributions and solvation energies from ab initio quantum mechanics andcontinuum dielectric theory. J. Am. Chem. Soc. 116, 11875–11882 (1994).
35. Marten, B. et al.New model for calculation of solvationfree energies:correctionofself-consistent reaction field continuum dielectric theory for short-range
hydrogen-bonding effects. J. Phys. Chem. 100, 11775–11788 (1996).36. Hongo, K.,Watson, M.A., Sanchez-Carrera,R. S.,Iitaka, T.& Aspuru-Guzik, A.Failure
of conventional density functionals for the prediction of molecular crystalpolymorphism: a quantum Monte Carlo study. J. Phys. Chem. Lett. 1, 1789–1794(2010).
RESEARCH LETTER
Macmillan Publishers Limited. All rights reserved©2014

8/9/2019 nature12909(1)
http://slidepdf.com/reader/full/nature129091 7/16
-100 0 100 200 300-1,200
-1,000
-800
-600
-400
-200
0
CurrentDensity(μAcm−2)
Potential (mV vs SHE)
3600 r.p.m.
200 r.p.m.
Extended Data Figure 1 | Plot of potential versus current density atdifferent rotation rates of the RDE. The solution is 1 mM DHAQDS (1mMi n 1 M H2SO4), using a rotating disk electrode (RDE) of glassycarbon.Rotationrates are200, 300, 400, 500, 700, 900, 1,200,1,600, 2,000,2,500and 3,600 r.p.m.
LETTER RESEARCH
Macmillan Publishers Limited. All rights reserved©2014

8/9/2019 nature12909(1)
http://slidepdf.com/reader/full/nature129091 8/16
0 2 4 6 8 10 12 14 16 18 200
-10
-20
-30
-40
-50
-60
-70
-80
-90
-100
Limiting
Current(μA)
ω1/2 (Rad/s)1/2
0 2 4 6 8 10 12 14 16 18 200
-10
-20
-30
-40
-50
-60
-70
-80
LimitingCurrent(μA)
ω1/2 (Rad/s)1/2
0.00 0.02 0.04 0.06 0.08 0.10 0.12 0.14 0.16 0.18 0.20 0.22 0.24
0
-10
-20
-30
-40
-50
-60
-70
η / mV131823283338236
i−1
(mA−1)
ω−1/2 (Rad/s)−1/2
a b
c
Extended Data Figure 2 | Levich and Koutecky ´–Levich plots obtainedusing the RDE. a , Levich plot (limiting current versus square root of rotation rate v) of 1mM AQDS in 1 M H2SO4 (the fitted line has a slope of 4.53(2)mA s1/2 rad21/2, giving D5 3.8(1)3 1026 cm2 s21). Data are an averageof three runs; error bars indicate the standard deviation. b, As a but for
DHAQDS in 1 M H2SO4 (slope of 3.94(6) mA s1/2 rad21/2
gives D53.19(7)3 1026 cm2 s21). c, Koutecky–Levich plot (i21 versus v21/2)of 1mM DHAQDS in 1M H2SO4. The current response, i, is shown forseven different AQDS reduction overpotentials g.
RESEARCH LETTER
Macmillan Publishers Limited. All rights reserved©2014

8/9/2019 nature12909(1)
http://slidepdf.com/reader/full/nature129091 9/16
-4.0 -3.9 -3.8 -3.7 -3.6 -3.5 -3.4 -3.30
5
10
15
20
25
30
35
40
45
Overpotentia
l( mV)
log(iK)
-4.4 -4.3 -4.2 -4.1 -4.0 -3.9 -3.8 -3.7 -3.60
5
10
15
20
25
30
35
40
45
Overpotential(mV)
log(iK)
a b
Extended Data Figure 3 | Fit of Butler–Volmer equation. Constructedusing the current response in the absence of mass transport at low AQDSreduction overpotentials; iK is the current extrapolated from the zero-interceptof Fig. 3b andExtendedData Fig. 2c (infiniterotationrate). Data arean average
of three runs; error bars indicate the standard deviation. a , AQDS: best-fitline has the equation y 5 62(x 1 4.32). This yields a5 0.474(2) andk05 7.2(5)3 1023 cm s21. b, DHAQDS: best-fit line is the function y 5 68(x 1 3.95). This yields a5 0.43(1) and k05 1.56(5)3 1022 cm s21.
LETTER RESEARCH
Macmillan Publishers Limited. All rights reserved©2014

8/9/2019 nature12909(1)
http://slidepdf.com/reader/full/nature129091 10/16
0 2 4 6 8 10 12 14
-300
-200
-100
0
100
200
300
E0 (mVvsSHE)
pH
Extended Data Figure 4 | Pourbaix diagram (E 0 vs pH) of AQDS. Data are
fitted to three solid lines indicating slopes of 259mVpH21, 230mVpH21
and 0 mVpH21, corresponding to two-, one- and zero-proton processes,respectively. Dashed lines linearly extrapolate the one- and zero-proton
processes to give E 0
values of 18 mV (2e2
/1H1
) and 2296mV (2e2
/0H1
).
RESEARCH LETTER
Macmillan Publishers Limited. All rights reserved©2014
8/9/2019 nature12909(1)
http://slidepdf.com/reader/full/nature129091 11/16
8/9/2019 nature12909(1)
http://slidepdf.com/reader/full/nature129091 12/16
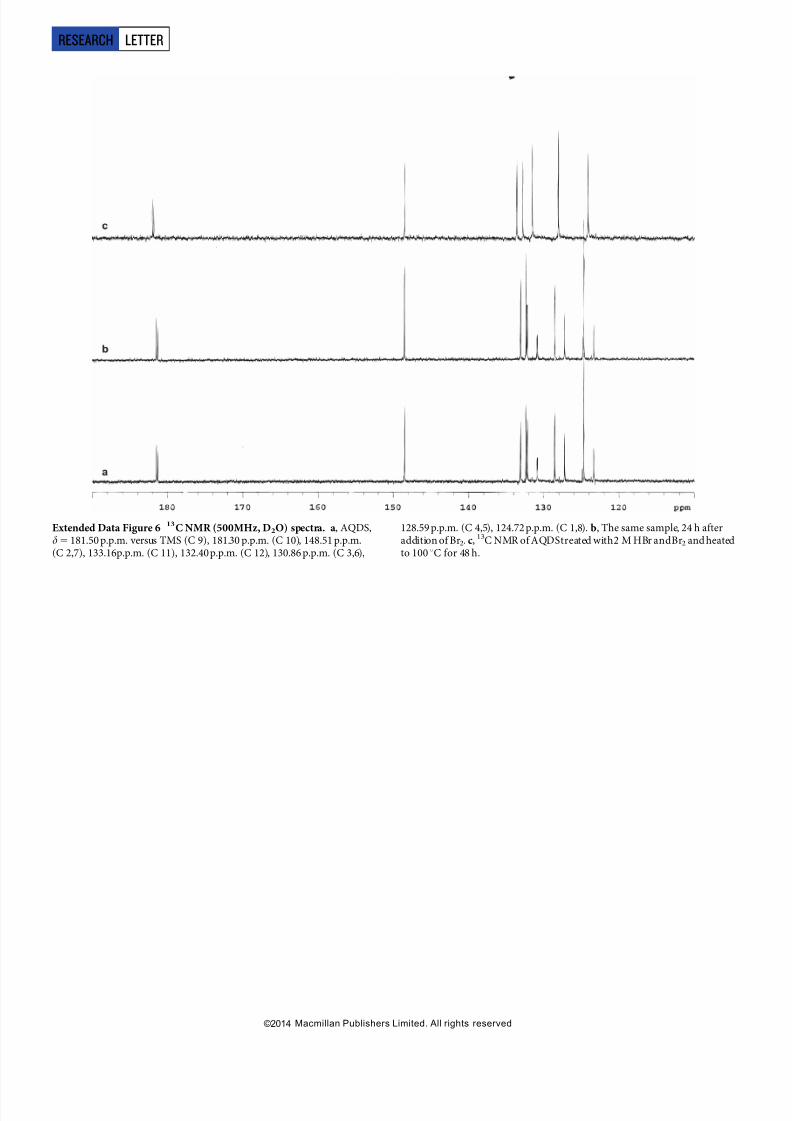
Extended Data Figure 6 | 13C NMR (500MHz, D2O) spectra. a , AQDS,d5 181.50 p.p.m. versus TMS (C 9), 181.30 p.p.m. (C 10), 148.51 p.p.m.(C 2,7), 133.16p.p.m. (C 11), 132.40p.p.m. (C 12), 130.86 p.p.m. (C 3,6),
128.59 p.p.m. (C 4,5), 124.72 p.p.m. (C 1,8). b, The same sample, 24 h afteraddition of Br2. c, 13C NMR of AQDStreated with2 M HBr andBr2 and heatedto 100 uC for 48 h.
RESEARCH LETTER
Macmillan Publishers Limited. All rights reserved©2014
8/9/2019 nature12909(1)
http://slidepdf.com/reader/full/nature129091 13/16
8/9/2019 nature12909(1)
http://slidepdf.com/reader/full/nature129091 14/16
-100 0 100 200 300 400 500-300
-200
-100
0
100
200
CurrentDen
sity(μAcm−2)
Potential (mV vs. SHE)
Extended Data Figure 8 | AQDS cyclic voltammograms. Black curve,obtained for a 1 mM solution of AQDS in 1 M H2SO4 on a stationary glassy carbon working electrode. Red curve, obtained for a crude anthraquinonesulphonation solutioncontaining a mixture of AQDS,9,10-anthraquinone-2,6-disulphonic acid and 9,10-anthraquinone-2-sulphonic acid diluted to 1 mM
total anthraquinone in 1 M H2SO4.
RESEARCH LETTER
Macmillan Publishers Limited. All rights reserved©2014
8/9/2019 nature12909(1)
http://slidepdf.com/reader/full/nature129091 15/16
0.0 0.5 1.0 1.5 2.0 2.5 3.0 3.5 4.0 4.5 5.0 5.50.0
0.3
0.6
0.9
1.2
1.5
CellPotential(V)
Time (hrs)
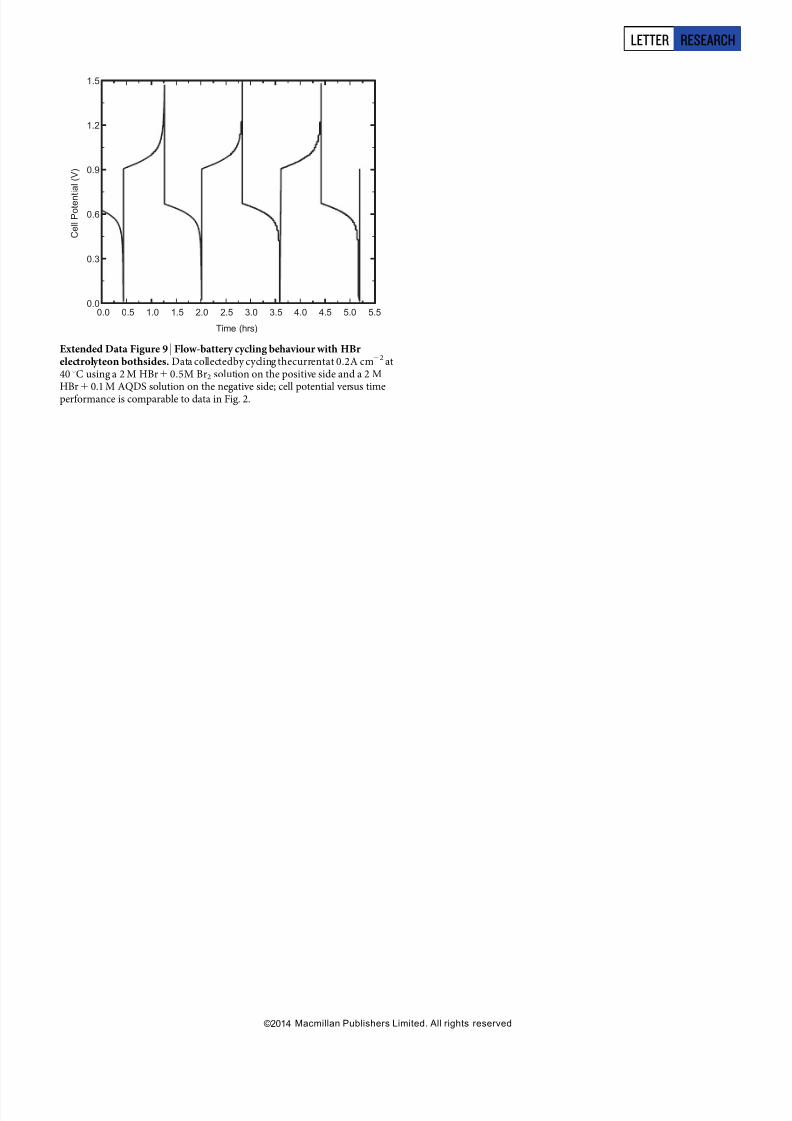
Extended Data Figure 9 | Flow-battery cycling behaviour with HBr electrolyteon bothsides. Data collectedby cycling thecurrentat 0.2A cm22 at40 uC using a 2 M HBr1 0.5M Br2 solution on the positive side and a 2 MHBr1 0.1 M AQDS solution on the negative side; cell potential versus timeperformance is comparable to data in Fig. 2.
LETTER RESEARCH
Macmillan Publishers Limited. All rights reserved©2014
8/9/2019 nature12909(1)
http://slidepdf.com/reader/full/nature129091 16/16
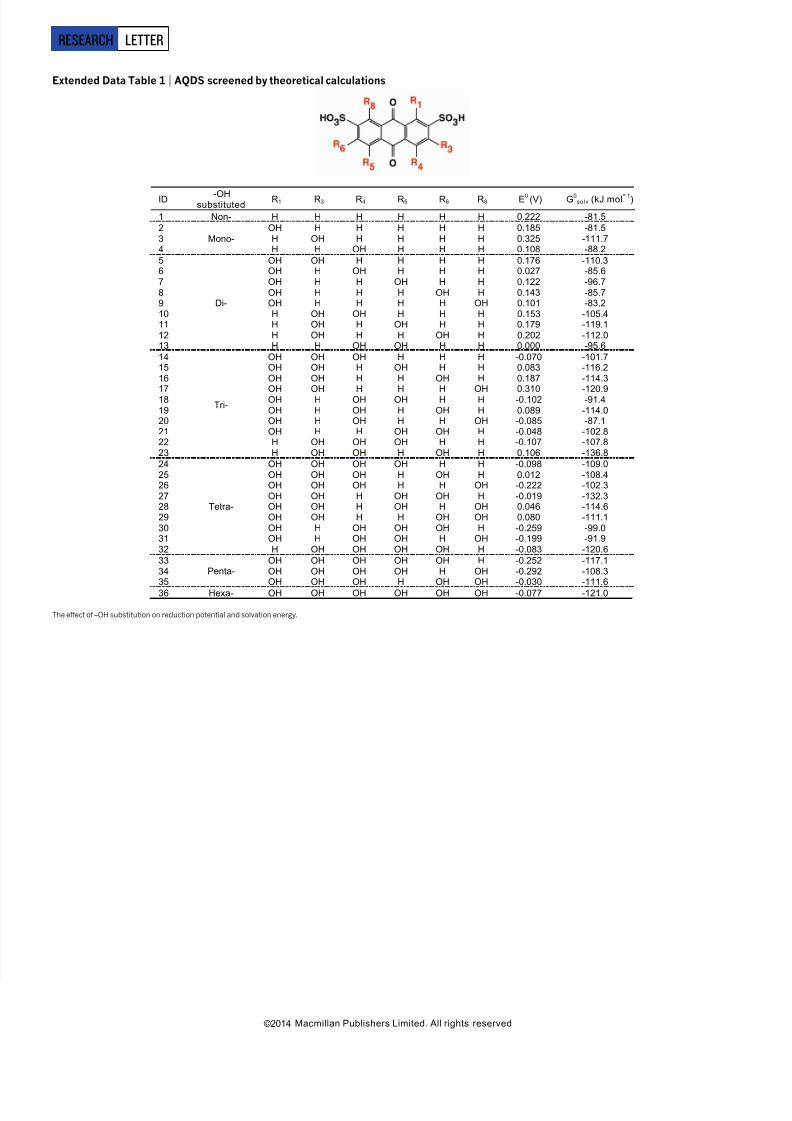
Extended Data Table 1 | AQDS screened by theoretical calculations
ID -OHsubstituted
R1 R3 R4 R5 R6 R8 E0 (V) G0solv (kJ mol 1)
1 Non- H H H H H H 0.222 -81.5
2 Mono-
OH H H H H H 0.185 -81.53 H OH H H H H 0.325 -111.74 H H OH H H H 0.108 -88.2
5
Di-
OH OH H H H H 0.176 -110.36 OH H OH H H H 0.027 -85.67 OH H H OH H H 0.122 -96.78 OH H H H OH H 0.143 -85.79 OH H H H H OH 0.101 -83.210 H OH OH H H H 0.153 -105.411 H OH H OH H H 0.179 -119.112 H OH H H OH H 0.202 -112.013 H H OH OH H H 0.000 -95.6
14
Tri-
OH OH OH H H H -0.070 -101.715 OH OH H OH H H 0.083 -116.216 OH OH H H OH H 0.187 -114.3
17 OH OH H H H OH 0.310 -120.918 OH H OH OH H H -0.102 -91.419 OH H OH H OH H 0.089 -114.020
OH H OH H H OH -0.085 -87.1
21 OH H H OH OH H -0.048 -102.822 H OH OH OH H H -0.107 -107.823 H OH OH H OH H 0.106 -136.8
24
Tetra-
OH OH OH OH H H -0.098 -109.025 OH OH OH H OH H 0.012 -108.426 OH OH OH H H OH -0.222 -102.327 OH OH H OH OH H -0.019 -132.328 OH OH H OH H OH 0.046 -114.629 OH OH H H OH OH 0.080 -111.130 OH H OH OH OH H -0.259 -99.031 OH H OH OH H OH -0.199 -91.932 H OH OH OH OH H -0.083 -120.6
33 Penta-
OH OH OH OH OH H -0.252 -117.134 OH OH OH OH H OH -0.292 -108.335 OH OH OH H OH OH -0.030 -111.6
36 Hexa- OH OH OH OH OH OH -0.077 -121.0
The effect of –OH substitution on reduction potential and solvation energy.
RESEARCH LETTER


![1 $SU VW (G +LWDFKL +HDOWKFDUH %XVLQHVV 8QLW 1 X ñ 1 … · 2020. 5. 26. · 1 1 1 1 1 x 1 1 , x _ y ] 1 1 1 1 1 1 ¢ 1 1 1 1 1 1 1 1 1 1 1 1 1 1 1 1 1 1 1 1 1 1 1 1 1 1 1 1 1 1](https://img.dokumen.tips/doc/110x75/5fbfc0fcc822f24c4706936b/1-su-vw-g-lwdfkl-hdowkfduh-xvlqhvv-8qlw-1-x-1-2020-5-26-1-1-1-1-1-x.jpg)
![1 1 1 1 1 1 1 ¢ 1 1 1 - pdfs.semanticscholar.org€¦ · 1 1 1 [ v . ] v 1 1 ¢ 1 1 1 1 ý y þ ï 1 1 1 ð 1 1 1 1 1 x](https://img.dokumen.tips/doc/110x75/5f7bc722cb31ab243d422a20/1-1-1-1-1-1-1-1-1-1-pdfs-1-1-1-v-v-1-1-1-1-1-1-y-1-1-1-.jpg)


![1 1 1 1 1 1 1 ¢ 1 , ¢ 1 1 1 , 1 1 1 1 ¡ 1 1 1 1 · 1 1 1 1 1 ] ð 1 1 w ï 1 x v w ^ 1 1 x w [ ^ \ w _ [ 1. 1 1 1 1 1 1 1 1 1 1 1 1 1 1 1 1 1 1 1 1 1 1 1 1 1 1 1 ð 1 ] û w ü](https://img.dokumen.tips/doc/110x75/5f40ff1754b8c6159c151d05/1-1-1-1-1-1-1-1-1-1-1-1-1-1-1-1-1-1-1-1-1-1-1-1-1-1-w-1-x-v.jpg)


![[XLS] · Web view1 1 1 2 3 1 1 2 2 1 1 1 1 1 1 2 1 1 1 1 1 1 2 1 1 1 1 2 2 3 5 1 1 1 1 34 1 1 1 1 1 1 1 1 1 1 240 2 1 1 1 1 1 2 1 3 1 1 2 1 2 5 1 1 1 1 8 1 1 2 1 1 1 1 2 2 1 1 1 1](https://img.dokumen.tips/doc/110x75/5ad1d2817f8b9a05208bfb6d/xls-view1-1-1-2-3-1-1-2-2-1-1-1-1-1-1-2-1-1-1-1-1-1-2-1-1-1-1-2-2-3-5-1-1-1-1.jpg)


![[XLS]fmism.univ-guelma.dzfmism.univ-guelma.dz/sites/default/files/le fond... · Web view1 1 1 1 1 1 1 1 1 1 1 1 1 1 1 1 1 1 1 1 1 1 1 1 1 1 1 1 1 1 1 1 1 1 1 1 1 1 1 1 1 1 1 1 1 1](https://img.dokumen.tips/doc/110x75/5b9d17e509d3f2194e8d827e/xlsfmismuniv-fond-web-view1-1-1-1-1-1-1-1-1-1-1-1-1-1-1-1-1-1-1-1-1-1.jpg)