Embed Size (px)
Citation preview

N A T U R E OF T H E A C T I O N C U R R E N T I N N I T E L L A
VI. SIMPLE AND COMPLEX ACTION PATTERNS
BY W. J. V. OSTERHOUT
(From the Laboratories of The Rockefeller Institute for Medical Research)
(Received for publication, April 15, 1946)
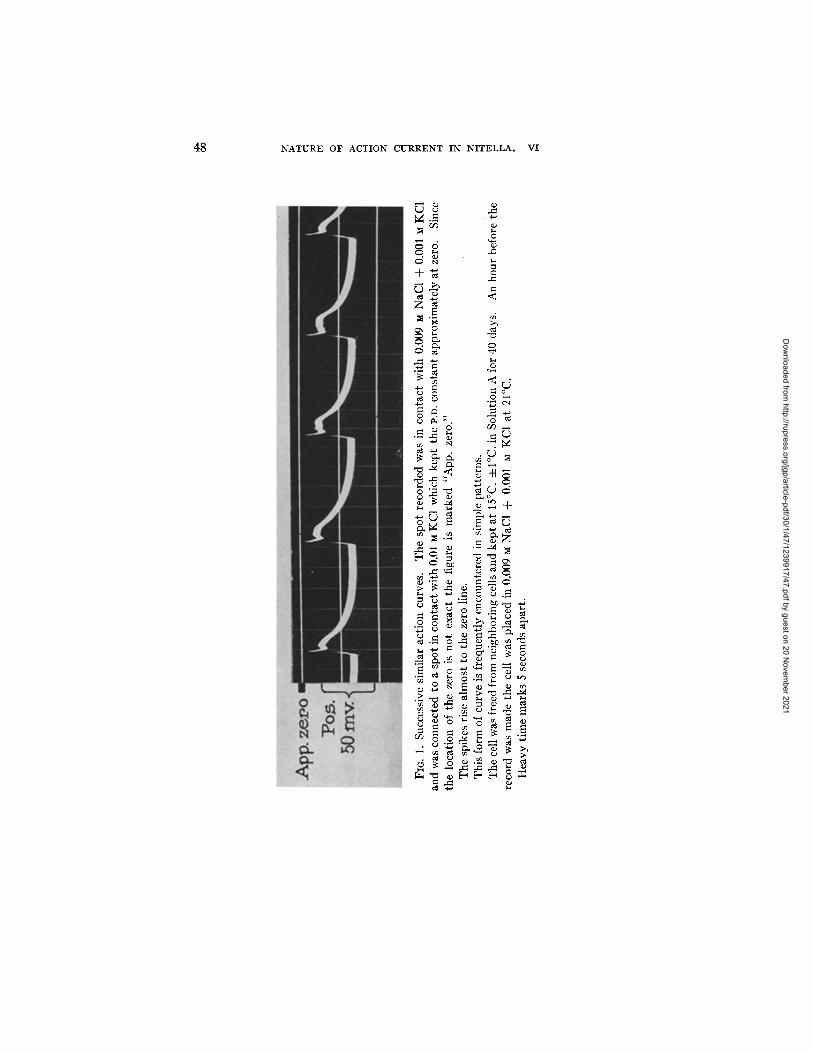
Successive action curves in Nitella may be almost or quite identical in which case the pattern may be called simple. Otherwise it may be regarded as complex.
A simple pat tern 1 is shown in Fig. 1. The nature of these action curves has been discussed in previous papers. 2, 3
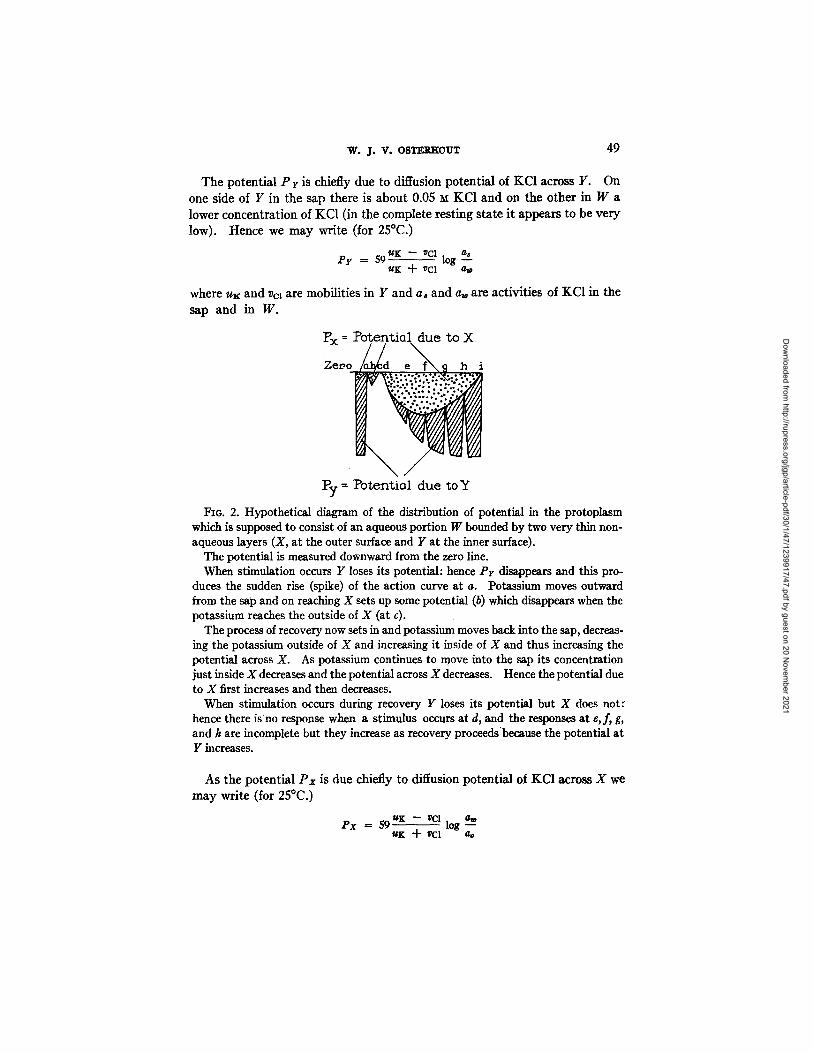
An example of a complex pat tern is seen in Fig. 2 which shows diagram- matically a series of changes in potential.*
These potentials appear to be chiefly diffusion potentials due to KC1 and for convenience the effect of other electrolytes may be neglected in the discussion.
There is a potential at the outer non-aqueous protoplasmic surface, X. This potential may be called Px. At the corresponding inner non-aqueous proto- plasmic surface, Y, there is a potential which ma y be called P ~. Between these two surfaces is the aqueous protoplasm, W.
1 The experiments were made on Nitella flexilis, Ag., using the technique described in former papers (Hill, S. E., and Osterhout, W. J. V., J. G,n. Physiol., 1937-38, 21, 541). Regarding the amplifier see the reference just cited. In all cases two spots were recorded which were connected to a spot at the end of the cell and any changes at the latter spot could be detected because they would cause simultaneous changes at the two recorded spots. In all cases the action curves are spontaneous; i.e., no stimu- lus is applied from without.
There was no indication of injury in these experiments. The cells, after being freed from neighboring cells, stood in the laboratory at 15°C.
+ 1°C. in Solution A (cf. Osterhout, W. J. V., and Hill, S. E., J. Gen. Physiol.. 1933-34, 17, 87) for several days. They belonged to Lot B (cf. Hill,.S.E., and Osterhout, W. J. V., Proc. Nat. Acad. Sc., 1938, 24, 312).
20sterhout, W. J. V., J. Gen. Physiol., 1934-35, 18, 215; 1943-44, 27, 61. Hill, S. E., and Osterhout, W. J. V., J. Gen. Physiol., 1934-35, 18, 377; 1938-39, 29., 91. Osterhout, W. J. V., and Hill, S. E., J. Gen. Physiol., 1934-35, 18, 499.
s This form of action curve is frequently encountered in simple patterns. The quick action curves seen in the remaining figures in this paper are observed during recovery when there is as a rule more KC1 in W than when recovery is complete. This increased amount of electrolyte in W probably tends to promote quick action curves as we find that soaking the cell in 0.01 ~t NaC1 and in other salts tends to produce quick action currents. Cf. Hill, S. E., and Osterhout, W. J. V., J. Gen. Physiol., 1938-39, 22, 91. Osterhout, W. J. V., J. Gen. Physiol., 1942-43, 9.6, 65.
4 Regarding this see Osterhout, W. J. V., J. Get~. Physiol., 1943-44, 27, 61.
47
The Journal of General Physiology
Dow
nloaded from http://rupress.org/jgp/article-pdf/30/1/47/1239917/47.pdf by guest on 20 N
ovember 2021
48 NATURE OF ACTION CURRENT IN N I T E L L A . VI
0
~ d "S
+ ~
~ 8 o. , - ,
o=,=i =~ .,..,
~ •
~. , . , . , - , = o ~ . ~
" ~ . ~ . ~ ~ ~ ~,.~ ~
~" N > .-a ,..= ,.~ • ~ 7 ~ =,~ ~ ~ ~ o ' ~ ' - ~ ~ ~
~ - s . ~ o ---g d ~ o ~ , . = . . . =
Dow
nloaded from http://rupress.org/jgp/article-pdf/30/1/47/1239917/47.pdf by guest on 20 N
ovember 2021
w..L v . OSTEKHOUT 49
The potential P r is chiefly due to diffusion potential of KC1 across Y. On one side of Y in the sap there is about 0.05 g KC1 and on the other in W a lower concentration of KC1 (in the complete resting state it appears to be very low). Hence we m a y write (for 25°C.)
Py = 59UK -- ~Cl log a_~s UK ~ vC1
where ux and Vcl are mobilities in Y and a , and a~ are activities of KCI in the sap and in W.
l~x = Potential due to X
Zero ~ J d e x ~ f o ~ i L ~ . ~ e f~N9 h 1
P y = P o t e n t i a l d u e to Y
FIo. 2. Hypothetical diagram of the distribution of potential in the protoplasm which is supposed to consist of an aqueous portion W bounded by two very thin non- aqueous layers (X, at the outer surface and Y at the inner surface).
The potential is measured downward from the zero line. When stimulation occurs Y loses its potential: hence P r disappears and this pro-
duces the sudden rise (spike) of the action curve at a. Potassium moves outward from the sap and on reaching X sets up some potential (b) which disappears when the potassium reaches the outside of X (at c).
The process of recovery now sets in and potassium moves back into the sap, decreas- ing the potassium outside of X and increasing it inside of X and thus increasing the potential across X. As potassium continues to move into the sap its concentration just inside X decreases and the potential across X decreases. Hence the potential due to X first increases and then decreases.
When stimulation occurs during recovery Y loses its potential but X does not: hence there isno response when a stimulus occurs at d, and the responses at e,f, g, and h are incomplete but they increase as recovery proceedsbecause the potential at Y increases.
As the potential P x is due chiefly to diffusion potential of KC1 across X we m a y write (for 25°C.)
Px ffi 59UK -- vCl log aw UK "4- vCl ao
Dow
nloaded from http://rupress.org/jgp/article-pdf/30/1/47/1239917/47.pdf by guest on 20 N
ovember 2021
5O N A T U R E O ~ ACTION C U R R E N T IN N I T E L L A . VI
where u• and Vcl are mobil i t ies in X and aw and ao are act ivi t ies of KCl in W and in the outside solution.
The experiments indicate tha t when a st imulus arrives P r disappears bu t P x is not a t once affected3 Hence we m a y say tha t if the to ta l potent ia l , P x + P r, in the resting state , is 100 inv. and the rise of the act ion curve is 99 mv. (s topping 1 inv. short of reaching the zero line) i t means tha t P v = 99 inv. and P x = 1 inv. We find, as a rule, t ha t the value of P x in the complete resting s ta te is ve ry small3
The disappearance of P r might be due to physical changes including ac tua l rupture of Y under electr icaF or mechanical pressure, s or i t might be due to a l tera t ion of mobili t ies 9 in Y as the result of chemical change. I f rupture of Y occurs the value of UK - - VC~ becomes equal to tha t in water.
As the result of s t imulat ion Y appears to become much more permeable as indica ted b y the great increase in the conduct iv i ty 1° of the pro toplasm and apparen t ly K + moves from the sap into W. n When the outward ly moving K + reaches X it sets up a potent ia l TM (b, Fig. 2) which soon falls off as K + moves
5 When the external concentration of KC1 is gradually raised an action current may occur which causes the disappearance of P r while Px remains unaffected. Cf. Hill, S. E., and Osterhout, W. J. V., J. Gen. Physiol., 1937-38, 21, 541.
60sterhout, W. J. V., J. Gen. Physiol., 1944-45, 28, 23. If we assume that Y is 0.01 micron in thickness the electrical pressure across Y may
amount to 20,000 volts per ram. Cf. Osterhout, W. J. V., J. Gen. Physiol., 1934-35, 18, 221 (footnote 21).
8 Regarding mechanical effects see Osterhout, W. J. V., and Harris, E. S., J. Gen. Physiol., 1927-28, 11, 673. Osterhout, W. J. V., and Hill, S. E., J. Gen. Physiol., 1934-35, 18, 369.
9 Changes in mobilities can be produced by organic substances. Osterhout, W. J. V., J. Gen. Physiol., 1938-39, 22,417; 1939-40, 23, 171,569, 749.
l0 Blinks, L. R., J. Gen. Physiol., 1936--37, 20, 229. Cole, K. S., and Curtis, H. J., J. Gen. Physiol., 1938-39, 22, 37.
n If there is an actual rupture of Y it is evident that KC1 may pass outward freely. If there is no rupture we may assume that K + and C1- combine at the surface of X or of Y to form molecules which pass through in molecular form and dissociate on the other
side. This seems probable since X and Y are non-aqueous substances immiscible with water in which KC1 probably has a low dissociation constant owing to the lower dielectric constant of X and Y. Cf. Osterhout, W. J .V., Some models of protoplas- mic surfaces, in Cold Spring Harbor Symposia on Quantitative Biology, Cold Spring Harbor, Long Island Biological Association, 1940, 8, 51 ; J. Gen. Physiol., 1942-43, 26, 293,
12 This can be true only if X is sensitive to K + (i.e., if UK + VCl has a fairly high value in X). If X can be made insensitive to K + the second peak in Fig. 2 should not appear. This can be brought about experimentally. Cf. Osterhout, W. J. V., and Hill, S. E., J. Gen. Physiol., 1939-40, 23, 743.
(Footnote continued on following page)
Dow
nloaded from http://rupress.org/jgp/article-pdf/30/1/47/1239917/47.pdf by guest on 20 N
ovember 2021
w. J. v. OSTER~OUT 51
out through X so tha t the ac t iv i ty gradient of K + across X disappears (Fig. 2, c). Then potass ium begins to move back into the sap under the influence of the forces which normal ly cause potass ium to enter the cell from without and reach a higher concentrat ion in the sap than in the external solution. This does not necessari ly increase the concentrat ion of K + in W bu t i t first of all lessens the concentra t ion of K + jus t outside X and this sets up an ou tward ly di rec ted ac t iv i ty gradient of K across X and thus 13 bui lds up P x (c to f ) . As potass ium continues to move into the sap the ac t iv i ty of K + jus t inside X falls off and in consequence P x falls off ( f to i). I n the meant ime P r increases s teadi ly as potass ium moves from W into the sap thus increasing the ou tward ly di rected ac t iv i ty gradient of K + across Y.
A st imulus arr iving a t d can produce no response because the value of P r is then zero.
A st imulus arr iving at e causes a loss of P r bu t the response is small because a t t ha t t ime the value of P r is small. As P r increases the responses increase accordingly.
The experiments indicate tha t in the complete resting s ta te P x is ve ry small and P r is about 100 my. In X the value of uK m a y be much greater than t ha t of vcl so tha t we may have uK -- Vcx -- 40 or more ~4 and the s i tuat ion is not very different in Y, for in the chain
S a p [ X [ W [ r l S a p
there is an inwardly di rected poten t ia l of about 16 my. which indicates tha t the difference between X and Y is not ve ry great.
When s t imulat ion occurs X appears to suffer l i t t le or no change bu t Y be- comes very permeable and the value of UK + VC~ presumably decreases. Dur- ing recovery Y regains i ts former s ta te bu t unt i l recovery is complete u~ -- vct m a y be greater in X than in Y.
I n some figures in this paper the curve does not re turn to the complete resting level af ter the ini t ial spike bu t remains a t a higher level which m a y be called the incomplete resting state. Here the value of u~: - - Vc~ in Y m a y be less than in the complete resting state. In tha t case the value of P r may be less than normal even if the concentra t ion of K + in W falls to the normal value as potass ium moves back from W into the sap.
The converse of this is seen in Chara where normally the second peak is absent be- cause X is insensitive t o K +. But when it is made sensitive to K + by means of guanidine the second peak appears. Cf. Osterhout, W. J. V., and Hill, S. E., J. Gen. Physiol., 1940-41, 24, 9.
If recovery sets in before potassium diffuses out through X there will be no second peak: this is seen in several of the later figures.
13 Here potassium enters against the gradient and K + presumably becomes less outside X than inside. Cf. Osterhout, W. J. V., J. Gen. Physiol., 1932-33, 16, 157.
14 Osterhout, W. J. V., J. Gen. Physiol., 1929-30, 13, 715.
Dow
nloaded from http://rupress.org/jgp/article-pdf/30/1/47/1239917/47.pdf by guest on 20 N
ovember 2021

52 NATURE OF ACTION CURRENT IN N I T E L L A . VI
I t follows tha t al though we know the value of P r which is equal to the magni tude of the action curve (assuming tha t this involves the to ta l loss of P v) we cannot tell precisely the concentration of K + in W when the concentra- t ion of K + in the sap is known because the value of uK + ~'ct in Y is uncer ta in unless Y is similar to X, as is approximate ly true in the complete resting state.
A be t te r es t imate of the concentrat ion of K + in W could be made from the value of P x which depends on the outward ly directed ac t iv i ty gradient of K + across X, bu t with rapid action currents we cannot be sure of the concentrat ion of KC1 just outside X since some KC1 may pass out through X which does not a t once return to W. There may be var ia t ion in the value of P x which is measured as the distance from the zero line to the top of the act ion curve, as in Fig. 2.
I t follows tha t we may not be able to make a precise es t imate of the concen- t ra t ion of K + in W. But we may say tha t the rise of the act ion curve probably signifies a movement of K + from the sap into W and the fall of the act ion curve is accompanied by a movement of K + from W into the sap al though these movements might theoret ical ly be due to changes in the value of uK + ~'cl in Y wi thout any movement of K +.
If K + were uniformly dis t r ibuted throughout W and if X and Y were closely similar we might assume tha t the effect of K + in W would be equal and opposite in X and Y and hence would cancel out. Hence the presence of K + in W would affect P x - - P Y but not P x + P r. In tha t case the value of P x + P v would depend on the value of uK -- vcl in X and in Y and on the ac t iv i ty of KC1 in the sap and in the solution just outside X and would be independent of the concentrat ion of K + in W.
Hence when the base line, corresponding to the resting state, rises we m a y a t t r ibu te i t to an increase in the concentrat ion of KC1 just outside X or to a decrease in the value of uI~ -- rcl in Y, since the concentrat ion of KC1 in the sap is probably not subject to much variat ion. (But the rise of the base line might in some cases be due to a higher concentrat ion of K + in W in the region adjoining Y.)
In Fig. 2 there is a s teady increase in the magni tude of the successive act ion curves corresponding to an order ly progress of the process of recovery whereby K + in W decreases regularly as K + moves from W into the sap. But each t ime a st imulus arrives during recovery some K + moves from the sap into W thus giving oppor tun i ty for dis turbances in the process of recovery. Such dis turbances take various forms, as will appear in the following pages. (See especial ly Figs. 3, 7, 9, and 11.)
In Fig. 2 there is s teady increase in P y bu t in Fig. 3 the increase is irregular. This might be explained on the ground tha t the re turn of K + to the sap during recovery does not progress in orderly fashion as in Fig. 2 bu t is rendered irregu- lar by the movement of K + from the sap into W which takes place at each s t imulat ion.
Dow
nloaded from http://rupress.org/jgp/article-pdf/30/1/47/1239917/47.pdf by guest on 20 N
ovember 2021

W. J. V. OSTERHOUT 53
In Fig. 4 there is a steady increase in Px and a corresponding decrease in P r
and the action curve declines in magnitude. We may assume that Px and
FIG. 3. Resembles Fig. 2 but the partial responses first increase and then decrease. The recorded spot was in contact with 0.005 M NaC1 + 0.0025 M CaCI2. I t was
connected with a spot in contact with 0.01 M KC1 which kept the P.9. constant approxi- mately at zero.
The cell was freed from neighboring cells and kept in Solution A for 30 days at 15°C. 4-1°C. About an hour before the record was made it was placed in 0.01 za NaC1 at 22°C.
Time marks 5 seconds apart. Cf. Osterhout, W. J. V., J. Gen. Physiol., 1943-44, 27, 61 (Fig. 2).
FIG. 4. Shows a regular increase in the potential at the outer protoplasmic surface and decrease in the magnitude of the action curve. For explanation see Fig. 5.
The recorded spot was in contact with 0.01 ~ ammonium acetate at pH 7. I t was connected with another spot in contact with 0.01 M ammonium acetate.
The cell was freed from neighboring cells and kept in Solution A at 15°C. 4- I°C. for 29 days. Half an hour before the record was made the cell was placed in 0.01 M ammonium acetate at 22°C.
Time marks 5 seconds apart.
P r change as shown in Fig. 5. This behavior might be accounted for on the
ground tha t after each action current the return of K + to the sap is incomplete
so that the concentration of K + in W steadily increases.
Dow
nloaded from http://rupress.org/jgp/article-pdf/30/1/47/1239917/47.pdf by guest on 20 N
ovember 2021
54 NATURE OF ACTION CURRENT IN NITELLA. VI
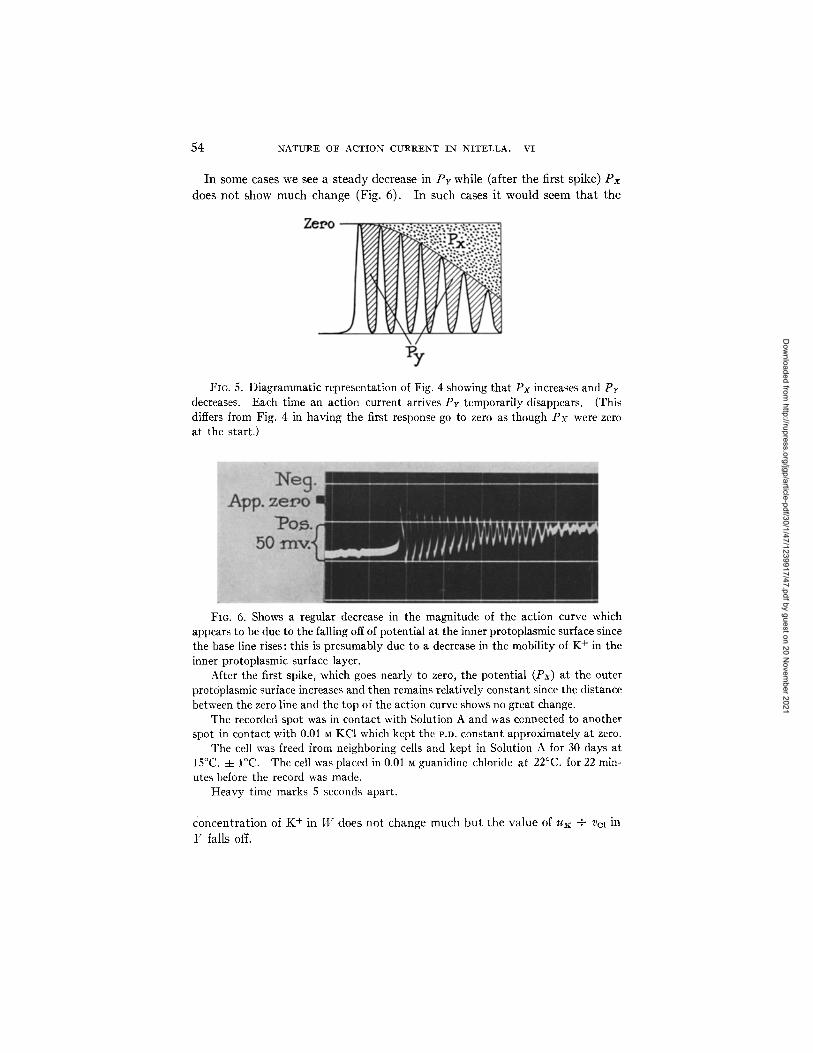
In some cases we see a s t eady decrease in P r while (after the first spike) P x
does no t show much change (Fig. 6). I n such cases it would seem t h a t the
FIO. 5. Diagrammatic representation of Fig. 4 showing that Px increases and Pr decreases. Each time an action current arrives Py temporarily disappears. (This differs from Fig. 4 in having the first response go to zero as though Px were zero at the start.)
FIG. 6. Shows a regular decrease in the magnitude of the action curve which appears to be due to the falling off of potential at the inner protoplasmic surface since the base line rises: this is presumably due to a decrease in the mobility of K + in the inner protoplasmic surface layer.
After the first spike, which goes nearly to zero, the potential (Px) at the outer protoplasmic surface increases and then remains relatively constant since the distance between the zero line and the top of the action curve shows no great change.
The recorded spot was in contact with Solution A and was connected to another spot in contact with 0.01 M KC1 which kept the I'.D. constant approximately at zero.
The cell was freed from neighboring cells and kept in Solution A for 30 days at 15°C. 4- I°C. The cell was placed in 0.01 • guanidine chloride at 22°C. for 22 min- utes before the record was made.
Heavy time marks 5 seconds apart.
concen t ra t ion of K + in W does n o t change much bu t the va lue of uK + V(~l in
Y falls off.
Dow
nloaded from http://rupress.org/jgp/article-pdf/30/1/47/1239917/47.pdf by guest on 20 N
ovember 2021

w. J. v. OST~R_nOVT 55
In other cases (Fig. 7) there is a s teady increase in the magni tude of the act ion curve such as we see in Fig. 2 (p. 49). This is followed by a s teady decrease of Pr while Px does not change much: the l a t t e r pa r t of the pa t t e rn re- sembles Fig. 6.
In Fig. 8 the magni tude of the act ion curve soon becomes approx imate ly constant , indicat ing a relat ively constant value of P r in the resting state. This m a y cont inue for several minutes .
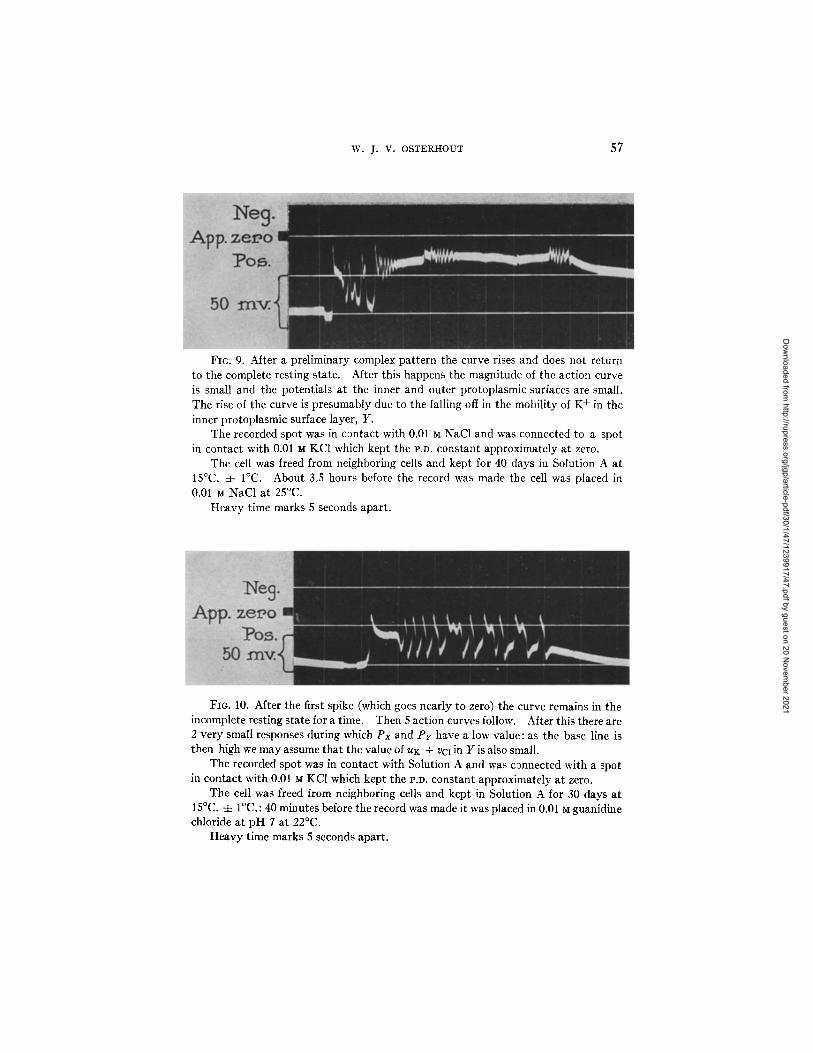
Fig. 9 presents an interest ing case where after a complex pa t t e rn the curve rises and does not re turn to the complete resting s ta te : af ter this it is evident t ha t Px remains small since the distance between the zero line and the top of the act ion curve is small, and P r is also small as shown by the magni tude of the
FIG. 7. After the first spike (which goes nearly to zero) there is a decrease and then a gradual increase in the magnitude of the action curve as in Fig. 2. This is followed by a gradual decrease in magnitude during which the potential at the outer protoplasmic surface shows little change. Since the base line rises we may assume that the mobility of K + in the inner protoplasmic surface falls off, as in Fig. 6.
The recorded spot was in contact with 0.01 ~ NaC1 and was connected to another spot in contact with 0.01 • KC1 which kept the P.9. constant approximately at zero.
The cell was freed from neighboring cells and kept in Solution A for 40 days at 15°C. 4- I°C. An hour before the record was made the cell was placed in 0.01 NaC1 at 25°C.
Time marks 5 seconds apart.
act ion curve. The rise of the base line is p resumably to be explained in the same manner as in Fig. 6.
I n Fig. 10 the curve af ter the first spike fails to re turn at once to the complete resting state, bu t in a short t ime there are 5 action curves and then 2 very small responses during which P r has a low value. Since Px also has a low value we cannot ascribe the low value of Pr to the presence of K + in W but we may assume tha t the mobi l i ty of K + in Y is re la t ively small.
Some addi t ional features of these curves call for comment. I t will be ob- served tha t the double peak seen in Figs. 1 and 2 is lacking in some of the slow act ion curves and in all of the quick act ion curves. This is to be expected if
Dow
nloaded from http://rupress.org/jgp/article-pdf/30/1/47/1239917/47.pdf by guest on 20 N
ovember 2021

56 N A T U R E O F A C T I O N C U R R E N T I N N I T E L L A . V I
~ o ~ o d
~ _ ~ g o = ° d © ~ tt)
. g o = ~
.~-~ o ~ m ° ~
. ~ . ~
Dow
nloaded from http://rupress.org/jgp/article-pdf/30/1/47/1239917/47.pdf by guest on 20 N
ovember 2021
W. 7" V. OSTERHOUT 57
FIG. 9. After a preliminary complex pattern the curve rises and does not return to the complete resting state. After this happens the magnitude of the action curve is small and the potentials at the inner and outer protoplasmic surfaces are small. The rise of the curve is presumably due to the falling off in the mobility of K + in the inner protoplasmic surface layer, Y.
The recorded spot was in contact with 0.01 M NaC1 and was connected to a spot in contact with 0.01 M KC1 which kept the l'.D. constant approximately at zero.
The cell was freed from neighboring cells and kept for 40 days in Solution A at 15°C. 4- I°C. About 3.5 hours before the record was made the cell was placed in 0.01 M NaC1 at 25°C.
Heavy time marks 5 seconds apart.
FIG. 10. After the first spike (which goes nearly to zero) the curve remains in the incomplete resting state for a time. Then 5 action curves follow. After this there are 2 very small responses during which Px and P r have a low value: as the base line is then high we may assume that the value of uK + VCl in Y is also small.
The recorded spot was in contact with Solution A and was c~nnected with a spot in contact with 0.01 M KC1 which kept the P.D. constant approximately at zero.
The cell was freed from neighboring cells and kept in Solution A for 30 days at 15°C. 4- I°C.: 40 minutes before the record was made it was placed in 0.01 M guanidine chloride at pH 7 at 22°C.
Heavy time marks 5 seconds apart.
Dow
nloaded from http://rupress.org/jgp/article-pdf/30/1/47/1239917/47.pdf by guest on 20 N
ovember 2021

58 NATURE OF ACTION CURRENT IN NITELLA. VI
recovery sets in and potass ium begins to move back into the sap before potas- sium has t ime to diffuse out through X. 15
If we assume tha t the all-or-none law holds and tha t each st imulus causes a complete disappearance of P r we must likewise assume tha t in some cases rapid changes take place in P x (as shown by the distance between the top of the act ion curve and the zero line) as well as in the value of P r in the resting state . A good example of this is seen in Fig. 11. Here we see tha t an act ion curve which goes near ly to zero is regularly followed by 2 responses of small magni tude. This might be explained on the ground tha t after each full re- sponse the movement of K + from W into the sap is too slow to increase the
FIG. 11. Shows rapid changes in the potential at the outer protoplasmic surface and in the magnitude of the action curve. A complete response (which goes nearly to zero) is followed by 2 incomplete responses: the latter are presumably due to in- complete recovery.
The recorded spot was in contact with 0.01 M NaC1 and was connected with a spot in contact with 0.01 M KC1 which kept the P.D. constant approximately at zero.
The cell was freed from neighboring cells and kept in Solution A for 30 days at 15°C. 4- I°C. About an hour before the record was made the cell was placed in 0.01 ~t NaC1 at 22°C.
Heavy time marks 5 seconds apart. Cf. Osterhout, W. J. V., J. Gen. Physiol., 1943-44, 27, 61 (Figs. 1 and 2).
value of P r (and decrease the value of Px) sufficiently to permi t a full response during the next 2 stimuli. 16 A more gradual change of this sort is seen in Fig. 4.
An a l ternat ive explanat ion would be tha t the incomplete responses are due to incomplete disappearance of P r. On this basis we should not have to assume such rapid changes in the concentrat ion of K + in W and correspond- ingly rapid changes in Px .
I t is evident tha t the act ion currents of Nitella vary much more than those of such highly specialized cells as muscle and nerve which give s te reo typed re- sponses. The var ia t ions found in Nitella are largely due to irregularit ies in the process of recovery. These in turn depend on lack of uni formity in the move-
15 Cf. Osterhout, W. J. V., J. Gen. Physiol., 1943-44, 27, 61. 16 Cf. Osterhout, W. J. V., and Hill, S. E., J. Gen. Physiol., 1938-39, 22, 115.
Osterhout, W. J. V., J. Gen. Physiol., 1942-43, 26, 457.
Dow
nloaded from http://rupress.org/jgp/article-pdf/30/1/47/1239917/47.pdf by guest on 20 N
ovember 2021

w . J. v . OST~.P.HOUT 59
ments of potassium and on changes in the mobility of ions in the non-aqueous protoplasmic surfaces: it seems probable that such changes in mobility can be produced by metabolism since they can be brought about by organic sub- stances. ~ These variations occur chiefly in connection with quick action currents brought about by previous treatment with such reagents as NaCI TM
and guanidine. ~9 I t seems possible that these reagents act by increasing the conductivity of W. Untreated cells usually give simple action patterns with slow recovery, such as we see in Fig. 1.
The situation in Nitella suggests that here is an excellent opportunity for the experimental control of the action current.
SUMMARY
The experiments indicate that the protoplasm of Nitdla consists of an aque- ous layer W with an outer non-aqueous surface layer X and an inner non- aqueous surface layer Y.
The potential at Y is measured by the magnitude of the action curve and the potential at X by the distance from the top of the action curve to the zero line. These potentials appear to be due chiefly to diffusion potentials caused by the activity gradients of KC1 across the non-aqueous layers X and Y. The rela- tive mobilities of K + and C1- in X and in Y can be computed and an estimate of the activity of KC1 in W can be made. In the complete resting state the mobilities of K + and C1- in X are not very different from those in Y.
The action curve is due to changes in Y which suddenly becomesveryperme- able, allowing potassium to move from the sap across Y into W, and thus losing its potential. A gradual loss may be due to changes in ionic mobility in Y.
When recovery is incomplete and Y has not yet regained its normal potential a stimulus may cause a loss of the potential at Y giving an action curve of small magnitude. The magnitude may vary in successive action curves giving what is called a complex pattern in contrast to the simple pattern observed when recovery is complete and all the action curves are alike. Complex pat- terns occur chiefly in ceils treated with reagents. Untreated cells usually give simple patterns.
A variety of complex action patterns is discussed. I t is evident that the cells of Nitdla show much more variation than such highly specialized cells as muscle and nerve which give stereotyped responses.
In some cases it may be doubtful whether the all-or-none law holds.
1~ Osterhout, W. J. V., and Hill,'S. E., Proc. Nat. Acad. So., 1938, 24, 427. Oster- hout, W. J. V., J. Got. Physiol., 1938--39, 22, 417; 1939-40, 9.3, 171, 569, 749.
is Hill, S. E., and Osterhout, W. J. V., J. Got. Physiol., 1938-39, 29., 91. 1~ Osterhout, W. J. V., J. Got. Physiol., 1942--43, 26, 65. Osterhout, W. J. V., and
Hill, S. E., Some ways to control bioelectrical behavior, in Cold Spring Harbor Sym- posia on Quantitative Biology, Cold Spring Harbor, Long Island Biological Associa- tion, 1936, 4, 43.
Dow
nloaded from http://rupress.org/jgp/article-pdf/30/1/47/1239917/47.pdf by guest on 20 N
ovember 2021