Embed Size (px)
Citation preview
Nature Biotechnology: doi:10.1038/nbt.3828
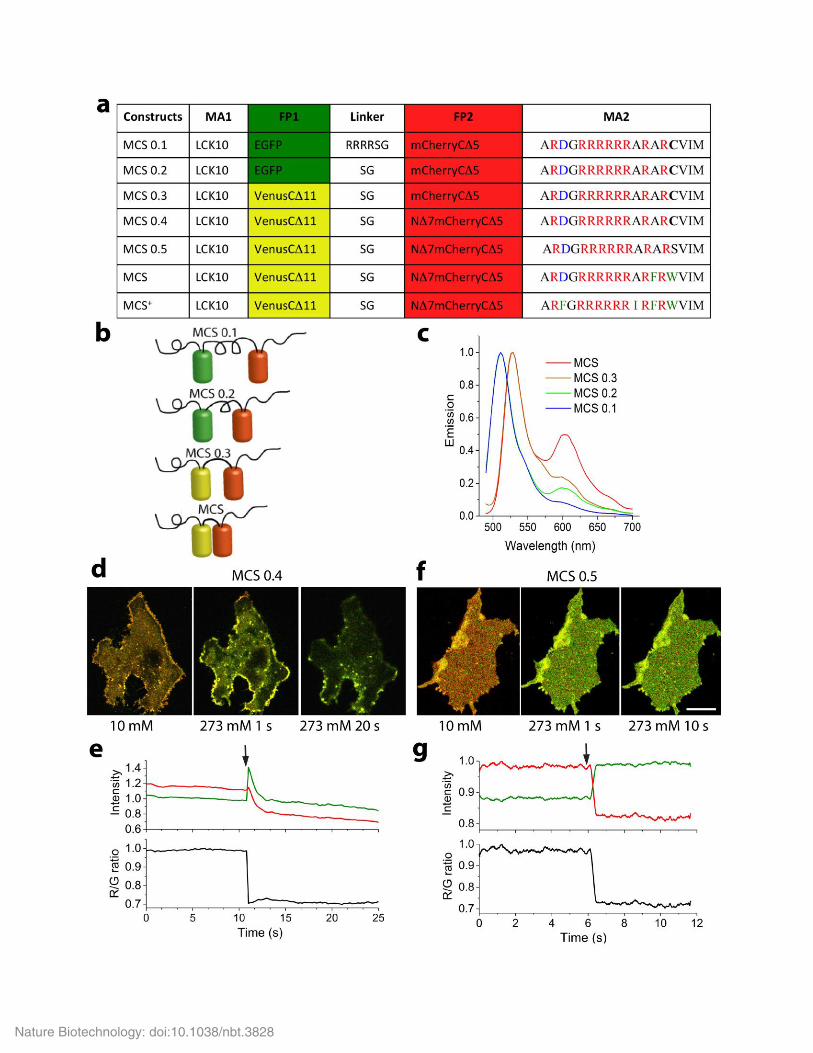
Supplementary Figure 1
Development of a FRET-based MCS.
(a) Linker and MA2 modification are indicated by single letter amino acid code. indicates deletion of amino acids and N or C indicate the
terminus where the amino acids were deleted from. Negatively charged amino acids are highlighted in blue, positively charged amino acids in
red, hydrophobic residues in green and farnesylated residues are marked with C. Lck10 is the first 10 amino acid sequence of tyrosine kinase
Lck. (b-c). Schematic drawings (b) and emission spectra (c) of MCS 0.1, MCS 0.2 MCS 0.3 and MCS. The emission spectra were averaged over
50 cells. (d-g) Membrane association (d, f) and change in donor (green) and acceptor (red) intensity and FRET efficiency (R/G ratio, black, e, g)
when ionic strength was changed from 10 mM to 275 mM (indicated by arrows) in membrane lawns containing MCS 0.4 (d-e) and MCS 0.5 (f-
g). Please note that MCS 0.4 (and previous versions) partially dissociated from the plasma membrane at high ionic strength, resulting in a 49 ±
10% decrease in total donor and acceptor intensity. When the farnesylated cysteine residue at the C-terminus was removed, MCS 0.5 (and
subsequent versions) remained at the plasma membrane even when exposed to high ionic strength solutions. Scale bar in d and f = 5 µm. Data
are representative of n = 10 independent experiments.
Nature Biotechnology: doi:10.1038/nbt.3828
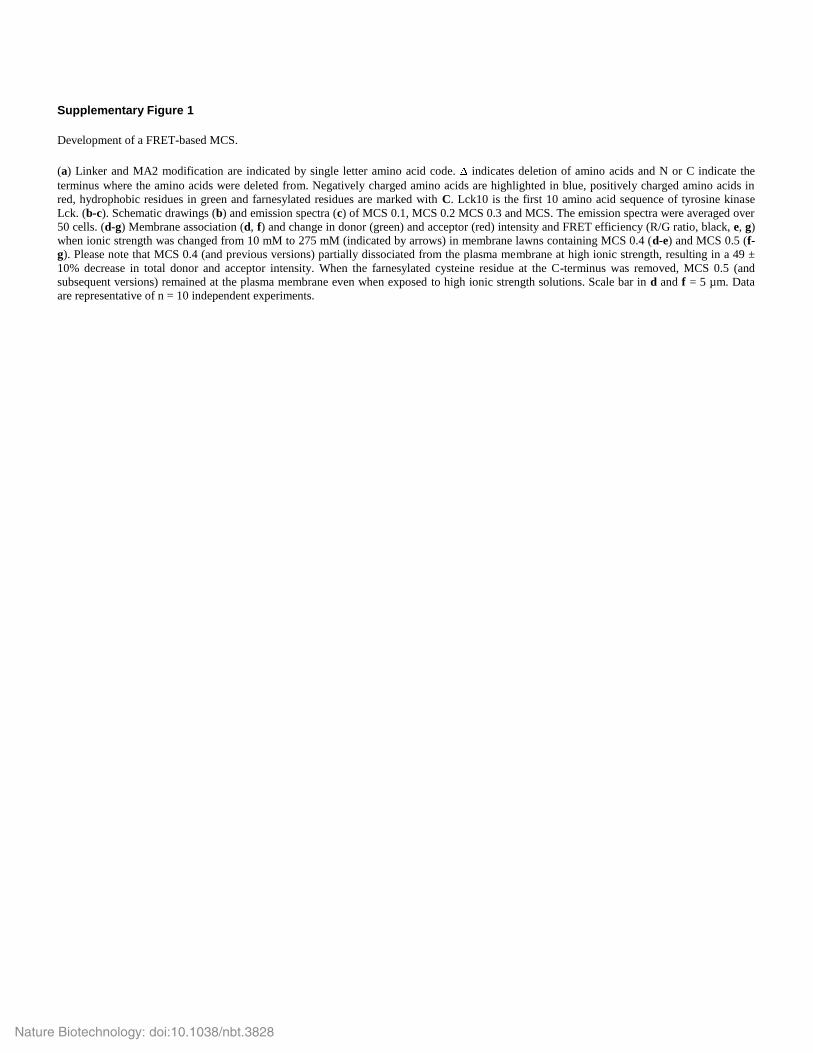
Supplementary Figure 2
Membrane association of MCS R-pre only, MCS Lck only, MCS 0.4 and MCS during ionomyocin-induced Ca2+ influx.
(a-d) Intensity line profile across HeLa cells that expressed MCS R-Pre only (a), MCS Lck only (b), MCS 0.4 (c) and MCS (d) 0 s (black line),
100 s (red line) and 200 s (blue line) after treatment with 3 μM ionomycin to induce Ca2+ flux. Note MCS R-Pre only that lacks the hydrophobic
membrane anchor unit (MA1 in Fig. 1) completely detached from membrane. MCS 0.4 partially detached due to farnesylation (Supplementary
Fig. 1). MCS Lck only and MCS remained attached to plasma membrane. Data are representative of n = 5 independent experiments.
Nature Biotechnology: doi:10.1038/nbt.3828

Supplementary Figure 3
FRET readout of MCS during ionic titration.
(a) Change of donor (green) and acceptor (red) fluorescence and normalized donor/acceptor fluorescence (R/G) ratio as a function of ionic
strength from 10 mM to 400 mM in membrane lawns containing MCS. Measurements were taken at equilibrium for each ionic strength. The R/G
ratios were normalized to the maxima. (b) Emission spectra of MCS at the indicated ionic strength values. Data in a-b are representative of n = 7
independent replicates. (c) Merged donor (green) and acceptor (red) intensity image. Two membrane sheets (highlighted by dashed lines) were
compared with non-photobleached acceptor in the region of interest (ROI) 1 and photobleached acceptor in ROI 2. Scale bar = 5 μm (d) Donor
(green) and acceptor (red) intensity and R/G ratio profile for ROI 1 and ROI 2 in (c) following the exchange of ionic strength from 10 mM to 275
mM. Note that acceptor photobleached ROI2 did not exhibit an increase of donor fluorescence as observed in ROI1, suggesting the increase of
donor fluorescence in ROI1 was due to FRET. Data are representative of n = 3 independent experiments.
Nature Biotechnology: doi:10.1038/nbt.3828
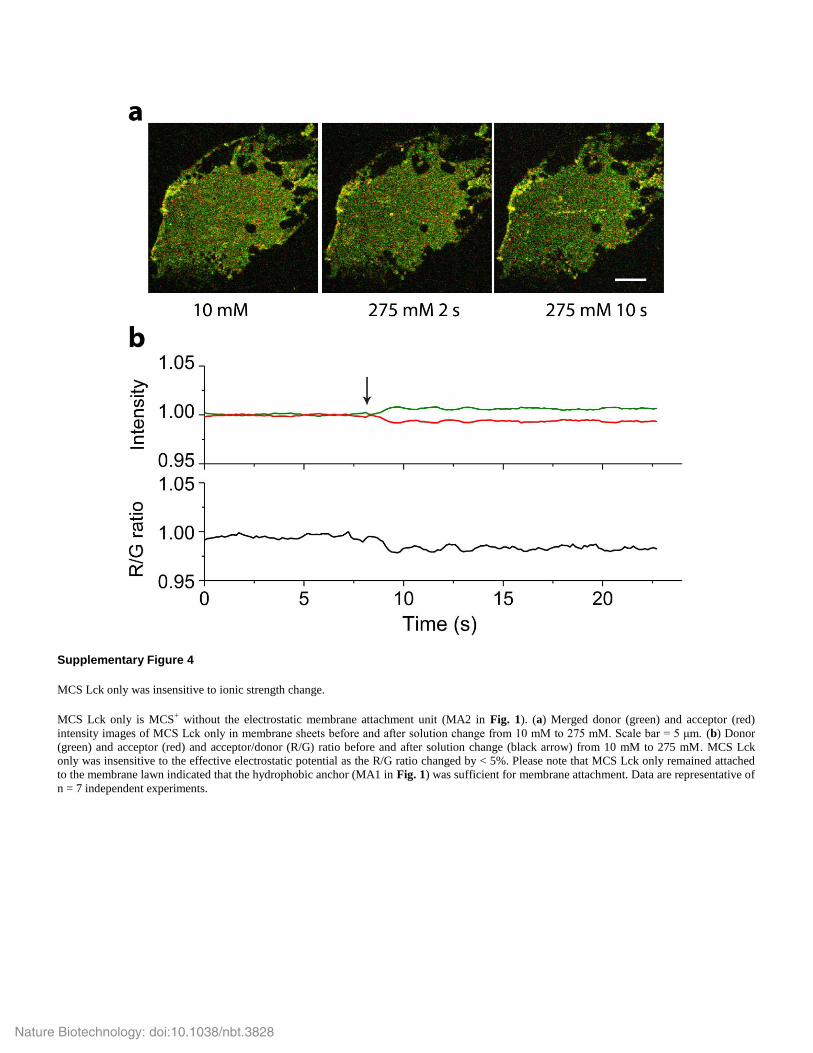
Supplementary Figure 4
MCS Lck only was insensitive to ionic strength change.
MCS Lck only is MCS+ without the electrostatic membrane attachment unit (MA2 in Fig. 1). (a) Merged donor (green) and acceptor (red)
intensity images of MCS Lck only in membrane sheets before and after solution change from 10 mM to 275 mM. Scale bar = 5 μm. (b) Donor
(green) and acceptor (red) and acceptor/donor (R/G) ratio before and after solution change (black arrow) from 10 mM to 275 mM. MCS Lck
only was insensitive to the effective electrostatic potential as the R/G ratio changed by < 5%. Please note that MCS Lck only remained attached
to the membrane lawn indicated that the hydrophobic anchor (MA1 in Fig. 1) was sufficient for membrane attachment. Data are representative of
n = 7 independent experiments.
Nature Biotechnology: doi:10.1038/nbt.3828
Nature Biotechnology: doi:10.1038/nbt.3828
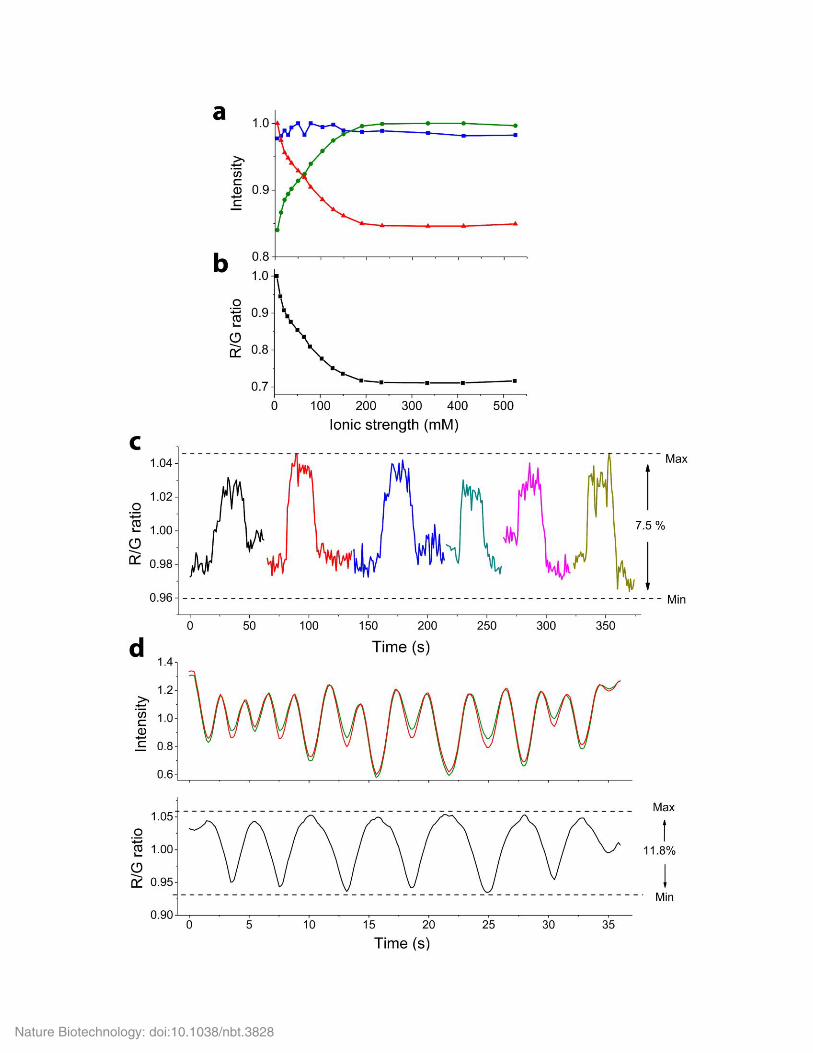
Supplementary Figure 5
Acceptor fluorescence was not directly influenced by the change in ionic strength, and change in objective focus during solution exchange had a
negligibly impact on MCS FRET measurement.
(a) Change of donor intensity (green), acceptor intensity (red) under 488 nm excitation and acceptor intensity (blue) under 561 nm excitation of
MCS+-containing membrane lawns exposed to solution of increasing ionic strengths. (b) The acceptor/ donor (R/G) ratio under 488 excitation at
the corresponding ionic strengths. Images were taken sequentially under 488 nm and 561 nm excitation at each ionic strength. Note that the
directly excited acceptor (blue) was unaffected by the ionic strength of the solution and did not mirror the intensity change of donor acceptor
under 488 nm excitation. This suggested that the acceptor fluorescence was not directly influence by the ionic strength of the solution. Data are
representative of n = 5 biological replicates. (c-d) Solution exchange during ionic strength titration experiments could cause a shift in focus that
potentially affected R/G ratio values. Here, the maximal variations in R/G values (Max - Min) were determined by adding 300 µL of 10 mM
PBS to 600 µL of 10 mM PBS. 6 reprehensive solution exchanges are shown in c, causing an average variation in R/G ratio of 7.5 ±1.0%. Data
are mean and standard error of n = 10 measurements. (d) The impact of the loss of focus on R/G values was also directly measured by manually
changing the objective focus up and down, causing a maximal change in R/G ratio of 11.8 ± 3.1%. Note the concurrent change of donor (green)
and acceptor (red) intensity due to change in focus.
Nature Biotechnology: doi:10.1038/nbt.3828
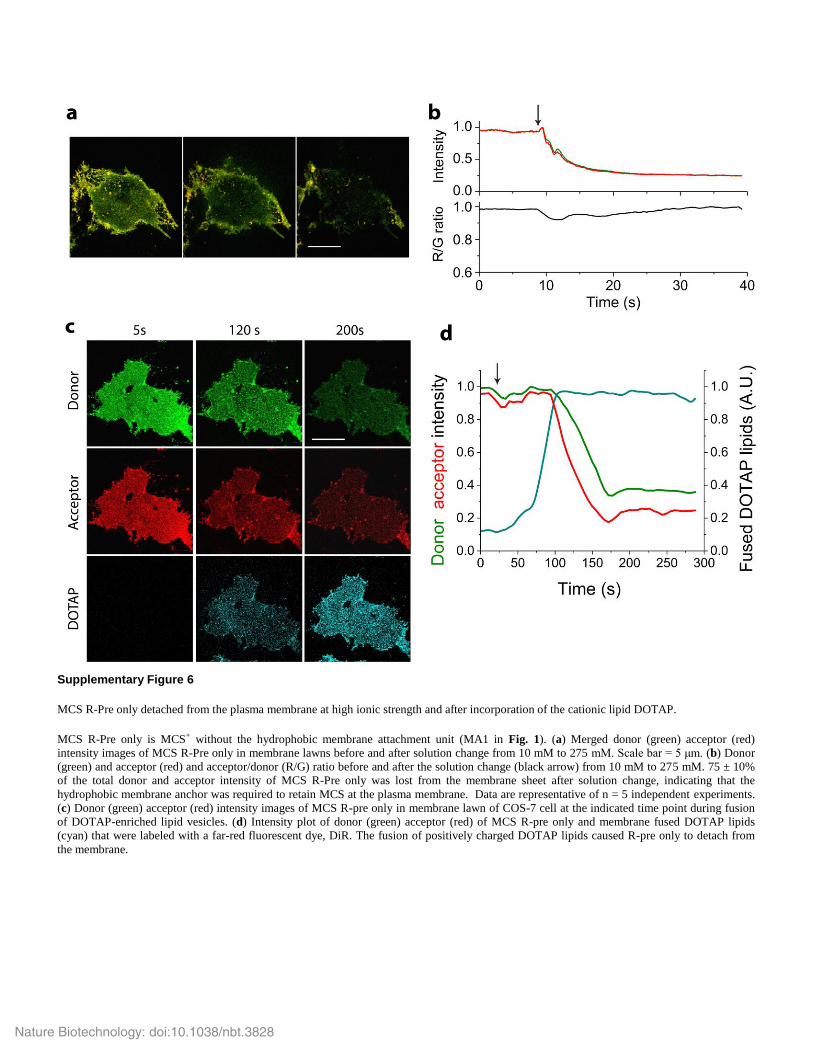
Supplementary Figure 6
MCS R-Pre only detached from the plasma membrane at high ionic strength and after incorporation of the cationic lipid DOTAP.
MCS R-Pre only is MCS+ without the hydrophobic membrane attachment unit (MA1 in Fig. 1). (a) Merged donor (green) acceptor (red)
intensity images of MCS R-Pre only in membrane lawns before and after solution change from 10 mM to 275 mM. Scale bar = 5 μm. (b) Donor
(green) and acceptor (red) and acceptor/donor (R/G) ratio before and after the solution change (black arrow) from 10 mM to 275 mM. 75 ± 10%
of the total donor and acceptor intensity of MCS R-Pre only was lost from the membrane sheet after solution change, indicating that the
hydrophobic membrane anchor was required to retain MCS at the plasma membrane. Data are representative of n = 5 independent experiments.
(c) Donor (green) acceptor (red) intensity images of MCS R-pre only in membrane lawn of COS-7 cell at the indicated time point during fusion
of DOTAP-enriched lipid vesicles. (d) Intensity plot of donor (green) acceptor (red) of MCS R-pre only and membrane fused DOTAP lipids
(cyan) that were labeled with a far-red fluorescent dye, DiR. The fusion of positively charged DOTAP lipids caused R-pre only to detach from
the membrane.
Nature Biotechnology: doi:10.1038/nbt.3828
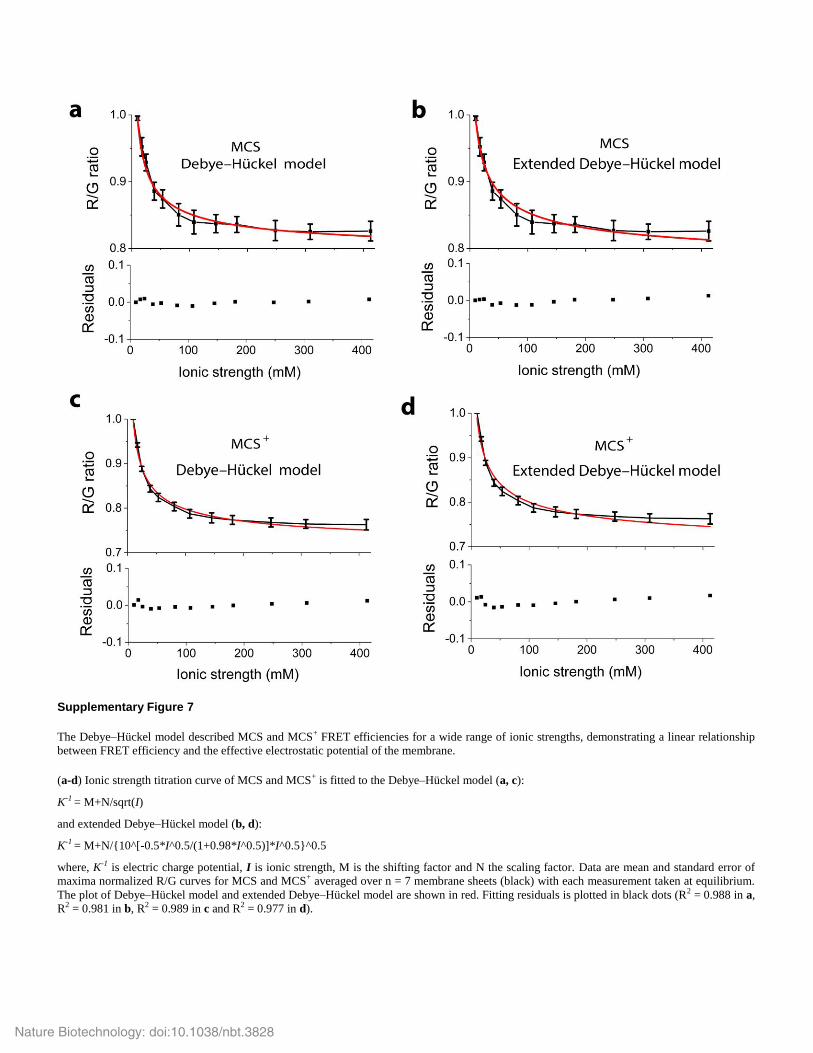
Supplementary Figure 7
The Debye–Hückel model described MCS and MCS+ FRET efficiencies for a wide range of ionic strengths, demonstrating a linear relationship
between FRET efficiency and the effective electrostatic potential of the membrane.
(a-d) Ionic strength titration curve of MCS and MCS+ is fitted to the Debye–Hückel model (a, c):
K-1 = M+N/sqrt(I)
and extended Debye–Hückel model (b, d):
K-1 = M+N/{10^[-0.5*I^0.5/(1+0.98*I^0.5)]*I^0.5}^0.5
where, K-1 is electric charge potential, I is ionic strength, M is the shifting factor and N the scaling factor. Data are mean and standard error of
maxima normalized R/G curves for MCS and MCS+ averaged over n = 7 membrane sheets (black) with each measurement taken at equilibrium.
The plot of Debye–Hückel model and extended Debye–Hückel model are shown in red. Fitting residuals is plotted in black dots (R2 = 0.988 in a,
R2 = 0.981 in b, R2 = 0.989 in c and R2 = 0.977 in d).
Nature Biotechnology: doi:10.1038/nbt.3828
Supplementary Figure 8
Nature Biotechnology: doi:10.1038/nbt.3828
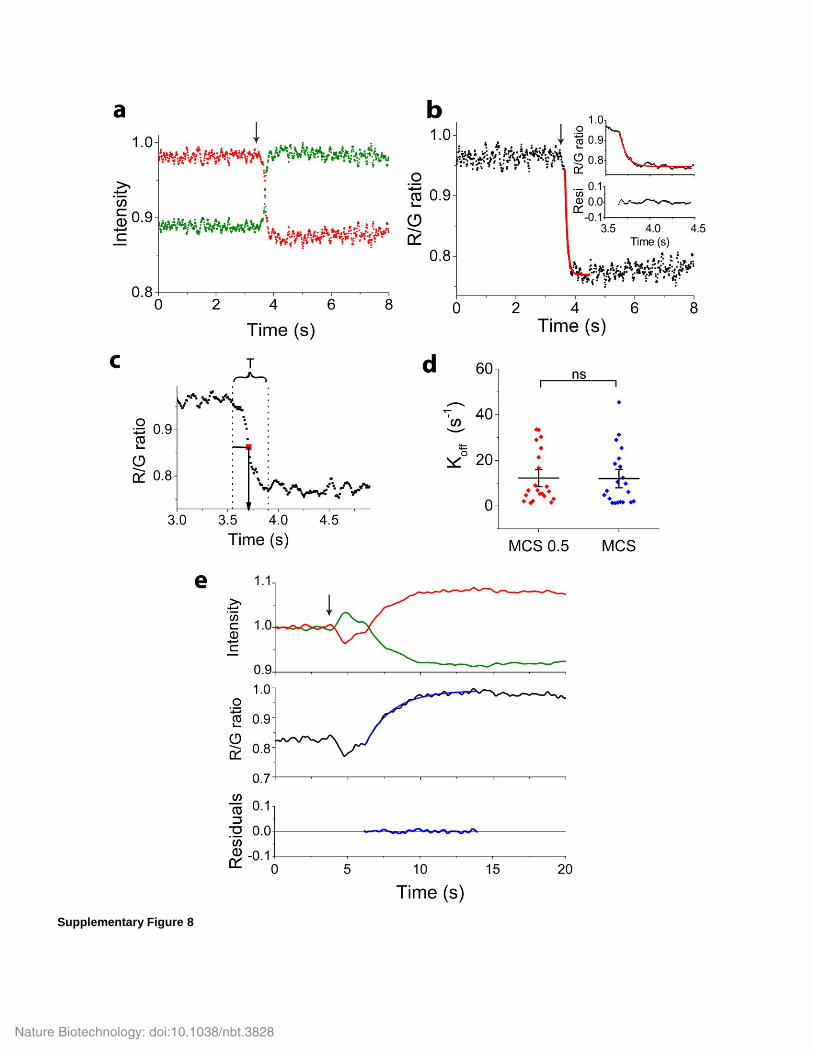
Membrane disassociation koff rates and association kon rate demonstrated reversibility of the MCS.
(a, b) Change in donor (green) acceptor (red) intensity (a) and R/G ratio (b) of MCS when the solutions to which membrane lawns were exposed
were rapidly changed from 10 mM to 275 mM. The decrease of R/G ratio in (b) could be fitted to a single exponential decay function,
R/G=(R/G)max × exp(-kt) (red solid line, R2=0.95), indicating that membrane disassociation of MCS was a first-order reaction. A magnified
region of the fitting is shown in the inset with fit residuals plotted below. For fast acquisition, the images were acquired at 100 Hz using a
resonance scanner. (c) Determination of T1/2, i.e. the time it took to reach 50% of overall FRET efficiency change after the solution change. The
values for koff rates were calculated from the membrane residence time T1/2 as koff rate is the inverse of membrane residence time. For MCS, koff =
12 ± 2 s-1 (n = 21 independent measurements). (d) Comparison of koff rate of MCS 0.5 and MCS. Each symbol is one membrane sheet i.e.
corresponds to one measurement. Black horizontal lines indicate the means and vertical bars the standard errors. No statistical significant
difference was found between the two sensors (n = 21, * P<0.05, two-sample two tailed t-test). The data suggest that enhanced hydrophobicity of
the MA2 anchor arm did not affect MCS membrane disassociation rate. (e) Donor (green) and acceptor (red) intensity and acceptor/donor (R/G)
ratio of MCS on the membrane lawn before and after the ionic strength of the solution was rapidly changed from 275 mM to 35 mM (indicated
by arrow). R/G ratio curve was fitted to R/G=(R/G)min× exp(kt) (blue solid line, R2=0.991) and yielded kon = 0.5 ± 0.05 s-1, indicating that
membrane association of MCS+ is a first-order reaction. Data are representative of n = 7 independent experiments.
Nature Biotechnology: doi:10.1038/nbt.3828
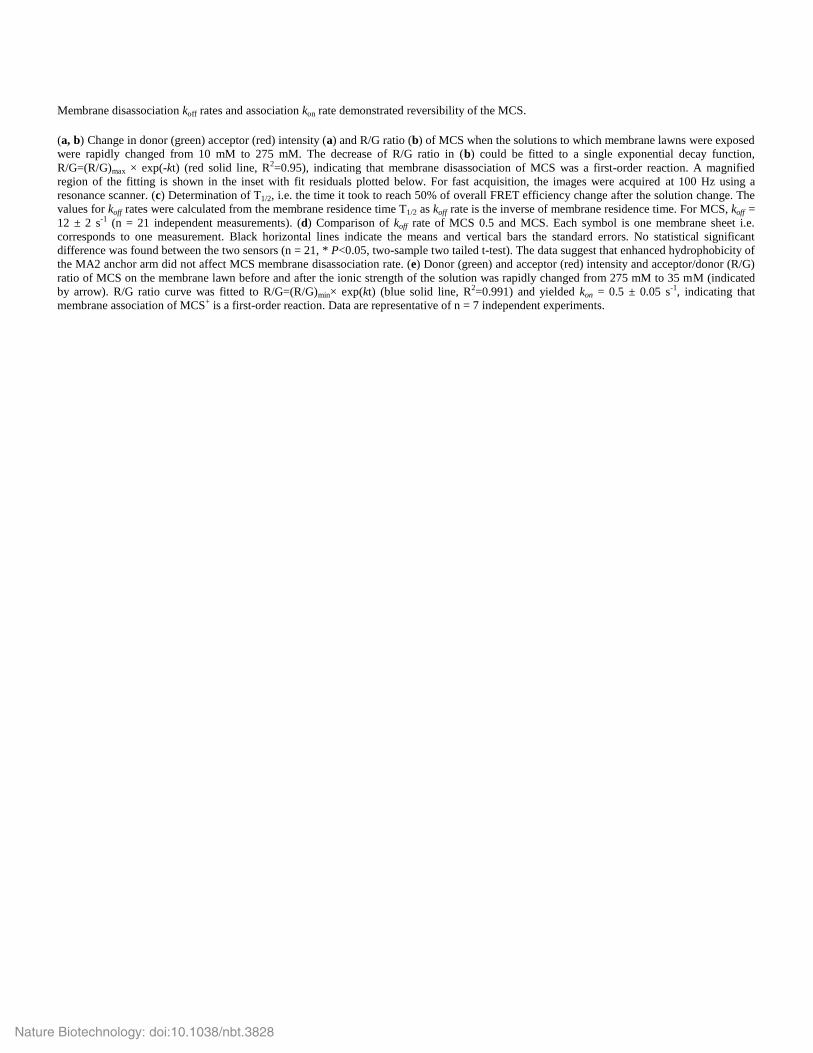
Supplementary Figure 9
Electrostatic membrane potential at the endoplasmic reticulum (ER) after induction of calcium fluxes.
COS-7 cells expressing MCS+ and a TagRFP657-tagged ER marker (which consisted of the peptide sequence
MLLSVPLLLGLLGLAVAGPVAT at N-terminus and KDEL at C-terminus of TagRFP657) were treated with 10 µM ionomycin to induce
intracellular calcium fluxes. (a) Merged intensity image of MCS+ (green) and TagRFP657-tagged ER marker (magenta) before and after
ionomycin treatment. Two regions of interest (ROI) were selected corresponding to the ER (blue, ROI1) and a region outside the ER that
contained the plasma membrane (red, ROI2). (b) Corresponding ratiometric FRET images of MCS+ at the indicated time points. Scale bar = 5
μm. (c) Normalized R/G ratio of ROI1 (blue) and ROI2 (red) that were identified in a. In this example, the electrostatic membrane potential
dropped much faster in ER-containing ROI1 compared to plasma membrane-containing ROI2. Data are representative of n = 5 cells.
Nature Biotechnology: doi:10.1038/nbt.3828

Supplementary Figure 10
MCS Lck only and MCS Hras FI were largely unresponsive to calcium fluxes induced by thapsigargin and hypotonic and hypertonic treatments.
FRET efficiency of MCS Lck only (a) and MCS Hras FI (b) in COS-7 cells before (black symbols) and after (red symbols) thapsigargin,
hypotonic (150 mM to 40 mM) and hypertonic (150 mM to 450 mM) treatments. FRET efficiencies were normalized to the mean of untreated
cells. Each symbol is one measurement in one cell; horizontal and vertical bars represent mean and standard error, respectively. ns, not
significant (P > 0.05); * P < 0.05; ** P < 0.01 (unpaired, two-tailed t-test).
Nature Biotechnology: doi:10.1038/nbt.3828
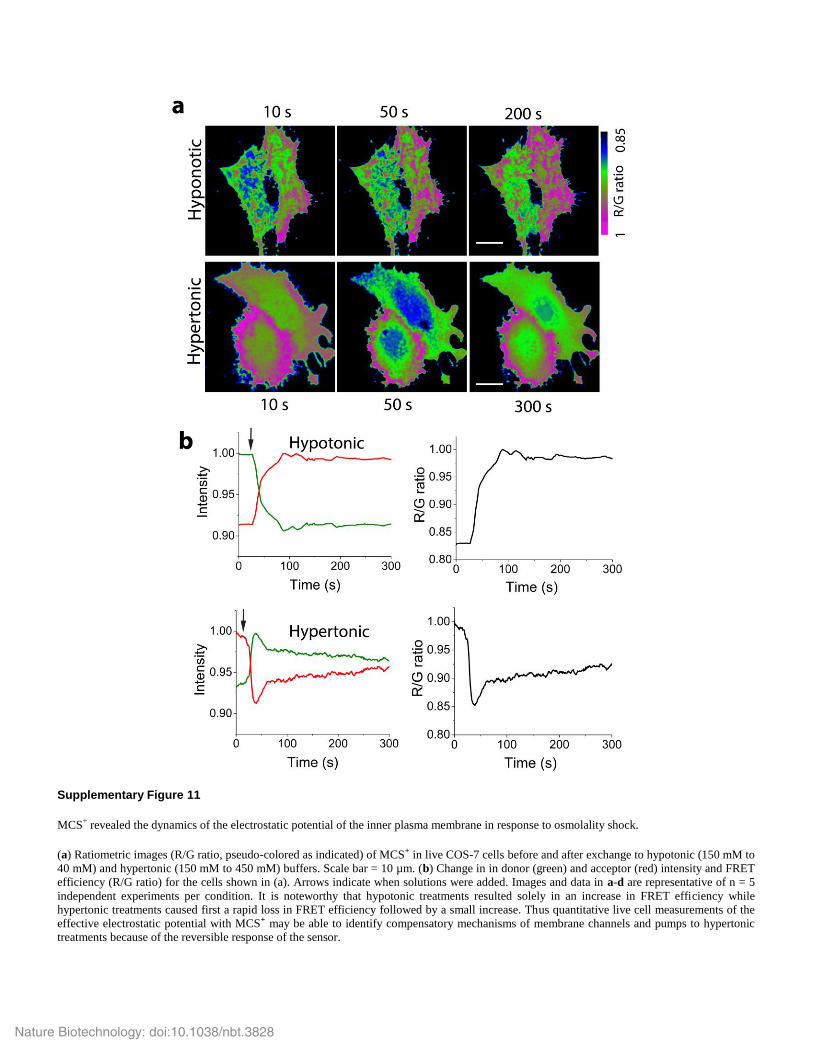
Supplementary Figure 11
MCS+ revealed the dynamics of the electrostatic potential of the inner plasma membrane in response to osmolality shock.
(a) Ratiometric images (R/G ratio, pseudo-colored as indicated) of MCS+ in live COS-7 cells before and after exchange to hypotonic (150 mM to
40 mM) and hypertonic (150 mM to 450 mM) buffers. Scale bar = 10 µm. (b) Change in in donor (green) and acceptor (red) intensity and FRET
efficiency (R/G ratio) for the cells shown in (a). Arrows indicate when solutions were added. Images and data in a-d are representative of n = 5
independent experiments per condition. It is noteworthy that hypotonic treatments resulted solely in an increase in FRET efficiency while
hypertonic treatments caused first a rapid loss in FRET efficiency followed by a small increase. Thus quantitative live cell measurements of the
effective electrostatic potential with MCS+ may be able to identify compensatory mechanisms of membrane channels and pumps to hypertonic
treatments because of the reversible response of the sensor.
Nature Biotechnology: doi:10.1038/nbt.3828

Supplementary Figure 12
FRET efficiency of MCS Lck only and MCS Hras FI in response to fendiline and wortmannin treatments.
(a-b) FRET efficiency of MCS Lck only (a) and MCS Hras FI (b) in COS-7 cells before (black symbols) and after (red symbols) fendiline (60
µM) and wortmannin (10 µM) treatments in fixed cells. FRET efficiencies were normalized to the mean of untreated cells. Each symbol is one
cell of n = 30 independent measurements; horizontal and vertical bars represent mean and standard error, respectively. ns, not significant (P >
0.05); * P < 0.05 (unpaired, two-tailed t-test).
Nature Biotechnology: doi:10.1038/nbt.3828
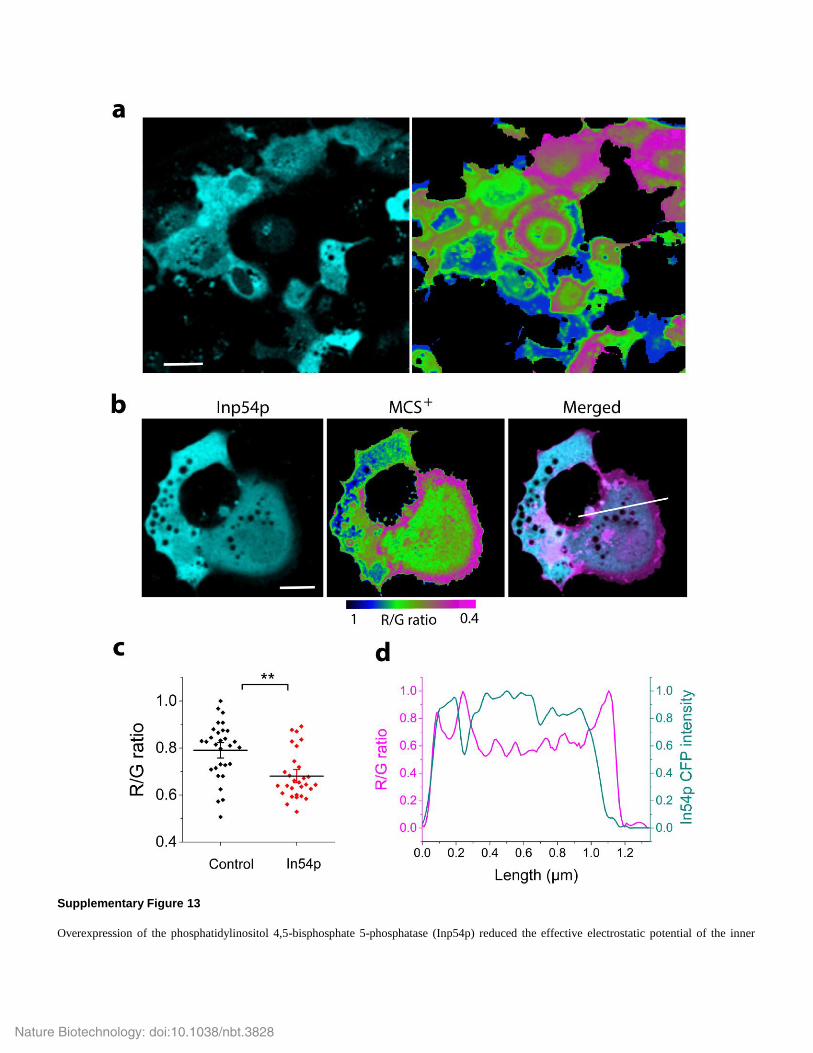
Supplementary Figure 13
Overexpression of the phosphatidylinositol 4,5-bisphosphate 5-phosphatase (Inp54p) reduced the effective electrostatic potential of the inner
Nature Biotechnology: doi:10.1038/nbt.3828
plasma membrane.
COS-7 cells were transfected to co-express MCS+ and the CFP-tagged phosphatase Inp54p. (a, b) Intensity images of Inp54p expression (cyan)
and FRET efficiency images of MCS+ (pseudo-colored as indicated by the color scale). In a, a correlation between high Inp54p expression and
low FRET efficiency is visible. Scale bar in a = 30 μm; Scale bar in b = 10 μm. (c) FRET efficiency (R/G ratio) of MCS+ in control cells and
cells overexpressing Inp54p CFP. Data were from n = 30 cells; horizontal lines indicate the means and vertical bars the standard errors. ** P <
0.01 (unpaired, two-tailed t-test). (d) R/G ratio line profile (red, 1st y-axis) and intensity profile of Inp54p (cyan, 2nd y-axis) across the cell shown
in b; position of line profile is indicated by white line. Note that FRET efficiency was low in regions with high Inp54p expression and vice versa,
even in a single cell. Taken together, the data demonstrate that chronic manipulations of phosphatidylinositol levels, here by converting
phosphatidylinositol 4,5-bisphosphate to phosphatidylinositol 4-phosphate, reset the electrostatic potential as sensed by MCS+.
Nature Biotechnology: doi:10.1038/nbt.3828
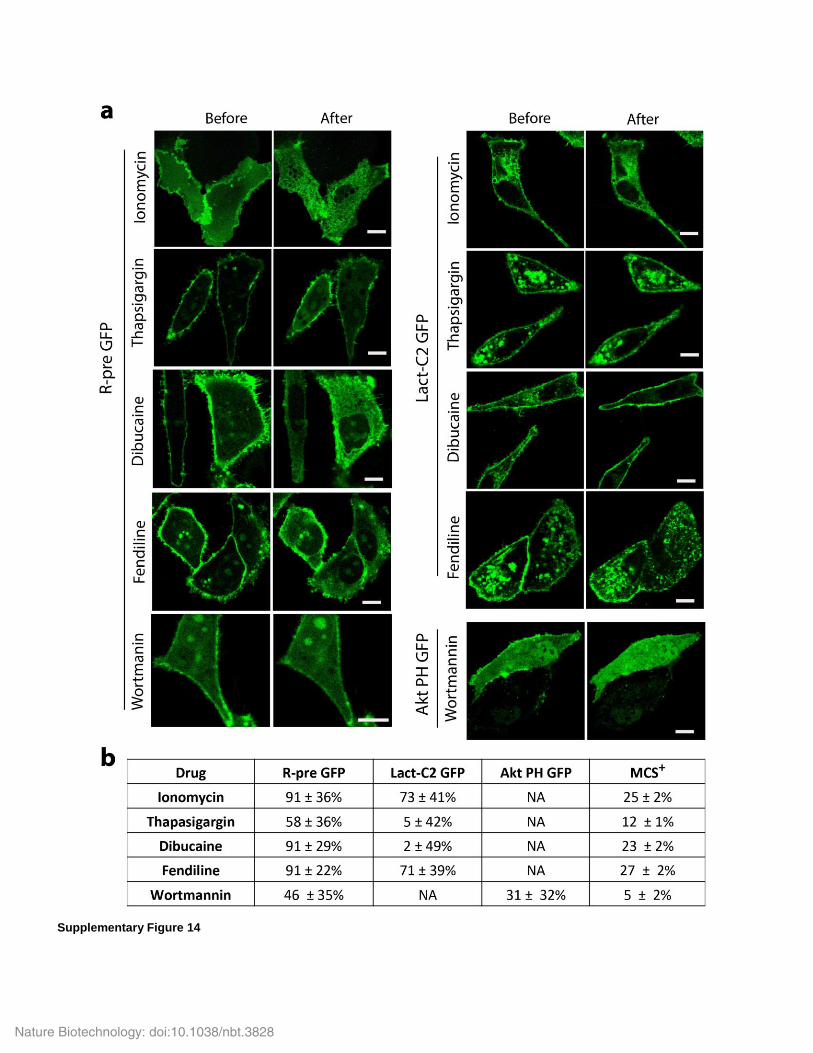
Supplementary Figure 14
Nature Biotechnology: doi:10.1038/nbt.3828
Comparison of MCS+ to intensity-based sensors R-Pre GFP, Lact-C2 GFP and Akt PH GFP.
(a) Images of R-pre GFP (membrane charge sensor), Lact-C2 GFP Lact-C2 (PS) sensor) and Akt PH GFP (which senses PIP3) in COS-7 cells
before and after the indicated drug treatments (3 min of 10 µM ionomycin, 20 µM thapsigargin, 1 mM dibucaine, 60 µM fendiline, or 10 µM
wortmannin). The intensity ratio of plasma membrane (outer 10 pixels, ~1 µm) to cytoplasm (cell area minus outer 10 pixels) was measured with
an semi-automated MATLAB routine (see Methods). Scale bar = 10 um. (b) Sensor responses as normalized plasma membrane-to-cytoplasm
intensity ratios (R-pre GFP, Lact-C2 GFP and Akt PH GFP) and normalized FRET efficiency (MCS+) in response to drug treatments. Data are
mean and standard error of n = 25 cells per condition; NA = not applicable.
Nature Biotechnology: doi:10.1038/nbt.3828
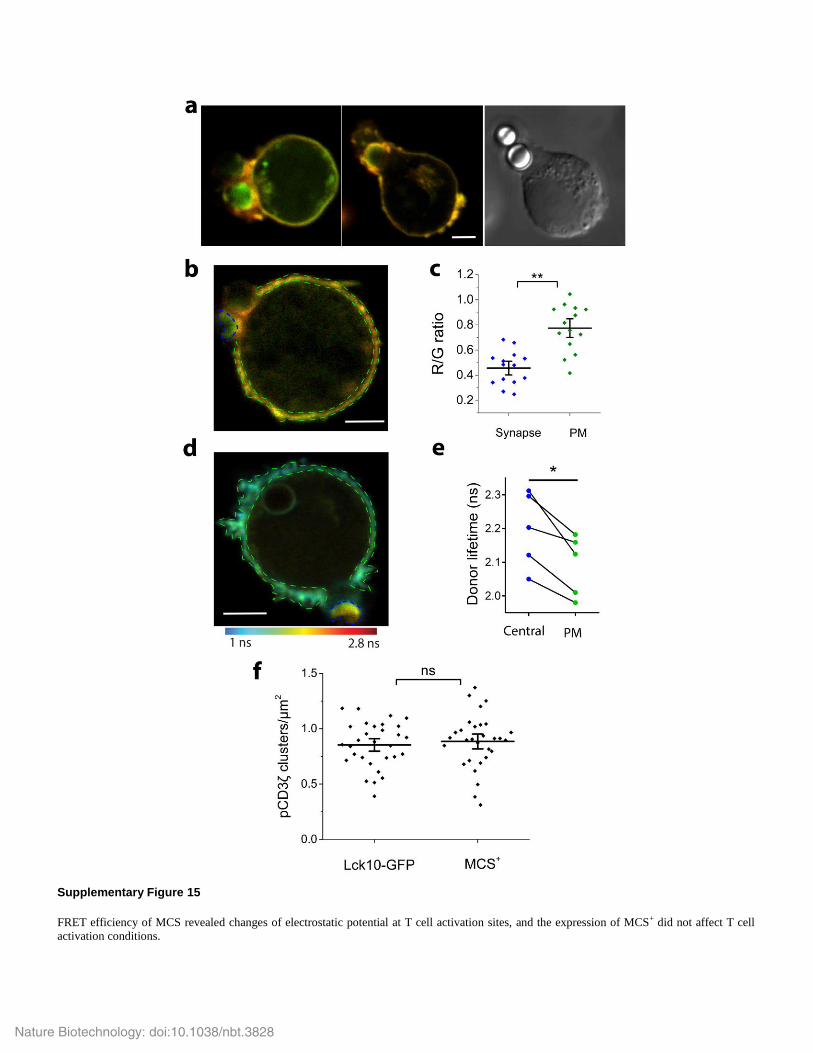
Supplementary Figure 15
FRET efficiency of MCS revealed changes of electrostatic potential at T cell activation sites, and the expression of MCS+ did not affect T cell
activation conditions.
Nature Biotechnology: doi:10.1038/nbt.3828
(a-c) Merged donor (green) and acceptor (red) intensity images of Jurkat E6.1 cells expressing MCS activated with polystyrene beads coated in
anti-human CD3 and anti-human CD28 antibodies (anti-CD3+28 Ab beads). Beads can be identified in the transmitted region (right). In b,
regions were identified that corresponded to the central synapse (blue dotted regions) and the plasma membrane that was not part of the synapse
(green dotted regions). Their corresponding R/G ratio values were plotted in c. In c, black horizontal and vertical lines indicate mean and
standard error, respectively (** P<0.01, paired t-test, n = 14 cells). (d, e) Fluorescence donor lifetime image (d) and values (e) of MCS in Jurkat
cells activated with anti-CD3+28 Ab beads. Fluorescence donor lifetime image was photon-weighted and pseudo-colored (blue to red) reflecting
short to long lifetimes and high to low FRET, respectively. Regions corresponding to synapse (blue region and symbols) and plasma membrane
that was not part of the synapse (green regions and symbols) were identified and their lifetime values were compared. In e, * P<0.05 (paired t-
test, n = 5 cells). (f) Jurkat cells transfected with Lck10-GFP or MCS+ were activated on anti-CD3+CD28 Ab coated coverslips. T cells were
immuno-stained for phosphorylated CD3ζ and phosphorylated TCR-CD3 clusters per um2 measured as described in Methods. ns, not significant,
P > 0.05 (unpaired, two-tailed t-test).
Nature Biotechnology: doi:10.1038/nbt.3828