Embed Size (px)
Citation preview
Pertanika J. Soc. Sci. & Hum. 23 (4): 885 – 904 (2015)
ISSN: 0128-7702 © Universiti Putra Malaysia Press
SOCIAL SCIENCES & HUMANITIESJournal homepage: http://www.pertanika.upm.edu.my/
ARTICLE INFOArticle history:Received: 21 April 2014Accepted: 20 November 2014
E-mail addresses:[email protected] (Ibiyeye, A. I.),[email protected] (Mohd, F. Z. J.),[email protected] (Zalina, S.)* Corresponding author
Natural Ventilation Provisions in Terraced-House Designs in Hot-Humid Climates: Case of Putrajaya, Malaysia
Ibiyeye, A. I., Mohd, F. Z. J.* and Zalina, S.Department of Architecture, Faculty of Design and Architecture, Universiti Putra Malaysia, 43400 UPM Serdang, Malaysia
ABSTRACT
Due to the high risk of global warming from the increased level of energy consumption, energy sustainability is increasingly practised around the world especially in the residential sector. Attempts to save energy in hot-humid climates however, are mainly through improved mechanical cooling. Consequently, residential buildings are built to be air tight and they are provided with insufficient opening areas for natural ventilation which in turn, results in the deterioration of indoor air quality (IAQ). Previous studies on IAQ with respect to ventilation rates are mostly on indoor concentrations of contaminants and various diseases associated with them. Detailed studies on openings and their impact on delivered ventilation rates are still limited, particularly in hot-humid climates. This study investigates natural ventilation provisions in different house design types in Putrajaya, Malaysia with respect to the Uniform Building By-Law (UBBL) governing them. Five terrace house design types were selected, of which two were found to be non-compliant with UBBL 10% window area requirement. Simulations were conducted using the Integrated Environment Solution (IES<VE>) software and the results reveal that house types complying with the UBBL requirements exhibit higher ventilation rates and a longer duration of leaving windows open is found to improve ventilation rates. This paper informs regulatory stakeholders, designers and clients of the residential building sector of the impact of open designs on occupants’ health and the importance of UBBL compliance and enforcement. This study further emphasises the need for occupants to increase the duration of leaving windows open and to embrace night
ventilation as a means of improving natural ventilation in their homes.
Keywords: Hot-humid climate, Indoor Air Quality, natural ventilation, residential buildings, terraced houses, Uniform Building By-Law, ventilation rates, window openings
Pertanika J. Soc. Sci. & Hum. 23 (4): 885 – 904 (2015)
Ibiyeye, A. I., Mohd, F. Z. J. and Zalina, S.
886
INTRODUCTION
Energy sustainability is one of the strategies aimed at tackling the issue of climate change. With the world’s dependence on energy for everyday life, the rate of energy consumption was reported to be on a rapid increase, that is expected to reach 53% in the year 2035 (Smith et al., 2011). Research findings revealed that 40% of energy use is accounted for in buildings and it is mostly for heating, cooling, lighting and operating electrical equipment (Santamouris, 2005; Chan et al., 2009). For residential buildings in hot-humid climate region such as Malaysia, occupants were reported to depend highly on mechanical cooling technologies to achieve comfort (Kubota et al., 2009). Consequently, the Malaysian residential sector is ranked third in the national list of electricity consumption (21.4%) after commercial sector (34.3%) and industrial sector (43.8%) (Malaysian Energy Commission, 2011). In line with this realisation, Kubota and Ahmad (2005) recommended for the number of air-conditioners owned by Malaysian households and the duration of air-conditioning operation to be greatly reduced. In addition, the need to further reduce energy consumption in the residential sector has resulted in houses being designed and built to be air tight to prevent leakage of cool draft through the building skin (Nielsen & Drivsholm, 2010; Lee et al., 2012).
Air tightness in buildings potentially limits the free passage of air in and out of the indoor environment, causing a reduction in
ventilation rates (Nantka, 2006). Previous studies (Guo et al., 2008; Zuraimi & Tham, 2008; Aizat et al., 2009; Fisk et al., 2009; Lee et al., 2012; Sun & Sundell, 2013) have shown that this reduction in ventilation rates results in the deterioration of the indoor air quality (IAQ), which consequently leads to various health-related issues such as sick building syndrome, occurrence of asthma and other respiratory diseases. Marr et al. (2012) argued that ventilation rates could be affected by natural ventilation through window openings, and the level of the effect is determined by the provided window opening area, as well as the frequency of opening the windows. Yamamoto et al. (2010) expressed similar views when he asserted that natural ventilation through window openings and doors were more likely to increase the air-change rate (ACH) in residential buildings. However, he concluded that ACH could be reduced when air-conditioning is being used. Hence, it is sensible to suggest that window openings play an important role in improving the rate of ventilation, which can induce a significant effect on both air quality and thermal comfort in buildings (Daghigh, 2009; Kubota et al., 2009; Lee et al., 2012; Marr et al., 2012).
Studies related to the impact of window openings on IAQ in terms of delivered ventilation rates for contaminants control have been conducted all over the world. For example, Lee et al. (2012) found that restricted ventilation during cooking activities had resulted in poor IAQ, with the average carbon dioxide (CO2)
Pertanika J. Soc. Sci. & Hum. 23 (4): 885 – 904 (2015)
Natural Ventilation
887
concentration greater than 1000ppm. Wong and Huang (2004) on the other hand, had measured the CO2 level of residential bedrooms during sleeping hours and they had recorded a higher level of CO2 concentration in air-conditioned bedrooms compared to bedrooms that were naturally-ventilated. A high level of indoor CO2, as reported by Sekhar and Goh (2011) could result in interrupted sleep among residents. The high level of indoor contaminants could be associated with high level of outdoor contaminant concentrations coupled with high residential density (Zuraimi & Tham, 2008). These indoor contaminants can be reduced by increasing the ventilation rates through natural ventilation (Guo et al., 2008; Zuraimi & Tham, 2008).
Series of investigations into the IAQ of residential buildings in hot-humid climate, particularly in Malaysia, has been conducted. For instance, Muhamad-darus et al. (2011) and Ahmed et al. (2004) studied naturally-ventilated Malaysian terrace houses and discovered the contributing factors of IAQ. These include the number of occupants, sizes of room, house design type, household activities, ventilation systems and the house location. Hassan and Ramli (2010) analysed the level of performance of natural ventilation in a traditional Malay house in Penang, Malaysia. The study showed that large window openings on the building walls facilitated high air intake into the house.
These studies further revealed the factors influencing IAQ in residential buildings and the varying levels of
contaminants between naturally and mechanically-ventilated buildings. However, it remains unclear whether the natural ventilation provisions (window openings) in Malaysian houses are sufficient for optimum ventilation rate. It is also unclear whether these houses are in compliance with the Uniform Building By-Laws (UBBL), 1984 (Laws of Malaysia, 2008). The By-Laws are sets of standardised building regulations for the whole of Malaysia and applicable to all local authorities and building professionals. Specifically, the UBBL law 39(1) states that: “Every room designed, adapted or used for residential...shall be provided with natural lighting and ventilation by means of one or more windows having a total area of not less than 10% of the clear floor area of such room and shall have openings capable of allowing a free uninterrupted passage of air not less than 5% of such floor area.”
This paper aims to fill this gap by investigating natural ventilation provisions in residential buildings in the hot-humid climate of Malaysia, taking into account window openings in all living spaces under different house design types. The specific objectives of this paper are: 1) to identify natural ventilation provisions in different house design types; 2) to reveal the extent to which these provisions conform to the UBBL requirements; 3) to measure the natural ventilation rates of the selected house design types through computer simulations.
This paper intends to reveal the difference in the actual delivered ventilation
Pertanika J. Soc. Sci. & Hum. 23 (4): 885 – 904 (2015)
Ibiyeye, A. I., Mohd, F. Z. J. and Zalina, S.
888
rates between residential buildings with UBBL compliant openings and those with non-compliant openings. It also intends to show the effect of opening windows for a longer period on indoor ventilation rates. It is anticipated that the results would facilitate cultural awareness and sensitivity among designers and building regulators in conforming to the law governing natural ventilation. Added to this, the results of this study could enlighten occupants on the importance of leaving windows open for a longer duration as a means of improving natural ventilation in their homes. This article first explains the method used in the study, followed by results and discussion. The paper concludes with some thoughts on the importance of sufficient openings for optimum natural ventilation and some recommendations for future research.
METHODOLOGY
The methodology used for this study was computer modelling, which mainly
involved a computer simulation process on case study houses. This was mainly done using the Integrated Environmental Solution (IES<VE>) software version 2012. A set of controllable input or independent variables were combined to produce an output variable also known as the dependent or response variable. The independent variables considered were “opening sizes” (UBBL and non-UBBL compliant) and “the duration of opening windows”, while the dependent or output variable was the “airflow in (in litres per seconds)” from which the ventilation rates were calculated. For this study, the results obtained for the ventilation rates are purely based on computer simulation.
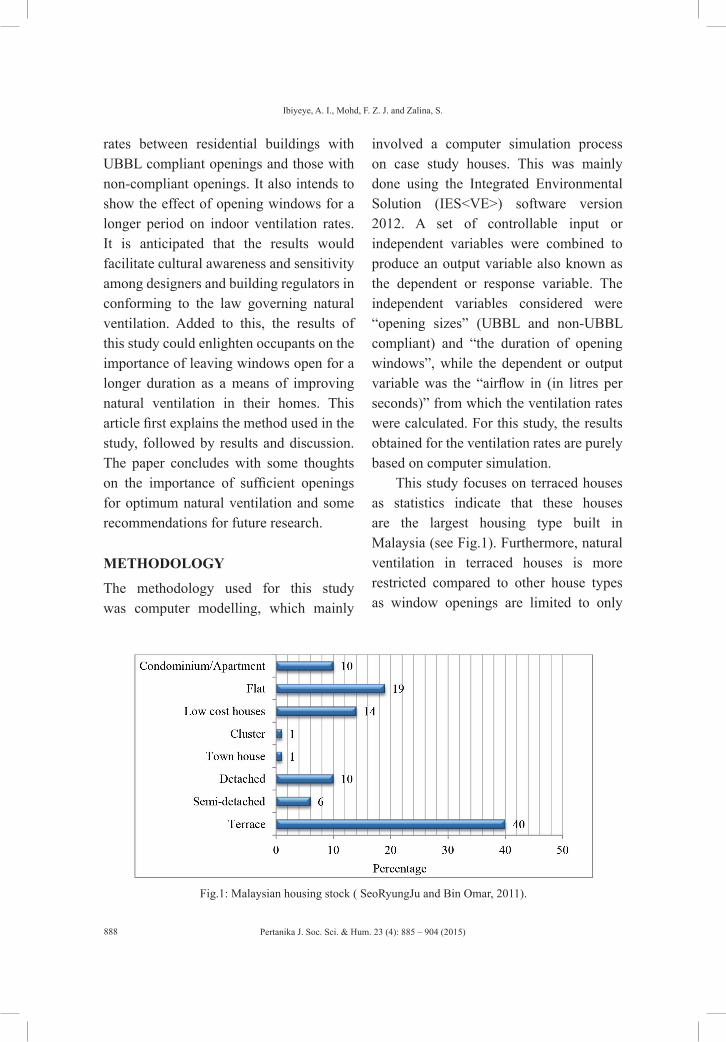
This study focuses on terraced houses as statistics indicate that these houses are the largest housing type built in Malaysia (see Fig.1). Furthermore, natural ventilation in terraced houses is more restricted compared to other house types as window openings are limited to only
Fig.1: Malaysian housing stock ( SeoRyungJu and Bin Omar, 2011).
Pertanika J. Soc. Sci. & Hum. 23 (4): 885 – 904 (2015)
Natural Ventilation
889
two external walls (with the exception of end units). The living spaces included in the study were living/dining room, kitchen and bedrooms as they are considered as the main occupied areas in a house.
Study Area
Being the new Federal Capital Territory of Malaysia, Putrajaya has residential zones that constitute the second largest major land use, thus making it suitable as the study area. Furthermore, houses in Putrajaya are mainly in the condition they were built in as the local authority places restrictions on renovating the properties for the purpose of maintaining the uniformity of the overall designs. This ensures that all units under each design type selected for the study have similar characteristics. Of the 14 residential precincts in Putrajaya, Precincts 11 and 14 are among those with the largest number of terraced housing units and designs. Terraced houses from these two precincts were therefore selected for the purpose of this study.
Sample Selection and Design Review
Site visits were conducted in both Precincts 11 and 14, where the main objective behind
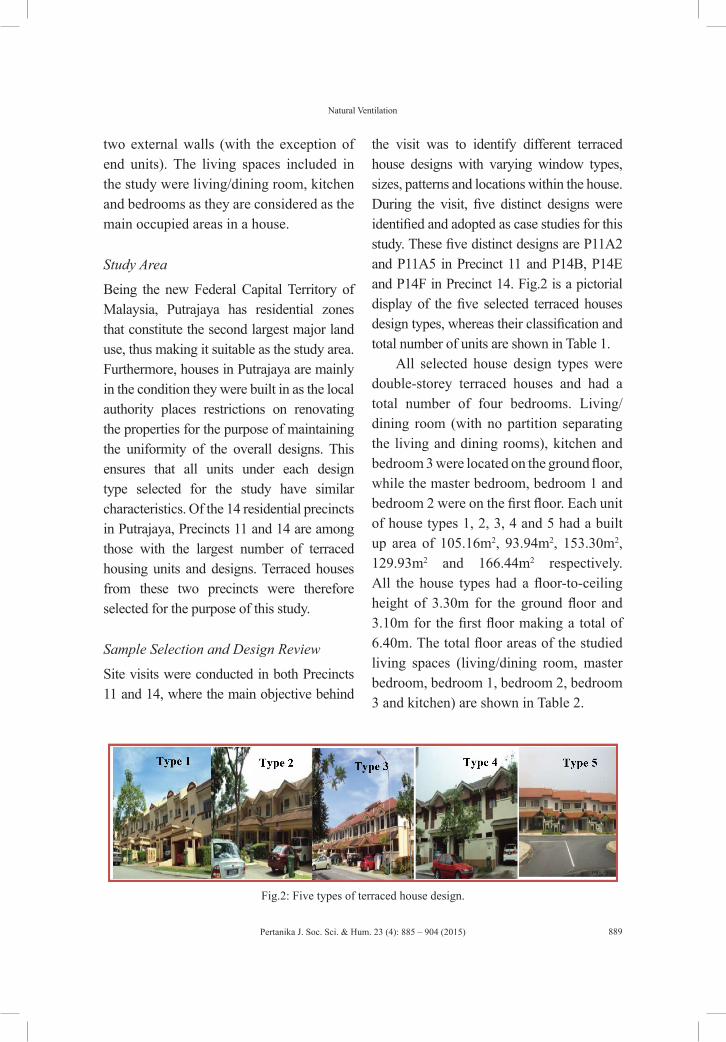
the visit was to identify different terraced house designs with varying window types, sizes, patterns and locations within the house. During the visit, five distinct designs were identified and adopted as case studies for this study. These five distinct designs are P11A2 and P11A5 in Precinct 11 and P14B, P14E and P14F in Precinct 14. Fig.2 is a pictorial display of the five selected terraced houses design types, whereas their classification and total number of units are shown in Table 1.
All selected house design types were double-storey terraced houses and had a total number of four bedrooms. Living/dining room (with no partition separating the living and dining rooms), kitchen and bedroom 3 were located on the ground floor, while the master bedroom, bedroom 1 and bedroom 2 were on the first floor. Each unit of house types 1, 2, 3, 4 and 5 had a built up area of 105.16m2, 93.94m2, 153.30m2, 129.93m2 and 166.44m2 respectively. All the house types had a floor-to-ceiling height of 3.30m for the ground floor and 3.10m for the first floor making a total of 6.40m. The total floor areas of the studied living spaces (living/dining room, master bedroom, bedroom 1, bedroom 2, bedroom 3 and kitchen) are shown in Table 2.
Fig.2: Five types of terraced house design.

Pertanika J. Soc. Sci. & Hum. 23 (4): 885 – 904 (2015)
Ibiyeye, A. I., Mohd, F. Z. J. and Zalina, S.
890
TABLE 1Design Classification of House Types and Their Total Number of Units
Precinct Precinct 11 Precinct 14Design type P11A2 P11A5 P14B P14E P14F TotalDesign classification Type 1 Type 2 Type 3 Type 4 Type 5Total units 136 215 94 120 84 649
TABLE 2Total Floor Area of Living Spaces in All House Design Types
Type 1 Type 2 Type 3 Type 4 Type 5
Living spaces Floor area (m2)
Floor area (m2)
Floor area (m2)
Floor area (m2)
Floor area (m2)
Living/dining room 35.64 29.59 35.96 30.36 31.27Master bedroom 13.65 19.49 20.83 12.87 18.65Bedroom 1 17.16 12.14 16.21 12.12 15.8Bedroom 2 12.96 13.83 11.64 12.83 16.56Bedroom 3 9.56 4.99 8.91 7.48 7.38Kitchen 12.1 8.93 12.98 11.12 12.55Total 101.07 88.97 106.53 86.78 102.21
Among all of the house types, only type 5 had an internal courtyard included in its design. According to Sadafi et al. (2008), an internal courtyard helps to improve the ventilation of terrace houses as window openings facing the courtyard facilitate temperature differences between indoors and outdoors. With the exception of house type 5, all house types had balconies attached to the master bedroom on the first floor. The balcony in house type 5, however, was attached to the family area, which was also located on the first floor. The living spaces of all house types had casement window type of varying sizes; in some cases, awning window types were installed at the top of each casement. Apart from the architectural design, the difference between these house types was in the ratio of their window openings for ventilation provisions
and wall area, as required by the UBBL, (Laws of Malaysia, 2008) law 39(1).
Once all window types had been identified, windows were then grouped according to the living space and the house type to which they belonged. Then the total area of window opening (width x height) was calculated for each living space. The total area of living spaces of each house design type was also recorded. Consequently, the window/floor area percentage was calculated using the following formula:
% window/floor area (%) = window area (m2)/ Floor area (m2) x 100…. (1)
Computer Simulation
To predict airflow and ventilation performance in buildings, the use of a suitable tool or model is essential.

Pertanika J. Soc. Sci. & Hum. 23 (4): 885 – 904 (2015)
Natural Ventilation
891
Furthermore, the tool or model should be capable of giving a reasonably accurate prediction. Therefore, the study used the Integrated Environmental Solution (IES<VE>) software version 2012 as the modelling tool for simulating the airflow through each opening in all of the studied living spaces. Based on a research study conducted by Attia et al. (2009) and Behrendt et al. (2011), IES<VE> was selected as the most suitable simulation software after it was compared with other available software. Consequently, its validity was ascertained by Leng et al. (2012) after comparing results from a field study with simulation results from IES<VE> during a ventilation study. IES<VE> has been used in different studies (Mohammadi et al., 2010; Sadrzadehrafiei et al., 2011) for various environmental analyses. For the simulation to be carried out in this study, three sequential stages of procedures were performed to ensure the reliability of the results and these are explained below.
Stage 1: Geometry generation. The first stage was geometry generation, which involved creating the house geometry, assigning the site orientation and site location, and specifying the appropriate weather data. The design geometry of all five buildings were drawn in the “ModelIT” IES<VE> interface. All building components (e.g. openings, floors, partitions and roofs) were incorporated in the generated geometries to create the replicate of the real buildings as accurately as possible.
The data inputs for the present simulation in the “ModelIT” IES<VE>
interface include: site orientation, site location and weather data. The weather data in IES<VE> was assigned in the “APLocate” module located in the “ModelIT” IES<VE> interface. APLocate is the weather and site location editor of IES<VE>. From the APLocate interface, it was possible to choose a location from an extensive database and guidance was provided on how to define weather data for various locations.
Standard simulation weather files were sourced from various locations and converted into the standard FWT file format for IES<VE> database. Some of these files i.e. weather data for a period of over 30 years were obtained from the meteorological offices. For the purpose of this study, weather data from the Kuala Lumpur Subang weather station was selected as it is the closest weather station to the study area. The weather station has geographic coordinates that lie between latitude 3.120N and latitude 101.550E. Table 3 shows the weather data summary of Kuala Lumpur Subang specified in IES<VE> APLocate. This reveals that the highest temperature was witnessed in the month of March (35.10C) and the lowest in the months of November and December (33.20C).
Fig.3 presents the wind data obtained from IES<VE> APLocate. It indicates that the prevailing winds were from the North and Northeast and the lowest wind speed was between 0-3 m/s. Consequently, the generated geometries were orientated facing the North.

Pertanika J. Soc. Sci. & Hum. 23 (4): 885 – 904 (2015)
Ibiyeye, A. I., Mohd, F. Z. J. and Zalina, S.
892
TABLE 3Monthly Dry and Wet Bulb Temperature, Kuala Lumpur Subang (Integrated Environmental solution, 2012)
MonthsMinimum dry bulb temperature (0C)
Maximum dry bulb temperature (0C)
Maximum wet bulb temperature (0C)
January 25.50 34.00 24.50
February 25.80 34.80 24.90
March 26.40 35.10 25.20
April 26.50 34.90 26.20
May 26.90 34.80 26.30
June 26.00 34.20 25.40
July 26.00 34.00 25.40
August 26.10 34.10 25.30
September 26.00 34.00 25.20
October 26.10 34.00 25.50
November 25.60 33.20 25.60
December 25.60 33.20 25.00
Mean 26.04 34.19 25.38
Fig.3: Wind rose, Kuala Lumpur Subang, Malaysia (Integrated Environmental solution, 2012).
Pertanika J. Soc. Sci. & Hum. 23 (4): 885 – 904 (2015)
Natural Ventilation
893
Stage 2: Natural ventilation analysis. In the second stage, natural ventilation analysis was performed in the Macroflo IES<VE> module. In this stage, opening characteristics i.e. opening types, opening category and opening angle and direction, were assigned in the MacroFlo ‘opening types manager’ interface. The duration for which the windows were left open was specified. Subsequently, the heating and cooling profiles in the ‘Building template manager’ were turned off to keep the simulation in full natural ventilation mode.
Stage 3: Running the simulation. Finally, the simulation was run in IES<VE> ApacheSim. Here, the mode of simulation, output parameters, the required space for the simulation and the duration (1 January to 31 December) were assigned. Among the many rows of units in each house design type, an intermediate house unit was selected to be simulated. For this study, two different simulations were performed: 1) simulating when the windows were left open during the daytime (6:00 AM to 10:00 PM every day), and 2) simulating when all windows were left open at all times (24 hours every day). This decision was informed by the survey results of Kubota and co-authors (Kubota & Ahmad, 2005; Kubota, 2006; Kubota et al., 2009), who revealed that the majority of residential building occupants in Malaysia left their windows open mostly during the daytime (from morning to evening). These approaches were adopted in order to reveal the difference in air flow introduced by the openings under these two scenarios.
Result Viewer
The simulation results i.e. volume of air flow in (in litres per seconds) through each opening in all house types for the period of a year, were viewed from the Vista interface. The results were viewed in tabular form from the IES<VE> vista result viewer. The mean volume of air flow in (in litres per seconds) was then calculated using a Microsoft excel spread sheet. From this, the total volume of air in each living space was added up. Consequently, the air flow in (in cubic metre per hour) for each studied living space was calculated using the following formula:
Air flow in cubic metre per hour (m3/h) = Air flow in litres per seconds (l/s) x 3.6………………… (2)
Therefore, the Air Changes per hour (ACH) for each studied living space was calculated as:
Air Changes per hour (ACH) = Air flow in cubic meter per hour (m3/h) / Floor area in cubic meter (m3) ……………… (3)
RESULTS
Design Review
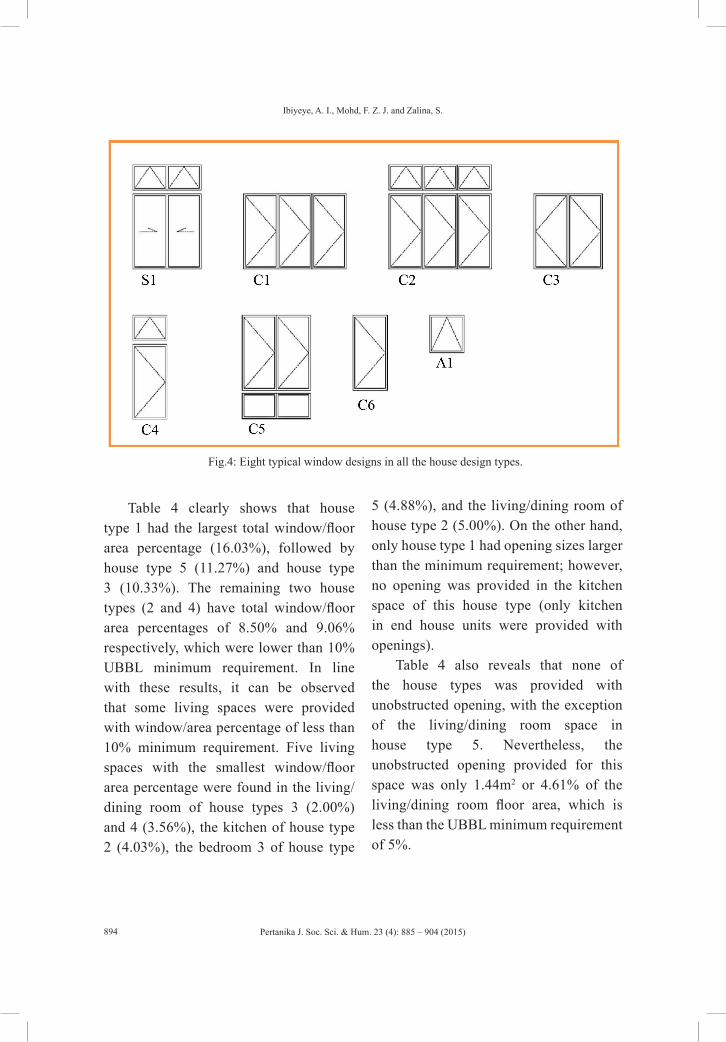
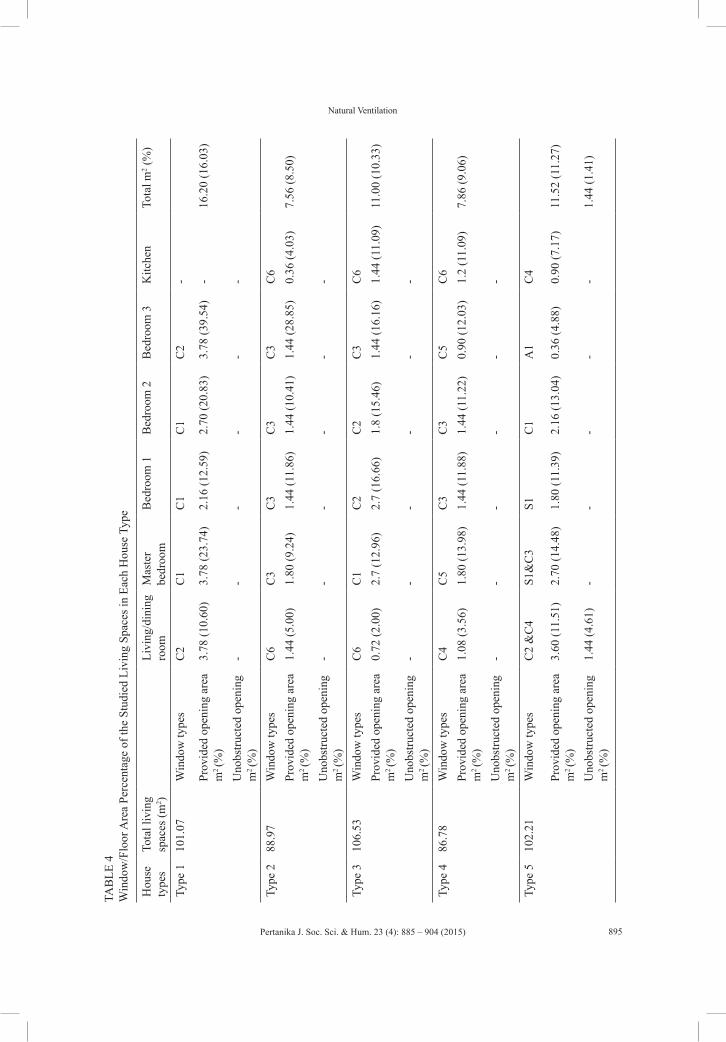
From the five house types, eight typical window design types with varying sizes were identified (see Fig.4). These windows designs were categorised as casement, sliding and awning windows; hence, they were labelled ‘S’, ‘C’ and ‘A’ respectively (see Fig.4). Table 4 shows the window design, opening area and window/floor area percentage of the studied living spaces in each house type.
Pertanika J. Soc. Sci. & Hum. 23 (4): 885 – 904 (2015)
Ibiyeye, A. I., Mohd, F. Z. J. and Zalina, S.
894
Table 4 clearly shows that house type 1 had the largest total window/floor area percentage (16.03%), followed by house type 5 (11.27%) and house type 3 (10.33%). The remaining two house types (2 and 4) have total window/floor area percentages of 8.50% and 9.06% respectively, which were lower than 10% UBBL minimum requirement. In line with these results, it can be observed that some living spaces were provided with window/area percentage of less than 10% minimum requirement. Five living spaces with the smallest window/floor area percentage were found in the living/dining room of house types 3 (2.00%) and 4 (3.56%), the kitchen of house type 2 (4.03%), the bedroom 3 of house type
5 (4.88%), and the living/dining room of house type 2 (5.00%). On the other hand, only house type 1 had opening sizes larger than the minimum requirement; however, no opening was provided in the kitchen space of this house type (only kitchen in end house units were provided with openings).
Table 4 also reveals that none of the house types was provided with unobstructed opening, with the exception of the living/dining room space in house type 5. Nevertheless, the unobstructed opening provided for this space was only 1.44m2 or 4.61% of the living/dining room floor area, which is less than the UBBL minimum requirement of 5%.
Fig.4: Eight typical window designs in all the house design types.
Pertanika J. Soc. Sci. & Hum. 23 (4): 885 – 904 (2015)
Natural Ventilation
895
TAB
LE 4
Win
dow
/Flo
or A
rea
Perc
enta
ge o
f the
Stu
died
Liv
ing
Spac
es in
Eac
h H
ouse
Typ
e
Hou
se
type
sTo
tal l
ivin
g sp
aces
(m2 )
Livi
ng/d
inin
g ro
omM
aste
r be
droo
mB
edro
om 1
Bed
room
2B
edro
om 3
Kitc
hen
Tota
l m2 (
%)
Type
110
1.07
Win
dow
type
sC
2C
1C
1C
1C
2-
Prov
ided
ope
ning
are
a m
2 (%
)3.
78 (1
0.60
)3.
78 (2
3.74
)2.
16 (1
2.59
)2.
70 (2
0.83
)3.
78 (3
9.54
)-
16.2
0 (1
6.03
)
Uno
bstru
cted
ope
ning
m
2 (%
)-
--
--
-
Type
288
.97
Win
dow
type
sC
6C
3C
3C
3C
3C
6Pr
ovid
ed o
peni
ng a
rea
m2 (%
)1.
44 (5
.00)
1.80
(9.2
4)1.
44 (1
1.86
)1.
44 (1
0.41
)1.
44 (2
8.85
)0.
36 (4
.03)
7.56
(8.5
0)
Uno
bstru
cted
ope
ning
m
2 (%
)-
--
--
-
Type
310
6.53
Win
dow
type
sC
6C
1C
2C
2C
3C
6Pr
ovid
ed o
peni
ng a
rea
m2 (%
)0.
72 (2
.00)
2.7
(12.
96)
2.7
(16.
66)
1.8
(15.
46)
1.44
(16.
16)
1.44
(11.
09)
11.0
0 (1
0.33
)
Uno
bstru
cted
ope
ning
m
2 (%
)-
--
--
-
Type
486
.78
Win
dow
type
sC
4C
5C
3C
3C
5C
6Pr
ovid
ed o
peni
ng a
rea
m2 (%
)1.
08 (3
.56)
1.80
(13.
98)
1.44
(11.
88)
1.44
(11.
22)
0.90
(12.
03)
1.2
(11.
09)
7.86
(9.0
6)
Uno
bstru
cted
ope
ning
m
2 (%
)-
--
--
-
Type
510
2.21
Win
dow
type
sC
2 &
C4
S1&
C3
S1C
1A
1C
4
Prov
ided
ope
ning
are
a m
2 (%
)3.
60 (1
1.51
)2.
70 (1
4.48
)1.
80 (1
1.39
)2.
16 (1
3.04
)0.
36 (4
.88)
0.90
(7.1
7)11
.52
(11.
27)
Uno
bstru
cted
ope
ning
m
2 (%
)1.
44 (4
.61)
--
--
-1.
44 (1
.41)
Pertanika J. Soc. Sci. & Hum. 23 (4): 885 – 904 (2015)
Ibiyeye, A. I., Mohd, F. Z. J. and Zalina, S.
896
TABLE 5Air Changes Rates (ACH) Values When Windows Were Left Open at All Times
Living spaces Type 1 Type 2 Type 3 Type 4 Type 5
Living/dining room 7.96 1.65 1.39 2.79 11.54Master bedroom 18.12 5.93 8.14 8.40 15.91Bedroom 1 7.89 6.98 10.12 6.75 16.04Bedroom 2 13.53 6.16 9.99 6.37 7.54Bedroom 3 23.26 14.28 8.67 7.91 2.57Kitchen 0.01 5.06 6.69 6.54 4.79Total 10.47 5.03 6.15 5.58 10.84
TABLE 6Air Changes Rates (ACH) Values When Windows Were Left Open Only During the Day Time (Between 6:00 AM to 10:00 PM)
Living spaces Type 1 Type 2 Type 3 Type 4 Type 5
Living/dining room 5.23 1.07 0.91 1.79 8.72
Master bedroom 12.54 3.87 5.38 5.56 11.93Bedroom 1 5.32 4.61 6.75 4.49 12.03Bedroom 2 9.17 4.06 6.58 4.24 4.99Bedroom 3 16.21 9.65 5.81 5.20 1.72Kitchen 0.01 3.33 4.46 4.33 3.14Total 7.11 3.31 4.08 3.68 7.97
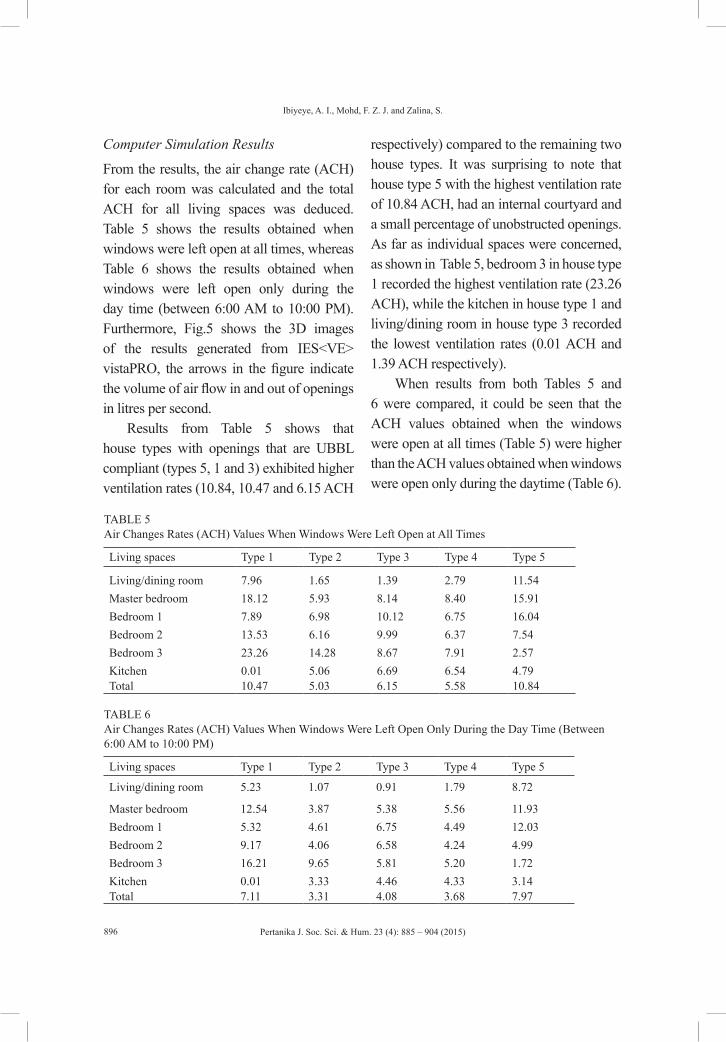
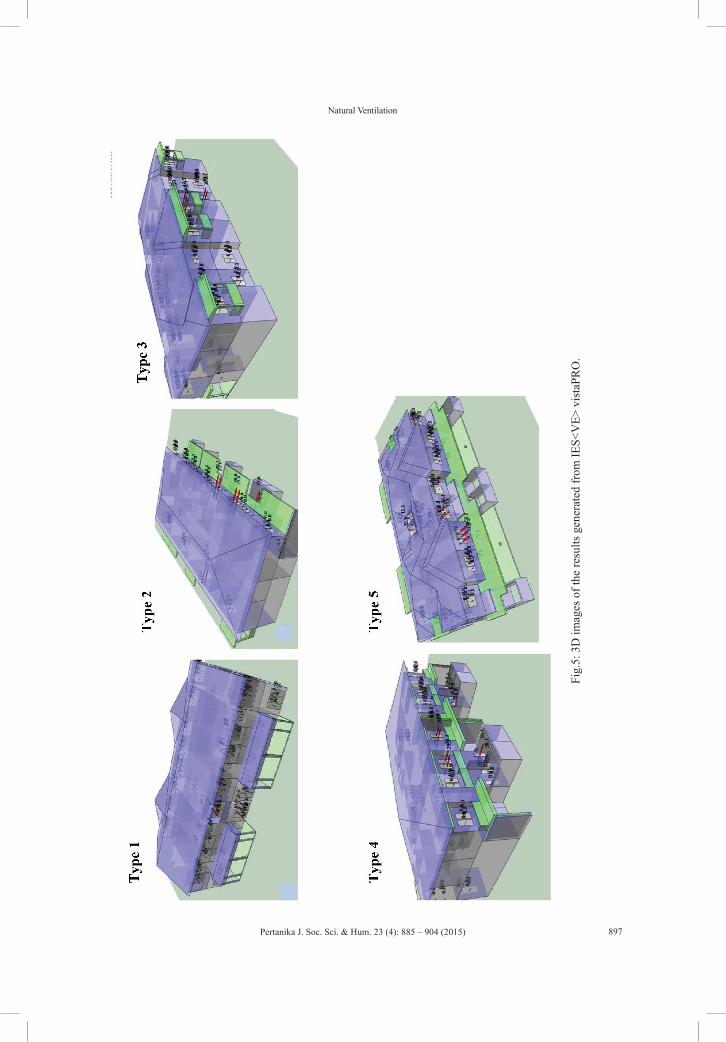
Computer Simulation Results
From the results, the air change rate (ACH) for each room was calculated and the total ACH for all living spaces was deduced. Table 5 shows the results obtained when windows were left open at all times, whereas Table 6 shows the results obtained when windows were left open only during the day time (between 6:00 AM to 10:00 PM). Furthermore, Fig.5 shows the 3D images of the results generated from IES<VE> vistaPRO, the arrows in the figure indicate the volume of air flow in and out of openings in litres per second.
Results from Table 5 shows that house types with openings that are UBBL compliant (types 5, 1 and 3) exhibited higher ventilation rates (10.84, 10.47 and 6.15 ACH
respectively) compared to the remaining two house types. It was surprising to note that house type 5 with the highest ventilation rate of 10.84 ACH, had an internal courtyard and a small percentage of unobstructed openings. As far as individual spaces were concerned, as shown in Table 5, bedroom 3 in house type 1 recorded the highest ventilation rate (23.26 ACH), while the kitchen in house type 1 and living/dining room in house type 3 recorded the lowest ventilation rates (0.01 ACH and 1.39 ACH respectively).
When results from both Tables 5 and 6 were compared, it could be seen that the ACH values obtained when the windows were open at all times (Table 5) were higher than the ACH values obtained when windows were open only during the daytime (Table 6).
Pertanika J. Soc. Sci. & Hum. 23 (4): 885 – 904 (2015)
Natural Ventilation
897
Fig.
5: 3
D im
ages
of t
he re
sults
gen
erat
ed fr
om IE
S<V
E> v
ista
PRO
.
Pertanika J. Soc. Sci. & Hum. 23 (4): 885 – 904 (2015)
Ibiyeye, A. I., Mohd, F. Z. J. and Zalina, S.
898
DISCUSSION
This study has revealed the natural ventilation provisions (i.e. window openings) and ACH of five selected terrace house design types, taking into account all living spaces, namely, living/dining room, master bedrooms, kitchen and other bedrooms. This study was conducted in order to fulfil three specific objectives which are: 1) to identify natural ventilation provisions in different house design types; 2) to reveal the extent to which these provisions conform to the UBBL requirements; 3) to measure the natural ventilation rates of the selected house design types through computer simulations.
After identifying the natural ventilation provisions in all the house types in order to achieve the first objective, the results showed that only three house design types (1, 3 and 5) were provided with the required window opening area. Surprisingly, all house design types had no unobstructed openings installed, except house type 5. Nevertheless, this provision was still below the 5% mandatory requirement. These findings are consistent with similar findings by Hanafiah (2005) and Ahmad et al. (2011), who revealed that the majority of Malaysia’s residential buildings were provided with window openings that do not fulfil the UBBL requirements. With this, the extent to which the provided provisions for natural ventilation conform to the UBBL requirements was revealed.
It might be surprising how the building designs were approved in the first place when some do not comply with the UBBL
requirements. In the acquired submission drawings, all window sizes were indicated. These drawings showed that both the 10% and 5% UBBL requirements were adhered to, hence, explaining the approval granted by the local authority. However, this was not the case when seen from the actual completed buildings on site. Taking the issue of the 5% requirement for example, Fig.4 (See ‘Result section’) shows the different window types in the studied houses. It can be seen that some windows have ‘awning’ window types on top while some have ‘fixed glasses’ below. In the acquired submission drawings, these (awning window and fixed glass) were indicated as the provisions to comply with the 5% requirement. According to the UBBL, the 5% opening is expected to be unobstructed (left permanently open) but these openings (awning window) are in fact operable, meaning they cannot be left permanently open.
Expectedly, the sufficient provision of operable window area was reflected in the natural ventilation simulation results which fulfilled the study’s third objective. House types provided with openings in accordance with or higher than UBBL 10% opening requirements were found to exhibit higher ventilation rates. This suggests that a larger opening area can potentially increase the ventilation rates of a space. This result is also echoed by Marr et al. (2012), who revealed that window opening, opening area and frequency of opening affect the rate of ventilation in a residential building. By the same token,

Pertanika J. Soc. Sci. & Hum. 23 (4): 885 – 904 (2015)
Natural Ventilation
899
Hassan and Ramli (2010) argued that opening area on building walls should be maximised to create high air intake from outdoor into the indoor environment.
The non-conformity of the opening areas to the UBBL 10% requirement could be due to negligence on the part of building designers. However, the avoidance of 5% unobstructed requirements could be due to the rising attempt at increasing energy efficiency with the use of mechanical cooling in buildings. This is supported by the findings of Kubota and Ahmad (2005b), Kubota (2006) and Kubota et al. (2009), that the majority of occupants installed AC in their homes. Furthermore, Nielsen and Drivsholm (2010) and Lee et al. (2012) explained that increasing energy efficiency with the use of mechanical cooling has resulted in houses being built to be air tight to prevent leakage of cool draft through the building’s skin. This (air tightness) would be an added advantage for those occupants who rely on AC as a means of achieving comfort in their homes. However, the rights of those occupants who rely solely on natural ventilation should not be denied.
Among all the house design types, house type 1 had the largest operable window/floor area percentage (16.03%), followed by house type 5 (11.27% + 1.41% unobstructed opening). However, house type 5 exhibited the highest ventilation rates due to the fact that this house type was designed with an internal courtyard. This evidence suggests that such design strategy in Malaysian terrace houses can improve natural ventilation rates. In
addition, simulation results showed that ventilation rates were higher when the windows were open at all times compared to when windows were left open only during the daytime. The evidence gathered here suggests that opening windows during both daytime and night time can potentially improve the ventilation rates of a space. In other words, the longer the duration of windows being left open, the higher the ACH delivered into a space. This finding reinforced the argument by Marr et al. (2012) that an increase in the frequency of opening windows in residential buildings will increase the rate of ventilation. According to Lee et al. (2012), this phenomenon leads to a healthy indoor environment.
Although having windows open during the day and at night is desirable, according to Rijal et al. (2007), Andersen et al. (2009) and Fabi et al. (2012), occupants are more likely to open their windows only during the daytime as the indoor temperature gets hot due to high outdoor temperature. Occupants should therefore be encouraged to open their windows during the night as well because at this period of time, the outdoor temperature is much lower than indoor temperature. According to Kubota et al. (2009), night ventilation reduces both indoor air temperature and nocturnal air temperature by 2.50C and 2.00C respectively. Hence, it is sensible to suggest that opening windows during the night to let in cool outdoor breeze is more effective than opening windows only during daytime in order to
Pertanika J. Soc. Sci. & Hum. 23 (4): 885 – 904 (2015)
Ibiyeye, A. I., Mohd, F. Z. J. and Zalina, S.
900
improve ventilation rate. However, results from Kubota and Ahmad (2005) indicate that insects and security issues are the major reasons why occupants of terraced houses do not open their windows during the night.
CONCLUSION AND RECOMMENDATIONS
In this paper, the natural ventilation provisions of living spaces in five selected terrace house design types in Precincts 11 and 14, Putrajaya were investigated to see whether these provisions are compliant with the UBBL requirements. Furthermore, computer simulations using the IES software were conducted to find out the delivered ventilation rates through each opening type. Eight window types were identified in all the house types; these window types varied in their sizes, patterns and locations within the house. In revealing the extent to which these window types conform to the UBBL requirements in respect to their opening area, two out of the five terraced house types have operable opening areas that are not in accordance with the law requirement of 10%. In addition, all house types totally ignore the requirement of 5% fixed opening. Further analysis into the performance of the natural ventilation provisions shows that house types with openings that are UBBL compliant turned out to exhibit higher ventilation rates than house types with non-compliant openings. More importantly, it turned out that a house type with an internal courtyard and installed with both
fixed openings and operable (with sizes that are in accordance with UBBL) had the highest ventilation rate.
Hence, larger opening areas as well as longer duration of opening windows contributed to higher ventilation rates, which in turn led to a healthy indoor environment. A large opening area as stipulated in the UBBL (both 10% window area and 5% uninterrupted fixed area) are essential for efficient exchange of air from outdoor to the internal environment. In addition, ventilation rates supplied into a space can further be improved if occupants utilise window openings not only during the daytime but also at night.
It is recommended that future housing designs should incorporate maximum use of wall area to provide window openings that are large enough to admit considerable amount of air needed for adequate ventilation. However, in order to achieve maximum compliance to the stated by-law governing the opening areas, the by-laws should be strictly enforced by the government agencies on builders and designers during both design and construction stages. Furthermore, since insects and security are the major reasons for not opening windows at night, it is recommended for devices such as iron grilles and insect nettings to be incorporated within the opening space without jeopardising the flow of air in and out of the indoor environment.
Findings in this paper have implications for the regulatory stakeholders, designers and the clients of residential building sector
Pertanika J. Soc. Sci. & Hum. 23 (4): 885 – 904 (2015)
Natural Ventilation
901
in three ways: 1) they increase awareness of the importance of unobstructed opening designs on the quality of indoor environment and health of occupants; 2) they emphasise the need to increase the duration of opening windows and to embrace night ventilation as a means of improving natural ventilation in homes; and 3) they highlight the need for an effective enforcement of UBBL compliance for the purpose of building approvals.
As this research is only based on five different terraced house design types in Putrajaya, a more comprehensive study is recommended to assess the general ventilation provisions in the Malaysian housing sector as a whole. Since the results are purely based on computer simulation, it is highly recommended for physical measurements to be conducted to validate the results of this study. Future work should be done to include residential natural ventilation improvement that will incorporate other architectural features and environmental factors.
ACKNOWLEDGEMENTS
This work was supported by the Malaysian Ministry of Higher Education, under Exploratory Research Grant Scheme [ERGS/1/11/SSI/UPM/01/8]. The authors also acknowledge the contributions of Husam Abdul Fatah Haron during the building simulation stage.
REFERENCESAhmad, H., Fadlie, M. Y., Yahaya, N., & Abu, J.
(2011). The means of escaping for occupants for renovation works of terrace houses in Malaysia. Procedia Engineering 20,188–192.
Ahmed, A. Z., Rahman, S. A., & Shahrani, S. (2004). CO and CO2 concentrations in naturally-ventilated houses in Malaysia. In: 21st Conference on Passive and Low Energy Architecture, Eindhoven, The Netherlands, September 19–22.
Aizat, I. S., Juliana, J., Norhafizalina, O., Azman, Z. A., & Kamaruzaman, J. (2009). Indoor air quality and sick building syndrome in Malaysian buildings. Global Journal of Health Science, 1(2), 126–135.
Andersen, R. V., Toftum, J., Andersen, K. K., & Olesen, B. W. (2009). Survey of occupant behaviour and control of indoor environment in Danish dwellings. Energy and Buildings, 41(1), 11–16.
Attia, S., Beltrán, L., De Herde, A., & Hensen, J. (2009). “Architect Friendly”: A comparison of ten different building performance simulation tools. In: 11th IBPSA Building Simulation Conference, International Building Performance Simulation Association, Glasgow, July 27-30.
Behrendt, B. M., Raimondo, D., Zhang, Y., Schwarz, S., Christensen, J. E., & Olesen, B. W. (2011). A system for the comparison of tools for the simulation of water-based radiant heating and cooling system. In: 12th Conference of International Building Performance Simulation Association. Proceedings of Building Simulation, Sydney, November 14-16.
Chan, L. S., Chow, T. T., Fong, K. F., & Lin, Z. (2009). Investigation on energy performance of double skin façade in Hong Kong. Energy and Buildings, 41(11), 1135–1142.
Pertanika J. Soc. Sci. & Hum. 23 (4): 885 – 904 (2015)
Ibiyeye, A. I., Mohd, F. Z. J. and Zalina, S.
902
Daghigh, R. (2009). Thermal comfort in naturally ventilated office under varied opening arrangements: Objective and subjective approach. European Journal of Scientific Research, 26(2), 260–276.
Fabi, V., Andersen, R. V., Corgnati, S., & Olesen, B. W. (2012). Occupants’ window opening behaviour: A literature review of factors influencing occupant behaviour and models. Building and Environment, 58,188–198.
Fisk, W. J., Mirer, A. G., & Mendell, M. J. (2009). Quantitative relationship of sick building syndrome symptoms with ventilation rates. Indoor air, 19(2), 159–65.
Guo, H., Morawska, L., He, C., & Gilbert, D. (2008). Impact of ventilation scenario on air exchange rates and on indoor particle number concentrations in an air-conditioned classroom. Atmospheric Environment, 42(4),757–768.
Hassan, A. S., & Ramli, M. (2010). Natural ventilation of indoor air temperature: A case study of the traditional Malay house in Penang. American Journal of Engineering and Applied Science, 3(3), 521–528.
Hanafiah, M. A. (2005). The effectiveness of natural ventilation design in low cost housing. (Unpublished master dissertation), Universiti Teknologi Malaysia, Malaysia.
Integrated Environmental solution IES<VE> software. (2012). Integrated Environmental Solutions Limited.
Kubota, T. (2006). Usage of air-conditioners and windows in residential areas in Johor Bahru city: planning methods of coastal residential areas in consideration of wind flow. In: The 7th International Seminar on Sustainable Environment & Architecture, Hasanuddin University Makassar Indonesia, November 20–21.
Kubota, T., & Ahmad, S. (2005). Questionnaire survey on behavior for natural ventilation and electricity consumption in terraced houses: A case study of Johor Bahru City. In: Asian Planning Schools Association (APSA) Conference, Peneng, Malaysia, September 11-14.
Kubota, T., Chyee, D. T. H., & Ahmad, S. (2009). The effects of night ventilation technique on indoor thermal environment for residential buildings in hot-humid climate of Malaysia. Energy and Buildings, 41(8), 829–839.
Laws of Malaysia, Uniform Building By-Laws, Act 133 (15th ed., vol. 133). (2008). Kuala Lumpur: MDC Publishers Sdn Bhd.
Lee, H., Lee, Y. J., Park, S. Y., Kim, Y. W., & Lee, Y. (2012). The improvement of ventilation behaviours in kitchens of residential buildings. Indoor Built Environment, 21(1), 48–61.
Leng, P. C., Ahmad, M. H., Ossen, D. R., & Hamid, M. (2012). Investigation of integrated environmental solutions-virtual environment software accuracy for air temperature and relative humidity of the test room simulations. UMT 11th International Annual Symposium on Sustainability Science and Management, Terengganu, Malaysia, July 9-11.
Marr, D., Mason, M., Mosley, R., & Liu, X. (2012). The influence of opening windows and doors on the natural ventilation rate of a residential building. HVAC and R Research, 18(1–2), 195–203.
Mohammadi, A. R., Tahir, M. M., Usman, I. M. S., Surat, M., & Ismail, A. H. (2010). The effect of balcony to enhance the natural ventilation of terrace houses in the tropical climate of Malaysia. The Journal of Design + Built. 3, 105–113.
Pertanika J. Soc. Sci. & Hum. 23 (4): 885 – 904 (2015)
Natural Ventilation
903
Muhamad-darus, F., Zain-ahmed, A., & Talib, M. (2011). Assessment of indoor air quality in terrace houses. Journal of Environment and Health, 2(2), 8–14.
Nantka, M. B. (2006). Indoor conditions in silesian buildings with natural ventilation. Indoor Built Environment, 15(6), 571–582.
Nielsen, T. R., & Drivsholm, C. (2010). Energy efficient demand controlled ventilation in single family houses. Energy and Buildings, 42(11), 1995–1998.
Rijal, H. B., Tuohy, P., Humphreys, M. A., Nicol, J. F., Samuel, A., & Clarke, J. (2007). Using results from field surveys to predict the effect of open windows on thermal comfort and energy use in buildings. Energy and Buildings, 39, 823–836.
Sadafi, N., Salleh, E., Lim, C. H., & Jaafar, Z. (2008). Potential thermal impacts of internal courtyard in terrace houses: A case study in tropical climate. Journal Applied Science, 8(15), 2770–2775.
Sadrzadehrafiei, S., Mat, K. S. S., & Lim, C. H. (2011). Determining the cost saving and emission reduction of optimum insulation thickness and air gap for building walls. Australian Journal of Basic and Applied Sciences, 5(12), 2287–2294.
Santamouris, M. (2005). Energy in the urban built environment: The role of natural ventilation. In C. Ghiaus & F. Allard (Eds.), Natural Ventilation in the Urban Environment: Assessment and Design (pp. 1-19). London: Earthscan.
Sekhar, S. C., & Goh, S. E. (2011). Thermal comfort and IAQ characteristics of naturally/mechanically ventilated and air-conditioned bedrooms in a hot and humid climate. Building Environment, 46(10), 1905–1916.
SeoRyungJu, Bin Omar, S. (2011). A typology of modern housing in Malaysia. 1st South East Asia Housing Forum of ARCH, Seoul, Korea, October 1–12.
Smith, K. A., Sullivan, J. O., Vincent, K. R., Barden, J. L., Martin, P. D., Mellish, C. M. L., … Murphy, E. B. T. (2011). International Energy Outlook. U.S.: Energy Information Administration.
Sun, Y., & Sundell, J. (2013). On associations between housing characteristics, dampness and asthma and allergies among children in Northeast Texas. Indoor Built Environment, 22(4), 678–684.
Suruhanjaya Tenaga (Malaysian Energy Comission). (2011). National Energy Balance. Malaysia (p. 58). Suruhanjaya Tenaga Malaysia.
Wong, N. H., & Huang, B. (2004). Comparative study of the indoor air quality of naturally ventilated and air-conditioned bedrooms of residential buildings in Singapore. Building and Environment, 39(9), 1115–1123.
Yamamoto, N., Shendell, D. G., Winer, M., & Zhang, J. (2010). Residential air exchange rates in three major US metropolitan areas: Results from the relationship among indoor, outdoor, and personal air study 1999-2001. Indoor air, 20(1), 85–90.
Zuraimi, M. S., & Tham, K.W. (2008). Indoor air quality and its determinants in tropical child care centers. Atmospheric Environment, 42(9), 2225–2239.