Embed Size (px)
Citation preview

JURUTERA, May 200524
F E A T U R E
1.0 INTRODUCTION1.1 Characteristics of Natural
RiversMaterials comprising the beds of alluvialrivers have an important influence onriver geometry. Bed slopes at theheadwaters of rivers are steep, and thebed material is relatively coarse. Ingeneral, both river slope and bedmaterial sizes decrease in thedownstream direction.
Figure 1.0 shows bed material of RioGrande River range in size from boulders
and cobbles to silts and clays, generallydecreasing in a downstream direction.On the Rio Grande, median particle sizedecreases from 0.5 mm at Otowi, NewMexico, to 0.14 at a point 200 milesdownstream.
Figure 2.0 shows natural riverexhibiting non-uniform bed materials atdifferent locations along the river course.It’s imperative to maintain these naturalfeatures of the river to preserve the riverequilibrium.
1.2 Bank MaterialsBank material normally changes withdistance along a stream. It is important tonote that banks are generally notcomposed of uniform materialsthroughout their height, but rather arestratified with layers of gravels, silts,sands and clays.
Riverbanks may generally beclassified as cohesive, non-cohesive, andstratified (composed of layers ofmaterials of different size, permeability,and cohesion characteristics).
1.3 Definition of Stable SectionLane (Chang, 1988) presented anexcellent definition of stable or regimechannels as follows;
“A stable channel is an unlined earthcanal for carrying water, the banks and bed ofwhich are not scoured by the moving waterand in which objectionable deposits ofsediment do not occur.”
Thus from the definition, smallamount of erosion and deposition mayoccur within river channels but for a longperiod of time, bank and bed will attaintoward stability.
Natural Stable River Section Design Using Fluvial-12
AHMAD DARUSEngineer, Drainage and Irrigation Department(DID), Malaysia
PROF. MADYA DR NOR AZAZI ZAKARIADirector, River Engineering and UrbanDrainage Research Centre (REDAC),Engineering Campus, Universiti SainsMalaysia, 14300 Nibong Tebal, Seberang PeraiSelatan, Pulau Pinang, Malaysia
PROF. MADYA DR AMINUDDIN AB. GHANIDeputy Director, River Engineering and UrbanDrainage Research Centre (REDAC), EngineeringCampus, Universiti Sains Malaysia, 14300 NibongTebal, Seberang Perai Selatan, Pulau Pinang,Malaysia
PROF. MADYA DR ROZI ABDULAHLecturer, School of Civil Engineering,Engineering Campus, Universiti Sains Malaysia,14300 Nibong Tebal, Seberang Perai Selatan,Pulau Pinang, Malaysia
ABSTRACT
Sediment transporting capacity, curvature effects as well as composition of channel bed and bank materials needto be considered by the engineer during the design process of natural channels. Neglecting these effects wouldnormally result in instability problems because channel morphology usually changes with time.
Mathematical model (FLUVIAL-12) has gradually become popular in designing stable sections because it is moreeconomical compared to physical model. The model is capable of predicting instability effects such as riverbedchanges due to erosion and sedimentation during flood, thereby providing the necessary information for thedesign or bank protection work. In this paper, the application of FLUVIAL-12 for Raia River shows that the studyreach can be preserved to its natural characteristics provided that the river bank should be covered with naturalprotection which produce the flow resistance to the value of Manning’s n = 0.045.
Keywords: Stable River Design, Sediment Transport, River Modelling, FLUVIAL-12, River Conservation
Figure 1.0: Grain Size Degradation of Rio Grande River (Peterson, 1986)

JURUTERA, May 2005 25
F E A T U R E
2.0 MATHEMATICAL MODEL(FLUVIAL-12) FORCHANNEL DESIGN
The FLUVIAL-12 (Chang 1980, 1982,1984, 1985, 1986, 1988, 1990) model hasbeen formulated and developed forwater and sediment routing in naturaland man-made channels.
Briefly, this model, for a given floodhydrograph, simulates time and spatialvariations in flood level, sedimenttransport, and bed topography (Figure3.0). In the prediction of river-channelchanges, scour and fill are tied in withwidth variation and the effect ofsecondary currents under the changingchannel curvature. In the model, scourand fill are computed on the basis oflongitudinal imbalance in sedimentdischarge.
In this paper,F L U V I A L - 1 2was applied toRaia River reachnear Ipoh. Theaim of the studyis to identify thebest effectiveg e o m e t r ynatural section(Darus, 2002).C o m p a r i s o nwith the Simons& AlbertsonRegime method(Chang, 1988) isalso made(Figure 4.0).
3.0 METHODOLOGY3.1 Case Study of Raia RiverRaia River is an important tributary ofKinta River. It has a catchment area of 192km2 covering the areas in Ipoh and KintaValley. Figure 5.0 shows Raia River studyarea started at Kampong Tanjung Bridge(Ch. 2800m) and extends upstream for adistance of about 2.8 km.
3.2 Study ProceduresSimulations using the FLUVIAL-12mathematical model carried out by using
several input data such as hydrographand rating curve obtained from DID. Bedand bank material as well as crosssections profiles at selected gaugingstations shown in Figure 6.0 were takenfor comparison with the simulatedresults. Cross sections used in thesimulation process were obtained from aDID survey plan in 1999.
4.0 DESIGN CONFIGURATIONOF RAIA RIVER
4.1 Selected Cross SectionAn appropriate cross section wasidentified and selected to conveymaximum discharge and furthermore theimportant task is to minimize the
Figure 2.0: Natural River Exhibiting Non-Uniform Bed Materials (8th January 2003)
Figure 3.0: Flow Chart Showing Major Steps of Computation for FLUVIAL Model
(Chang 1988, 1993)
Figure 4.0 Methodology for Identifying,Analyzing and Modeling Instability Problem
(Darus, 2002)
Figure 7.0 : Selected Cross Section Design for Raia River
Figure 6.0 : Study Reach of Raia River (Darus, 2002)
instability problem. Due to inadequateriver reserve at site, the cross section asshown in Figure 7.0 was adopted(uniform for all cross section).
4.2 Hydrology
a). HydrographFigure 8.0 shows the predictedhydrograph based on land use until 2020that was used for the design process(Darus, 2002).
b). Flow Rating CurveThe rating curve for the simulationprocess was derived from thedownstream section using Manning’sformula (Figure 9.0)
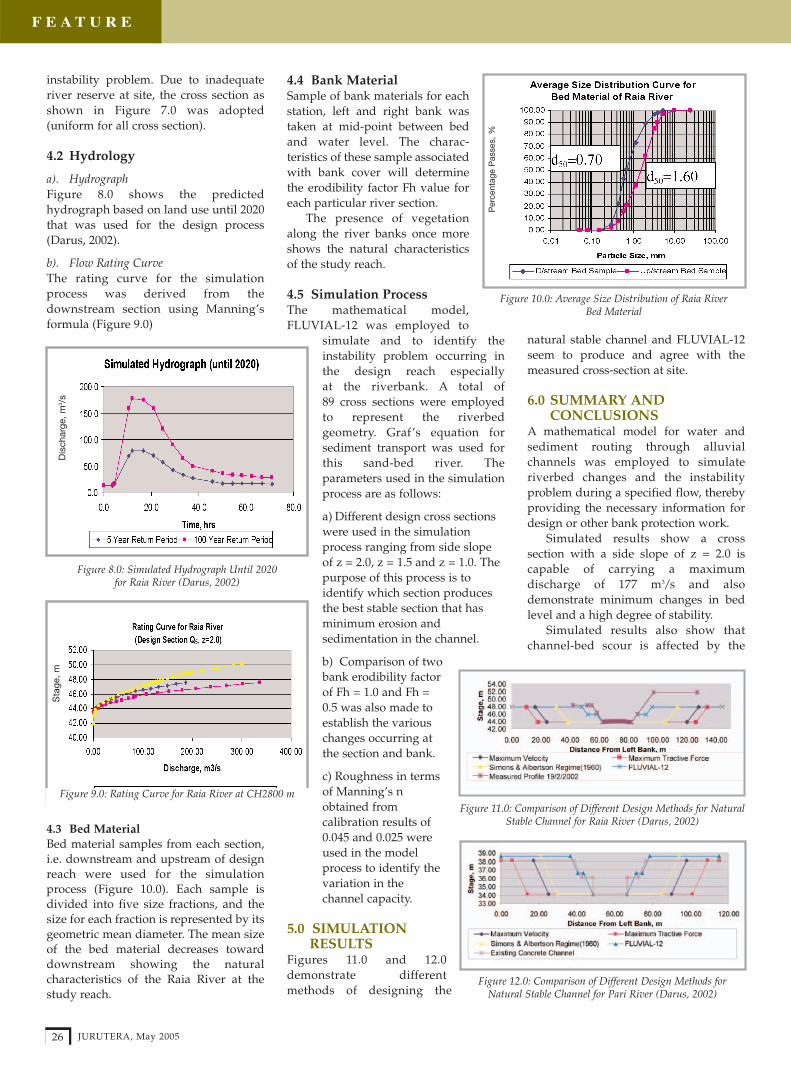
4.3 Bed MaterialBed material samples from each section,i.e. downstream and upstream of designreach were used for the simulationprocess (Figure 10.0). Each sample isdivided into five size fractions, and thesize for each fraction is represented by itsgeometric mean diameter. The mean sizeof the bed material decreases towarddownstream showing the naturalcharacteristics of the Raia River at thestudy reach.
4.4 Bank MaterialSample of bank materials for eachstation, left and right bank wastaken at mid-point between bedand water level. The charac-teristics of these sample associatedwith bank cover will determinethe erodibility factor Fh value foreach particular river section.
The presence of vegetationalong the river banks once moreshows the natural characteristicsof the study reach.
4.5 Simulation ProcessThe mathematical model,FLUVIAL-12 was employed to
simulate and to identify theinstability problem occurring inthe design reach especially at the riverbank. A total of 89 cross sections were employedto represent the riverbedgeometry. Graf’s equation forsediment transport was used forthis sand-bed river. Theparameters used in the simulationprocess are as follows:
a) Different design cross sectionswere used in the simulationprocess ranging from side slopeof z = 2.0, z = 1.5 and z = 1.0. Thepurpose of this process is toidentify which section producesthe best stable section that hasminimum erosion andsedimentation in the channel.
b) Comparison of twobank erodibility factorof Fh = 1.0 and Fh =0.5 was also made toestablish the variouschanges occurring atthe section and bank.
c) Roughness in termsof Manning’s nobtained fromcalibration results of0.045 and 0.025 wereused in the modelprocess to identify thevariation in thechannel capacity.
5.0 SIMULATIONRESULTS
Figures 11.0 and 12.0demonstrate differentmethods of designing the
natural stable channel and FLUVIAL-12seem to produce and agree with themeasured cross-section at site.
6.0 SUMMARY ANDCONCLUSIONS
A mathematical model for water andsediment routing through alluvialchannels was employed to simulateriverbed changes and the instabilityproblem during a specified flow, therebyproviding the necessary information fordesign or other bank protection work.
Simulated results show a crosssection with a side slope of z = 2.0 iscapable of carrying a maximumdischarge of 177 m3/s and alsodemonstrate minimum changes in bedlevel and a high degree of stability.
Simulated results also show thatchannel-bed scour is affected by the
Figure 8.0: Simulated Hydrograph Until 2020 for Raia River (Darus, 2002)
Dis
char
ge,
m3 /
s
Figure 9.0: Rating Curve for Raia River at CH2800 m
Sta
ge,
m
Figure 10.0: Average Size Distribution of Raia River Bed Material
Per
cent
age
Pas
ses,
%
Figure 11.0: Comparison of Different Design Methods for NaturalStable Channel for Raia River (Darus, 2002)
Figure 12.0: Comparison of Different Design Methods forNatural Stable Channel for Pari River (Darus, 2002)
JURUTERA, May 200526
F E A T U R E

JURUTERA, May 2005 27
F E A T U R E
channel curvature. The scour depthincreases as flow enters a bend;maximum scour is generally reached atthe bend exit, followed by a gradualdecrease in transverse bed slope andscour depth with the decline in spiralmotion.
7.0 REFERENCES
Chang, H. H., (1980). “Stable alluvialcanal design.” Journal Hydraulics. Div.,Proceedings, ASCE, vol. 106 No. HY5.
Chang, H. H., (1982). “Fluvialhydraulics of deltas and alluvial fans.”Journal Hydraulics. Div., ProceedingsASCE, Vol. 108, No. HY11, Nov., pp.1282-1295.
Chang, H. H., (1982). “Mathematicalmodel for erodible channels.” JournalHydraulics. Div., ASCE, 108(HY5), pp.678-689.
Chang, H. H., (1984). “Modeling riverchannel changes.” Journal Hydraulics.Engrg., ASCE, 110(2), pp. 157-172.
Chang, H. H., (1985). “Channel widthadjustment during scour and fill.”Journal Hydraulics. Engrg., ASCE, vol.111, No. 10, Oct., pp. 1368-1370.
Chang, H. H., (1985). “Water andsediment routing curved channels.”Journal Hydraulics. Engrg., ASCE,111(4), pp. 644-658.
Chang, H. H., (1986). “River channelchanges: adjustments of equilibrium.”Journal Hydraulics. Engrg., ASCE, vol.112, No. 1, January, pp. 43-55.
Chang, H. H., (1988). “Computer-aideddesign for channelisation.” JournalHydraulics. Engrg., ASCE, vol. 114, No.11, Nov., pp. 1377-1389.
Chang, H. H., (1988). “Fluvial processesin river engineering.” John Wiley andSons, New York.
Chang, H. H., (1990). “Hydraulicdesign of erodible-bed channels.”Journal Hydraulics. Engrg., ASCE, vol.116, No. 1, January, pp. 87-101.
Chang, H. H., (1993). “FLUVIAL-12User Manual.”
Petersen, M. (1986). “RiverEngineering.” Prentice-Hall, EnglewoodCliffs, New Jersey.
Darus, A. (2002). “Conservation andRestoration of Urban Rivers : Case Studiesof Raia River and Pari River.” MSc Thesis,Universiti Sains Malaysia.
CONDOLENCE MESSAGE
With deep sadness, the Institution would like to announcethe demise of IEM Council Member,
ALLAHYARHAM IR. MOHAMAD NIZAR BINHAJI HASSAN (M 13444) on 20th March 2004 and
wish to extend our condolences to his family. The Institution would like to thank him for his past
support and contributions.

JURUTERA, May 2005 29
F E A T U R E
IntroductionBefore, when it came to industrialwastewater treatment, Malaysiancorporations usually relied on foreignexperts to design and build the treatmentsystems for them.
Now, our local wastewater treatmentcompanies have gradually developed thetechnical expertise in this specializedfield and they are capable of designingsystems that are equally effective or evenbetter than their foreign counterparts. Inaddition, Malaysian companies relymostly on local fabrications, and hence,can maintain a low cost.
This article summarizes treatmentprocesses for recycled paper milleffluent. They have been proven to workwell for the three leading recycled papermills in the country. The systems wereinstalled by CG Environmental SystemsSdn. Bhd. (www.cges.com.my)
Treatment technologyFigure 1 shows the treatment technologyused in these three factories.
Part I : Primary TreatmentCoarse solids (cans, paper) are removedusing an automatic bar screen.Wastewater flow and contaminants areequalized in an equalisation tank thatuses coarse bubble diffusers for mixing.
Fine solids (fibres) are removed usinga static fine screen. Fibres can be recycledback to the factory for reuse.
Chemicals are added to condition thewastewater in the coagulation and
flocculation processes. This aids in theremoval of suspended solids before thenext stage of biological treatment.Without the removal of solids, biologicalsystems will not work well. This isbecause:• Solids replace biomass and less
will be available for contaminantremoval.
• Solids need to be broken down bythe biomass that is intended forremoval of other contaminants (indissolved form.)
• Some solids could be toxic to thebiomass.
Solids separation from thewastewater is done with a dissolved airflotation clarifier. Solids, mostly insuspended form, are floated to thesurface with the aid of small air bubbles.From the surface, they are skimmed offinto a sludge holding tank.
Part II : Secondary TreatmentSecondary treatment is mainly intendedfor dissolved contaminant removal. Atwo-stage biological system is used in the
secondary treatment. The first stageconsists of a trickling filter tower (TFT).The second stage is an extended aerationsystem (EAS).
The advantages compared to a singlestage biological system are:• Higher COD removal efficiency. • Greater shock-load resistance: TFT
absorbs shock-load better than singleEAS.
• Lower sludge production: TFT haslow sludge production.
• Lower energy consumption: TFTuses energy more efficiently thenEAS.
The trickling filter tower is anattached growth system using cross-flowplastic media to support the growth of abiomass slime layer. Different types ofbacteria will grow on the layer:• The inner layer consist of mainly
anaerobic biomass.• The outer layer is predominantly
aerobic biomass.
Wastewater is pumped to the top ofthe tower from where it is sprayed downonto the media. It then trickles down thetower. The trickling filter tower will alsoassist in cooling down the wastewater tothe temperature for optimum bacterialactivity.
The extended aeration tank is asuspended growth system. The aerobicbiomass uses oxygen to break down theorganic pollutants in the wastewater. Thesupply of this oxygen to the biomassrequires the highest amount of energy in
Wastewater Treatment for the Recycled Pulpand Paper Industry.....................................................................................................................................................................................................................
By: Ir. David C. Keow, CG Environmental Systems Sdn. Bhd.
Figure 2 : Static screen
Figure 1 : Flow chart WWTP
Figure 4 : Trickling Filter
Figure 3 : Dissolved Air Flotation Clarifier
COARSE SCREENING EQUALIZATION
FINE SCREENINGCOAGULATION/FLOCCULATION
PRIMARYCLARIFICATION
ATTACHED GROWTH ACTIVATED SLUDGESECONDARYCLARIFIER
TERTIARYCOAG/FLOC. OR
OXIDATIONPOLISHING EFFLUENT
INFLUENT

JURUTERA, May 200530
F E A T U R E
the treatment plant. It is thereforeimportant to carefully evaluate bothcapital and operating costs of availableaeration systems (fine/coarse bubblediffuser, surface aerator, and jet aerator.)
Wastewater is then clarified in thesecondary clarifier.
Part III : Tertiary SystemTertiary treatment is required in a more stringent discharge limit area(Standard A) or if there is high level ofrecalcitrant contaminants that cannot beremoved in the secondary system.Tertiary coagulation or oxidation processis proven to work well for this type of wastewater.
Tertiary treatment is alwaysexponentially more expensive to operatethan biological treatment. Table 1 showsthe cost for the biological systems andtertiary treatment processes. It is clearthat TFT is the most energy efficientprocess. The cost to remove the refractoryCOD in the tertiary system is very high.
[RM/kgMill 1 Mill 2 Mill 3 Ave.COD]
TFT 0.14 0.12 0.17 0.14
EAT 0.18 0.25 0.28 0.24
Tertiary 6.6 - - 6.6
Polishing with a multi media filter(MMF) can be used as a final step forremoval of suspended solids fromtreated water. A multi media filter usesdifferent sizes of sand and anthracite toremove these solids.
Part IV Sludge Management Minimizing sludge generation inwastewater treatment systems should beconsidered, examples are:• Recycling the fibre back to factory.• Implementing a low sludge yield
biological system (such as the two-stage system.)
• Optimizing aeration in aeration tank.• Optimizing chemical usage.
Final dewatering of the sludge iscommonly done with either belt or screwpress type de-watering equipment.
An option to include in the system is recycling of treated wastewater.However, the total dissolved solids (TDS)in the treated water can be high and totalrecycling of treated water may not bepractical due to increase of TDSovertime. Partial recycling, of treatedwater up to 50% of the volume, is beingpracticed in some of the mills.
System DesignThe design of the system depends onseveral factors:• Wastewater characteristics have to be
checked and evaluated.• Integration of existing components in
the new system.• Land availability.• Site condition.
Recycled paper mills produce avariety of products like tissue, brownpaper, liner, newspaper, etc. Variousproduction techniques are used in theproductions of these papers. Dependingon the paper quality that is required,sometimes a bleaching process is used.
These variations result in a variationin the quantity and strength of thewastewater produced:• Higher water consumption ➞ lower
strength (pollutants in wastewater arediluted.)
• Higher quality paper ➞ higherstrength (pollutants from paper endup in wastewater.)
This variation occurs betweendifferent mills as shown in Table 2.
The variation also occurs within onemill. Figure 7 shows the variation in CODof the incoming wastewater.
Table 2 : Parameters Paper Mills
Parameter Unit Mill 1 Mill 2 Mill 3
Water m3/ton 15 25 40usage
Flowrate m3/day 10,000 8,500 15,000
Raw COD mg/l 5,000 3,500 3,000
Raw BOD mg/l 1,500 1,200 1,000
Raw TSS mg/l 4,000 1,500 1,200
COD after mg/l 2,000 1,200 900coag/floc
Conclusions
• A two stage biological system cansave costs due to reduced powerconsumption and sludge production.It can also reduce upsets to thetreatment plant.
• Attention has to be paid to theoption of recycling sludge andwastewater.
• Design of the system requires greatattention. Even though the treatmentconcept for the three mills is thesame, design parameters aredifferent due to the variation inincoming wastewater strength. ■
Figure 5 : Aeration Tank with DiffusedAeration System
Table 1 : Treatment cost comparison
Figure 6 : MMF and Secondary Clarifier
Note: Trendline is the 4-day moving average
Figure 7 : Variation in raw COD Mill 1

JURUTERA, May 2005 31
A N N O U N C E M E N T
The visit to PETRONAS Penapisan (Melaka) Sdn Bhd(PPMSB) organised by the Oil, Gas and
Mining Technical Division scheduled on 23 April 2005(Saturday) has been postponed to 18 June 2005 (Saturday).
Members who are interested to join the visit, pleasecontact Puan Jamaliah at 03-79684012 or e-mail to [email protected].
CONGRATULATE MESSAGE
Receive IEM Announcements Early Via E-mail45% of IEM Members receive notices and announcements via e-mail. The iem-announce mailing list is a low traffic list;announcement e-mails are sent only by the Secretariat so you will not receive any spam from us.
We urge online members to join the mailing list, as this would allow IEM to disseminate important news and informationto members more quickly. Kindly complete your details below and fax it to IEM at 603-79577678, or go to the IEM websiteat http://www.iem.org.my/ and click on Members Online; then click on IEM Discuss-Groups to get the form for subscribingto the mailing list.
Contact Details for Subscribing to IEM Announcements Via E-mail
I would like to receive announcements from IEM via e-mail. Please subscribe me to the IEM announcements mailing listusing the e-mail address given below:
Name : _____________________________________________________________________________________________________
Membership No. : _______________________________________ (if applicable)
Grade : ■■ Graduate ■■ Member ■■ Fellow ■■ Affiliate
■■ Others (please specify) ___________________________________________________________________________
___________________________________________________________________________
E-mail Address : _____________________________________________________________
The Institution would like to congratulate
IR. DR ANDY SEO KIAN HAW (F 13276)
on being awarded the
“Darjah Kebesaran Setia Mahkota Selangor (SMS)”
from the
Sultan of Selangor in conjunction with His Royal Highness’s 59th Birthday
on
13th December 2004
and also conferred the
Honorary Degree of Doctor of Science (Hon. DSc.)
from
The University of Hertfordshire, England, United Kingdom, London
on
20th March 2005

JURUTERA, May 200532
IntroductionHydropower is the only renewableenergy technology that is presentlycommercially viable on a large scale. It has four major advantages, namely it is renewable, it produces negligibleamounts of greenhouse gases, it is theleast costly way of storing large amountsof electricity, and it can easily adjust the amount of electricity produced to theamount demanded by consumers.Hydropower accounts for about 17% of global generation capacity and about 20% of the energy produced eachyear [1].
Hydropower provides about 10% ofthe electricity in the United States.Norway produces more than 99% of itselectricity with hydropower and NewZealand uses hydropower for 75% of itselectricity [2]. Malaysia uses hydropowerfor 11% of its electricity [3].
Hydropower energy is widely usedthroughout the world, varying in sizefrom small (mini-hydro) to mammothschemes serving several countries orregions. Industrialised countries haveutilised their hydro potential to aconsiderable extent, although in thedeveloping world, particularly in theequatorial and tropical belts, the use ofhydropower is an option withconsiderable potential for satisfyingenergy needs.
How is Hydropower Generated?Most conventional hydropower plantswill include four major components:• Dam. Raises the water level of the
river to create falling water. The damalso controls the flow of water andthe reservoir created is in effectstored energy.
• Turbine. The force of falling waterpushing against turbine bladescauses the turbine to spin. A waterturbine is much like a windmill,except that the energy is provided byfalling water instead of wind. Theturbine converts the kinetic energyof falling water into mechanicalenergy.
• Generator. Connected to the turbineby shafts and possibly gears so whenthe turbine spins it causes thegenerator to spin as well. Thisconverts the mechanical energy fromthe turbine into electrical energy.Generators in hydropower plantsworks like generators in other typesof power plants.
• Transmission lines. Conductselectricity from the hydropowerplant to houses and businesses.
Examples of major hydropowerplants in Malaysia are those belonging toTNB, namely the Kenyir Sultan MahmudPower Station with 400MW installedcapacity, the Pergau Hydroelectric PowerStation with 600MW installed capacityand the Temenggor Hydroelectric PowerPlant with 348MW installed capacity.
The current total installed capacityfor Peninsular Malaysia as of August2004 is 17,326MW with hydro making up11.0% of the total [3]. The detailedbreakdown of energy sources is asfollows:• Hydro – 11.0%• Conventional thermal (coal) – 21.2%• Combined cycle – 11.8%
• Conventional thermal (oil/gas) –6.9%
• Gas turbine – 9.2%• Diesel – 0.4%• IPPs – 39.5%
In Peninsular Malaysia, TNB operatesa mixed hydro thermal system which isin line with the Government’s policy onfuel diversification. The IndependentPower Producers (IPP) make up almost40% of the total energy supply [3].
Overview of HydropowerDevelopmentLet us briefly look at the history ofhydropower dam development inPeninsular Malaysia. The first majordam, the Chenderoh Dam, wasconstructed in 1939. There followed a long gap before constructionrecommenced after the Second WorldWar, starting with the Sultan Abu BakarDam (Cameron Highlands) in 1963.
A temporary lull in constructionactivity occurred between the late 60sand early 70s when fuel oil was still verycompetitively priced as to offer a viablethermal alternative for power generation.
The oil price increase in the mid 70sshifted attention back to hydropower in
F E A T U R E
The Future of Hydropower in Malaysia.........................................................................................................................................................................
By: Ir. Zainal Abidin bin Othman, Managing Director, SMEC (Malaysia) Sdn. Bhd.
400MW Kenyir Hydropower Station in Terengganu

JURUTERA, May 2005 33
F E A T U R E
the overall energy development plan.This eventually led to the construction offour more dams between 1974 and 1984.These are Temengor (1974), Bersia (1980),Kenering (1980) and Kenyir (1980).
The 90s saw the development of twomore hydro schemes, namely Sg. Piah(1993) and Pergau (1991).
Currently the only major hydroproject under construction is the Bakunhydro in Sarawak.
Status of Hydropower Potential Malaysia has a total land mass of 332,000km2 and its mean elevation is about300m. The average rainfall is slightlymore than 2,600mm per year. The totalgross hydro potential is 414,000GWh/year, of which about 85,000GWh/year is available in PeninsularMalaysia. Hence, whilst PeninsularMalaysia has 39% of the land area, itsshare of hydropower resources is onlyslightly more than 20% [4].
Geographically, the peninsula isrelatively narrow, and its main range oflow mountains, the Titiwangsa Range,runs along the interior to form the mainwatershed. Thus, the river basins formedare moderately small. The largest riverbasin is Sg. Pahang with a drainage areaof 28,500 km2. In addition, topographicfeatures and rainfall are comparativelyless favourable than Sabah and Sarawak.These are the main factors whichcontributes towards the limitedhydropower resources in the peninsula.
Of the 85,000 GWh/year grosspotential, the utilised resources amount
to 4,900 GWh/year (6%) whilst another5,000 GWh/year (6%) has been identified.The Sg. Perak river basin is the mostdeveloped in terms of hydro-power development utilisation (2,500GWh/year), and it is reaching the limit ofhydropower potential development. ForPeninsular Malaysia, it has beenestimated that the economic limit ofhydropower utilisation is unlikely toexceed 10,000 GWh/year.
Future developmentAs for future hydro development inPeninsular Malaysia, several projectshave been identified and studied atfeasibility and pre-feasibility levels.These potential projects have to competewith alternative energy sources such ascoal and gas in terms of economicviability.
From the economic point of view, it isclear that hydropower requiressubstantial initial investment costs whichcan be a deterrent to potentialdevelopers. It has been proven in somecountries of the inability of the privatesector to undertake such investments.However, this should be balancedagainst the long life and low operatingcosts of hydro plants, and the fact thatthere is no consumption of fuel forenergy generation. Globally, incomparison with other plants, andconsidering the quality of the energyproduced, the balance shows a clearadvantage for hydropower.
At the 17th Congress of the WorldEnergy Council in 1998, it was concluded
that clear priority should be given to thedevelopment and use of appropriaterenewable energies with the aim oflimiting emissions resulting from the use of fossil fuels. This declarationsupports the recommendations of theInternational Hydropower Association aslisted below [5]:• The remaining hydro potential
should be developed to themaximum possible extent, providedit is implemented in a technically,economically and socially acceptableway;
• Hydropower development should gohand-in-hand (rather than incompetition) with furtherdevelopment of other renewablesources of energy;
• The cost of the kWh produced by ahydro plant is competitive. Theinitial investment is substantial butthe life of the plant is long (about 100years). This is part of the sustainablecharacter of hydropower. Theoperating cost is low. Financialsolutions will have to be found tofacilitate the initial investment inhydropower in developing countrieswithout requiring the owners to giveguarantees that they cannot afford;
• The state cannot totally entrusthydropower development to theprivate organisation (as is the casefor thermal plant). It should beinvolved in the planning anddevelopment process;
• It has been demonstrated in manycountries that hydroelectric potentialis a form of potential wealth andsustainable development. Itsimplementation, with a strongbacking of the state, contributes tothe well-being of society. ■
Kuala Yong Dam in Pergau, Kelantan
References
1. Facts you should know aboutHydropower, National HydropowerAssociation, 1966.
2. IEA Hydropower Agreement, AnnexIII, Vol. II: Main Report.
3. Tenaga Nasional Berhad AnnualReport 2004.
4. Th’ng Yong Huat (1986) “Anoverview of Hydropower Planningand Development in PeninsularMalaysia”, Proc. Seminar on TheDevelopment of Water ResourcesEngineering in Malaysia, Institutionof Engineers, Malaysia.
5. URL: http://www.worldenergy.org/wec-geis/publications/
JURUTERA, May 200534
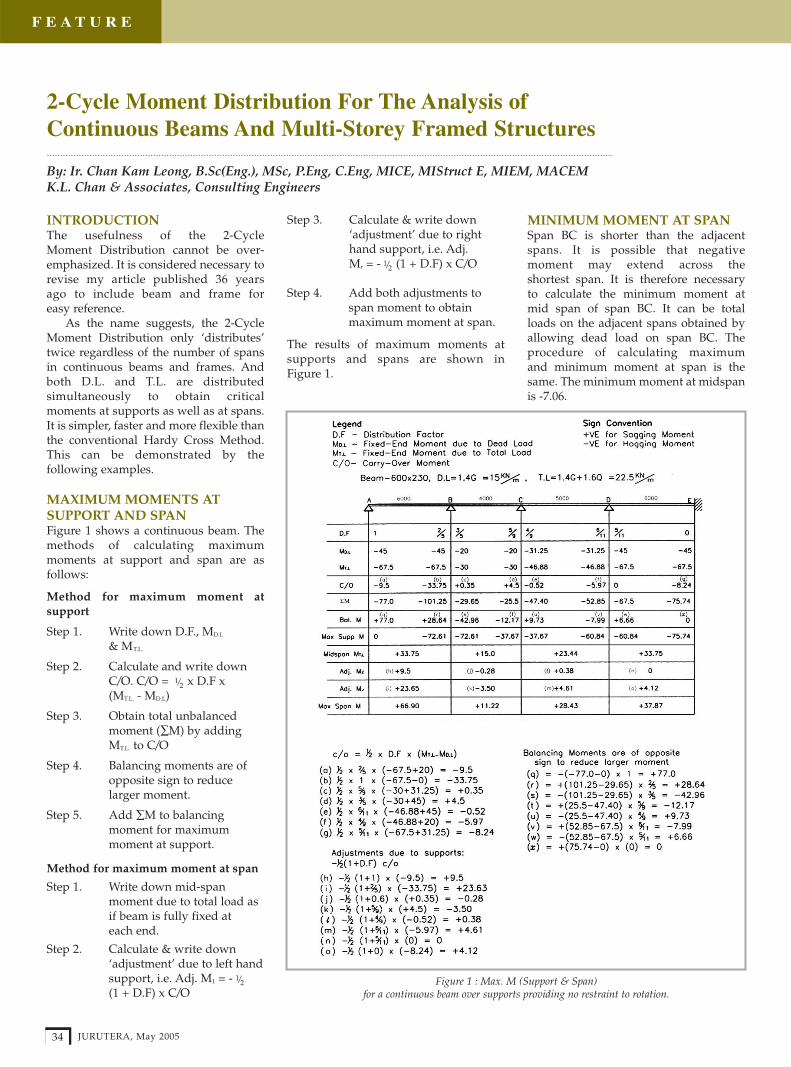
INTRODUCTIONThe usefulness of the 2-Cycle Moment Distribution cannot be over-emphasized. It is considered necessary torevise my article published 36 years ago to include beam and frame for easy reference.
As the name suggests, the 2-CycleMoment Distribution only ‘distributes’twice regardless of the number of spansin continuous beams and frames. Andboth D.L. and T.L. are distributedsimultaneously to obtain criticalmoments at supports as well as at spans.It is simpler, faster and more flexible thanthe conventional Hardy Cross Method.This can be demonstrated by thefollowing examples.
MAXIMUM MOMENTS ATSUPPORT AND SPANFigure 1 shows a continuous beam. Themethods of calculating maximummoments at support and span are asfollows:
Method for maximum moment atsupport
Step 1. Write down D.F., MD.L
& MT.L.
Step 2. Calculate and write down C/O. C/O = x D.F x (MT.L. - MD.L)
Step 3. Obtain total unbalanced moment (∑M) by adding MT.L. to C/O
Step 4. Balancing moments are of opposite sign to reduce larger moment.
Step 5. Add ∑M to balancing moment for maximum moment at support.
Method for maximum moment at span
Step 1. Write down mid-span moment due to total load as if beam is fully fixed at each end.
Step 2. Calculate & write down ‘adjustment’ due to left handsupport, i.e. Adj. M1 = -(1 + D.F) x C/O
Step 3. Calculate & write down ‘adjustment’ due to right hand support, i.e. Adj.Mr = - (1 + D.F) x C/O
Step 4. Add both adjustments to span moment to obtain maximum moment at span.
The results of maximum moments atsupports and spans are shown in Figure 1.
MINIMUM MOMENT AT SPANSpan BC is shorter than the adjacentspans. It is possible that negativemoment may extend across the shortest span. It is therefore necessary to calculate the minimum moment at mid span of span BC. It can be total loads on the adjacent spans obtained byallowing dead load on span BC. Theprocedure of calculating maximum and minimum moment at span is thesame. The minimum moment at midspanis -7.06.
1/2
1/2
1/2
2-Cycle Moment Distribution For The Analysis ofContinuous Beams And Multi-Storey Framed Structures.....................................................................................................................................................................................................................
By: Ir. Chan Kam Leong, B.Sc(Eng.), MSc, P.Eng, C.Eng, MICE, MIStruct E, MIEM, MACEMK.L. Chan & Associates, Consulting Engineers
F E A T U R E
Figure 1 : Max. M (Support & Span)for a continuous beam over supports providing no restraint to rotation.

JURUTERA, May 2005 35
F E A T U R E
DETERMINATION OF COLUMNMOMENTSFor multi storey buildings, it isconsidered satisfactory to computecolumn moments under the sameassumption used for beam moments, i.e. far lends of columns are fixed above and below the floor at whichmoments are to be determined. Column moments are computed forunbalanced floor loading, that is line loadon one side only.
Figure 2 is a sub-frame of a multi-storey structure; live load is placed on thealternate spans as shown on load patternA and load pattern B.
The method of calculating themaximum moments in columns is:
Step 1. Write down the Distribution Factors for the columns and for the beams and the M D.L
and MT.L. according to the load pattern.
Step 2. Calculate and write down the carry-over moment (C/O) and C/O = x D.F x (MT.L. - MD.L. )
Step 3. Obtain Total Unbalanced Moment (∑M) by adding MT.L. to C/O
Step 4. Maximum moments in column are obtained by multiplying the difference of the beam moments at the joint by the distribution factors of the columns.
The sign of column moments shouldbe opposite to the beam unbalancedmoments at the joint. The results of the column moments are shown inFigure 2.
It can be seen that the maximummoments in columns A, B and C are obtained from load pattern A, whereas load pattern B givesmaximum moments in column D. ■
CONCLUSIONS1. Moment coefficients may be used
only if loads and spans meet thecode requirement.
2. The Hardy Cross Method is tootime consuming.
3. The 2-Cycle Method is simplerand faster. Not only supportmoment but also span momentand column moment can beobtained fairly quickly using thismethod.
4. A structure basically consists ofbeams and columns, the 2-CycleMethod helps us to understandstructures better and thus gainconfidence. Hence, we can feeland appreciate them better.
5. It can be used to counter checkcomputer software. No structuralengineer should ever useunfamiliar software withoutapplying some verification.
6. It helps us to be a computer-aideddesign engineer and not just acomputer operator!
1/2
Figure 2 : For Max M in col
REFERENCES
[1] Portland CementAssociation, Continuity inConcrete Building Frames:Practical Analysis forVertical Load and WindPressure, 1959.
[2] Chan Kam Leong, “TwoCycle MomentDistribution.” Bulletin ofthe Institution of Engineers,Malaysia, August, 1978.
[3] Leong Tuck Wah, “Analysisof Multi-Storey FrameStructures Using The TwoCycle Moment DistributionMethod.” Bulletin of theInstitution of Engineers,Malaysia, December 1978.

JURUTERA, May 200536
R E P O R T
On 12 January 2005, the ChemicalEngineering Technical Division
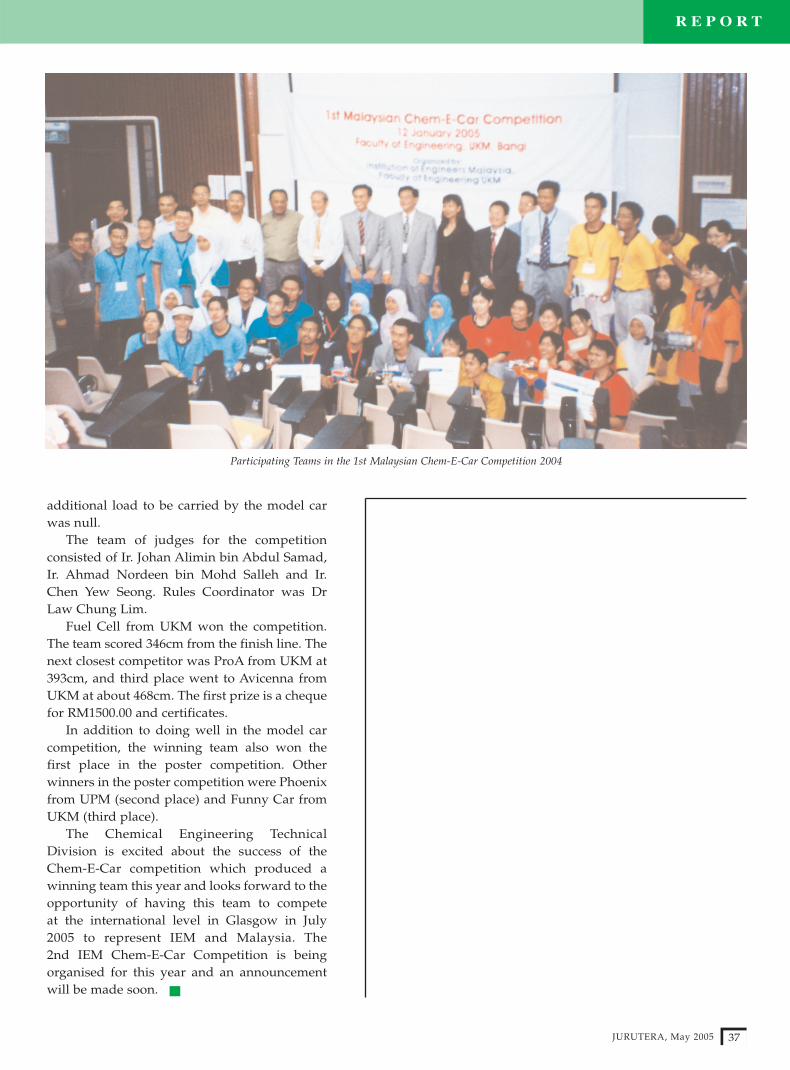
organised the 1st Malaysian Chem-E-Car 2004 Competition. UniversitiKebangsaan Malaysia is the co-organiser of this event. Thecompetition was officially opened by Ir. Prof. Abang Abdullah binAbang Ali, President of TheInstitution of Engineers, Malaysia. Ir. Prof. Abang Abdullah was pleasedto see participating students whowill be young engineers in the futurebeing very creative and innovative in making their own Chem-E-Car. The Organising Chair of Asia Pacific Confederation on ChemicalEngineering Congress 2006(APCChE 2006) announced that aregional Chem-E-Car Competition will be organised by the OrganisingCommittee in conjunction withAPCChE 2006. He was confident thatparticipating students in thisnational competition will havegained experience and will be able to compete very well with teams
from other countries duringthe regional competition.
The competition con-sisted of two sessions. Thefirst session was a posterpresentation. Participantswere given 10 minutes topresent their model car anddescribe the propulsionsystem as well as theinnovative and creativeideas they have made inareas such as propulsionsystem, safety, environ-mental issues, efficiency, etc.It was then followed by themodel car competitionwhere each team was givenfour attempts. The teamwhose model car endednearest to the end line winsthe competition.
A Chem-E-Car is a modelcar whose propulsionsystem is either a chemicalcell or a fuel cell. The powerthat is required to drive the
model car must be generated orconverted from chemical energy. Ofcourse, commercial batteries and fuelcells were not allowed in thecompetition.
Seven teams from UniversitiKebangsaan Malaysia (UKM),Universiti Malaya (UM) andUniversiti Putra Malaysia (UPM)participated in the competition. Theparticipating teams were: Pro-A,Chem-X, Funny Car, Avicenna andFuel Cell from UKM, Crest from UMand Phoenix from UPM. Oncompetition day, the participatingteams were notified that the distance to be traveled was 15m and the
UKM Chemical Engineering Students Win IEM’s1st Malaysian Chem-E-Car Competition 2004.....................................................................................................................................................................................................................
Reported by: Prof. Dr Asbi bin Ali and Dr Law Chung Lim, Chemical Engineering Technical Division
Organising Committee with the car models of the teams
“Fuel Cell” from UKM won the poster presentation
Winner for Car Model presentation
JURUTERA, May 2005 37
R E P O R T
additional load to be carried by the model carwas null.
The team of judges for the competitionconsisted of Ir. Johan Alimin bin Abdul Samad,Ir. Ahmad Nordeen bin Mohd Salleh and Ir.Chen Yew Seong. Rules Coordinator was DrLaw Chung Lim.
Fuel Cell from UKM won the competition.The team scored 346cm from the finish line. The next closest competitor was ProA from UKM at393cm, and third place went to Avicenna fromUKM at about 468cm. The first prize is a chequefor RM1500.00 and certificates.
In addition to doing well in the model carcompetition, the winning team also won thefirst place in the poster competition. Otherwinners in the poster competition were Phoenixfrom UPM (second place) and Funny Car fromUKM (third place).
The Chemical Engineering TechnicalDivision is excited about the success of theChem-E-Car competition which produced awinning team this year and looks forward to theopportunity of having this team to compete at the international level in Glasgow in July2005 to represent IEM and Malaysia. The 2nd IEM Chem-E-Car Competition is beingorganised for this year and an announcementwill be made soon. ■
Participating Teams in the 1st Malaysian Chem-E-Car Competition 2004

JURUTERA, May 200538
R E P O R T
As part of the programme for the half-day seminar on Trends and Issues in
Engineering Education, the Divisionorganised a visit to the UniversitiTerbuka Malaysia on 23 March 2005. Theuniversity, better known as OpenUniversity of Malaysia (OUM), wasofficially established on 10 August 2000.The university is located in the heart ofKuala Lumpur in Jalan Tun Ismail,within walking distance from a masstransit railway interchange station and isreadily accessible from all parts of thecity.
After the initial briefing with amultimedia presentation by Ir. Prof.Madya Dr. Rosli bin Hamir, the Dean of the Faculty of Engineering andTechnical Studies, the misconception that members of the entourage had thatthe programmes conducted by OUMwere all virtual was quickly eliminated.The OUM adopts a multi-mode learning approach where learning takesplace through real and virtual interaction
between learners and tutors via the following: self-managed learning,online learning and face-to-faceinteraction.
A tour of the CIDT (Centre forInstructional Design and Technology)where open and distance learning (ODL)materials that are used in the variousprogrammes offered by OUM aredeveloped was an eye-opener for theparticipants of the visit. The materialsinclude printed modules, online contentand multimedia content. CIDT usesproven instructional design, strategiesand methods together with the latest incommunications technology to performits functions effectively.
The Tan Sri Dr. Abdullah SanusiDigital Library comprises a wide range ofresources in print and online formats insupport of the virtual and open distancelearning concept. The online databasesconsist of Electronic Books (e-books) andElectronic Journals (e-journals). Theavailability of “MY Library (OPAC)” also
e n a b l e susers tosearch thel i b r a r ycollection.Self-servicef e a t u r e si n c l u d i n gl o a nre n e w a l s ,reservationof items onloan toother users and checking of items on loanare also available.
Despite the short period of the visit,the participants felt that OUM has a greatpotential in ensuring universityeducation reaching the masses and thatthe multimedia and distance contentsdeveloped specifically for the respectivecourses are invaluable and could beshared with other institutions of higherlearning. ■
Visit to Open University Malaysia..............................................................................................................................................................................................................................................................
Reported by: Ir. Assoc. Prof. Megat Johari bin Megat Mohd. Noor, Engineering Education Technical Division
Visit To New Straits Times Press (NSTP)...............................................................................................................................................................................................
Reported by: Ir. Mah Soo, Standing Committee on Publications
On 27 July 2004, a visit to the New Straits Times Press at 31,
Jalan Riong, Bangsar, Kuala Lumpur was organised by the IEM Secretariat for the IEM Publishing Book Project Sub-Committee to gain insight on themechanisms of publishing books.
The IEM participants on this visitcomprised of Y. Bhg. Dato’ Ir. Pang Leong Hoon, Ir. Chin Mee Poon, Ir. Mah Soo, Puan Nurul Aida and PuanAbriza.
The participants were received by Y. Bhg. Datuk Ahmad A. Talib, who is the Group General Manager for Communications & EditorialMarketing in NSTP. He gave theparticipants some insight on thefollowing topics:1. the process and stages in getting a
book published;2. what type of books NSTP had
supported;3. what ways NSTP could work with
IEM on the Book Project;
4. some examples of book formats withregards to contents, size andthickness, and the charges involved;and
5. the sources of potential contributorssuch as writers, editorial staff andpublishers.
He stressed that the objective of theBook Project should influence the bookfeatures as well as the distributionmethods. To give an impressivecorporate image, the book should beprinted on good paper with beautifullycoloured photographs. It should appealto the engineering fraternity as well as beinteresting to the general public forinformation. A coffee table type of bookwould suit the Book Project well.
He cited books published by variouscorporate and professional bodies for useas corporate gifts as well as for sale to thegeneral public and their respectiveprofessional fraternities. The book couldbe printed in hard-cover binding for
corporate use or as a collector’s item andin soft cover binding which is affordableto the general public.
He showed examples of booksproduced in collaboration with somecorporations and professionalinstitutions that were published byNSTP. They were professionally doneand portrayed an excellent corporateimage.
As for the text, information andphotographs, NSTP has an archive ofpress releases on the engineeringprofession and could offer its resourcesfor a fee. NSTP also could offer itsprofessional services from concept tofinal publication of the book with certainagreed financial terms.
Finally, the visit was concluded withthe presentation of an IEM souvenir to Y.Bhg. Datuk Ahmad A. Talib, as anappreciation for his generosity in his timeand sharing of experience with theparticipants. ■

JURUTERA, May 2005 39
R E P O R T
Shalin Zulklifi wannabes from SMHB,SSP, BENAIM and IEM G&S Section
showed up at Endah Parade on theevening of 21 February 2005 for ashowdown of bowling prowess. Fromthe number of participants that turnedup and with some bringing their ownshoes and balls, the evening lookedpromising and it sure was.
The total of 43 participants wasseparated into groups of 4 with membersfrom different companies to allowparticipants to get to know other better.Feelings of awkwardness soon faded
when the games started. Members ofeach group pushed and encouraged eachother to bowl better. Throughout theevening, shouts of delight when amember hit a strike and groans of agonywhen a pin was missed could be heardfrom the lanes we occupied. The laneswere certainly scorched that night andpresumably ‘square’ engineers can sureroll!
The night concluded around 10 p.m.with the following participants walkingaway with the prizes:
TEAM EVENTChampion: Group 7 (Jaafar, Chua MF,Choo Ah Min)1st Runner Up: Group 4 (Rafidin,Husaini, Chen L.S, Suresh)2nd Runner Up: Group 5 (Samsuar, Tan Loo Shyang, Daniel Sek, Ivan Tan)MENChampion: En. Jaafar (SMHB)1st Runner Up: Tan Loo Shyang (SMHB)2nd Runner Up: Chua MF (SMHB)
WOMENChampions: Loo A.C (SMHB)1st Runner Up: Peggy Yeo (SMHB)2nd Runner Up: Leong LY (SSP)
BEST EFFORT:Men: Wong Chee Fui (SSP)Women: Rozila (SMHB)
Graduate & Student Sect ion (IEM G&S)
MMU Cyberjaya Membership Drive........................................................................................................................................................................
Reported by: Sdri. Heah Hooi Kiang
G&S Bowling Competition
Date : 21 February 2005Venue : Endah Parade Bowling AlleyParticipants : IEM G&S, SSP, SMHB, BENAIM
“Close your eyes and imagine…” ahypnosis class? No, it was a
membership talk by the IEM G&S. DearIvan and Bernard had kicked off the talkin an interesting way, which is out of theaudiences’ expectation. In a morerelaxing circumstance instead of theformal and serious typical engineeringtalk, they successfully warmed up thefloor and had flawless interaction withthe participants.
Held on 3 March 2005, the one and ahalf hour talk in MMU Cyberjaya was
divided into two sessions. Students were introduced to the IEM G&S in thefirst session. The roles of each portfolio,as well as the activities held throughoutthe year and the benefits of joining as astudent member were clearly explained.Besides, with the sharing of experiencesand stories by both young engineers, theaudience had a chance to think abouttheir future. Hence, the determination tobecome a Professional Engineer (PE) andto get an Ir. title positively increasedamong the crowd.
Specially-designed IEM G&S t-shirts and caps were given out during the Q&A session. Questions asked bymembers of the audience were answeredin a professional way by both of the speakers. With the talk, students have managed to get a clearer picture of the role that IEM G&S can play in theirstudent life. All of the uncertainties and doubts were dispelled by the end ofthe day. ■

JURUTERA, May 200540
R E P O R T Graduate & Student Sect ion (IEM G&S)
The Trip Down To MMU Melaka...............................................................................................................................................
Reported by: Sdri. Eunice Lim Hui Lyn
On 22 March 2005, two youngengineers (Sdr. Yau Chau Fong
and Sdr. Ivan Tan) from IEM G&S andtwo student volunteers (Sdri. HeahHooi Kiang and me) from MMUCyberjaya traveled from KL down toMelaka for a membership talk held inthe Multimedia University Melakacampus. Our team of four started the
journey early in themorning and reachedMelaka by 12:30 p.m., theright time for lunch. Wehad lunch, followed by ashort tour around thehistorical city.
In the evening, after alight dinner, we drove to
MMU Melaka, themain purpose of thetrip. Around 20students attended the talkpresented by the two youngengineers. The purpose of thetalk was to introduce IEM to thestudents. Both speakersexplained about IEM, theactivities held throughout theyear and the ten benefits ofjoining IEM. They also explainedabout the procedure to be aProfessional Engineer (PE) and
the Ir. title. Finally, after thepresentation, there was a Q&A sessionwhere the students asked questionsregarding IEM and aspects of theengineering world. The questions weredutifully answered by the speakers.Some refreshments were provided tothe students and the guests of the day.After the talk, we packed up and droveback to the city. It was a great trip,tiring, but fun. ■