Embed Size (px)
Citation preview
Natural Rubber review
-1-
Natural rubber market review – Aug2010
Fundamental developments
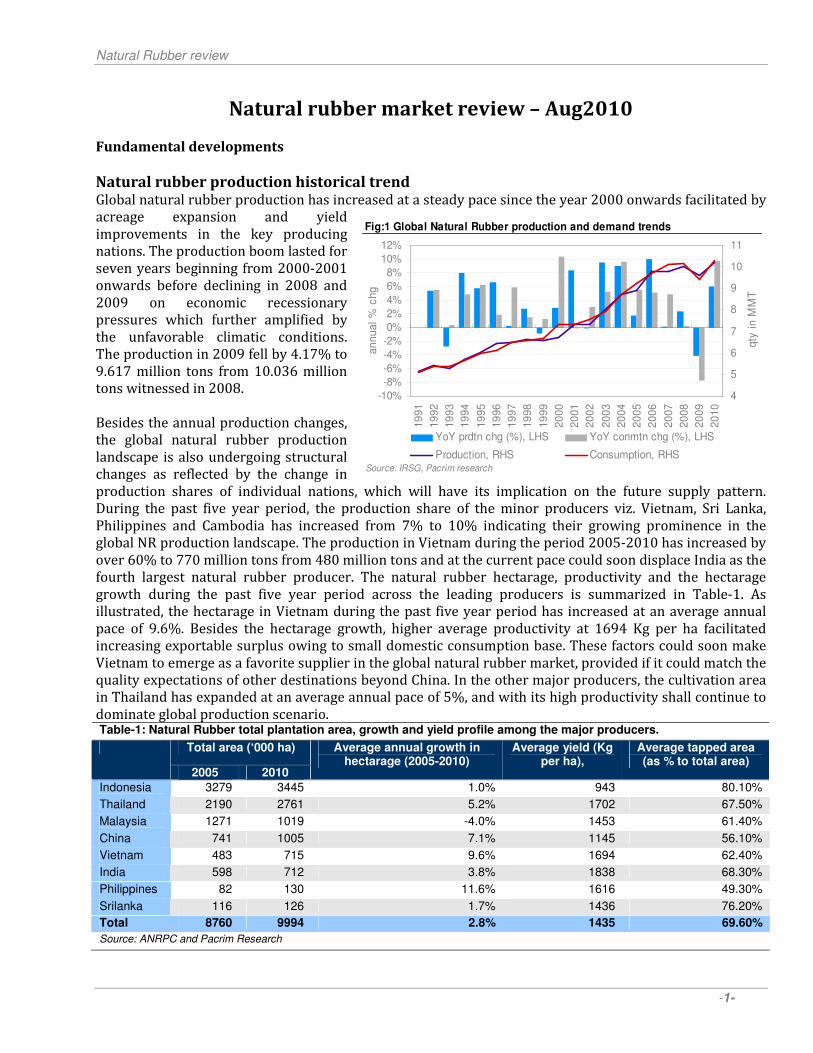
Natural rubber production historical trend Global natural rubber production has increased at a steady pace since the year 2000 onwards facilitated by acreage expansion and yield
improvements in the key producing
nations. The production boom lasted for
seven years beginning from 2000-2001
onwards before declining in 2008 and
2009 on economic recessionary
pressures which further amplified by
the unfavorable climatic conditions.
The production in 2009 fell by 4.17% to
9.617 million tons from 10.036 million
tons witnessed in 2008.
Besides the annual production changes,
the global natural rubber production
landscape is also undergoing structural
changes as reflected by the change in
production shares of individual nations, which will have its implication on the future supply pattern.
During the past five year period, the production share of the minor producers viz. Vietnam, Sri Lanka,
Philippines and Cambodia has increased from 7% to 10% indicating their growing prominence in the
global NR production landscape. The production in Vietnam during the period 2005-2010 has increased by
over 60% to 770 million tons from 480 million tons and at the current pace could soon displace India as the
fourth largest natural rubber producer. The natural rubber hectarage, productivity and the hectarage
growth during the past five year period across the leading producers is summarized in Table-1. As
illustrated, the hectarage in Vietnam during the past five year period has increased at an average annual
pace of 9.6%. Besides the hectarage growth, higher average productivity at 1694 Kg per ha facilitated
increasing exportable surplus owing to small domestic consumption base. These factors could soon make
Vietnam to emerge as a favorite supplier in the global natural rubber market, provided if it could match the
quality expectations of other destinations beyond China. In the other major producers, the cultivation area
in Thailand has expanded at an average annual pace of 5%, and with its high productivity shall continue to
dominate global production scenario. Table-1: Natural Rubber total plantation area, growth and yield profile among the major producers.
Total area (‘000 ha)
2005 2010
Average annual growth in hectarage (2005-2010)
Average yield (Kg per ha),
Average tapped area (as % to total area)
Indonesia 3279 3445 1.0% 943 80.10%
Thailand 2190 2761 5.2% 1702 67.50%
Malaysia 1271 1019 -4.0% 1453 61.40%
China 741 1005 7.1% 1145 56.10%
Vietnam 483 715 9.6% 1694 62.40%
India 598 712 3.8% 1838 68.30%
Philippines 82 130 11.6% 1616 49.30%
Srilanka 116 126 1.7% 1436 76.20%
Total 8760 9994 2.8% 1435 69.60%
Source: ANRPC and Pacrim Research
Fig:1 Global Natural Rubber production and demand trends
-10%
-8%
-6%
-4%
-2%
0%
2%
4%
6%
8%
10%
12%
19
91
19
92
19
93
19
94
19
95
19
96
19
97
19
98
19
99
20
00
20
01
20
02
20
03
20
04
20
05
20
06
20
07
20
08
20
09
20
10
an
nu
al
% c
hg
4
5
6
7
8
9
10
11
qty
in
MM
T
YoY prdtn chg (%), LHS YoY conmtn chg (%), LHS
Production, RHS Consumption, RHSSource: IRSG, Pacrim research

Natural Rubber review
-2-
Current scenario, NR production expected to rebound in the year 2010….
The natural rubber production is seen rebounding in 2010 from the depressed production levels witnessed in 2009. The production in the leading
producers viz. Thailand, Indonesia, Malaysia
and India which together accounted for 75%
of the global production in 2009, witnessed
good increase in the first half of 2010
compared to the corresponding period
previous year level as illustrated in Fig-2.
This coupled with the expected production
growth in the minor producers viz. Vietnam,
Sri Lanka and Cambodia could facilitate a
positive growth for the year 2010. Following
the growth in the first half of 2010, the
production in 2010 is currently projected at
10.2 million tons, higher by around 6% from
the previous year level of 9.617 million tons.
Natural Rubber consumption
Natural rubber on account of its
elasticity, resilience and toughness is
used in a variety of industrial and
durable goods components, among
which automobile is the major
segment that accounts for 70% of the
total consumption. Thus the natural
rubber demand closely tracks
automobile production trends as
illustrated in Fig-3. The natural
rubber demand grew uninterrupted
at an annual average rate of 5.58%
during the period 2002 to 2007
facilitated by the rapid growth in
automobile segment and booming
economic climate before succumbing
to the global recessionary pressures
in 2008 and 2009. As illustrated in
the chart, the global automobile production slumped in 2009, which has declined by 12.5% to 61.71 million
units from the previous year production level of 70.52 million units. Natural rubber consumption also
witnessed its worst annual decline in 2009, which fell by 7.7% to 9.39 million tons from the previous year
peak consumption level of 10.17 million tons. Major declines were observed in US and Japan followed by
other nations. The change in consumption in 2009 over 2008 across the major nations is illustrated in Fig-
4.
Fig-2: NR production changes in 1h 2010 over 1h 2009
21.1%
14.3%
13.9%
6.5%3.1% 0.2%
9.7%46.7%
0
200
400
600
800
1000
1200
1400
1600
Th
aila
nd
(Jn
-Ju
n)
Ind
on
esia
(Jn
-My)
Ma
laysia
(Jn
-Ju
n)
Ind
ia (
Jn
-
Jly
)
Vie
tna
m
(Jn
-Jly
)
Ch
ina
(Jn
-
Ju
n)
Sri
lan
ka
(Jn
-Jly
)
Ca
mb
od
ia
(Jn
-Jly
)
pro
duction in '000 T
ons
200820092010
change in 2010 over 2009
Source: ANRPC and Pacrim research
Fig-3: Global automobile production vs. natural rubber
consumption, Year on year changes
-15%
-10%
-5%
0%
5%
10%
15%
1995
1996
1997
1998
1999
2000
2001
2002
2003
2004
2005
2006
2007
2008
2009
2010
an
nu
al c
hg
40
45
50
55
60
65
70
75
au
to p
rod
tn, m
ln u
nit
s
Automobile production (mln units), RHS
YoY NR conmptn chg (%), LHS
YoY % auto chg (%), LHS
prodtn in 2007:
73.26 mln. 2010 est:
67.7 mln.
Source: OCIA, Pacrim research

Natural Rubber review
-3-
Consumption to pickup in 2010, albeit at a slower rate than initially anticipated…
The rubber consumption is seen improving in the year 2010 following the pick up in the automobile
demand as reflected by an increase in sales during the first half of the year. The automobile sales at the
global front were estimated at 41.852 million units during the period Jan-Jul2010, higher by 16% over the
same period previous year level of 36.06 million units. Following the growth in automobile segment and
taking clues from the increase in import demand from leading consuming nations viz. China, India, Malaysia
and Japan, the natural rubber consumption for the year 2010 was initially expected to grow at an annual
rate of 10.7% to 10.4 million tons, which after wards was revised lower taking into account the growing
fears over double dip recession. The natural rubber consumption is currently projected at 10.2 million tons,
higher by 8.63% over the 2009 level. Much would depend upon the economic performance in the second
half of the 2010 following the evidence of slowing down economic growth in the developed economies and
economy cooling off measures like higher interest rates being initiated in China, as the same might impact
the automobile segment performance.
Natural rubber balance sheet
Given the current expectations, the global natural production and consumption could balance each other in
absolute terms thus leaving the ending stocks unchanged from the previous year level at 1.613 million tons.
However, in relative terms, the stock to use ratio is expected to decline from 17.18% in 2009 to 15.81% in
2010 on account of the higher consumption base. The supply and demand balances in the past two decades
is summarized in the Table-2. As illustrated, faster growth in demand relative to production is expected to
reduce the ending stocks in months to use to 1.9 in 2010 from the previous year level of 2.06 and shall
support the prices over the important support levels in the remaining part of the year. On the cautionary
note, although the production growth at 6% seems possible given the increases in the first half of the year,
much would depend upon the consumption growth in the remaining part of the year following the fears of
double dip recession. Any reduction in consumption could ease the current tight situation and might weigh
on the prices.
Leaving aside the immediate implications, a glance on the months to use trends during the past two decade
period hints that natural rubber market has tilted down from a well supplied scenario (with ending stocks
greater than four months of usage) in 1990’s to a balanced scenario in 2000s where in stocks hovered
0
1000
2000
3000
4000
5000
6000
7000
8000
Chin
a
U.S
.A
India
Japan
Mala
ysia
Indonesia
Thaila
nd
Rep.o
f
Kore
a
Oth
ers
co
nsu
mp
tn i
n '000 t
on
s
-80%
-60%
-40%
-20%
0%
20%
40%
% c
han
ge2008 2009 % change in 2009 over 2008 (RHS)
Fig-4: Natural rubber consumption in 2009 vs. 2008 in important countries
Source: IRSG, Rubberboard, India and Pacrim research

Natural Rubber review
-4-
between 1.5 to 2 months of usage. This is a major supportive factor for the prices in the long run and clearly
indicates that market is more prone for wide swings for the slightest hint of any possible deviations from
the normal supply and demand trends owing to decline in margin of comfort. Although the measures
initiated by several players in expanding the rubber plantations might help to restore the balance, it could
be a while before those increased supplies find their way into the market.
Table-2: Natural rubber supply and demand balance sheet
1991 1995 2000 2005 2006 2007 2008 2009 2010
Production, MMT 5.16 6.04 6.76 8.90 9.79 9.80 10.04 9.62 10.20
Consumption, MMT 5.09 6.00 7.34 9.20 9.68 10.14 10.17 9.39 10.20
Production deficit/ surplus, MMT 0.07 0.04 -0.58 -0.30 0.11 -0.34 -0.14 0.23 0.00
Ending stocks, MMT 2.38 2.45 2.18 1.75 1.87 1.52 1.39 1.61 1.61
Stocks to use ratio (%) 46.8% 40.8% 29.7% 19.0% 19.3% 15.0% 13.6% 17.2% 15.8%
Stocks in months to use 5.61 4.90 3.57 2.29 2.31 1.80 1.63 2.06 1.90
Average price, RSS3, US$ per Kg 0.85 1.56 0.75 1.50 2.16 2.32 2.61 1.98 3.18
Source: IRSG, Pacrim research