Embed Size (px)
Citation preview

i
Islamic University of Gaza
Deanery of Higher Studies
Faculty of Science
Department of Physics
Natural Pigments Extracted from Plant Leaves
as Photosensitizers for Dye-sensitized Solar Cells
الأصباغ الطبيعية المستخلصة من أوراق النباتات
في الخلايا الشمسية الصبغيةBy
Almohanad Mohammad Dawoud
B.Sc. in Physics, Islamic University of Gaza
Supervisors
Dr. Taher M. El-Agez Dr. Sofyan A. Taya Associate Professor of Physics Associate Professor of Physics
Submitted to the Faculty of Science as a Partial Fulfillment of the Master
Degree of Science (M. Sc.) in Physics
1437 – 2016

ii

iii
Dedication
I dedicate my dissertation work to my family for their endless love, support and
encouragement. A special feeling of gratitude to my loving parents, whose words of
encouragement and push for tenacity ring in my ears and to my beloved brothers and
sisters who stands by me when things look bleak. I also dedicate this dissertation to
my friends who have supported me throughout the process. I will always appreciate
all they have done.

iv
Acknowledgment
First and foremost, I thank Allah for endowing me with health, patience, and
knowledge to complete this work.
I would like to express my sincere thanks and gratitude to my supervisors Dr. Sofyan
Taya and Dr. Taher El-Agez. Despite being busy in various activities, they was always
available for his excellent guidance. As a matter of fact without there enormous
support and encouragement, it won't be possible for me to complete this master
research work.
Special acknowledgement is also given to the Islamic university of Gaza and the staff
members in Physics department for their continued support. I have to give a special
mention for the support and assistance given by Hatem El-Ghamri during experimental
work.
I also thank my entire family for all their support, from the first to the last day of my
study. So many thanks go to my parents for their unending support through my studies,
as well as initially providing me with the drive and desire to succeed in something
which is so difficult. Thank you so much.
Last, but not least, I am grateful to every individual who has helped me in one way or
another during my master study.

v
What most people know but don't realize they know is that the world is almost
entirely solar-powered already. If the sun wasn't there, we'd be a frozen ice ball at
three degrees Kelvin, and the sun powers the entire system of precipitation. The
whole ecosystem is solar-powered.
Elon Musk

vi
Abstract
The objectives of this thesis are to prepare dye sensitized solar cells (DSSCs) using
titanium dioxide (TiO2) based on twelve natural dyes extracted from plant leaves which
are lemon, mandarin, orange, almond, avocado, peach, pomelo, apple, fig, loquat,
orange, olive and pomegranate as sensitizers. Among the previous dyes, lemon showed
the best efficiency.
The performance of DSSCs are improved through adjustment of the solution extraction
temperature, the pre-treatments of the fluorinated tin oxide (FTO) glass substrate and
post-treatments of the TiO2 film using hydrochloric (HCl), phosphoric (H3PO4), and
nitric (HNO3) acids.
The results showed that an extracting temperature of 50 °C could be used as an optimal
value. In this case, the short current density Jsc rose from 0.77 (30 °C) to 1.52 mA/cm2
and the photoelectric conversion efficiency of the DSSC rose from 0.24% to 0.5%.
The dye sensitized solar cells extracted from lemon, orange and mandarin leaves showed
improvement in efficiency by 140%, 180% and 148% respectively as a result of the
surface pre-treatments of the glass using nitric acid.
The TiO2 semiconductor layer using a nitric acid post-treatment showed an increase in
dye sensitized solar cell efficiency by 128% and the short current density Jsc rose from
1.08 to 1.25 mA/cm2, while the open circuit voltage decreased from 0.61 to 0.58V.
Key words: Dye sensitized solar cell, natural dyes, solar cell.

vii
Abstract in Arabic
تحضير خلايا شمسية صبغية باستخدام ثاني أكسيد التيتانيوم كطبقة شبه إلىهذا البحث يهدف
، ن البرتقالالليمو النباتات وهي أوراقطبيعية مستخلصة من ةصبغ اثني عشرموصلة معتمدة على
هذه . من بين ليلبومواالتفاح ، لزيتون ا الخوخ، الأفوكادو،اللوز، التين، البشملة، ،الرمان، الكلمنتينا
أعلى كفاءة. الليمون أظهر الأوراق
ن خلالم بعض الأصباغ السابقةلقد تم تحسين أداء الخلايا الشمسية الصبغية المستخلصة من
باستخدام 2TiOوطبقة شبه الموصل FTOسطح معالجة و ضبط درجة حرارة استخلاص الصبغة
. بالإضافة إلى ذلك HNO)3(، والنيتريك )4PO3H(، الفوسفوريك ) (HClأحماض الهيدروكلوريك
الاستخلاص مع ثبات درجة الحرارة. تم تسريع عملية استخلاص الصبغة بواسطة تعديل زمن
لها كقيمة مثلى لاستخلاص الصبغةمكن استعماي سيلسيوس 50النتائج أن درجة الحرارة أظهرتو
أن الخلايا الشمسية الصبغية المستخلصة من صبغة كماساعات. 3وذلك في مدة زمنية قدرها
على %148، %180، %140كفاءة بنسبة تحسنا في ال أظهرت الكلمنتيناو الليمون والبرتقالأوراق
جة لطبقة . في حين أن المعالالنيتريكنتيجة المعالجة لسطح الزجاج باستخدام حمض الترتيب وذلك
.% 128كفاءة الخلية بنسبة في زيادة تباستخدام حمض النيتريك أظهر 2TiOشبه الموصل
الخلايا الشمسية الصبغية، أصباغ طبيعية، خلايا شمسية. كلمات مفتاحية:

viii
Table of Contents
Dedication ...................................................................................................................... iii
Acknowledgment .......................................................................................................... iv
Abstract ......................................................................................................................... vi
Abstract in Arabic ........................................................................................................ vii
List of Figures ............................................................................................................ xi
List of Tables .......................................................................................................... xiii
List of Abbreviations .................................................................................................... xiv
1 Introduction ................................................................................................................. 1
1.1 Energy resources .................................................................................................... 1
1.1.1 Non- renewable energy resources ........................................................................ 1
1.1.2 Renewable energy resources ................................................................................ 3
1.2 Energy usage.............................................................................................................. 7
1.3 A history of solar technology................................................................................. 8
1.4 Solar cells generations ............................................................................................... 9
1.5 The solar spectrum ................................................................................................... 11
1.6 Energy sources in Palestine ...................................................................................... 13
1.7 Purpose and outline of this thesis ........................................................................... 14
2 Theoretical Background…..................................................................................... 15
2.1 Historical background and state of the art.............................................................. 15
2.2 DSSCs basic materials............................................................................................. 17
2.2.1 Transparent conducting glass substrate .............................................................. 17
2.2.2 Nanocrystalline film (Photoanode) ..................................................................... 18
2.2.3 Dye sensitizers .................................................................................................... 18
2.2.4 Electrolyte and redox couples ........................................................................... 20
2.2.5 Counter electrode ................................................................................................ 21
2.3 DSSC operation ...................................................................................................... 21
2.4 Basic parameters to evaluate the performance of DSSC........................................ 24
2.4.1 Short circuit current ............................................................................................. 24
2.4.2 Open circuit voltage ............................................................................................ 25
2.4.3 Fill factor ............................................................................................................. 25
2.4.4 Power conversion efficiency ............................................................................. 25

ix
2.4.5 Series and shunt resistance ....................................................................................26
2.5 Advantages of the dye-sensitized solar cells......................................................... 27
3 Experimental work ................................................................................................... 28
3.1 Device characterization ......................................................................................... 28
3.1.1 Ultraviolet–visible spectroscopy ....................................................................... 28
3.1.2 Current-Voltage measurements .......................................................................... 29
3.1.3 Electrochemical impedance spectroscopy ......................................................... 30
3.2 Device fabrication.................................................................................................... 31
3.2.1 Materials ............................................................................................................. 31
3.2.2 Tools ................................................................................................................... 32
3.2.3 Preparation of TiO2 paste ................................................................................. 32
3.2.4 Preparation of TiO2 electrode ...................................................................... 32
3.2.5 Preparation of natural dye sensitizers .............................................................. 33
3.2.6 DSSC assembling ............................................................................................... 34
3.3 Experimental studies ............................................................................................. 34
3.3.1 Testing twelve natural dyes ............................................................................ 34
3.3.2 Optimizing of the extracting temperature and time of lemon leaves ...... 35
3.3.3 Effect of pre-treatment of FTO glass substrates ………………………….. 35
3.3.4 Effect of surface post-treatment of TiO2 layer ………………………….... 35
4 Results and Discussions ....................................................................................... 36
4.1 Testing twelve natural dyes.............................................................................. 36
4.1.1 Absorption spectra of the dyes ……………………………………………… 36
4.1.2 J-V characterization of DSSCs …………………………………………….. 37
4.2 Optimizing of the extracting temperature and time of lemon leaves dye... 44
4.2.1 J-V characterization of DSSCs at different extracting temperature ……….44
4.2.2 J-V characterization of DSSCs at different extracting times ………………47
4.3 Effect of pre-treatment of FTO glass substrates................................................ 49
4.3.1 J-V characterization of DSSCs with the pre-treatment of FTO glass........ 50
4.4 Effect of surface post-treatment of TiO2 layer ……………………………… 55
4.4.1 J-V Characterization of DSSCs with post-treatment of TiO2 electrode ……. 55
4.5 Electrochemical impedance spectroscopy (EIS) analysis …………………….. 58
4.5.1 EIS of the DSSC sensitized by lemon leaves without any treatment …….……. 58

x
4.5.2 EIS of the DSSC sensitized with lemon leaves with pre-treated FTO ……...… 60
Conclusion ………………………………………………………………….……..... 61
References …………………………………………………………………….......... 63

xi
List of Figures
Fig. 1.1 World energy consumption by source 2014………………………..………… 7
Fig. 1.2 Solar cell generations ……………………………………………….………. 10
Fig. 1.3 Incident spectrum of sunlight ……………………………………………….. 11
Fig. 1.4 Solar irradiance spectra …………………………………………………... 12
Fig. 2.1 Overview of the working principle of DSSC …………………………….. 23
Fig. 2.2 Illustration of current-voltage characteristics of a solar cell ……………… 24
Fig. 2.3 The equivalent circuit of a solar cell ……………………………………… 26
Fig. 3.1 UV-Vis spectrophotometers used in this study …………………………….29
Fig. 3.2 Simplified layout of solar simulation system ……………………..…………29
Fig. 3.3 Schematic representation of doctor blade method………………...…………..33
Fig. 3.4 Assembled dye sensitized solar cell……………………………………….34
Fig. 4.1 UV–Vis absorption spectra of natural dyes extracted ……………..……….. 36
Fig. 4.2 J–V curves for the DSSCs sensitized by lemon, mandarin and orange ……. 37
Fig. 4.3 J–V curves for the DSSCs sensitized by peach, loquat and pomegranate ......38
Fig. 4.4 J–V curves for the DSSCs sensitized by almond, fig and pomelo ………… 38
Fig. 4.5 J–V curves for the DSSCs sensitized by olive, apple and avocado ……..…. 39
Fig. 4.6 P–V curves of the DSSCs using lemon, mandarin and orange ………….… 39
Fig. 4.7 P versus V curves of the DSSCs using peach, loquat and pomegranate ……40
Fig. 4.8 P versus V curves of the DSSCs using almond, fig and pomelo ………… 40
Fig. 4.9 P versus V curves of the DSSCs using olive, apple and avocado ……………41
Fig. 4.10 The basic molecular structure of Chlorophyll ……………………....……. 44
Fig. 4.11 J–V curves for the DSSCs sensitized at different extracting temperature… 45
Fig. 4.12 P-V curves of the DSSCs sensitized at different extracting temperatures... 46
Fig. 4.13 DSSC efficiency versus the extracting temperature of lemon leaves…….. 46
Fig. 4.14 J–V curves for the DSSCs sensitized at different extracting times ………48
Fig. 4.15 P–V curves of the DSSCs sensitized at different extracting times ……........48
Fig. 4.16 DSSC efficiency (η) versus the extracting time of lemon leaves ……...…49
Fig. 4.17 J–V curves for the DSSCs with the pre-treatment of FTO using lemon …50
Fig. 4.18 P–V curves of the DSSCs with the pre-treatment of FTO using lemon dye..51
Fig. 4.19 J–V curves of the DSSCs with the pre-treatment of FTO using mandarin..51
Fig. 4.20 P–V curves of the DSSCs with the pre-treatment of FTO using mandarin..52

xii
Fig. 4.21 J–V curves for the DSSCs with the pre-treatment of FTO using orange…. 52
Fig. 4.22 P–V curves of the DSSCs with the pre-treatment of FTO using orange…. 53
Fig. 4.23 J–V curves of DSSCs with post-treatment of TiO2 electrode ……………...56
Fig. 4.24 P–V curves of the DSSCs with post-treatment of TiO2 electrode ……...... 56
Fig. 4.25 Nyquist plots of the DSSC sensitized by lemon leaves without treatment.. 59
Fig. 4.26 The equivalent circuit for the DSSCs without treatment ………………59
Fig. 4.27 Nyquist plots of the DSSC sensitized by lemon leaves with nitric acid pre-
treatment of FTO glass substrates ………………………..………………………… 60

xiii
List of Tables
Table 3.1 Photos of the dyes sources extracted from the leaves of plants .…..…31
Table 4.1 Photovoltaic parameters of the DSSCs sensitized by 12 kinds of natural dyes
extracted from plant leaves ………………………………………………….………41
Table 4.2 Solar cell parameters of the DSSCs sensitized with lemon leaves dye
extracted at different temperatures …………………………………………..………47
Table 4.3 Photoelectrochemical parameters of the DSSCs sensitized with lemon
leaves dye extracted at various times at 60º C ……………………………….………49
Table 4.4 Photovoltaic parameters of the DSSCs with the pre-treatment of FTO glass
substrates by HCl, H3PO4, and HNO3 acids using lemon leaves dye ………….…… 53
Table 4.5 Photovoltaic parameters of the DSSCs with the pre-treatment of FTO glass
substrates by HCl, H3PO4, and HNO3 acids using mandarin leaves dye ……………54
Table 4.6 Photovoltaic parameters of the DSSCs with the pre-treatment of FTO glass
substrates by HCl, H3PO4, and HNO3 acids using orange leaves dye ………… 54
Table 4.7 Photovoltaic parameters of the DSSCs with post-treatment of TiO2
electrode by HCL and HNO3 acids ……………………………………………….. 57
Table 4.8 EIS results from data-fitting of Nyquist plots to the equivalent circuit model
in Fig. 4.26 ………………………………………………………….……………… 59
Table 4.9 EIS results from data-fitting of Nyquist plots to the equivalent circuit model
in Fig. 4.27 ………………………………………………………………..............…60

xiv
List of Abbreviations
A Absorbance
a.u. Arbitrary units
AM 1.5 G Air mass 1.5 global spectrum
AM0 Air mass zero
a-Si Amorphous silicon
CO2 Carbon dioxide
CIGS Copper indium gallium selenide
CdTe Cadmium telluride
RCT Charge transfer resistance
oC Celsius degree
I-V Current voltage
J-V Current density – Voltage
N3 cis-diisothiocyanato-bis(2,2’-bipyridyl-4,4’-dicarboxylic acid)
ruthenium(II) - C26H16O8N6S2Ru
N719 cis-diisothiocyanato-bis(2,2’-bipyridyl-4,4’-dicarboxylato)
ruthenium(II) bis(tetrabutylammonium) - C58H86O8N8S2Ru
DSSC Dye Sensitized Solar Cell
S* Excited energy state of the sensitizer
eV Electron volt
Eg Energy bandgap
EIS Electrochemical impedance spectroscopy
e- Electron
FF Fill factor
FRA Frequency response analyzer
FTO Fluorine-doped tin oxide
GW Gigawatts
S Ground energy state of the sensitizer
HOMO Highest occupied molecular orbital

xv
HCl Hydrochloric acid
IR Infrared
I- Iodide
I3- Tri-iodide
ITO Indium-doped tin oxide
IUG Islamic university of Gaza
Jsc Short circuit current density
oK Kelvin degree
LOMO Lowest unoccupied molecular orbital
MW Megawatts
Pm Maximum power
Vm Maximum voltage
nm Nanometer
HNO3 Nitric acid
S+ Oxidized state of the sensitizer
SnO2 Tin oxide
PV Photovoltaics
Pin Power of incident light
Pt Platinum
H3PO4 Phosphoric acid
R Resistance
Ru Ruthenium
RS Series resistance
Rsh Shunt resistance

xvi
Isc Short circuit current
T Temperature
TW Terawatts
TiO2 Titanium dioxide
TCO Transparent conducting oxide
UV Ultraviolet
UV-Vis Ultraviolet-Visible
Z' Real impedance
Z" Imaginary impedance
ZC Capacitance impedance
Zim Imaginary impedance
ZR Resistance impedance
Zre Real impedance
α Absorption coefficient
η Solar energy to electric power conversion efficiency
λ Wavelength of the light
λmax Maximum wavelength

1
Chapter 1
Introduction
This chapter reviews renewable and non-renewable energy resources as well as the
global usage of each resource. The chapter also includes a history of solar cell
technology, solar cell generations and solar spectrum. Finally, the purpose and outline
of this thesis are introduced.
1.1 Energy resources
Energy may be our most important resource, and all societies require energy services
to meet basic human needs. Abundant energy makes it easy to be sustainable because
it can be used to produce essential resources such as lighting, food, communication
and potable water where they are scarce. Today the greatest attention in the world is
devoted to energy resources while many areas of the world are experiencing energy
shortages. Human energy consumption has grown steadily throughout human history.
Early humans had modest energy requirements, mostly food and fuel for fires to cook
and keep warm. Thus, the continuous increase in energy consumption nowadays has
led to take advantage of currently available energy resources. An energy resource is
something that can produce heat or electricity. Primary energy sources take many
forms, including nuclear energy, fossil energy (non-renewable) like oil, coal and
natural gas and renewable sources like wind, solar, geothermal and hydropower. These
primary sources are converted to electricity, a secondary energy source, which flows
through power lines and other transmission infrastructure to your home and business.
1.1.1 Non-renewable energy resources
Energy sources are classified as nonrenewable if they cannot be replenished in a short
period. A non-renewable resource is a resource that does not renew itself at a sufficient
rate for sustainable economic extraction in meaningful human time-frames. Most non-
renewable energy sources are fossil fuels, which converted to usable energy by thermal
reactions.
There are three major non-renewable energy resource:

2
Oil
Oil is available in abundance in most of the middle east countries including Saudi
Arabia, Kuwait, Iran, Iraq and UAE while some limited oil wells are present in North
America and Canada. Most of the countries still have their huge dependency on these
countries for their oil requirements. Oil was made out of dead plants and animals that
had lived millions of years ago. When plants and animals died they were covered with
thick layer of mud and sand which created huge pressure and temperature. Wide usage
of oil and oil related products has resulted in massive air pollution. It is a major source
of fuel that is used in vehicles. Due to the process of combustion, harmful gases like
carbon dioxide are released when oil is burnt. Oil is transported to other nations using
pipelines or ships. Leakage in ships leads to oil spill which affects animals and plants
that live inside or around the sea.
Natural gas
Natural gas consists primarily of methane plus minor amounts of other light
hydrocarbons. It is associated with oil because it forms from similar material through
similar processes. Methane that escapes to the atmosphere is considered a pollutant
and is a potent greenhouse gas. Natural gas is considered a “clean” fossil fuel because
burning it emits less CO2 and sulfur per unit energy than other fossil fuels, so it causes
the least environmental damage than coal or oil. It is the fuel most commonly used for
heating. One downside of natural gas is that it takes up more volume than liquid oil
and gasoline, making it more expensive to transport. Currently natural gas is
transported under pressure and is highly flammable, which may result in dangerous
explosions and fires.
Coal
Coal is the most abundant form of fossil fuel available on earth. They were formed by
the decay of old plants and animals several centuries ago. Coal is mostly found below
the earth and is major source of fuel for electricity generation as of today. Most power
stations on earth require huge reserves of coal to produce electricity continuously
without break. Because coal takes millions of years to form, it is considered a non-
renewable resource, meaning that coal use is unsustainable. Known reserves of coal

3
far exceed those of other fossil fuels, and may be our best bet for an energy source of
the future. Still, burning of coal produces large amounts of waste products, like SO2
and soot, that pollute the atmosphere. This problem needs to be overcome before we
can further exploit this source of energy. Coal is the dirtiest source of energy. It has
the largest carbon footprint, meaning it emits more CO2 per unit energy over its life
cycle than any other energy source. Coal burning releases more CO2 worldwide than
any other human activity. Carbon dioxide is one the gas responsible for global
warming. Coal burning also releases toxic metals like mercury, sulphurous and nitrous
oxides that contribute to acid rain, and particulates and ozone that contribute to ground-
level air pollution.
1.1.2 Renewable energy resources
Renewable energy is generated from sources that are derived from, and quickly
replenished by, the natural movements and mechanisms of the Earth. For decades now,
the perception of dwindling fossil fuels has motivated government, economists, and
scientists to find an alternative energy source that is not only endless in supply, but
also inexpensive and comparable in terms of storage density and capacity to fossil
fuels. Therefore, the largest challenge for our global society is to find ways to replace
the vanishing fossil fuel supplies by renewable resources, and at the same time, avoid
negative effects from the current energy system on climate, environment, and health.
For development to be sustainable, delivery of energy services needs to be secure and
have low environmental impacts.
There are five major renewable energy resource:
Wind energy
Winds develop when solar radiation reaches the Earth’s highly varied surface
unevenly, creating temperature, density, and pressure differences. Tropical regions
have a net gain of heat due to solar radiation, while polar regions are subject to a net
loss. This means that the Earth’s atmosphere has to circulate to transport heat from the
tropics towards the poles. The Earth’s rotation further contributes to semipermanent,
planetary-scale circulation patterns in the atmosphere. Topographical features and
local temperature gradients also alter wind energy distribution. A region’s mean wind

4
speed and its frequency distribution have to be taken into account to calculate the
amount of electricity that can be produced by wind turbines. Wind resources can be
exploited in areas where wind power density is at least 400 watts per square m at 30
m above the ground (or 500 watts per square m at 50 m). Moreover, technical advances
are expected to open new areas to development. The following assessment includes
regions where the average annual wind power density exceeds 250–300 watts per
square m at 50 m. Wind power results in zero emissions, but can only be effectively
utilized in a limited number of locations. Startup costs are large and require large areas
of land to establish such a “wind farm”.
Hydropower
Hydropower is power derived from the energy of falling water or fast running water,
which may be harnessed for useful purposes. Water, when it is falling by the force of
gravity, can be used to turn turbines and generators that produce electricity.
Hydroelectricity, which depends on the natural evaporation of water by solar energy,
is by far the largest renewable resource used for electricity generation. Because rainfall
varies by region and even country, hydro energy is not evenly accessible. Although
the effective cost is zero but the manufacturing and building a dam and installation of
the turbines is very costly due to which many countries do not employ this alternative
source of energy. If the initial cost had been less; then it would have used more
commonly. Its construction requires a lot of human capital and labor. Its maintenance
is also very costly. Although hydroelectricity is generally considered a clean energy
source, it is not totally devoid of greenhouse gas emissions, ecosystem load, or adverse
socioeconomic impacts. For comparable electricity outputs, greenhouse gas emissions
associated with hydropower are one or two orders of magnitude lower than those from
fossil-generated electricity. Ecosystem impacts usually occur downstream and range
from changes in fish biodiversity and in the sediment load of the river to coastal erosion
and pollution.
Geothermal energy
Geothermal energy is generally defined as heat stored within the Earth. The Earth’s
temperature increases by about 3 degrees Celsius for every 100 metres in depth, though
5
this value is highly variable. Heat originates from the Earth’s molten interior and from
the decay of radioactive materials. Four types of geothermal energy are usually
distinguished:
- Hydrothermal—hot water or steam at moderate depths (100–4,500 m).
- Geopressed—hot-water aquifers containing dissolved methane under high
pressure at depths of 3–6 km.
- Hot dry rock—abnormally hot geologic formations with little or no water.
- Magma—molten rock at temperatures of 700–1,200 degrees Celsius.
Today only hydrothermal resources are used on a commercial. Environmental aspects
of geothermal energy use relate primarily to gas admixtures to the geothermal fluids
such as carbon dioxide, nitrogen, hydrogen sulphides or ammonia and heavy metals
such as mercury.
Biomass energy
Biomass can be classified as plant biomass (woody, non-woody, processed waste, or
processed fuel) or animal biomass. Most woody biomass is supplied by forestry
plantations, natural forests, and natural woodlands. Non-woody biomass and
processed waste are products or by-products of agroindustrial activities. Animal
manure can be used as cooking fuel or as feedstock for biogas generation. Municipal
solid waste is also considered a biomass resource. For biomass to become a major fuel,
energy crops and plantations will have to become a significant land-use category. Land
requirements will depend on energy crop yields, water availability, and the efficiency
of biomass conversion to usable fuels. Assuming a 45 percent conversion efficiency
to electricity and yields of 15 oven dry tonnes a hectare per year, 2 square km of
plantation would be needed per megawatt of electricity. Biomass is often perceived as
a fuel of the past because of its low efficiency, high pollution, and associations with
poverty. Biomass is the fuel most closely associated with energy-related health
problems in developing countries. Exposure to particulates from biomass or coal
burning causes respiratory infections in children, and carbon monoxide is implicated
in problems in pregnancy. In addition, large-scale production of biomass can have
considerable negative impacts on soil fertility, water and agrochemical use, leaching
of nutrients, and biodiversity and landscape. The collection and transport of biomass

6
will increase vehicle and infrastructure use and air-borne emissions. The biomass
challenge is not availability but sustainable management, conversion, and delivery to
the market in the form of modern and affordable energy services.
Solar energy
Solar energy is a constant renewable resource available in many areas of the world and
offers a continuous increase of achievable efficiencies. Of all the available
technologies producing renewable energy, photovoltaic energy is a hot topic in current
research. All renewable energy sources have many advantages but solar energy is the
only in this competition which can meet the global demand by providing full spectral
composition of sunlight with vast amount of clean energy. While silicon-based
technologies have been developed to harness solar energy efficiently, they are not yet
competitive with fossil fuels mainly due to the high production costs. It is an urgent
task to develop much cheaper photovoltaic devices with reasonable efficiency for
widespread application of photovoltaic technology. In this context, dye sensitized solar
cells (DSSCs) have emerged as an important alternative to conventional silicon solar
cells owing to their fascinating features such as low fabrication cost and relatively high
efficiency. At present, continuous consumption of these stored energy resources have
caused not only scarcity but also a severe impact on the environment due to
increasing CO2 levels producing problems such as those presented by greenhouse
gases and by environmental pollutants. Addressing such issues and the ever-
increasing human demand for energy has led to the need to develop new direct solar
energy conversion methods. Solar energy represents a clean, vast and a renewable
energy source and is therefore an excellent candidate for a future environmentally
friendly energy source. However, the large-scale availability of solar energy will thus
depend on a region’s geographic position, typical weather conditions, relatively high
production costs of conventional solar cells and land availability, which have limited
their widespread commercialization. We clearly must move toward a more sustainable
energy economy. So,with growing demands for energy, the necessity of stemming
increases in carbon dioxide emissions and the need to develop renewable, clean
sources of energy are becoming increasingly crucial. Solar energy holds the
possibility of addressing these energy concerns. Fabrication of dye-sensitized solar

7
cells (DSSCs) offers a potential solution to this problem, as these novel cells
can conceivably be produced more inexpensively compared to standard Si-based
cells. Recent research and technological developments of DSSCs have attracted
much attention because of their characteristics of being inexpensive and having
the capability for large-scale solar energy conversion .
1.2 Energy usage
With the explosion of the world population at the beginning of the 20th century and
its growing energy needs, humans started to exhaust non-renewable sources of energy
like oil, gas and coal extensively. In the recent world of technological
developments, energy has become one of the important requirements for life.
Fossil fuels are non-renewable energy sources and they are the basis to run our
planet these days. In 2014, the worldwide energy consumption primarily originates
from fossil fuels, e.g. 35.7% come from oil, 19.3% from coal, 25.6% from gas and
9.5% from renewable energy sources as illustrated in Fig.1.1 [1].
Fig. 1.1. World energy consumption by source 2014.
Energy from renewable sources i.e. biomass, hydropower, wind, solar, and geothermal
currently accounts for about 9.5% of global energy consumption. Worldwide Solar
Photovoltaics (PV) capacity reached 135 gigawatts in 2013, and the current solar PV
35.7%
19.3%
25.6%
9.9%
9.5%
Oil
Coal
Gas
Nuclear
Renewable

8
capacity growing to 1,721 gigawatts in 2030 and a massive 4,674 gigawatts in 2050
[2]. That would be able to generate around 16% of global electricity needs. Today,
global primary energy is consumed at a rate of about 16 TW, whereas our planet
receives about 173 × 103 TW of solar radiation, which is about 10000 times more than
the global population currently consumes. Even if only a fraction of this energy can be
harvested, the solar energy source is enormous and dwarfs all known non-renewable
sources. The current energy demand can be fully met by covering 0.15% of earth’s
surface with 10% efficiency solar cell panels [3]. Our world will need at least 10
Terawatts of additional energy from clean and low-cost energy source by 2050 to
maintain worldwide peace and prosperity [3]. In 2014, Geothermal heating currently
produces over 12.8 GW of power, while solar and wind energy produce 180 GW and
373 GW of power respectively.
Whilst this thirst for energy is clearly not diminishing, the resources from which we
gain this energy are. Oil, gas and coal are all products that are highly energy rich and
convenient to process, however come with a price. High CO2 emissions create an
imbalance in the earth’s atmosphere, the consequences of which are well known and
may prove to be cataclysmic. Whilst nuclear energy provides similar energy outputs
to traditional fossil fuels without the carbon footprint, the nuclear disaster at
Fukushima Daiichi in Japan has served as a stark reminder of the significant risks
associated with this technology.
1.3 A History of solar technology
The first solar cell concept came into existence in the 1800s, when it was
observed that the presence of sunlight was capable of generating usable electrical
energy. Alexandre Becquerel observed the photoelectric effect via a silver-coated
platinum electrode in a conductive electrolyte solution exposed to light in 1839 [4]. In
1883, Charles Fritts developed a solar cell using selenium on a thin layer of gold to
form a device giving less than 1% efficiency. Adams and Becquerel described the basis
for the first selenium solar cell, which was built in 1877 [5]. This phenomenon was
not fully understandable until the theoretical explanation of the photoelectric effect by
Einstein in 1905. He was awarded a Nobel Prize in 1921 for his theoretical explanation.
In 1918, a method for monocrystalline silicon production was discovered, which

9
enabled monocrystalline solar cells production [6]. The first silicon monocrystalline
solar cell was constructed in 1941. In 1955, a 2% efficient commercial solar cell was
created. In the following years, the use of a grid contact technique method to
reduce the cell's resistance was introduced. In 1958, the first solar powered satellite,
Vanguard I, was launched with a 0.1W, 100-cm² solar panel. After Vanguard I, many
progresses in the space field happened: in 1964 the Nimbus spacecraft was launched
with a 470 W PV array; in 1966 the Orbiting Astronomical Observatory was
launched with a 1 kW PV array. However, the cost of the photogenerated electricity
was so high that this newly born technique became an exception, only used in
extraterrestrial applications
In the 1970s, there was a dramatic growth in research funding in solar energy due to
the energy crisis. Solar cells were of significant interest during this period and various
methods of producing cells with improved efficiencies were explored. The
fundamental understanding of modern photovoltaic science was developed and rooted
mainly in that period. Moreover, some photovoltaic companies were established in the
energy market, like Solar Power Corporation in 1972, Solarex Corporation in 1973
and Solec International and Solar Technology International in 1975.
In 1991, Michael Grätzel and O’ Regan introduced a new kind of photovoltaic
device based on charge separation processes by a sensitizer as light-absorbing
material associated with a wide band gap nanocrystalline semiconductor. This new
type of solar cells has attracted worldwide attention because of their low cost and good
levels of efficiency [7].
1.4 Solar cells generations
There are many different types of solar cells such as the silicon solar cell, solid-state
solar cell, organic solar cell, thin-film solar cell, thick-film solar cell, and dye-
sensitized solar cell. These different types of solar cells are usually classified
into three main categories based on their performance and cost effectiveness as
shown in Fig. 1.2.

10
Fig. 1.2. Solar cell generations
The first generation of solar cells is based on bulk silicon photovoltaic cells. These
solar cells are fabricated on single crystal silicon wafers and demonstrate a high
efficiency. Single junction silicon devices are approaching the theoretical limiting
efficiency of 31%. Due to their high efficiency, they still dominate the solar market.
The cost of silicon wafers has restricted their wide spread use in energy generation.
The second generation solar cells are based on thin-films materials that are cheaper
to produce. However, thin film solar cell efficiency is inferior compared to first
generation silicon solar cells. Thin film solar cells have drawn a wide spread interest
from residential solar markets because of cost, flexibility, lighter weight, and ease of
integration, compared to wafer silicon cells. The most popular materials used for
second generation thin-film solar cells are amorphous silicon (a-Si), copper indium
gallium selenide (CIGS), cadmium telluride (CdTe), copper zinc tin sulfide (CZTS)
and polycrystalline silicon. CIGS and CdTe solar cells have certified efficiencies of
about 21%.
The third generation solar cells utilize new materials, architecture and solar cell
concepts. They are in general not focused on typical p-n junction based energy
conversions. The focus is to find highly efficient, and low cost alternatives to
traditional silicon solar cells. Several new solar cell technologies such as polymer-
photovoltaic
1st gen classical silicon
Mono c-Si
Poly c-Si
2nd gen Thin film
a-Si CIGS CdTe
3rd gen organic
DSSCQuantum
DotOrganic ploymer

11
based cells, quantum dots, tandem/multi-junction cells, and dye-sensitized solar
cells have been proposed in recent years.
1.5 The solar spectrum
The spectrum of the solar light that reaches the earth is influenced by absorption of
radiation in the earth’s atmosphere and therefore also by the path length of the photons
through the atmosphere. The Sun is capable of sustaining fusion reactions in its core
and constantly radiates light with a power of 4×1024 W. Its emission spectrum is close
to that of a blackbody with a temperature of 5800º K. Only a small fraction (1.74×10¹⁷
W) of this power enters the Earth’s atmosphere, where about 42% of the light is lost
due to absorption and scattering. The amount of light that strikes the Earth’s surface is
over 5000 times larger than current energy consumption.
Fig. 1.3. Incident spectrum of sunlight just above the earth’s atmosphere (AM0) and
at the earth’s surface (AM1.5G), used as a measurement standard.

12
Air mass zero (AM0) radiation is defined as the intensity of light of the sun outside
the Earth’s atmosphere. The accepted value of AM0 sunlight is 1.353 kW/m2, but is
attenuated by nearly 30 % inside the Earth’s atmosphere. AM1 radiation is the incident
radiation intensity on the Earth’s surface when the sun is directly overhead. The most
commonly used spectrum is the Air Mass 1.5 Global (AM 1.5G). The AM1.5G
spectrum corresponds to an angle between the incident solar radiation and the zenith
point of the measurements of 48.2°, and integrates to 1000 Wm-2. Once the light enters
the earth’s atmosphere, the intensity is attenuated by scattering from molecules,
aerosols and dust particles, as well as absorption by gases in the atmosphere. These
are highlighted in Fig. 1.4 where there are dips in the spectral irradiance intensity from
absorption by H2O, O3, O2 and CO2.
Fig. 1.4. Solar irradiance spectra at the top of the atmosphere and at sea level (AM
1.5G) compared to the spectrum of a 5250 °C black body.
The level of change is highly dependent on the amount of atmosphere the light has to
pass through. When the sun is directly overhead, the distance the light has to travel to
reach the earth is minimum. As the sun moves away from the zenith through the sky,

13
light has to pass through a greater portion of the atmosphere, and so the intensity of
light is reduced as it reaches the earth’s surface. Assuming the sun is at an angle, θ,
from the zenith, then the distance the light has to travel through the atmosphere is the
Air Mass = 1/cos θ. Assuming the sun is overhead, the Air Mass is defined as 1, or
AM1, and increases as it passes through the sky. For standard measurement conditions,
AM1.5G has been used as an average spectrum for terrestrial applications, which is
the global irradiance from the sun at an angle of approximately 48° from the zenith.
1.6 Energy sources in Palestine
The energy sources in the Palestinian territories are very limited and it depends on the
imports of different types of fuel from the Israeli occupation government and
neighboring countries like Egypt and Jordan. An energy crisis is currently hitting the
Gaza Strip's public services hard and could lead to a severe humanitarian crisis if a
sustainable solution is not found soon. The Gaza power station was completely
dependent on external aid and had to reduce electricity production due to supply
limitations imposed by the Israeli occupation government and some economic and
political factors. This situation continued to impact on the daily life of Gaza
inhabitants. Gaza Strip is currently supplied with only 208 Megawatts (MW) of
electricity from three sources: purchases from Israel (120 MW) and Egypt (28 MW),
and production by the Gaza power plant (currently 60 MW). This supply meets only
46% of the estimated demand (452 MW) [8]. Rolling power outages currently reach
up to 12 hours per day and the electricity is expected to be available only 6 hours per
day at any time. Palestine receives a relatively high quality of solar energy all over the
year with an average solar radiation of 5.46 kWh/ m².day. The West Bank and Gaza
Strip are located at the geographic latitude of approximately 30º N, where the annual
incident solar irradiance is about 2000 kWh per m2. However, there is no use of solar
energy effectively inside Palestine. Therefore, the concerned authorities in Palestine
should adopt new policies in the field of energy, including the use of solar energy as
one of the effective solutions to the energy problem. In addition, research and
educational institutions in Palestine should focus on the areas of renewable energy,
particularly solar energy by providing the necessary support for research and studies

14
in this field and through the adoption of clear strategies to raise awareness of the solar
energy importance.
1.7 Purpose and outline of this thesis
A dye-sensitized solar cell (DSSC) is one of the third generation photovoltaic devices
that convert visible light into electric energy, which provides a technically and
economically credible alternative concept to silicon photovoltaic devices. The
performance of dye sensitized solar cells is strongly based on the dye as a
sensitizer. Natural dyes have become a viable alternative to expensive and rare
organic sensitizers because of its low cost, easy attainability, abundance in supply
of raw materials and no environment threat.
In this work various plant leaves have been tested as sensitizers. The
characterization of dye-sensitized solar cells based on natural dyes extracted from the
plant leaves will be studied. The current-voltage (I-V) characteristics of the dye-
sensitized solar cells will be employed to determine the power conversion
efficiency of the cells. The effects of changing extracting temperature and time will
be reported. The influence of acids on a fluorine-doped tin oxide (FTO) glass and TiO2
paste will be investigated and discussed.
This thesis is divided into four parts:
Chapter 1 gives an introduction to the thesis by describing the general overview
of the energy resources and briefly mention the purpose of the study as well as
the outline of the thesis.
Chapter 2 contains a thorough discussion about the operating principles of the
DSSCs, historical review of DSSC, device structure and DSSC basic materials.
Chapter 3 describes the experimental part of this work. The fabrication process
are discussed. A detailed description on the experimental procedures carried
out in this research is also provided.
Chapter 4 focuses on the results and discussions.

15
Chapter 2
Theoretical Background
In this chapter, the operation principle of dye sensitized solar cells and materials used
in the fabrication of DSSCs are presented. Historical review of DSSCs and key works
in the DSSCs field are reviewed.
2.1 Historical background and state of the art
The use of dye-sensitization in photovoltaics remained rather unsuccessful until
a breakthrough in 1991. In the Laboratory of Photonics and Interfaces in Ecole
Polytechnique Federale de Lausanne, Switzerland, Grätzel and his co-workers
developed a solar cell by the successful combination of nanostructured electrodes
and efficient charge injection dyes. This cell was hence termed the dye sensitized
nanostructured solar cell [9]. While initial indications showed great promise, two
problems, efficiency and durability, have yet to find effective solutions. Most research
into dye sensitized solar cells since their invention has focused on the various
components of the cells independently. These include organic and natural dyes,
electrolytic carriers, counter electrodes, and semi-conductors. As early as 1992,
Grätzel and others were searching for improvements in all of these. The use of
sintered mesoporous titanium dioxide (TiO2) was the breakthrough that established
DSSC technology and raised the DSSC efficiency from 1% to 7%. DSSCs have
been subjected of a large number of experimental investigations since then. An
impressive number of new sensitizers are being developed in recent years and thus can
be grouped into metal-complex based dye, natural dye, synthetic organic dye, and
polymer dye and quantum dot sensitizer.
Kumara et al. (2006) investigated synergistic sensitization by dye cocktail (shisonin
and chlorophyll) obtained from shiso leaves and successfully achieved broadening of
spectral response of dye-sensitized solar devices [10].
Yamazaki et al. (2007) assembled DSSCs by using natural carotenoids, crocetin and
crocin, as sensitizers and demonstrated that crocetin can attach effectively to the
surface of TiO2 film due to the presence of carboxylic groups in the molecule and

16
perform the better photosensitization effect than crocin that has no carboxylic group
in the molecule [11].
Furukawa et al. (2009) fabricated various DSSCs using natural dyes of red cabbage,
curcumin, red perilla and their mixtures. They found that the conversion efficiency of
the solar cells fabricated using the mixture of red cabbage and curcumin was much
larger than that of solar cells using one kind of dye. [12]
Sandquist and McHale (2011) explored the use of a blocking layer and treatment by
TiCl4 in order to optimize the performance of the betanin-based dye-sensitized solar
cells, and recorded the highest energy conversion efficiencies as high as 2.7% for a
DSSC containing a single unmodified natural dye sensitizer [13].
Oprea et al. (2012) identified betacyanins as the useful constituents of red beetroot
extract as natural sensitizers and emphasized on the role of extract purification for
better results [14].
Although a number of natural dyes have been tested for their performance in DSSCs,
most of them yielded conversion efficiencies of less than 1%. Betanin extracted from
beet roots achieved an efficiency of 2.71% [15], Xanthomonascin-A extracted from
Monascus purpureus achieved an efficiency of 2.3% [16], and isobutrin from Butea
monosperma achieved an efficiency of η =1.8% [17]. Chlorophyll derivatives yielded
conversion efficiencies over 2% [18]. Natural chlorophyll derivative chlorin-e6
exhibited energy conversion efficiencies over 4% [19].
Juices extracted from fruit were found to make good dyes for DSSCs. Blackberries
were found to be an excellent choice, as the anthocyanins bonded readily with
crystalline titanium dioxide [20]. These include berry juice, pomegranate juice and
hibiscus leaves [21]. Research on electrolyte solutions has been less intense since
Grätzel used an iodide solution in his research. While other electrolyte solutions have
been studied with varying success, use of any liquid poses problems [22]. A liquid
sealed permanently inside the cell poses manufacturing issues, and outdoor exposure
of liquid filled cells to low temperatures causes shortened life. A dry or “solid state”
cell is therefore considered far more practical, and has been the greatest focus of
research [23-25]. Some counter electrode work has also been carried out, although this
17
has been an area of secondary concern. Some of the research is dedicated to improving
the original carbon coating electrode used by Grätzel [26]. More efficient, although
probably not economically practical, have been counter electrodes produced by
various applications of platinum. A great deal of research has been dedicated to the
semi-conducting layer. Grätzel started with titanium dioxide, and this is still the
standard for dye sensitized solar cells, although other metal oxides including zinc, tin,
aluminum and others have been used with success. The dye sensitized solar cells can
achieve efficiencies over 10%, but have not yet been successfully scaled up for
production [27].
T. El-Agez et al. (2013) investigated the performance of dye-sensitized solar cells
based on natural dyes extracted from ten different plant seeds and the best performance
was for the DSSC sensitized with Eruca sativa with a solar energy conversion
efficiency of 0.725% [28].
S. Taya et al. (2014) fabricated various DSSCs using dried plant leaves and the best
performance was for the DSSC sensitized with Jasminum Grandifolium with a solar
energy conversion efficiency of 0.33% [29].
H. El-Ghamri et al. (2014) used natural dyes extracted from plant seeds in the
fabrication of dye-sensitized solar cells and found that the highest conversion
efficiency of 0.875% obtained with an allium cepa (onion) extract [30].
I. Radwan (2015) fabricated various DSSCs using natural dyes extracted from purple
carrot, carrot, beet, curcuma, kale and radish as sensitizers and found that the
conversion efficiency of the solar cells fabricated using the purple carrot was much
larger than that of solar cells using other dyes [31].
2.2 DSSCs basic materials
2.2.1 Transparent conducting glass substrate
Transparent conducting oxide (TCO) coated glass is used as the substrate for the TiO2
photo electrode. For high solar cell performance, the substrate must have low sheet
resistance and high transparency. In addition, sheet resistance should be nearly
independent of the temperature up to 500º C because sintering of the TiO2 electrode is
carried out at 450º to 500º C. Fluorine doped tin oxide SnO2 is one of the best known

18
TCO materials for DSSCs. It is low-cost and stable at high temperatures and in acidic
environments.
2.2.2 Nanocrystalline film (Photoanode)
Photo electrodes made of materials such as silicon and cadmium sulfide
decompose under irradiance in solution. In contrast, semiconductor oxide
materials, especially TiO2, have good chemical stability under visible irradiation
in solution. It has been found that TiO2 is a stable photoelectrode in photo
electrochemical systems even under extreme operating conditions. It is cheap,
readily available and non-toxic and is normally used as dye in white paint and
toothpastes. The high dielectric constant of TiO2 (€= 80 for anatase) provides
good electrostatic shielding of the injected electron from the oxidized dye
molecule attached to the TiO2, thus preventing their recombination before
reduction of the dye by the redox electrolyte. High refractive index of TiO2 (n
= 2.5 for anatase) results in efficient diffuse scattering of the light inside the
porous photoelectrode, which significantly enhances the light absorption. Dye
adsorption and microstructure of the TiO2 film are important properties when it
is used as photoelectrode for DSSCs. TiO2 occurs in three crystalline forms: rutile,
anatase and brookite. Anatase appears as pyramid-like crystals and is stable at
low temperatures whereas needle-like rutile crystals are dominantly formed in
high temperature processes. Rutile absorbs 4% of the incident light in the near
UV region. Brookite is difficult to produce and is therefore not considered in
DSSC application. The band-gap of anatase is 3.2 eV at an absorption edge of
388 nm and that of rutile is 3.0 eV at an absorption edge of 413 nm. The
common techniques employed in the preparation of TiO2 films include the doctor
blade technique, screen printing, electrophoretic deposition and tape casting
method.
2.2.3 Dye sensitizers
Dye Sensitizers must be rapidly regenerated by the mediator layer to avoid
electron recombination processes and be fairly stable, both in the ground and
excited states. The ideal sensitizer for a photovoltaic cell converting standard air
mass (AM) 1.5 sunlight to electricity, must absorb all light below a wavelength
19
of about 900 nm, which is equivalent to a semiconductor with a bandgap of 1.4
eV. An efficient photosensitizer must fulfill certain requirements such as:
An strong absorption in the visible region.
Strong chemical bonding to the semiconductor surface.
Efficient electron injection into the conduction band of the
semiconductor.
The stability of the dye should be excellent.
The dye should be cheap and easy to synthesize.
Finally, the dye should also be non-toxic and recyclable.
Energy levels of the sensitizer should match well with those of the semiconductor and
the electrolyte. The Lowest Unoccupied Molecular Orbital (LUMO) of dye needs to
be higher than the edge of the conduction band of semiconductor for efficient electron
injection, and the Highest Occupied Molecular Orbital (HOMO) of dye needs to be
aligned with the redox potential of the electrolyte, for facilitating active regeneration
of the oxidized dye. Sensitizing materials should be strongly anchored on the surface
of the semiconductor film to decrease the interface resistance and to secure stable
bonding for a long time. Electrons in the sensitizing materials need be quickly
separated from their counterpart holes and injected to the photoanodes before being
recombined. It is preferable to have a light absorption spectrum ranging from UV to
near IR region, with an absorption peak at visible region for the sensitizing material.
Good environmental stability of the sensitizing materials is also warranted for
maintaining the photovoltaic performance for long duration. The finest photovoltaic
performance in terms of both conversion yield and long term stability, has so
far been achieved with polypyridyl complexes of Ruthenium (Ru) developed by
the Grätzel group: N3, N719 and ‘black’ dyes. However, the use of these
expensive Ru metals, derived from relatively scarce natural resources corresponds
to a relatively heavy environmental burden. Hence, it is possible to use natural
dyes as alternative photosensitizers with appreciable efficiencies. Their advantages
over synthetic dyes include easy availability, abundance in supply, can be applied
without further purification, environmentally friendly and they considerably reduce
the cost of devices.

20
The efficiency of DSSC is determined mainly by the sensitizer used. The dye as a
sensitizer plays a key role in absorbing sunlight and transforming solar energy into
electrical energy. DSSCs with efficiencies of up to 15% have been designed using
ruthenium (Ru) based dyes but the limited availability and high cost of these dyes
together with their undesirable environmental impact have led to the search for cheaper
and safer dyes. There have been some interesting explorations of natural dyes in the
context of the dye-sensitized solar cell (DSSC) application using pigments obtained
from biomaterials. Several reports have emphasized on exploration into natural dyes,
such as cyanine, anthocyanin, cyanidins, chlorophyll and their derivatives,
carotenoids, betalains and many others as a cheaper, faster, low-energy requiring and
environment-friendly alternative for use in dye-sensitized solar cells. Although these
natural dyes often work poorly in DSSCs, these are expected as low cost and prepared
easily comparing to ruthenium (Ru) complex based dyes. Different types of natural
dyes showed different solar conversion efficiencies depending on the source and
chemical structure of dye and interaction between dye molecule and photo-electrode.
The advantages of natural dyes as photosensitizers are large absorption coefficients,
high light-harvesting efficiency, no resource limitations, low cost, simple preparation
techniques and no harm to the environment.
2.2.4 Electrolyte and redox couples
The electrolyte is a key component of the DSSC. It consists of a redox couple,
additives to improve the efficiency and a suitable solvent. Short circuit current density
(Jsc) and open circuit voltage (Voc) considerably depend on the electrolyte. The
electrolyte used in DSSC mostly contains I−/I3− redox ions, which mediate electrons
between the TiO2 photoelectrode and the counter electrode. The electrolyte affects the
DSSC performance mainly in three ways:
The photo voltage of the device depends on the redox couple because it sets
the electrochemical potential at the counter electrode.
The oxidized dye is reduced by the reduced part of the couple.
It affects the electrochemical potential of the TiO2 electrode through the
recombination kinetics between electrons in TiO2 and the redox species.
The electrolyte must meet a wide range of requirements:

21
The electrolyte must have long-term stability, including chemical, optical,
electrochemical, thermal and interfacial stability, which does not cause the
desorption and degradation of the dye from the oxide surface.
The electrolyte must reduce the oxidized dye rapidly. Thus, it is important
taking into account the redox potential of the dye and the electrolyte.
The electrolyte must guarantee the fast diffusion of charge carriers and
produces good interfacial contact with the porous nanocrystalline layer and the
counter electrode.
The electrolyte must not exhibit a significant absorption in the range of visible
light, otherwise it subtracts photons useful for the photosensitizer excitation.
Therefore, if the electrolyte is colored, its concentration must be optimized
taking into account not only the conventional parameters (viscosity, ionic
strength, reactivity), but also its spectral properties.
2.2.5 Counter electrode
The prerequisite of a material used as counter electrode in DSSC is that it should have
a low charge transfer resistance and high exchange current densities for the reduction
of the oxidized form of the charge mediator. The counter electrode serves to transfer
electrons arriving from the external circuit back to the redox electrolyte. It also has to
carry the photocurrent over the width of each solar cell. Hence, it must be well
conducting and exhibit a low overvoltage for reduction of the redox couple. Till now,
Pt has been the desired material for the counter electrode since it is an excellent catalyst
for I3− reduction. An interesting low cost alternative for Pt is carbon (C), because it
combines sufficient conductivity and heat resistance as well as corrosion resistance
and electrocatalytic activity for the I3− reduction.
2.3 DSSC operation
A schematic diagram of a dye-sensitized solar cell is shown in Fig. 2.1. Excitation of
the sensitizer (S) such as N3 adsorbed on the TiO2 nano-particle surface by visible light
in the range of 400–800 nm results in the excitation of an electron to an excited S1
state, subsequently transferring the electron very rapidly into the conduction bands of

22
the TiO2 particles. The migrated electron diffuses among the TiO2 particles to reach a
transparent electrode, while I3− formed by an electron transfer from an iodide ion (I−)
to the one-electron oxidized dye accepts an electron at the counter electrode. The
mechanism of electric current generation, therefore, involves the diffusion of I− and
I3− in the solvent, the viscosity of which can significantly affect the response time for
photon-to-current conversion. The operating cycle can be summarized as:
The excitation of the photosensitizers (dye) from the ground state (S) to the excited
state (S*) results in the injection of an electron into the conduction band of the TiO2
electrode resulting in the oxidation of the photosensitizers.
S + photon → S∗ Absorption (1)
S∗ → S+ + e- (TiO2) Electron injection (2)
The injected electron in the conduction band of TiO2 is transported between the TiO2
nanoparticles by diffusion towards the back contact of the transparent conducting glass
and reaches the counter electrode through the external load. The oxidized dye (S+)
recaptures the conduction band electron from the iodide (I-) ion redox mediator
regenerating the ground state (S) of the sensitizer and I- is oxidized to I3-.
2S+ + 3I− → 2S + I−3 Regeneration of dye (3)
The electron travels through the outer circuit performing work, reaches the back FTO
electrode, and reduces the iodine in the electrolyte. The platinum layer on the FTO acts
as a catalyst for the reduction. Then there is the ionic diffusion in the electrolyte and
the reduction of tri-iodide at the counter electrode.
I−3 + 2e−(Pt) → 3I− (4)
e−(Pt) + hʋ→ 3I− (5)

23
Fig. 2.1. Overview of the working principle of DSSC.
The performance of the DSSC is primarily based on the four energy levels of the
components: the ground state (HOMO) and the excited state (LUMO) of the dye, the
Fermi level of the TiO2 photo electrode, which is located near the conduction band
level and the redox potential of the redox mediator(I-/ I3-) in the electrolyte solution.
The photocurrent obtained from the DSSC is determined by the energy difference
between the HOMO and LUMO of the dye corresponding to the band gap, Eg, for
inorganic semiconductor materials. The smaller the HOMO – LUMO energy gap, the
larger will be the current because of the use of the long –wavelength region in the solar
spectrum. The energy gap between the LUMO level and the conduction band of TiO2
is important and the energy level of the LUMO must be sufficiently negative with
respect to the conduction band of TiO2 in order to inject electrons effectively. Besides,
substantial electronic coupling between the LUMO and the conduction band of TiO2
also leads to effective electron injection. The HOMO level of the dye must be
sufficiently more positive than the redox potential of the I- / I3- redox mediator to accept
electrons effectively.

24
2.4 Basic parameters to evaluate the performance of DSSC
There are a number of key parameters that are typically required in the analysis of
DSSCs. The key performance parameters of the cell are obtained from current-voltage
(J-V) measurements. An example J-V curve is shown in Fig. 2.2.
Fig. 2.2 Illustration of current density-voltage characteristics of a solar cell.
2.4.1 Short circuit current density
The short-circuit current (Jsc) is the current through the solar cell per unit area when
the voltage across the solar cell is zero. The short-circuit current depends on a number
of factors:
The number of photons: (i.e., the intensity of the incident light source); Jsc from a
solar cell is directly dependant on the light intensity.
The spectrum of the incident light: For most solar cell measurements, the spectrum
is standardized to the AM1.5 spectrum. (See section 1.4).
The optical properties of the solar cell
The collection probability of the solar cell: which depends chiefly on the surface
passivation and the minority carrier lifetime in the base.

25
2.4.2 Open circuit voltage
The open-circuit voltage (Voc) is the maximum voltage available from a solar cell, and
this occurs at zero current. The open-circuit voltage corresponds to the amount of
forward bias on the solar cell due to the bias of the solar cell junction with the light
generated current. The theoretical maximum Voc of the cell is determined by the
difference between the Fermi level of the semiconductor and the redox potential of the
hole-conductor.
2.4.3 Fill factor
The fill factor, more commonly known by its abbreviation "FF", is basically a
measure of quality of the solar cell. The FF is determined by comparing the maximum
power (PMAX) to the theoretical power (PT) that would be output obtained at the open
circuit voltage and the short circuit current.
The FF is typically calculated as:
𝐹𝐹 =𝐽𝑚 × 𝑉𝑚
𝐽𝑠𝑐 × 𝑉𝑜𝑐
where Jm and Vm are the maximum current and voltage, respectively.
The fill factor (FF) is a measure of the maximum power output from a solar cell, and
it reflects the extent of electrical and electrochemical losses during cell operation. To
obtain higher fill factor, improvement of the shunt resistance and decrement of the
series resistance, with reduction of the overvoltage for diffusion and charge transfer is
required.
2.4.4 Power Conversion Efficiency
The efficiency,, is the most commonly used parameter to compare the performance
of one solar cell to another and it is defined as the ratio of maximum electrical
energy output to the energy input from the sun.
Power conversion efficiency under sunlight irradiation (e.g., AM 1.5) can be
obtained using:
𝜂 = 𝐽𝑠𝑐 × 𝑉𝑜𝑐 × 𝐹𝐹
𝑃𝑖𝑛
(6)
(7)

26
where Pin is the power per unit area of incident light. Besides the solar cell
performance itself, it depends on the incident light spectrum and intensity as well as
operating temperature.
2.4.5 Series and shunt resistance
The efficiency of solar cells, during operation, is reduced by the dissipation of power
across internal resistances. These resistances are modelled as a parallel shunt resistance
(RSH) and series resistance (RS) as shown in Fig. 2.3. The series resistance is mainly
contributed by the bulk resistance of the semiconductor and the resistance of the
contacts and interconnections. Ideally, the value of this resistance is required to be
zero. However, in practicality there is a value associated with it. A high value of the
series resistance can cause a significant reduction in the short-circuit current and hence
degrade the solar cell efficiency by reducing the fill factor. The shunt resistance is
typically due to manufacturing defects around the depletion region or leakage currents
around the edges of the cell. Low shunt resistance causes power losses in solar cells
by providing an alternate path for the current flow. This results in a significant
reduction in the open-circuit voltage (VOC) and a slight reduction in the JSC (the short
circuit current density). For an ideal cell, RSH would be infinite, which means that there
is no alternative path for current flow.
Fig. 2.3. The equivalent circuit of a solar cell.

27
2.5 Advantages of the dye-sensitized solar cells
The DSSCs are currently the most efficient third generation thin film solar cells based
on a semiconductor and photo-electrochemical system. DSSCs demonstrate many
advantages in comparison to bulk silicon p-n junction solar cells.
Friendly and cost-effective conversion of solar energy to electricity due to the
use of inexpensive, biocompatible, abundantly available and flexible materials.
Simple fabrication process and low environmental impact.
Unlike traditional solar cells, dye-sensitized cells can work effectively in low
light conditions and are less susceptible to losing energy to heat.
DSSC materials and dyes can be tuned for optimization in a variety of lighting
conditions making it suitable for indoor applications and outdoor applications.
Considering these advantages, DSSCs have the potential to be a feasible candidate for
the race of large-scale solar energy conversion systems.

28
Chapter 3
Experimental Work
In this chapter, dye-sensitized solar cell preparation techniques are discussed. The
relevant theoretical and experimental principles are briefly described. The materials
and tools applied in this study are also introduced. The chapter also includes
characterization techniques.
3.1 Device characterization
3.1.1 Ultraviolet–visible spectroscopy
Ultraviolet (UV) and visible radiation comprise only a small part of the
electromagnetic spectrum, which includes such other forms of radiation as radio,
infrared (IR), cosmic, and X rays. When radiation interacts with matter, a number of
processes can occur, including reflection, scattering and absorbance. In general, when
measuring UV-visible spectra, we want only absorbance to occur. Since light is a form
of energy, absorption of light by matter causes the energy content of the molecules (or
atoms) to increase. In general, the total potential energy of a molecule can be
represented as the sum of its electronic, vibrational and rotational energies. The
amount of energy a molecule possesses in each form is not a continuum but a series of
discrete states. In some molecules, photons of UV and visible light have enough energy
to cause transitions between different electronic energy levels. The wavelength of light
absorbed is equal to the energy required to move an electron from a lower energy level
to a higher energy level. When light passes through or is reflected from a sample, the
amount of light absorbed is the difference between the incident radiation (Io) and the
transmitted radiation (I). The amount of light absorbed is expressed as either
transmittance or absorbance. Transmittance usually is given in terms of a fraction of 1
or as a percentage and is defined as follows: T=I/Io and A=-log T. The absorption
spectra of all natural dyes were measured by using a GENESYS 10S UV–Vis
spectrophotometer with ethanol as the solvent reference. The absorbance was
measured normally in the wavelength range of 200–900 nm. The optical properties
of the films deposited on the FTO substrates were examined for their absorbance

29
at normal incident by using a V-670 and JASCO UV-Vis spectrophotometer which
were shown in Fig. 3.1.
Fig. 3.1. UV-Vis spectrophotometers used in this study (1) GENESYS 10S (2) V-670
3.1.2 Current-voltage measurements
One of the most important characterization techniques for solar cells is current–voltage
(I–V) measurements, from which the solar cell energy conversion efficiency can be
determined. The dye sensitized solar cell characterization is performed under AM1.5G
illumination. The I-V characteristics are monitored under illumination by changing the
external load from zero (short-circuit conditions) to infinite load (open circuit
conditions). The cells were illuminated using a tungsten halogen lamp. The intensity
of the incident light was about 100 mW/cm2. The cells are contacted using a custom-
made sample holder which can be mounted repeatedly in the center of the illuminated
area during each measurement. The photocurrent voltage characteristics of the solar
cells were carried out using a NI USB6251 data acquisition card controlled by a
computer using a LabVIEW controlled source-meter as show in Fig 3.2. From these
measurements, the short circuit current density (Jsc), open circuit voltage (Voc), fill
factor (FF) and efficiency (η) of the device can be determined.

30
Fig. 3.2. Simplified layout of solar simulation system.
3.1.3 Electrochemical Impedance spectroscopy
Electrochemical Impedance Spectroscopy (EIS) is a powerful diagnostic tool that can
be used to characterize limitations and improve the performance of fuel cells, and it
has become a major tool for investigating the properties and quality of dye-sensitized
solar cell devices. There are several advantages of this technique for the determination
of device parameters and characteristics: (i) It is a small perturbation and noninvasive
method that can be applied under any operating conditions and thicknesses of the
device, so that the dependence of parameters on voltage can be scanned, (ii) It allows
for the simultaneous determination of several characteristics, such as capacitance and
transport resistance. This allows the carrier distribution in the device to be probed at
the same time as kinetic information about carrier displacement. During an impedance
measurement, a frequency response analyzer (FRA 32) is used to impose a small
amplitude AC signal to the solar cell via the load. EIS measurements were performed
with an Autolab AUT 85276 Potentiostat Gelvanostat. All the measurements were
carried out with the NOVA software. Impedance measurements were implemented in
the frequency range 10 KHz to 10 mHz, using 20 mV AC amplitude. Impedance was
measured under illumination and under dark conditions. Under illumination, the cell
was illuminated with a range of intensities and impedance was performed at open-
circuit condition. In the dark, a bias potential was applied. From EIS, several

31
parameters can be obtained, such as charge-transfer resistance and electron
recombination resistance.
3.2 Device fabrication
3.2.1 Materials
FTO conductive glass (fluorine-doped SnO2, sheet resistance: 15Ω / sq).
Commercial P25 TiO2 nano-powder with particle size in the range of 15–20
nm.
A redox (I−/I3−) electrolyte solution composed of 2 mL of acetonitrile, 8 mL of
propylene carbonate (p-carbonate), 0.668 g of Potassium iodide, and 0.0634 g
of I2.
Platinum counter electrode (cathode) sputtered on FTO substrate.
Natural dyes extracted from plant leaves as listed in table 3.1.
Ethanol was used for extracting natural dyes from plant leaves.
Distilled water, TritonX-100 and acetyl acetone were used for preparing TiO2
paste.
Nitric acid, hydrochloric acid and phosphoric acid were used for FTO and TiO2
treating processes.
Table 3.1 Photos of the plants used for the dyes extraction.
Dye Image Dye Image
Lemon
Avocado
Mandarin
Almond

32
Orange
Peach
Apple
Pomelo
Fig
Loquat
Olive
Pomegranate
3.2.2 Tools
Equipments used in this study were a transparent glass, binder clip, scotch tape,
cutter, mortar (grinding), tissue paper, filter paper, alligator clip wire, glass
beaker, pipette drops, measuring cup, oven, stirrer rod, multimeter, cotton
swabs, tweezers, washing bottle, hot plate, glass funnel and test tubes.
3.2.3 Preparation of TiO2 paste
A TiO2 paste was prepared by blending 2g of TiO2 powder, 10 µl
acetylacetone, and 4 ml of distilled water. After that 50 µl of the surfactant
Triton X-100 were added to the paste and mixed by grinding continuously
for 30 min.
3.2.4 Preparation of TiO2 electrode
The FTO substrates were cut into pieces of dimensions 1.6 cm × 1.6 cm. The
substrates were washed with distilled water and ethanol for 15 min in an

33
ultrasonic bath. To prepare the DSSC photoanodes, doctor blade technique was
used as shown in Fig. 3.3. The prepared paste was spread on FTO conductive
glass by using a glass rod. A scotch tape of thickness 20µm was fixed on the
two sides of the cleaned FTO conductive glass sheet to restrict the thickness
and area of TiO2 film. The paste was spread to have an active area of 0.25 cm2.
After tape removal, the film was gradually sintered at 450º C for 30 min. Then
the TiO2 film was cooled to 80º C, and subsequently immersed in natural dye
sensitizer solution at room temperature for 24 h.
Fig. 3.3. Schematic representation of doctor blade method.
3.2.5 Preparation of natural dye sensitizers
Locally available fresh leaves of 12 plants as listed in Table 3.1 were collected,
washed with water and dried. The leaves were crushed into small pieces. Then
0.5g of each fresh leaves were immersed into 10 ml of ethanol. The solutions

34
were kept for 24 hour in the dark at room temperature. Then, the residual (solid)
parts were filtered out and the resulting filtrates were used as dye solutions.
3.2.6 DSSC assembling
The DSSCs with an active area of 0.25 cm2 were assembled as follows:
The sensitized films were rinsed with ethanol to remove excess dye
remaining on the surface and then air-dried at room temperature. For the
preparation of counter electrodes, platinum with a mirror finish is
sputtered on FTO glass substrates. The dye-covered TiO2 electrode and
Pt-counter electrode were assembled into a sandwich type cell using a
spacer as show in Fig 3.4. The gap between the electrodes was filled with
the electrolyte.
Fig. 3.4. Assembled dye sensitized solar cell.
3.3 Experimental studies
3.3.1 Testing twelve natural dyes
Plant leaves of lemon, avocado, mandarin, almond, peach, pomelo, apple, fig, loquat,
orange, olive and pomegranate were collected, washed and dried. All dyes were

35
prepared by immersing 0.5 g of the natural leaves in 10 ml of ethanol as a solvent for
24 h. All solutions were protected from direct light exposure. After filtration of the
solutions, natural extracts were obtained and the resulting filtrates were used as
sensitizers. After the cells were assembled, the fabricated DSSCs were connected to
the solar cell I-V measurement system and the photovoltaic parameters were studied.
3.3.2 Optimizing of the extracting temperature
Fresh lemon leaves of 0.5 g was extracted in 10 ml of ethanol solvent at different
temperatures for 3 hours. The effect of extracting temperature was studied at 30º C,
40º C, 50º C, 60º C and 75º C, using ethanol as an extracting solvent. Then the prepared
TiO2 electrodes were immersed in these dyes solution at room temperature for 24 h.
After the cells were assembled, the photovoltaic parameters were studied.
3.3.3 Effect of pre-treatment of FTO glass substrates
The FTO glass substrates were cleaned by acetone and ethanol, successively for
20 minutes. The substrates were then immersed in 0.1 M of one of the acids mentioned
before at room temperature for 5 min then washed with ethanol. Then the TiO2 paste
was spread uniformly on the FTO substrates as mentioned in chapter three sec (3.2.4).
The TiO2 electrodes were soaked in an ethanol solution of lemon, mandarin and orange
dyes at room temperature for 24 hours. After the cells were assembled, the
photovoltaic parameters were studied.
3.3.4 Effect of surface post-treatment of TiO2 layer
FTO glass plates were cleaned using an ultrasonic bath for 20 min, rinsed with water
and acetone and dried in ambient conditions. TiO2 electrodes were prepared on FTO
substrates by a doctor blade method. The TiO2 electrodes were soaked in 0.1 M HCl,
and HNO3 at room temperature for 5 min followed by washing with ethanol. Then, the
electrodes were sintered at 450oC for 30 min and cooled down to 100oC in ambient air.
After the treatments, the TiO2 electrodes were soaked in an ethanol solution of lemon
leaves dyes at room temperature for 24 hours.

36
Chapter 4
Results and Discussions
In this chapter, the results of four experimental studies are presented in details,
including determination of the best dye of twelve natural dyes extracted from plant
leaves, optimizing extracting temperature and time, pre-treatment of the FTO glass
using several acids, and post-treatment of TiO2 layer. Finally, the results of
electrochemical impedance spectroscopy are given.
4.1 Testing twelve natural dyes
In this work, twelve natural dyes extracted from plant leaves were used as sensitizers
to fabricate dye-sensitized solar cells (DSSCs). The purpose of this study was to
determine the best dyes in terms of efficiency to be used in subsequent studies.
4.1.1 Absorption spectra of the dyes
The absorption spectra of the dye solutions extracted from the leaves of lemon,
mandarin and orange in ethanol as a solvent were measured. The absorption spectra
analysis was carried out in the wavelength range from 390 to 700 nm as shown in
Fig. 4.1.
400 500 600 700
ab
so
rba
nce
(a
.u.)
wavelenght (nm)
mandarine
Orange
Lemon
Fig. 4.1. UV–Vis absorption spectra of natural dyes extracted from lemon, mandarin,
and orange leaves in ethanol solution.

37
Figure 4.1 demonstrates that the ethanol extracts of lemon, mandarin, and orange,
whose colors are green, reach maximum absorption peaks at 665 nm and 435 nm. The
main component of these three extracts is chlorophyll [32]. From this figure, it is
evident that these natural extracts absorb in the visible region of light spectrum and
hence fulfill the primary criterion for their use as sensitizers in DSSCs.
4.1.2 J-V characterization of DSSCs
The photovoltaic performances of DSSCs using natural dyes as photosensitizer were
determined by recording the current density-voltage (J-V) curves as displayed in Fig.
4.2, Fig. 4.3, Fig. 4.4 and Fig. 4.5.
-1.0
-0.8
-0.6
-0.4
-0.2
0.00.0 0.1 0.2 0.3 0.4 0.5 0.6
V(v)
J(m
A/c
m2)
Lemon
Mandarin
Orange
Fig. 4.2. J–V curves for the DSSCs sensitized by lemon, mandarin and orange leaves
extracts.

38
-0.3
-0.2
-0.1
0.00.0 0.1 0.2 0.3 0.4 0.5 0.6
J(m
A/c
m2
)
V(v)
Peach
Loquat
Pomegranate
Fig. 4.3. J–V curves for the DSSCs sensitized by peach, loquat and pomegranate leaves
extracts.
-0.4
-0.3
-0.2
-0.1
0.00.0 0.1 0.2 0.3 0.4 0.5 0.6
V(v)
J(m
A/c
m2
)
Almond
Fig
Pomelo
Fig. 4.4. J–V curves for the DSSCs sensitized by almond, fig and pomelo leaves
extracts.

39
-0.5
-0.4
-0.3
-0.2
-0.1
0.0
0.0 0.1 0.2 0.3 0.4 0.5 0.6
V(v)
J(m
A/c
m2
)
Avocado
Apple
Olive
Fig. 4.5. J–V curves for the DSSCs sensitized by olive, apple and avocado leaves
extracts.
Fig. 4.6, Fig. 4.7, Fig. 4.8 and Fig. 4.9 show the power versus voltage curves for the
DSSCs sensitized by natural dyes. The highest maximum power was obtained in the
case of lemon leaf extract while the lowest maximum power was obtained in the case
of loquat.
0.0 0.1 0.2 0.3 0.4 0.5 0.6 0.70.0
0.1
0.2
0.3
0.4
0.5
P(m
W/c
m2
)
V(v)
Lemon
Mandarin
Orange
Fig. 4.6. Power versus voltage curves of the DSSCs using lemon, mandarin and orange
leaves dyes.

40
0.0 0.1 0.2 0.3 0.4 0.5 0.6 0.70.0
0.1
P(m
W/c
m2
)
V(v)
Peach
Loquat
Pomerganate
Fig. 4.7. Power versus voltage curves of the DSSCs using peach, loquat and
pomegranate leaves dyes.
0.0 0.1 0.2 0.3 0.4 0.5 0.6 0.70.0
0.1
0.2
P(m
W/c
m2)
V(v)
Almond
Fig
Pomelo
Fig. 4.8. Power versus voltage curves of the DSSCs using almond, fig and pomelo
leaves dyes.
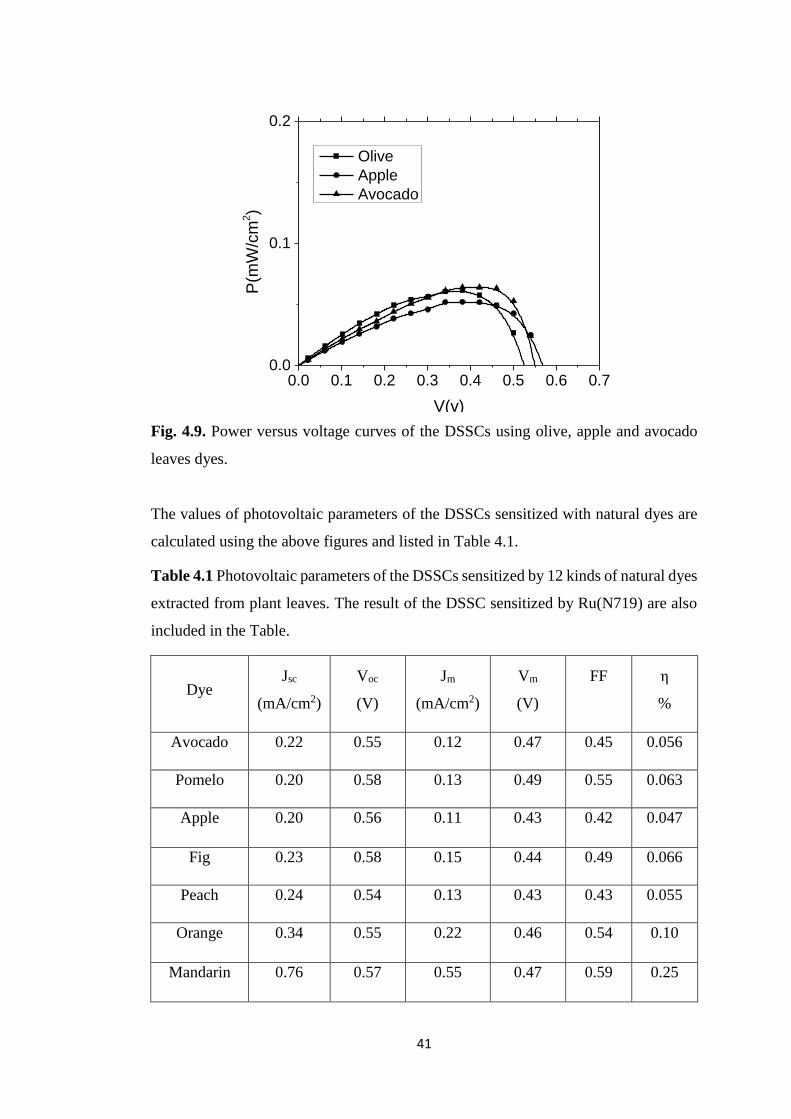
41
0.0 0.1 0.2 0.3 0.4 0.5 0.6 0.70.0
0.1
0.2
P(m
W/c
m2)
V(v)
Olive
Apple
Avocado
Fig. 4.9. Power versus voltage curves of the DSSCs using olive, apple and avocado
leaves dyes.
The values of photovoltaic parameters of the DSSCs sensitized with natural dyes are
calculated using the above figures and listed in Table 4.1.
Table 4.1 Photovoltaic parameters of the DSSCs sensitized by 12 kinds of natural dyes
extracted from plant leaves. The result of the DSSC sensitized by Ru(N719) are also
included in the Table.
Dye Jsc
(mA/cm2)
Voc
(V)
Jm
(mA/cm2)
Vm
(V)
FF
η
%
Avocado 0.22 0.55 0.12 0.47 0.45 0.056
Pomelo 0.20 0.58 0.13 0.49 0.55 0.063
Apple 0.20 0.56 0.11 0.43 0.42 0.047
Fig 0.23 0.58 0.15 0.44 0.49 0.066
Peach 0.24 0.54 0.13 0.43 0.43 0.055
Orange 0.34 0.55 0.22 0.46 0.54 0.10
Mandarin 0.76 0.57 0.55 0.47 0.59 0.25

42
Lemon 0.95 0.59 0.77 0.46 0.63 0.35
Loquat 0.18 0.50 0.09 0.38 0.38 0.034
Pomegranate 0.17 0.49 0.10 0.39 0.46 0.04
Olive 0.27 0.52 0.15 0.40 0.42 0.06
Almond 0.31 0.58 0.19 0.42 0.44 0.08
Ru (N719) 4.76 0.57 3.53 0.38 0.50 1.35
As displayed in Table 4.1 open circuit voltage (Voc) varies from 0.49 to 0.59 V, and
the short circuit photocurrent densities (JSC) changes from 0.17 to 0.95 mA/cm2. The
highest Voc (0.59 V) and JSC (0.95 mA/cm2) were obtained with the DSSC sensitized
by lemon leaves extract; the efficiency of which reached 0.35%.
The lowest efficiency was obtained with the DSSC sensitized by Loquat leaves extract.
The efficiencies of DSSCs sensitized with lemon, mandarin and orange dyes are
significantly higher than those of the DSSCs sensitized by other natural dyes in this
work. Chlorophyll plays an important role in plant photosynthesis. The DSSCs
fabricated using chlorophyll derivatives as sensitizers showed a relatively high
conversion efficiency. However, the DSSCs sensitized by the leaves of loquat, olive,
almond, pomegranate, peach, fig, apple and avocado did not exhibit high conversion
efficiencies. These results can be explained as follows:
Obviously, the efficiency of the cell sensitized by the Ru-complex dye
is significantly higher than that sensitized by the natural extracts. This
is due to a higher intensity and broader range of the light absorption of
the Ru on TiO2.
In general, the results obtained in this study using chlorophyll pigment gives
less efficiency comparing with other natural dyes such as anthocyanins and
betalains [33]. This is because the week bonds between the dye and TiO2
molecules through which electrons can transport from the excited dye
molecules to the TiO2 film. The functional group necessary to interact with the
TiO2 surface is a carboxylic or other peripheral acidic anchoring group. Several
possible chemical functional groups are able to bind the dye to the TiO2. The

43
best anchoring groups for metal oxides are phosphonic acids followed by
carboxylic acids and their derivatives, such as acid chlorides, amides, esters or
carboxylate salts. The carboxylic group is the most frequently used anchoring
group and its present in the anthocyanin pigments. The presence of carboxylic
groups presents mainly two advantages: a better anchoring between the dye
and the TiO2 surface and an efficient dye regeneration by iodine/iodide redox
couple. Thus, the absence of the effective anchoring group in Chlorophyll
structure and depending on its ester group in chelation which is far
effective to the carboxyl group, leads to a lower performance. This result
indicates that the interaction between the sensitizer and the TiO2 film is
significant in enhancing the energy conversion efficiency of DSSCs. The
chemical structure of chlorophyll is shown in Fig. 4.10.
As can be seen from the above results, the photoelectric conversion efficiency
of lemon leaf extract is higher than the photoelectric conversion efficiency of
other extract dyes. This is because, after the lemon leaf extract is adsorbed on
the surface of TiO2 nanoparticles, the absorption intensity is higher. In addition,
there is a higher interaction between TiO2 nanoparticles and the chlorophyll in
lemon leaf extract, giving the produced DSSCs better charge-transfer
performance, clearly improved efficiency. The reason is that the electrons can
be transported from excited lemon leaf extract dyes molecule to TiO2 thin film
is much higher than other dyes. Also, the difference in chemical structure of
these pigments would also directly reflect the efficiency results [34].

44
Fig. 4.10. The basic molecular structure of Chlorophyll. [35]
4.2 Optimizing of the extracting temperature and time of lemon leaves
dye.
The performance of the dye-sensitized solar cell mainly depends on the dye used as a
sensitizer. The dye performance is affected by several factors such as pH, storage
temperature, extracting temperature and extraction time. The extracting temperature
and time play a critical role for DSSC performance. Hence, it is important to evaluate
the optimum conditions regarding the extracting temperature and time of natural dyes.
In this study, different extracting temperatures were tested for lemon leaves pigments.
Moreover, different times of extraction were examined.
4.2.1 J-V characterization of DSSCs at different extracting temperature
Figures 4.11 and 4.12 show the J-V characteristic curves and the power of DSSCs
fabricated with lemon leaves at different extracting temperatures. Figure 4.13 shows
the DSSC efficiency as a function of the extracting temperature. As observed from the
figure, the efficiency is enhanced with increasing the extracting temperature from
30°C to 50°C and then it declines towards lower values with further increasing of the

45
temperature. Here, the optimum extracting temperature was found 50º C. This is due
to the greater absorbance of light than the dye extracted at other temperatures. The
reason is that the dye extracted at 50 °C resulted in deep colored solution. In addition,
the extraction solution has the best stability and the degradation rate of pigment is the
slowest under the extraction temperature at 50º C [36]. Solar cell sensitized using the
dye extracted at 50 °C showed a power conversion efficiency of 0.5%, with Voc of
0.55V, Jsc of 1.52 mA/cm2 and FF of 0.60. Solar cell sensitized using the dye extracted
at higher temperatures (60 °C and 75 °C) showed less efficiency. This is due to the
less stability of chlorophyll at higher temperatures [37]. Solar cell sensitized using the
dyes extracted at lower temperatures (30 °C) also gave lower efficiency than that
sensitized using the dyes extracted at 50 °C. This is due to the lighter color of the
extract, which is due to restriction of chlorophyll solubility.
-1.6
-1.4
-1.2
-1.0
-0.8
-0.6
-0.4
-0.2
0.00.0 0.1 0.2 0.3 0.4 0.5 0.6
V(v)
J(m
A/c
m2)
T=30 C
T=40C
T=50C
T=60C
T=75C
Fig. 4.11. Current density (J) versus voltage (V) characteristics curves for the DSSCs
sensitized at different extracting temperatures.

46
0.0 0.1 0.2 0.3 0.4 0.5 0.6 0.70.0
0.1
0.2
0.3
0.4
0.5
0.6
V(v)
P(m
W/c
m2)
T= 30C
T= 40C
T= 50C
T= 60C
T= 75C
Fig. 4.12. Power (P) versus voltage (V) characteristics curves of the DSSCs sensitized
at different extracting temperatures.
30 40 50 60 70 800.20
0.25
0.30
0.35
0.40
0.45
0.50
0.55
0.60
(%
)
Temprature (oC)
Fig. 4.13. DSSC efficiency (η) versus the extracting temperature (T) of lemon leaves
extract.
Table 4.2 shows the electrochemical parametrs of the DSSCs sensitized with lemon
leaves dye extracted at different temperatures.

47
Table 4.2. Solar cell parameters of the DSSCs sensitized with lemon leaves dye
extracted at different temperatures.
Extracting
Temperature
(ºC)
Jsc
(mA/cm2)
Voc
(V)
Jm
(mA/cm2)
Vm
(V)
FF
η
%
30 0.77 0.57 0.54 0.46 0.56 0.24
40 1.35 0.56 0.98 0.46 0.59 0.45
50 1.52 0.55 1.17 0.43 0.60 0.50
60 1.09 0.56 0.78 0.42 0.53 0.32
75 0.94 0.58 0.66 0.47 0.56 0.31
Therefore, in order to acquire the best photoelectric conversion efficiency, the
extraction temperature of natural dye has also must to be controlled.
4.2.2 J-V characterization of DSSCs at different extracting times
To find out the proper extracting time, we studied the extraction of lemon leaves at 1,
2, 3, 5, 6, 7 and 8 hours at 60 ºC. Figures 4.14 and 4.15 show the J-V characteristic
curves and the power of DSSCs fabricated with lemon leaves at different extracting
time. Figure 4.16 shows the DSSC efficiency as a function of the extracting time. The
extraction process of dye solution usually takes 24 hours in dye-sensitized solar cell
fabrication. Here, it was shown that by changing of extracting temperature, extracting
time can be reduced from 24 hours to 5 hours. This method is ideal for rapid DSSC
fabrication. While immersing photoelectrodes for 24 hours in dye solution gives cells
with an efficiency of 0.35. Changing of extracting temperature to 60 ºC for 5 hours
gave cells with an efficiency of 0.37.

48
-1.4
-1.2
-1.0
-0.8
-0.6
-0.4
-0.2
0.00.0 0.1 0.2 0.3 0.4 0.5 0.6
V(v)
J(m
A/c
m2)
1 h
2 h
3 h
5 h
6 h
7 h
8 h
Fig. 4.14. Current density (J) versus voltage (V) characteristic curves for the DSSCs
sensitized at different extracting times at 60 ºC.
0.0 0.1 0.2 0.3 0.4 0.5 0.60.0
0.1
0.2
0.3
0.4
0.5
P(m
W/c
m2)
V(v)
1 h
2 h
3 h
5 h
6 h
7 h
8 h
Fig. 4.15. Power (P) versus voltage (V) characteristics curves of the DSSCs sensitized
at different extracting times.
The effect of dye extracting time on DSSC efficiency at 60 ºC is presented in Table
4.3.

49
Table 4.3. Photoelectrochemical parameters of the DSSCs sensitized with lemon
leaves dye extracted at various times at 60º C.
Extracting
Time (h)
Jsc
(mA/cm2)
Voc
(V)
Jm
(mA/cm2)
Vm
(V)
FF
η
%
1 0.75 0.56 0.51 0.38 0.46 0.19
2 0.86 0.57 0.50 0.42 0.42 0.21
3 1.09 0.56 0.78 0.42 0.53 0.32
5 1.08 0.55 0.87 0.43 0.62 0.37
6 1.30 0.54 0.83 0.42 0.49 0.34
7 1.26 0.52 0.86 0.39 0.51 0.33
8 1.09 0.56 0.82 0.38 0.51 0.31
0 1 2 3 4 5 6 7 8 9
0.20
0.25
0.30
0.35
Time (h)
Fig. 4.16. DSSC efficiency (η) versus the extracting time (t) of lemon leaves extract
at 60º C.
4.3 Effect of pre-treatment of FTO glass substrates
Acidic pre-treatment are used in the fabrication of high performance photoanodes for
dye-sensitized solar cells (DSSCs). In this study, hydrochloric (HCl), phosphoric
(H3PO4) and nitric (HNO3) acids pretreatment were used with fluorine doped tin oxide

50
(FTO) before fabricating TiO2 films. The effects of previous acids pretreatment on
some important parameters of solar cells, such as short-circuit current (Jsc) and fill
factor, were investigated.
4.3.1 J-V characterization of DSSCs with the pre-treatment of FTO glass
Fig. 4.17, Fig. 4.19 and Fig. 4.21 show the J–V characteristic curves of DSSCs with
the pre-treatment of FTO glass substrate using lemon, mandarin and orange leaves dye
respectively, while Fig. 4.18, Fig. 4.20 and Fig. 4.22 show the power versus voltage
curves obtained for DSSCs sensitized using lemon, mandarin and orange leaves dye
respectively.
-1.6
-1.4
-1.2
-1.0
-0.8
-0.6
-0.4
-0.2
0.00.0 0.1 0.2 0.3 0.4 0.5 0.6 0.7
V(v)
J(m
A/c
m2)
untreated
H3PO
4
HCL
HNO3
Fig. 4.17. Current density (J) versus voltage (V) characteristic curves for the DSSCs
with the pre-treatment of FTO glass substrates with HCL, H3PO4 and HNO3 acids
using lemon leaves dye.

51
0.0 0.1 0.2 0.3 0.4 0.5 0.6 0.70.0
0.1
0.2
0.3
0.4
0.5
0.6
P(m
W/c
m2)
V(v)
Untreated
HCL
HNO3
H3PO
4
Fig. 4.18 Power (P) versus voltage (V) characteristic curves of the DSSCs with the
pre-treatment of FTO glass substrates with HCL, H3PO4 and HNO3 acids using lemon
leaves dye.
-1.50
-1.25
-1.00
-0.75
-0.50
-0.25
0.000.0 0.1 0.2 0.3 0.4 0.5 0.6
V(v)
J(m
A/c
m2)
Untreated
HNO3
HCL
H3PO
4
Fig. 4.19. Current density (J) versus voltage (V) characteristic curves for the DSSCs
with the pre-treatment of FTO glass substrates with HCL, H3PO4 and HNO3 acids
using mandarin leaves dye.
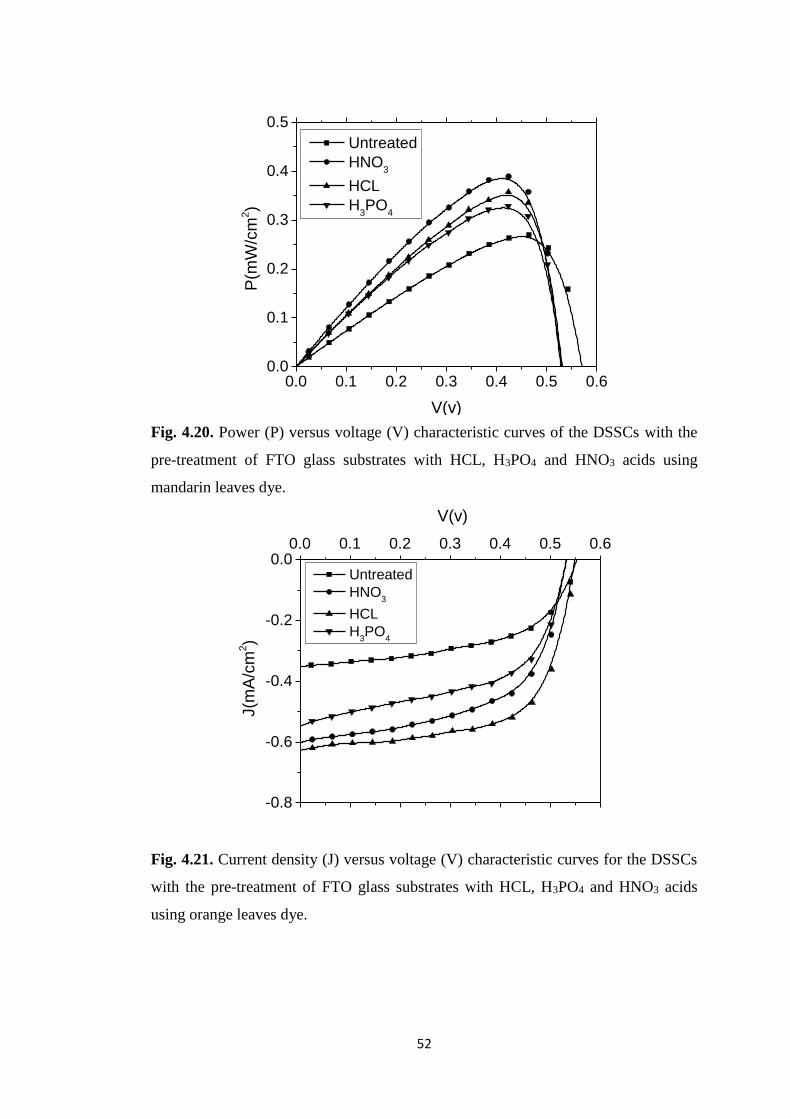
52
0.0 0.1 0.2 0.3 0.4 0.5 0.60.0
0.1
0.2
0.3
0.4
0.5
P(m
W/c
m2)
V(v)
Untreated
HNO3
HCL
H3PO
4
Fig. 4.20. Power (P) versus voltage (V) characteristic curves of the DSSCs with the
pre-treatment of FTO glass substrates with HCL, H3PO4 and HNO3 acids using
mandarin leaves dye.
-0.8
-0.6
-0.4
-0.2
0.00.0 0.1 0.2 0.3 0.4 0.5 0.6
V(v)
J(m
A/c
m2)
Untreated
HNO3
HCL
H3PO
4
Fig. 4.21. Current density (J) versus voltage (V) characteristic curves for the DSSCs
with the pre-treatment of FTO glass substrates with HCL, H3PO4 and HNO3 acids
using orange leaves dye.

53
0.0 0.1 0.2 0.3 0.4 0.5 0.60.0
0.1
0.2
0.3
0.4
0.5
P(m
W/c
m2)
V(v)
Untreated
HNO3
HCL
H3PO
4
Fig. 4.22. Power (P) versus voltage (V) characteristics curve of the DSSCs with the
pre-treatment of FTO glass substrates with HCL, H3PO4 and HNO3 acids using orange
leaves dye.
Table 4.4 shows the photovoltaic parameters of the DSSCs sensitized by lemon leaves
dye and pre-treated with hydrochloric (HCl), phosphoric (H3PO4) and nitric (HNO3)
acids, while Tables 4.5 and 4.6 show the photovoltaic parameters of the DSSCs
sensitized by mandarin and orange leaves dye and pre-treated with hydrochloric (HCl),
phosphoric (H3PO4) and nitric (HNO3) acids respectively.
Table 4.4 Photovoltaic parameters of the DSSCs with the pre-treatment of FTO glass
substrates by HCl, H3PO4, and HNO3 acids using lemon leaves dye.
FTO
Pre-treatment
Jsc
(mA/cm2)
Voc
(V)
Jm
(mA/cm2)
Vm
(V)
FF
η
%
Untreated 0.95 0.59 0.77 0.46 0.63 0.35
HCl
(0.1M, 5min) 1.38 0.58 1.08 0.46 0.62 0.49
H3PO4
(0.1M, 5min) 1.44 0.57 1.06 0.46 0.59 0.48
HNO3
(0.1M, 5min) 1.35 0.58 1.08 0.46 0.63 0.49

54
Table 4.5 Photovoltaic parameters of the DSSCs with the pre-treatment of FTO glass
substrates by HCl, H3PO4, and HNO3 acids using mandarin leaves dye.
FTO
Pre-treatment
Jsc
(mA/cm2)
Voc
(V)
Jm
(mA/cm2)
Vm
(V)
FF
η
%
Untreated 0.76 0.57 0.55 0.47 0.59 0.25
HCl
(0.1M, 5min) 1.11 0.53 0.77 0.45 0.58 0.34
H3PO4
(0.1M, 5min) 1.12 0.53 0.71 0.44 0.52 0.31
HNO3
(0.1M, 5min) 1.27 0.53 0.85 0.44 0.55 0.37
Table 4.6 Photovoltaic parameters of the DSSCs with the pre-treatment of FTO glass
substrates by HCl, H3PO4, and HNO3 acids using orange leaves dye.
FTO
Pre-treatment
Jsc
(mA/cm2)
Voc
(V)
Jm
(mA/cm2)
Vm
(V)
FF
η
%
Untreated 0.34 0.55 0.22 0.46 0.54 0.10
HCl
(0.1M, 5min) 0.62 0.54 0.46 0.46 0.63 0.21
H3PO4
(0.1M, 5min) 0.53 0.55 0.34 0.45 0.52 0.15
HNO3
(0.1M, 5min) 0.60 0.53 0.42 0.44 0.42 0.18
It can be seen from the J-V curves that the performances of DSSCs with acids
pretreatment are much better than the DSSCs without acids pretreatment. As shown in
Tables 4.4, 4.5, and 4.6, the short-circuit current (Jsc), open-circuit voltage, conversion
efficiency, and filling factor of DSSCs with acids pretreatment are greatly improved.
The pre-treatment of the FTO with HCL and HNO3 showed an improved efficiency of
140% using lemon leaves dye, while the pre-treatment of the FTO with HCL using

55
orange leaves dye showed an improved efficiency of 210%. The main reason for these
results is that the acids pretreatment of FTO enhance the bonding strength between the
FTO substrate and the porous-TiO2 layer. Aslo more dye were adsorbed on TiO2.
Meanwhile the acids pretreatment block charge recombination between electrons in
the FTO with holes in I-/Ι-3 redox couple and a layer of dense TiO2 on FTO is formed
and impede carriers recombination between Ι-3 and FTO effectively, thus, the short-
circuit photocurrent density is improved, so the conversion efficiency is also increased
[38]. The reason behind that may be attributed to decreasing of the FTO sheet
resistance by acids treatment.
4.4 Effect of surface post-treatment of TiO2 layer
The role of photoelectrode is one of the most important factors to get high efficiency
in DSSCs. So, lots of efforts have been reported to enhance the dispersion and adhesion
relating to porosity, dispersion and modification between FTO and TiO2 particles as a
photoelectrode. In this study, we investigated the influence of acidic post-treatment of
TiO2 photoelectrode on DSSCs efficiency. Hydrochloric acid (HCl) and nitric acid
(HNO3) were used to investigate the effect of surface post-treatment of TiO2 film on
the efficiency of DSSCs.
4.4.1 J-V characterization of DSSCs with post-treatment of TiO2 electrode
DSSCs with electrodes that untreated with acids, together with acids post-treated TiO2
electrodes are tested under 100 mW/cm2 intensity. Their characteristic J-V curves are
illustrated in Fig. 4.23. The power versus the voltage for all DSSCs with post-treatment
of TiO2 electrode with the two acids are shown in Fig. 4.24.

56
-1.4
-1.2
-1.0
-0.8
-0.6
-0.4
-0.2
0.00.0 0.1 0.2 0.3 0.4 0.5 0.6 0.7
V(v)
J(m
A/c
m2)
Untreated
HNO3
HCL
Fig. 4.23 Current density (J) versus voltage (V) characteristic curves of DSSCs with
post-treatment of TiO2 electrode using HCL and HNO3 acids.
0.0 0.1 0.2 0.3 0.4 0.5 0.6 0.70.0
0.1
0.2
0.3
0.4
0.5
P(m
W/c
m2)
V(v)
Untreated
HNO3
HCL
Fig. 4.24 Power (P) versus voltage (V) characteristic curves of the DSSCs with post-
treatment of TiO2 electrode with HCL and HNO3 acids.

57
Table 4.7 Photovoltaic parameters of the DSSCs with post-treatment of TiO2 electrode
by HCL and HNO3 acids.
TiO2
post-treatment
Jsc
(mA/cm2)
Voc
(V)
Jm
(mA/cm2)
Vm
(V)
FF
η
%
Untreated 1.08 0.61 0.70 0.46 0.48 0.32
HCl
(0.1M, 5min) 1.36 0.58 0.95 0.42 0.50 0.39
HNO3
(0.1M, 5min) 1.25 0.58 0.91 0.46 0.57 0.41
Acid post-treated cells showed enhanced current density in comparison with normal
cell. HCl and HNO3 treated cells showed higher current densities of 1.36 mA/cm2 and
1.25 mA/cm2, and reduced open circuit voltage 0.58V respectively. HNO3 treated cell
showed over 128% improvement of conversion efficiency (0.41) with 1.25 mA/cm2
short circuit current, 0.58V open circuit voltage and 0.57 fill factor. These observations
could be conferring that the acid contributed regular arrangement of the photoelectrode
by the dispersion of TiO2 nanoparticles. This dispersion is one of the factors that makes
much chemisorption sites for the dyes. Also, the reason behind that behavior may be
attributed to the improvement of TiO2 film electrical conductivity by enhancing the
neck points between the nanoparticles, increasing dye loading and minimizing the
recombination rate between the TiO2 film and the mediator. The positively charged
TiO2 surface formed by nitric acid treatment induces high electrostatic attraction
between the reaction sites and anionic dyes, resulting in a much faster adsorption
reaction [39]. The HNO3 treatment enhanced the dispersion of TiO2 particles,
increased the surface area and porosity of the sintered TiO2 films, increased the amount
of adsorbed dye molecules on the TiO2 electrode, and reduced the charge-transfer
resistance [40]. The Isc improvement upon HNO3 treatment of TiO2 has also been
related to the enhanced charge collection efficiency by surface protonation of TiO2 and
the retarded backward electron transfer by anion (NO3−) adsorption on the TiO2
surface.

58
4.5 Electrochemical impedance spectroscopy analysis
In order to study the internal resistances and electron transfer kinetics of the cells
sensitized by lemon leaves dye, EIS was employed using AUT 85276 Potentiostat-
Galvanostat with FRA 32 Module. DSSCs sensitized by lemon leaves dye without
treatment and with FTO treated with nitric acid were studied.
4.5.1 EIS of the DSSC sensitized by lemon leaves without any treatment
The EIS measurements were carried out in the dark and under an illumination of
100 mW/cm2 for the DSSC sensitized by lemon leaves without any treatment at -0.6 V,
applied voltages.
As observed from Fig. 4.25 and Table 4.8, there is a decrease in the charge-transfer
resistance (RCT) upon exposure to an illumination of 100 mW/cm2 for the DSSC
sensitized by lemon leaves without any treatment at the chosen applied voltages. This
can be ascribed to a difference in the local I3− concentration. Under illumination, I3
− is
formed "in situ" by dye regeneration at the mesoporous TiO2/electrolyte interface,
whereas in the dark, I3− is generated at counter electrode and penetrates the
mesoporous TiO2 films by diffusion. Electrochemical circle fit was obtained for the
DSSC sensitized by lemon leaves without any treatment in the dark and under an
illumination at chosen applied voltage as shown in Fig 4.25. Hus and Mansfeld
proposed equation 4.1 that can be used to calculate the estimated interfacial
capacitance from a depressed semicircle model (a Constant Phase Element in parallel
with a resistor).
𝐶 = 𝑄0(𝜔𝑚𝑎𝑥)(𝑛−1) (4.1)
where C is estimated interfacial capacitance, Qo is the CPE coefficient, ωmax is the
characteristic frequency at which the imaginary part of the impedance reaches its
maximum magnitude, and n is the exponent. A summary of the equivalent circuit
component values obtained from modeling the DSSCs sensitized by lemon leaves
without any treatment in the dark and under an illumination at chosen applied voltage
can be found in Table 4.8.

59
0 1 2 3 4 50.0
0.5
1.0
1.5
2.0
2.5 -0.6v dark
-0.6v illumination
-Z"(
K
)
Z'(K)
Fig. 4.25. Nyquist plots of the DSSC sensitized by lemon leaves without any treatment
at -0.6 V in the dark and under an illumination of 100 mW/cm2.
Fig. 4.26. The equivalent circuit for the DSSCs sensitized by lemon leaves without
any treatment.
where RS is the series resistance, CPE is the constant phase element, and RCT is the
charge-transfer resistance.
Table 4.8 EIS results from data-fitting of Nyquist plots to the equivalent circuit model
in Fig. 4.26 without treatment.
Applied voltage RS(Ω) RCT (kΩ) C(µF)
-0.6v dark 34.55 4.35 1.77
-0.6v illumination 33.19 1.48 1.62

60
4.5.2 EIS of the DSSC sensitized with lemon leaves with pre-treated FTO
Figure 4.27 shows the Nyquist plots for DSSC sensitized by lemon leaves with pre-
treatment of FTO glass substrates with nitric acid in the dark at -0.6 V applied voltages.
Electrochemical circle fit was obtained for the DSSCs sensitized by lemon leaves and
pre-treatment of FTO glass substrates with nitric acid in the dark at different applied
voltages as shown in Fig 4.27. A summary of the equivalent circuit component values
obtained from modeling the DSSCs sensitized by lemon leaves with pre-treatment of
FTO glass substrates with nitric acid in the dark and under an illumination at chosen
applied voltage can be found in Table 4.9.
0.00 0.25 0.50 0.75 1.000.0
0.1
0.2
0.3
0.4
0.5 -0.6v dark
-0.6v illumination
Z'(k)
Fig. 4.27. Nyquist plots of the DSSC sensitized by lemon leaves with nitric acid
pretreatment of FTO glass substrates at -0.6 V
Table 4.9 EIS results from data-fitting of Nyquist plots to the equivalent circuit model
in Fig. 4.27 for the DSSC sensitized by lemon leaves with nitric acid pre-treatment of
FTO glass substrates.
Pre-treatment of FTO
with HNO3 RS(Ω) RCT(kΩ) C(µF)
-0.6v dark 36.4 0.80 1.18
-0.6v illumination 35.6 0.89 1.20

61
CONCLUSION
Twelve natural dyes obtained from leaves of plants were used as sensitizers in DSSCs.
The absorption spectra of these dyes were measured. The J-V characteristics curves of
the fabricated cells were carried out. The performance of the cells were optimized. The
photoelectrochemical performance of the DSSCs based on these dyes showed that the
Voc ranged from 0.49–0.59 V, and Jsc was in the range of 0.17–0.95 mA/cm2. The
DSSC sensitized by lemon leaves extract exhibited the highest conversion efficiency
of 0.35% among the 12 extracts.
It was found that the efficiency of the DSSC can be enhanced by adjusting extracting
temperature of the extracts. The optimum extracting temperature of the lemon leaves
extract were found at 50º C. At the optimum conditions, the lemon leaves sensitized
DSSC showed efficiency as high as 0.50%.
It was also found that the efficiency of the DSSC can be enhanced by the pre-treatment
of the FTO with phosphoric acid (H3PO4), nitric acid (HNO3) and hydrochloric acid
(HCl). The pre-treatment of the FTO with phosphoric acid (H3PO4) improved
efficiencies by 137%, 124% and 150% for the DSSCs sensitized by lemon, mandarin
and orange leaves, respectively. The pre-treatment of the FTO with nitric acid (HNO3)
improved efficiencies by 140%, 148% and 180% for the DSSCs sensitized by lemon,
mandarin and orange leaves respectively, where as the pre-treatment of the FTO with
hydrochloric acid (HCL) improved efficiencies by 140%, 136% and 210% for the
DSSCs sensitized by lemon, mandarin and orange leaves respectively.
The nitric acid (HNO3) and hydrochloric acid (HCL) post-treated electrodes showed
an efficiency of 0.41% and 0.39% while the DSSC fabricated with untreated electrodes
gave an efficiency of η=0.32%. The HNO3 and HCL treated electrodes showed an
efficiency enhancement of about 128% and 121% for the DSSCs sensitized by lemon
leaves dye.
The highest efficiency of 0.5% has been obtained by lemon leaves which contains
chlorophyll pigment extracted at 50º C for 3 hours.

62
It can be concluded that natural dyes as sensitizers for DSSCs are promising
alternatives to organic dyes. They offer environmental friendliness, low-cost
production, simple preparation technique and wide availability. Although the
efficiencies obtained with the natural dyes are below the requirements for large scale
production, the results are hopeful and can boost additional studies oriented to the
search of new natural sensitizers and to the optimization of solar cell components
compatible with such dyes. However, there still remains room for further development
for the commercialization of this technology and there are still many challenges that
need to be faced, and a lot of improvements within the field have to be done, before
dye sensitized solar cells make a large impact on the society.

63
References
[1] World Energy Outlook: 2014 - International Energy Agency (IEA).
[2] Technology Roadmap Solar Photovoltaic Energy: 2014 – (IEA).
[3] Statistical Review of World Energy: 2014 – BP.
[4] A.E. Becquerel, "Memoire sur les effets électriques produits sous l’influence des
rayons solaires", C. R. Acad. Sci, Vol. 9, No. 2, pp. 561–567, 1839.
[5] W. G Adams, R. E. Day, "The action of light on selenium", Proc. R. Soc. Lond,
Vol. 25, No. 113, pp. 171–177, 1877.
[6] J. Z. Czocharalski, "A new method for the measurement of crystallization rate of
metals", Phys. Chem, Vol. 92, No. 5, pp. 219–221, 1918.
[7] B. O'Regan, M. Grätzel, "A low-cost, high-efficiency solar cell based on dye-
sensitized colloidal TiO2 films", Nature, Vol. 353, No. 24, pp. 737–740, 1991.
[8] Palestinian Energy And Natural Resources Authority - PENRA.
[9] B. O'Regan, M. Grätzel, "A low-cost, high-efficiency solar cell based on dye-
sensitized colloidal TiO2 films", Nature, Vol. 353, No. 24, pp. 737-740, 1991.
[10] G.R.A. Kumara, S. Kaneko, M. Okuya, B. Onwona-Agyeman, A. Konno, K.
Tennakone, "Shiso leaf pigments for dye -sensitized solid-state solar cell", Sol. Energ.
Mat. Sol. Cells, Vol. 90, NO. 9, pp.1220-1226, 2006.
[11] E. Yamazaki, M. Murayama, N. Nishikawa, N. Hashimoto, M. Shoyama, O.
Kurita, "Utilization of natural carotenoids as photosensitizers for dye-sensitized solar
cells", Sol. Energ, Vol. 81, No. 4, pp.512-516, 2007.
[12] S. Furukawa, H. Iino, T. Iwamoto, K. Kukita, S. Yamauchi, "Characteristics of
dye-sensitized solar cells using natural dye", Thin Solid Films, Vol. 518, No. 2, pp.
526-529, 2009.
[13] C.Sandquist, J.L. McHale, "Improved efficiency of betanin-based dye sensitized
solar cells", J. Photochem. Photobiol. A: Chem, Vol. 221, No. 1, pp.90-97, 2011.

64
[14] C.I. Oprea, A. Dumbrava, I. Enache, A. Georgescu, M.A. Gîrt¸u, "A combined
experimental and theoretical study of natural betalain pigments used in dye sensitized
solar cells", J. Photochem. Photobiol. A: Chem, Vol. 240, No. 2, pp.5-13, 2012.
[15] C. Sandquist, J.L. McHale, "Improved efficiency of betanin-based dye sensitized
solar cells", J. Photochem. Photobiol. A: Chem, Vol. 221, No. 1, pp. 90-97, 2011.
[16] S. Ito, T. Saitou, H. Imahori, H. Uehara, N. Hasegawa, "Fabrication of
dyesensitized solar cells using natural dye for food pigment", Monascus yellow.
Energy Environ. Sci, Vol.3, No. 7, pp. 905-909, 2010.
[17] S.A. Agarkar, R.R. Kulkarni, V.V. Dhas, A.A. Chinchansure, P. Hazra, S.P. Joshi,
S.B. Ogale, S.B., "Isobutrin from Butea monosperma (flame of the forest): a promising
new natural sensitizer belonging to chalcone class". ACS Appl. Mater, Vol. 3, No. 7,
pp. 2440-2444, 2011.
[18] G. Calogero, G.D. Marco, S. Caramori, S. Cazzanti, R. Argazzi, C.A.Bignozzi,
"Natural dye sensitizers for photoelectrochemical cells", Energy Environ. Sci, Vol. 2,
No. 11, pp. 1162-1172, 2009.
[19] M. Ikegami, M. Ozeki, Y. Kijitori, T. Miyasaka, "Chlorin-sensitized high
efficiency photovoltaic cells that mimic spectral response of photosynthesis",
Electrochemistry, Vol. 76, No. 2, pp. 140-143, 2008.
[20] O. Alfredo, G. Ponce, and P. J. Sebastian, "Electron transfer via organic dyes for
solar conversion", Solar Energy Materials and Solar Cells, Vol. 59, No. 2, pp. 137-
143, 1999.
[21] M. Grätzel, "Demonstrating Electron Transfer and Nanotechnology: A Natural
Dye Sensitized Nanocrystalline Energy Converter", Journal of Chemical Education,
Vol. 75, No. 6, pp. 752-756, 1998.
[22] Z. Kebede, S.E Lindquist, "Donor–acceptor interaction between non-aqueous
solvents and I2 to generate I-3 and its implication in dye sensitized solar cells", Solar
Energy Materials and Solar Cells, Vol. 57, No. 3, pp. 259-275, 1999.
[23] G. Katsarosa, T. Stergiopoulosa, I. M. Arabatzisa, K. G. Papadokostakia and P.
Falaras, "A solvent-free composite polymer/inorganic oxide electrolyte for high

65
efficiency solid-state dye-sensitized solar cells", Photochemistry and Photobiology A:
Chem., Vol. 149, No. 1, pp. 191-198, 2002.
[24] J. Zhang, Y. Yanga, S. Wua, S. Xua, C. Zhoua, H. Hua, B. Chena, H. Hana and
X. Zhao, "Improved photovoltage and performance by aminosilane-modified
PEO/P(VDF-HFP) composite polymer electrolyte dye-sensitized solar cells",
Electrochimica Acta, Vol. 53, No. 16, pp. 5415-5422, 2008.
[25] A.F. Nogueira, M.A. De Paoli, "A dye sensitized TiO2 photovoltaic cell
constructed with an elastomeric electrolyte", Solar Energy Materials and Solar Cells,
Vol. 61, No. 2, pp. 135-141, 2000.
[26] W.J. Lee, Easwaramoorthi Ramasamya, Dong Yoon Leea and Jae Sung Song,
"Performance variation of carbon counter electrode based dye-sensitized solar cell",
Solar Energy Materials and Solar Cells, Vol. 92, No. 7, pp. 814-818, 2008.
[27] S. Ito, T. N. Murakami, P. Comte, P. Liska, C. Grätzel, M. K. Nazeeruddin, M.
Grätzel, "Fabrication of thin film dye sensitized solar cells with solar to electric power
conversion efficiency over 10%", Thin Solid Films, Vol. 516, No. 14, pp. 4613-4619,
2008.
[28] S. Taya, T. El-Agez, H. El-Ghamri and M. Abdel-Latif, "Dye-Sensitized Solar
Cells Using Fresh and Dried Natural Dyes", International Journal of Materials Science
and Applications, Vol. 2, No. 2, pp. 37-42, 2013.
[29] S. Taya, T. El-Agez, M. Abdel-Latif, H. El-Ghamri, A. Batniji, and I. El-Sheikh,
"Fabrication of dye-sensitized solar cells using dried plant leaves", International
Journal of Renewable Energy Research, Vol. 4, No. 2, , 2014.
[30] H. El-Ghamri, T. El-Agez, S. Taya, M. Abdel-Latif, A. Batniji, "Dye-sensitized
solar cells with natural dyes extracted from plant seeds", Materials Science, Vol. 32,
No. 4, pp. 547-554, 2014.
[31] I. Radwan, "Dye sensitized solar cells based on natural dyes extracted from plant
roots", Islamic University of Gaza, Palestine, 2015.

66
[32] A. R. Hernández-Martínez, M. Estevez, S. Vargas, F. Quintanilla, and R.
Rodríguez, "Natural pigment based dye sensitized solar cells", Journal of Applied
Research and Technology, Vol. 10, No. 1, pp. 38–47, 2012.
[33] G. Calogero, J.H. Yum, A. Sinopoli, G.D. Marco, M. Grätzel, M. K. Nazeeruddin,
"Anthocyanins and betalains as light-harvesting pigments for dye-sensitized solar
cells", Solar Energy, Vol. 86, No. 5, pp. 1563-1575, 2012.
[34] H. Chang, H.M. Wu, T.L. Chen, K.D. Huang, C.S. Jwo, Y.J. Lo, "Dye-sensitized
solar cell using natural dyes extracted from spinach and ipomoea", Journal of Alloys
and Compounds, Vol. 495, No. 2, pp. 606-610, 2010.
[35] S. Hao, J. Wu, Y. Huang and J. Lin, "Natural dyes as photosensitizers for dye-
sensitized solar cell", Solar Cells and Solar Energy Materials, Vol. 80, No.2, pp. 209-
214, 2006.
[36] A. Bakowska, A.Z. Kucharska, J. Oszmianski, " The effects of heating, UV
irradiation, and storage on stability of the anthocyanin-polyphenol copigment complex
", Food Chem, Vol. 81, No. 3, pp. 349– 355, 2003.
[37] H. ERGE, F. KARADEN, N. KOCA, Y. SOYER "Effect of heat treatment on
chlorophyll degradation and color loss in green peas", the association of food
technology, Vol. 33, No. 5, pp.225-233, 2008.
[38] W. Xu, S. Dai, and L. Hu, "Influence of different surface modifications on the
photovoltaic performance and dark current of dye-sensitized solar cells", Plasma
Science and Technology, Vol. 9, No. 5, pp. 556–559, 2007.
[39] S. Hao, J. Wu, L. Fan, Y. Huang, J. Lin and Y. Wei, "The influence of acid
treatment of TiO2 porous film electrode on photoelectric performance of dye-
sensitized solar cell", Solar energy, Vol. 76, No. 6, pp. 745-750, 2004.
[40] K.Park, M. Kim and H.B Gu, "Electrochemical Properties of HNO3 Pre-treated
TiO2 Photoanode Based Dye-sensitized Solar Cell", Journal of Advanced Engineering
and Technology, Vol. 1, No. 2, pp. 405-408, 2008.