Embed Size (px)
Citation preview

Natural gas: physical properties and combustion features 39
Natural gas: physical properties and combustion features
Le Corre Olivier and Loubar Khaled
X
Natural gas: physical properties and combustion features
Le Corre Olivier and Loubar Khaled
GEPEA, Ecole des Mines de Nantes, CNRS, UMR 6144 Ecole des Mines de Nantes, NATech, GEM, PRES UNAM
La Chantrerie, 4, rue Alfred Kastler, B.P. 20722, F-44307, Nantes, Cedex 3, France
1. Introduction
One calls combustible natural gas or simply natural gas, any combustible gas fluid coming from the basement. The concept of a unique “natural gas” is incorrect. It is more exact to speak about natural gases. In fact, the chemical composition of available natural gas (at the final customer) depends on its geographic origin and various mixtures carried out by networks operators. The majority of natural gases are mixtures of saturated hydrocarbons where methane prevails; they come from underground accumulations of gases alone or gases associated with oil. There are thus as many compositions of natural gases as exploited hydrocarbon layers. Apart from the methane which is the prevailing element, the crude natural gas usually contains decreasing volumetric percentages of ethane, propane, butane, pentane, etc. The ultimate analysis of a natural gas thus includes/understands the molar fraction of hydrocarbons in CH4, C2H6, C3H8, C4H10 and the remainder of heavier hydrocarbons is generally indicated under the term C5+. Table 1 gives typical compositions. Apart from these hydrocarbons, one often finds one or more minor elements, or impurities, quoted hereafter:
nitrogen N2: it has as a disadvantage its inert character which decreases the commercial value of gas,
carbon dioxide CO2: it is harmful by its corrosive properties, hydrogen sulfide H2S: it is harmful by its corrosive properties, helium He: it can be developed commercially, water H2O: the natural gas of a layer is generally saturated with steam. To be
exploited, it undergoes a partial dehydration.
In this chapter, the characteristics of natural gas in term of composition and physical properties and combustion features are presented. The physical models for the calculation of the physical properties are developed and a synthesis of the models selected is carried out.
2
www.intechopen.com

Natural Gas40
Fuel CH4 C2H6 C3H8 C4H10 C5H12 N2 CO2 MN No.1 87.1 8.8 2.5 0.8 0 0.8 0 70.7 No.2 97.3 2.1 0.2 0.1 0 0.3 0 90.6 No. 3 87.0 9.4 2.6 0.6 0 0.4 0 70.9 No.4 91.2 6.5 1.1 0.2 0 1.0 0 79.3 No.5 88.6 4.6 1.1 0.3 0.1 3.9 1.4 82.2 No.6 82.9 3.2 0.6 0.2 0.1 12 1 87.9 No.7 92.3 3.2 0.6 0.2 0.1 3 0.4 85.7 No.8 89.5 3.1 3.6 0.2 0.1 2.9 0.4 76.3 No.9 87.7 3.0 5.6 0.2 0.1 2.9 0.4 71.8 No10 84.9 2.9 8.5 0.2 0.1 2.7 0.3 66.5
Table 1. Sample group of fuel gases (Saikaly et al., 2008). Various techniques of determination of combustion features such as equivalence ratio, the low heating value and Wobbe index are exposed. These techniques are based on direct or indirect methods. The section “Physical Properties” is a toolbox to calculate transport properties (dynamic viscosity and thermal conductivity) and other important properties such as speed of sound, refractive index and density. Regards time, the ultimate consumer burns a fuel whose chemical composition varies, see Figure 1. These variations bring problems for plant operation, whatever is the prime mover (Internal Combustion engine, gas turbine or boiler). The section “Combustion features” details: Air-fuel ratio is the ratio of air to fuel in stoichiometric conditions. Network operator sells natural gas volume but final customer needs heat. Low heating
value LHV is the link and is very important. By contract, network operator takes obligations on the LHV minimum value.
Wobbe index (W) is an important criterion of inter-changeability of gases in the industrial applications (engines, boilers, burners, etc). Gas composition variation does not involve any notable change of the factor of air and the velocity burning when the index of Wobbe remains almost constant.
Methane number (MN) characterizes gaseous fuel tendency to auto-ignition. By convention, this index has a value 100 for methane and 0 for hydrogen (Leiker et al., 1972). The gaseous fuels are thus compared with a methane-hydrogen binary mixture. Two gases with same value MN have the same resistance against the spontaneous combustion.
2. Physical Properties
2.1 Introduction Physical models of transport properties relating to the gases (viscosity, conductivity) result from the kinetic theory of gases, see (Hirschfelder et al., 1954) and (Chapman & Cowling, 1970).
Fig. 1. Methane Number during 5 consecutive months (Saikaly et al., 2008) The assumptions with regards to the kinetic theory of gases are: 1. The average distance between the molecules is sufficiently important so that the
molecular interactions (other than shocks) are negligible, 2. The number of molecules per unit volume is large and constant (gas homogeneity on a
macroscopic scale). The following assumptions are relating to kinematics: 1. Between two shocks, presumed elastic, the movement of each molecule is rectilinear
and uniform, 2. The direction of the Speed Vectors of the various molecules obeys a uniform space
distribution, 3. The module of the Speed Vectors varies according to a law of distribution which does
not depend on time when the macroscopic variables of state are fixed.
Natural gases are a mixture of components. Their physical properties such as dynamic viscosity and thermal conductivity, evaluated on the basis of kinetics of gases, are obtained starting from the properties of pure gases and corrective factors (related on the mixtures, the polar moments, etc).
2.2 Dynamic viscosity Natural gas viscosity is required to carry out flow calculations at the various stages of the production and in particular to determine pressure network losses. Natural gas generally behaves as a Newtonian fluid, see (Rojey et al., 2000) and, in this case, dynamic viscosity in unit [Pa.s] is defined by Equation (1):
dydu (1)
With the shear stress and dydu
the shear rate.
www.intechopen.com

Natural gas: physical properties and combustion features 41
Fuel CH4 C2H6 C3H8 C4H10 C5H12 N2 CO2 MN No.1 87.1 8.8 2.5 0.8 0 0.8 0 70.7 No.2 97.3 2.1 0.2 0.1 0 0.3 0 90.6 No. 3 87.0 9.4 2.6 0.6 0 0.4 0 70.9 No.4 91.2 6.5 1.1 0.2 0 1.0 0 79.3 No.5 88.6 4.6 1.1 0.3 0.1 3.9 1.4 82.2 No.6 82.9 3.2 0.6 0.2 0.1 12 1 87.9 No.7 92.3 3.2 0.6 0.2 0.1 3 0.4 85.7 No.8 89.5 3.1 3.6 0.2 0.1 2.9 0.4 76.3 No.9 87.7 3.0 5.6 0.2 0.1 2.9 0.4 71.8 No10 84.9 2.9 8.5 0.2 0.1 2.7 0.3 66.5
Table 1. Sample group of fuel gases (Saikaly et al., 2008). Various techniques of determination of combustion features such as equivalence ratio, the low heating value and Wobbe index are exposed. These techniques are based on direct or indirect methods. The section “Physical Properties” is a toolbox to calculate transport properties (dynamic viscosity and thermal conductivity) and other important properties such as speed of sound, refractive index and density. Regards time, the ultimate consumer burns a fuel whose chemical composition varies, see Figure 1. These variations bring problems for plant operation, whatever is the prime mover (Internal Combustion engine, gas turbine or boiler). The section “Combustion features” details: Air-fuel ratio is the ratio of air to fuel in stoichiometric conditions. Network operator sells natural gas volume but final customer needs heat. Low heating
value LHV is the link and is very important. By contract, network operator takes obligations on the LHV minimum value.
Wobbe index (W) is an important criterion of inter-changeability of gases in the industrial applications (engines, boilers, burners, etc). Gas composition variation does not involve any notable change of the factor of air and the velocity burning when the index of Wobbe remains almost constant.
Methane number (MN) characterizes gaseous fuel tendency to auto-ignition. By convention, this index has a value 100 for methane and 0 for hydrogen (Leiker et al., 1972). The gaseous fuels are thus compared with a methane-hydrogen binary mixture. Two gases with same value MN have the same resistance against the spontaneous combustion.
2. Physical Properties
2.1 Introduction Physical models of transport properties relating to the gases (viscosity, conductivity) result from the kinetic theory of gases, see (Hirschfelder et al., 1954) and (Chapman & Cowling, 1970).
Fig. 1. Methane Number during 5 consecutive months (Saikaly et al., 2008) The assumptions with regards to the kinetic theory of gases are: 1. The average distance between the molecules is sufficiently important so that the
molecular interactions (other than shocks) are negligible, 2. The number of molecules per unit volume is large and constant (gas homogeneity on a
macroscopic scale). The following assumptions are relating to kinematics: 1. Between two shocks, presumed elastic, the movement of each molecule is rectilinear
and uniform, 2. The direction of the Speed Vectors of the various molecules obeys a uniform space
distribution, 3. The module of the Speed Vectors varies according to a law of distribution which does
not depend on time when the macroscopic variables of state are fixed.
Natural gases are a mixture of components. Their physical properties such as dynamic viscosity and thermal conductivity, evaluated on the basis of kinetics of gases, are obtained starting from the properties of pure gases and corrective factors (related on the mixtures, the polar moments, etc).
2.2 Dynamic viscosity Natural gas viscosity is required to carry out flow calculations at the various stages of the production and in particular to determine pressure network losses. Natural gas generally behaves as a Newtonian fluid, see (Rojey et al., 2000) and, in this case, dynamic viscosity in unit [Pa.s] is defined by Equation (1):
dydu (1)
With the shear stress and dydu
the shear rate.
www.intechopen.com

Natural Gas42
2.2.1 Pure gases Considering brownian motion of the molecules regards to the intermolecular forces, Chapman and Enskog theory can be applied. This approach considers in detail the interactions between molecules which enter in collision and is based on equation of Maxwell-Boltzmann function distribution, see (Chapman & Cowling, 1970). For mono-atomic gases, analytic solution of this equation gives the viscosity depending of a two double integrals )2,2( , corresponding to molecules binary collisions, often called “collision integral for viscosity”. However, this theoretical approach is only applicable to mono-atomic gases under low pressures and high temperatures. To apply this model to polyatomic gases, a correction for energy storage and transfer are required, see (Le Neindre, 1998). In general terms, the solution obtained for the dynamic viscosity of the mono-atomic gases which do not have degree of freedom of rotation or vibration is written:
*)2,2(26106693.2 TM
(2)
With M the molar mass in [g mol-1], T the absolute temperature in [K], a characteristic
diameter of the molecules, often called “the collision diameter” in [1 A ], *)2,2( the
collision integral depending on the reduced temperature *T defined as /* kTT , where k is the Boltzmann constant and is the maximum energy of attraction. Correlations exist to approximate the collision integral.
For nonpolar gases, Neufeld et al. (1972) have proposed the expression: *** *)2,2( TFTDB
eEeCTA (3)
Where A=1.16145, B=0.14874, C=0.52487, D=0.77320, E=2.16178 and F=2.43787. Equation (3) is valuable in the range 1003.0 rT , where cr TTT / , Tc being the critical temperature, with a standard deviation of 0.064%.
Chung et al. (1984) and (1988) have experimentally obtained:
2593.1cT
k
(4)
3/1809.0 cV (5)
To take into account molecule shapes, Chung et al. have introduced a corrective factor cF :
*)2,2(3/26100785.4
cc
V
TMF (6)
With 4059035.02756.01 rcF ; is the acentric factor, is a correction for gases being strongly polar; the dimensionless dipole moment r
being given by 2/13.131 ccr TV Reichenberg (1974) have chosen a linear dependence:
nTa
*)2,2( * (7)
Dynamic viscosity is then expressed by:
3/212/12/16 2593.1/
100785.4c
ncn
VTaTM (8)
2.2.2 Gaseous blends At low pressure, dynamic viscosity of gases blend, noted m , can be estimated from the viscosity of pure gases. For a mixture of components, gaseous blend viscosity is given by the expression:
1
1
1 ,1 ,121
i
i
j ij ikkjikijiijim KKHHKHK (9)
Where
ikikikkii
iii
MMHxx
xK
,1/23
(10)
Where i is the dynamic viscosity of ith pure gas, iM its molar mass, ix its molar fraction and coefficients ijH are obtained by
2/1
,
,6/1
,,2
2/1
3
136.01
32 ijr
ijRijrijrji
ji
jiij T
FTTCC
MM
MMH
(11)
Reduced temperature ijrT , is based on critical temperature of pure gases i and j:
2/1,,
,jcic
ijrTTTT (12)
www.intechopen.com

Natural gas: physical properties and combustion features 43
2.2.1 Pure gases Considering brownian motion of the molecules regards to the intermolecular forces, Chapman and Enskog theory can be applied. This approach considers in detail the interactions between molecules which enter in collision and is based on equation of Maxwell-Boltzmann function distribution, see (Chapman & Cowling, 1970). For mono-atomic gases, analytic solution of this equation gives the viscosity depending of a two double integrals )2,2( , corresponding to molecules binary collisions, often called “collision integral for viscosity”. However, this theoretical approach is only applicable to mono-atomic gases under low pressures and high temperatures. To apply this model to polyatomic gases, a correction for energy storage and transfer are required, see (Le Neindre, 1998). In general terms, the solution obtained for the dynamic viscosity of the mono-atomic gases which do not have degree of freedom of rotation or vibration is written:
*)2,2(26106693.2 TM
(2)
With M the molar mass in [g mol-1], T the absolute temperature in [K], a characteristic
diameter of the molecules, often called “the collision diameter” in [1 A ], *)2,2( the
collision integral depending on the reduced temperature *T defined as /* kTT , where k is the Boltzmann constant and is the maximum energy of attraction. Correlations exist to approximate the collision integral.
For nonpolar gases, Neufeld et al. (1972) have proposed the expression: *** *)2,2( TFTDB
eEeCTA (3)
Where A=1.16145, B=0.14874, C=0.52487, D=0.77320, E=2.16178 and F=2.43787. Equation (3) is valuable in the range 1003.0 rT , where cr TTT / , Tc being the critical temperature, with a standard deviation of 0.064%.
Chung et al. (1984) and (1988) have experimentally obtained:
2593.1cT
k
(4)
3/1809.0 cV (5)
To take into account molecule shapes, Chung et al. have introduced a corrective factor cF :
*)2,2(3/26100785.4
cc
V
TMF (6)
With 4059035.02756.01 rcF ; is the acentric factor, is a correction for gases being strongly polar; the dimensionless dipole moment r
being given by 2/13.131 ccr TV Reichenberg (1974) have chosen a linear dependence:
nTa
*)2,2( * (7)
Dynamic viscosity is then expressed by:
3/212/12/16 2593.1/
100785.4c
ncn
VTaTM (8)
2.2.2 Gaseous blends At low pressure, dynamic viscosity of gases blend, noted m , can be estimated from the viscosity of pure gases. For a mixture of components, gaseous blend viscosity is given by the expression:
1
1
1 ,1 ,121
i
i
j ij ikkjikijiijim KKHHKHK (9)
Where
ikikikkii
iii
MMHxx
xK
,1/23
(10)
Where i is the dynamic viscosity of ith pure gas, iM its molar mass, ix its molar fraction and coefficients ijH are obtained by
2/1
,
,6/1
,,2
2/1
3
136.01
32 ijr
ijRijrijrji
ji
jiij T
FTTCC
MM
MMH
(11)
Reduced temperature ijrT , is based on critical temperature of pure gases i and j:
2/1,,
,jcic
ijrTTTT (12)
www.intechopen.com

Natural Gas44
Correction coefficients ijRF , is given by:
72/1,,
2/7,
72/1,,
2/7,
,101
10
jririjr
jririjrijR
T
TF
(13)
Coefficients iC is obtained by:
2/1
4/1
ii
ii
UMC (14)
With:
2/1,
6/1,,, )1(36.01
iir
iiriiriiRi T
TTFU
(15)
Wilke (1950) have introduced simplifications into equation (9) by neglecting the term of the second order. The expression of dynamic viscosity obtained makes easier the application:
1
1
i
jijj
iim
x
x
(16)
With 2/1
24/12/1
/18
//1
ji
jijiij
MM
MM
In the literature, specific correlations were established to calculate the viscosity of gas hydrocarbons. In particular, to calculate the viscosity of methane, an equation of the following general form was proposed by Hanley et al (1975) and included by Vogel et al. (2000):
),()()( 10 TTTm (17) where )(0 T represents dynamic viscosity in extreme cases of 0 . The sum
),()(1 TT is the residual dynamic viscosity which takes account of the increase in viscosity from )(0 T .
function viscosity = func_viscosity(compo) % compo is a vector in volume fraction % [CH4 C2H6 C3H8 i-C4H10 n-C4H10 C5H12 CO2 N2 O2 H2 H2S CO] P = 101325; % current gas pressure in Pa T = 273.15; % current gas temperature in K M = [16.043 30.069 44.096 58.123 58.123 72.151 44.01 28.013 32 2.016 34 28.01]; % molar mass in g mol-1 Tc = [190.58 305.42 369.82 408.14 425.18 469.65 304.19 126.1 154.58 33.18 373.53 132.92];% Critical temperature Vc = [99.2 148.3 203 263 255 304 93.9 89.8 73.4 64.3 98.6 93.2];%Critical Volume cm3/mol Dip = [0 0 0 0.1 0 0 0 0 0 0 0.9 0.1];% Dipolar Moment omega = [0.011 0.099 0.1518 0.1770 0.1993 0.2486 0.2276 0.0403 0.0218 -0.215 0.0827 0.0663]; T_et = 1.2593*T/Tc; % omegaV = 1.16145*T_et^(-0.14874)+0.52487*(exp(-0.77320*T_et))+ 2.16178*(exp(-2.43787*T_et)); mu_r = 131.3*Dip./sqrt(Vc.*Tc); Fc = ones(1,12)-0.2756*omega+0.05903*mu_r.^4; eta = 40.785*(Fc.*sqrt(T.*M))./(Vc.^(2/3).*omegaV)/10000000; for i = 1:12 for j = 1:12 A(i,j) = (1 + sqrt(eta(i)/eta(j))*(M(i)/M(j))^(1/4))^2/sqrt(8*(1+M(i)/M(j))); % end end p1 = compo.*eta; for i = 1:12 p2(i) = p1(i)/sum(compo.*A(i,:)); % end viscosity = sum(p2); %Pa s-1 Sandia National Laboratory (www.sandia.gov) has developed CHEMKIN, a reference tool for chemical. The Gas Research Group (www.me.berkeley.edu/gri_mech/overview.html), carried out by the University of California at Berkeley, Stanford University, The University of Texas at Austin, and SRI International, has set up the description of methane and its co-products. The hand-made Matlab© function is compared to this reference code. Error is defined as:
)()()(
max)max(]500300[T
TTTCHEM
CHEMhm (19)
Fig. 2. Dynamic viscosity for main Fig. 3. Relative error between constituents of natural gases hand-made function and CHEMKIN for dynamic viscosity
www.intechopen.com

Natural gas: physical properties and combustion features 45
Correction coefficients ijRF , is given by:
72/1,,
2/7,
72/1,,
2/7,
,101
10
jririjr
jririjrijR
T
TF
(13)
Coefficients iC is obtained by:
2/1
4/1
ii
ii
UMC (14)
With:
2/1,
6/1,,, )1(36.01
iir
iiriiriiRi T
TTFU
(15)
Wilke (1950) have introduced simplifications into equation (9) by neglecting the term of the second order. The expression of dynamic viscosity obtained makes easier the application:
1
1
i
jijj
iim
x
x
(16)
With 2/1
24/12/1
/18
//1
ji
jijiij
MM
MM
In the literature, specific correlations were established to calculate the viscosity of gas hydrocarbons. In particular, to calculate the viscosity of methane, an equation of the following general form was proposed by Hanley et al (1975) and included by Vogel et al. (2000):
),()()( 10 TTTm (17) where )(0 T represents dynamic viscosity in extreme cases of 0 . The sum
),()(1 TT is the residual dynamic viscosity which takes account of the increase in viscosity from )(0 T .
function viscosity = func_viscosity(compo) % compo is a vector in volume fraction % [CH4 C2H6 C3H8 i-C4H10 n-C4H10 C5H12 CO2 N2 O2 H2 H2S CO] P = 101325; % current gas pressure in Pa T = 273.15; % current gas temperature in K M = [16.043 30.069 44.096 58.123 58.123 72.151 44.01 28.013 32 2.016 34 28.01]; % molar mass in g mol-1 Tc = [190.58 305.42 369.82 408.14 425.18 469.65 304.19 126.1 154.58 33.18 373.53 132.92];% Critical temperature Vc = [99.2 148.3 203 263 255 304 93.9 89.8 73.4 64.3 98.6 93.2];%Critical Volume cm3/mol Dip = [0 0 0 0.1 0 0 0 0 0 0 0.9 0.1];% Dipolar Moment omega = [0.011 0.099 0.1518 0.1770 0.1993 0.2486 0.2276 0.0403 0.0218 -0.215 0.0827 0.0663]; T_et = 1.2593*T/Tc; % omegaV = 1.16145*T_et^(-0.14874)+0.52487*(exp(-0.77320*T_et))+ 2.16178*(exp(-2.43787*T_et)); mu_r = 131.3*Dip./sqrt(Vc.*Tc); Fc = ones(1,12)-0.2756*omega+0.05903*mu_r.^4; eta = 40.785*(Fc.*sqrt(T.*M))./(Vc.^(2/3).*omegaV)/10000000; for i = 1:12 for j = 1:12 A(i,j) = (1 + sqrt(eta(i)/eta(j))*(M(i)/M(j))^(1/4))^2/sqrt(8*(1+M(i)/M(j))); % end end p1 = compo.*eta; for i = 1:12 p2(i) = p1(i)/sum(compo.*A(i,:)); % end viscosity = sum(p2); %Pa s-1 Sandia National Laboratory (www.sandia.gov) has developed CHEMKIN, a reference tool for chemical. The Gas Research Group (www.me.berkeley.edu/gri_mech/overview.html), carried out by the University of California at Berkeley, Stanford University, The University of Texas at Austin, and SRI International, has set up the description of methane and its co-products. The hand-made Matlab© function is compared to this reference code. Error is defined as:
)()()(
max)max(]500300[T
TTTCHEM
CHEMhm (19)
Fig. 2. Dynamic viscosity for main Fig. 3. Relative error between constituents of natural gases hand-made function and CHEMKIN for dynamic viscosity
www.intechopen.com

Natural Gas46
The variation of the viscosity of the various components of natural gas according to the temperature is presented on Figure 2 at atmospheric pressure. Good agreement is obtained for the 5 major gases constituting a natural gas, see Figure 3.
2.2.3 Viscometer Various methods exist to measure the dynamic viscosity of a gas (Guérin, 1981):
U-tubes of Fagelson (1929) are an extension of Rankine apparatus (1910) Double-Helmholtz resonator is first conceived (Greenspan and Wimenitz, 1953).
The precision have been extended (Wilhem et al, 2000). Rotational viscometers are available products.
2.3 Thermal conductivity Fourier law characterizes heat conduction: the heat conduction flux crossing surface S in a given direction is proportional to the gradient of temperature yT . This factor of proportionality is called thermal conductivity .
yTS
(20)
2.3.1 Pure gases Thermal conductivity of a mono-atomic gas, for which only the energy of translation acts, is given by the traditional expression (Reid et al., 1987):
*2,22231063.2 M
T (21)
Where is in [ 11 KWm ] Using Equation (2), thermal conductivity is expressed from dynamic viscosity by:
MR
415 (22)
For polyatomic gases (constituents of natural gases), Euken number Eu is introduced:
vCMEu
(23)
Where vC is the heat capacity at constant volume.
For mono-atomic gases, Euken Number is close to 5/2. For polyatomic gases, Euken Number is modified by separating the contributions due to translation energy from those due to internal energy (Reid et al., 1987):
v
inin
v
trtr
v CCf
CCf
CMEu
(24)
With trC in [ 11 KmolJ ] the part of the heat capacity due to translation modes RCtr 2/3 and inC , related to internal modes, is defined as: trvin CCC , see
(Reid et al., 1987) .
1
49
1
R
CCMEu
pv
(25)
Where pC is the heat capacity at constant pressure.
A modified Euken relation was proposed for which inf is related to a coefficient of molecular diffusion too. This new relation is written as, see (Reid et al., 1987):
1
77.132.1
R
CCMEu
pv
(26)
Mason and Monchick (1962) worked out a theory based on a dynamic formalism to calculate the conductivity of polyatomic gases. They obtained for non-polar gases, by supposing the contributions of the negligible modes of vibrations, the following expression:
rot
vrot
pv ZCC
RCC
MEu 886.01
77.132.1
(27)
With rotC in [ 11 KmolJ ] the part of the heat capacity due to rotation modes and rotZ the number of collisions necessary to change a quantum of rotation energy into translation energy. Equation (27) was applied to hydrogen, nitrogen and carbon dioxide, but the main problem for their use remains the precise determination of the number of collisions of rotation rotZ which is function of the temperature. Chung and al. (1984) used similar method to Mason and Monchick (1962) and obtained the relation of thermal conductivity. Indeed, Euken number is expressed in this case according to a coefficient of correction v as follows:
175.3
RCv
CMEu
pv
(28)
www.intechopen.com

Natural gas: physical properties and combustion features 47
The variation of the viscosity of the various components of natural gas according to the temperature is presented on Figure 2 at atmospheric pressure. Good agreement is obtained for the 5 major gases constituting a natural gas, see Figure 3.
2.2.3 Viscometer Various methods exist to measure the dynamic viscosity of a gas (Guérin, 1981):
U-tubes of Fagelson (1929) are an extension of Rankine apparatus (1910) Double-Helmholtz resonator is first conceived (Greenspan and Wimenitz, 1953).
The precision have been extended (Wilhem et al, 2000). Rotational viscometers are available products.
2.3 Thermal conductivity Fourier law characterizes heat conduction: the heat conduction flux crossing surface S in a given direction is proportional to the gradient of temperature yT . This factor of proportionality is called thermal conductivity .
yTS
(20)
2.3.1 Pure gases Thermal conductivity of a mono-atomic gas, for which only the energy of translation acts, is given by the traditional expression (Reid et al., 1987):
*2,22231063.2 M
T (21)
Where is in [ 11 KWm ] Using Equation (2), thermal conductivity is expressed from dynamic viscosity by:
MR
415 (22)
For polyatomic gases (constituents of natural gases), Euken number Eu is introduced:
vCMEu
(23)
Where vC is the heat capacity at constant volume.
For mono-atomic gases, Euken Number is close to 5/2. For polyatomic gases, Euken Number is modified by separating the contributions due to translation energy from those due to internal energy (Reid et al., 1987):
v
inin
v
trtr
v CCf
CCf
CMEu
(24)
With trC in [ 11 KmolJ ] the part of the heat capacity due to translation modes RCtr 2/3 and inC , related to internal modes, is defined as: trvin CCC , see
(Reid et al., 1987) .
1
49
1
R
CCMEu
pv
(25)
Where pC is the heat capacity at constant pressure.
A modified Euken relation was proposed for which inf is related to a coefficient of molecular diffusion too. This new relation is written as, see (Reid et al., 1987):
1
77.132.1
R
CCMEu
pv
(26)
Mason and Monchick (1962) worked out a theory based on a dynamic formalism to calculate the conductivity of polyatomic gases. They obtained for non-polar gases, by supposing the contributions of the negligible modes of vibrations, the following expression:
rot
vrot
pv ZCC
RCC
MEu 886.01
77.132.1
(27)
With rotC in [ 11 KmolJ ] the part of the heat capacity due to rotation modes and rotZ the number of collisions necessary to change a quantum of rotation energy into translation energy. Equation (27) was applied to hydrogen, nitrogen and carbon dioxide, but the main problem for their use remains the precise determination of the number of collisions of rotation rotZ which is function of the temperature. Chung and al. (1984) used similar method to Mason and Monchick (1962) and obtained the relation of thermal conductivity. Indeed, Euken number is expressed in this case according to a coefficient of correction v as follows:
175.3
RCv
CMEu
pv
(28)
www.intechopen.com

Natural Gas48
Coefficient is given by the following formula:
061.16366.026665.0061.128288.0215.01
v (29)
With 23 RCv ; 23168.17109.07862.0 and 250.100.2 rT . Term is given by an empirical correlation for the contribution of translation energy of the molecules to thermal conductivity for polyatomic gases and applies for the non-polar molecules. As the two main components of the natural gas (methane and ethane) are non-polar and that the other components have weak dipole moment, this correlation represents well the behaviour of natural gases. In the case of the polar molecules, a default value of 0,758 should be used. Term corresponds to the heat-storage capacity due to the internal degrees of freedom. Thus, term can be included/understood as being a shape factor pointing out the deviations of the polyatomic molecules with respect to the model of the rigid sphere.
2.3.2 Gaseous blends Thermal conductivity of blends is estimated in the same manner as for viscosity. The thermal conductivity of a gas mixture m can be thus calculated starting from a standard formula in the same way than Equation (16), see (Reid et al., 1987):
1
1
i
jijj
iim
Ax
x
(30)
Mason and Saxena (1958) proposed the following expression for coefficient ijA : 2/1
24/12/1,,
/18
//1
ji
jijtritrij
MM
MMA
(31)
Where tr represents thermal conductivity of monoatomic gas and is a constant close to 1.0; Mason and Saxena (1958) proposed 065.1 . Heat conductivities ratio due to the energy of translation of the molecules can be obtained in a purely empirical way: jrjr
irir
TTi
TTj
jtritree
ee,,
,,
2412.00464.0
2412.00464.0
,, / (32)
With
6/1
4,
3,0.210
ic
iici P
MT; icP , is the critical pressure of the ith component.
function thermal_conductivity = func_conductivity(compo) P = 101325; % current gas pressure in Pa T = 273.15; % current gas temperature in K R = 8.314; %ideal gas constant J/K/mol M = [16.043 30.069 44.096 58.123 58.123 72.151 44.01 28.013 32 2.016 34 28.01]; % molar mass in g mol-1 Tc = [190.58 305.42 369.82 408.14 425.18 469.65 304.19 126.1 154.58 33.18 373.53 132.92];% Critical temperature Vc = [99.2 148.3 203 263 255 304 93.9 89.8 73.4 64.3 98.6 93.2];%Critical Volume cm3/mol Pc = [4.604 4.88 4.249 3.648 3.797 3.369 7.382 3.394 5.043 1.313 8.963 3.499];% Critical pressure Dip = [0 0 0 0.1 0 0 0 0 0 0 0.9 0.1];% Dipolar Moment omega = [0.011 0.099 0.1518 0.1770 0.1993 0.2486 0.2276 0.0403 0.0218 -0.215 0.0827 0.0663]; methane = -672.87+439.74*(T/100)^0.25-24.875*(T/100)^0.75+323.88*(T/100)^(-0.5); ethane = 6.895+17.26*(T/100)-0.6402*(T/100)^2+0.00728*(T/100)^3; propane = -4.092+30.46*(T/100)-1.571*(T/100)^2+0.03171*(T/100)^3; ibutane = 3.954+37.12*(T/100)-1.833*(T/100)^2+0.03498*(T/100)^3; nbutane = 3.954+37.12*(T/100)-1.833*(T/100)^2+0.03498*(T/100)^3; pentane = R*(1.878+4.1216*(T/100)+0.12532*(T/100)^2-0.037*(T/100)^3+0.001525*(T/100)^4); diocarbone = -3.7357+30.529*(T/100)^0.5-4.1034*(T/100)+0.024198*(T/100)^2; azote = 39.060-512.79*(T/100)^(-1.5)+1072.7*(T/100)^(-2)-820.4*(T/100)^(-3); oxygene = 37.432+0.020102*(T/100)^1.5-178.57*(T/100)^(-1.5)+236.88*(T/100)^(-2); hydrogene = 56.505-702.74*(T/100)^(-0.75)+1165*(T/100)^(-1)-560.7*(T/100)^(-1.5); hydrosulf = R*(3.071029+0.5578*(T/100)-0.1031*(T/100)^2+0.01202*(T/100)^3-0.0004838*(T/100)^4); monocarbone = 69.145-0.70463*(T/100)^0.75-200.77*(T/100)^(-0.5)+176.76*(T/100)^(-0.75); Cpmol = [methane ethane propane ibutane nbutane pentane diocarbone azote oxygene hydrogene hydrosulf monocarbone]; cp=Cpmol.*1000./M; alpha = (cp.*M*1e-3-R*ones(1,12))./(R*ones(1,12))-1.5*ones(1,12); beta = 0.7862*ones(1,12)-0.7109*omega+1.3168*omega.^2; zed = 2*ones(1,12)+10.5*(T./Tc).^2; psi = ones(1,12)+alpha.*(0.215*ones(1,12)+0.28288*alpha-1.061*beta+0.26665*zed)./ ... (0.6366*ones(1,12)+beta.*zed+1.061*alpha.*beta); %**************Dynamic Viscosity********************************** T_et = 1.2593*T./Tc; omegaV = 1.16145.*T_et.^(-0.14874)+0.52487*(exp(-0.77320*T_et))+ ... 2.16178*(exp(-2.43787*T_et)); mu_r = 131.3*Dip./sqrt(Vc.*Tc); Fc = ones(1,12)-0.2756*omega+0.05903*mu_r.^4; eta = 40.785*(Fc.*sqrt(T.*M))./(Vc.^(2/3).*omegaV)/10000000; %***************************************************************** lambda = 3.75*R*eta.*psi./M*1000; %for mixture temp = 210*(Tc.*M.^3./(Pc*10).^4).^(1/6); lambda_tr = temp.*(exp(0.0464.*(T./Tc))-exp(-0.2412.*(T./Tc))); for i = 1:12 for j = 1:12 A(i,j) = (1 + sqrt(lambda_tr(i)/lambda_tr(j))*(M(i)/M(j))^(1/4))^2/ ... sqrt(8*(1+M(i)/M(j))); end end p1 = lambda.*compo; for i = 1:12 p2(i) = p1(i)/sum(compo.*A(i,:)); end thermal_conductivity = sum(p2);
www.intechopen.com

Natural gas: physical properties and combustion features 49
Coefficient is given by the following formula:
061.16366.026665.0061.128288.0215.01
v (29)
With 23 RCv ; 23168.17109.07862.0 and 250.100.2 rT . Term is given by an empirical correlation for the contribution of translation energy of the molecules to thermal conductivity for polyatomic gases and applies for the non-polar molecules. As the two main components of the natural gas (methane and ethane) are non-polar and that the other components have weak dipole moment, this correlation represents well the behaviour of natural gases. In the case of the polar molecules, a default value of 0,758 should be used. Term corresponds to the heat-storage capacity due to the internal degrees of freedom. Thus, term can be included/understood as being a shape factor pointing out the deviations of the polyatomic molecules with respect to the model of the rigid sphere.
2.3.2 Gaseous blends Thermal conductivity of blends is estimated in the same manner as for viscosity. The thermal conductivity of a gas mixture m can be thus calculated starting from a standard formula in the same way than Equation (16), see (Reid et al., 1987):
1
1
i
jijj
iim
Ax
x
(30)
Mason and Saxena (1958) proposed the following expression for coefficient ijA : 2/1
24/12/1,,
/18
//1
ji
jijtritrij
MM
MMA
(31)
Where tr represents thermal conductivity of monoatomic gas and is a constant close to 1.0; Mason and Saxena (1958) proposed 065.1 . Heat conductivities ratio due to the energy of translation of the molecules can be obtained in a purely empirical way: jrjr
irir
TTi
TTj
jtritree
ee,,
,,
2412.00464.0
2412.00464.0
,, / (32)
With
6/1
4,
3,0.210
ic
iici P
MT; icP , is the critical pressure of the ith component.
function thermal_conductivity = func_conductivity(compo) P = 101325; % current gas pressure in Pa T = 273.15; % current gas temperature in K R = 8.314; %ideal gas constant J/K/mol M = [16.043 30.069 44.096 58.123 58.123 72.151 44.01 28.013 32 2.016 34 28.01]; % molar mass in g mol-1 Tc = [190.58 305.42 369.82 408.14 425.18 469.65 304.19 126.1 154.58 33.18 373.53 132.92];% Critical temperature Vc = [99.2 148.3 203 263 255 304 93.9 89.8 73.4 64.3 98.6 93.2];%Critical Volume cm3/mol Pc = [4.604 4.88 4.249 3.648 3.797 3.369 7.382 3.394 5.043 1.313 8.963 3.499];% Critical pressure Dip = [0 0 0 0.1 0 0 0 0 0 0 0.9 0.1];% Dipolar Moment omega = [0.011 0.099 0.1518 0.1770 0.1993 0.2486 0.2276 0.0403 0.0218 -0.215 0.0827 0.0663]; methane = -672.87+439.74*(T/100)^0.25-24.875*(T/100)^0.75+323.88*(T/100)^(-0.5); ethane = 6.895+17.26*(T/100)-0.6402*(T/100)^2+0.00728*(T/100)^3; propane = -4.092+30.46*(T/100)-1.571*(T/100)^2+0.03171*(T/100)^3; ibutane = 3.954+37.12*(T/100)-1.833*(T/100)^2+0.03498*(T/100)^3; nbutane = 3.954+37.12*(T/100)-1.833*(T/100)^2+0.03498*(T/100)^3; pentane = R*(1.878+4.1216*(T/100)+0.12532*(T/100)^2-0.037*(T/100)^3+0.001525*(T/100)^4); diocarbone = -3.7357+30.529*(T/100)^0.5-4.1034*(T/100)+0.024198*(T/100)^2; azote = 39.060-512.79*(T/100)^(-1.5)+1072.7*(T/100)^(-2)-820.4*(T/100)^(-3); oxygene = 37.432+0.020102*(T/100)^1.5-178.57*(T/100)^(-1.5)+236.88*(T/100)^(-2); hydrogene = 56.505-702.74*(T/100)^(-0.75)+1165*(T/100)^(-1)-560.7*(T/100)^(-1.5); hydrosulf = R*(3.071029+0.5578*(T/100)-0.1031*(T/100)^2+0.01202*(T/100)^3-0.0004838*(T/100)^4); monocarbone = 69.145-0.70463*(T/100)^0.75-200.77*(T/100)^(-0.5)+176.76*(T/100)^(-0.75); Cpmol = [methane ethane propane ibutane nbutane pentane diocarbone azote oxygene hydrogene hydrosulf monocarbone]; cp=Cpmol.*1000./M; alpha = (cp.*M*1e-3-R*ones(1,12))./(R*ones(1,12))-1.5*ones(1,12); beta = 0.7862*ones(1,12)-0.7109*omega+1.3168*omega.^2; zed = 2*ones(1,12)+10.5*(T./Tc).^2; psi = ones(1,12)+alpha.*(0.215*ones(1,12)+0.28288*alpha-1.061*beta+0.26665*zed)./ ... (0.6366*ones(1,12)+beta.*zed+1.061*alpha.*beta); %**************Dynamic Viscosity********************************** T_et = 1.2593*T./Tc; omegaV = 1.16145.*T_et.^(-0.14874)+0.52487*(exp(-0.77320*T_et))+ ... 2.16178*(exp(-2.43787*T_et)); mu_r = 131.3*Dip./sqrt(Vc.*Tc); Fc = ones(1,12)-0.2756*omega+0.05903*mu_r.^4; eta = 40.785*(Fc.*sqrt(T.*M))./(Vc.^(2/3).*omegaV)/10000000; %***************************************************************** lambda = 3.75*R*eta.*psi./M*1000; %for mixture temp = 210*(Tc.*M.^3./(Pc*10).^4).^(1/6); lambda_tr = temp.*(exp(0.0464.*(T./Tc))-exp(-0.2412.*(T./Tc))); for i = 1:12 for j = 1:12 A(i,j) = (1 + sqrt(lambda_tr(i)/lambda_tr(j))*(M(i)/M(j))^(1/4))^2/ ... sqrt(8*(1+M(i)/M(j))); end end p1 = lambda.*compo; for i = 1:12 p2(i) = p1(i)/sum(compo.*A(i,:)); end thermal_conductivity = sum(p2);
www.intechopen.com

Natural Gas50
Fig. 4. Thermal conductivity for main Fig. 5. Relative error between constituents of natural gases hand-made function and CHEMKIN
for thermal conductivity The variation of the thermal conductivity of the various components of natural gas according to the temperature is presented on Figure 4 at atmospheric pressure. Good agreement is obtained for the 5 major gases constituting a natural gas, see Figure 5.
)()()(max)max(]500300[
TTTT
CHEM
CHEMhm (33)
2.3.3 Thermal conductivity measurement Different techniques can be used to measure the thermal conductivity: Katharometer: Thermal conductivity determination of a gas is commonly based on the
method of hot wires (Guérin, 1981). A wire is tended in the axis of a metal cylindrical room whose walls are maintained at constant temperature and traversed by a gas, constituting a cell. If one applies a constant electromotive force at the ends of this wire, its temperature rises until the energy spent by Joule effect is, at each time, compensated by the energy dissipated by radiation, convection and thermal conduction. By choosing conditions such as the losses other than the last are negligible (temperature of the wire lower than 400°C, diameter maximum of the tube of 1 cm, rather slow gas flow: 6 to 12 l/h), the temperature of the wire depends primarily on the nature of the gas which surrounds it. If the wire has a resistivity whose temperature coefficient is raised, resistance is function of the thermal conductivity of this gas.
Guarded Hot Plate Method: Guarded hot plate is a widely used and versatile method for measuring the thermal conductivity. A flat, electrically heated metering section surrounded on all lateral sides by a guard heater section controlled through differential thermocouples, supplies the planar heat source introduced over the hot face of the specimens (gas). The most common measurement configuration is the conventional, symmetrically arranged guarded hot plate where the heater assembly is sandwiched between two specimens, see Figure 6. It is an absolute method of measurement and its applicability requires: (a) the establishment of steady-state conditions, and (b) the measurement of the unidirectional heat flux in the metered
region, the temperatures of the hot and cold surfaces, the thickness of the specimens and other parameters which may affect the unidirectional heat flux through the metered area of the specimen.
Top cold plate
Top auxiliary heaterSpecimen
SpecimenGuard GuardMetered area
Bottom auxiliary heater
Bottom cold plateSecondary guard
Top cold plate
Top auxiliary heaterSpecimen
SpecimenGuard GuardMetered area
Bottom auxiliary heater
Bottom cold plateSecondary guard
Fig. 6. Guarded hot plate method configuration.
2.4 Speed of sound Speed of sound is connected to thermodynamic scale of the fluid by the relation:
S
Pc
(34)
where P and represent the pressure and the density respectively, and S the entropy. The previous relation shows the direct link between the speed of sound and state equation of gas.
2.4.1 Speed of sound for ideal gas For ideal gas, speed of sound is:
MTRc (35) For a mixture of ideal gases, speed of sound is:
11,
1,
2
iii
iivi
iipi
m
mm
Mx
TR
Cx
Cx
MTR
c (36)
Ideal gas law is a good approximation for low pressure. However, in order to take into account the real behavior of gases, several state laws were proposed. Van Der Waals equation thus introduces two corrective terms:
2)( Va
bVTRP (37)
www.intechopen.com

Natural gas: physical properties and combustion features 51
Fig. 4. Thermal conductivity for main Fig. 5. Relative error between constituents of natural gases hand-made function and CHEMKIN
for thermal conductivity The variation of the thermal conductivity of the various components of natural gas according to the temperature is presented on Figure 4 at atmospheric pressure. Good agreement is obtained for the 5 major gases constituting a natural gas, see Figure 5.
)()()(max)max(]500300[
TTTT
CHEM
CHEMhm (33)
2.3.3 Thermal conductivity measurement Different techniques can be used to measure the thermal conductivity: Katharometer: Thermal conductivity determination of a gas is commonly based on the
method of hot wires (Guérin, 1981). A wire is tended in the axis of a metal cylindrical room whose walls are maintained at constant temperature and traversed by a gas, constituting a cell. If one applies a constant electromotive force at the ends of this wire, its temperature rises until the energy spent by Joule effect is, at each time, compensated by the energy dissipated by radiation, convection and thermal conduction. By choosing conditions such as the losses other than the last are negligible (temperature of the wire lower than 400°C, diameter maximum of the tube of 1 cm, rather slow gas flow: 6 to 12 l/h), the temperature of the wire depends primarily on the nature of the gas which surrounds it. If the wire has a resistivity whose temperature coefficient is raised, resistance is function of the thermal conductivity of this gas.
Guarded Hot Plate Method: Guarded hot plate is a widely used and versatile method for measuring the thermal conductivity. A flat, electrically heated metering section surrounded on all lateral sides by a guard heater section controlled through differential thermocouples, supplies the planar heat source introduced over the hot face of the specimens (gas). The most common measurement configuration is the conventional, symmetrically arranged guarded hot plate where the heater assembly is sandwiched between two specimens, see Figure 6. It is an absolute method of measurement and its applicability requires: (a) the establishment of steady-state conditions, and (b) the measurement of the unidirectional heat flux in the metered
region, the temperatures of the hot and cold surfaces, the thickness of the specimens and other parameters which may affect the unidirectional heat flux through the metered area of the specimen.
Top cold plate
Top auxiliary heaterSpecimen
SpecimenGuard GuardMetered area
Bottom auxiliary heater
Bottom cold plateSecondary guard
Top cold plate
Top auxiliary heaterSpecimen
SpecimenGuard GuardMetered area
Bottom auxiliary heater
Bottom cold plateSecondary guard
Fig. 6. Guarded hot plate method configuration.
2.4 Speed of sound Speed of sound is connected to thermodynamic scale of the fluid by the relation:
S
Pc
(34)
where P and represent the pressure and the density respectively, and S the entropy. The previous relation shows the direct link between the speed of sound and state equation of gas.
2.4.1 Speed of sound for ideal gas For ideal gas, speed of sound is:
MTRc (35) For a mixture of ideal gases, speed of sound is:
11,
1,
2
iii
iivi
iipi
m
mm
Mx
TR
Cx
Cx
MTR
c (36)
Ideal gas law is a good approximation for low pressure. However, in order to take into account the real behavior of gases, several state laws were proposed. Van Der Waals equation thus introduces two corrective terms:
2)( Va
bVTRP (37)
www.intechopen.com

Natural Gas52
Then, in this case, speed of sound is:
Va
VbTRc r
2
12
2 (38)
Thermodynamic properties models based on state equation provide value of compressibility factor. It is useful, in the field of gas industry, to have specific methods of calculation for natural gas of commercial type. The equation derived from virial equation, established by Groups European of Gas Research - GEGR (Jaescheke et al., 2003), gives calculation for the compressibility factor of commercial gas with an average error of about 0.06% for a pressure up to 12 MPa. However, one of the methods most used in this field is based on the model AGA8-DC92 developed by American Gas Association (Starling & Savidge, 1992). This model makes it possible to estimate the density with an average absolute deviation (AAD) of 0.04% and the speed of sound with AAD of 0.08%. In addition, Estela-Uribe et al. (2003, 2005) used another formulation for natural gas in the range 330][270 KT and
MPaP 12 . This model presents compressibility factor according to the density by:
21 mm CBZ (39) Coefficients mB and mC respectively represents the second and the third coefficient of the virial development of the gas mixture. They are given according to temperature and composition of natural gas by the relations:
i jijjim BxxB (40)
i j k
ijkkjim CxxxC (41)
Where ijB and ijkC are given by:
22,1,
0, T
bT
bbB ijij
ijij (42)
22,1,
0, T
cT
ccC ijkijk
ijkij (43)
Reader is referred to Estela-Uribe et al. (2003, 2005) for coefficients bij and cijk.
Speed of sound is written:
2
,
2
TZTZ
CRZZ
MTRc
mvTmm (44)
Where mvC , is heat capacity at constant volume of the mixture calculated by:
resmv
IGLmvmv CCC ,,, (45)
IGL
mvC , is heat capacity calculated by ideal gas law, see (Jaeschke & Schley, 1995), and resmvC , is
residual correction, calculated by:
22
22
2
22
, 22
dTCdT
dTdCT
dTBdT
dTdBTC mmmmres
mv (46)
function speedofsound = func_speedofsound(compo) P = 101325; % current gas pressure in Pa T = 273.15; % current gas temperature in K R = 8.314; %ideal gas constant J/K/mol M = [16.043 30.069 44.096 58.123 58.123 72.151 44.01 28.013 32 2.016 34 28.01]; methane = -672.87+439.74*(T/100)^0.25-24.875*(T/100)^0.75+323.88*(T/100)^(-0.5); ethane = 6.895+17.26*(T/100)-0.6402*(T/100)^2+0.00728*(T/100)^3; propane = -4.092+30.46*(T/100)-1.571*(T/100)^2+0.03171*(T/100)^3; ibutane = 3.954+37.12*(T/100)-1.833*(T/100)^2+0.03498*(T/100)^3; nbutane = 3.954+37.12*(T/100)-1.833*(T/100)^2+0.03498*(T/100)^3; pentane = R*(1.878+4.1216*(T/100)+0.12532*(T/100)^2-0.037*(T/100)^3+0.001525*(T/100)^4); diocarbone = -3.7357+30.529*(T/100)^0.5-4.1034*(T/100)+0.024198*(T/100)^2; azote = 39.060-512.79*(T/100)^(-1.5)+1072.7*(T/100)^(-2)-820.4*(T/100)^(-3); oxygene = 37.432+0.020102*(T/100)^1.5-178.57*(T/100)^(-1.5)+236.88*(T/100)^(-2); hydrogene = 56.505-702.74*(T/100)^(-0.75)+1165*(T/100)^(-1)-560.7*(T/100)^(-1.5); hydrosulf = R*(3.071029+0.5578*(T/100)-0.1031*(T/100)^2+0.01202*(T/100)^3-0.0004838*(T/100)^4); monocarbone = 69.145-0.70463*(T/100)^0.75-200.77*(T/100)^(-0.5)+176.76*(T/100)^(-0.75); Cpmol = [methane ethane propane ibutane nbutane pentane diocarbone azote oxygene hydrogene hydrosulf monocarbone]; MassMol =1/100*sum(M.*compo); HeatCapacity = 1/100*sum(Cpmol.*compo)*1000./MassMol; speedofsound = sqrt(HeatCapacity /( HeatCapacity -1000*R/MassMol)*R*T/MassMol*1000 The variation of the speed of sound of the various components of natural gas according to the temperature is presented on Figure 7 at atmospheric pressure. Good agreement is obtained for the 5 major gases constituting a natural gas, see figure 8.
)()()(max)max(]500300[
TcTcTcT
CHEM
CHEMhmc
(47)
www.intechopen.com

Natural gas: physical properties and combustion features 53
Then, in this case, speed of sound is:
Va
VbTRc r
2
12
2 (38)
Thermodynamic properties models based on state equation provide value of compressibility factor. It is useful, in the field of gas industry, to have specific methods of calculation for natural gas of commercial type. The equation derived from virial equation, established by Groups European of Gas Research - GEGR (Jaescheke et al., 2003), gives calculation for the compressibility factor of commercial gas with an average error of about 0.06% for a pressure up to 12 MPa. However, one of the methods most used in this field is based on the model AGA8-DC92 developed by American Gas Association (Starling & Savidge, 1992). This model makes it possible to estimate the density with an average absolute deviation (AAD) of 0.04% and the speed of sound with AAD of 0.08%. In addition, Estela-Uribe et al. (2003, 2005) used another formulation for natural gas in the range 330][270 KT and
MPaP 12 . This model presents compressibility factor according to the density by:
21 mm CBZ (39) Coefficients mB and mC respectively represents the second and the third coefficient of the virial development of the gas mixture. They are given according to temperature and composition of natural gas by the relations:
i jijjim BxxB (40)
i j k
ijkkjim CxxxC (41)
Where ijB and ijkC are given by:
22,1,
0, T
bT
bbB ijij
ijij (42)
22,1,
0, T
cT
ccC ijkijk
ijkij (43)
Reader is referred to Estela-Uribe et al. (2003, 2005) for coefficients bij and cijk.
Speed of sound is written:
2
,
2
TZTZ
CRZZ
MTRc
mvTmm (44)
Where mvC , is heat capacity at constant volume of the mixture calculated by:
resmv
IGLmvmv CCC ,,, (45)
IGL
mvC , is heat capacity calculated by ideal gas law, see (Jaeschke & Schley, 1995), and resmvC , is
residual correction, calculated by:
22
22
2
22
, 22
dTCdT
dTdCT
dTBdT
dTdBTC mmmmres
mv (46)
function speedofsound = func_speedofsound(compo) P = 101325; % current gas pressure in Pa T = 273.15; % current gas temperature in K R = 8.314; %ideal gas constant J/K/mol M = [16.043 30.069 44.096 58.123 58.123 72.151 44.01 28.013 32 2.016 34 28.01]; methane = -672.87+439.74*(T/100)^0.25-24.875*(T/100)^0.75+323.88*(T/100)^(-0.5); ethane = 6.895+17.26*(T/100)-0.6402*(T/100)^2+0.00728*(T/100)^3; propane = -4.092+30.46*(T/100)-1.571*(T/100)^2+0.03171*(T/100)^3; ibutane = 3.954+37.12*(T/100)-1.833*(T/100)^2+0.03498*(T/100)^3; nbutane = 3.954+37.12*(T/100)-1.833*(T/100)^2+0.03498*(T/100)^3; pentane = R*(1.878+4.1216*(T/100)+0.12532*(T/100)^2-0.037*(T/100)^3+0.001525*(T/100)^4); diocarbone = -3.7357+30.529*(T/100)^0.5-4.1034*(T/100)+0.024198*(T/100)^2; azote = 39.060-512.79*(T/100)^(-1.5)+1072.7*(T/100)^(-2)-820.4*(T/100)^(-3); oxygene = 37.432+0.020102*(T/100)^1.5-178.57*(T/100)^(-1.5)+236.88*(T/100)^(-2); hydrogene = 56.505-702.74*(T/100)^(-0.75)+1165*(T/100)^(-1)-560.7*(T/100)^(-1.5); hydrosulf = R*(3.071029+0.5578*(T/100)-0.1031*(T/100)^2+0.01202*(T/100)^3-0.0004838*(T/100)^4); monocarbone = 69.145-0.70463*(T/100)^0.75-200.77*(T/100)^(-0.5)+176.76*(T/100)^(-0.75); Cpmol = [methane ethane propane ibutane nbutane pentane diocarbone azote oxygene hydrogene hydrosulf monocarbone]; MassMol =1/100*sum(M.*compo); HeatCapacity = 1/100*sum(Cpmol.*compo)*1000./MassMol; speedofsound = sqrt(HeatCapacity /( HeatCapacity -1000*R/MassMol)*R*T/MassMol*1000 The variation of the speed of sound of the various components of natural gas according to the temperature is presented on Figure 7 at atmospheric pressure. Good agreement is obtained for the 5 major gases constituting a natural gas, see figure 8.
)()()(max)max(]500300[
TcTcTcT
CHEM
CHEMhmc
(47)
www.intechopen.com

Natural Gas54
Fig. 7. Speed of sound for main constituents Fig. 8. Relative error between of natural gases hand-made function and CHEMKIN for speed of sound
2.4.2 Sound velocity sensor Acoustic wave propagation is characterized by the speed of sound c in the propagation medium. Several techniques allow the measurement of this characteristic in gases. Three methods of measurement can be distinguished such as: - the acoustic waves dephasing, - the acoustic resonator, - the time of transit. The last method is largely used in industrial applications such as level measurement, flow metering, etc… (Hauptmann et al., 2002). It involves measurement of the transit time of an ultrasonic pulse travelling over a known propagation distance in the gas. This technique typically employs one or more piezoelectric transducers to generate and detect sound waves in the frequency range of about 20 kHz to 1 MHz and higher. A particular technique known as a “pulse echo” technique uses a single transducer as both the transmitter and the receiver see Figure 9. The generated sound wave is reflected back to the source transducer from a target located at a known distance from the transducer, and is received by the same transducer. If the distance between the transducer and the reflecting target is D, and the measured two-way travel time is t, then the speed of sound is represented by:
tDc 2 (48)
This method is advantageous because it uses only one transducer. However, in applications requiring high precision speed of sound measurements, the method has the disadvantage of introducing time delay errors associated with imperfectly defined and variable distance, D, and an imperfect ability to determine the exact time delay with respect to the time of the transmitted pulse and the time instant when the reflected sound wave is received at the transducer.
Temperature
Gas output
Gas input
Ultr
ason
ictr
ansd
ucer
D
Obstacle
t
Temperature
Gas output
Gas input
Ultr
ason
ictr
ansd
ucer
D
Obstacle
t
Temperature
Gas output
Gas input
Ultr
ason
ictr
ansd
ucer
D1
D2
DD
Obstaclet2
t1
Temperature
Gas output
Gas input
Ultr
ason
ictr
ansd
ucer
D1
D2
DD
Obstaclet2
t1
Fig. 9. “Pulse echo” technique Fig. 10. Modified “pulse echo” technique To reduce the time delay error, the pulse echo method may be modified to measure a time difference between two received signals (Kelner et al., 2004). A transmitted wave is reflected from two different targets rather than a single target, see Figure 10. The distance, DD, between the two targets is known. Using this method, the speed of sound is represented by:
tDDcgas 2
(49)
where t is the time difference between the two received signals.
2.5 Refractive index Guérin (1981) expressed refractive index ng of a gas, for radiation of wavelength , according to the density:
IRqndef
gg 10
(50)
Where q is a constant. Noting RI0 the value of RI corresponding to the normal conditions (273,15 K, 1 atm) and assuming that the gases follow ideal gas law, the value of RI (called co-index of refraction, but named improperly refractive index too) relates to temperature T (in Kelvin) and pressure P (in atmosphere) is given by:
0
00 P
PTTRIRI (51)
Co-index of refraction has an additive property:
1i
ii RIxRI (52)
www.intechopen.com

Natural gas: physical properties and combustion features 55
Fig. 7. Speed of sound for main constituents Fig. 8. Relative error between of natural gases hand-made function and CHEMKIN for speed of sound
2.4.2 Sound velocity sensor Acoustic wave propagation is characterized by the speed of sound c in the propagation medium. Several techniques allow the measurement of this characteristic in gases. Three methods of measurement can be distinguished such as: - the acoustic waves dephasing, - the acoustic resonator, - the time of transit. The last method is largely used in industrial applications such as level measurement, flow metering, etc… (Hauptmann et al., 2002). It involves measurement of the transit time of an ultrasonic pulse travelling over a known propagation distance in the gas. This technique typically employs one or more piezoelectric transducers to generate and detect sound waves in the frequency range of about 20 kHz to 1 MHz and higher. A particular technique known as a “pulse echo” technique uses a single transducer as both the transmitter and the receiver see Figure 9. The generated sound wave is reflected back to the source transducer from a target located at a known distance from the transducer, and is received by the same transducer. If the distance between the transducer and the reflecting target is D, and the measured two-way travel time is t, then the speed of sound is represented by:
tDc 2 (48)
This method is advantageous because it uses only one transducer. However, in applications requiring high precision speed of sound measurements, the method has the disadvantage of introducing time delay errors associated with imperfectly defined and variable distance, D, and an imperfect ability to determine the exact time delay with respect to the time of the transmitted pulse and the time instant when the reflected sound wave is received at the transducer.
Temperature
Gas output
Gas input
Ultr
ason
ictr
ansd
ucer
D
Obstacle
t
Temperature
Gas output
Gas input
Ultr
ason
ictr
ansd
ucer
D
Obstacle
t
Temperature
Gas output
Gas input
Ultr
ason
ictr
ansd
ucer
D1
D2
DD
Obstaclet2
t1
Temperature
Gas output
Gas input
Ultr
ason
ictr
ansd
ucer
D1
D2
DD
Obstaclet2
t1
Fig. 9. “Pulse echo” technique Fig. 10. Modified “pulse echo” technique To reduce the time delay error, the pulse echo method may be modified to measure a time difference between two received signals (Kelner et al., 2004). A transmitted wave is reflected from two different targets rather than a single target, see Figure 10. The distance, DD, between the two targets is known. Using this method, the speed of sound is represented by:
tDDcgas 2
(49)
where t is the time difference between the two received signals.
2.5 Refractive index Guérin (1981) expressed refractive index ng of a gas, for radiation of wavelength , according to the density:
IRqndef
gg 10
(50)
Where q is a constant. Noting RI0 the value of RI corresponding to the normal conditions (273,15 K, 1 atm) and assuming that the gases follow ideal gas law, the value of RI (called co-index of refraction, but named improperly refractive index too) relates to temperature T (in Kelvin) and pressure P (in atmosphere) is given by:
0
00 P
PTTRIRI (51)
Co-index of refraction has an additive property:
1i
ii RIxRI (52)
www.intechopen.com

Natural Gas56
Equations (51-52) are enough to calculate with precision the co-index of refraction of natural gases.
2.6 Density and specific density In the case of a gas mixture, the expression of the specific density dm is written:
),(),(
PTZPTZdd
m
airIGLmm (53)
with
22
120005.011 HH
iiim xxZxZ
(54)
With Zi compressibility factor of component i, xH molar fraction of hydrogen. Specific density IGL
md is independent of any state of reference and is calculated starting from the equation:
1i air
ii
IGLm M
Mxd (55)
In the same way, the density is obtained by:
),(),(
,PTZPTPT
m
IGLm (56)
1iii
IGLm Mx
TRP
(57)
2.7 Synthesis Quality of natural gas, mainly composed of methane, varies according to the various sources of supply (layers). Consequently, physical properties and energy content are subject to variations. As a result, one of the important information required for natural gas exploitation relates to its physical properties. Besides the properties of transport (viscosity, thermal conductivity), various models of determination speed of sound, index of refraction and density were presented.
3. Combustion features
Combustion features of a gas such as the low heating value, Wobbe index and air-fuel equivalence ratio are of a great industrial interest. These properties interest both engine manufacturers and business activities of CHP installations and boilers. The commercial transactions on natural gas are generally based on the energy content of gas, obtained by multiplying the volumes measured by the higher heating value.
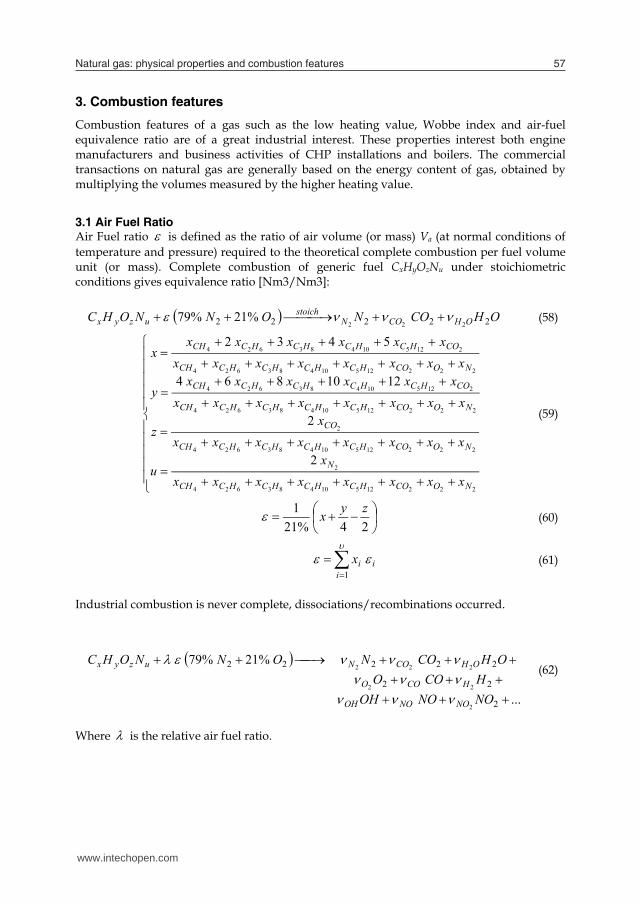
3.1 Air Fuel Ratio Air Fuel ratio is defined as the ratio of air volume (or mass) Va (at normal conditions of temperature and pressure) required to the theoretical complete combustion per fuel volume unit (or mass). Complete combustion of generic fuel CxHyOzNu under stoichiometric conditions gives equivalence ratio [Nm3/Nm3]: OHCONONNOHC OHCON
stoichuzyx 22222 222
%21%79 (58)
22212510483624
2
22212510483624
2
22212510483624
212510483624
22212510483624
212510483624
2
2
1210864
5432
NOCOHCHCHCHCCH
N
NOCOHCHCHCHCCH
CO
NOCOHCHCHCHCCH
COHCHCHCHCCH
NOCOHCHCHCHCCH
COHCHCHCHCCH
xxxxxxxxx
u
xxxxxxxxx
z
xxxxxxxxxxxxxx
y
xxxxxxxxxxxxxx
x
(59)
24%21
1 zyx (60)
1i
iix (61)
Industrial combustion is never complete, dissociations/recombinations occurred.
...
%21%79
2
22
22222
2
22
222
NONOOHHCOO
OHCONONNOHC
NONOOH
HCOO
OHCONuzyx
(62)
Where is the relative air fuel ratio.
www.intechopen.com
Natural gas: physical properties and combustion features 57
Equations (51-52) are enough to calculate with precision the co-index of refraction of natural gases.
2.6 Density and specific density In the case of a gas mixture, the expression of the specific density dm is written:
),(),(
PTZPTZdd
m
airIGLmm (53)
with
22
120005.011 HH
iiim xxZxZ
(54)
With Zi compressibility factor of component i, xH molar fraction of hydrogen. Specific density IGL
md is independent of any state of reference and is calculated starting from the equation:
1i air
ii
IGLm M
Mxd (55)
In the same way, the density is obtained by:
),(),(
,PTZPTPT
m
IGLm (56)
1iii
IGLm Mx
TRP
(57)
2.7 Synthesis Quality of natural gas, mainly composed of methane, varies according to the various sources of supply (layers). Consequently, physical properties and energy content are subject to variations. As a result, one of the important information required for natural gas exploitation relates to its physical properties. Besides the properties of transport (viscosity, thermal conductivity), various models of determination speed of sound, index of refraction and density were presented.
3. Combustion features
Combustion features of a gas such as the low heating value, Wobbe index and air-fuel equivalence ratio are of a great industrial interest. These properties interest both engine manufacturers and business activities of CHP installations and boilers. The commercial transactions on natural gas are generally based on the energy content of gas, obtained by multiplying the volumes measured by the higher heating value.
3.1 Air Fuel Ratio Air Fuel ratio is defined as the ratio of air volume (or mass) Va (at normal conditions of temperature and pressure) required to the theoretical complete combustion per fuel volume unit (or mass). Complete combustion of generic fuel CxHyOzNu under stoichiometric conditions gives equivalence ratio [Nm3/Nm3]: OHCONONNOHC OHCON
stoichuzyx 22222 222
%21%79 (58)
22212510483624
2
22212510483624
2
22212510483624
212510483624
22212510483624
212510483624
2
2
1210864
5432
NOCOHCHCHCHCCH
N
NOCOHCHCHCHCCH
CO
NOCOHCHCHCHCCH
COHCHCHCHCCH
NOCOHCHCHCHCCH
COHCHCHCHCCH
xxxxxxxxx
u
xxxxxxxxx
z
xxxxxxxxxxxxxx
y
xxxxxxxxxxxxxx
x
(59)
24%21
1 zyx (60)
1i
iix (61)
Industrial combustion is never complete, dissociations/recombinations occurred.
...
%21%79
2
22
22222
2
22
222
NONOOHHCOO
OHCONONNOHC
NONOOH
HCOO
OHCONuzyx
(62)
Where is the relative air fuel ratio.
www.intechopen.com
Natural Gas58
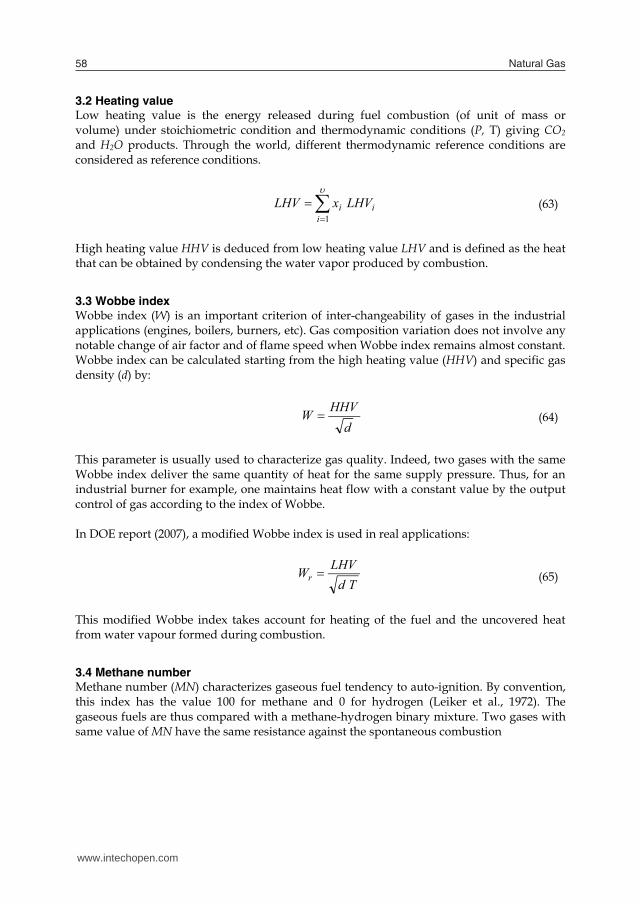
3.2 Heating value Low heating value is the energy released during fuel combustion (of unit of mass or volume) under stoichiometric condition and thermodynamic conditions (P, T) giving CO2 and H2O products. Through the world, different thermodynamic reference conditions are considered as reference conditions.
1i
ii LHVxLHV (63)
High heating value HHV is deduced from low heating value LHV and is defined as the heat that can be obtained by condensing the water vapor produced by combustion.
3.3 Wobbe index Wobbe index (W) is an important criterion of inter-changeability of gases in the industrial applications (engines, boilers, burners, etc). Gas composition variation does not involve any notable change of air factor and of flame speed when Wobbe index remains almost constant. Wobbe index can be calculated starting from the high heating value (HHV) and specific gas density (d) by:
dHHVW (64)
This parameter is usually used to characterize gas quality. Indeed, two gases with the same Wobbe index deliver the same quantity of heat for the same supply pressure. Thus, for an industrial burner for example, one maintains heat flow with a constant value by the output control of gas according to the index of Wobbe. In DOE report (2007), a modified Wobbe index is used in real applications:
TdLHVWr (65)
This modified Wobbe index takes account for heating of the fuel and the uncovered heat from water vapour formed during combustion.
3.4 Methane number Methane number (MN) characterizes gaseous fuel tendency to auto-ignition. By convention, this index has the value 100 for methane and 0 for hydrogen (Leiker et al., 1972). The gaseous fuels are thus compared with a methane-hydrogen binary mixture. Two gases with same value of MN have the same resistance against the spontaneous combustion
4. Measuring instruments
Combustion features can be determined according to two types of methods: direct or indirect. Direct methods are based on calorimetric measures where the energy released by the combustion of a gas sample is measured. Indirect methods are issued of either calculation from gas composition, or of measurements of gas physical properties.
4.1 Calorimeter This direct method is based on calorimetric measures. Ulbig & Hoburg (2002) synthesized measurement of heat value by:
combustion of a gas sample inside a calorimetric bomb (isochoric combustion), combustion of a gas with a gas-burner (isobar combustion), catalytic combustion (isobar combustion without flame) by oxidation of a gas on a
catalyst. Combustion technique with a gas-burner is largely used. Various types of calorimeters, based on this technique, are employed: Junkers, Reinke, Thomas--Cambridge and Culter--Hammer. Operation principle, presented on Figure 11, is identical. Specific quantity of gas is measured then burned completely. In a heat exchanger, energy released by combustion heats a coolant (water or air). Consequently, coolant temperature increase makes it possible to measure gas heating value. Apparatus calibration is done using reference gas which its specific heating value is known (in general pure methane).
Water storage at T [K]
MixerFuel
Air
Heat exchangerBurner
Exhausttemperature
Inlet temperature
Outlet temperature
Water storage at T [K]
MixerFuel
Air
Heat exchangerBurner
Exhausttemperature
Inlet temperature
Outlet temperature
Fig. 11. Calorimeter operation principle Catalytic combustion is safe way (flameless) to measure high heating value of gases (Hornemann, 1995), (Heyden & Berg, 1998). This batch method is based on the following principle: gas mixture and air are introduced on a noble metal (platinum). Air quantity introduced is sufficient for gas mixture oxidation. Hydrocarbons are oxidized over noble metal being a catalyst. The procedure is renewed thereafter with an unknown gas mixture. Heat released can be measured either starting from temperature changes related to the catalytic reaction, or starting from electric output changes required to keep catalyst at
www.intechopen.com

Natural gas: physical properties and combustion features 59
3.2 Heating value Low heating value is the energy released during fuel combustion (of unit of mass or volume) under stoichiometric condition and thermodynamic conditions (P, T) giving CO2 and H2O products. Through the world, different thermodynamic reference conditions are considered as reference conditions.
1i
ii LHVxLHV (63)
High heating value HHV is deduced from low heating value LHV and is defined as the heat that can be obtained by condensing the water vapor produced by combustion.
3.3 Wobbe index Wobbe index (W) is an important criterion of inter-changeability of gases in the industrial applications (engines, boilers, burners, etc). Gas composition variation does not involve any notable change of air factor and of flame speed when Wobbe index remains almost constant. Wobbe index can be calculated starting from the high heating value (HHV) and specific gas density (d) by:
dHHVW (64)
This parameter is usually used to characterize gas quality. Indeed, two gases with the same Wobbe index deliver the same quantity of heat for the same supply pressure. Thus, for an industrial burner for example, one maintains heat flow with a constant value by the output control of gas according to the index of Wobbe. In DOE report (2007), a modified Wobbe index is used in real applications:
TdLHVWr (65)
This modified Wobbe index takes account for heating of the fuel and the uncovered heat from water vapour formed during combustion.
3.4 Methane number Methane number (MN) characterizes gaseous fuel tendency to auto-ignition. By convention, this index has the value 100 for methane and 0 for hydrogen (Leiker et al., 1972). The gaseous fuels are thus compared with a methane-hydrogen binary mixture. Two gases with same value of MN have the same resistance against the spontaneous combustion
4. Measuring instruments
Combustion features can be determined according to two types of methods: direct or indirect. Direct methods are based on calorimetric measures where the energy released by the combustion of a gas sample is measured. Indirect methods are issued of either calculation from gas composition, or of measurements of gas physical properties.
4.1 Calorimeter This direct method is based on calorimetric measures. Ulbig & Hoburg (2002) synthesized measurement of heat value by:
combustion of a gas sample inside a calorimetric bomb (isochoric combustion), combustion of a gas with a gas-burner (isobar combustion), catalytic combustion (isobar combustion without flame) by oxidation of a gas on a
catalyst. Combustion technique with a gas-burner is largely used. Various types of calorimeters, based on this technique, are employed: Junkers, Reinke, Thomas--Cambridge and Culter--Hammer. Operation principle, presented on Figure 11, is identical. Specific quantity of gas is measured then burned completely. In a heat exchanger, energy released by combustion heats a coolant (water or air). Consequently, coolant temperature increase makes it possible to measure gas heating value. Apparatus calibration is done using reference gas which its specific heating value is known (in general pure methane).
Water storage at T [K]
MixerFuel
Air
Heat exchangerBurner
Exhausttemperature
Inlet temperature
Outlet temperature
Water storage at T [K]
MixerFuel
Air
Heat exchangerBurner
Exhausttemperature
Inlet temperature
Outlet temperature
Fig. 11. Calorimeter operation principle Catalytic combustion is safe way (flameless) to measure high heating value of gases (Hornemann, 1995), (Heyden & Berg, 1998). This batch method is based on the following principle: gas mixture and air are introduced on a noble metal (platinum). Air quantity introduced is sufficient for gas mixture oxidation. Hydrocarbons are oxidized over noble metal being a catalyst. The procedure is renewed thereafter with an unknown gas mixture. Heat released can be measured either starting from temperature changes related to the catalytic reaction, or starting from electric output changes required to keep catalyst at
www.intechopen.com

Natural Gas60
constant temperature. This method can however be subject at two errors: incomplete gas oxidation or catalyst poisoning.
4.2 Stoichiometric combustion For saturated linear hydrocarbons (alkanes), there exists a linear relation between air fuel ratio and low heating value of gas mixtures, see Figure 12. This measurement principle is thus issued on air volume knowledge per unit of gas volume under stoichiometric combustion. Consequently, that makes it possible to reach the calorific value of gas starting from the following relation see (Ingrain, 1990):
m
a
VVKLHV (66)
10 15 20 25 30 35 40 4520
40
60
80
100
120
140
160
Stoichiometric air-to-gas ratio
Low
Hea
ting
Val
ue [
MJ/
m3]
Methane
Ethane
Propane
i-Butanen-µButane
n-Pentane
Fig. 12. Linear relation between LHV and Stoichiometric Air-to-gas ratio
4.3 Gas composition Gas chromatography and mass spectroscopy are the most commonly employed laboratory techniques. These two techniques are based upon the separation of gas species followed detection.
4.3.1 Gas chromatography Gas chromatography is a partition method. It is based on components distribution of a sample between mobile phase (the gas) and stationary phase (liquid or solid), see Figure 13 upon a column. The column provides a pathway, which aims to separate the species based upon molecular size, charge, polarizability, and other physical parameters which limit interactions between the gas species and the column materials. If the components of the sample have different partition coefficients between the two phases, they migrate with different speeds. An inert carrier gas (e.g. nitrogen or helium) is used to transport the gas sample through the columns.
Column
Controlvalve
Pressurecontroller
Mixer
Filter
Pressurecontroller
Oven
ProcessingUnit
Detection cell
Column
Controlvalve
Pressurecontroller
Mixer
Filter
Pressurecontroller
Oven
ProcessingUnit
Detection cell
Fig. 13. Gas chromatography principle Gas chromatography is considered accurate and reliable. However, it is usually slow and the columns require maintenance. It is not considered practical for a continuous on-line application. Calculation of heating value and Wobbe index of gas are obtained regards to the standard procedure ISO 6976. For a natural gas, the higher heating value is written see (Ingrain, 1990):
m
iii
Z
HHVxHHV
1 (67)
Where Zm is the compressibility factor, see Equation (54).
4.3.2 Mass Spectrometer Mass spectrometer is based mainly upon the mass-to-charge ratio of ionized species. The mass spectrum is generated by first ionizing natural gas and the accelerating it with an electric field. The ions are separated by their momentum distribution. Most mass spectrometers have software that determines gas concentrations from peak intensities and allows real time calculations
4.4 Gas composition by Infrared spectroscopy Infrared spectroscopy method exploits the property that natural gas components absorb light in a given wavelengh of the infra-red spectrum. Only the hydrogen, which do not absorb the infrared radiation, and the carbon monoxide, which absorbs in another area of the spectrum, do not take part in this phenomenon. The general diagram is represented on the figure 14. From calibration, using the absorption band of the methane and the band of hydrocarbons higher than methane, the measurement of radiation absorption lead to the determination of the heating value of natural gas. However, the components higher than the C4, as well as hydrogen, do not absorb the infra-red radiation. Consequently, those components are not taken into account for the calculation of the calorific value
www.intechopen.com
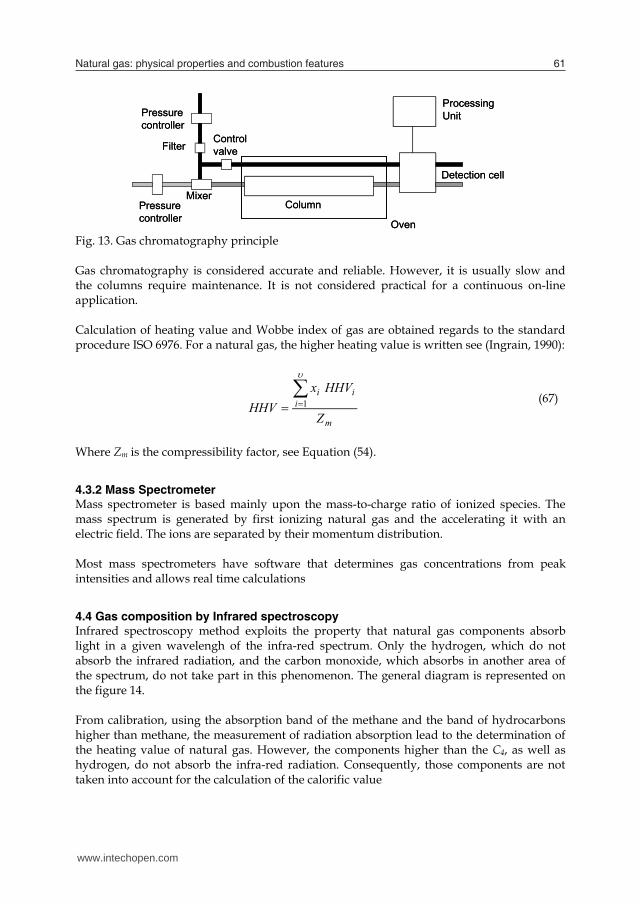
Natural gas: physical properties and combustion features 61
constant temperature. This method can however be subject at two errors: incomplete gas oxidation or catalyst poisoning.
4.2 Stoichiometric combustion For saturated linear hydrocarbons (alkanes), there exists a linear relation between air fuel ratio and low heating value of gas mixtures, see Figure 12. This measurement principle is thus issued on air volume knowledge per unit of gas volume under stoichiometric combustion. Consequently, that makes it possible to reach the calorific value of gas starting from the following relation see (Ingrain, 1990):
m
a
VVKLHV (66)
10 15 20 25 30 35 40 4520
40
60
80
100
120
140
160
Stoichiometric air-to-gas ratio
Low
Hea
ting
Val
ue [
MJ/
m3]
Methane
Ethane
Propane
i-Butanen-µButane
n-Pentane
Fig. 12. Linear relation between LHV and Stoichiometric Air-to-gas ratio
4.3 Gas composition Gas chromatography and mass spectroscopy are the most commonly employed laboratory techniques. These two techniques are based upon the separation of gas species followed detection.
4.3.1 Gas chromatography Gas chromatography is a partition method. It is based on components distribution of a sample between mobile phase (the gas) and stationary phase (liquid or solid), see Figure 13 upon a column. The column provides a pathway, which aims to separate the species based upon molecular size, charge, polarizability, and other physical parameters which limit interactions between the gas species and the column materials. If the components of the sample have different partition coefficients between the two phases, they migrate with different speeds. An inert carrier gas (e.g. nitrogen or helium) is used to transport the gas sample through the columns.
Column
Controlvalve
Pressurecontroller
Mixer
Filter
Pressurecontroller
Oven
ProcessingUnit
Detection cell
Column
Controlvalve
Pressurecontroller
Mixer
Filter
Pressurecontroller
Oven
ProcessingUnit
Detection cell
Fig. 13. Gas chromatography principle Gas chromatography is considered accurate and reliable. However, it is usually slow and the columns require maintenance. It is not considered practical for a continuous on-line application. Calculation of heating value and Wobbe index of gas are obtained regards to the standard procedure ISO 6976. For a natural gas, the higher heating value is written see (Ingrain, 1990):
m
iii
Z
HHVxHHV
1 (67)
Where Zm is the compressibility factor, see Equation (54).
4.3.2 Mass Spectrometer Mass spectrometer is based mainly upon the mass-to-charge ratio of ionized species. The mass spectrum is generated by first ionizing natural gas and the accelerating it with an electric field. The ions are separated by their momentum distribution. Most mass spectrometers have software that determines gas concentrations from peak intensities and allows real time calculations
4.4 Gas composition by Infrared spectroscopy Infrared spectroscopy method exploits the property that natural gas components absorb light in a given wavelengh of the infra-red spectrum. Only the hydrogen, which do not absorb the infrared radiation, and the carbon monoxide, which absorbs in another area of the spectrum, do not take part in this phenomenon. The general diagram is represented on the figure 14. From calibration, using the absorption band of the methane and the band of hydrocarbons higher than methane, the measurement of radiation absorption lead to the determination of the heating value of natural gas. However, the components higher than the C4, as well as hydrogen, do not absorb the infra-red radiation. Consequently, those components are not taken into account for the calculation of the calorific value
www.intechopen.com

Natural Gas62
IR generator
Focusing mirror
Focusing mirror Measurement cell
Slit and Filters
Infrared probe
Gas input
Gas output
Wave pulse signal
IR generator
Focusing mirror
Focusing mirror Measurement cell
Slit and Filters
Infrared probe
Gas input
Gas output
Wave pulse signal
Fig. 14. Infrared spectroscopy principle
5. Physical properties methods
Besides the combustion or analysis of fuel gases, it is also possible to correlate and, respectively, calculate the calorific value by measuring the physical properties of the gas mixture. Correlations have to be determined, allowing the calorific value to be reliably calculated as a function of one or several different physical properties. For gases distributed in the United Kingdom, British Gas (Thurston et al., 2002)
established correlation to estimate low heating value LHV regards to speed of sound measurement and thermal conductivity of natural gas. Low heating value is thus given by the expression :
62
54321 aTaTacaaaLHV aaTT LH (68)
Where
HT is the thermal conductivity of natural gas at temperature HT , respectively
LT the thermal conductivity at temperature LT , c is the speed of sound, aT the
ambient temperature, 1a to 6a are the fitted coefficients.
Thurston et al. (2002) proposed : 25649.361 a , 5768.452 a , 047029.03 a , 091067.04 a , 00074.05 a and 18731.246 a under conditions KTT aH 70
and KTT aL 50 .
In partnership with the department of energy of the United States, Morrow and Behring (1999), of Southwest Research Institute, have developed a correlation based on speed of sound, nitrogen and carbon dioxide contents. HHV is evaluated by:
MMBHHV CH 048.54343
(69) cxxB CON 2202568212.002523803.004552871.0406.20442 (70)
Where
2Nx is the volume fraction of 2N , respectively 2COx the volume fraction of
2CO , and c is the speed of sound, M is the mass molar of the mixture, evaluated by: i
iCO
iN
ii cxaxaaM 2
0210 22
(71)
Bonne (1996) proposed a general expression :
H
LH
T
TTHHV
2.229460221.710271.105053.36433
(72)
Where is the thermal conductivity (cal/s m °C) and TL, TH are the low and high temperatures respectively (°C). is the gas viscosity (µpoise). This HHV estimation
has a maximal error of 0.067 3. mMJ with a standard error of 0.01831 3. mMJ . 7514.14742.173846.0 100189.910488008087007.1287 MCHHV p (73)
Pinvidic et al. (2000), of Gaz de France, developed a correlation of high heating value
regards to light beam optical absorption by gas components. Light beam defines three bands of wave length measure, located to the near infrared, with a width of 10 to 20 10-9
m. HHV is deduced from the measurement of temperature T, pressure P and transmission coefficients 3,2,1, ii of natural gas in three bands. HHV is expressed thus by the following relation:
PTaa
PTaaHHV
iiii 10
3
1,1,0 ln (74)
Where ia ,0 , ia ,1 , 0a and 1a are obtained from reference gases. This fitting has a maximum error of 1%.
Tacke and Kastner (2003) developed measure device of HHV, in particular, for natural
gas. The apparatus set up uses infrared radiation dispersion regards to wavelengths getting a spectrum. This spectrum is detected by a system to be analyzed thereafter. HHV is deduced through the correlation:
www.intechopen.com

Natural gas: physical properties and combustion features 63
IR generator
Focusing mirror
Focusing mirror Measurement cell
Slit and Filters
Infrared probe
Gas input
Gas output
Wave pulse signal
IR generator
Focusing mirror
Focusing mirror Measurement cell
Slit and Filters
Infrared probe
Gas input
Gas output
Wave pulse signal
Fig. 14. Infrared spectroscopy principle
5. Physical properties methods
Besides the combustion or analysis of fuel gases, it is also possible to correlate and, respectively, calculate the calorific value by measuring the physical properties of the gas mixture. Correlations have to be determined, allowing the calorific value to be reliably calculated as a function of one or several different physical properties. For gases distributed in the United Kingdom, British Gas (Thurston et al., 2002)
established correlation to estimate low heating value LHV regards to speed of sound measurement and thermal conductivity of natural gas. Low heating value is thus given by the expression :
62
54321 aTaTacaaaLHV aaTT LH (68)
Where
HT is the thermal conductivity of natural gas at temperature HT , respectively
LT the thermal conductivity at temperature LT , c is the speed of sound, aT the
ambient temperature, 1a to 6a are the fitted coefficients.
Thurston et al. (2002) proposed : 25649.361 a , 5768.452 a , 047029.03 a , 091067.04 a , 00074.05 a and 18731.246 a under conditions KTT aH 70
and KTT aL 50 .
In partnership with the department of energy of the United States, Morrow and Behring (1999), of Southwest Research Institute, have developed a correlation based on speed of sound, nitrogen and carbon dioxide contents. HHV is evaluated by:
MMBHHV CH 048.54343
(69) cxxB CON 2202568212.002523803.004552871.0406.20442 (70)
Where
2Nx is the volume fraction of 2N , respectively 2COx the volume fraction of
2CO , and c is the speed of sound, M is the mass molar of the mixture, evaluated by: i
iCO
iN
ii cxaxaaM 2
0210 22
(71)
Bonne (1996) proposed a general expression :
H
LH
T
TTHHV
2.229460221.710271.105053.36433
(72)
Where is the thermal conductivity (cal/s m °C) and TL, TH are the low and high temperatures respectively (°C). is the gas viscosity (µpoise). This HHV estimation
has a maximal error of 0.067 3. mMJ with a standard error of 0.01831 3. mMJ . 7514.14742.173846.0 100189.910488008087007.1287 MCHHV p (73)
Pinvidic et al. (2000), of Gaz de France, developed a correlation of high heating value
regards to light beam optical absorption by gas components. Light beam defines three bands of wave length measure, located to the near infrared, with a width of 10 to 20 10-9
m. HHV is deduced from the measurement of temperature T, pressure P and transmission coefficients 3,2,1, ii of natural gas in three bands. HHV is expressed thus by the following relation:
PTaa
PTaaHHV
iiii 10
3
1,1,0 ln (74)
Where ia ,0 , ia ,1 , 0a and 1a are obtained from reference gases. This fitting has a maximum error of 1%.
Tacke and Kastner (2003) developed measure device of HHV, in particular, for natural
gas. The apparatus set up uses infrared radiation dispersion regards to wavelengths getting a spectrum. This spectrum is detected by a system to be analyzed thereafter. HHV is deduced through the correlation:
www.intechopen.com

Natural Gas64
i
iiHHVHHV (75)
Where
i is the absorption coefficient for wavelength i and i
HHV is the high
heating value of the component which has its wavelength i . Florisson and Burrie (1989) determined Wobbe index based on density estimation and
nitrogen and carbon dioxide contents. The correlation is valid only for gases whose Wobbe index is in the range 43.4 and 44.4 MJ m- 3.
d
xxdW NCO 22
57.6497.9836.61671.5 (76)
Pickenäcker et al. (2000) showed that Wobbe index can also be given by a technique
based on measurements of dynamic viscosity. They obtained the following correlation:
10.311ln486.288405.0
T
TW ref (77)
Rahmouni et al. (2003-2004)
Fig. 15. Determination of the ternary composition by using a mixture diagram.
A non-correlative method was proposed by Rahmouni et al. (2004). Combustion properties of natural gas were calculated from a ternary composition that has the same physical properties as the tested gas. As illustrated on Figure 15, when measured physical properties of natural gas are represented in a ternary diagram mixture, an ‘equivalent’ ternary composition is determined. That pseudo-composition has no connection to the composition of the real gas (natural gas of five or more constituents). The term ‘equivalent’ means that the three compounds—gas, has the same two physical properties than the real gas (same refraction index and same thermal conductivity for instance). Then, the combustion properties are evaluated using the ‘equivalent’ ternary composition (or pseudo-composition) and match the real gas combustion properties.
The choice of these properties was based on a statistical analysis (numerical experiment plan, principal component analysis) of a natural gas base distributed in Europe. The basic assumption is that if the measurement of two physical properties corresponds to the description of a ternary gas, then the properties of combustion of this ternary gas will be also those of the real gas which models the ternary gas, with the help of a reasonable error.
The statistical analysis concluded that methane and ethane, then comes propane and nitrogen, are the most influent component of natural gas. Thus, two ternary mixtures can be considered: CH4-C2H6-C3H8 or CH4-C2H6-N2.
Three combinations Ternary diagram / physical properties were used: - The measurement of thermal conductivity and co-index of refraction for T = 293 K
and using CH4-C2H6-C3H8 diagram, - Combination of the precedent measurements with the CH4-C2H6-N2 diagram, - The measurement of thermal conductivity for two temperature levels 293 K and
343 K.
The relations below describe the intersection of two physical properties in a ternary diagram which give the ternary pseudo-composition:
33
1 11
1122
221111101
b
aabbaxx
(78)
3
23
2 11
2211
112211202
b
aabbaxx
(79)
213 1 xxx (80)
Where i : Physical property i, 21, xx and 3x : Ternary gas composition, 10x : Lower limit of 1x axis, 20x Lower limit of 2x axis, 211 ,, aba and 2b : Coefficients depending on physical properties and temperature. Once the composition of the ternary mixture is determined, the combustion properties can be calculated using Equations 63, 64 and 65.
www.intechopen.com
Natural gas: physical properties and combustion features 65
i
iiHHVHHV (75)
Where
i is the absorption coefficient for wavelength i and i
HHV is the high
heating value of the component which has its wavelength i . Florisson and Burrie (1989) determined Wobbe index based on density estimation and
nitrogen and carbon dioxide contents. The correlation is valid only for gases whose Wobbe index is in the range 43.4 and 44.4 MJ m- 3.
d
xxdW NCO 22
57.6497.9836.61671.5 (76)
Pickenäcker et al. (2000) showed that Wobbe index can also be given by a technique
based on measurements of dynamic viscosity. They obtained the following correlation:
10.311ln486.288405.0
T
TW ref (77)
Rahmouni et al. (2003-2004)
Fig. 15. Determination of the ternary composition by using a mixture diagram.
A non-correlative method was proposed by Rahmouni et al. (2004). Combustion properties of natural gas were calculated from a ternary composition that has the same physical properties as the tested gas. As illustrated on Figure 15, when measured physical properties of natural gas are represented in a ternary diagram mixture, an ‘equivalent’ ternary composition is determined. That pseudo-composition has no connection to the composition of the real gas (natural gas of five or more constituents). The term ‘equivalent’ means that the three compounds—gas, has the same two physical properties than the real gas (same refraction index and same thermal conductivity for instance). Then, the combustion properties are evaluated using the ‘equivalent’ ternary composition (or pseudo-composition) and match the real gas combustion properties.
The choice of these properties was based on a statistical analysis (numerical experiment plan, principal component analysis) of a natural gas base distributed in Europe. The basic assumption is that if the measurement of two physical properties corresponds to the description of a ternary gas, then the properties of combustion of this ternary gas will be also those of the real gas which models the ternary gas, with the help of a reasonable error.
The statistical analysis concluded that methane and ethane, then comes propane and nitrogen, are the most influent component of natural gas. Thus, two ternary mixtures can be considered: CH4-C2H6-C3H8 or CH4-C2H6-N2.
Three combinations Ternary diagram / physical properties were used: - The measurement of thermal conductivity and co-index of refraction for T = 293 K
and using CH4-C2H6-C3H8 diagram, - Combination of the precedent measurements with the CH4-C2H6-N2 diagram, - The measurement of thermal conductivity for two temperature levels 293 K and
343 K.
The relations below describe the intersection of two physical properties in a ternary diagram which give the ternary pseudo-composition:
33
1 11
1122
221111101
b
aabbaxx
(78)
3
23
2 11
2211
112211202
b
aabbaxx
(79)
213 1 xxx (80)
Where i : Physical property i, 21, xx and 3x : Ternary gas composition, 10x : Lower limit of 1x axis, 20x Lower limit of 2x axis, 211 ,, aba and 2b : Coefficients depending on physical properties and temperature. Once the composition of the ternary mixture is determined, the combustion properties can be calculated using Equations 63, 64 and 65.
www.intechopen.com

Natural Gas66
30 35 40 45 50-0,2
-0,1
0,0
0,1
0,2
MAD = 0.01%R
elat
ive
erro
r [%
]
HHV [MJ/m3] Fig. 16. Relative error between pseudo-composition and direct GC analysis for high heating value
Based on the work of Rahmouni et al. (2003-a and 2003-b), Loubar et al. (2007) have used a quinternary pseudo-composition in order to improve the accuracy of combustion properties determination. However, with a pseudo-composition of five components, it is impossible to use the previous graphical method involving mixture diagrams. So, they determined the compositions by solving a nonlinear system of equations expressing, for quinternary gases, the thermal conductivity (Equation 30), at two fixed temperatures (T1 = 333 K and T2 = 383 K), the speed of sound determined at T3 = 303 K (Equation 36) and the carbon dioxide content. Figure 16 shows the percentage of the relative error of high heating value, calculated from pseudo-composition and the GC analysis. The mean absolute deviation (MAD) is about 0.01%.
6. Summary
The actual composition of natural gas depends primarily on the production field from which it is extracted and limited variations in composition must therefore be accepted. Moreover, at a local distribution level, seasonal adjustments by the local gas distributor may cause significant variations in the gas composition. Consequently, physical properties and energy content are subject to variations and their calculation / estimation is of great importance for technical and economical aspects. In this chapter, physical models for the calculation of physical properties of natural gas are presented. Physical models of transport properties (viscosity, conductivity) result from the kinetic theory of gases. Viscosity and thermal conductivity of gases mixture (like natural
gas) can be estimated from the properties of pure gases and requiring some correction factors. These physicals models offer a good tool for industrial calculations and applications. Speed of sound can be easily determined from the composition of natural gas. Besides, different methods and devices are developed to measure this property with a good accuracy. A particular technique known as a “pulse echo” was presented. This technique uses a single ultrasonic transducer as both the transmitter and the receiver and two obstacles separated by a known distance. The speed of sound of natural gas is then determined from the transit time and the distance between the targets. In addition, properties such as refractive index and the specific density were presented. These properties can be used in correlations in order to estimate other properties that are difficult to measure or need expensive instruments. Various techniques of determination of combustion features such as air-fuel ratio, the low heating value and Wobbe index are exposed. These techniques are based on direct or indirect methods. Besides the combustion or analysis of fuel gases, it is possible to correlate and, respectively, calculate the combustion features by measuring the physical properties of the gas mixture. Some correlations can be limited to a region, a quality of natural gas or a specified range of combustion properties variation. So, it is important to consider those correlations according to their specified conditions. Researchers and industrials continue their efforts in developing methods and devices to reach rapid and accurate measurement / determination of natural gas properties regarding the stakes.
7. References
Bonne U. (1996). Sensing fuel properties with thermal microsensors. Proc. SPIE Vol. 2722, p. 165-176, Smart Structures and Materials 1996: Smart Electronics and MEMS, Vijay K. Varadan; Paul J. McWhorter; Eds.
Chapman C. & Cowling T.G. (1970). The mathematical theory of non-uniform gases, Press Syndicate of the University of Cambridge, ISBN 0 521 40844.
Chung T.H., Lee L.L. & Starling K.E. (1984). Applications of Kinetic Gas Theories and Multiparameter Correlation for Prediction of Dilute Gas Viscosity and Thermal Conductivity, Industrial & engineering chemistry fundamentals, Vol. 23, No. 1, p 8-13, ISSN 0196-4313
Chung T.H., Ajlan M., Lee L.L. & Starling K.E. (1988). Generalized Multiparameter Correlation for Nonpolar and Polar Fluid Transport Properties, Industrial & engineering chemistry research, Vol. 27, No. 4, p 671-679, ISSN 0888-5885.
DOE (2007) LNG Interchangeability/Gas Quality: Results of the National Energy Technology Laboratory’s Research for the FERC on Natural Gas Quality and Interchangeability, DOE/NETL-207/1290, prepared by U.S. Department of Energy, National Energy Technology Laboratory
Estela-Uribe J.F., Jaramillo J., Salazar M.A. & Trusler J.P.M. (2003). Viriel equation of state for natural gas systems. Fluid Phase Equilibria, Vol. 204, No. 2, pp. 169--182. ISSN 0378-3812
Estela-Uribe J.F. and Jaramillo J. (2005). Generalised viriel equation of state for natural gas systems. Fluid Phase Equilibria Vol. 231, No.1, pp. 84--98, ISSN 0378-3812.
www.intechopen.com

Natural gas: physical properties and combustion features 67
30 35 40 45 50-0,2
-0,1
0,0
0,1
0,2
MAD = 0.01%
Rel
ativ
e er
ror [
%]
HHV [MJ/m3] Fig. 16. Relative error between pseudo-composition and direct GC analysis for high heating value
Based on the work of Rahmouni et al. (2003-a and 2003-b), Loubar et al. (2007) have used a quinternary pseudo-composition in order to improve the accuracy of combustion properties determination. However, with a pseudo-composition of five components, it is impossible to use the previous graphical method involving mixture diagrams. So, they determined the compositions by solving a nonlinear system of equations expressing, for quinternary gases, the thermal conductivity (Equation 30), at two fixed temperatures (T1 = 333 K and T2 = 383 K), the speed of sound determined at T3 = 303 K (Equation 36) and the carbon dioxide content. Figure 16 shows the percentage of the relative error of high heating value, calculated from pseudo-composition and the GC analysis. The mean absolute deviation (MAD) is about 0.01%.
6. Summary
The actual composition of natural gas depends primarily on the production field from which it is extracted and limited variations in composition must therefore be accepted. Moreover, at a local distribution level, seasonal adjustments by the local gas distributor may cause significant variations in the gas composition. Consequently, physical properties and energy content are subject to variations and their calculation / estimation is of great importance for technical and economical aspects. In this chapter, physical models for the calculation of physical properties of natural gas are presented. Physical models of transport properties (viscosity, conductivity) result from the kinetic theory of gases. Viscosity and thermal conductivity of gases mixture (like natural
gas) can be estimated from the properties of pure gases and requiring some correction factors. These physicals models offer a good tool for industrial calculations and applications. Speed of sound can be easily determined from the composition of natural gas. Besides, different methods and devices are developed to measure this property with a good accuracy. A particular technique known as a “pulse echo” was presented. This technique uses a single ultrasonic transducer as both the transmitter and the receiver and two obstacles separated by a known distance. The speed of sound of natural gas is then determined from the transit time and the distance between the targets. In addition, properties such as refractive index and the specific density were presented. These properties can be used in correlations in order to estimate other properties that are difficult to measure or need expensive instruments. Various techniques of determination of combustion features such as air-fuel ratio, the low heating value and Wobbe index are exposed. These techniques are based on direct or indirect methods. Besides the combustion or analysis of fuel gases, it is possible to correlate and, respectively, calculate the combustion features by measuring the physical properties of the gas mixture. Some correlations can be limited to a region, a quality of natural gas or a specified range of combustion properties variation. So, it is important to consider those correlations according to their specified conditions. Researchers and industrials continue their efforts in developing methods and devices to reach rapid and accurate measurement / determination of natural gas properties regarding the stakes.
7. References
Bonne U. (1996). Sensing fuel properties with thermal microsensors. Proc. SPIE Vol. 2722, p. 165-176, Smart Structures and Materials 1996: Smart Electronics and MEMS, Vijay K. Varadan; Paul J. McWhorter; Eds.
Chapman C. & Cowling T.G. (1970). The mathematical theory of non-uniform gases, Press Syndicate of the University of Cambridge, ISBN 0 521 40844.
Chung T.H., Lee L.L. & Starling K.E. (1984). Applications of Kinetic Gas Theories and Multiparameter Correlation for Prediction of Dilute Gas Viscosity and Thermal Conductivity, Industrial & engineering chemistry fundamentals, Vol. 23, No. 1, p 8-13, ISSN 0196-4313
Chung T.H., Ajlan M., Lee L.L. & Starling K.E. (1988). Generalized Multiparameter Correlation for Nonpolar and Polar Fluid Transport Properties, Industrial & engineering chemistry research, Vol. 27, No. 4, p 671-679, ISSN 0888-5885.
DOE (2007) LNG Interchangeability/Gas Quality: Results of the National Energy Technology Laboratory’s Research for the FERC on Natural Gas Quality and Interchangeability, DOE/NETL-207/1290, prepared by U.S. Department of Energy, National Energy Technology Laboratory
Estela-Uribe J.F., Jaramillo J., Salazar M.A. & Trusler J.P.M. (2003). Viriel equation of state for natural gas systems. Fluid Phase Equilibria, Vol. 204, No. 2, pp. 169--182. ISSN 0378-3812
Estela-Uribe J.F. and Jaramillo J. (2005). Generalised viriel equation of state for natural gas systems. Fluid Phase Equilibria Vol. 231, No.1, pp. 84--98, ISSN 0378-3812.
www.intechopen.com

Natural Gas68
Florisson O. & Burrie P.H. (1989). Rapid determination of the Wobbe index of natural gas. Journal of physics. Part E. Scientific instruments ISSN 0022-3735, Vol. 22, No.2, p. 123-128.
Guérin H. (1981) Traité de manipulation et d'analyse des gaz. Ed. Masson 2nd édition. Greenspan M. and Wimenitz F.N. (1953). An acoustic viscometer for gases- Part I. National
Bureau of Standard Report No. 2658. pages 25. OSTI ID: 4379711. Hanley H.J., McCarty R.D. & Haynes W.N. (1975). Equation for the viscosity and thermal
conductivity coefficients of methane, Cryogenics, Vol. 15, No. 7, p413-417 Hauptmann P., Hoppe N. and Püttmer A. (2002). Application of ultrasonic sensors in the
process industry. Meas. Sci. Technol. 13 R73 – R83, ISSN 0957-0233 Heyden W.H.V. & Berg R.A. (1998) Measuring heating value using catalytic combustion.
United States Patent, US 0 575 986 2A, pp. 1--14, 1998. Hirschfelder J.O., Curtiss C.F. & Bird R.B. (1954). Molecular theory of gases and liquids, Ed.
John Wiley, ISBN 978-0-471-40065-3. Hornemann J.A.T. (1995) Method for determining the calorific value of a gas and/or the Wobbe
index of natural gas. European Patent, EP 0 665 953 B1, pp. 1--9. Ingrain D. (1990). Caloric value of gases (in french). Technique de l'ingénieur, ISSN 0399-4147
Vol. RC3, No. R 2980, pp. 1--10. Jaescheke M., Benito A., Fredheim A., Henault J. M., Viglietti B., van Wesenbeeck P.,
Klimeck R., Kunz O. & Wagner W. (2003), GERG Project : Wide-range reference equation of state for natural gases. Gas- und Wasserfach. Gas Erdgas, Vol. 144, No. 7, p. 430—435, ISSN 0016-4909.
Jaeschke M. and Schley P. (1995). Ideal gas thermodynamic properties for natural gas applications. International Journal of Thermophysics, Vol. 16, No. 6, p. 1381—1392, ISSN 0195-928X, DOI 10.1007/BF02083547.
Kelner E., Minachi A., Owen T. E, Burzynski JR. M. and Petullo S. P. (2004). Device for precision measurement of speed of sound in a gas. United States Patent, US 2004/0093948 A1.
Leiker M., Christoph K., Rankl M., Cartellieri W. & Pleifer U. (1972). Evaluation of anti-knocking property of gaseous fuels by means of methane number and its practical application to gas engines, ASME paperNo. 72-DGP-4, Vol. 94, Issue 7, p55
Le Neindre B. (1998). Heat conductivity of gases and liquids (in french), Ed. Technique de l’ingénieur, K 427, p1-43.
Loubar K., Rahmouni C., Le Corre O. and Tazerout M. (2007). A combustionless determination method for combustion properties of natural gases, Fuel, Vol. 86, No. 16, p 2535-2544, ISSN 0016-2361, DOI: 10.1016/j.fuel.2007.02.024.
Morrow T.B. and Behring K.A. (1999). Energy flow measurement technology, and the promise of reduced operating costs. 4th International Symposium on Fluid Flow Measurement, Denver, CO. June 28--30, pp. 1--12, 1999.
Mason E.A. and Monchick I. (1962). Heat Conductivity of Polyatomic and Polar Gases, The journal of Chemical Physics, Vol. 36, p. 1622- 1962. ISSN 0021-9606 doi:10.1063/1.1732790
Mason E.A. and Saxena S.C. Approximate formula for the thermal conductivity of gas mixtures, The Physics of Fluids, Vol.1, No. 5, p. 361-369, ISSN 0031- 9171 doi:10.1063/1.1724352.
Neufeld P.D., Jansen A.R. & Aziz R.A. (1972). Empirical equations to calculate 16 of the
transport collision integrals*),( sl for the (12-6) potential, Journal of Chemical
Physics, Vol. 57, p 1100-1102, ISSN 0021-9606 Pickenäcker K., Trimis D. & Wawrzinek K. (2000). Excess air controlled operation of boilers
and furnaces by means of Wobbe number measurement. 5th European Conference on Industrial Furnaces and Boilers (INFUB5), ISBN 972-8034-04-0, Espinho-Porto, Portugal (11/04/2000)
Pinvidic J.J., Juen G.L. & Pelous G.P. (2000). Method and apparatus for determining the calorific value of a natural gas optically and in real time. United States Patent, US S6157455A.
Saikaly K., Rousseau S., Rahmouni C., Le Corre O. & Truffet L. (2008). Safe operating conditions determination for stationary SI gas engines, Fuel Processing Technology, Vol. 89, No. 11, 1p169-1179, ISSN 0378-3820
Rahmouni C., Le Corre O. and Tazerout M. (2003-a). Online determination of natural gas properties, Comptes Rendus Mecanique, Vol. 331, No. 8, Pages 545-550, ISSN 1631-0721, DOI: 10.1016/S1631-0721(03)00126-8.
Rahmouni C., Tazerout M. and O. Le Corre (2003-b)., Determination of the combustion properties of natural gases by pseudo-constituents*, Fuel, Vol. 82, No. 11, Pages 1399-1409, ISSN 0016-2361, DOI: 10.1016/S0016-2361(03)00029-2.
Rahmouni C., Tazerout M. and Le Corre O. (2004). Method for determining at least one energetic property of a gas fuel mixture by measuring physical properties of the gas mixture, Patent US2004195531, 2004-10-07, Also published as US7091509, FR2827961, RU2004102387, WO03012435, EP1412742
Reid R.C., Prausnitz J.M. and Poling B.E. (1987). The properties of gases & liquids. Ed. McGraw Hill Book Company, Fourth Edition, ISBN 978-0-07-118971-2.
Rojey A., Durand B., Jaffret C., Jullian S. & Valais M. (2000). Natural gas : Production – processing – transport (translate by N. Marshall), Eds Technip, ISBN-13 978-2710806936
Starling K. E. and Savidge J. L. (1992), Compressibility factors of natural gas and other related hydrocarbon gases. AGA Transmission Measurement Committee. Report 8, American Gas Association.
Tacke M. & Kastner J. (2003). Photometric device and photometric method for determining the gross calorific value of a test gas. United States Patent, US 6555820B1.
Thurston R.R., Hammond P.S. and Price B.L. (2002). Method and apparatus for measuring the calorific value of a gas. United States Patent, US 6442996B1.
Ulbig P. & Hoburg D. (2002). Determination of the calorific value of natural gas by different methods. Thermochimica acta. Vol. 382, No.1-2, pp. 27—35, ISSN 0040-6031.
Vogel E., Wilhelm J., Küchenmeister C. & Jaeschke M. (2000). High-precision viscosity measurements on methane, High temperatures-high pressures, Vol. 32, No. 1, p. 73-81, doi:10.1068/htwu359.
Wilhem J., Gillis K.A., Mehl J.B. and Moldover M.R. (2000). An improved Greenspan acoustic viscometer. International Journal of Thermophysics, Vol .21, No. 5, p. 983-997, ISSN 0195-928X, DOI: 10.1023/A:1026471901657
Wilke C.R. (1950). A viscosity for gas mixtures, Journal of Chemical Physics, Vol. 18, p517-519, ISSN 0021-9606
www.intechopen.com

Natural gas: physical properties and combustion features 69
Florisson O. & Burrie P.H. (1989). Rapid determination of the Wobbe index of natural gas. Journal of physics. Part E. Scientific instruments ISSN 0022-3735, Vol. 22, No.2, p. 123-128.
Guérin H. (1981) Traité de manipulation et d'analyse des gaz. Ed. Masson 2nd édition. Greenspan M. and Wimenitz F.N. (1953). An acoustic viscometer for gases- Part I. National
Bureau of Standard Report No. 2658. pages 25. OSTI ID: 4379711. Hanley H.J., McCarty R.D. & Haynes W.N. (1975). Equation for the viscosity and thermal
conductivity coefficients of methane, Cryogenics, Vol. 15, No. 7, p413-417 Hauptmann P., Hoppe N. and Püttmer A. (2002). Application of ultrasonic sensors in the
process industry. Meas. Sci. Technol. 13 R73 – R83, ISSN 0957-0233 Heyden W.H.V. & Berg R.A. (1998) Measuring heating value using catalytic combustion.
United States Patent, US 0 575 986 2A, pp. 1--14, 1998. Hirschfelder J.O., Curtiss C.F. & Bird R.B. (1954). Molecular theory of gases and liquids, Ed.
John Wiley, ISBN 978-0-471-40065-3. Hornemann J.A.T. (1995) Method for determining the calorific value of a gas and/or the Wobbe
index of natural gas. European Patent, EP 0 665 953 B1, pp. 1--9. Ingrain D. (1990). Caloric value of gases (in french). Technique de l'ingénieur, ISSN 0399-4147
Vol. RC3, No. R 2980, pp. 1--10. Jaescheke M., Benito A., Fredheim A., Henault J. M., Viglietti B., van Wesenbeeck P.,
Klimeck R., Kunz O. & Wagner W. (2003), GERG Project : Wide-range reference equation of state for natural gases. Gas- und Wasserfach. Gas Erdgas, Vol. 144, No. 7, p. 430—435, ISSN 0016-4909.
Jaeschke M. and Schley P. (1995). Ideal gas thermodynamic properties for natural gas applications. International Journal of Thermophysics, Vol. 16, No. 6, p. 1381—1392, ISSN 0195-928X, DOI 10.1007/BF02083547.
Kelner E., Minachi A., Owen T. E, Burzynski JR. M. and Petullo S. P. (2004). Device for precision measurement of speed of sound in a gas. United States Patent, US 2004/0093948 A1.
Leiker M., Christoph K., Rankl M., Cartellieri W. & Pleifer U. (1972). Evaluation of anti-knocking property of gaseous fuels by means of methane number and its practical application to gas engines, ASME paperNo. 72-DGP-4, Vol. 94, Issue 7, p55
Le Neindre B. (1998). Heat conductivity of gases and liquids (in french), Ed. Technique de l’ingénieur, K 427, p1-43.
Loubar K., Rahmouni C., Le Corre O. and Tazerout M. (2007). A combustionless determination method for combustion properties of natural gases, Fuel, Vol. 86, No. 16, p 2535-2544, ISSN 0016-2361, DOI: 10.1016/j.fuel.2007.02.024.
Morrow T.B. and Behring K.A. (1999). Energy flow measurement technology, and the promise of reduced operating costs. 4th International Symposium on Fluid Flow Measurement, Denver, CO. June 28--30, pp. 1--12, 1999.
Mason E.A. and Monchick I. (1962). Heat Conductivity of Polyatomic and Polar Gases, The journal of Chemical Physics, Vol. 36, p. 1622- 1962. ISSN 0021-9606 doi:10.1063/1.1732790
Mason E.A. and Saxena S.C. Approximate formula for the thermal conductivity of gas mixtures, The Physics of Fluids, Vol.1, No. 5, p. 361-369, ISSN 0031- 9171 doi:10.1063/1.1724352.
Neufeld P.D., Jansen A.R. & Aziz R.A. (1972). Empirical equations to calculate 16 of the
transport collision integrals*),( sl for the (12-6) potential, Journal of Chemical
Physics, Vol. 57, p 1100-1102, ISSN 0021-9606 Pickenäcker K., Trimis D. & Wawrzinek K. (2000). Excess air controlled operation of boilers
and furnaces by means of Wobbe number measurement. 5th European Conference on Industrial Furnaces and Boilers (INFUB5), ISBN 972-8034-04-0, Espinho-Porto, Portugal (11/04/2000)
Pinvidic J.J., Juen G.L. & Pelous G.P. (2000). Method and apparatus for determining the calorific value of a natural gas optically and in real time. United States Patent, US S6157455A.
Saikaly K., Rousseau S., Rahmouni C., Le Corre O. & Truffet L. (2008). Safe operating conditions determination for stationary SI gas engines, Fuel Processing Technology, Vol. 89, No. 11, 1p169-1179, ISSN 0378-3820
Rahmouni C., Le Corre O. and Tazerout M. (2003-a). Online determination of natural gas properties, Comptes Rendus Mecanique, Vol. 331, No. 8, Pages 545-550, ISSN 1631-0721, DOI: 10.1016/S1631-0721(03)00126-8.
Rahmouni C., Tazerout M. and O. Le Corre (2003-b)., Determination of the combustion properties of natural gases by pseudo-constituents*, Fuel, Vol. 82, No. 11, Pages 1399-1409, ISSN 0016-2361, DOI: 10.1016/S0016-2361(03)00029-2.
Rahmouni C., Tazerout M. and Le Corre O. (2004). Method for determining at least one energetic property of a gas fuel mixture by measuring physical properties of the gas mixture, Patent US2004195531, 2004-10-07, Also published as US7091509, FR2827961, RU2004102387, WO03012435, EP1412742
Reid R.C., Prausnitz J.M. and Poling B.E. (1987). The properties of gases & liquids. Ed. McGraw Hill Book Company, Fourth Edition, ISBN 978-0-07-118971-2.
Rojey A., Durand B., Jaffret C., Jullian S. & Valais M. (2000). Natural gas : Production – processing – transport (translate by N. Marshall), Eds Technip, ISBN-13 978-2710806936
Starling K. E. and Savidge J. L. (1992), Compressibility factors of natural gas and other related hydrocarbon gases. AGA Transmission Measurement Committee. Report 8, American Gas Association.
Tacke M. & Kastner J. (2003). Photometric device and photometric method for determining the gross calorific value of a test gas. United States Patent, US 6555820B1.
Thurston R.R., Hammond P.S. and Price B.L. (2002). Method and apparatus for measuring the calorific value of a gas. United States Patent, US 6442996B1.
Ulbig P. & Hoburg D. (2002). Determination of the calorific value of natural gas by different methods. Thermochimica acta. Vol. 382, No.1-2, pp. 27—35, ISSN 0040-6031.
Vogel E., Wilhelm J., Küchenmeister C. & Jaeschke M. (2000). High-precision viscosity measurements on methane, High temperatures-high pressures, Vol. 32, No. 1, p. 73-81, doi:10.1068/htwu359.
Wilhem J., Gillis K.A., Mehl J.B. and Moldover M.R. (2000). An improved Greenspan acoustic viscometer. International Journal of Thermophysics, Vol .21, No. 5, p. 983-997, ISSN 0195-928X, DOI: 10.1023/A:1026471901657
Wilke C.R. (1950). A viscosity for gas mixtures, Journal of Chemical Physics, Vol. 18, p517-519, ISSN 0021-9606
www.intechopen.com

Natural Gas70
www.intechopen.com
Natural GasEdited by Primož PotoÄÂnik
ISBN 978-953-307-112-1Hard cover, 606 pagesPublisher SciyoPublished online 18, August, 2010Published in print edition August, 2010
InTech EuropeUniversity Campus STeP Ri Slavka Krautzeka 83/A 51000 Rijeka, Croatia Phone: +385 (51) 770 447 Fax: +385 (51) 686 166www.intechopen.com
InTech ChinaUnit 405, Office Block, Hotel Equatorial Shanghai No.65, Yan An Road (West), Shanghai, 200040, China Phone: +86-21-62489820 Fax: +86-21-62489821
The contributions in this book present an overview of cutting edge research on natural gas which is a vitalcomponent of world's supply of energy. Natural gas is a combustible mixture of hydrocarbon gases, primarilymethane but also heavier gaseous hydrocarbons such as ethane, propane and butane. Unlike other fossilfuels, natural gas is clean burning and emits lower levels of potentially harmful by-products into the air.Therefore, it is considered as one of the cleanest, safest, and most useful of all energy sources applied invariety of residential, commercial and industrial fields. The book is organized in 25 chapters that cover variousaspects of natural gas research: technology, applications, forecasting, numerical simulations, transport andrisk assessment.
How to referenceIn order to correctly reference this scholarly work, feel free to copy and paste the following:
Olivier Le Corre and Khaled Loubar (2010). Natural Gas : Physical Properties and Combustion Features,Natural Gas, Primož PotoÄÂnik (Ed.), ISBN: 978-953-307-112-1, InTech, Available from:http://www.intechopen.com/books/natural-gas/natural-gas-physical-properties-and-combustion-features