Embed Size (px)
Citation preview

No 1/2021
Natural catastrophes in 2020: secondary perils in the spotlight, but don’t forget primary-peril risks
01 Executive summary02 Key takeaways04 Exploring the
secondary perils universe
12 Deep dive: severe convective storms
18 Primary and secondary perils, and the way forward
22 Appendix 1: 2020 – the year in review
28 Appendix 2

Swiss Re sigma No 1/2021 1
Executive summary
2020 will be remembered for the global health and economic crisis triggered by COVID-19. Against the backdrop of the disruption and upheaval caused by the pandemic, millions of people also experienced severe weather events. In inflation-adjusted terms, global economic losses from natural and man-made catastrophes were USD 202 billion last year, up from USD 150 billion in 2019. The US was hardest hit, with large stretches of the East Coast pummelled by hurricanes, wildfires in the west, and the Midwest struck by a record number of convective storms. Australia suffered too, from unprecedented drought, wildfire and storms. Asia suffered deadly and catastrophic floods from monsoon rains.
At 2020 prices, the year ranks ninth highest on sigma records in terms of economic losses caused by natural catastrophes in any one year. After normalising for GDP-growth effects, last year’s economic losses rank 18th highest on record. The average annual growth rate of GDP-normalised losses of 1.3% between 1970 and 2020 shows that many catastrophe events in the past, if they were to strike at same magnitude today, would cause more damage than in the year of occurrence given the accumulation of value (human and physical assets) in the intervening years.
In terms of insurance sector contribution, the industry covered USD 89 billion of the absolute economic costs incurred in 2020 on account of disaster events, the fifth highest on sigma records, and above the previous 10-year annual average of USD 79 billion. Of the total compensation, USD 81 billion was cover for damage resulting from natural catastrophes. Hurricanes Laura and Sally and a “derecho” storm, all in the US, were the biggest natural-peril insured loss events of 2020. There was no single truly major peak primary-peril loss-making event. Rather, it was a year of many small to mid-size, so-called secondary perils, events. Among these were severe convective storms (SCS). Even though highly localised, the damage and costs of SCS can be extreme. Of other secondary perils, overall losses from wildfires are rising fastest, mainly on account of widespread burning in California.
Insured losses from both primary and secondary perils have been on an upward trajectory since 1970, and we expect this to continue. The two peril types are affected by the same loss-driving risk trends, including population growth, increasing property values in exposed regions and the effects of climate change. In the absence of peak primary peril events, the rise in losses from secondary perils seen in recent years serves as a reminder that future extreme losses from primary perils may also grow significantly. For example, last year the industry was spared major losses from the North Atlantic hurricane season, as most US landfalls did not hit densely populated areas. This was down to luck. There is no reason that future landfalls will not strike areas of economic wealth. And, it was certainly no luck for those communities in Central America in the path of last year’s hurricanes but which without insurance, had no recourse to compensation.
This points to the still-existing need to close protection gaps in many areas of the world, for both primary and secondary peril exposures. This sigma looks at the interplay of different factors shaping secondary perils in particular. The re/insurance industry has long monitored primary perils and its modelling capabilities of the risks are strong. Often, however, secondary peril events are not fully monitored nor modelled. Given the rise of their associated losses, secondary perils need to be better understood for the purpose of more complete and accurate risk assessment. Here re/insurers can do more to contribute to helping households, business and communities be more resilient. We call on the industry to make secondary perils a priority topic in the risk assessment programme, and to improve related modelling capabilities. Damages and claims patterns also need to be monitored on a more granular level for detection of emerging trends, and there needs to be sharing of information, where legally permissible. Critically, the complex interplay of factors – natural world and socioeconomic – shaping secondary peril developments need to be further investigated and much better understood.
In absolute terms, global economic losses from disaster events in 2020 were USD 202 billion....
…the 18th highest on sigma records in GDP-normalised terms.
Insurance covered USD 89 billion of the absolute losses, mostly for damage inflicted by secondary perils.
Ever-rising losses from secondary perils are a reminder that potential losses from future primary perils may grow significantly.
To date, risk assessment has focused less on secondary than primary peril risk: a rebalance is required.

2 Swiss Re sigma No 1/2021
Key takeaways
2020 in a nutshell
Uninflated, inflated (2020 prices) and normalised economic losses from natural catastrophes, USD billionThe annual growth rate of normalised losses from natural catastrophes on a 10-year moving average basis between 1970 and 2020 was 1.3%. Normalisation adjusts to show that an event in the past, if it were to occur in today's world of higher levels of asset values, would cause more damage. This is due to the accumulation of human and economic value (physical assets) in the intervening years.
0
100
200
300
400
500
600
202020152010200520001995199019851980
Uninflated Inflated NormalisedEconomic losses:
Note: normalised by GDP (country real GDP + US inflation); loss-data quality prior to 1990 poor. Source: Swiss Re Institute
Economic losses
Total
Natural catastophesUSD 190 billion
10-year average: 0.26%
2019: USD 150 bn10-year average: USD 222 bn
Man-madeUSD 12 billion
USD 202 billion
0.24%of global GDP
2019
USD 87 bnUSD 113 bn
USD 143 bn
2020 10-year average
Insured losses
Total
Natural catastophesUSD 81 billion
10-year average: 4.7%
2019: USD 22.5 bn
2019: USD 31.9 bn
2019: USD 63 bn10-year average: USD 79 bn
Man-madeUSD 8 billion
USD 89 billion
4.9% of global property direct premiums written
Victims
7 993
Catastrophe events
274
Natural catastropheinsured losses
Total
Secondary perilUSD 57.4 billion (71%)
2019: USD 54 bn10-year average: USD 74 bn
Primary peril USD 23.2 billion (29%)
USD 81 billion
Global protection gap
Source: Swiss Re Institute

Swiss Re sigma No 1/2021 3
Global insured losses from secondary perils since 1970, in USD billion (2020 prices)Insured losses from secondary perils have been growing steadily. Among them, losses from severe convective storms represent the biggest component. However, in recent years losses from wildfires have been growing fastest.
0
10
20
30
40
50
60
70
20202015201020052000199519901985198019751970
Severe convective storms Wildfires Other secondary Secondary effects of primary perilsFloods
Source: Swiss Re Institute
Cumulative insured losses in 2011–2020 by secondary peril type, and primary peril totals, in USD billion (2020 prices)In the last decade, severe convective storms were the main loss-inducing peril in North America and Australia. In North America, accumulated insured losses from storms in 2011–2020 exceeded those from all primary perils together.
2 11 2
217.9
67.3 56.2 35.3 41.6
317.4
192.0
15.6
16.2
20.1
53.1
0.2
18.6
2.4
30.3
3.4
167.8
21.9
0.226.7
0.0 10.1 5.9
91.0
0.0 1.2 0.2 1.0 0.5
9.1
9.42.8 2.5 3.0 1.4
27.4
Severeconvective storms
Floods Wildfires Secondary effectsof primary perils
Othersecondary perils
Primary perils
250Grand total
250North America
25Europe
100Asia
7South America
25Oceania/Australia
Source: Swiss Re Institute

4 Swiss Re sigma No 1/2021
Last year’s loss experience reaffirmed the significant threat presented by secondary perils. Secondary perils caused more than 70% of insured losses from all natural catastrophes (USD 81 billion) in 2020.1 Accumulated losses from many small- and mid-size events made it the fifth-costliest year on record in insured loss terms. The main drivers were SCS and wildfires in the US and Australia. In all regions where extreme weather events occurred, the experience was shaped by the complex interplay of natural-world phenomena, including climate change, and socio-economic trends.
Secondary and primary peril loss developments The term primary perils references catastrophes of larger scale, notably tropical cyclones, earthquakes and European winter storms. Events tend to be less frequent, but resulting losses can be extreme. We use secondary perils as an umbrella term for natural catastrophes that typically generate losses of low to medium magnitude, but that can happen relatively frequently. These include “independent secondary perils” such as SCS (including thunderstorms, hail and tornadoes), drought, wildfire, snow, flash floods and landslides. Primary perils can also trigger causally-linked consequential losses, for instance from heavy rains in the wake of a tropical cyclone, a storm surge induced by a winter storm, or fire outbreak after an earthquake. We consider these to be “secondary effects of primary perils” that also fall into the secondary perils bucket. Losses from primary and secondary perils have both risen continuously since 1970 (see Figure 1).
The largest annual insured loss total from independent secondary peril events – USD 62 billion – occurred in 2011, the year of devastating floods in Thailand and high-loss tornado outbreaks in the US. More recently, three of the four costliest secondary perils years occurred during 2017–2020. Primary perils are well-monitored risks and the re/insurance industry’s modelling capabilities of these exposures are strong. Their secondary effects, however, are not always fully captured. Likewise, independent secondary events are often also not fully monitored nor modelled. Given the rise of their associated losses in absolute terms, secondary perils need to be better understood for the purpose of more complete risk assessment and sustainable underwriting of natural catastrophe risks overall.
1 Unless otherwise stated in the text, all loss numbers in the report as inflation-adjusted.
Secondary perils are high frequency, low- to medium-severity events.
Figure 1 Annual primary and secondary peril insured losses since 1970 (USD billion) at 2020 prices, and share of secondary peril in total insured losses (five-years accumulated)
Source: Swiss Re Institute
0
25
50
75
100
125
150
175
20202015201020052000199519901985198019751970
0%
20%
40%
60%
80%
100%
Insu
red
loss
es
Seco
ndar
y pe
rils
shar
e
Independent secondary perils 5-years accumulatedPrimary perils Secondary perils share:Secondary effects of primary perilsInsured losses:
Primary perils are better understood than secondary peril risks.
Exploring the secondary perils universe

Swiss Re sigma No 1/2021 5
Absent primary, secondary peril events can lead to high-loss yearsFrom a hazard point of view, 2020 was extraordinary, affirming the significant threat that secondary perils present. Notwithstanding the impact on local communities, there were no major primary-peril loss events. Rather, there were many small and mid-size events, together making 2020 the fifth-costliest year on record, with insured losses for all natural catastrophes (primary + secondary perils) reaching USD 81 billion. Insured losses from secondary perils were over USD 57 billion, 71% of the total (see Figure 2). The main drivers were SCS and wildfires.
The wildfires presented the world with apocalyptic images from Australia and California of huge forests in flames, destroyed homes, and cities covered in smoke. Perhaps less visible, but no less substantial, were losses from SCS. Due to their ubiquity, short lives and small spatial scales, SCS rarely make international headlines. But, based on sigma data, together they have been responsible for more insurance damage than any other secondary peril since the 1970s. So too in 2020: while the fires in Australia burned, more than USD 1.6 billion in insured losses were generated by just two hailstorm events affecting the Sunshine Coast in Queensland, the Australian Capital Territory (ACT), and parts of New South Wales (NSW). And while western US was burning, 40 separate SCS events generated accumulated insured losses of well above USD 30 billion last year.
Rising secondary-peril losses: an interplay of factorsIn 2019/20, Australia experienced a series of weather events including extended bushfires, SCS and floods that resulted in one of the country’s most catastrophic seasons on record. Over the course of the fire season, more than 15 000 fires burned through nearly 19 million hectares (47 million acres) of land, destroying more than 3 000 houses and leaving 33 people as well as more than a billion animals dead.2 Bushfires burned from June 2019 through March 2020, most intensely from September 2019 – February 2020 (austral spring and summer) in NSW, ACT and Victoria. On 20 January, the ACT and parts of NSW were hit by SCS that spawned large, damaging hail. This was followed by a major East Coast Low that brought heavy rain to eastern NSW in early February, setting a new rainfall record in Sydney.3
2 A. I. Filkov, T. Ngo and S. Matthews, “Impact of Australia’s catastrophic 2019/20 bushfire season on communities and environment. Retrospective analysis and current trends”, Journal of Safety Science and Resilience, no 1, 2020.
3 East Coast Lows are extra-tropical low pressure systems that affect Australia’s southeast coast.
In 2020, 71% of all natural catastrophe losses resulted from secondary perils.
Since the 1970s, SCS have resulted in more insured damage than any other secondary peril.
Figure 2 Global insured losses from secondary perils by peril types since 1970, in USD billion at 2020 prices
Source: Swiss Re Institute
0
10
20
30
40
50
60
70
20202015201020052000199519901985198019751970
Severe convective storms Wildfires Other secondary Secondary effects of primary perilsFloods
Last year, Australia experienced severe bushfires, SCS and flooding.

6 Swiss Re sigma No 1/2021
Exploring the secondary perils universe
The experience provides insights into the various weather factors at complex interplay. A summer that saw high damage bills from the rapid succession of bushfires, hailstorms and floods in much of the same areas raises the question: was it an exceptional spring/summer? See Was Australia’s 2019/20 spring-summer season exceptional? for more on the climate conditions that led to the series of events, and the implications for underwriting.
Was Australia’s 2019/20 spring-summer season exceptional?Australia has been warming at a rate of approximately 1.44°C since 1910, with 2019 the hottest year on record.4 A trend of increasing number of days with dangerous weather conditions for bushfires has been reported across much of Australia since the 1950s, particularly in the south.5 By the spring of 2019, fire-prone Australia was also suffering its worst droughts ever. Against this backdrop of a warming trend, several climate drivers aligned to create conditions conducive for fire (high temperatures, low humidity and strong winds) that allowed large destructive blazes to spread rapidly through the dry vegetation in drought-affected lands.
As of June of 2019, the Indian Ocean Dipole (IOD) – an irregular oscillation of sea-surface temperatures in the Indian Ocean – entered a positive phase, resulting in reduced moisture in the local atmosphere and hot dry conditions over central and south-eastern Australia. The IOD strengthened over the course of spring and summer to exacerbate the fire conditions. Reinforcing the intensifying positive IOD signal, a second climate driver, the Southern Annular Mode (SAM) – defined by the position of the strong westerly wind belt surrounding the Antarctic – entered a strong negative phase in September, bringing westerly winds and more dry conditions to eastern Australia (see Figure 3). The combination of IOD and SAM phases fuelled an extraordinary bushfire season.
A third driver, El Niño–Southern Oscillation (ENSO), remained largely neutral through 2019, but conditions briefly approached El Niño thresholds in late spring-summer, further accentuating the IOD impact. The very combination of the climate drivers that caused the highly conducive bushfire conditions through January were also responsible for suppressing the usual spring and summer thunderstorm activity in eastern Australia. By mid-January 2020, both the IOD and SAM approached neutral phases. This allowed moist air from the Coral and the Tasman seas to track inland. A low-pressure system tracking over southeast Australia fed off this now-available moisture, causing ideal conditions of thunderstorms and hail.
In all likelihood, the damage due to the East Coast flooding and ACT hailstorm was exacerbated by the ongoing drought and fire season. Much of the vegetation in the drought- and fire-affected region was already weakened and therefore more susceptible to wind and hail damage. Outflow from the storm systems also stirred up massive dust clouds over the drought-affected land. The topsoil in the scorched and drought-ridden areas was less able to absorb a significant amount of rain in a short time span. The result was flash flooding after heavy rains.
4 State of the Climate 2020, Commonwealth Scientific and Industrial Research Organisation, 2020. 5 Ibid.
A number of factors contributed to the heavy loss tally.
The year was characterised by severe drought.
The coming together of different natural climatic phenomena…
…also generated conditions ideal for thunderstorms and hail.
The drought and fires exacerbated the damage from flooding and hail.

Swiss Re sigma No 1/2021 7
Implications for insurance Climate conditions help explain the physics leading to the weather event sequence. From the insurance perspective, important questions are: was the 2019/20 weather story in Australia a consequence of climate change, and was it an exceptional year? These questions cannot be answered with a definitive yes or no, but do raise important considerations for risk assessment and the pricing assumptions for standard natural catastrophe protection insurance covers.
There have been previous occurrences in Australia’s climate history of multiple extreme events coming together in clusters in highly variable and strong conditions (eg, in 2011). Severe weather events in Australia remain predominantly influenced by climate drivers like IOD, SAM and ENSO in the short term. As such, it is not easy to attribute a specific event or even an intensive natural catastrophe season to climate change. That said, long-term trends in risk factors like fire-inducing dry weather or extreme rainfall are very likely influenced by the rise in global temperatures.6 The spring-summer of 2019/20 was an extreme season with several climate signals feeding off each other. And, with climate change set to continue if no mitigating actions are taken, such seasons are less likely to be exceptional.
Secondary perils account for roughly 75% of insured losses in Australia. After a benign 2000–09, the last decade has seen an increased number of severe insurance losses, at AUD 1 billion or higher, many times in a single year across all secondary perils.7 Short-term climate signals and the effects of climate change alone do not explain this increase. Climate change loss-impacts are being compounded by increasing exposure and expanding cities in coastal areas and in the wilderness. What may previously been a small or even unnoticed natural disturbance can today lead to significant insured losses.
The socioeconomic factors, and short- and long-term climate drivers are here to stay, warranting careful reconsideration of commercially sustainable insurance offerings. Risk assessment needs to account for frequency and severity of individual perils as in a traditional natural catastrophe modelling. However, it also needs to explicitly consider the compounding effects of climate variability. These can trigger multiple and diverse secondary perils in the same season, adding significant annual variability to aggregate losses in underwriting. In view of dynamic nature of risk, taking a forward-looking stance versus averaging a multi-decadal past, is paramount.
6 Severe weather in a changing climate – 2nd ed, IAG, National Center for Atmospheric Research, 2020.7 Insurance Council of Australia.
Figure 3 Timeline of events against trends of various climate drivers
Sources: Bureau of Meteorology (for IOD and ENSO data), British Antarctic Survey (for SAM data), Insurance Council of Australia (for loss numbers), Swiss Re Institute
–5–4–3–2–1
01234567
May 2020Jan 2020Sep 2019May 2019Jan 2019
–1.5
–1.0
–0.5
0.0
0.5
1.0
1.5
2.0
2.5
SAM
ENSO
/IO
D
SAM ENSO IODClimate index: Jun 2019–Mar 2020
Bushfires: AUD 2.3 bn
Jan 20, 2020
ACT Hail: AUD 1.66 bn
Feb 7–10, 2020
East Coast Flood: AUD 0.97 bn
Events:
The 2019/20 spring-summer season in Australia brought many severe weather events.
Climate change cannot be cited as the driving cause.
Socio-economic factors also play a significant role.
Risk assessment should take a forward-looking stance of the multiple factor influencing losses.

8 Swiss Re sigma No 1/2021
What’s behind the growing scale of global wildfire losses?In 2020, wildfires triggered the third highest annual insured losses from this peril ever, after record seasons of 2017 and 2018. Most of the losses were in California. In recent years, annual losses from wildfire have been rising rapidly. Evaluated over 2016–2020, almost a quarter of all secondary peril insurance losses worldwide can be attributed to wildfire. This is unprecedented: before 2016, the share of this peril in losses averaged just above 3% and rarely exceeded 5–10% (see Figure 4).
2016 and 2020 are the warmest years on record,8 and new scientific evidence points to a lengthening in time of average fire seasons.9 This gives reason to believe that climate change is likely a significant factor in the growing scale of wildfire-related losses in different regions of the world, including in regions where fires have historically happened only rarely. However, it is not the only contributor. Also important is the parallel development of socio-economic trends such as rapidly growing exposure in areas adjacent or within undeveloped natural areas (the so-called “wildland-urban interface”), and sub-optimal fire management strategies that may have led to an increasing availability of natural biomass fuels.10
And flood risk?Figure 5 shows the accumulation of secondary peril insured losses over the last decade, by peril type and region. In Europe, South America and Asia, flooding was the main secondary peril. Or more specifically, river flooding, flash flooding and surface water flooding (which occurs when urban drainage systems are overwhelmed). At the global level, flooding represents 16% of all secondary peril insured losses in 2011–2020, according to sigma estimates. If floods resulting from hurricane- or typhoon-induced precipitation and storm surge are included, (ie, secondary effects of primary perils), the share increases to 20–25%, making it the number two contributing secondary peril of the last decade, after SCS and wildfires. However, due to lower insurance penetration, flood loss events tend to be under-reported.
8 Copernicus: 2020 warmest year on record for Europe; globally, 2020 ties with 2016 for warmest year recorded, European Centre for Medium-Range Weather Forecasts, 2021.
9 M. Goss, D. L. Swain, et. al. , “Climate change is increasing the likelihood of extreme autumn wildfire conditions across California,” Environmental Research Letters, vol. 15, 2020.
10 C. Kolden, “Wildfires: count lives and homes, not hectares burnt”, Nature, vol. 586, 2020.
2020 global insured losses from wildfire were the third highest ever.
Climate change plays a role in the rise of wildfire losses.
Figure 4 Global insured losses from wildfires, in USD billion at 2020 prices
Source: Swiss Re Institute
0
10
20
30
40
50
60
2011–20202001–20101991–20001981–1990
Insured losses from wildfires
2011–20152016
2017
2018
2019
2020*% of natcat insured losses
1981–2015
1.7%12.4%
2016–2020
*% of insured losses from secondary perils
1981–2015
3.3%
23.3%
2016–2020
Floods from precipitation and storm surges make up a quarter of secondary peril losses.
Exploring the secondary perils universe

Swiss Re sigma No 1/2021 9
While the upward trend of global flood losses has been less pronounced than that of wildfires and SCS, probably not least due to big investments in improved flood defences, research has demonstrated that about a third of the cumulative flood-related losses in the US can be attributed to precipitation changes in recent decades.11 Hence, the potential for a significant future increase must not be underestimated, considering the increasing water-holding capacity of the atmosphere in a warming climate, growing exposure in flood-exposed low-elevation coastal zones, and more and more surface being sealed in urban areas.12,13
Ground subsidenceSubsidence is the downward-settling of the ground’s surface. Human activity such as mining or over-farming, but also natural processes contribute to vertical ground motion. The main natural cause is severe drought conditions, which lead to pronounced seasonal reductions in soil moisture. Clay-rich soils in particular, can settle by several centimetres as they dry out. In effect, subsidence can in part be described as a secondary effect of a secondary peril.
Subsidence presents a major challenge for the insurance industry. Unlike, for example, a winter storm, which occurs in a limited time window and whose intensity is measurable, drought-induced ground motion is a slow process that takes place over a whole season and is almost invisible. Buildings with poor foundations that stand on subsiding grounds are at high risk and can suffer significant damage. Furthermore, the resulting property damage may not appear for many years. The combination of man-made and natural factors make loss assessment and attribution – and hence policy and insurance response – complicated (see Insuring subsidence: the French example).
11 F. V. Davenport, M. Burke and N. S. Diffenbaugh, “Contribution of historical precipitation change to US flood damages”, PNAS, vol. 118, 2021.
12 sigma 2/2020: Natural catastrophes in times of economic accumulation and climate change, Swiss Re Institute.
13 H. C. Winsemius, J. C. J. H. Aerts, L. P. H. van Beek et. al. “Global drivers of future river flood risk”, Nature Climate Change, vol. 6, 2016.
The increase in flood losses is likely in part due to changes in precipitation patterns.
Figure 5 Cumulative insured losses in 2011–2020 by secondary peril type, and primary peril totals, in USD billion at 2020 prices
Source: Swiss Re Institute
Severeconvective storms Floods Wildfires
Secondary effectsof primary perils Other secondary perils Primary perils
217.967.3 56.2 35.3 41.6
317.4
192.0
15.6
16.2
20.1
53.1
0.2
18.6
2.4
30.3
3.4
167.8
21.9
0.2 26.7 0.0 10.1 5.9
91.0
0.0 1.2 0.2 1.0 0.5
9.1
9.4 2.8 2.5 3.0 1.4
27.4
250Grand Total
250North America
25Europe
100Asia
7South America
25Oceania/Australia
Subsidence is downwards soil movement.
Drought is the main cause, but human actions compound the risk.

10 Swiss Re sigma No 1/2021
Insuring subsidence: the French exampleSubsidence risk has long been on the policy agenda in France, more so than in other markets. A national natural catastrophe insurance programme – CatNat – has covered property losses caused by subsidence since 1989. From 2016, inflation-corrected insured losses from subsidence have exceeded EUR 550 million each year (see Figure 6), with the average annual loss standing at EUR 810 million.14 That corresponds to about 45% of the annual CatNat premiums collected, making subsidence the costliest natural hazard in France.15 Compared with an average annual loss of EUR 310 million in 2000–2015, the sudden and persistent yearly explosion in claims post-2016 is puzzling.
A Swiss Re study in 2011 suggested that climate change would lead to more droughts and increasing subsidence losses in France. Considering the dry years of 2017–2019, it seems this prediction has been confirmed.16 That said, we would expect climate change influence to appear in a gradual upward trend of annual losses rather than a sudden, step-like increase. The loss pattern post-2016 suggests additional factors at play.
One of the drivers may be the French insurance scheme itself, a key feature of which is that claimants are compensated for subsidence losses only if their municipality has been awarded a so-called CatNat declaration.17 The mayor of each municipality must first request such a declaration, the grant of which is dependent on whether the region has experienced what is determined to be a drought, and if specific geological prerequisites are met. In recent years, there has been an increase in the number of municipalities requesting the declaration. In 2018 and 2019, of all requests, 23% came from first-time applicants (see Figure 7). This cannot be explained by an increase in drought conditions alone.18 It may also be due to increasing awareness of the possibility to receive compensation for subsidence losses.
We believe awareness of the opportunity to claim for subsidence losses will likely continue to rise. Of all municipalities, 62% have yet to request a CatNat declaration
14 Les catastrophes naturelles en France, Bilan 1982–2019, 2020, Caisse Centrale de Réassurance15 In 2018, EUR 1 649 million of CatNat premiums were collected in France, most as cover for flood,
subsidence, and earthquake risk. L’assurance des catastrophes naturelles en 2018, FFA, 2018.16 The hidden risks of climate change: An increase in property damage from soil subsidence in Europe,
Swiss Re, 2011.17 Based on pre-defined criteria, the French administration provides CatNat declarations to municipalities
that have been affected by a natural disaster.18 “arrêtés de catastrophe naturelle”, CCR, 2020.
France has had a nationwide insurance scheme for subsidence since 1989.
Figure 6 Annual insured losses from subsidence in France, EUR million
Source: Les catastrophes naturelles en France, Bilan 1982–2019, Caisse Centrale de Réassurance, 2020
0
500
1 000
1 500
2 000
Errorbar
CCR
mean loss 2016 - 19
mean loss 2000 - 15
2019201720152013201120092007200520032001
CCR 2000–2015 2016–2019Mean loss:Error range
Climate change will likely exacerbate soil subsidence…
…but recent spikes in insured losses are likely due to growing awareness of the nationwide scheme.
If climate conditions remain dry, claims will likely continue to rise.
Exploring the secondary perils universe

Swiss Re sigma No 1/2021 11
(grey areas in Figure 7). Assuming conditions remain dry, subsidence losses may well rise significantly in the coming years. Mitigation techniques, such as building codes, will only partially avoid rising losses in the mid-term, as only 1% of building stock is renewed each year. We believe more transparency to the scheme, where declarations are provided to all drought-affected regions rather than upon request, would help increase overall resilience in the long run. Shorter-term, this could lead to an explosion in claims costs, which would need to be managed with adjusted policy conditions and more elaborate criteria for CatNat declarations.
Subsidence risk and damage to property is gaining attention in other European countries, such as in the UK.19 However, insurance for subsidence is available as a bespoke cover only, meaning insurance claims have been lower than in France.
19 O. G. Pritchard et al., “Probabilistic soil moisture projections to assess Great Britain’s future clay-related subsidence hazard”, Climatic Change, vol 133, no 4, 2015.
Figure 7 Colour: year in which a municipality received a CatNat declaration for the first time (only years 2003–2019 considered) Grey: municipalities that have never received a declaration.
Source: Caisse Centrale de Réassurance
2018
2016
2014
2012
2010
2008
2006
2004
Elsewhere, subsidence insurance is available as bespoke cover.

12 Swiss Re sigma No 1/2021
High frequency, high intensityAccumulated over the past 10 years, according to sigma estimates more than 50% of the world’s insured secondary peril losses have come from SCS (thunderstorms, hail and tornadoes). In North America and Australia, SCS are the main loss-inducing secondary peril. In North America, the accumulated insured losses from SCS in 2011–2020 even exceeded those from all primary perils together (see Figure 5). In Europe, SCS account for the second largest secondary-peril losses, after flooding.
Convective storms, or thunderstorms, are frequently-observed violent weather events that develop when warm moisture-laden air rises from the surface of the earth into the upper layers of the troposphere. Intense updrafts lead to the formation of towering cumulonimbus clouds, lightning and thunder, while parcels of cool air (“downdrafts”) rush to the Earth’s surface, bringing powerful wind gusts, rain or even hail. Convective storms can form very rapidly. They are short-lived (they last just a few hours) and small-scale (spatial area of typically tens of kilometres).
About 50–80% of SCS losses result from hailstorms.20 Hail can develop when convective updrafts are strong enough to keep water droplets suspended for long enough in the cold upper troposphere, so that they freeze and expand by merging. Hailstorms occur most frequently in the continental interiors of the mid-latitudes. Their damage potential is linked to diameter and volume of hailstones, and factors such as surface wind speeds. When of 2–3 cm in diameter, hail stones can damage parts of buildings, glass structures and vehicles. Crops and fruit can be harmed by smaller hailstones.21 In extreme rare cases, hailstones can reach gargantuan dimensions of up to 20 cm, as observed on 8 February 2018 in Argentina.22
After hail, wind is the second main cause of damage from SCS, with two wind phenomena bearing particularly high-loss potential: tornadoes and derechos.
Tornadoes – violently rotating columns of air between a thunderstorm cloud-base and the Earth’s surface – generate extreme winds. Tornadoes occur most frequently in the midwestern and southern US, a region referred to as “Tornado Alley”. Often tornadoes appear in clusters and sequences. The highest-ever wind speed of 486 km/h was recorded in a tornado on 3 May 1999 in Oklahoma.23 While typically only a few hundreds of meters wide, tornadoes can leave damage tracks of more than 100 km length. The Enhanced Fujita (EF) tornado intensity scale classifies the damage potential in terms of wind speed. One of the worst sequences of tornado outbreaks occurred during 20–27 May 2011 in the US, with 241 confirmed tornadoes and a maximum rating of EF5, whipping up significant losses.
Derechos are long-lived and fast-moving clusters of severe thunderstorms, characterised by strong straight-line winds that can reach hurricane strength. Last year, a derecho in the Midwest in August was the costliest SCS event of the year in the US, resulting in insured losses of USD 7 billion.
20 Severe convective storms: Evolving risks call for innovation to reduce costs, drive resilience, Insurance Information Institute, 2020.
21 TORRO Hail Scale, The Tornado & Storm Research Organisation, 2020.22 M. R. Kumjian, R. Gutierrez, J. S. Soderholm et. al., “Gargantuan Hail in Argentina”, Bulletin of the
American Meteorological Society, 2020.23 Highest recorded wind speed in tornado (via Doppler Radar), Arizona State University, 2020.
Severe convective storms (SCS) happen all over the world, with high frequency and often high intensity. In 2011–20, SCS accounted for more than half of accumulated global insured losses resulting from all secondary peril events. As with other secondary perils, a combination of factors is contributing to the trend of rising losses. The short lives and localised spatial scales of SCS poses event recording challenges. Modern observation tools such as satellite imagery and remote sensing are more informative when complemented by on-the-ground witness. The monitoring of hazards at local, national and region level and the sharing of findings facilitate better understanding and pricing of SCS risks.
In the last 10 years, SCS have contributed more than half of global insured losses from secondary perils.
SCS are short-lived and small-scale, but often with extreme intensity.
Hailstorms generate most SCS-associated losses...
…followed by tornadoes and derechos.
Deep dive: severe convective storms

Swiss Re sigma No 1/2021 13
Severe convective storm losses in key marketsMost insurance losses from SCS have originated in North America. In 2011–2020, annual losses averaged USD 19 billion, and in no year less than USD 10 billion. The SCS losses in Europe (average annual loss USD 1.5 billion) and Australia (USD 0.9 billion) over the same period were significantly lower. That said, the number and severity of SCS insurance loss events has been rising in all regions, with 2020 an all-time high both in North America and Australia (see Figure 8).
In North America, the increasing insurance loss trend has been relatively steady, due to its wide geographic extent and high number of events. Annual loss amounts correlate closely with the annual event counts, underscoring the notion of SCS being a frequency peril.
In Australia, a smaller continent with fewer events per year, the year-to-year variability of annual losses is correspondingly higher. Here 2010 sticks out as a watershed: since then, annual insured hailstorm losses on average have exceeded USD 1 billion every second year. That happened only once previously, when the “Sydney Hailstorm” of 1999 led to insured losses of USD 1.9 billion.24
In Europe, recent-year losses from SCS have been benign relative to the heavy damages in 2013 from hailstorms Bernd and Andreas in Germany, and the “2014 Pentecost weekend storms” (also known as convective storm “Ela”) in France, Germany and Belgium. However, the number of severe hail events has been increasing since then, suggesting that SCS-associated losses in Europe may also rise in the coming years.
24 The Insurance Council of Australia estimates that if this storm were to repeat itself today, it would result in an insured loss of more than 4 billion USD 2020. K. Sullivan “ 1. Sydney Hailstorm $5.6B (1999)”, icadataglobe.com, 16 April 2020.
SCS losses are highest in North America, but are rising elsewhere too.
Figure 8 Annual insurance losses (bars) and event numbers (dots) from SCS per region, in USD billions, at 2020 prices
Source: Swiss Re Institute
0
10
20
30
40
50
20202016
20122008
20042000
19961992
North America
0
2
4
6
8
10
20202016
20122008
20042000
19961992
Europe
0.0
0.5
1.0
1.5
2.0
2.5
3.0
20202016
20122008
20042000
19961992
Australia/Oceania
Annual insurance losses Event numbers

14 Swiss Re sigma No 1/2021
You only see them when you look at them Do the strong loss trends from SCS imply that the hazard per se has been increasing? Difficult to say, given the lack of spatially and temporally homogeneous historic data needed to characterise the hazard statistics.25,26 While tornado and hailstorm occurrence has been reported for many decades across the US,27 Europe28 and Australia,29 longer-back history events could only be documented when someone was literally in place when and where events occurred. With small spatial extent and short duration, many SCS likely remain unrecorded when hitting unpopulated areas. And unlike tropical cyclones, hailstorms and tornadoes are far more difficult to detect and quantify from satellites. This “observation bias” is evident in Figure 9, showing that the frequency of observed severe hailstorms in the US (from 1955–2019 NOAA Storm Prediction Center hail reports) has been highest in urban areas, although this is likely indicative of a high number of observers rather than more storm activity.
Changes in observational and reporting practice over time have added complexities. For example, with the introduction of Doppler weather radars and the expansion of the network of tornado spotters in the 1990s, the number of reported tornadoes has increased significantly.30 And, while modern remote sensing/weather modelling techniques help improve the spatial coverage of event detection, classifying event severity remains a challenge without complementary ground observations.31
25 J. T. Allen and M. K. Tippett, “The characteristics of United States hail reports: 1955–2014”, Electronic Journal of Severe Storms Meteorology, vol. 10, no. 3, pp 1–31, 2015.
26 A. F. Prein and G. J. Holland, “Global estimates of damaging hail hazard”, Weather and Climate Extremes, vol. 22, pp 10–23, 2018.
27 SPC, NOAA Storm Prediction Center, 2020.28 ESWD, European Severe Weather Database 2020.29 Severe Storms Archive, Bureau of Meteorology, 2020.30 D. McCarthy and J. Schaefer, “Tornado trends over the past 30 years”, Preprints, 14th Conference on
Applied Meteorology, 2004.31 T. Púcik, C. Castellano, P. Groenemeijer et. al., “Large hail incidence and its economic and societal
impacts across Europe”, Monthly Weather Review, vol. 147, 2019.
Observation bias hinders climatological analysis of SCS…
…even with the advent of remote sensing techniques.
Figure 9 Annual frequency of storms where hail size has exceeded 2 inches (= 5 cm) per 15x15 square miles (= 24 x 24 square km) in the US, 1955–2019
Source: NOAA Storm Prediction Center hail reports, Swiss Re
DenverKansas City
Wichita
Oklahoma City
Dallas
<= 0.05
0.05–0.1
0.1–0.2
0.2–0.3
0.3–0.4
0.4–0.5
0.5–0.75
0.75–1
1.0–1.25
>1.25
Deep dive: severe convective storms in focus

Swiss Re sigma No 1/2021 15
Despite this statistical fog, recent research suggests that average tornado power has increased by around 5.5% per year over the past decade in the US,32 with an increasing frequency of extreme outbreaks with many tornadoes.33 For hail, it has been shown that in central and eastern regions of the US, the coming together of environmental conditions conducive to large hail formation has become more frequent since 1979.34 And preliminary analysis of radar observations in Eastern Australia suggest a possibly increased frequency of damaging hailstorms across the major urban areas,35 although scientific consensus has not yet been reached.36
It is not yet clear whether these trends reflect climate change or natural variability. However, scientific evidence is growing that climate change will influence SCS activity in the coming decades, with anticipated changes in the seasonality and local characteristics of storms. Recent model-based studies suggest that the frequency of large hail events may increase in North America37,38 and Europe,39 but uncertainties remain high. As with other secondary perils, climate change alone does not explain the increase in SCS loss trends. Socio-economic trends are also important factors.
The role of economic growth and urbanisationIn the US, inflation-adjusted annual economic losses from SCS have increased by about 6.0% per year since 2000, and insured losses by 6.4%. At least half of the rise can be explained by the combined effects of economic growth and urbanisation.40 The remaining loss trend drivers include potential changes in convective storm activity and as other socio-economic and vulnerability trends, which can be geographically heterogeneous and difficult to detect without granular claims data.
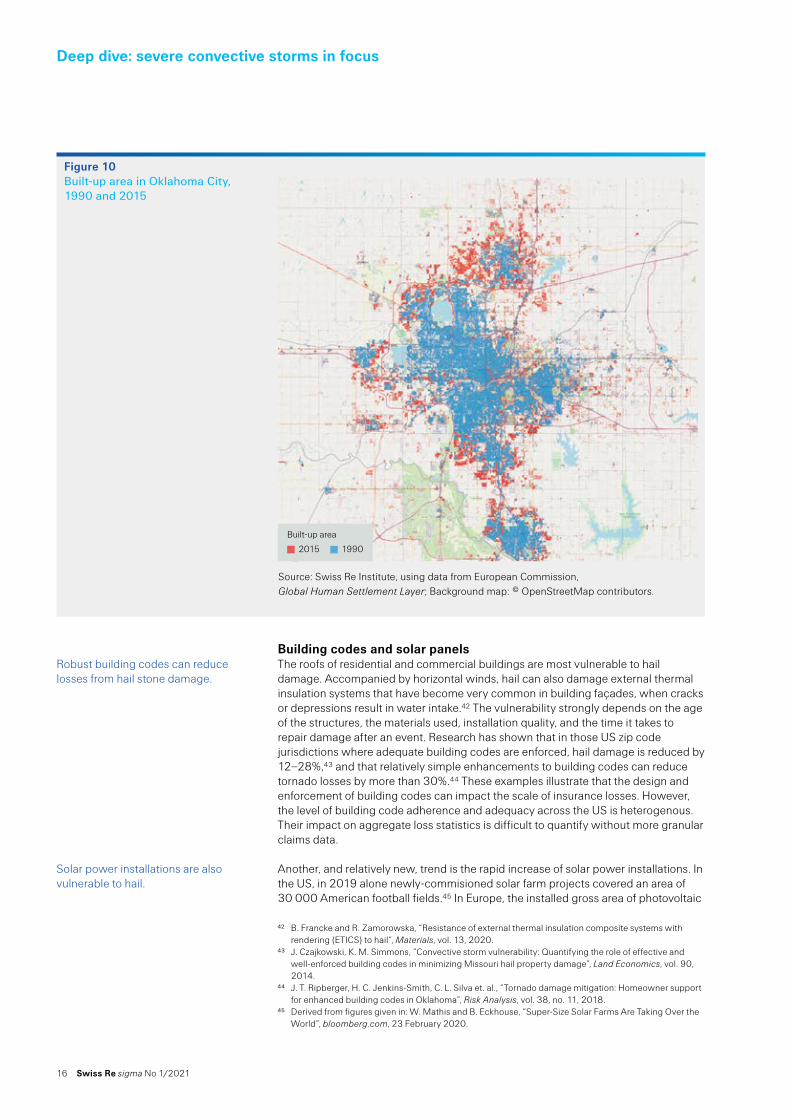
Over the past decades, the area of built-up land has increased due to migration trends and urban sprawl (see Figure 10 showing Oklahoma City). Satellite data reveal that the area of built-up land in the US has increased by about 50% between 1990 and 2015, and by even around 60% in the Midwest and south (those areas of the US that are particularly prone to hail and tornado events).41 This corresponds to an annual increase of about 2%. For small-scale phenomena like SCS, an increase in built-up areas should also lead to an increase in the number of higher loss events, as storms are more likely to strike areas of asset value concentration, be that buildings, infrastructure or vehicles. During the past two decades, the average annual number of loss-generating SCS events in North America has risen by about 2.3% per year. This can in part be explained by land use changes, as previously unused lands have become habited, built on and/or put to economic use.
32 J. B. Elsner, T. Fricker and Z. Schroder, “Increasingly powerful tornadoes in the United States,” Geophysical Research Letters, vol. 46, 2019.
33 M. K. Tippett, C. Lepore and J. E. Cohen, “More tornadoes in the most extreme U.S. tornado outbreaks”, Science, vol. 354, 2016.
34 B. H. Tang, V. A. Gensini and C. R. Homeyer, “Trends in United States large hail environments and observations”, NPJ Climate and Atmospheric Science, vol. 45, 2019.
35 IAG and National Center for Atmospheric Research, 2020, op. cit.36 H. Raupach, O. Martius, J. T. Allen, et. al., “The effects of climate change on hailstorms”, Nature Reviews
Earth and Environment, 2021.37 J. C. Brimelow, W. R. Burrows and J. M. Hanesiak, “The changing hail threat over North America in
response to anthropogenic climate change”, Nature Climate Change , vol. 7, pp 516–522, 2017.38 R. J. Trapp, K. A. Hoogewind and S. Lasher-Trapp, “Future changes in hail occurrence in the United
States determined through convection-permitting dynamical downscaling”, vol. 32, Journal of Climate, 2019.
39 A. T. Rädler, P. H. Groenemeijer, E. Faust et. al. “Frequency of severe thunderstorms across Europe expected to increase in the 21st century due to rising instability”, NPJ Climate and Atmospheric Science, vol. 2, 2019.
40 See sigma 2/2020, op. cit.41 Data from Global Human Settlement Layer, European Commission.
There is growing evidence of hazard intensification…
…but uncertainties remain high due to the influence of natural climate variability and other factors.
Economic growth and urbanisation can explain more than 50% of the observed loss trends…
…and the increase in built-up land implies more insured-loss events.
16 Swiss Re sigma No 1/2021
Building codes and solar panels The roofs of residential and commercial buildings are most vulnerable to hail damage. Accompanied by horizontal winds, hail can also damage external thermal insulation systems that have become very common in building façades, when cracks or depressions result in water intake.42 The vulnerability strongly depends on the age of the structures, the materials used, installation quality, and the time it takes to repair damage after an event. Research has shown that in those US zip code jurisdictions where adequate building codes are enforced, hail damage is reduced by 12–28%,43 and that relatively simple enhancements to building codes can reduce tornado losses by more than 30%.44 These examples illustrate that the design and enforcement of building codes can impact the scale of insurance losses. However, the level of building code adherence and adequacy across the US is heterogenous. Their impact on aggregate loss statistics is difficult to quantify without more granular claims data.
Another, and relatively new, trend is the rapid increase of solar power installations. In the US, in 2019 alone newly-commisioned solar farm projects covered an area of 30 000 American football fields.45 In Europe, the installed gross area of photovoltaic
42 B. Francke and R. Zamorowska, “Resistance of external thermal insulation composite systems with rendering (ETICS) to hail”, Materials, vol. 13, 2020.
43 J. Czajkowski, K. M. Simmons, “Convective storm vulnerability: Quantifying the role of effective and well-enforced building codes in minimizing Missouri hail property damage”, Land Economics, vol. 90, 2014.
44 J. T. Ripberger, H. C. Jenkins-Smith, C. L. Silva et. al., “Tornado damage mitigation: Homeowner support for enhanced building codes in Oklahoma”, Risk Analysis, vol. 38, no. 11, 2018.
45 Derived from figures given in: W. Mathis and B. Eckhouse, “Super-Size Solar Farms Are Taking Over the World”, bloomberg.com, 23 February 2020.
Figure 10 Built-up area in Oklahoma City, 1990 and 2015
Source: Swiss Re Institute, using data from European Commission, Global Human Settlement Layer; Background map: © OpenStreetMap contributors.
Built-up area
2015 1990
Robust building codes can reduce losses from hail stone damage.
Solar power installations are also vulnerable to hail.
Deep dive: severe convective storms in focus

Swiss Re sigma No 1/2021 17
thermal collectors has risen by 25% in just three years.46 The solar panel market is still relatively new, and standards and regulations on the quality and installation not yet well formulated.47 While generally being designed to withstand moderate hail impact, severe events with hailstone diameters exceeding 3 cm can generate deformations and microcracks. These may not be immediately visible but they can destroy the functionality of a panel entirely. Associated insurance claims can be huge. For example, in May 2019 a single hailstorm generated a USD 70 million insurance payout for a Texas solar farm.48 Solar energy is a key technology of the move to a low-carbon economy. The vulnerability of solar panels to SCS, in terms of loss potential, is an area where the insurance sector can play an important role in helping society mitigate the effects of climate change.
46 W. Weiss and M. Spörk-Dür, “Solar heat worldwide, edition 2020”, Solar heating & cooling programme, International Energy Agency, 2020.
47 T. S. Teule, M. Appeldoorn, P. Bosma et. al., “The vulnerability of solar panels to hail”, Vrije Universiteit Amsterdam, 2019.
48 “Extreme weather causes surge in solar power insurance costs”, Financial Times 14 Dec 2020.

18 Swiss Re sigma No 1/2021
Primary and secondary perils, and the way forward
Don’t forget about primary-peril risksAccording to sigma records, from 1970 total (primary + secondary peril) annual insured losses exceeded USD 80 billion in only six years, all since 2005. Losses were highest when large primary perils events occurred, the peak-loss years being 2017 (Hurricanes Harvey, Irma, Maria), 2011 (earthquakes in Japan and New Zealand, flood in Thailand), 2005 (Hurricanes Katrina, Wilma, Rita) and 2012 (Hurricane Sandy). There has been a growing contribution of secondary perils to total losses in off-peak years, notably in 2018 and 2020. More than 50% of all catastrophe-related insured losses in 2016–2020 were from secondary perils. In 2020 alone, the share of secondary-related was more than 70% of total losses.
However, this does not mean secondary perils are becoming primary loss drivers. Over the past decades, the contribution of secondary perils to total annual insurance losses has fluctuated between 20–90%, without a clear trend in either direction. In years like 2020, secondary perils have been in the spotlight, but this is no reason to believe that peak primary-peril loss events will not occur again. Since 1970, losses from both peril groups have been accumulating more or less in sync (see Figure 11). And while secondary peril losses have accumulated faster in specific years, history shows that it can take just a few peak-event strikes to demonstrate the very large magnitude of losses that primary peril risk poses, as in the case of Hurricanes Katrina, Wilma and Rita in 2005.
Insured losses from primary and secondary perils have been on an upward trajectory since 1970. In the last decade, in years absent major losses from primary perils, accumulated losses from secondary perils alone have been high, 2020 being a case in point. The risk trends impacting both peril types remain the same, and rising losses from secondary perils are a warning that future peak-loss scenarios could also grow significantly. However, insurance industry risk knowledge of secondary perils lags that of primary perils. Better understanding of the complex interplay of factors influencing secondary peril event losses – natural and socio-economic – is essential to improve modelling capabilities and better inform forward-looking risk mitigation decisions.
Losses from secondary peril have been rising….
...but the huge loss potential from primary peril strikes remains an ever-present danger.
Figure 11 Cumulative insured losses from primary and secondary perils since 1970, in USD billion at 2020 prices
Source: Swiss Re Institute
0
200
400
600
800
1 000
20202015201020052000199519901985198019751970
Primary perils Secondary perils

Swiss Re sigma No 1/2021 19
Primary and secondary peril losses are affected by the same risk trends, including rapid population growth, increasing property values in exposed regions, and the effects of climate change.49 Absent insured damage from primary peril events, rising losses from secondary perils should be taken as a warning sign that future peak-loss scenarios could also grow significantly. For example, in 2005, insured losses from Hurricanes Katrina, Rita and Wilma were close to USD 120 billion, without precedent at the time. As the same risk trends affect both primary and secondary perils, the implication is that in the future, in a year with, for example, a peak-loss inducing hurricane season and multiple secondary-peril event occurrence, total insured losses could be as high as USD 250–300 billion. The underlying risks have not changed: it is just a question of time before such a severe scenario plays out in reality. The 2020 North Atlantic hurricane season was actually very active, with 30 named storms, a record high.50 It was just by chance that the storms did not strike areas of high population and economic value concentration.
The 2020 North Atlantic hurricane season: a trail of broken recordsFuelled by extremely warm water temperatures, the 2020 North Atlantic hurricane season was record-setting for the number of named storms (30; the previous record was 28 in 2005), landfalls on the US coastline (12; previous record was nine (1916)). Nicaragua was hit by two hurricanes (Category 4 Eta and Category 5 Iota, one of the strongest ever to hit the country) in quick succession in roughly the same region.
Overall insured losses, though, were moderate (USD 21 billion) relative to the 2005 and 2017 seasons, owing to the landfall location of some of the major storms. While devastation was significant in Nicaragua, Honduras and Guatemala, as well as parts of coastal Louisiana in the US (battered by five storms (Cristobal, Laura, Marco, Delta and Zeta), another record), overall insured losses from the season could have been much more severe. This is because the most intense storms struck Central America, a region with low insurance penetration, while the hurricanes striking the US mostly made landfall in regions of less population and exposure. A less favourable occurrence pattern (storm track and landfall location on coastal stretches with higher value concentration) can happen in any year. As the experience of Hurricane Andrew in 1992 confirms, it can take just one severe event to inflict untold damage.
49 sigma 2/2020, op. cit.50 M. Bertogg, “Why hurricane risk modelling has to change”, swissre.com, 6 January 2021.
Rising losses from secondary perils are a reminder that future peak loss scenarios could grow significantly.
The 2020 North America hurricane season had a record number of named storms.
However, landfall location moderated the resulting insurance losses.
Figure 12 North Atlantic hurricane season insured losses (USD bn), 2020 prices
Source: Swiss Re Institute
0
20
40
60
80
100
120
20202015201020052000199519901985
10
15
20
25
30
35
Insu
red
loss
es
No
of n
amed
sto
rmes
HugoAndrew Ivan
Charley
Ike
Gustav Florence
Michael
IsaiasSallyLaura
Dorian
Sandy Maria
Isaac Irma
Harvey
Francis
Katrina
Wilma
Rita
Costliest hurricane 3rd costliest hurricane Other hurricane losses No of named storms2nd costliest hurricaneInsured losses:

20 Swiss Re sigma No 1/2021
Primary and secondary perils, and the way forward
Even though insured losses from hurricanes Eta and Iota in Central America were low (an estimated USD 0.4 to USD 0.6 billion, respectively, mostly resulting from industrial and commercial assets), the devastation wreaked was severe. The economic losses were USD 3.5 billion, pointing to a large protection gap, particularly for homeowners. A lack of robust models with sufficient granularity, and incomplete data on the precise footprints for both hurricane events, highlight the uncertainties in the loss quantification for the region. In addition, the short time between the two events (within weeks of one another), prevented loss adjusters from completing their investigation into Eta.
The way forwardAgainst a background of dynamic socio-economic trends and climate change, we expect that economic losses from primary and secondary perils will continue to rise. In this environment, the re/insurance industry will have an increasing responsibility to strengthen global resilience through effective risk transfer solutions. This necessitates improved understanding of the full range of the natural catastrophe exposures facing the world. To be able to provide sustainable coverage, re/insurers need to maintain balance sheet strength and to this end, deepen their understanding of all present-day risks.
As last years’ experience in Central America shows, it is important to continue focus on an adequate risk modelling in areas exposed to primary peril risks, and where insurance penetration remains low. This will be even more necessary as climate change turns up the heat in this region and elsewhere. It is essential to increase granularity in claims reporting to analyse the drivers for new trends. However, more research attention to secondary peril risks is also critical. Primary perils are well monitored by the re/insurance industry, and modelling capabilities are strong. Often, however, secondary peril events are not fully monitored nor modelled. Given the rise of their associated losses, secondary perils need to be better understood for the purpose of more complete risk assessment of the full range of natural catastrophe exposures that society and global economy faces. To this end, we identify the following as key insurance sector calls-to-action:
Make secondary peril risk knowledge a priority topic. Historically, re/insurers have focused on primary perils, with good reason given the huge volatility and magnitudes of peak losses, and their impact on solvency capital. However, in view of the growing prominence of secondary peril-events and associated losses, more attention on this risk set is needed. With accumulating economic wealth, growing populations and climate change effects, property values in exposed regions are growing. The industry needs to act now to fully capture secondary peril risk assessment in re/insurance pricing.
Improve modelling capabilities. The industry’s capability for modelling secondary peril risks remains limited. For some perils such as flood and SCS, probabilistic models do exist and have been improving. Advances in computer technology now allow for simulations in unprecedented resolution, and machine-learning techniques combined with high-resolution satellite imagery are increasingly being used to fill data gaps. For other secondary perils, however, models are still in their infancy. Wildfire risk is particularly challenging on account of man-made and natural factors that need to be considered.
Include forward-looking information in risk assessment. With a steep increase in severity and frequency trends, even sophisticated models can return biased risk estimates when calibrated against historic loss statistics. That is because the latter are not always a suitable proxy for present-day conditions. Secondary perils have repeatedly shown to be full of surprises in this context. For example, wildfire losses in California, and subsidence losses in France, have increased dramatically since 2015, suggesting that loss models based on
Hurricanes Eta and Iota are a reminder of the large protection gap in Central America.
Deeper understanding of all present-day natural catastrophe risks is needed.
The re/insurance industry can help to rebalance efforts to develop better modelling capabilities for the factors influencing secondary peril risks.

Swiss Re sigma No 1/2021 21
pre-2015 data would underestimate the risk and overestimate margins. Re/insurers need to systematically assess the representativeness of historic loss data, identify potential statistical regime changes, keep abreast of latest scientific findings, and include forward-looking views in risk assessment.
Support open-source loss modelling frameworks. The development of natural catastrophe models is driven by a select few specialised modelling firms and re/insurers with typically global focus. Wider acceptance of standardised data formats for claims and exposures, and stronger support for open source loss modelling frameworks like OASIS,51 could boost the establishment of new and regionally better-anchored model development firms, closer to emerging local trends. This would accelerate the creation of new tailored risk assessment tools and facilitate smoother integration of the latest academic research into the model development process. Such actions would also advance local mitigation and adaptation efforts in regions of under-insurance to primary peril risks.
Monitor claims in more granularity and share data where permissible. Secondary perils are often not yet well monitored. In many markets, claims reports and loss statistics, whether from government agencies, insurers or insurance associations, still lack the granularity and historic consistency needed to judge premium rate adequacy for specific secondary perils, and to identify emerging or changing loss patterns early enough. Access to detailed claims statistics is also an indispensable component in the model building process. This will become more relevant as climate change effects manifest. A better ability to detect trends and to adjust risk premiums, for primary peril exposures too, will support the sustainability of the insurance risk transfer model. However, care needs to be taken to ensure that sharing of industry data is in compliance with competition and antitrust laws.
Understand inter-peril correlations. The increasing frequency of small- to medium-sized losses can leave insurers unprotected when per-event triggers for reinsurance cession are not reached. This could lead to increased demand for frequency risk and aggregate excess reinsurance covers. Adequate costing of such aggregate structures requires an understanding of the clustering statistics of individual secondary perils, as well as inter-dependencies with other perils. For example, in Australia the expected number of tropical cyclones making landfall, and the probability of flooding events on the Eastern coast, increase during La Niña years, and taper off during El Niño. Bushfire risk, meanwhile, follows the reverse pattern. Individual perils cannot be assumed to be independent of one another. There is a need for better understanding of the interplays – including of socio-economic trends – for adequate risk assessment.
51 OASIS loss modelling framework: https://oasislmf.org/

22 Swiss Re sigma No 1/2021
Appendix 1: 2020 – the year in review
A year of secondary-peril recordsGlobal insured losses in 2020 were USD 89 billion, the fifth highest for any one year on sigma records. That was significantly more than the USD 63 billion in losses in 2019 and also above the previous 10-year average of USD 79 billion (and median of USD 62 billion). 2020 was the fourth year in a row that losses topped USD 60 billion. Aggregate secondary peril losses were USD 56 billion, of which SCS accounted for 57%. In the US, a record number of SCS led to the highest insured losses ever for this hazard, despite a relatively low number of tornadoes. With resulting losses of USD 7 billion, the August derecho storm in Midwest US was the third-costliest event for this peril ever. Australia also suffered its highest ever SCS-related losses (more than USD 2.6 billion), mostly from hail.
Extreme high temperatures in western US, combined with unusual lightning activity and drought conditions, resulted in a record number of wildfire outbreaks (17). The outbreaks encroached onto populated areas and, with an accumulated area of 16 000 square kilometres in flames, US insured losses for this peril were the third highest ever recorded. Elsewhere, at the beginning of the year Australia was still suffering the tail end of a catastrophic 2019–20 bushfire season, the most damaging and costly on record. Both fire and convective storms were augmented by drought.
The rest of the world saw lower insured losses in 2020, in relative terms. India, Bangladesh, Nepal, China and Pakistan all suffered heavy floods following intense monsoon rains. In China, the worst flooding along the Yangtze River for decades occurred in June, killing hundreds of people, destroying cropland, and testing the limits of the Three Gorges Dam. Insured losses were more than USD 2 billion, the second costliest flood event ever in Asia.
Man-made lossesThe number of man-made events fell to one of its lowest levels in 2020, reflecting the reduced economic activity and mobility due to lockdowns imposed to curb the spread of COVID-19. Even so, man-made losses were on par with 2019, owing to two large events, the Beirut explosion (see The 2020 Beirut explosion) and riots in the US that led to property damage across 24 states.
The 2020 Beirut explosionOn 4 August 2020, a massive explosion at the port of Beirut, Lebanon ripped through the densely populated city, killing around 200 people and causing large-scale damage to the docklands and surrounding neighbourhoods. The explosion was caused by the detonation of an estimated 2 750 tonnes of high-density ammonium nitrate, a compound used to make fertilisers and explosives, stored in a warehouse. The blast struck with the force of a 3.5 magnitude earthquake. It was heard and felt in Cyprus, more than 200km away.52 It is believed to be one of the biggest non-nuclear explosions in history, and the largest single recorded explosion ever to occur in the Middle East.53
Reconstruction will take years. The World Bank estimates the overall physical damage in the range of USD 3.8–4.6 billion, and further economic losses ranging between USD 2.9–3.5 billion given that the district impacted is an industrial and commercial hub.54 According to the World Bank, Beirut port is Lebanon’s main point of entry/exit, processing 68% (2011–2018 average) of the country’s total external trade. The full impact for re/insurers will depend on whether investigation determines if the cause is an act of war, a terrorist attack or an accident. Swiss Re
52 “Beirut explosion: Claims considerations”, Middle East Insurance Review, October 2020. 53 Beirut explosion was one of the largest non-nuclear blasts in history, new analysis shows, The
University of Sheffield, 2020.54 Beirut Rapid Damage and Needs Assessment, World Bank, 2020.
Insured losses in 2020 were driven mostly by secondary perils, in particular SCS and wildfires.
Global wildfires losses were the third highest ever.
Flooding in China was the second-costliest flood ever in Asia.
The number of man-made losses decreased, with the COVID-19 lockdown response measures curtailing economic activity.
An explosion at a warehouse in the port of Beirut triggered shock waves felt more than 200km away.
It caused large-scale devastation in Beirut and around 200 deaths.

Swiss Re sigma No 1/2021 23
estimates the losses at around USD 1.5 billion, mostly from property damage and also liability insurance.
As with the similar explosion incidents at a storage and distribution facility in West Texas in 2013, and at the port of Tianjin in China in 2015, the Beirut blast is a stark reminder of the risk that long-term storage of ammonium nitrate poses. Ammonium nitrate is used in the production of many goods and can be found in ports, warehouses and other logistical facilities across the world. The explosive risks are well known to manufacturers, but less so to agents in transport and storage. When properly stored – away from combustible materials or any other sensitisers; outside or in well segregated and ventilated facilities; away from where people live and work – ammonium nitrate does not represent a hazard. Loss history shows no explosion incidents where it had been stored away from combustible materials.
Facts and figuresNumber of catastrophic events: 274In terms of sigma criteria, there were 274 catastrophes worldwide in 2020, down from 321 in 2019. There were 189 natural peril and 85 man-made disasters.
The blast calls for renewed attention on safe handling and storage of dangerous goods.
Figure 13 Number of catastrophic events, 1970–2020
Source: Swiss Re Institute
0
50
100
150
200
250
300
Man-made disasters
Natural catastrophes
20202015201020052000199519901985198019751970
Man-made disasters Natural catastrophes
189
85

24 Swiss Re sigma No 1/2021
Appendix 1: 2020 – the year in review
Number of victims: close to 8 000Worldwide, 7 993 people are believed to have died or gone missing in disaster events in 2020, one of the lowest ever in a single year on sigma records. Natural catastrophes claimed roughly 6 000 victims, and man-made disasters over 2 000.
Figure 14 Number of victims, 1970–2020
Note: Scale is logarithmic: the number of victims increases tenfold per band.
Source: Swiss Re Institute
20202015201020052000199519901985198019751970
Man-made disasters Natural catastrophes
1 000
10 000
100 000
1 000 000
10 000 000
5 804
2 189
1 23
4 5 6
7 8
! Kommentar:Skalierung ist loga-rhytmisch, dahermit vektorisiertem Diagramm stattmit AI-Diagrammgelöst
1. 1970: Bangladesh storm, Peru earthquake
2. 1976: Tangshan earthquake, China
3. 1991: Cyclone Gorky, Bangladesh
4. 2004: Indian Ocean earthquake and tsunami
5. 2008: Cyclone Nargis, Myanmar
6. 2010: Haiti earthquake
7. 2013: Typhoon Haiyan, Philippines
8. 2015: Earthquake in Nepal
Figure 15 Insured catastrophe losses, 1970–2020, in USD billion at 2020 prices
Source: Swiss Re Institute
0
20
40
60
80
100
120
140
160
180
Man-made disasters
Weather-related catastrophes
Earthquake/tsunami
20202015201020052000199519901985198019751970
Earthquake/tsunami Weather-related catastrophes Man-made disasters
1 2 3
4
5
6 7
8
911 12
10
1. 1992: Hurricane Andrew
2. 1999: Winter Storm Lothar
3. 2001: 9/11 attacks
4. 2004: Hurricanes Ivan, Charley, Frances
5. 2005: Hurricanes Katrina, Rita, Wilma
6. 2008: Hurricanes Ike, Gustav
7. 2010: Chile, New Zealand earthquakes
8. 2011: Japan. NZ earthquakes, Thailand flood
9. 2012: Hurricane Sandy
10. 2017: Hurricanes Harvey, Irma, Maria
11. 2018: Camp Fire, Typhoon Jebi
12. 2020: Hurricane Laura, wildfires

Swiss Re sigma No 1/2021 25
Total economic losses: USD 202 billion Total economic losses from disasters globally were an estimated USD 202 billion in 2020, up from USD 150 billion in 2019, with around USD 190 billion resulting from natural catastrophes and the remainder from man-made events.
Global catastrophe protection gap: USD 113 billionFigure 16 shows the difference between economic and insured losses over time, the insurance protection gap. It is the financial loss generated by catastrophes not covered by insurance. In 2020, the global protection gap was around USD 113 billion, up from 87 in 2019, but down from the previous 10-year average of USD 143 billion.
Table 1 Economic losses, in USD billion and as a % of global GDP, 2020
*rounded numbers, **inflation adjusted Source: Swiss Re Institute.
Regions in USD bn* in % of GDP
North America 105 0.46%
Latin America & Caribbean 2 0.05%
Europe 18 0.08%
Africa 1 0.06%
Asia 71 0.22%
Oceania/Australia 5 0.31%
Seas/Space 0 0.00%
Total 202
World average 0.24%
10-y average** 222 0.26%
Figure 16 Insured vs uninsured losses, 1970–2020, in USD billion at 2020 prices
Economic losses = insured + uninsured losses Source: Swiss Re Institute
0
100
200
300
400
500
20202015201020052000199519901985198019751970
Insured losses Uninsured losses 10-year moving average insured losses 10-year moving average economic losses

26 Swiss Re sigma No 1/2021
Appendix 1: 2020 – the year in review
Exposure accumulation and rising lossesWe estimate that the annual growth rate of normalised losses from natural catastrophes between 1970 and 2020 was roughly 1.3%, still increasing but at much slower rate than shown by uninflated losses (8.7%) and also real (adjusted for inflation) losses (5%) over the same time period. Normalisation adjusts to show that an event in the past, if it were to occur at the same magnitude today, would cause more damage now than in the year of occurrence due to the accumulation of value (human and physical assets) in the intervening years.
Regional loss overviewInsured and economic losses were highest in North America.
Figure 17 Uninflated, inflated (2020 prices) and normalised economic losses from natural catastrophes, 1970–2020, USD bn
Note: normalised by GDP (country real GDP + US inflation); loss-data quality prior to 1990 poor. Source: Swiss Re Institute
0
100
200
300
400
500
600
202020152010200520001995199019851980
Uninflated Inflated NormalisedEconomic losses:
Table 2 Number of events, victims, economic and insured losses by region, 2020
Note: some percentages may not add up to 100 due to rounding. Source: Swiss Re Institute
Insured losses Economic lossesRegion Number Victims in % in USD bn in % in USD bn in %
North America 83 478 6.0% 69.8 78.9% 104.6 51.8%
Latin America & Caribbean 10 633 7.9% 0.4 0.5% 2.2 1.1%
Europe 39 336 4.2% 6.0 6.8% 17.9 8.9%
Africa 37 1 720 21.5% 0.0 0.0% 1.4 0.7%
Asia 96 4 792 60.0% 8.6 9.8% 70.5 34.9%
Oceania/Australia 8 34 0.4% 3.6 4.0% 4.9 2.4%
Seas/Space 1 0 0.0% 0.0 0.0% 0.4 0.2%
World 274 7 993 100.0% 88.6 100.0% 202.0 100.0%

Swiss Re sigma No 1/2021 27
Figure 18 Natural catastrophes protection gap by region 2010–2020, in USD billion at 2020 prices
Source: Swiss Re Institute
Insured losses Uninsured losses
0
50
100
150
200
250
300
20192018
20172016
20152014
20132012
20112010
North America
0
10
20
30
40
50
20192018
20172016
20152014
20132012
20112010
Europe
0
50
100
150
200
250
300
350
20192018
20172016
20152014
20132012
20112010
Asia
0
10
20
30
40
50
60
20192018
20172016
20152014
20132012
20112010
Latin America & Caribbean
0
1
2
3
4
5
20192018
20172016
20152014
20132012
20112010
Africa
0
10
20
30
40
20192018
20172016
20152014
20132012
20112010
Oceania

28 Swiss Re sigma No 1/2021
Appendix 2
Definition of terms Natural catastrophesThe term “natural catastrophe” refers to an event caused by natural forces. Such an event generally results in a large number of individual losses involving many insurance policies. The scale of the losses resulting from a catastrophe depends not only on the severity of the natural forces concerned, but also on man-made factors, such as building design or the efficiency of disaster control in the afflicted region. In this sigma study, natural catastrophes are subdivided into the following categories: floods, storms, earthquakes, droughts/forest fires/heat waves, cold waves/frost, hail, tsunamis, and other natural catastrophes.
Man-made disastersThis study categorises major events associated with human activities as “man-made” or “technical” disasters. Generally, a large object in a very limited space is affected, which is covered by a small number of insurance policies. War, civil war, and war-like events are excluded. sigma subdivides man-made disasters into the following categories: major fires and explosions, aviation and space disasters, shipping disasters, rail disasters, mining accidents, collapse of buildings/bridges, and miscellaneous (including terrorism).
Economic lossesFor the purposes of the present sigma study, economic losses are all the financial losses directly attributable to a major event, ie damage to buildings, infrastructure, vehicles etc. The term also includes losses due to business interruption as a direct consequence of the property damage. Insured losses are gross of any reinsurance, be it provided by commercial or government schemes. A figure identified as “total damage” or “economic loss” includes all damage, insured and uninsured. Total loss figures do not include indirect financial losses – ie loss of earnings by suppliers due to disabled businesses, estimated shortfalls in GDP and non-economic losses, such as loss of reputation or impaired quality of life.
Generally, total (or economic) losses are estimated and communicated in very different ways. As a result, they are not directly comparable and should be seen only as an indication of the general order of magnitude.
Insured losses“Losses” refer to all insured losses except liability. Leaving aside liability losses, on one hand, allows a relatively swift assessment of the insurance year; on the other hand, however, it tends to understate the cost of man-made disasters. Life insurance losses are also not included.

Swiss Re sigma No 1/2021 29
Adjustments for inflation, changes to published data, informationsigma converts all losses for the occurrence year not given in USD into USD using the end-of-year exchange rate. To adjust for inflation, these USD values are extrapolated using the US consumer price index to give current (2020) values.
For the 2020 reporting year, the lower loss thresholds were set as follows:
If changes to the loss amounts of previously published events become known, sigma takes these into account in its database, but Swiss Re is under no obligation to publicly revise or update this sigma study.
SourcesInformation is collected from newspapers, direct insurance and reinsurance periodicals, specialist publications (in printed or electronic form) and reports from insurers and reinsurers. In no event shall Swiss Re be liable for any loss or damage arising in connection with the use of this information (see the copyright information on the inside back cover).
Thresholds for insured losses and casualities in 2020
Insured losses (threshold in USD m)
Maritime disasters 21.5
Aviation 42.9
Other losses 53.3
or Total economic losses (threshold in USD m) 106.7
or Casualties
Dead or missing 20
Injured 50
Homeless 2 000

30 Swiss Re sigma No 1/2021
Recent sigma publications
2021 No 1 Natural catastrophes in 2020: secondary perils in the spotlight, but don’t forget primary-peril risks
2020 No 1 Data-driven insurance: ready for the next frontier? No 2 Natural catastrophes in times of economic accumulation and climate change No 3 Power up: investing in infrastructure to drive sustainable growth in emerging markets No 4 World insurance: riding out the 2020 pandemic storm No 5 Machine intelligence in insurance: insights for end-to-end enterprise transformation No 6 De-risking global supply chains: rebalancing to strengthen resilience No 7 Rebuilding better: global economic and insurance market outlook 2021/22
2019 No 1 Emerging markets: the silver lining amid a challenging outlook No 2 Natural catastrophes and man-made disasters in 2018: “secondary” perils on the frontline No 3 World insurance: the great pivot east continues No 4 Advanced analytics: unlocking new frontiers in P&C insurance No 5 Indexing resilience: a primer for insurance markets and economies No 6 Global economic and insurance outlook 2020/21
2018 No 1 Natural catastrophes and man-made disasters in 2017: a year of record-breaking losses No 2 Constructing the future: recent developments in engineering insurance No 3 World insurance in 2017: solid, but mature life markets weigh on growth No 4 Profitability in non-life insurance: mind the gap No 5 Global economic and insurance outlook 2020 No 6 Mortality improvement: understanding the past and framing the future
2017 No 1 Cyber: getting to grips with a complex risk No 2 Natural catastrophes and man-made disasters in 2016: a year of widespread damages No 3 World insurance in 2016: the China growth engine steams ahead No 4 Insurance: adding value to development in emerging markets No 5 Commercial insurance: expanding the scope of insurability No 6 Life in-force management: improving consumer value and long-term profitability
2016 No 1 Natural catastrophes and man-made disasters in 2015: Asia suffers substantial losses No 2 Insuring the frontier markets No 3 World insurance 2015: steady growth amid regional disparities No 4 Mutual insurance in the 21st century: back to the future? No 5 Strategic reinsurance and insurance: the increasing trend of customised solutions
2015 No 1 Keeping healthy in emerging markets: insurance can help No 2 Natural catastrophes and man-made disasters in 2014: convective and winter storms generate most losses No 3 M & A in insurance: start of a new wave? No 4 World insurance in 2014: back to life No 5 Underinsurance of property risks: closing the gap No 6 Life insurance in the digital age: fundamental transformation ahead
2014 No 1 Natural catastrophes and man-made disasters in 2013: large losses from floods and hail; Haiyan hits the Philippines
No 2 Digital distribution in insurance: a quiet revolution No 3 World insurance in 2013: steering towards recovery No 4 Liability claims trends: emerging risks and rebounding economic drivers No 5 How will we care? Finding sustainable long-term care solutions for an ageing world

Published bySwiss Re Management LtdSwiss Re Institute Mythenquai 50/60P.O. Box8022 ZurichSwitzerland
Telephone +41 43 285 2551Email [email protected]
AuthorsLucia BevereDr Andreas Weigel
ContributorsDr Anwesha BhattacharyaDr Erik LindgrenRajeev SharanYordanka VelichkovaDr Jan Winkler
sigma editorPaul Ronke
Managing editorMartin BertoggHead of Cat Perils at Swiss Re
Dr Jerome Jean HaegeliSwiss Re Group Chief Economist
Explore and visualize sigma data on natural catastrophes and the world insurance markets at www.sigma-explorer.com
© 2021 Swiss Re. All rights reserved.
The editorial deadline for this study was 31 January 2021.
sigma is available on Swiss Reʼs website: www.swissre.com/sigma
The internet version may contain slightly updated information.
Graphic design and production:Corporate Real Estate & Logistics / Media Production, Zurich
Printing: Multicolor Print AG, Baar
The entire content of this sigma edition is subject to copyright with all rights reserved. The information may be used for private or internal purposes, provided that any copyright or other proprietary notices are not removed. Electronic reuse of the data published in sigma is prohibited.
Reproduction in whole or in part or use for any public purpose is permitted only with the prior written approval of Swiss Re and if the source reference “sigma 1/2021” is indicated. Courtesy copies are appreciated.
Although all the information used in this study was taken from reliable sources, Swiss Re does not accept any responsibility for the accuracy or comprehensiveness of the information given or forward looking statements made. The information provided and forward-looking statements made are for informational purposes only and in no way constitute or should be taken to reflect Swiss Re’s position, in particular in relation to any ongoing or future dispute. In no event shall Swiss Re be liable for any loss or damage arising in connection with the use of this information and readers are cautioned not to place undue reliance on forward-looking statements. Swiss Re undertakes no obligation to publicly revise or update any forward-looking statements, whether as a result of new information, future events or otherwise.
Order no: 270_0121_EN

Swiss Re Management Ltd.Swiss Re InstituteMythenquai 50 /60 P.O. Box 8022 Zurich Switzerland
Telephone + 41 43 285 2551 swissre.com/institute