Embed Size (px)
Citation preview

SKYWARNEWSNational Weather Service State College, PA
Spring 2009“Working Together To Save Lives”
Using Google Maps and Google Earth to Display Weather Data
By Ron Holmes, Information Technology Officer
The National Weather Service has recently increased its use of Geographic Information Systems (GIS) to map weather and its affects using various technologies. All offices have ArcGIS 9.3 and have received various levels of training on how to use the software. These systems help us understand relationships between geographic data and weather phenomena so that we can be more efficient and responsive to public needs. For example, GIS systems can show us locations of gas stations or post offices to call for severe weather verification purposes.
One of the more exciting technologies to recently emerge is Google Earth and Google Maps. These closely related technologies are free for anyone to download and use. Because weather changes every day the NWS in State College is using these technologies to make dynamic maps of GIS-based weather information. This information spans a
variety of areas from river ice to fire weather to severe weather.
Knowing the state of the rivers is vital to hydrologic operations. During winter ice build-up on the rivers can cause ice jams which act as temporary dams allowing water to pool behind
Figure 1. Google Map showing river ice observer reports

the dam. When the ice jam breaks,the sudden release of water could inundate and flood low lying areas. Our hydrologic forecasters benefit from reports of river ice which come in daily. They watch the slow increase of ice coverage over time and note areas of potential ice jams when preparing their river forecasts. Over the winter we collected river ice information from our river observers and posted daily maps of the reports using Google Maps on our web site. An example of the river ice reports received is shown in Figure 1.
From ice to fire our office is now showing Spot Fire Weather burn locations that are called into the office on Google Maps. When an agency is planning a prescribed burn all aspects of the burn area are sent to our office and a detailed fire weather forecast is produced for that location. In addition to location meteorologists need to know the exact latitude, longitude, elevation, and aspect (which direction
the burn area is facing) to calculate temperature, humidity, and fuel moisture for that specific location. Now these burn areas can be mapped onto terrain using Google Maps (Figure 2) so NWS forecasters can help Forest Service agencies and the burn crews safely fight the fire.
Lastly, severe weather impacts the lives of everyone affected. Protecting life and property from severe weather is one of the primary missions of the NWS. During the past year the NWS changed its warning strategy from a county-based paradigm to a smaller,
polygon area. This benefited the public from over-warning areas of the county that were clearly not going to be affected by the storm. We included latitude and longitude information of the polygon area in the warnings so they can be plotted on maps using automated technology. When these polygon areas are shown on television and web sites residents in that specific location can be evacuated or urged to take shelter immediately. Local storm reports received by the public are also issued with the latitude and longitude of the location of the storm. To help our
office better serve the community we have recently begun to plot locations and type of severe weather warnings and reports using Google Maps and Google Earth. This allows emergency managers to quickly respond to that specific area and provide assistance to the public during a severe weather event and for post-storm clean up operations. These maps will be updated as warnings are sent and reports of severe weather received. An example of reports received during a
Figure 2. Google Map showing a burn location for fire weather forecasting

high wind event over the winter is shown below in Figure 3.
The Winter in ReviewBy John La Corte, Senior Forecaster
Another winter has come and gone, and in talking to some around the local area the impression was that it was a nasty cold one. How perception can differ from reality is quite interesting because while temperatures were near or a little below normal across most of the Commonwealth overall it was yet another snow-starved winter.
Some might recall that back in October there was an observation of a high correlation between a cold October in which measurable snow fell and a
snowy-cold winter to follow. This past season proved to be the exception to that “rule”.
Figure one shows that the state was split roughly in half with the northwest half experiencing below normal cold while most of the southeast half of the region was near to slightly above normal temperature-wise.
The impression that it was such a severe winter may arise out of a very cold couple of weeks we suffered
Figure 3. Google Map showing severe weather reports received during a high wind event over the
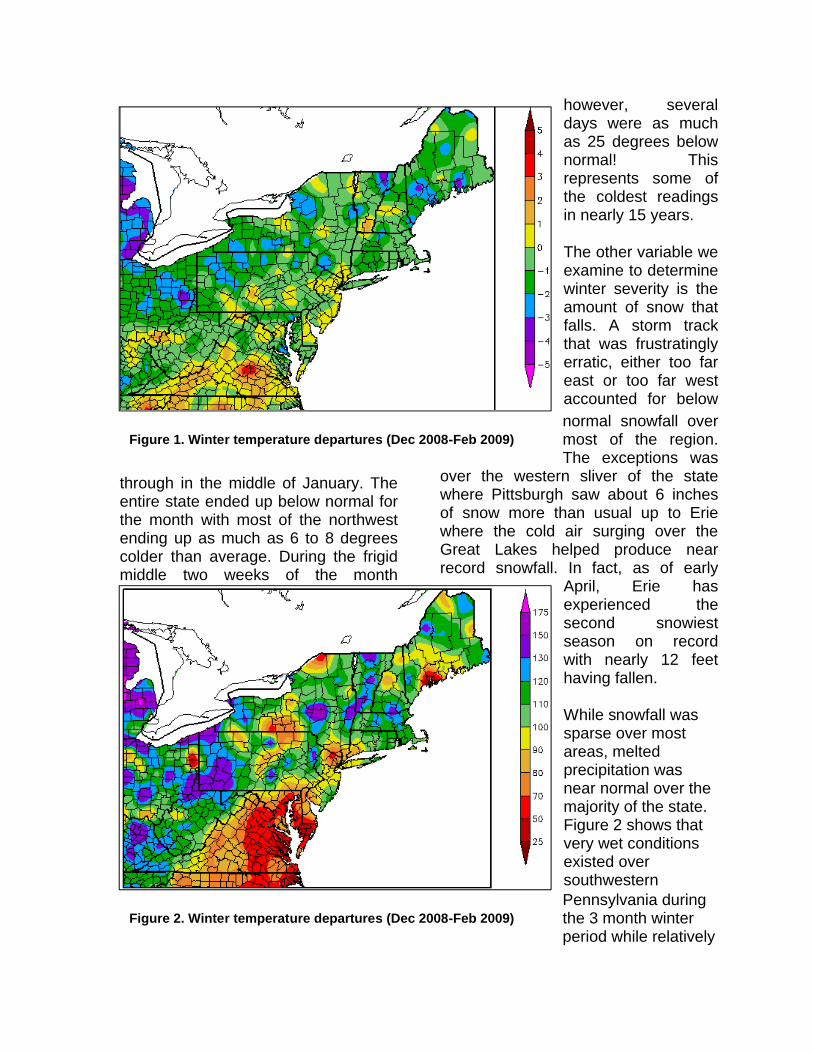
through in the middle of January. The entire state ended up below normal for the month with most of the northwest ending up as much as 6 to 8 degrees colder than average. During the frigid middle two weeks of the month
however, several days were as much as 25 degrees below normal! This represents some of the coldest readings in nearly 15 years.
The other variable we examine to determine winter severity is the amount of snow that falls. A storm track that was frustratingly erratic, either too far east or too far west accounted for below normal snowfall over most of the region. The exceptions was
over the western sliver of the state where Pittsburgh saw about 6 inches of snow more than usual up to Erie where the cold air surging over the Great Lakes helped produce near record snowfall. In fact, as of early
April, Erie has experienced the second snowiest season on record with nearly 12 feethaving fallen.
While snowfall was sparse over most areas, melted precipitation was near normal over the majority of the state. Figure 2 shows that very wet conditions existed over southwestern Pennsylvania during the 3 month winter period while relatively
Figure 1. Winter temperature departures (Dec 2008-Feb 2009)
Figure 2. Winter temperature departures (Dec 2008-Feb 2009)

small areas saw normal to slightly below normal rainfall
Hitting the waterways safely in 2009By David L. Beachler, General Forecaster
Each year millions head to the water to enjoy the outdoors via some type of watercraft. While many adhere to safety guidelines when operating and/or riding a watercraft, there continues to be a significant number of accidents.
According to the United States Coast Guard (USCG) nearly 80% of all marine related fatalities occur from individuals not wearing a personal floatation device (PFD).
All watercraft must have a USCGapproved PFD for each individual on board. Additionally, all PFDs must be worn according to the manufacturer’s guidelines.
While PFDs are an important part to safe boating, prior to departing the docks it is best to gather information regarding the forecast and dangers that may be encountered while on the water.
Weather can either make or break an enjoyable time on the water. Warm temperatures and sunny skies can make for the best days; however, dark clouds, gusty winds, and increasing wave heights can turns things to sour quickly. Prior to leaving docks or heading out to the streams, it is best to become familiar with the forecast. The National Weather Service (NWS) provides continuous updates via the
NOAA All-Hazards radio and weather.gov websites, with up to date weather observations and forecasts.
While on the open waters, one of the most serious dangers posed to mariners are thunderstorms. Associated with thunderstorms are not only gusty winds that cause locally higher wave heights, but cloud to water lightning strikes.
Lightning is one of the most dangerous weather elements for boaters, either in harbor or on the open waters, as it can travel vast distances in a short period and frequently strikes the tallest objects. The best course of action if a thunderstorm is expected is to seek safe shelter immediately. If caught on the open water; however, it is best to perform the following actions. Mariners should stay away from all ungrounded metal objects and seek the best possible shelter on board while assuring everyone is wearing their PFD.
As was noted earlier, the NWS maintains an up-to-date weather forecast on the NOAA All-Hazards radio. In addition to the forecasts, the NWS issues marine weather warnings for boaters. They are as follows:
Small Craft Advisory - Winds are forecast to be between 18 and 33 knots. Winds at these levels could
impact the safe operation of small boats.
Gale Warning - Winds are forecast to be between 34 and 47 knots
Storm Warning - Winds are forecast to be over 48 knots.
Tropical Storm Warning - Winds are forecast to be between 34 and 63
knots, and are associated with a topical storm.
Hurricane Warning - Winds are forecast to be over 64 knots and associated with a hurricane.
Special Marine Warning - A broadcast warning of a short-term marine hazard occurring on the water.
Pennsylvania Weather ExtremesBy Michael Dangelo, Senior Forecaster
It is always interesting to see what the extreme conditions can be in our local area, if only to compare them to what is currently occurring. The best use of extremes is to give us boundaries on what we can expect in our local climate. Remember, as Mark Twain said, “Climate is what we expect, weather is what we get.”
The All-Time Minimum Temperature: Smethport (McKean County), minus 42°F, set on January 5th 1904. Lawrenceville in Tioga County was minus 38 F that same morning.
All-Time Maximum Temperature: Phoenixville (Chester County), 111°F, set on July 10th 1936.
Most Snowfall in 24 hours: 40 inches fell at Seven Springs Resort on March 13th-14th of 1993. 38 inches fell in Morgantown (Berks County) ending on the 20th of March, 1958.
Most Rainfall in 24 hours: 14.50 inches fell over portions of Schuylkill County from June 21st-22nd, 1972, due to the
remnants of Hurricane Agnes. The worst flooding to date for much of the Eastern and Central portions of PA followed during the next week. The stage of the Susquehanna River at Harrisburg reached the still-standing record of 32.6 feet on the 24th.
Most Snowfall in One Month: 96 inches at Blue Knob (Blair County) during December 1890.
Almost all of this data was collected by the dedicated (and mostly volunteer) network of Co-Operative Observers overseen by your National Weather Service. In Central PA alone, there are 119 Co-Operative Observers. We currently in need of observers, especially in Fulton and Perry Counties. If you are interested in becoming a Co-Operative Weather Observer, contact Paul Head, Co-Operative Program Manager at (814) 231-2226.

Dr. Foster of Bruges, who is well known as a meteorologist, declares that, by journals of the weather kept by his grandfather, father and himself, ever since 1767, to the present time, whenever the new moon has fallen on a Saturday, the following twenty days have been wet and windy, in nineteen cases out of twenty.
1850 Old Farmer’s Almanac
Heat Wave of 25-28 April 2009By Richard H. Grumm, Science Officer and Craig Evanego, Meteorological Intern
An early season heat wave struck Pennsylvania on 25-28 April 2009. As shown in Table 1, many locations had several days where the daily high temperature was over 80F and a few locations, such as Williamsport, exceed 90F on 3 consecutive days. One may ponder if such warm temperatures in April are normal or theresult of global warming?
Table 2 shows the 14 warm episodes to affect central Pennsylvania since 1948. The COOP site at State College was used to obtain this record. Other sites may have provided some differences. State College was used to illustrate that April heat waves do and have occurred in the past. This data clearly show that the 1976 event had the highest maximum temperature. These data suggest that 3-5 day streaks of unseasonably warm weather affect the region regularly and have done so since at least 1954. Not shown in these data is that the high temperature in State College has reached 90F in at least four other years. They were 1976 (18th, 19th, and 21st), in 1990 (28th), and in 2008 (27th)
and exceeded it one time with a reading of 94 on 19 April 1976. To many, the heat wave of April 1976 is the event of note as it set many record high temperatures for the month at several sites, to include State College.
The data in Table 2 suggest that since April heat waves have been observed in the past, global warming is not a likely culprit. They are in fact predictable and seem to occur with a specific weather pattern.
What weather pattern causes these early season heat waves? An examination of weather data shows that a strong subtropical ridge dominates the region during these April heat events. The strong ridge allows warm subtropical air into the region and protects us from showers and thunderstorms, which would limit daytime high temperatures. The ridge tends to be slow to evolve and slow to break down. This explains why many of these events tend to span 3-5 days in length.

So while we may have found the need to crank on the air conditioning rather early this year, hopefully this little write-
up shows that summer-like warmth in April is not unheard of.
Lightning FactsBy Barry Lambert, Senior Forecaster
Lightning is the #2 weather killer in the U.S., and the top weather killer in the sunshine state of Florida (leading to about 100 deaths per year, and injuring 1000 annually). In Pennsylvania alone, 126 lightning fatalities occurred during the period 1959-2007, ranking our state #9 in lightning deaths, and #4 in casualties (deaths + injuries) behind only Florida, North Carolina and Michigan. Since it is estimated that between 3% and 10% of lightning
incidents result in death, anywhere from several hundred, up to 1250 people were struck by lightning in the Commonwealth during this approximate 50-year period. Pennsylvania actually ranks as #1 in lightning damage annually, and contributes to a scorching 5 billion dollar yearly bill related to the economic impact of lightning.
Location 25th 26th 27th 28thAltoona (KAOO) 84 84 85 81Bradford (KBFD) 82 82 83 76Johnstown (KJST) 82 81 83 78Lancaster (KLNS) 85 87 88 84Middletown (KMDT) 88 90 92 88State College (Coop) 86 86 90 84York (KTHV) 88 90 90 86Williamsport (KIPT) 90 91 94 88Table 1. A list of cities in Pennsylvania and the high temperatures on 25-28 April 2009. Red values show new or tied record high temperatures of the date.
Dates STCP1 Max19-22 April 1954 8523-28 April 1957 8815-18 April 1960 8223-26 April 1960 8726-29 April 1962 8816-22 April 1976 9412-13 April 1977 8420-23 April 1977 8319-21 April 1984 8422-24 April 1987 8924-29 April 1990 9026-27 April 1994 8517-20 April 2002 8925-28 April 2009 90
Table 2. Dates in April where the temperature in State College exceeded 80F for 3 consecutive days and the highest temperature during the span.
In 2008, 27 people died due to lightning strikes.
In 2007, 45 people were struck and killed by lightning in the U.S.
Casualties peak in July between noon and 6 pm, with 4 pm on Sunday followed closely by the same time Saturday being the deadliest instances. Greater than 50% of lightning fatalities occur after the thunderstorm has passed, and rain has ended (up to 30 minutes following the last clap of thunder). Men comprise about 80% of all lightning related deaths. Approximately 25% of lightning deaths occur while seeking shelter under trees, with 6% occurring while golfing and 4% from corded telephone use. You don’t have to be directly struck when lightning contacts the ground to be seriously injured of killed. Lightning bolts can spread out horizontally along the ground for up to 60 feet from where it strikes.
Greensburg, Pennsylvania native and Pro Golfer, Rocco Mediate is featured on this year’s National Weather Service Lightning Safety Week poster, and quoted saying “When you hear thunder, head for the clubhouse. Let the storm play through.”
Lightning Safety Week (When Thunder Roars, Go Indoors!) will be held June 21-27, 2009
Did you know?
1) 25 million cloud-to-ground lightning strikes occur in the U.S. each year.
2) Your odds of being struck by lightning in the U.S. in any single year are about 1 in 700, 000.
3) Your odds of being struck by lightning over the course of your lifetime are about 1 in 5,000.
4) Lightning heats the air within its path to 50,000 degrees F, or five times hotter than the surface of the sun.
5) There are two types of lightning; negative strikes and positive strikes. Positive strikes are 5 times more powerful than negative strikes, and positive charge flows instead of negative charge.
6) The average lightning bolt is 6 miles long, although Cape Canaveral

Kennedy Space Center has indicated some as long as 75 miles.
7) The thickness of a lightning bolt is about the size of a silver dollar. It only looks bigger because it is so bright.
8) A lightning bolt is made of a series of strokes from about 3 to 20, with an average of about four. The duration of each lightning bolt can vary, but typically average about 30 microseconds.
Here are some safety tips that will help protect you and your family or friends from the danger of lightning.
* Postpone outdoor plans such as golf, fishing or other outdoor activities ahead of time to avoid being caught off guard and placing yourself in danger.
* Have a lightning safety plan and a designated place of shelter before you venture outdoors during potentially threatening weather.
* Keep an eye on the sky, and be on the lookout for darkening skies, and increased wind, which are signs of an approaching thunderstorm. To ensure you can get to adequate shelter while on the gold course, use your cell phone to call the club house and check how close thunderstorms are, and theapproximate time they will begin to affect your area.
* Avoid being in open areas, especially on high ground. Since lightning has an affinity for tall objects, remain far away from trees, towers and utility poles. Other objects to stay away from include metal bleachers, backstops
and fences since lightning can travel long distances through metal). I canpersonally attest to this last safety tip, since I witnessed lightning strike anoutfield fence during a teener league baseball game. The thunderstorm was 5 to 10 miles to the north, with frequent thunder. Rain never fell at the field,and it was actually mostly sunny when the lightning struck. Luckily, the lightning stayed along the fence line and nobody was injured. Some yells from the players and rapid heartbeats after jumping from the loud bang – For Sure! If no shelter in a sturdy building is available, take cover in a hard-topped metal vehicle with the windows closed (however, don’t touch any of the metal while inside).
* Finally, have a convenient and reliable source of real time weather information, such as NOAA Weather Radio – All Hazards with a tone alert feature programmed specifically for your county (Short Term Forecast and Special Weather Statements found on such broadcasts will highlight areas of less severe though still dangerous thunderstorms along with their movement), wireless internet access to your favorite national weather site and radar, or at the least a handheld radio tuned into a station that has emergency activation when severe weather is in the area.
* While indoors stay off corded telephones, and keep away from any wiring or plumbing (this means don’t take a shower when it’s thundering out). About 4% of all lightning deaths in the U.S. are a result of people talking on a corded phone during a thunderstorm.

This year marks the 4th Annual National Lightning Safety Awareness Week in the U.S. – June 20-26, 2004. Be sure to tune into NOAA Weather Radio – All Hazards or visit the multimedia page linked to the site www.weather.gov. Additional information on statistics and protection
from the dangers of lightning can be found at:
www.lightningsafety.noaa.gov
Would you Prefer Relative Humidity or Dewpoint with that Soupy Airmass?
By Barry Lambert, Senior Forecaster
One of the most critical pieces of information incorporated in the daily weather puzzle (besides temperature and wind) is something referred to as the relative humidity.
Most people see or hear about this weather quantity very frequently, but how many actually understand what it means? Most probably understand that if the humidity is high, the air is moist, but sometimes it can feel downright humid even with the relative humidity being reported as pretty low. What is going on then?
The word “relative” is the key to comprehending this weather measurement. Simply put is the ratio (or relative amount) of the water vaporin the air compared the maximum amount the air can actually hold (saturation). So what is water vapor? Water vapor is an invisible gas that makes up a part of our atmosphere. Remember, water vapor is not the same as steam or clouds. When we boil water we see the water turn first to steam then disappear altogether. The
water isn’t gone; it has merely been converted to a gas which we call water vapor.
We can see the water vapor once again when the air reaches saturation. Saturation occurs when we see fog or clouds. It means that the air has reached its capacity to hold water vapor (in an invisible form), and it must start to condense out in the form of visible moisture, which are small water droplets. Reaching the saturation point to form fog or clouds requires cooling, in the case of clouds, as the air rises it expends energy (heat) as it expands under lower external pressure aloft. When fog forms (typically toward the end of a long night), cooling of the air is due to heat escaping from the ground into the clear, calm air above. Saturation is also the first step in the precipitation process, which leads to rain or snow.
All this may seem rather complicated, but consider that the air can hold much more water vapor at warm temperatures than it can at cooler temperatures. This partially explains why it feels so much more humid on a typical day in July than it does in

January, even when the relative humidity can be near 100% at either of those times. It’s because there is actually much more water vapor in the air during a typical July day. Perhaps a better way to determine just how humid it is would be to examine the dewpoint. The dewpoint is a more accurate representation of the actual moisture in the air and is represented as a temperature. Why? Because it doesn't change when the air temperature changes, it only changes when the moisture content changes. (assuming constant pressure). Dewpoint isn't an absolute measure though, because of its dependency upon constant pressure. Although pressure doesn't change very rapidly at the ground, it changes or decreases very fast in the vertical (the reason why our ears pop when we drive up mountains or take an airline flight).
Dewpoint is basically defined as “the temperature which the air would have
to be cooled to in order to condense the moisture out of it”. So the dewpoint is really what it sounds like, the point (or temperature) at which dew (visible water droplets) will form.
Still confused? Let’s look at a typical summer day. By mid afternoon the temperature may be about 88 degrees with a typical mid summer dewpoint being about 65 degrees. If you were to see that report on television, the relative humidity would only be 47%, yet rest assured, you would feel uncomfortable. In fact the forecast may sound something like “…Hazy…very warm and humid with highs…” Why is that? It is because the dewpoint is so high. Table 1 summarizes a rough estimation of dewpoints and what most people perceive when they are reached. Ever been to Florida in summer? Dewpoints are typically in the mid to upper 70s all summer long. So
even though temperatures rarely reach
Table 1. Typical Dewpoints and How Most People Feel
Dew PointTemp. °F Human Perception
Relative HumidityAir Temp 90°F
75°+ Extremely uncomfortable, oppressive 62%
70° - 74° Very Humid, quite uncomfortable 52% - 60%
65° - 69°Somewhat uncomfortable for most peopleat upper limit 44% - 52%
60° - 64°OK for most, but everyone perceives the humidityat upper limit 37% - 46%
55° - 59° Comfortable 31% - 41%
50° - 54° Very comfortable 31% - 37%
49°or lower Feels like the western US a bit dry to some 30%

100 in Florida, the humidity is why most people complain that it is so hot and humid. A corresponding day in the desert southwest may reach 100 pretty routinely, but if one manages to stay in the shade it may feel relatively comfortable because dewpoints are generally well below 50.
On the flip side, do you ever wonder why we often have such dry, cracking skin in the wintertime? Well, consider the very low dewpoints of say 0 or 10 degrees F typically observed in a dry, cold airmass (with temperatures in the teens and 20s) that we frequently see in Pennsylvania during December through January. The corresponding sparse amount of water vapor leads to extremely low relative humidity indoors, where we keep the temperatures of our homes in the 60s
and 70s. Essentially, we’re creating a desert-like climate indoors. What would the relative humidity be in the case above, using an indoor temperature of 70 and dewpoint of zero? Would you believe…just a measly 2 percent? Wow! This is why we need humidifiers indoors during the winter and de-humidifiers in the summer.
World Record Dew Points
Many veterans of the Persian Gulf War are very aware of what a temperature of 90°F and a relative humidity of 90% feels like. The Persian Gulf and Red Sea both see sea water temperaturesreach the mid 90's. When that happens, there is plenty of energy available via the 115°F air temperatures to evaporate water.
Dew Point Calculation Chart (Fahrenheit)At Sea Level
RH% AMBIENT AIR TEMPERATURE IN FAHRENHEIT
20 30 40 50 60 70 80 90 100 110 120
90 18 28 37 47 57 67 77 87 97 107 117
85 17 26 36 45 55 65 75 84 95 104 113
80 16 25 34 44 54 63 73 82 93 102 110
75 15 24 33 42 52 62 71 80 91 100 108
70 13 22 31 40 50 60 68 78 88 96 105
65 12 20 29 38 47 57 66 76 85 93 103
60 11 19 27 36 45 55 64 73 83 92 101
55 9 17 25 34 43 53 61 70 80 89 98
50 6 15 23 31 40 50 59 67 77 86 94
45 4 13 21 29 37 47 56 64 73 82 91
40 1 11 18 26 35 43 52 61 69 78 87
35 -2 8 16 23 31 40 48 57 65 74 83
30 -6 4 13 20 28 36 44 52 61 69 77

The dew point has been measured on the shore of Ethiopia (the area is now part of Eritrea) at 94°F! This is thehighest known dew point temperature in the world. The relative humidity with a temperature of 115°F and a dew point of 94°F is only 54%. This airmass would feel downright oppressive, and doesn't tell us as much as the dew point when you consider the table above.
Dewpoint vs. Severe Weather
Meteorologists consider dewpoints near 55 degrees and higher to be necessary for severe weather. That's just a guideline but it's usually true. It's because the higher moisture content in the air helps storms grow. Typically, thunderstorms don’t grow that tall (and their updrafts remain too weak to support large hailstones) with dewpoints below 55 degrees.
May 31st, 2010 – 25th Anniversary of the Deadliest Tornado Outbreak in Pennsylvania History
By Matt Steinbugl, General Forecaster
During the afternoon and evening ofMay 31st 1985, thunderstorms along and ahead of a strong cold front produced the most devastating and deadliest tornado outbreak in Pennsylvania history. Post-storm aerial and ground surveys revealed a total of 21 tornado touchdowns across the northwest and central part of the state. Overall, a total of 41 tornadoes were recorded spanning three states (PA, OH, NY) and a portion of southeastern Canada between Lake Ontario and Georgian Bay. Next year -- May 31, 2010 -- will mark the silver anniversary of this unforgettable and unprecedented severe weather event.
The most intense tornado, which passed through the town of Wheatland,
PA along the Ohio border near Sharon – 61 miles from Pittsburgh, was rated an F5 on the original Fujita Scale *, the only confirmed F5 tornado in Pennsylvania history! Among several
Figure 1. Tornado tracks by F-scale. Image courtesy of the PA State Climatologist.

F4 tornadoes, one cut a path approximately 65 miles (105km) long through the Moshannon State Forest. This long-track tornado produced a 0.62 mile (1km) wide swath of downed trees that is still visible to this day. Two other tornadoes also touched down in relatively close proximity to the State College area in Watsontown and in Hollenbeck Township (Luzerne County).
Casualties included 65 killed and 707 injured in Pennsylvania alone, with additional death and destruction reported across Ohio and New York. 1009 homes were reported destroyed across Pennsylvania with a damage estimate at that time of $376,367,000. Killer tornadoes were also reported across southeast Ontario.
The National Weather Service in State College is considering a commemoration of this historical severe weather event for next year. If you have any information (pictures, stories, impacts, statistics, etc) that you would like to share with the NWS, please e-mail or send us the information.
* The Enhanced Fujita (EF) scale has replaced the original Fujita scale.
Table 2: Tornadoes, numbered to match Figure 1.

SKYWARNEWS
National Weather Service328 Innovation BlvdSuite #330 State College, PA 16803
TO: