Embed Size (px)
Citation preview

NatioNal tB ServiceS Survey report
APHL Report
Diagnosing TB JUNE 201 2
© Copyright 2012, Association of Public Health Laboratories. All Rights Reserved.
The Association of Public Health Laboratories (APHL) is a national non-profit organization dedi-cated to working with members to strengthen governmental laboratories that perform testing of public health significance. By promoting effective programs and public policy, APHL strives to provide member laboratories with the resources and infrastructure needed to protect the health of US residents and to prevent and control disease globally.

TABLE OF CONTENTS
Background and Purpose ........................................................................................................ 4
Method ..................................................................................................................................... 5
Results ................................................................................................................................ 6-22
Summary of Major Findings .............................................................................................23-24
Resources ............................................................................................................................... 25
Glossary of Terms ................................................................................................................... 26
References...............................................................................................................................27
Appendix ............................................................................................................................28-29
Acknowledgements ................................................................................................................ 30

BACkgROuNd ANd PuRPOSE
Diagnosis of tuberculosis (TB) in the United States involves a network of private and public laborato-ries with different levels of service. As a result, specimens from a single patient may be referred to several laboratories for more complex tests including drug susceptibility testing. Without excellent coordination and communication between public and private sector laboratories, diagnosis and treatment of TB patients may be delayed.
As the number of TB cases in the US has fallen, the number of laboratories offering the full menu of TB diagnostic services has eroded. In 2002, the Association of Public Health Laboratories (APHL) and the US Centers for Disease Control and Prevention (CDC) convened the Task Force on the Fu-ture of TB Laboratory Services to develop recommendations to assure continued availability of high-quality, cost-effective TB laboratory services. The Task Force formulated three principle benchmarks of which one was a comprehensive assessment of available TB laboratory services in the public and private sector to fill gaps in knowledge about the capabilities and capacities of US laboratories and the structure of jurisdictional laboratory networks.
In response to that recommendation, APHL and CDC developed and launched the National TB Labo-ratory Services Survey in 2010. The purpose of the survey was to assess the overall ability of com-mercial, clinical, and public health laboratories in the United States to provide quality TB diagnostic services. The results will be used to identify gaps in the capabilities and capacities of TB testing services and identify opportunities to strengthen laboratory systems.
METHOd
The National TB Laboratory Services Survey was developed by an APHL-led workgroup that consisted of representatives from CDC’s Division of Tuberculosis Elimination (DTBE) and public health labo-ratories. The final product was reviewed by a larger workgroup that included representatives from clinical and commercial laboratories.
The 118-question survey was launched September 7, 2010, and officially closed in February 2011. The questions were divided into 11 different categories, including: demographics; testing method-ologies and volume; referral strategies; specimen collection, handling and transport; turnaround-times; reporting practices; laboratory staff and training; safety practices; proficiency testing and quality assurance; public health and epidemiology; and planning for the future.
The survey was distributed electronically to 1,444 clinical, commercial, public health, and Depart-ment of Defense laboratories via MRInterview, a web-based survey instrument. The survey participants were identified based on a list of laboratories enrolled in a mycobacteriology proficiency testing program in 2009. The list was quality-checked by APHL, and points of contact were identified for each laboratory. The point of contact for each laboratory received a link to an electronic version of the survey as well as a PDF file on September 7, 2010. Reminders were sent out on September 14 and twice more, biweekly. Of the 1,444 laboratories receiving the survey, 656 (45%) responded. Of those that responded, 580 (88%) performed some level of TB service in-house and were included in the analysis for this first of a series of issue briefs describing the survey results.
6 Association of Public Health Laboratories
RESuLTS
Table 1
In-house service
performed
No. of laboratories by type Total (% )Hospital-based
Clinical Commercial State Public Health
Local Public Health Other
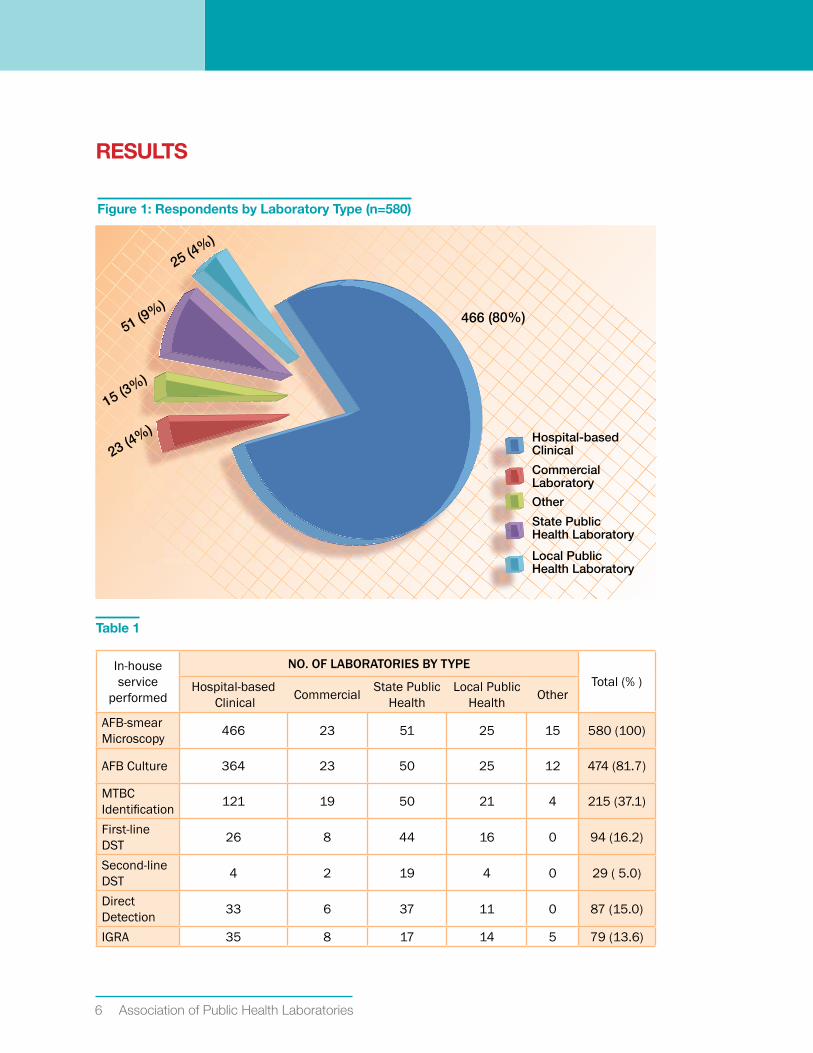
AFB-smear Microscopy 466 23 51 25 15 580 (100)
AFB Culture 364 23 50 25 12 474 (81.7)
MTBC Identification 121 19 50 21 4 215 (37.1)
First-line DST 26 8 44 16 0 94 (16.2)
Second-line DST 4 2 19 4 0 29 ( 5.0)
Direct Detection 33 6 37 11 0 87 (15.0)
IGRA 35 8 17 14 5 79 (13.6)
Figure 1: Respondents by Laboratory Type (n=580)
466 (80%)
25 (4%)
51 (9%)
15 (3%)
23 (4%)
State Public Health Laboratory
Commercial Laboratory
Other
Hospital-based Clinical
Local Public Health Laboratory
Survey Summary report 7
Results
Table 2
No. of afb smears processed per week
No. of laboratories by type
Total (% )Hospital-based Clinical
Commercial State Public Health
Local Public Health Other
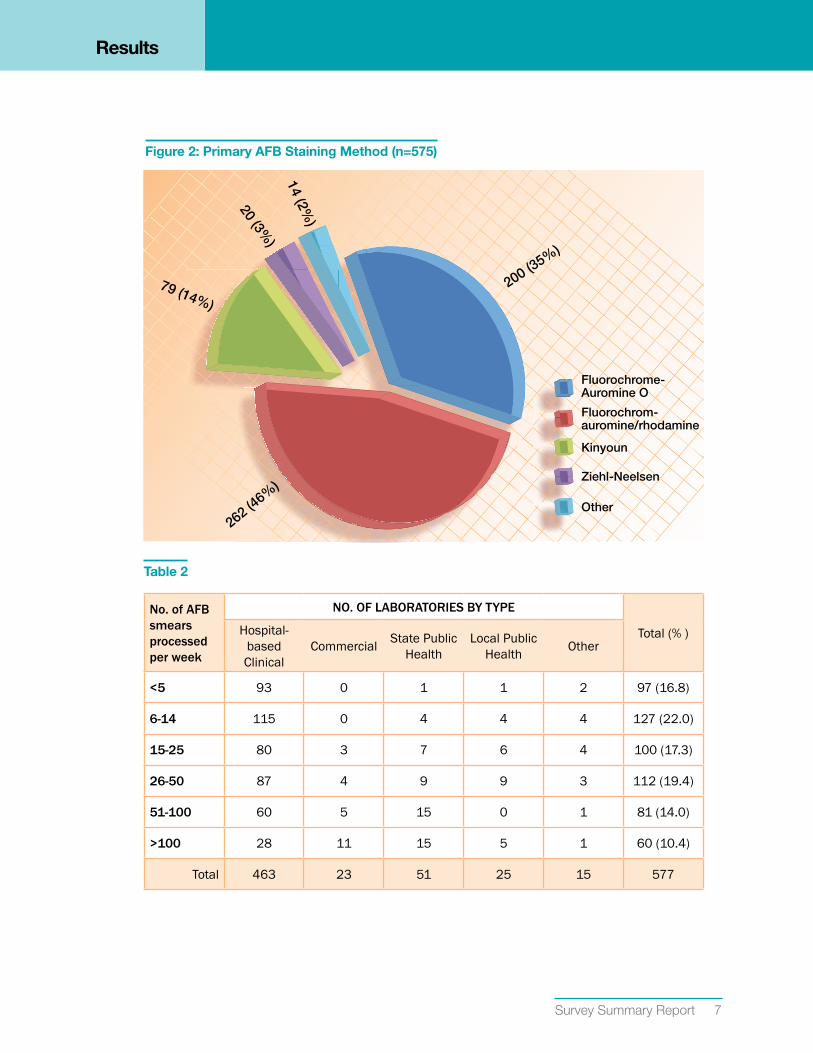
<5 93 0 1 1 2 97 (16.8)
6-14 115 0 4 4 4 127 (22.0)
15-25 80 3 7 6 4 100 (17.3)
26-50 87 4 9 9 3 112 (19.4)
51-100 60 5 15 0 1 81 (14.0)
>100 28 11 15 5 1 60 (10.4)
Total 463 23 51 25 15 577
Figure 2: Primary AFB Staining Method (n=575)
Ziehl-Neelsen
Fluorochrom-auromine/rhodamine
Kinyoun
Fluorochrome-Auromine O
Other
200 (35%)
79 (14%)
20 (3%)
14 (2%)
262 (46%
)
8 Association of Public Health Laboratories
Results
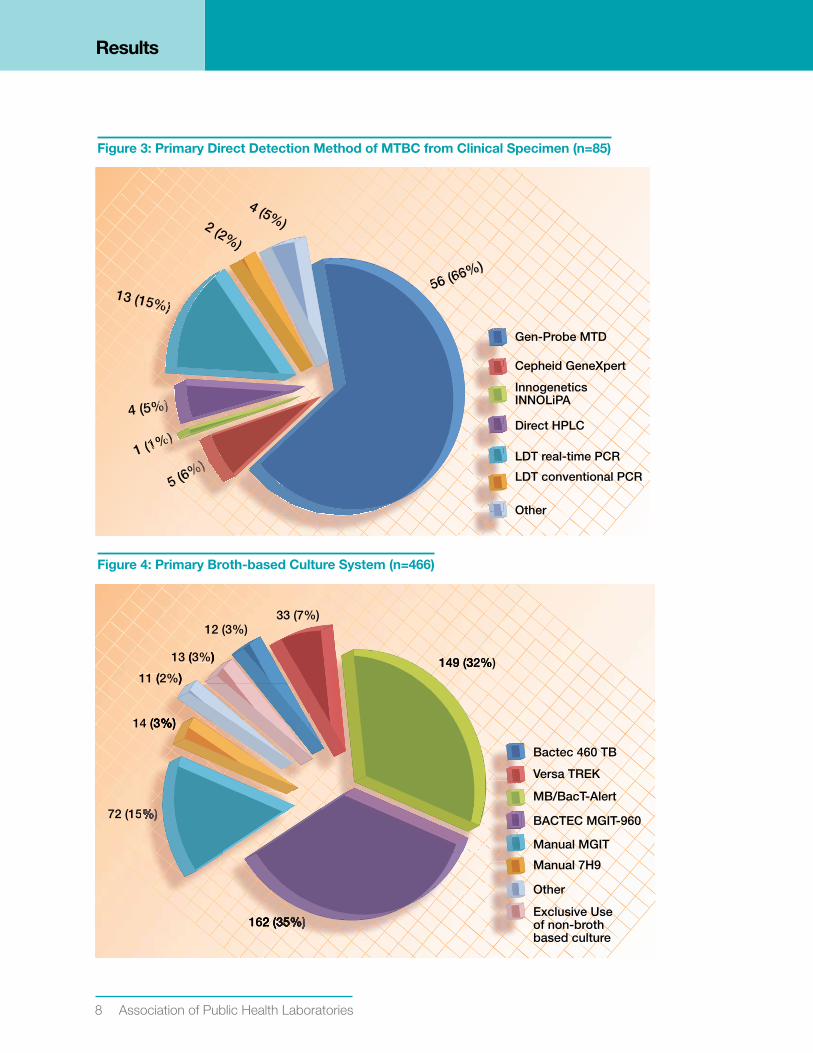
Figure 3: Primary direct detection Method of MTBC from Clinical Specimen (n=85)
Other
LDT real-time PCR
LDT conventional PCR
Direct HPLC
Cepheid GeneXpert
Innogenetics INNOLiPA
Gen-Probe MTD
56 (66%)
1 (1%)
4 (5%)
13 (15%)
2 (2%)
4 (5%)
5 (6%)
56 (665 (66666 (656
(1%%)%)%)%)%)))(1
)))%%)%)%))))(1
5%%%%%)%)))5%%%%)))5%
5%)%)5%)%))
2%)2%2%
5 (66%%%)%)%)%)%)%5
%%%%)%)%)%%%%)(6%
5 (
Figure 4: Primary Broth-based Culture System (n=466)
Other
Exclusive Use of non-broth based culture
Manual MGIT
Manual 7H9
BACTEC MGIT-960
Versa TREK
MB/BacT-Alert72 (15%)
14 (3%)
11 (2%)
13 (3%)
12 (3%)33 (7%)
149 (32%)
162 (35%)
Bactec 460 TB
)( ))
3%%)))))3
( ))
(33%%))%%3%
%%%%%%%)%%%%%%%)%%%)
162 2 (33333(35%5%5%5%5%5%5%5 )))))))1 2 ( %%%%%%5%%)335%62
149 (32%1 (332%49
Survey Summary report 9
Results
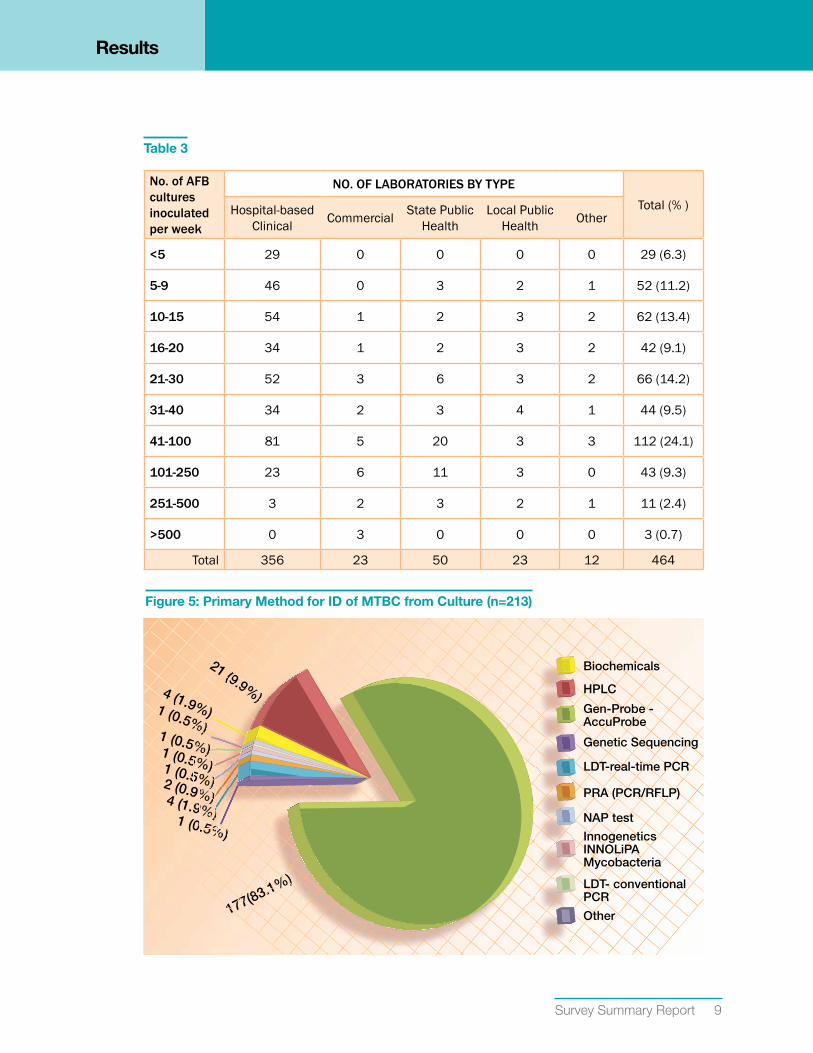
Table 3
No. of afb cultures inoculated per week
No. of laboratories by type
Total (% )Hospital-based Clinical Commercial State Public
HealthLocal Public
Health Other
<5 29 0 0 0 0 29 (6.3)
5-9 46 0 3 2 1 52 (11.2)
10-15 54 1 2 3 2 62 (13.4)
16-20 34 1 2 3 2 42 (9.1)
21-30 52 3 6 3 2 66 (14.2)
31-40 34 2 3 4 1 44 (9.5)
41-100 81 5 20 3 3 112 (24.1)
101-250 23 6 11 3 0 43 (9.3)
251-500 3 2 3 2 1 11 (2.4)
>500 0 3 0 0 0 3 (0.7)
Total 356 23 50 23 12 464
Figure 5: Primary Method for Id of MTBC from Culture (n=213)
177(83.1%)
1 (0.5%)
4 (1.9%)
21 (9.9%)
1 (0.5%)1 (0.5%)1 (0.5%)2 (0.9%)4 (1.9%)1 (0.5%)
LDT- conventional PCR
Other
NAP test
Innogenetics INNOLiPA Mycobacteria
PRA (PCR/RFLP)
Genetic Sequencing
LDT-real-time PCR
Gen-Probe - AccuProbe
HPLC
Biochemicals
55
5%)%)5%5%%)555%)%)55%%5%%55555%%)%)
555595
)55%%)%)55
))5555%%)%)55%%
999995595
)55%%55%%%9
%%)%%%5%)%)%%%%
000
%%%%9999999%%55%%)5%)%)%9
0.55%%0. %55%%
%)%%)00 55%0 550 5
%%)%%99%)%%)9%)
))%)%%%%)
))
177(83.1%)%)
1773.1%%)%).1%
(8377(8
17
1 (9.9%%))
(9 9%1 (9.9%))
%%)%))%%))
10 Association of Public Health Laboratories
Results
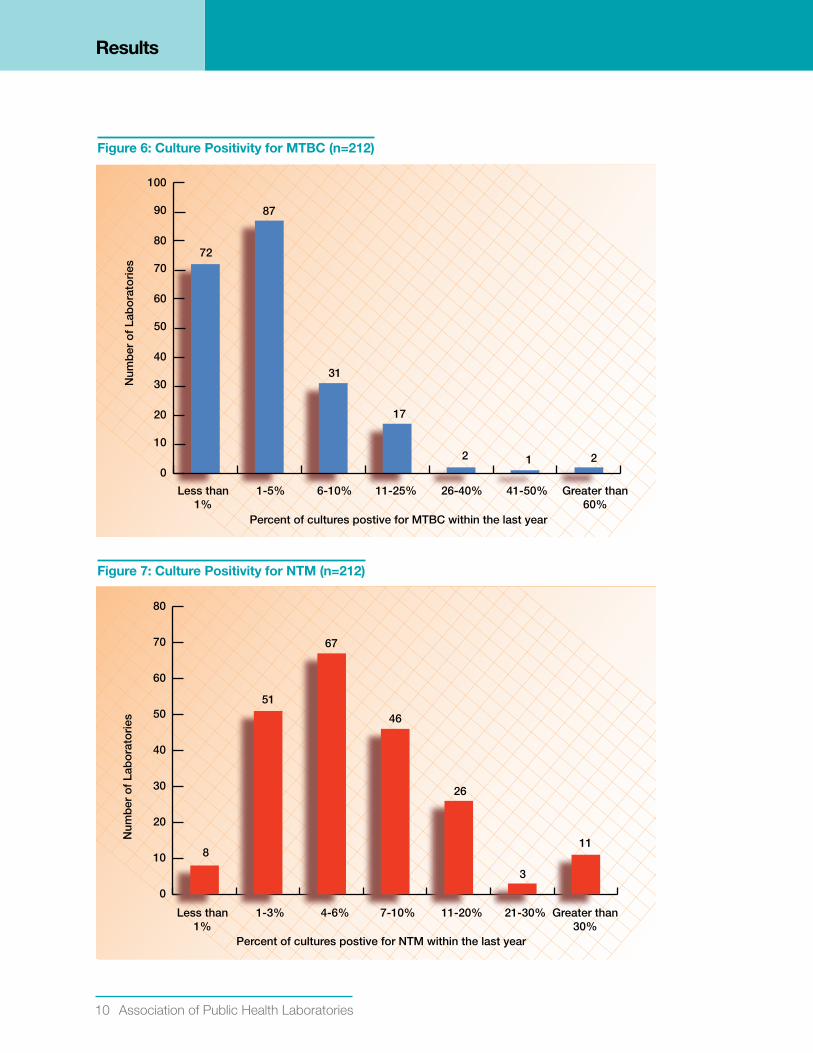
Figure 6: Culture Positivity for MTBC (n=212)
0
20
40
60
80
100
Less than1%
1-5%
Percent of cultures postive for MTBC within the last year
Num
ber
of
Lab
ora
tori
es
6-10% 11-25% 26-40% 41-50% Greater than60%
10
30
50
70
90
72
87
31
17
2 1 2
Figure 7: Culture Positivity for NTM (n=212)
Percent of cultures postive for NTM within the last year
Num
ber
of
Lab
ora
tori
es
8
51
67
46
26
3
11
0
10
20
30
40
50
60
70
80
Less than1%
1-3% 4-6% 7-10% 11-20% 21-30% Greater than30%
Survey Summary report 11
Results
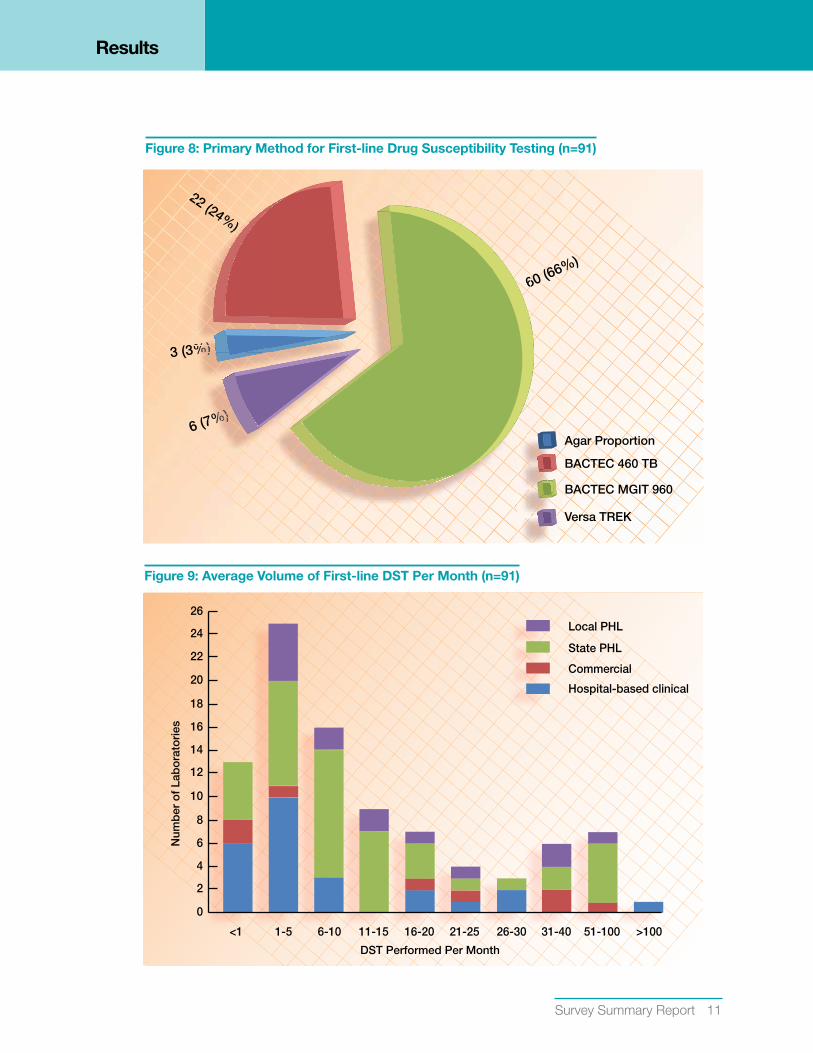
Figure 8: Primary Method for First-line drug Susceptibility Testing (n=91)
60 (66%)
22 (24%)
6 (7%)
3 (3%)
Versa TREK
BACTEC MGIT 960
BACTEC 460 TB
Agar Proportion
22 (24%)%)
22 (224%)
22 (24%))
3%%%%%)%)%)%)%)))%%%%)%)%)%)%)%)%))))
(77%%%%%)%)%)%%%%%%)%)%%)(7%
%%%%)%%%
66
Figure 9: Average Volume of First-line dST Per Month (n=91)
DST Performed Per Month
Num
ber
of
Lab
ora
tori
es
0
12
14
16
18
20
22
24
26
<1 1-5 6-10 11-15 16-20
Local PHL
State PHL
Commercial
Hospital-based clinical
21-25 26-30 31-40 51-100 >100
2
4
6
8
10
12 Association of Public Health Laboratories
Results
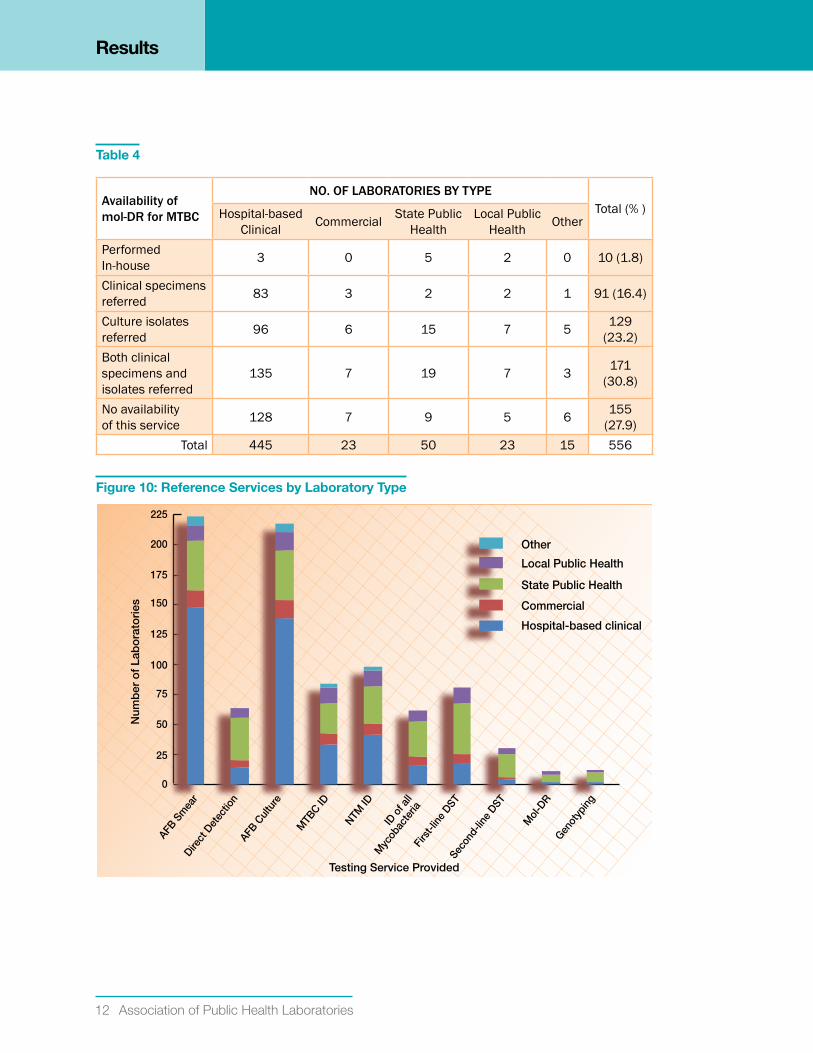
Table 4
availability of mol-Dr for MtbC
No. of laboratories by type Total (% )Hospital-based
Clinical Commercial State Public Health
Local Public Health Other
Performed In-house 3 0 5 2 0 10 (1.8)
Clinical specimens referred 83 3 2 2 1 91 (16.4)
Culture isolates referred 96 6 15 7 5 129
(23.2)Both clinical specimens and isolates referred
135 7 19 7 3 171 (30.8)
No availability of this service 128 7 9 5 6 155
(27.9)Total 445 23 50 23 15 556
Figure 10: Reference Services by Laboratory Type
Testing Service Provided
200
225
AFB S
mea
r
AFB C
ultu
re
Direct
Det
ectio
n
MTB
C ID
NTM ID
ID o
f all
Myc
obac
teria
Firs
t-lin
e DST
Seco
nd-li
ne D
ST
Mol
-DR
Genot
ypin
g175
150
125
100
75
50
25
0
Local Public Health
State Public Health
Commercial
Hospital-based clinical
Other
Num
ber
of
Lab
ora
tori
es
Survey Summary report 13
Results
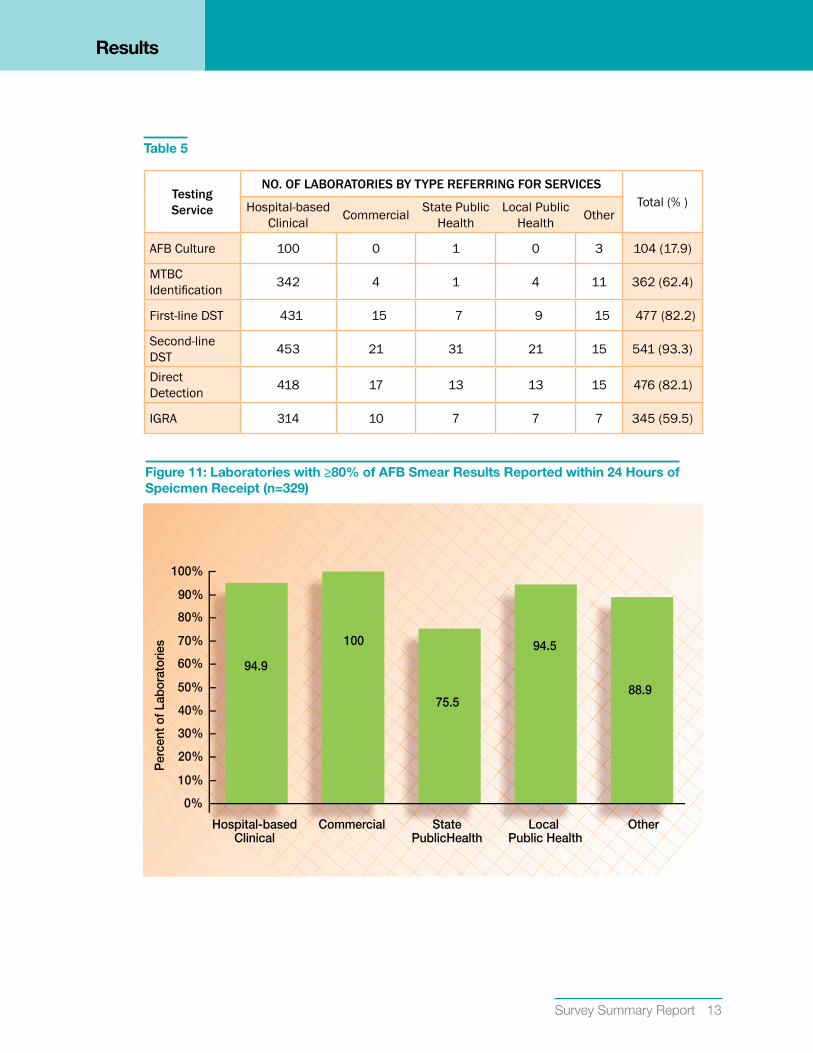
Table 5
testing service
No. of laboratories by type referriNg for serviCes Total (% )Hospital-based
Clinical Commercial State Public Health
Local Public Health Other
AFB Culture 100 0 1 0 3 104 (17.9)
MTBC Identification 342 4 1 4 11 362 (62.4)
First-line DST 431 15 7 9 15 477 (82.2)
Second-line DST 453 21 31 21 15 541 (93.3)
Direct Detection 418 17 13 13 15 476 (82.1)
IGRA 314 10 7 7 7 345 (59.5)
Figure 11: Laboratories with ≥80% of AFB Smear Results Reported within 24 Hours of Speicmen Receipt (n=329)
Hospital-basedClinical
StatePublicHealth
Commercial
Per
cent
of L
abor
ator
ies
OtherLocal Public Health
80%
100%
90%
70%
0%
30%
20%
10%
40%
50%
60% 94.9
100
75.5
94.5
88.9
14 Association of Public Health Laboratories
Results
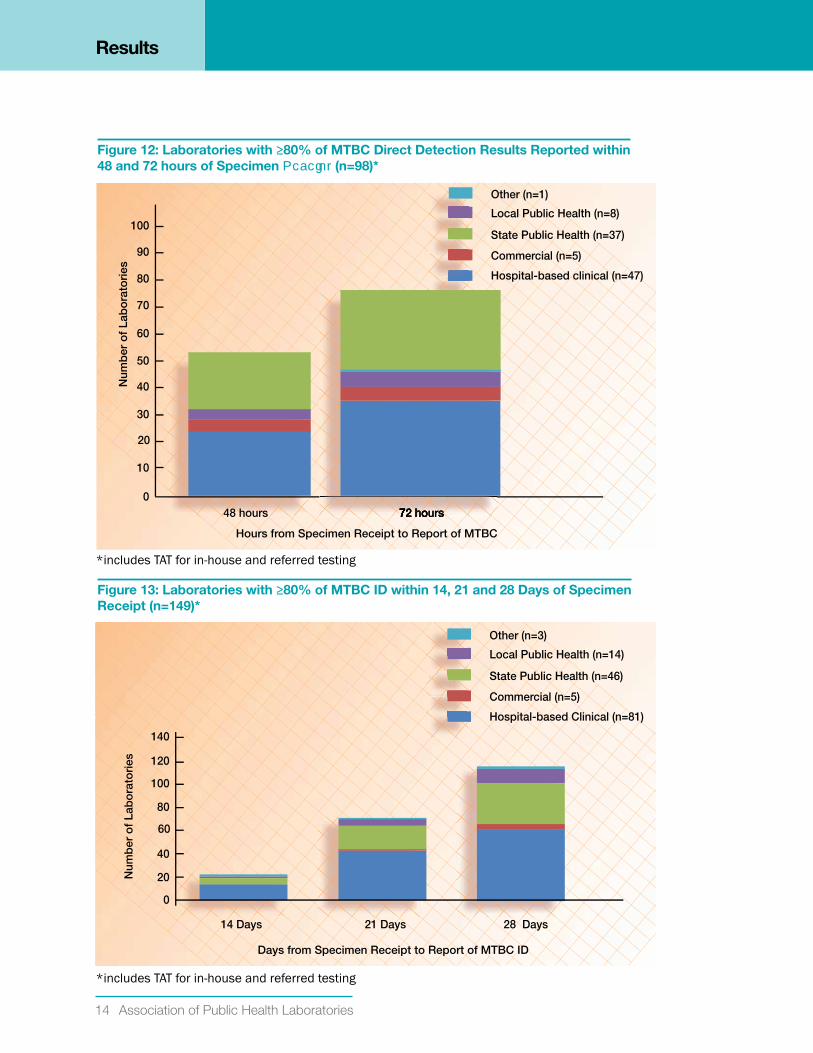
*includes TAT for in-house and referred testing
*includes TAT for in-house and referred testing
Figure 12: Laboratories with ≥80% of MTBC direct detection Results Reported within 48 and 72 hours of Specimen (n=98)*
Hours from Specimen Receipt to Report of MTBC
Num
ber
of
Lab
ora
tori
es
Local Public Health (n=8)
State Public Health (n=37)
Commercial (n=5)
Hospital-based clinical (n=47)
Other (n=1)
90
100
48 hours 72 hours
80
70
60
50
40
30
10
20
072727272 hhhhouoursrshho ssshhhoo77
Figure 13: Laboratories with ≥80% of MTBC Id within 14, 21 and 28 days of Specimen Receipt (n=149)*
Days from Specimen Receipt to Report of MTBC ID
Num
ber
of
Lab
ora
tori
es
Local Public Health (n=14)
State Public Health (n=46)
Commercial (n=5)
Hospital-based Clinical (n=81)
Other (n=3)
14 Days 21 Days 28 Days
140
120
100
80
40
60
0
20
Survey Summary report 15
Results
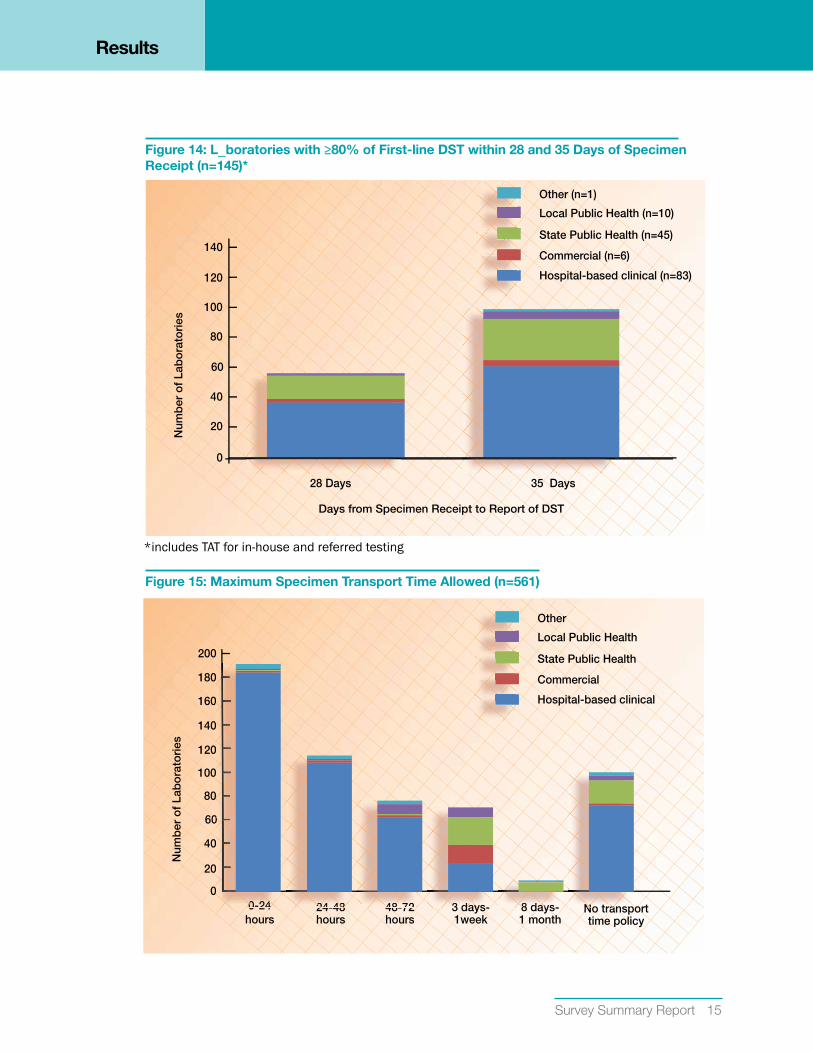
*includes TAT for in-house and referred testing
Figure 14: L boratories with ≥80% of First-line dST within 28 and 35 days of Specimen Receipt (n=145)*
Days from Specimen Receipt to Report of DST
Num
ber
of
Lab
ora
tori
es
Local Public Health (n=10)
State Public Health (n=45)
Commercial (n=6)
Hospital-based clinical (n=83)
Other (n=1)
28 Days 35 Days
140
120
100
80
40
60
0
20
Figure 15: Maximum Specimen Transport Time Allowed (n=561)
Num
ber
of
Lab
ora
tori
es
Local Public Health
State Public Health
Commercial
Hospital-based clinical
Other
24-48hours
0-24hours
48-72hours
3 days-1week
No transporttime policy
8 days-1 month
140
200
180
160
120
100
80
40
60
0
20
00-0-2242400 4400
00
0
00
0
00
000
0
0000
00
0
2424 4-488242 848822 33 dadaysys-dad yy33 88 dadaysys-aaaayy88 NNo ttranspNN aaNN4848 7-72288 772244
16 Association of Public Health Laboratories
Results
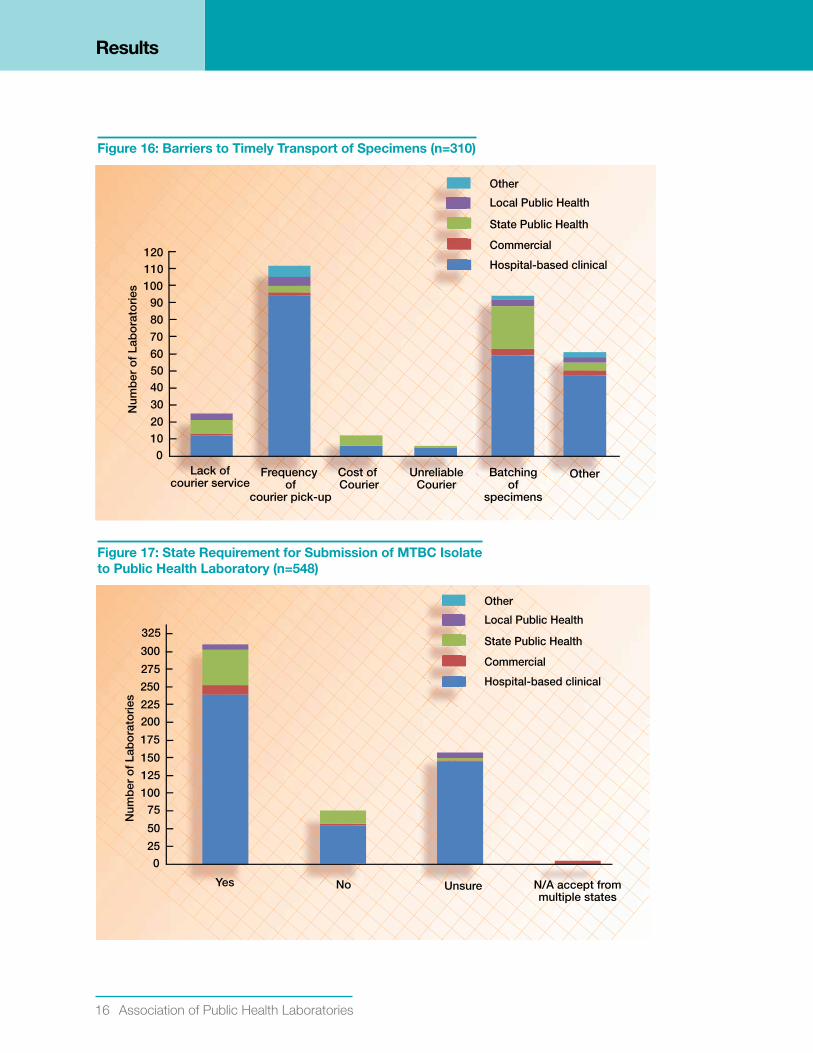
Figure 16: Barriers to Timely Transport of Specimens (n=310)
Local Public Health
State Public Health
Commercial
Hospital-based clinical
Other
Num
ber
of
Lab
ora
tori
es
Frequency of
courier pick-up
Lack ofcourier service
Cost of Courier
UnreliableCourier
OtherBatchingof
specimens
90
120
100110
80
7060
20
40
30
50
010
Figure 17: State Requirement for Submission of MTBC Isolate to Public Health Laboratory (n=548)
Local Public Health
State Public Health
Commercial
Hospital-based clinical
Other
Num
ber
of
Lab
ora
tori
es
Yes No N/A accept frommultiple states
Unsure
225
300
325
250
275
200
175
150
50
100
75
125
0
25
Survey Summary report 17
Results
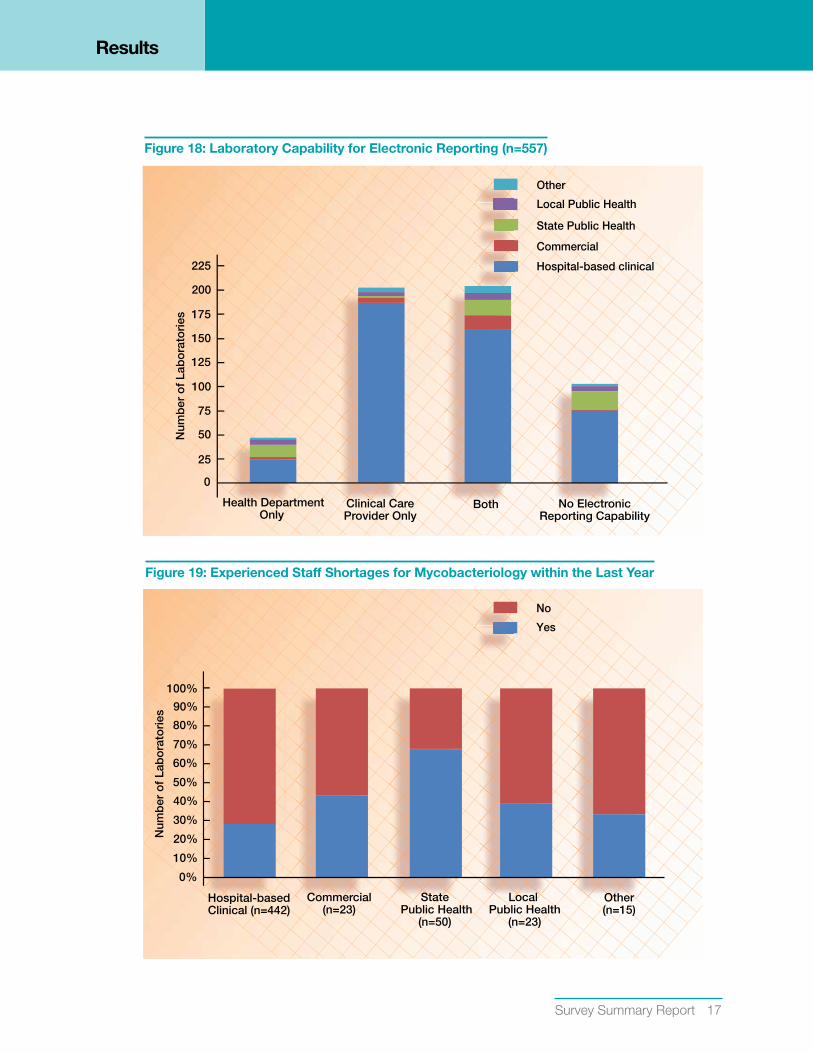
Figure 18: Laboratory Capability for Electronic Reporting (n=557)
Local Public Health
State Public Health
Commercial
Hospital-based clinical
OtherN
umb
er o
f La
bo
rato
ries
Health DepartmentOnly
Clinical CareProvider Only
No ElectronicReporting Capability
Both
175
225
200
150
125
50
75
100
0
25
Figure 19: Experienced Staff Shortages for Mycobacteriology within the Last Year
Yes
No
Num
ber
of
Lab
ora
tori
es
Hospital-basedClinical (n=442)
StatePublic Health
(n=50)
Commercial(n=23)
Other(n=15)
Local Public Health
(n=23)
80%
100%
90%
70%
60%
50%
20%
30%
40%
0%
10%
18 Association of Public Health Laboratories
Results
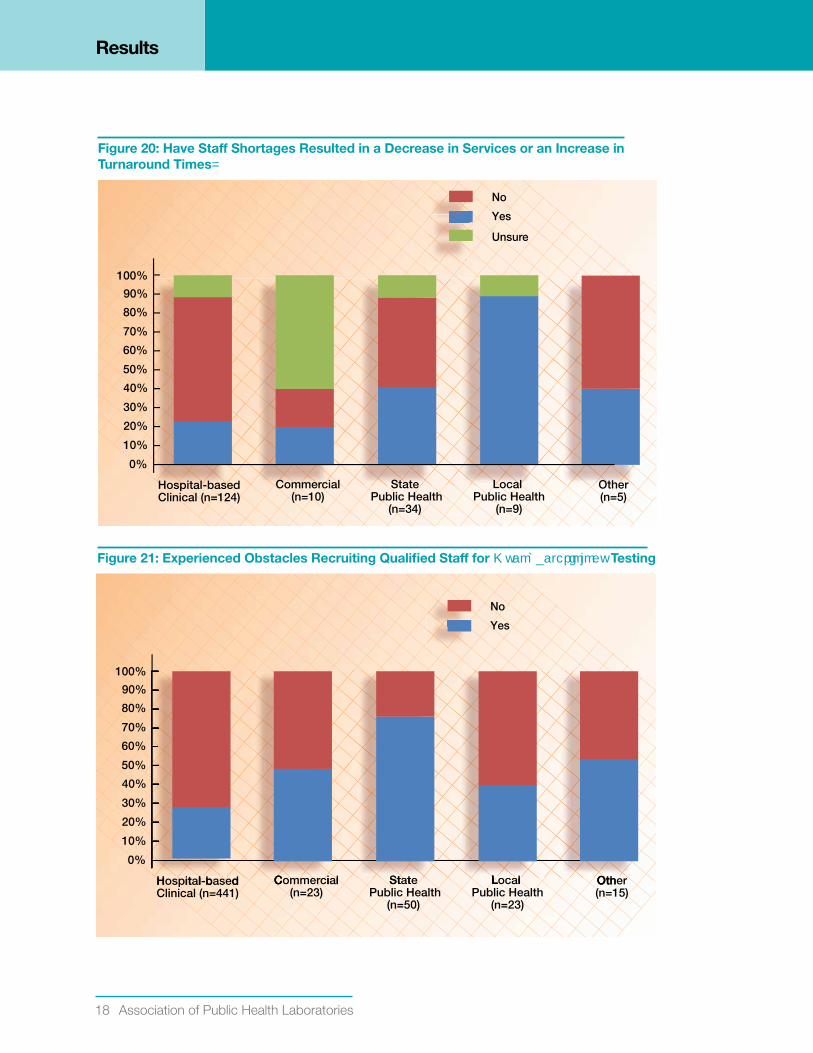
Figure 20: Have Staff Shortages Resulted in a decrease in Services or an Increase in Turnaround Times
Yes
No
Unsure
Hospital-basedClinical (n=124)
StatePublic Health
(n=34)
Commercial(n=10)
Other(n=5)
Local Public Health
(n=9)
80%
100%
90%
70%
60%
50%
20%
30%
40%
0%
10%
Figure 21: Experienced Obstacles Recruiting Qualified Staff for Testing
Yes
No
Hospital-basedClinical (n=441)
StatePublic Health
(n=50)
Commercial(n=23)
Other(n=15)
Local Public Health
(n=23)
80%
100%
90%
70%
60%
50%
20%
30%
40%
0%
10%
H it l b dl St ttC i lC OthOtL lLL
Survey Summary report 19
Results
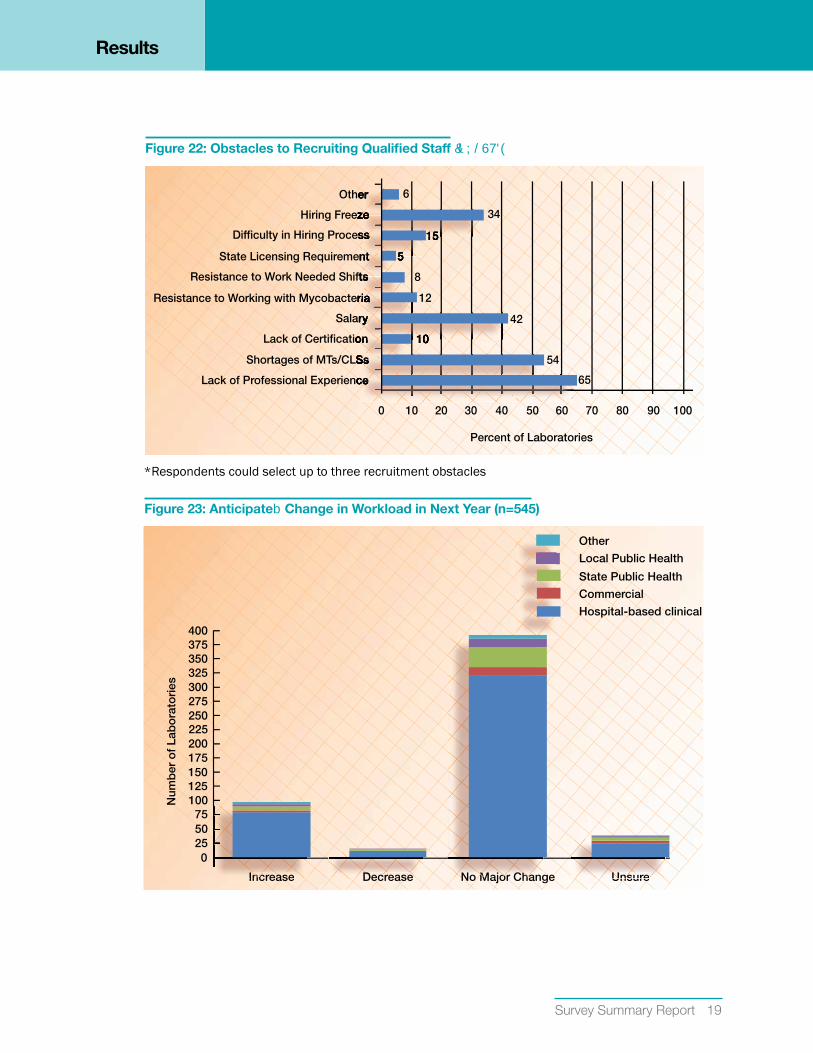
*Respondents could select up to three recruitment obstacles
Figure 22: Obstacles to Recruiting Qualified Staff
Shortages of MTs/CLSs
Lack of Certificatio
Salary
Resistance to Working with Mycobacteria
Resistance to Work Needed Shifts
State Licensing Requirement
Difficulty in Hiring Process
Hiring Freeze
Other
Lack of Professional Experience
6
34
15
5
8
12
42
10
65
0 10 20 30 40 50 60 70 80 90 100
Percent of Laboratories
54
eerrrerr
zzeeeeze
151555
zeezeee
ssssss
5555
ssssss
nntttnntt
r
tstsstsst
riiaaariiriaaiaa
o
ryryyyyy
10100010
ryy
onnoonn
SSsssSSsSssS
ceeeeceeceeec
Figure 23: Anticipate Change in Workload in Next Year (n=545)
Local Public Health
State Public Health
Commercial
Hospital-based clinical
Num
ber
of
Lab
ora
tori
es
Other
200
250275300325350375400
225
175150125
5075
100
025
DecreaseDecreasecr seereDe UnsureUnsurens eurUNo Major ChangeNo Major ChangM or hahaorMNIncreaseIncreasec sanc
20 Association of Public Health Laboratories
Results
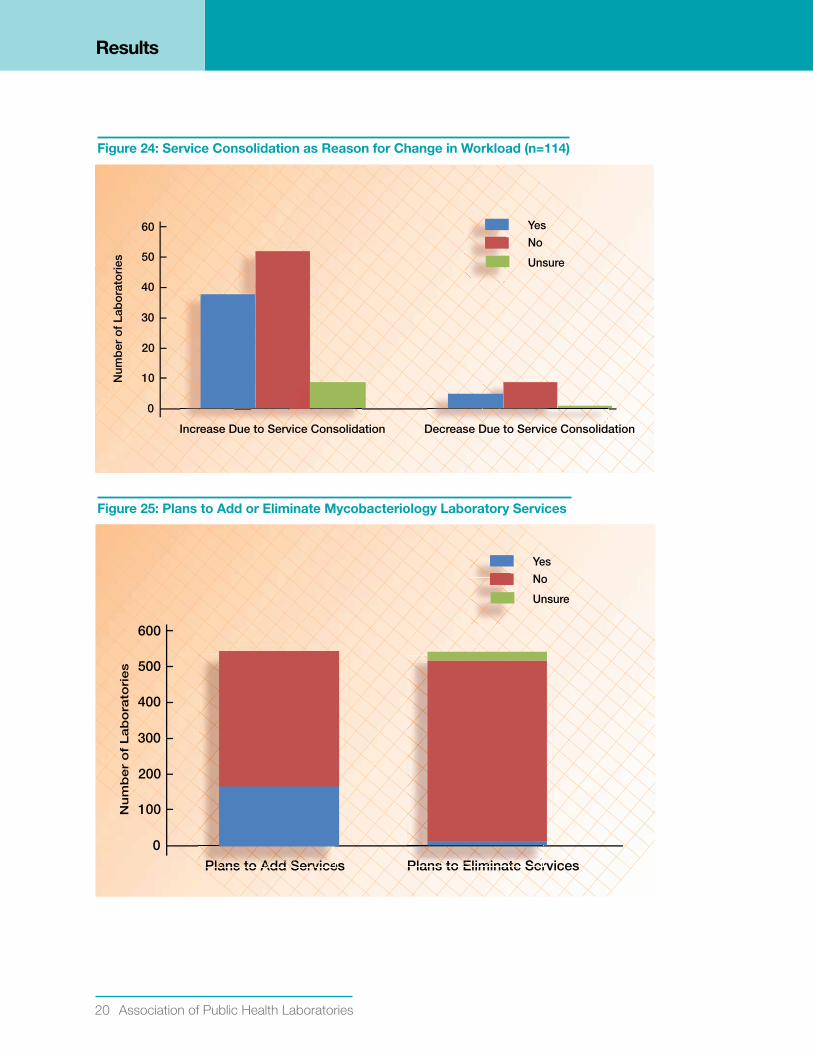
Figure 24: Service Consolidation as Reason for Change in Workload (n=114)
No
Unsure
Yes
400
500
600
300
100
200
0
Decrease Due to Service ConsolidationIncrease Due to Service Consolidation
40
50
60
30
10
20
0
Decrease Due to Service ConsolidationIncrease Due to Service Consolidation
Num
ber
of
Lab
ora
tori
es
Figure 25: Plans to Add or Eliminate Mycobacteriology Laboratory Services
No
Unsure
Yes
400
500
600
300
100
200
0
Plans to Eliminate ServicesPlans to Add Services
Nu
mb
er
of
La
bo
rato
rie
s
400
500
600
300
100
200
0
Plans to Eliminate ServicesPlans to Add Services
Nu
mb
er
of
La
bo
rato
rie
s
PlPPlans to AAdddd SSer iivicela t AAdd SS v eervdd SAAs tlla Plans to Eliminate SerPl s E mi te eSeatemiEs tla
Survey Summary report 21
Results
*Respondents could select multiple responses
*Respondents could select multiple responses
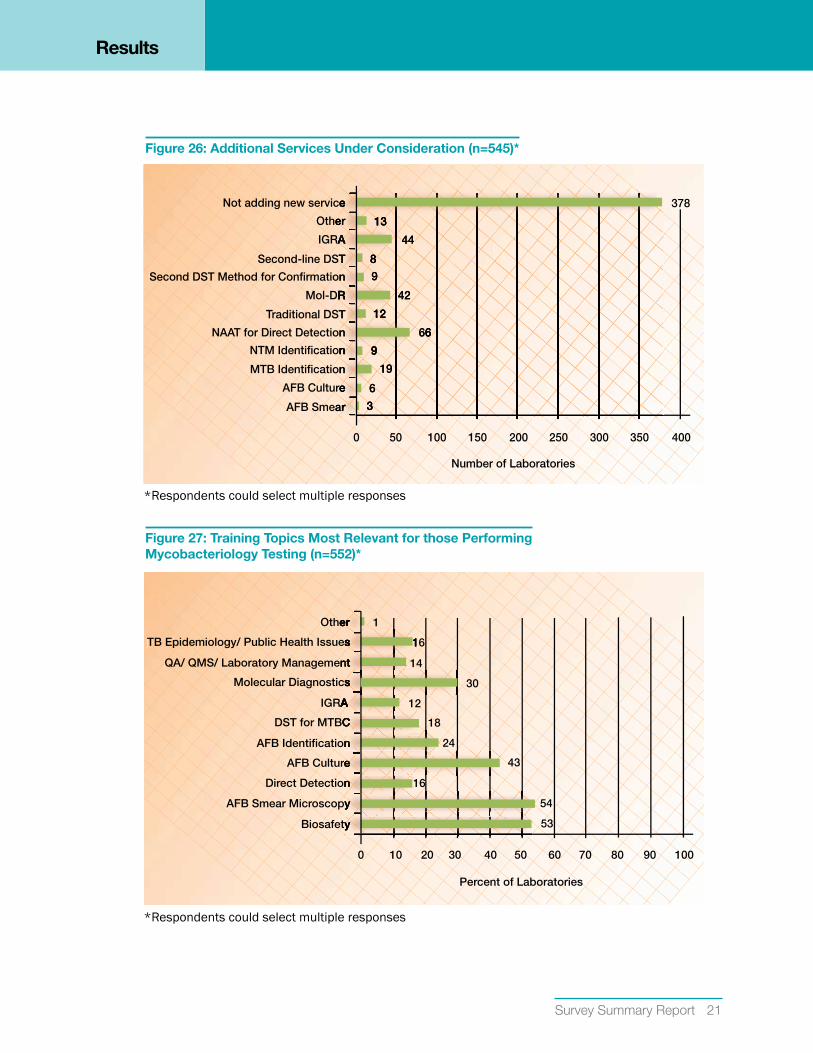
Figure 26: Additional Services under Consideration (n=545)*
AFB Culture
MTB Identification
NTM Identification
NAAT for Direct Detection
Traditional DST
Mol-DR
Second DST Method for Confirmation
Second-line DST
IGRA
Other
378Not adding new service
AFB Smear
13
44
8
9
42
12
66
9
19
0 50 100 150 200 250 300 350 400
Number of Laboratories
6
3
eee
nn
nnnn
nn
TT
RRRR
nn
TT
AAAA
erre
eeee
arrrr
131313
4444
888
99
4242
121212
66666
999
1919
66
333
Figure 27: Training Topics Most Relevant for those Performing Mycobacteriology Testing (n=552)*
Other
TB Epidemiology/ Public Health Issues
QA/ QMS/ Laboratory Management
Molecular Diagnostics
IGRA
DST for MTBC
AFB Identification
AFB Culture
Direct Detection
AFB Smear Microscopy
Biosafety
16
1
14
30
12
18
24
43
16
0 10 20 30 40 50 60 70 80 90 100
Percent of Laboratories
54
53
errererr
sssss 11
nttntt
AAAAAA
CCCC
nnn
eeeee
nnn
yyy
yyyy
sssss
22 Association of Public Health Laboratories
Results
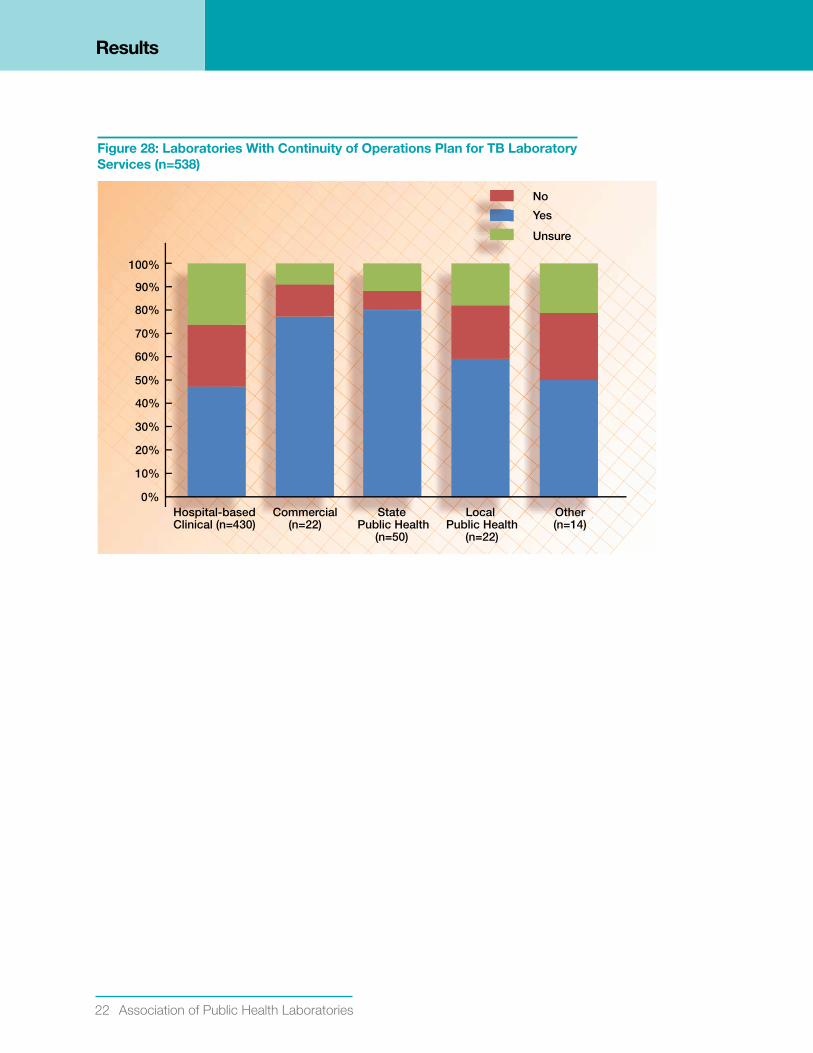
Figure 28: Laboratories With Continuity of Operations Plan for TB Laboratory Services (n=538)
Yes
No
Unsure
Hospital-basedClinical (n=430)
StatePublic Health
(n=50)
Commercial(n=22)
Other(n=14)
Local Public Health
(n=22)
80%
100%
90%
70%
60%
50%
20%
30%
40%
0%
10%

Survey Summary report 23
SuMMARY OF MAjOR FINdINgS
• Survey responses were obtained from 45% of all US laboratories enrolled in a mycobacteriology proficiency testing program in 2009.
• Of the 580 laboratories performing AFB-smear microscopy, 82% also performed AFB culture.
• Most laboratories performing culture refer isolates for MTBC identification, first and second-line DST, and direct detection.
• 81% of laboratories use a fluorescent stain as a primary staining method for AFB-smear microscopy, consistent with CDC recommendations (1, 2).
• 39% of laboratories perform fewer than 15 AFB smears per week. The current ATS and CDC recommendation specifies preparation and examination of at least 15 specimens per week for each microscopist to maintain proficiency (1).
• 15% of laboratories perform direct detection for rapid identification of MTBC from a clinical specimen. Of these, 55% were public health laboratories. Current CDC recommendations encourage the use of nucleic acid amplification testing on at least one respiratory specimen from each patient with signs and symptoms of pulmonary TB for whom a diagnosis of TB is being considered but has not yet been established, and for whom the test results would alter case management or TB control activities (3).
• Of those laboratories performing AFB culture, 40% inoculate fewer than 20 AFB cultures per week. To maintain proficiency in culture and identification of MTBC, it is recommended that laboratories process a minimum of 20 specimens per week (4).
• In 75% of laboratories performing identification in-house, 5% or less of mycobacterial cultures processed within the last year were positive for MTBC.
• In 72% of laboratories performing identification in-house, 4% or more of mycobacterial cultures processed within the last year were positive for nontuberculous mycobacteria.
• 42% of laboratories performing first-line DST perform testing for five or fewer MTBC isolates per month. The current APHL recommendation is referral if performing DST for less than 50 isolates per year (5).
• 72% of laboratories reported access, primarily through referral, for the molecular detection of mutations associated with drug resistance for MTBC.
24 Association of Public Health Laboratories
• The majority of laboratories reported that greater than 80% of AFB-smear results are reported within 24 hours of specimen receipt. However, only 54% of laboratories performing direct detection reported rapid reporting of ≥80% of results within the recommended 48 hours of specimen receipt (3).
• Meeting the recommended turnaround times for identification of MTBC within 21 days and DST within 28 days of specimen receipt was problematic for many laboratories with only 71 of 149 (48%) reporting ≥ 80% of ID within 21 days and 57 of 145 (39%) reporting ≥ 80% of DST results within 28 days.
• 250 of 560 (44%) respondents indicated no obstacles to timely transport of specimens.
• 37% of laboratories have electronic reporting capability for providing results to both the health department and clinical care provider. 34% of public health laboratories have no electronic reporting capability, including 38% of State Public Health Laboratories.
• Most laboratories anticipate no major change in workload during the next year but are considering adding additional services. The three top selections for additional services under consideration include nucleic acid amplification tests for direct detection of MTBC, molecular detection of mutations associated with drug resistance, and IGRA.
Survey Summary report 25
RESOuRCES
APHL TB Laboratory Assessment ToolLaboratories are encouraged to incorporate the use of this tool into their current Quality Assurance practices as a means to determine the existence of areas within individual laboratories that may be in need of improvement.
http://www.aphl.org/aphlprograms/infectious/tuberculosis/Pages/tbtool.aspx
APHL TB Resource PageThis webpage provide access to reports, tools and guidelines developed by APHL’s TB Steering Committee.
http://www.aphl.org/aphlprograms/infectious/tuberculosis/Pages/tbresources.aspx
26 Association of Public Health Laboratories
gLOSSARY OF TERMS
AFB: Acid fast bacilli
Direct detection: Test performed directly from patient specimen (e.g., sputum or bronchial alveolar lavage) for the detection of Mycobacterium tuberculosis complex. Tests may include nucleic acid amplification or direct HPLC.
DST: Drug susceptibility test (i.e., antimicrobial susceptibility test)
HPLC: High performance liquid chromatography
ID: Identification
IGRA: Interferon gamma release assay
LDT: Laboratory developed test
Mol-DR: Molecular detection of mutations associated with drug resistance
MTBC: Mycobacterium tuberculosis complex
QMS: Quality management system
NTM: Nontuberculous mycobacteria
TAT: Turnaround time

Survey Summary report 27
REFERENCES
1. American Thoracic Society; Centers for Disease Control and Prevention; Council of the Infectious Disease Society of America. (2000). Diagnostic standards and classification of tuberculosis in adults and children. American Journal of Respiratory and Critical Care Medicine. 161:1376—1395.
2. Tenover, F.C., J.T. Crawford, R.E. Huebner, L.J. Geiter, C.R. Horsburg Jr., and R.C. Good. (1993). The resurgence of tuberculosis: is your laboratory ready? Journal of Clinical Microbiology. 31: 767-770.
3. Centers for Disease Control and Prevention. (2009). Updated Guidelines for the Use of Nucleic Acid Amplification Tests in the Diagnosis of Tuberculosis. MMWR. 58(01); 7-10.
4. Clinical and Laboratory Standards Institute. Laboratory detection and identification of mycobacteria; approved guideline. CLSI Document M48-A. Wayne, PA: CLSI; 2008.
5. Association of Public Health Laboratories (2007). TB Drug-Susceptibility Testing Expert Panel Meeting. Retrieved August 30, 2011, from http://www.aphl.org/aphlprograms/infectious/ tuberculosis/Documents/TB_DST_Report.pdf
28 Association of Public Health Laboratories
APPENdIx
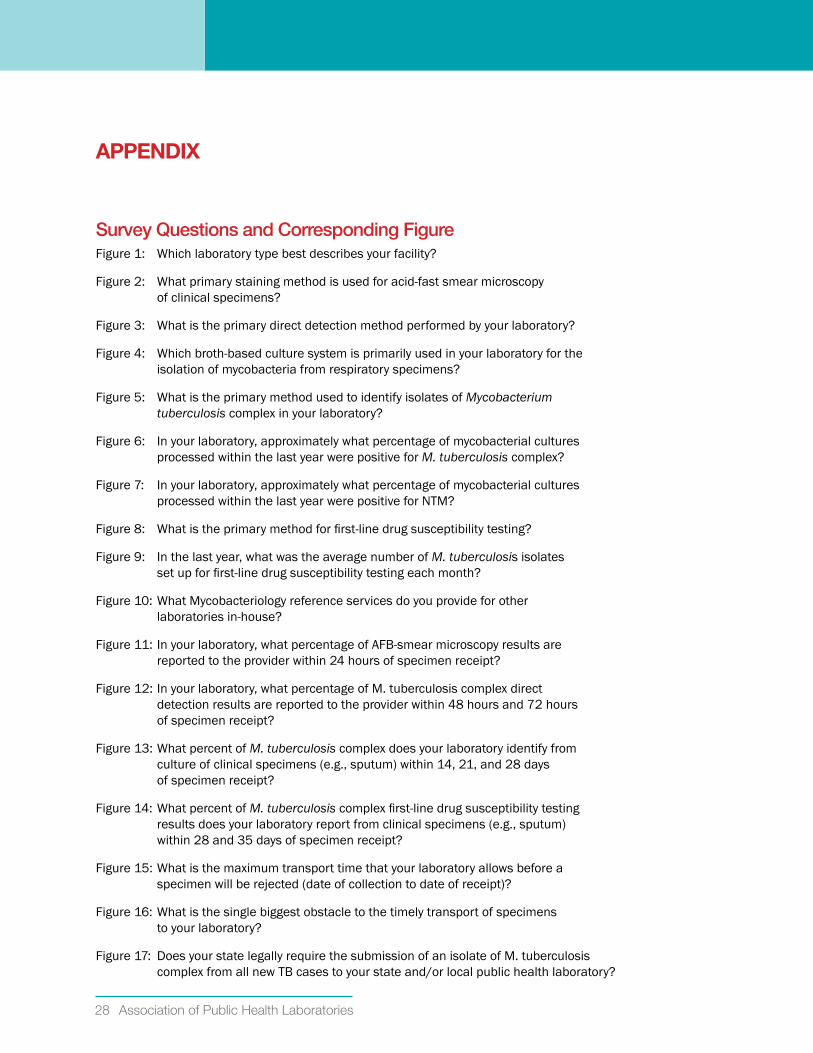
Survey Questions and Corresponding FigureFigure 1: Which laboratory type best describes your facility?
Figure 2: What primary staining method is used for acid-fast smear microscopy of clinical specimens?
Figure 3: What is the primary direct detection method performed by your laboratory?
Figure 4: Which broth-based culture system is primarily used in your laboratory for the isolation of mycobacteria from respiratory specimens?
Figure 5: What is the primary method used to identify isolates of Mycobacterium tuberculosis complex in your laboratory?
Figure 6: In your laboratory, approximately what percentage of mycobacterial cultures processed within the last year were positive for M. tuberculosis complex?
Figure 7: In your laboratory, approximately what percentage of mycobacterial cultures processed within the last year were positive for NTM?
Figure 8: What is the primary method for first-line drug susceptibility testing?
Figure 9: In the last year, what was the average number of M. tuberculosis isolates set up for first-line drug susceptibility testing each month?
Figure 10: What Mycobacteriology reference services do you provide for other laboratories in-house?
Figure 11: In your laboratory, what percentage of AFB-smear microscopy results are reported to the provider within 24 hours of specimen receipt?
Figure 12: In your laboratory, what percentage of M. tuberculosis complex direct detection results are reported to the provider within 48 hours and 72 hours of specimen receipt?
Figure 13: What percent of M. tuberculosis complex does your laboratory identify from culture of clinical specimens (e.g., sputum) within 14, 21, and 28 days of specimen receipt?
Figure 14: What percent of M. tuberculosis complex first-line drug susceptibility testing results does your laboratory report from clinical specimens (e.g., sputum) within 28 and 35 days of specimen receipt?
Figure 15: What is the maximum transport time that your laboratory allows before a specimen will be rejected (date of collection to date of receipt)?
Figure 16: What is the single biggest obstacle to the timely transport of specimens to your laboratory?
Figure 17: Does your state legally require the submission of an isolate of M. tuberculosis complex from all new TB cases to your state and/or local public health laboratory?

Survey Summary report 29
Figure 18: Does your laboratory have the capability to report results electronically to the state or local public health department only, clinical care provider only, both, or your laboratory does not have electronic reporting capability?
Figure 19: Have you experienced staff shortages for Mycobacteriology within the last 12 months?
Figure 20: Have those shortages resulted in a decrease in AFB services or an increase in turnaround times?
Figure 21: Has your laboratory experienced any obstacles in recruiting qualified staff to perform Mycobacteriology testing?
Figure 22: What are the biggest obstacles in recruiting qualified staff to perform Mycobacteriology testing?
Figure 23: Over the next 12 months, does your laboratory plan (or anticipate) changes in the volume of testing performed in house?
Figure 24: You indicated your laboratory is anticipating an increase or decrease in workload. Is this increase due to service consolidation within your network or geographic region?
Figure 25: Does your laboratory have any plans to eliminate Mycobacteriology services within the next 12 months or has your laboratory decreased services within the last 12 months?
Figure 26: Which of the following Mycobacteriology services is your laboratory considering adding?
Figure 27: What training topics are most relevant to those performing Mycobacteriology testing in your laboratory?
Figure 28: Does your laboratory have a Continuity of Operations plan to ensure the uninterrupted provision of TB laboratory services in the event of any unforeseen event that affects laboratory testing capability?
Survey Question and Corresponding TableTable 1: Does your laboratory perform or refer for the following AFB services: AFB-smear microscopy, direct detection, AFB culture, MTBC identification, first-line DST, second-line DST, and IGRA?
Table 2: Approximately how many smears per week does your laboratory process?
Table 3: What is the average number or specimens per week that are set up for culture of AFB in your laboratory?
Table 4: Does your laboratory perform testing for the molecular detection of mutations associated with drug resistance (mol-DR) for M. tuberculosis complex?
Table 5: Does your laboratory perform or refer for the following AFB services: AFB-smear microscopy, direct detection, AFB culture, MTBC identification, first-line DST, second-line DST, and IGRA?
Appendix
30 Association of Public Health Laboratories
ACkNOWLEdgEMENTS
APHL/ CDC National TB Laboratory Services Survey Workgroup
Kathleen Beavis, MD, PhD, FCAPJohn H. Stroger Jr. Hospital of Cook CountyChicago, IL
John Bernardo, MDBoston University School of Medicine
Barbara Body, PhD, D(ABMM)Laboratory Corporation of America
Tracy Dalton, PhDCDC Division of TB Elimination
Denise DunbarLaboratory Services SectionTexas Department of State Health Services
Rosemary Humes, MS, MT(ASCP)SMBARDA, formerly Association of Public Health Laboratories
Ken Jost, Jr., MT(ASCP)Laboratory Services SectionTexas Department of State Health Services
Billie Ann Juni, MSMinnesota Public Health Laboratory Division
Raymond Kaplan, PhDQuest Diagnostics
Mark LamiasStochastic Group
Yvette McCarter, PhDShands HospitalJacksonville, FL
Doug McNamaraAssociation of Public Health Laboratories
Beverly Metchock, DrPH, D(ABMM)CDC Division of TB Elimination
Angela Starks, PhD CDC Division of TB Elimination Becky TempleVermont Department of Health Laboratory
Frances Tyrrell, MPH, MT(ASCP), SMCDC Division of TB Elimination
David Warshauer, PhD, D(ABMM)Wisconsin State Laboratory of Hygiene
Kelly Wroblewski, MPH, MT(ASCP)Association of Public Health Laboratories
Mitch Yakrus, MS, MPHCDC Division of TB Elimination
Susanne Zanto, BS, CLS(NCA)Montana Laboratory Services Bureau
This publication was supported by Cooperative Agreement Number #1U60HM000803 from Centers for Disease Control and Prevention (“CDC”). Its contents are solely the responsibility of the authors and do not necessarily represent the official views of CDC.
Funding support for this publication was provided by National Center for Environmental Health (NCEH); National Center for Zoonotic, Vector-borne, and Enteric Diseases (CK); National Center for Immunization and Respiratory Diseases (IP); National Center for HIV, Viral Hepatitis, STDS and TB Prevention (PS); National Center for Infectious Diseases (NCID) (CID); Office of the Director, Centers for Disease Control & Prevention (ODCDC); National Center for Health Marketing (HM).
The National TB Laboratory Services Survey was financed 100% by Federal funds. The total cost of the project was $120,000.

8515 Georgia Avenue, Suite 700Silver Spring, MD 20910Phone: 240.485.2745Fax: 240.485.2700Web: www.aphl.org