Embed Size (px)
Citation preview

National Survey Results: Identification of Stakeholder Views of Opportunities and Barriers for Organics Waste Reduction and Diversion PN 1575
This report contains information which has been prepared for, but not approved by, the Canadian Council
of Ministers of the Environment (CCME). CCME is committed to reflect the highest standards of research
and analysis in its publications, however it is not responsible for the accuracy of the data contained in this
report and does not warrant the information herein. CCME or its member jurisdictions do not necessarily
share or affirm, in any way, any opinions expressed herein.
© Canadian Council of Ministers of the Environment, 2018
1195 Stellar Drive Newmarket Ontario L3Y 7B8 Canada (Project No) 11103231 | Report No 2 | January 2016

GHD | 2cg | Opportunities and Barriers for Organic Waste Reduction and Diversion | 11103231 (2) | i
Executive Summary
GHD and 2cg (‘Project Team’) were retained by the Canadian Council of Ministers of the Environment (CCME) to develop and administer a stakeholder survey to determine the key opportunities and barriers to organics waste diversion across provinces and territories. Despite diversion efforts across the country, large quantities of organics waste, especially food waste, are still being disposed at landfill. Not only does this represent a loss of resources such as organic matter and nutrients, it contributes to the need to find new and expanded landfill sites, as well as to greenhouse gas (GHG) emissions, leachate generation and the costs associated with managing both landfill gas and leachate.
A survey was developed and distributed to a wide range of stakeholders, including public sector, private sector and industry groups to explore the issue. This included waste generators and waste receivers (processors). The questions facilitated the development of a clear list of barriers but also a list of possible opportunities. In total, 140 responses to the survey were analyzed as part of this report, representing a broad view of organics diversion from across Canada and various sectors and user types.
At the highest level, the survey and subsequent stakeholder interviews identified the following barriers to growth and investment in the organics waste sector, which were common across Canada:
• Lack of over-arching strategy/policy at the Provincial/Territorial levels to increase organics waste diversion.
• Where a program exists, there is a lack of regulation, oversight and enforcement.
• Length of time and cost to obtain approvals for processing facilities.
• Cost difference between diversion and disposal (particularly in the Industrial Commercial and Institutional sector).
• Lack of interest in participating in available opportunities and lack of understanding on how programs work, i.e., education. This applies to both generators and managers.
Further, the survey and subsequent stakeholder interviews identified the following Canada-wide barriers for end markets in the organics waste sector:
• Low market value for compost (in many processing facilities the ratio of revenues is as high as 90% tipping fees and as low as 10% end products)
• Inability to add value to compost
• Difficulty having compost specified for various established uses
• Challenge in removing all contamination from compost
• Competition from other products (particularly from unregulated products)
• Poor understanding/appreciation of compost value in the marketplace
It is reasonable to conclude that the key Canada-wide barrier to organic waste diversion is a lack of provincial/territorial policies to stimulate program development, coupled with cost, with other barriers essentially ancillary to the primary barriers.

GHD | 2cg | Opportunities and Barriers for Organic Waste Reduction and Diversion | 11103231 (2) | ii
While the lack of government regulations and policies was conveyed as a barrier, it was also viewed as an opportunity to assist in implementing a more robust organics diversion program. Other opportunities identified across Canada included:
• Disposal bans
• Educating on the importance of organics diversion and reduction within the residential and Industrial, Commercial and Institutional sector
• Providing funding to develop infrastructure
• Educating generators on how to better manage food waste
• Promoting existing programs
• Collect more data on organics diversion rates across all sectors
• Develop a national compost quality standard
• Connect benefits of organic waste diversion and various processing technologies to international GHG emission reduction objectives using IPC protocols
Through the analysis of barriers and opportunities, the development of a tool kit on how to reduce and divert food waste, in order to educate the various sectors, would assist in addressing some of the common barriers identified. Further, providing a summary of best practices from other jurisdictions within the toolkit, including policies, programs and regulations, would assist in setting the overarching framework for increasing reduction and diversion nationally. In addition, setting policies that support the organics diversion program, which take into consideration the full cycle of the system – reducing at source (generation), collection, processing, end markets - and providing funding, is a key opportunities to address common barriers.
Overall, there is a strong opportunity for increased organics diversion in Canada – even in jurisdictions with established and relatively comprehensive diversion programs.

GHD | 2cg | Opportunities and Barriers for Organic Waste Reduction and Diversion | 11103231 (2) | iii
Résumé
Le Conseil canadien des ministres de l’environnement (CCME) a engagé les firmes GHD et 2cg (« l’équipe du projet ») pour élaborer et effectuer un sondage auprès des parties concernées afin de déterminer les principales possibilités et difficultés associées au détournement des résidus organiques dans l’ensemble des provinces et territoires. Malgré les efforts déployés au Canada pour détourner les résidus organiques, notamment les efforts des municipalités pour mettre en place des programmes de collecte sélective pour ces résidus, de grandes quantités de matières organiques, surtout d’origine alimentaire, aboutissent encore dans les sites d’enfouissement. Non seulement cette pratique représente-t-elle un gaspillage de ressources (p. ex. matières organiques et éléments nutritifs), mais elle nécessite souvent aussi la construction ou l’agrandissement de sites d’enfouissement et génère des émissions de gaz à effet de serre, des lixiviats et des coûts (c.-à-d. les coûts associés à la gestion des gaz d’enfouissement et des lixiviats).
Afin d’approfondir la question, un sondage a été produit et distribué à un large éventail d’acteurs des secteurs public et privé et de l’industrie, y compris des producteurs et des éliminateurs (installations de traitement) de matières résiduelles. Les questions posées ont facilité l’établissement d’une liste d’obstacles évidents, mais aussi d’une liste de possibilités envisageables. Au total, 140 réponses au sondage ont été analysées aux fins de la production du présent rapport, ce qui donne une vision globale du détournement des résidus organiques au Canada dans différents secteurs et chez différents types d’utilisateurs.
Globalement, le sondage et les entretiens subséquents avec les intervenants ont mis en lumière les obstacles suivants à la croissance du secteur et à l’investissement dans la gestion des résidus organiques, obstacles observés couramment d’un bout à l’autre du pays :
• Il n’y a pas de stratégie ni de politique globale à l’échelle provinciale ou territoriale pour augmenter le taux de détournement des résidus organiques.
• Là où il y a un programme, on constate des lacunes au chapitre de la réglementation, de la surveillance et de l’application des règles.
• Faire approuver des installations de traitement des matières résiduelles prend du temps et coûte cher.
• La différence de coût entre le détournement et l’élimination (surtout dans le secteur industriel, commercial et institutionnel).
• Les occasions offertes suscitent peu d’intérêt et le fonctionnement des programmes est mal compris; c’est dû à un manque de sensibilisation, aussi bien dans le cas des producteurs que des gestionnaires.
En outre, le sondage et les entretiens subséquents avec les intervenants ont mis en lumière les obstacles suivants pour les marchés finaux dans le secteur des résidus organiques à la grandeur du Canada :
• Faible valeur marchande du compost (dans beaucoup d’installations de traitement, les redevances d’élimination peuvent représenter jusqu’à 90 % des revenus; les produits finis, à peine 10 %).
• Incapacité d’ajouter de la valeur au compost.
• Difficulté de faire désigner le compost pour différents usages établis.

GHD | 2cg | Opportunities and Barriers for Organic Waste Reduction and Diversion | 11103231 (2) | iv
• Difficulté de débarrasser le compost de tout contaminant.
• Concurrence d’autres produits (surtout de produits non réglementés).
• Mauvaise compréhension ou méconnaissance de l’utilité du compost dans le marché.
Il est raisonnable de conclure que, outre les coûts, le principal obstacle au détournement des résidus organiques au Canada est le manque de politiques provinciales/territoriales pour stimuler la mise en place de programmes, les autres obstacles étant essentiellement accessoires aux premiers.
Le manque de réglementation et de politiques gouvernementales, bien que considéré comme un obstacle, était vu par ailleurs comme une occasion de mettre en place un meilleur programme de détournement des résidus organiques. Voici d’autres possibilités qui ont été évoquées un peu partout au pays :
• Interdire l’élimination.
• Sensibiliser les gens à l’importance du détournement et de la réduction des résidus organiquesdans le secteur résidentiel et dans les secteurs industriel, commercial et institutionnel.
• Fournir du financement pour l’aménagement d’infrastructures.
• Montrer aux producteurs de ces matières comment mieux gérer les résidus alimentaires.
• Faire la promotion des programmes déjà en place.
• Collecter davantage de données sur les taux de détournement des résidus organiques danstous les secteurs.
• Élaborer une norme nationale sur la qualité du compost.
• Relier les avantages du détournement des résidus organiques et de différentes technologies detraitement aux objectifs internationaux de réduction des émissions de gaz à effet de serre àl’aide des protocoles de l’International Food & Agricultural Trade Policy Council (IPC).
Après analyse des obstacles et des possibilités, il apparaît que la création d’une boîte à outils sur la réduction et le détournement des résidus alimentaires, conçue pour éduquer les différents secteurs, aiderait à aplanir certains des obstacles recensés. Intégrer à cette boîte à outils un résumé des meilleures pratiques (politiques, programmes et règlements) employées par diverses autorités compétentes contribuerait à établir un cadre global pour améliorer la réduction et le détournement dans l’ensemble du pays. Enfin, l’adoption de politiques favorables à un programme de détournement des résidus organiques qui prend en considération le cycle complet du système – la réduction à la source (production de matières), la collecte, le traitement et les marchés finaux – ainsi que l’octroi de fonds sont de bons moyens de surmonter certains obstacles communs.
Globalement, le potentiel d’augmentation du taux de détournement des résidus organiques est considérable partout au pays – même là où des programmes relativement complets sont en place.

GHD | 2cg | Opportunities and Barriers for Organic Waste Reduction and Diversion | 11103231 (2) | v
Table of Contents
1. Introduction 1
1.1 Study Objectives ....................................................................................................................... 4
2. Gathering Information 5
2.1 Methodology ............................................................................................................................. 5
2.1.1 Developing the Survey ............................................................................................ 5 2.1.2 Administering the Survey ......................................................................................... 5 2.1.3 Follow-up Interviews ................................................................................................ 7 2.1.4 Data Analysis ........................................................................................................... 7
3. Survey Results 7
3.1 Survey Key ................................................................................................................................ 7
3.2 Geographical Findings .............................................................................................................. 9 3.2.1 National (overall).................................................................................................... 10 3.2.1.1 Key Barriers – National .......................................................................................... 15 3.2.1.2 Key Opportunities – National ................................................................................. 16 3.2.2 Western Canada (Manitoba west) ......................................................................... 17 3.2.3 Ontario ................................................................................................................... 18 3.2.4 Quebec .................................................................................................................. 19 3.2.5 Eastern Canada (New Brunswick east) ................................................................. 21 3.2.6 Northern Canada (Territories) ............................................................................... 22 3.2.7 Key Barriers by Geography ................................................................................... 23 3.2.8 Opportunities by Geography .................................................................................. 24
3.3 Stakeholder Results ................................................................................................................ 24 3.3.1 Public Sector .......................................................................................................... 25 3.3.2 Organic Waste Associations/Organizations .......................................................... 30 3.3.3 Private Sector ........................................................................................................ 35 3.3.4 Key Barriers ........................................................................................................... 40 3.3.5 Opportunities ......................................................................................................... 41
3.4 Summary of Technical, Social and Economic Barriers ........................................................... 42 3.5 Overview of Organic Waste Quantification ............................................................................. 43
3.5.1 Data sets ................................................................................................................ 43 3.5.2 Information availability ........................................................................................... 43 3.5.3 Recommendations ................................................................................................. 44
3.6 Tools and Best Practices ........................................................................................................ 45 3.6.1 Recommendations ................................................................................................. 45
4. What’s Next? 45
4.1 Next Steps .............................................................................................................................. 45
Figure Index
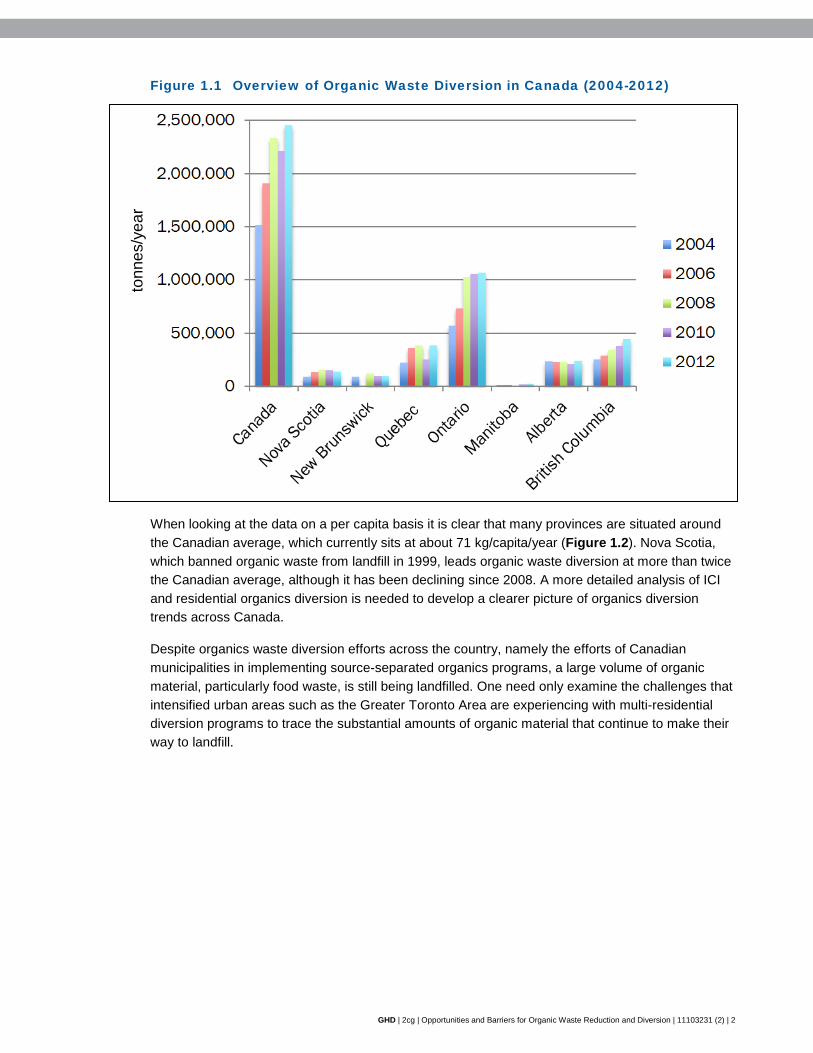
Figure 1.1 Overview of Organic Waste Diversion in Canada (2004-2012) ............................................... 2
Figure 1.2 Overview of Per Capita Organic Waste Diversion in Some Provinces .................................... 3

GHD | 2cg | Opportunities and Barriers for Organic Waste Reduction and Diversion | 11103231 (2) | vi
Appendices Appendix A Survey
Appendix B Detailed Survey Data
B.1 Geographical Summary B.2 National B.3 Western Canada B.4 Ontario B.5 Eastern Canada B.6 Northern Canada B.7 User Type Summary B.8 Government B.9 Organization B.10 Private
Note to Reader
Appendices have been removed.

GHD | 2cg | Opportunities and Barriers for Organic Waste Reduction and Diversion | 11103231 (2) | 1
1. Introduction
GHD and 2cg (‘Project Team’) were retained by the Canadian Council of Ministers of theEnvironment (CCME) to develop and administer a stakeholder survey to determine the keyopportunities and barriers to organics waste1 diversion across provinces and territories. Despitediversion efforts across the country, large quantities of organics waste, especially food waste, arestill being disposed at landfill. Not only does this represent a loss of resources such as organicmatter and nutrients, it contributes to the need to find new and expanded landfill sites, as well as togreenhouse gas (GHG) emissions, leachate generation and the costs associated with managingboth landfill gas and leachate. A survey was developed and distributed to a wide range ofstakeholders, including public sector, private sector and industry groups to explore the issue. Thisincluded waste generators and waste receivers (processors). The questions facilitated thedevelopment of a clear list of barriers but also a list of possible opportunities. In addition, follow-upinterviews to the survey were also completed to augment and build on the survey data.
Generally speaking, organic waste makes up between 25-30 percent of the overall waste stream(predominantly from the Residential sector, based on Provincial/Territorial averages) – more thanany other waste stream in Canada. The latest data from Statistics Canada (June, 2015) show thatthe 2012 diversion of organic waste in Canada has increased by about 11 percent from 2010(Figure 1.1). This increase is significant because it shows that organic waste diversion reboundedafter decreasing from 2008 to 2010, likely as a result of challenging economic times.
Most of this increase came from Quebec, whose organic waste diversion regained 2008 levels afterbeing reduced in 2010, as well as British Columbia and Alberta. However, if one compares 2012diversion with 2008, areas with the strongest growth are British Columbia, Ontario and Manitoba.Both Nova Scotia and New Brunswick organic waste diversion rates are decreasing. A moredetailed analysis of Industrial, Commercial and Institutional (ICI) and residential organics diversionis needed to develop a clearer picture of organics diversion trends across Canada.
1 Organic waste is defined to include all pre- and post-consumer organics materials from the residential, ICI and CRD sectors commonly disposed in landfills or incinerated. This includes food waste, compostable food-soiled paper and cardboard products, leaf and yard wastes and clean untreated wood.
GHD | 2cg | Opportunities and Barriers for Organic Waste Reduction and Diversion | 11103231 (2) | 2
Figure 1.1 Overview of Organic Waste Diversion in Canada (2004-2012)
When looking at the data on a per capita basis it is clear that many provinces are situated around the Canadian average, which currently sits at about 71 kg/capita/year (Figure 1.2). Nova Scotia, which banned organic waste from landfill in 1999, leads organic waste diversion at more than twice the Canadian average, although it has been declining since 2008. A more detailed analysis of ICI and residential organics diversion is needed to develop a clearer picture of organics diversion trends across Canada.
Despite organics waste diversion efforts across the country, namely the efforts of Canadian municipalities in implementing source-separated organics programs, a large volume of organic material, particularly food waste, is still being landfilled. One need only examine the challenges that intensified urban areas such as the Greater Toronto Area are experiencing with multi-residential diversion programs to trace the substantial amounts of organic material that continue to make their way to landfill.
tonn
es/y
ear

GHD | 2cg | Opportunities and Barriers for Organic Waste Reduction and Diversion | 11103231 (2) | 3
Figure 1.2 Overview of Per Capita Organic Waste Diversion in Some Provinces
Note: the above may include both Source Separated Organics (SSO) and industry-sourced organics, depending on the jurisdiction. For example, in Nova Scotia, the decline in total organics is due to closure of pulp mills as this was a major organics source; however the SSO fraction is actually increasing in Nova Scotia.
Organics waste should be treated as a resource, which not only has the ability to reduce the amount of waste taken to landfills and inefficiently disposed of, but also represents a resource that would be rerouted back into the Canadian economy. For example, by removing organics bound for the landfill and utilized in composting or anaerobic digestion, the Provinces and Territories will increase their capture rate of potential GHG emissions – conversely, the capture rate of methane generated by organics in landfills is never complete, despite the use of landfill gas collection and combustion systems at many landfills. Leakage is an ongoing issue that is mitigated by controlled systems such as composting and anaerobic digestion, which further offer the potential for generating value-added fertilizers that then sequester additional carbon as they are used in the agricultural or other sectors. A further and very important benefit is the anaerobic digestion, where there is the additional potential for production of green electricity or renewable natural gas or vehicle fuel.
While there are significant benefits to the diversion and efficient use of organic waste, there are a number of barriers to the reduction and diversion of this particular waste stream. The barriers to organic waste diversion are diverse, but not unique. They include high cost, lack of policy direction, low product value, and concerns around potential environmental impacts. While municipalities have a political mechanism that can be used to make decisions that are not strictly cost-based, the Industrial, Commercial and Institutional (ICI) key decision-making mechanism is still based on cost, although Corporate Social Responsibility (CSR) considerations have changed this for some. The ICI sector is an important sector to pay particular attention to, given that organics waste from ICI is estimated to be approximately 20-25 percent of the overall organics waste stream.

GHD | 2cg | Opportunities and Barriers for Organic Waste Reduction and Diversion | 11103231 (2) | 4
In provinces such as Manitoba and Saskatchewan, a relatively small amount of waste is produced in comparison to other provinces, and waste disposal is generally quite inexpensive. As a result, it becomes difficult to identify a critical mass of organic waste that can be cost-effectively diverted. Nova Scotia removed this barrier by banning organic waste from its landfills, and was the earliest adopter in North America to do so. In some cases, there is political will, particularly for municipal organic waste, to pay a premium to divert it (e.g., City of Edmonton, parts of Ontario such as the Greater Toronto Area and Guelph, another pioneer in this area). This choice is typically made in front of the backdrop of shrinking or non-existent disposal capacity.
At the highest level, the survey and subsequent stakeholder interviews identified the following barriers to growth and investment in the organics waste sector, which were common across Canada:
• Lack of over-arching strategy/policy at the Provincial/Territorial levels (a strategy would providea signal to the market) to increase organics waste diversion.
• Where a program exists, a lack of regulation, oversight and enforcement.
• Length of time and cost to obtain approvals for processing facilities.
• Cost difference between diversion and disposal (particularly in the ICI sector).
• Lack of interest in participating in available opportunities and lack of understanding on howprograms work, i.e., education. This applies to both generators and managers.
Further, the survey and subsequent stakeholder interviews identified the following Canada-wide barriers for end markets in the organics waste sector:
• Low market value for compost (in many processing facilities the ratio of revenues is as high as90% tipping fees and as low as 10% end products)
• Inability to add value to compost
• Difficulty having compost specified for various established uses
• Challenge in removing all contamination from compost
• Competition from other products (particularly from unregulated products)
• Poor understanding/appreciation of compost value in the marketplace
It is reasonable to conclude that the key Canada-wide barrier to organic waste diversion is a lack of provincial/territorial policies to stimulate program development, coupled with cost, with other barriers essentially ancillary to the primary barriers.
1.1 Study Objectives
This report summarizes the survey results as well as analysis on the survey data in order to address the key objectives of the study, namely:
• Identifying the technical, social and economic barriers preventing the diversion of organicsresiduals across Canada
• Identifying a description of tools and best practices which could support governments’ efforts toincrease the diversion of organics residuals through composting, anaerobic digestion or othertechniques

GHD | 2cg | Opportunities and Barriers for Organic Waste Reduction and Diversion | 11103231 (2) | 5
• Providing a description of what information is available on the types and quantities of organicswaste generated, diverted and disposed, as well as how data may be captured going forward
2. Gathering Information
The Project Team developed the survey based on the objectives and guidance provided by CCMEand delivered it to a stakeholder list. The survey was designed to ensure that specific questionswere developed for each sector (residential, ICI, construction, renovation and demolition [CRD]) aswell as for users of organic waste end products. The survey was designed to allow for participantsto answer only the specific sections that were applicable to them. Quantitative survey results havebeen aggregated and stratified by respondent type, while the qualitative responses have beenreviewed by the Project Team and summarized by topic areas that emerged (i.e., if a number ofrespondents share similar insights). Further, the Project Team developed a summary of anyadditional information provided through our follow-up discussions with survey respondents. Thediscussions were undertaken with as many respondents as possible, in order to “drill down” on theirsurvey responses and to allow them to provide additional insights from their perspective.
2.1 Methodology
2.1.1 Developing the Survey
The survey (Appendix A) was developed to address residential, ICI and CRD generation as well asend users of organic waste products. The questions sought to identify barriers and opportunities fororganic waste reduction and diversion as well as to identify possible tools or other means toimprove organic waste reduction and diversion. An initial set of questions was provided by CCMEand used as a starting point for survey development. Two types of survey questions weredeveloped. Most questions involved ranking the top three possibilities from a variety of possibleanswers, while the second type of question was text based or open-ended to allow respondents toelaborate on previous answers or add other relevant information. The survey was prepared usingthe online tool Survey Monkey.
Two main draft survey iterations were prepared and submitted to CCME where the questions,possible answers and overall layout of the survey were reviewed and confirmed prior to launchingthe survey.
2.1.2 Administering the Survey
A stakeholder list (approximately 110) was provided by CCME at the onset of the project, and wasreviewed by the Project Team and finalized, with minimal changes to the original list. Thestakeholder list consisted of relevant levels of government, trade organizations and organic wastesubject matter experts.
Two emails approximately one week apart were sent by CCME to the stakeholder list in advance ofthe survey launch. The purpose of these emails was to prepare the stakeholders for the arrival ofthe survey. The on-line survey was launched by CCME on October 26, 2015 with a deadline ofNovember 9, 2015 for completion. An email reminder was sent by CCME on November 3, 2015 andthe Project Team also sent personalized email reminders to stakeholders who had not responded tothe survey on November 3 and 4, 2015. These reminders also included a pdf copy of the survey sorespondents could print off and review questions prior to completing the online survey.

GHD | 2cg | Opportunities and Barriers for Organic Waste Reduction and Diversion | 11103231 (2) | 6
140 completed responses were received in November 2015. This included 42 from the original stakeholder list (110) along with 98 additional responses. 38 percent of the original stakeholder list responded to the survey, which represents a good survey response rate. Taking into account the additional responses provided beyond the original stakeholder list, there was a total response rate of 67 percent of total potential participants.
There were a high number of responses from organizations that were not on the original stakeholder list as some stakeholders forwarded the survey on to members within their various membership groups. It should be noted that while a number of additional responses were completed by individuals not on the original stakeholder list, the representation from the original stakeholder list represented a broad cross-section of the 4 sectors targeted as part of this study (Residential, ICI, CRD, End-User). In addition, because the survey was forwarded on from the chair of membership organizations to their members, the survey was dispersed in terms of sectors and stakeholders (i.e., generators, managers, end product users). Therefore, even though additional responses were provided by stakeholders not on the original list, the individuals who responded were from within the sectors that were specifically targeted for the purposes of this survey. Overall, the responses to Residential and ICI questions were highest among the 4 sectors targeted.

GHD | 2cg | Opportunities and Barriers for Organic Waste Reduction and Diversion | 11103231 (2) | 7
2.1.3 Follow-up Interviews
Survey respondents were interviewed to allow them to elaborate on their responses and/or provide additional information. The initial plan was to follow-up with those on the stakeholder list. When it became clear that many respondents were additional to the original stakeholder list, the approach used was to attempt to contact each respondent for consistency. This was done through a combination of telephone calls and two emails. Each respondent was contacted to determine if they wished to provide any additional information. Additional information was collected on the spot or an appointment was set to gather this information. For those contacted via telephone, if there was no response, a voicemail message was left including a brief reminder of the survey purpose and stating that all survey respondents were being followed-up with to ask whether they had any further input they would like to provide on the survey and, if so, to call back to discuss. Of those with whom follow-up contact was successfully made over the phone, approximately two-thirds had no further input to provide on the survey. The remaining one-third of follow-up telephone discussions resulted in additional input to the survey.
2.1.4 Data Analysis
Further details on the manner in which the data was segmented, weighted and analyzed is presented in Section 3. Full survey details are also provided in Appendix B, broken into 10 sub-appendices. It should be noted that within some geographical segments and sectors, the number of respondents is on the low end of the sample size, however the intent of this survey was to first and foremost, identify barriers and opportunities at a National level. Further, this survey and analysis of the survey results represents the stakeholder views and perceptions of the opportunities and barriers to organic waste reduction and diversion and does not in any way confirm jurisdictional issues, priorities or consensus on barriers and opportunities for organic waste reduction and diversion. This survey and the analysis of the survey results presents a snapshot of the key issues that may be addressed through further study, research and policy development.
3. Survey Results
3.1 Survey Key
An overview of the survey (Appendix A), key sections and questions is provided as follows.
General Questions
Question 1 – Generic respondent information including, name, organization, location, contact information. A majority of respondents provided all personal information requested, with only 3 respondents electing to skip this particular question.
Residential Questions
These questions are related to the residential waste stream (e.g., food waste, leaf and yard waste). Organic waste reduction relates only to the reduction of food waste.
Question 2 This question was established to ascertain whether the respondent should answer the survey questions with respect to the residential sector, either through generation or management of

GHD | 2cg | Opportunities and Barriers for Organic Waste Reduction and Diversion | 11103231 (2) | 8
residential organic waste. Of the 138 responses to this question, 103 responded “Yes” and would therefore then answer the Residential questions section of the Survey (Questions 3-12).
Questions 3 to 9 These questions are geared towards the generators/managers of residential organic waste and are of a quantitative nature. Respondents were asked to rank the top 3 answers (1 being the highest) although a number of respondents provided rankings for all potential answer options.
Questions 10 to 12 These questions are geared towards the generators/managers of residential organic waste and are of a qualitative nature. Respondents had the ability to provide open responses to qualitative questions with respect to types of data collected, tools and best practices and other general comments on barriers and opportunities to residential organic waste reduction and diversion.
Industrial, Commercial & Institutional Questions
These questions are related to the Industrial, Commercial & Institutional (ICI) waste stream (e.g., food waste, leaf and yard waste). Organic waste reduction relates only to the reduction of food waste.
Question 13 This question was established to ascertain whether the respondent should answer the survey questions with respect to the ICIsector, either through generation or management of ICI organic waste. Of the 135 responses to this question, 93 responded “Yes” and would therefore then answer the ICI questions section of the Survey (Questions 14-23).
Questions 14 to 20 These questions are geared towards the generators/managers of ICI organic waste and are of a quantitative nature. Respondents were asked to rank the top 3 answers (1 being the highest) although a number of respondents provided rankings for all potential answer options.
Questions 21 to 23 These questions are geared towards the generators/managers of ICI organic waste and are of a qualitative nature. Respondents had the ability to provide open responses to qualitative questions with respect to types of data collected, tools and best practices and other general comments on barriers and opportunities to ICI organic waste reduction and diversion.
Construction, Renovation & Demolition Questions
These questions are related to the Construction, Renovation & Demolition (CRD) organics waste stream. For this survey organic CRD waste reduction and diversion relates specifically to clean untreated wood.
Question 24 This question was established to ascertain whether the respondent should answer the survey questions with respect to the CRD sector, either through generation or management of CRD organic waste. Of the 130 responses to this question, 49 responded “Yes” and would therefore then answer the CRD questions section of the Survey (Questions 14-32).
Question 25 to 29 These questions are geared towards the generators/managers of CRD organic waste and are of a

GHD | 2cg | Opportunities and Barriers for Organic Waste Reduction and Diversion | 11103231 (2) | 9
quantitative nature. Respondents were asked to rank the top 3 answers (1 being the highest) although a number of respondents provided rankings for all potential answer options.
Questions 30 to 32 These questions are geared towards the generators/managers of CRD organic waste and are of a qualitative nature. Respondents had the ability to provide open responses to qualitative questions with respect to types of data collected, tools and best practices and other general comments on barriers and opportunities to CRD organic waste reduction and diversion.
End User Questions
These questions are related to the end use of products made from organic wastes.
Question 33 This question was established to ascertain whether the respondent should answer the survey questions with respect to whether they are an end user (“seller” or “buyer”) of products made from organic waste including compost, electricity or biogas. Of the 128 responses to this question, 58 responded “Yes” and would therefore then answer the end user questions section of the Survey (Questions 14-32).
Questions 34 to 39 These questions are geared towards the end users or “sellers” and “buyers” of products made from organic waste and are of a quantitative nature. Respondents were asked to rank the top 3 answers (1 being the highest) although a number of respondents provided rankings for all potential answer options.
Questions 40 to 42 These questions are geared towards the end users or “sellers” and “buyers” of products made from organic waste and are of a qualitative nature. Respondents had the ability to provide open responses to qualitative questions with respect to types of data collected, tools and best practices and other general comments on barriers and opportunities to selling/buying organic waste products (compost, electricity, biogas).
3.2 Geographical Findings
The survey and follow-up interview results were segmented into 4 geographical areas, as well as nationally. The results of both the quantitative and qualitative results for each geographical area are presented in the sub-sections below. It should be noted that for quantitative questions, respondents were asked to rank the top 3 answers (1 being the highest) although a number of respondents provided rankings for all potential answer options. Further, for data analysis purposes the following weighting was applied:
• Ranked #1 = 3 points
• Ranked #2 = 2 points
• Ranked #3 = 1 point
The results were then summed and ranked to provide the top three responses per question. The Project Team also applied an “n-factor” to help assess the intensity of the #1 ranked responses divided by the number of total responses – “Ranked 1st/n” and therefore assists in identifying

GHD | 2cg | Opportunities and Barriers for Organic Waste Reduction and Diversion | 11103231 (2) | 10
stronger responses. Appendix B.1 to B.6 provides full details as well as the calculations applied (n and the n-factor) for each quantitative survey question, as well as the un-adjusted survey results.
In addition to the quantitative questions, each respondent was able to provide additional feedback in a qualitative manner through open-ended responses via text boxes in the survey. In general, each of the 4 main categories of the survey (residential, ICI, CRD and end users) allowed for respondents to provide qualitative responses with respect to types of data collected, tools and best practices and other general comments on barriers and opportunities to organic waste reduction and diversion. Further, some quantitative questions provided an option of “Other” for a response and where a respondent selected the “Other” option, they were directed to provide additional comments/rationale for this particular selection at the end of the section. In general, there was a very good response rate for the qualitative questions, with some common themes evident from the comments provided.
It should be noted that there are 5 geographical sub-sections to this report, with Quebec data provided as a stand-alone from the survey data as this province did not participate in the survey. Therefore, the national survey results were segmented into 4 distinct geographical areas, while the information presented for Quebec was provided by a CCME project team member. The information is based on an organics working group representing individuals within the province’s organics recycling, as well as environmental and government representatives. Section 3.2.4 provides a further description of Quebec’s Action Plan, barriers and opportunities.
3.2.1 National (overall)
The following section highlights the National results of the survey, which highlights the common Canada-wide barriers and opportunities. The national summary includes 140 responses2. Subsequent sections provide a jurisdictional snapshot and identify common trends at the national level. As a summary, Appendix B.1 provides a Table of results by geography (including on a national basis) for each relevant question in the survey which assists in depicting the differences and similarities by geography. Appendix B.2 provides full national survey data and analysis.
From a national residential perspective (Questions 3-12), the top three responses to each of the quantitative questions as well as the commonly occurring qualitative responses are as follows:
Q3 What are the barriers to residential food waste reduction? 1 Residents don’t understand the extent of food waste generation 2 Lack of education on how to better manage food so that it does not become a waste 3 Lack of government policies or programs
Q4 What are the barriers to residential food waste reduction faced by the average
person? 1 Behaviours and attitudes 2 Inefficient shopping 3 Portion sizes
Q5 What are the barriers to residential food waste diversion? 1 Lack of government policies or programs 2 Cost difference between diversion and disposal 3 Lack of government regulations and enforcement
2 Note that some of these responses were completed at a national level only and were therefore only included in
the National datasets.

GHD | 2cg | Opportunities and Barriers for Organic Waste Reduction and Diversion | 11103231 (2) | 11
Q6 What are the barriers to organic waste diversion faced by the average person?
1 Lack of interest in fully participating in available opportunities 2 Lack of understanding of how programs work 3 Lack of opportunities
Q7 What are the opportunities for residential food waste reduction? 1 Educating generators on how to better manage food 2 Government policies or programs 3 Government regulations and enforcement
Q8 What are the opportunities for residential organic waste diversion? 1 Organic waste disposal ban 2 Government policies or programs 3 Government funding to develop infrastructure
Q9 What tools, best practices and/or lessons learned would assist residential
stakeholders in reducing food waste or diverting organic waste? 1 Tool kit on how to reduce and divert food waste from the residential sector 2 Summary of best practices from jurisdictions including services offered, by-laws and
enforcement at the municipal level 3 Summary of best practices from jurisdictions, including policy, programs, and
regulations at the provincial level Q10 What data, if any, does your organization collect on the types and quantities
of residential organic waste generated, disposed or diverted by your organization and/or its members? • Tonnages (i.e., inputs and outputs) • Residential curbside collection rates • Diversion rates • Composition of waste through waste
audits • Contamination rates • Edible vs. non-edible food waste
disposed of • Full mass balance of what is
received and what is sent out
Q11 What tools and/or best practices, if any, does your organization use to reduce
and/or divert residential organic wastes? • Public education and awareness
campaigns (i.e., diversion initiatives, social media, training programs, source separation)
• Provide materials to use the system (i.e., green carts/bags)
• Yard waste and organic curbside collection programs
• Subsidize programs and materials
• Political initiatives (i.e., bylaws banning organics from landfills, mandatory source separation)

GHD | 2cg | Opportunities and Barriers for Organic Waste Reduction and Diversion | 11103231 (2) | 12
Q12 Please include any other thoughts or opinions you have on the barriers and opportunities to residential organic waste reduction and diversion.
• Inconvenience and odours • High costs for program implementation
• Lack of understanding and public awareness on social and environmental responsibility as well as the benefits of organic waste diversion
• Lack of political direction and investment in diversion and program implementation
• Limited availability of funding
From a national ICI perspective (Questions 14-23), the top three responses to each of the quantitative questions as well as the commonly occurring qualitative responses are as follows:
Q14 What are the barriers to ICI food waste reduction? 1 Lack of government regulations and enforcement 2 Low disposal costs of food waste 3 Lack of government policies or programs
Q15 What are the barriers to food waste reduction faced by the average business?
1 Behaviours and attitudes 2 Low cost of disposal 3 Portion sizes
Q16 What are the barriers to ICI food waste diversion?
1 Cost difference between diversion and disposal 2 Lack of government regulations and enforcement 3 Lack of government policies or programs
Q17 What are the barriers to organic waste diversion faced by the average
business? 1 Low cost of disposal 2 Lack of interest in fully participating in available opportunities 3 Lack of opportunities
Q18 What are the opportunities for ICI food waste reduction?
1 Government policies or programs, regulations and enforcement 2 Educating generators on how to better manage food 3 Educating generators on how to donate food to charitable organizations
Q19 What are the opportunities for ICI organic waste diversion?
1 Organic waste disposal ban 2 Government policies, programs, regulations and enforcement 3 Government funding to develop infrastructure
Q20 What tools, best practices and/or lessons learned would assist ICI stakeholders in reducing food waste or diverting organic waste?
1 Tool kit on how to reduce and divert food waste from the ICI sector 2 Summary of best practices from jurisdictions including services offered, by-laws and
enforcement at the municipal level 3 Summary of best practices from jurisdictions, including policy, programs, and
regulations at the provincial level

GHD | 2cg | Opportunities and Barriers for Organic Waste Reduction and Diversion | 11103231 (2) | 13
Q21 What data, if any, does your organization collect on the types and quantities of ICI organic waste generated, disposed or diverted by your organization and/or its members? • Tonnage and volumes (i.e., inputs
and outputs) • Generation, collection and diversion
rates • Waste audits • Amount of materials sold to end
users
Q22 What tools and/or best practices, if any, does your organization use to reduce
and/or divert ICI organic wastes? • Public education and awareness
campaigns (i.e., door-to-door visits, ICI businesses)
• Lower disposal tipping fees for organic waste
• On-site organics management procedures
• Employee training programs
• Volume based-rate system for garbage (no charge for organic waste)
• Composting and diversion containers and equipment
Q23 Please include any other thoughts or opinions you have on the barriers and
opportunities to ICI organic waste reduction and diversion. • Opportunities to implement and
encourage provincial regulations (i.e., mandatory organics diversion in ICI or organics ban in ICI sector)
• Lack of/limited political direction in ICI sectors
• Implementation of tax incentives • Lack of understanding or awareness of programs available for ICI businesses
• Encourage cross-sectoral dialogue • High costs (cheaper to landfill than compost)
From a national CRD perspective (Questions 25-32), the top three responses to each of the quantitative questions as well as the commonly occurring qualitative responses are as follows:
Q25 What are the barriers to clean untreated wood waste reduction? 1 Lack of government policies or programs 2 Lack of education on how to better manage clean untreated wood so that it does
not become waste 3 Lack of government regulations and enforcement
Q26 What are the barriers to clean untreated wood waste diversion?
1 Cost difference between diversion and disposal 2 Lack of government regulations and enforcement 3 Lack of government policies or programs
Q27 What are the opportunities for clean untreated wood waste reduction?
1 Educating generators on how to better manage clean untreated wood 2 Government policies, programs, regulations and enforcement 3 Educating generators on how to donate clean untreated wood to charitable
organizations Q28 What are the opportunities for clean untreated wood waste diversion?
1 Government policies, programs, regulations and enforcement 2 Government funding to develop infrastructure 3 Organic waste disposal ban

GHD | 2cg | Opportunities and Barriers for Organic Waste Reduction and Diversion | 11103231 (2) | 14
Q29 What tools, best practices and/or lessons learned would assist CRD stakeholders in reducing clean untreated wood waste?
1 Summary of best practices from jurisdictions, including policy, programs, and regulations at the provincial level
2 Summary of best practices from jurisdictions including services offered, by-laws and enforcement at the municipal level
3 Detailed data on generation of CRD organic waste streams Q30 What data, if any, does your organization collect on the types and quantities
of CRD organic waste generated, disposed or diverted by your organization and/or its members? • Composition studies (i.e., measure
proportion of CRD waste that is considered clean wood)
• Tonnage and volumes (inputs and outputs, weights of diverted CRD material)
Q31 What tools and/or best practices, if any, does your organization use to reduce
and/or divert CRD organic wastes? • Reduced tipping fees for CRD (i.e.,
wood) materials • Guidelines and regulations
• Public education and awareness campaigns (i.e., educate business and contractors on wood waste)
• CRD (i.e., wood) waste bans in landfills
Q32 Please include any other thoughts or opinions you have on the barriers and
opportunities to CRD organic waste reduction and diversion. • Opportunities to implement a tax to
fund for CRD organic waste • Restrictive provincial regulations
and legislation • Opportunities to implement and
encourage provincial regulations • Develop more end markets/make
them less restrictive
From a national end user perspective (Questions 34-42), the top three responses to each of the quantitative questions as well as the commonly occurring qualitative responses are as follows:
Q34 What are the barriers to selling compost? 1 Low value competing products 2 Low organic waste product value 3 Lack of government policies and regulations requiring/specifying compost usage
Q35 What are the barriers to buying compost?
1 Lack of consumer awareness about products 2 Cheaper competing products such as topsoil and peat moss 3 Poor quality products
Q36 What are the opportunities to selling/buying compost?
1 Educating buyers on how to use compost 2 Government policies, programs, regulations and enforcement 3 Undertaking compost usage trials
Q37 What tools, best practices and/or lessons learned would assist sellers and
buyers of compost? 1 Detailed data on compost quality 2 Guidelines on how to develop procurement specifications for products 3 Summary of best practices from jurisdictions, including policy, programs, and
regulations at the provincial level

GHD | 2cg | Opportunities and Barriers for Organic Waste Reduction and Diversion | 11103231 (2) | 15
Q38 What are the barriers to selling electricity or biogas? 1 Unable to connect to the electricity or natural gas grid 2 Lack of government policies and regulations such as feed-in tariffs (FIT) 3 No market for these products
Q39 What are the opportunities for selling electricity or biogas?
1 Expanded ability to connect to electricity or natural gas grid 2 Government policies, programs and regulations such as feed-in tariffs (FIT) 3 Other (note – respondent was able to provide additional commentary within open
ended question) Q40 What data, if any, does your organization collect on the selling/buying
compost, electricity or biogas? • Tonnage and revenues • Energy produced, gas generation
rates • Sales of materials (i.e., type,
quantity, volumes) • Nutrient analysis of compost
Q41 What tools and/or best practices, if any, does your organization use to assist
with selling/buying compost, electricity or biogas? • Public education campaigns (i.e.,
organic demonstration gardens, improving customer relationships)
• Composting containers/equipment
• CQA methodology and analysis for final product
Q42 Please include any other thoughts or opinions you have on the barriers and
opportunities to selling/buying compost, electricity or biogas. • Lack of and restrictive government
regulations and programs • Product not being sold at high
enough price for the value of the material provided
• High operation and disposal costs • Limited incentives for electricity/biogas
• Public perception of compost (i.e., it is made from garbage)
• Lack of product uptake in the Agricultural sector
• Opportunities to educate the public on the benefits of using compost
With respect to follow-up interviews and additional data gained via this collection method, additional input received ranged from comments on the design of the survey (few); to the need for a national food policy, shifting the focus from diversion to reduction; to supporting farmers in the operation of their own composters, thereby generating revenue for the farmer and ensuring high-quality end-product is available in close proximity to its users (i.e., other farmers).
3.2.1.1 Key Barriers – National
Based on the overall survey results, it is clear that there are common barriers across Canada with respect to food waste reduction and organic waste diversion. The barriers are also common across the four sectors analyzed, with some minor variations from end users (See Appendix B.1).
From a National perspective and across all sectors, stakeholders identified that a common barrier to organics reduction and diversion (across all sectors) relates to the lack of regulations, policies and programs implemented and enforced by government. It should be noted that this relates to both provincial/territorial as well as municipal, but survey respondents pointed more in the direction of an

GHD | 2cg | Opportunities and Barriers for Organic Waste Reduction and Diversion | 11103231 (2) | 16
overarching provincial/territorial direction for policy, rather than at the municipal level. This was confirmed through our follow-up discussions with respondents, who felt that without the proper framework in place from a Regulatory perspective, organics reduction and diversion will reach a peak or has already reached a peak and plateaued in a given jurisdiction. In addition, because the cost difference between disposal and organics waste diversion remains high (i.e., cheaper to dispose), the cheaper option will continue to prevail. This was common for all sectors, but was highlighted more frequently with respect to the ICI sector.
Further to this, respondents believe that a lack of awareness, behaviours and attitudes are a limiting factor to organics reduction and diversion from both a residential and ICI perspective. For the most part, these barriers were inclusive across all geographic segments.
As a summary, the following barriers were identified nationally through the survey as well as during the follow-up telephone interviews and were common across all sectors:
• Regulation and enforcement with respect to source separation
• Lack of political will and leadership
• Education deficit – residents do not have a good understanding of what their options are, how to participate, what can and cannot be composted, and the consequences and overall impacts of their personal decisions
• Inconvenience
• Lack of incentive to participate
• Public perception of processing facilities, especially odour (“NIMBY-ism”)
• Multi-residential buildings not participating
• Private collection companies do not promote and/or offer diversion
• Jurisdictional – need regional/centralized systems
With respect to the End User responses, the common barriers differed from that of other sectors, but were common from a national perspective. It’s clear from the survey results that there appears to be a common theme that there is limited understanding of the agronomic value of compost and the need for and understanding of “compost quality” and high compost quality standards. To that end, the following key national barriers identified for the End User (i.e., compost) sector were:
• Cost to the end-user (purchase, trucking, application, trade-off vs. chemical fertilizer)
• Cost of collection and processing resulting in a low value of end-product
• Strict regulations on end-product deterring some interested in processing organics
• End-product composition not high enough in nutrients to off-set cost due to strict regulations on composition
3.2.1.2 Key Opportunities – National
A common theme across Canada within the Residential, ICI and CRD sectors was that while lack of government regulations and policies can be a barrier to organics waste diversion, it was also viewed as an opportunity. Nationally, jurisdictions identified the need for government policies or programs, regulations and enforcement as key opportunities to assist in implementing a more robust organics diversion program. Organic waste disposal bans were also identified as a key

GHD | 2cg | Opportunities and Barriers for Organic Waste Reduction and Diversion | 11103231 (2) | 17
opportunity, which would fall under the government policy/regulation umbrella. Further, opportunities identified across all jurisdictions related to solving some of the barriers identified around participation from residents and the ICI sector. Educating generators on how to better manage their food and organics waste and promoting the programs that are available to residents and the ICI sector were also identified as key opportunities.
Overall, there is a strong opportunity for increased organics diversion in Canada – even in jurisdictions with established and relatively comprehensive diversion programs.
3.2.2 Western Canada (Manitoba west)
Western Canada, for the purposes of this survey, is defined as Manitoba, Saskatchewan, Alberta and British Columbia and the total responses for this segment were 56 out of the 140 total (40%) responses provided (see Appendix B.3 for further survey details).
With respect to the top three responses provided for the residential survey questions, the results were virtually identical to the national responses, with a key exception that a lack of understanding of best before/expiration dates was identified as a barrier to food waste reduction faced by the average person.
In terms of the residential qualitative survey questions, the responses were similar to national data, particularly as it relates to data collection (i.e., waste characterization studies, audits, etc), with a number of respondents citing recent pilot collection projects currently underway. One particular response to point out relates to the Cowichan Valley Regional District’s (CVRD) recent waste composition study in 2015, where they collaborated with the British Columbia Ministry of Environment (MOE) on a study to determine the degree of edible vs. non-edible food waste (i.e., also often described as avoidable versus unavoidable) disposed of, which was a unique response to this segment – as well as nationally.
In terms of tools and best practices, again, a majority of the qualitative responses were similar to the national summary provided in Section 3.2.2, however there were a number of examples provided around toolkits for Multi-Residential buildings, as this sector is challenging in terms of participation and capture rates.
With respect to the ICI top three responses on the quantitative survey questions, the responses were similar to the national summary, with the exception that detailed data on generation of ICI organic waste streams was mentioned as a tool or best practice that would assist ICI stakeholders in reducing food waste/diverting organic waste.
In terms of the ICI qualitative survey questions, the responses were similar to national data, particularly as it relates to data collection, but there were some unique tools/best practices, such as offering on-site organics management/training guides to determine an optimal collection system within a kitchen, lunchroom, etc. In terms of additional comments on barriers and opportunities in the ICI sector, the common theme revolved around a landfill ban for organics from the ICI sector and the implementation of policies/Regulations to see this type of ban become a reality.
With respect to the top three responses provided for the CRD survey questions, there were a number of differences between the West segment and the national data. Namely, additional barriers to clean untreated wood waste reduction/diversion were identified as low disposal costs of clean untreated wood waste and contamination/inconsistency of the waste stream. In addition, a waste

GHD | 2cg | Opportunities and Barriers for Organic Waste Reduction and Diversion | 11103231 (2) | 18
disposal tax to fund organic waste diversion was identified as an opportunity for clean untreated wood waste diversion.
In terms of the CRD qualitative survey questions, the responses were similar to national data, with a common comment raised with respect to reducing tipping fees for clean wood waste at drop-off facilities/landfills, as well as suggesting that a wood waste ban be implemented at landfills.
With respect to the top three responses provided for the end user survey questions, no differences were identified in comparison to the National data/top 3 responses. In terms of the end user qualitative responses, similar responses to the overall national data were provided. One particular comment with respect to tools and best practices is worth noting, which was that a Stakeholder is currently working on revising the Master Municipal Construction Documents3 to allow/require the use of compost in place of some soil products. This would presumably increase the demand and possible monetary value of compost.
Similar to the above, additional comments were with respect to increasing the use of compost for municipal landscape projects, building developments, erosion control and remediation projects. Further, education on the value and beneficial use of compost for a variety of projects (as listed above) is required to ensure that compost is utilized as a resource.
3.2.3 Ontario
Total responses for this segment were 29 out of the 140 (21%) total responses provided (see Appendix B.4 for further survey details). With respect to the top three responses provided for the residential survey questions, there were some key differences with the national summary results, largely relating to a lack of government funding for programs and infrastructure as well as enforcement as key barriers to residential food waste reduction and diversion.
In terms of the residential qualitative survey questions, the responses were similar to national data, particularly as it relates to data collection (i.e., waste characterization studies, audits, etc), with the specific tool ReTrac Connect cited as a survey tool utilized for organic processing facilities to report on a range of data. In addition, a number of respondents cited pilot collection projects currently underway. For example, one stakeholder commented that a number of test trials are run at their compost facility specifically on new products (i.e., compostable pods) to see if particular products are able to break down within their system. Information from these pilots/tests could be valuable information to share with a wider group of operators.
With respect to tools/best practices, the example of a food waste reduction program was described as a tool that is starting to be implemented/considered in several municipalities in the Greater Toronto Area (GTA) including York Region, Peel Region and the City of Toronto. In addition, several municipalities and other organizations have formed a Southern Ontario Food Collaborative to further address the issue of food waste and to share information and ideas on food and food waste and how best to work together to decrease the amount of food waste and how best to educate the public and other stakeholders on food waste. This collaborative involves all sectors (i.e., all levels of government, Non-Governmental Organizations, Food Producers, Food Processors/Manufacturers, Distributors and Retailers, and Restaurants/Food Services.
3 The Master Municipal Construction Documents Association (MMCDA) supports a standard approach to construction contracts,
which have addressed the needs of British Columbia Municipalities’ infrastructure projects since 1989. https://www.mmcd.net/

GHD | 2cg | Opportunities and Barriers for Organic Waste Reduction and Diversion | 11103231 (2) | 19
Other comments raised through the residential qualitative responses touched on similar elements from the Western Canada geographic segment, specifically with respect to Multi-Residential buildings. The suggestion was made that Municipalities should look at other collection means forfood waste, including in-sink food waste disposers as a component of any organics food waste diversion toolkit. This was limited to Multi-Residential buildings. However, the application of this technology requires a thorough understanding of upstream and downstream elements related to wastewater conveyance, treatment and biosolids production and cost.
With respect to the ICI top three responses on the quantitative survey questions, the responses were similar to the national summary, with the exception that guidelines should be developed on procurement specifications for products as a tool or best practice that would assist ICI stakeholders in reducing food waste/diverting organic waste. ReTrac Connect was also cited as a data gathering tool for the ICI sector, similar to the residential.
In terms of the ICI qualitative survey questions, the responses were similar to national data, particularly as it relates to data collection as well as the government incorporating some form of regulation or legislation (i.e., landfill ban for organics from the ICI sector) in order for the ICI sector to manage the material appropriately. In terms of tools/best practices, one restaurant operator commented that they have developed a model that produces small batches of baked goods more often in order to minimize waste – one small change allowed for a significant reduction in the amount of food waste. Further, a number of restaurants in a given area have come together to consolidate their waste management programs, including organic waste diversion. A common theme raised in the ICI responses related to the cost comparison between disposal versus diversion and specifically to this geographic segment, given the close proximity to the American border and thus cheaper disposal options.
With respect to the top three responses provided for the CRD survey questions, there were a number of similarities between the Central segment and the national data. ReTrac Connect was also cited as a data gathering tool for the CRD sector, similar to the residential and ICI in Ontario. One differing barrier to clean untreated wood waste diversion was with respect to the contamination/inconsistency of the waste stream. This was also identified as a barrier in the West segment.
In terms of the CRD qualitative survey questions, the responses were similar to national data, with a specific comment on the ability to separate on site/at source of waste due to limited space on-site for storage and contamination with other waste due to misuse of on-site bins.
With respect to the top three responses provided for the end user survey questions, no differences were identified in comparison to the National data/top 3 responses. In terms of the end user qualitative responses, similar responses to the overall national data were provided. A lack of uptake of compost by the agricultural sector as well as the perception that municipalities are focused on making their compost go away rather than a marketable product were identified as two key issues of concern.
3.2.4 Quebec
The Government of Quebec adopted a Policy on Residual Materials Management (Politique québécoise de gestion des matières résiduelles in French) accompanied by a 2011-2015 Action

GHD | 2cg | Opportunities and Barriers for Organic Waste Reduction and Diversion | 11103231 (2) | 20
Plan4. One component of the Action Plan was to create a Working Group on Organics Waste Recycling (Table de concertation sur le recyclage des matières organiques in French). The Working Group, established in 2012, is composed of about 30 participants representing all the links of the value chain of Québec organics waste recycling, as well as environmental and government representatives. Prior to the development of its own action plan, the Working Group surveyed its members to identify opportunities and barriers on the recycling of organics waste in Québec. To avoid the unnecessary duplication of effort of having its Working Group members complete a similar survey for this particular study, Québec has instead provided a summary of its Working Group’s work.
The Working Group’s mandate is to identify and implement structural actions to advance the goals of the Québec Policy on Residual Materials Management. More specifically, the Working Group is designed to:
• Develop and structure actions related to decomposable organics matter recycling within an integrated approach
• Work with individuals holding a major role in organics waste diversion, such as municipalities, paper mills, other industries (e.g., food), businesses and institutions, towards the achievement of the Policy’s goals
• Support these partners in addressing the challenges and issues related to organics management, starting with social acceptability, collection, citizen participation, processing and markets
For its 2013-2015 Action Plan, the Working Group identified four priority areas:
1. Enhance recycling of the most easily recyclable organics waste
2. Facilitate decision-making on collection systems, treatment facilities and the production of high quality end-products
3. Develop markets for recycling biosolids, composts and digestates
4. Make information accessible to target audiences
In its work, the Working Group had identified several problems and obstacles to implement activities to support organics waste management. A list of these elements is presented in the Action Plan, (Annex 2) and a summary of the relevant5 items is provided as follows:
• Administrative challenges involved in issuing authorization certificate
• The need to strengthen ties between municipal bodies and the ICI sectors in their territory
• Specific ICI needs in order to promote implementation of residual materials management
• Challenges of collecting from multiple units (i.e., Multi-family residential)
• Data standardization and accessibility
• The importance of identifying the information available and making it readily available
• Collection equipment, solid waste organics processing technology and decision aids
4 https://www.recyc-quebec.gouv.qc.ca/sites/default/files/documents/plan-action-tcmo-2013-2015.pdf 5 It should be noted that this Action Plan includes both organics and biosolids. For the purposes of this report, we
have selected key problems and challenges from Annex 2 as they relate to organics only.

GHD | 2cg | Opportunities and Barriers for Organic Waste Reduction and Diversion | 11103231 (2) | 21
• The social acceptability and importance of information, awareness and education (IAE)
• The need for knowledge of fertilizing residual materials (FRM), including quality, quantity, etc., in relation to inputs, processing methods, procurement and storage conditions, to ensure their best use (right product in the right place)
• Agricultural potential for product recycling (FRM)
• Quality certification tools for products (FRM) and development of markets
• Uncertainty regarding the application of the ban on organic waste disposal
• The interpretation of certain requirements in the guidelines on composting activities
The Working Group’s deliverables are published as they are completed on RECYC-QUÉBEC’s website, the government body overseeing the Working Group’s work. These deliverables are presented under the “organic matter” heading under each of the sections ”Citizens”, "Municipalities" and "Companies and Organizations”.
3.2.5 Eastern Canada (New Brunswick east)
Eastern Canada is defined, for the purposes of this survey, as New Brunswick, Nova Scotia, Prince Edward Island and Newfoundland and Labrador and the total responses for this segment were 17 out of the 140 (12%) total responses provided (see Appendix B.5 for further survey details).
With respect to the top three responses provided for the residential survey questions, there were some key differences with the national summary results, largely relating to a lack of government regulations and enforcement, low disposal costs of food waste as well as contamination or inconsistency of the waste stream.
In terms of the residential qualitative survey questions, the responses were similar to national data, particularly as it relates to data collection (i.e., waste characterization studies, audits, etc). With respect to tools/best practices, the example of clear bags was provided as a method of encouraging and enforcing organics diversion – this practice is increasing in jurisdictions across Canada. As an additional comment, a review of appropriate technologies for deriving value (through energy and sale of final products) from organic waste was raised a potential area of review.
With respect to the ICI top three responses on the quantitative survey questions, the responses were virtually identical to the national summary (as well as the other geographical segments), with the exception that a key barrier to organic waste diversion faced by the average business is a lack of understanding of how diversion programs work.
In terms of the ICI qualitative survey questions, the responses were similar to national data, particularly as it relates to data collection. In terms of tools/best practices, the clear bags policy was cited as an example for the commercial sector as a means of enforcing the landfill ban, which is unique to this geographic segment. Other tools included a reduced tipping fee for source-separated ICI organics ($30/tonne instead of $75/tonne), however this was qualified by indicating that there was little participation in the organics diversion from the ICI sector, mainly due to a lack of willingness to participate, but also a lack of underlying regulation to assist in the implementation.
With respect to the top three responses provided for the CRD survey questions, there were a number of similarities between the Eastern segment and the national data. One differing barrier to

GHD | 2cg | Opportunities and Barriers for Organic Waste Reduction and Diversion | 11103231 (2) | 22
clean untreated wood waste diversion was with respect to a lack of government funding for programs and appropriate infrastructure.
In terms of the CRD qualitative survey questions, the responses were similar to national data, with a specific comment on offering a lower tipping/disposal fee for accepting loads of clean wood, which is then chipped and used for alternative uses (i.e., amendment to compost).
With respect to the top three responses provided for the end user survey questions, no differences were identified in comparison to the National data/top 3 responses. In terms of the end user qualitative responses, similar responses to the overall national data were provided. The overall sentiment was that compost is not being sold for high enough value and that standards should be applied to municipalities so that prices could be set across the board. Further, in many jurisdictions in this segment, it is a challenging business case for electricity and biogas without government subsidies/Feed-In-Tariffs.
3.2.6 Northern Canada (Territories)
Northern Canada is defined, for the purposes of this survey, as Yukon, Northwest Territories and Nunavut. Based on the number of responses, the Northern segment had a low “n” (6 of 140) and it was challenging to analyze this data, particularly for CRD and End User questions. The results are presented below, however they should be reviewed within the context of a relatively small sample size (see Appendix B.6 for further survey details).
With respect to the top three responses provided for the residential survey questions, the Northern geographic segment had more differences in responses than other segments. Namely, low disposal costs of food waste and lack of collection capacity were highlighted as barriers to food waste reduction and diversion. Further, it would appear that based on the response to tools/best practices in reducing/diverting food/organic waste, that there is a lack of detailed data on generation of residential organic waste in the Northern geographic segment.
In terms of the residential qualitative survey questions, the responses on data collection focused on weighing the incoming volumes and outgoing compost, but there was no mention of the standard waste audit/characterization studies, which were commonly noted across Canada. With respect to tools/best practices, one particular example cited their ability to distribute food to organizations, where this material would have otherwise been destined for a landfill. Other comments discussed the issue with the gap in commercial waste collection services as well as major challenges with physical space in built-up areas. The other major challenge cited is in relation to extreme cold in winter and organics becoming frozen inside carts and bins when collecting the material.
With respect to the ICI top three responses on the quantitative survey questions, the Northern geographic segment had more differences in responses than other segments. Costs were highlighted as barriers to food waste reduction, specifically costs associated with food donations. In addition, education was highlighted as a barrier in terms of understanding best before/expiration dates as well as a lack of understanding on how diversion programs work. Further, it would appear that based on the response to tools/best practices in reducing/diverting food/organic waste, that there is a lack of detailed data on generation of ICI organic waste in the Northern geographic segment.
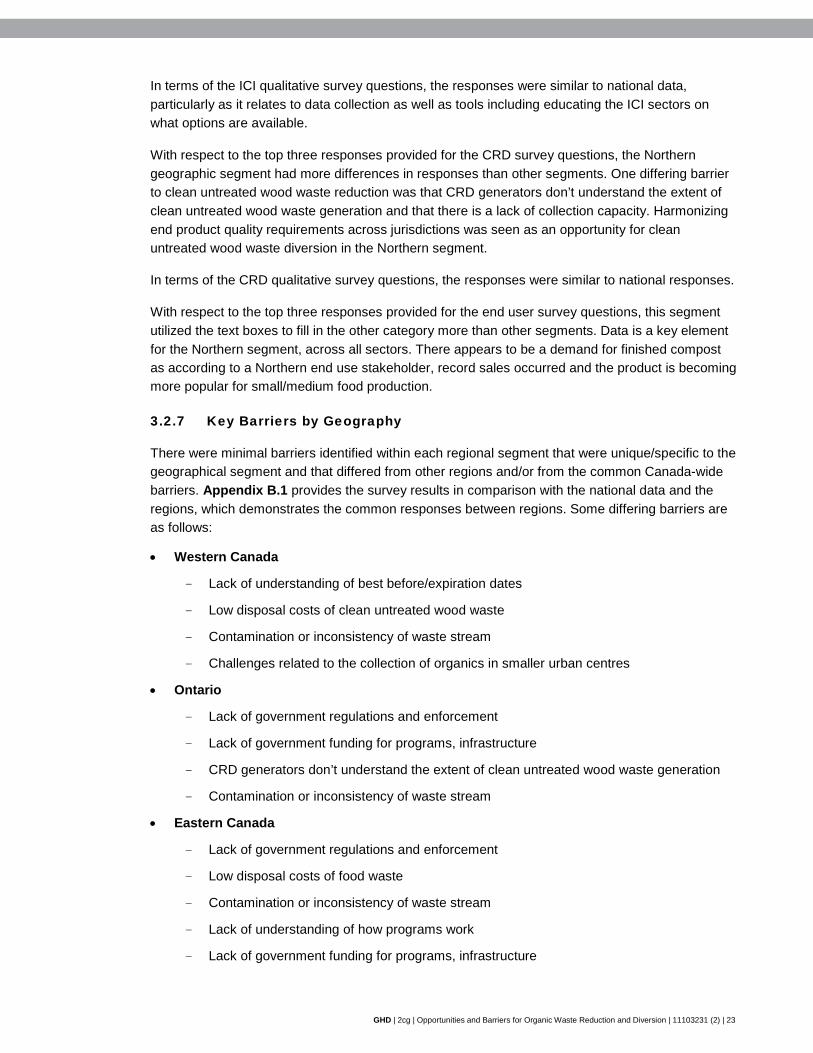
GHD | 2cg | Opportunities and Barriers for Organic Waste Reduction and Diversion | 11103231 (2) | 23
In terms of the ICI qualitative survey questions, the responses were similar to national data, particularly as it relates to data collection as well as tools including educating the ICI sectors on what options are available.
With respect to the top three responses provided for the CRD survey questions, the Northern geographic segment had more differences in responses than other segments. One differing barrier to clean untreated wood waste reduction was that CRD generators don’t understand the extent of clean untreated wood waste generation and that there is a lack of collection capacity. Harmonizing end product quality requirements across jurisdictions was seen as an opportunity for clean untreated wood waste diversion in the Northern segment.
In terms of the CRD qualitative survey questions, the responses were similar to national responses.
With respect to the top three responses provided for the end user survey questions, this segment utilized the text boxes to fill in the other category more than other segments. Data is a key element for the Northern segment, across all sectors. There appears to be a demand for finished compost as according to a Northern end use stakeholder, record sales occurred and the product is becoming more popular for small/medium food production.
3.2.7 Key Barriers by Geography
There were minimal barriers identified within each regional segment that were unique/specific to the geographical segment and that differed from other regions and/or from the common Canada-wide barriers. Appendix B.1 provides the survey results in comparison with the national data and the regions, which demonstrates the common responses between regions. Some differing barriers are as follows:
• Western Canada
- Lack of understanding of best before/expiration dates
- Low disposal costs of clean untreated wood waste
- Contamination or inconsistency of waste stream
- Challenges related to the collection of organics in smaller urban centres
• Ontario
- Lack of government regulations and enforcement
- Lack of government funding for programs, infrastructure
- CRD generators don’t understand the extent of clean untreated wood waste generation
- Contamination or inconsistency of waste stream
• Eastern Canada
- Lack of government regulations and enforcement
- Low disposal costs of food waste
- Contamination or inconsistency of waste stream
- Lack of understanding of how programs work
- Lack of government funding for programs, infrastructure

GHD | 2cg | Opportunities and Barriers for Organic Waste Reduction and Diversion | 11103231 (2) | 24
• Northern Canada
- Weather (extreme cold)
On a region to region comparison, the additional barriers outside of those that are common to the national level, are not dissimilar. This is with the exception of the weather (extreme cold) in Northern Canada. Contamination or inconsistency of the waste stream was identified by all other regions, which is a common issue. Other key differences relate to the barriers created in increasing organics diversion due to low disposal costs for particular material. This may be based on specific geographic market conditions.
3.2.8 Opportunities by Geography
Similar to the barriers identified in 3.2.8, there were minimal opportunities identified within each regional segment that were unique/specific to the geographical segment and that differed from other regions and/or from the common Canada-wide opportunities. Appendix B.1 provides the survey results in comparison with the national data and the Regions, which demonstrates the common responses between regions. Some differing opportunities are as follows:
• Western Canada
- Revising existing construction practices (i.e., MMCD) to require the use of compost in future developments
• Ontario
- Look to increase Multi-Residential participation by reviewing potential technologies/ collection methods
• Northern Canada
- Harmonize end product quality requirements across jurisdictions
On a region to region comparison, the additional opportunities outside of those that are common to the national level, are not dissimilar. Generally, British Columbia has been at the forefront in adopting additional tools to increase organics diversion, including setting aggressive targets for landfill bans on organics. Ontario has minimal policy tools in the way of a ban, and instead relies on collection options to create more opportunities for organics diversion, including clear garbage bags and bi-weekly residual waste collection.
3.3 Stakeholder Results
In addition to reviewing the survey results on a geographical basis, the data was segmented by user types. Given that the majority of respondents would be defined as “Managers”, the following section breaks down the data into the categories of:
• Public Sector
• Organic Waste Associations/Organizations (non-profit organizations)
• Private Sector
The categories above include generators, processors and end users.

GHD | 2cg | Opportunities and Barriers for Organic Waste Reduction and Diversion | 11103231 (2) | 25
It should be noted that for quantitative questions, respondents were asked to rank the top three answers (1 being the highest) although a number of respondents provided rankings for all potential answer options. Further, for data analysis purposes the following weighting was applied:
• Ranked #1 = 3 points
• Ranked #2 = 2 points
• Ranked #3 = 1 point
The results were then summed and ranked to provide the top three responses per question. The Project Team also applied an “n-factor” to help assess the intensity of the #1 ranked responses divided by the number of total responses – “Ranked 1st/n” and therefore assists in identifying stronger responses. Appendix B.7 to B.10 provides full details as well as the calculations applied (n and the n-factor) for each quantitative survey question, as well as the un-adjusted survey results.
In addition to the quantitative questions, each respondent was able to provide additional feedback in a qualitative manner through open-ended responses via text boxes in the survey. In general, each of the 4 main categories of the survey (residential, ICI, CRD and end users) allowed for respondents to provide qualitative responses with respect to types of data collected, tools and best practices and other general comments on barriers and opportunities to organic waste reduction and diversion. Further, some quantitative questions provided an option of “Other” for a response and where a respondent selected the “Other” option, they were directed to provide additional comments/rationale for this particular selection at the end of the section. In general, there was a very good response rate for the qualitative questions, with some common themes evident from the comments provided.
3.3.1 Public Sector
The following table presents the results of the government representatives from a residential perspective. 59 survey responses are included in these results, which provide the top 3 answers (1 being the highest) and utilize an n-factor similar to the geographical assessment. As a summary, Appendix B.7 provides a Table of results by user type for each relevant question in the survey which assists in depicting the differences and similarities. Full data and analysis for the Public Sector is provided in Appendix B.8.
Q3 What are the barriers to residential food waste reduction? 1 Residents don’t understand the extent of food waste generation 2 Lack of government regulations and enforcement 3 Lack of education on how to better manage food so that it does not become a waste
Q4 What are the barriers to residential food waste reduction faced by the average
person? 1 Behaviours and attitudes 2 Inefficient shopping 3 Portion sizes
Q5 What are the barriers to residential food waste diversion? 1 Cost difference between diversion and disposal 2 Lack of government policies or programs 3 Lack of government regulations and enforcement

GHD | 2cg | Opportunities and Barriers for Organic Waste Reduction and Diversion | 11103231 (2) | 26
Q6 What are the barriers to organic waste diversion faced by the average person?
1 Lack of interest in fully participating in available opportunities 2 Lack of understanding of how programs work 3 Lack of opportunities
Q7 What are the opportunities for residential food waste reduction? 1 Educating generators on how to better manage food 2 Government policies or programs 3 Government regulations and enforcement
Q8 What are the opportunities for residential organic waste diversion? 1 Organic waste disposal ban 2 Government policies or programs 3 Government regulations and enforcement
Q9 What tools, best practices and/or lessons learned would assist residential
stakeholders in reducing food waste or diverting organic waste? 1 Tool kit on how to reduce and divert food waste from the residential sector 2 Summary of best practices from jurisdictions including services offered, by-laws and
enforcement at the municipal level 3 Summary of best practices from jurisdictions, including policy, programs, and
regulations at the provincial level Q10 What data, if any, does your organization collect on the types and quantities
of residential organic waste generated, disposed or diverted by your organization and/or its members? • Tonnages (i.e., inputs and outputs) • Residential curbside collection rates • Diversion rates • Composition of waste through waste
audits • Contamination rates • Edible vs. non-edible food waste
disposed of • Full mass balance of what is
received and what is sent out • Results from Pilot Studies
Q11 What tools and/or best practices, if any, does your organization use to reduce
and/or divert residential organic wastes? • Public education and awareness
campaigns (i.e., diversion initiatives, social media, training programs, source separation)
• Provide materials to use the system (i.e., green carts/ bags)
• Yard waste and organic curbside collection programs
• Subsidize programs and materials
• Political initiatives (i.e., bylaws banning organics from landfills, mandatory source separation)
Q12 Please include any other thoughts or opinions you have on the barriers and
opportunities to residential organic waste reduction and diversion. • Inconvenience and odours • High costs for program
implementation • Lack of understanding and public
awareness on social and environmental responsibility as well as the benefits of organic waste diversion
• Lack of political direction and investment in diversion and program implementation

GHD | 2cg | Opportunities and Barriers for Organic Waste Reduction and Diversion | 11103231 (2) | 27
• Limited availability of funding • Lack of appropriate processing locations and technologies
The following table presents the results of the government representatives from an ICI perspective. 41 survey responses are included in these results, which provide the top 3 answers (1 being the highest). Full results are included in Appendix B.8.
Q14 What are the barriers to ICI food waste reduction? 1 Lack of government regulations and enforcement 2 Low disposal costs of food waste 3 Lack of government policies or programs
Q15 What are the barriers to food waste reduction faced by the average business?
1 Behaviours and attitudes 2 Low cost of disposal 3 Portion sizes
Q16 What are the barriers to ICI food waste diversion?
1 Cost difference between diversion and disposal 2 Lack of government regulations and enforcement 3 Lack of government policies or programs
Q17 What are the barriers to organic waste diversion faced by the average
business? 1 Low cost of disposal 2 Lack of interest in fully participating in available opportunities 3 Lack of opportunities
Q18 What are the opportunities for ICI food waste reduction?
1 Government policies or programs, regulations and enforcement 2 Educating generators on how to better manage food 3 Educating generators on how to donate food to charitable organizations
Q19 What are the opportunities for ICI organic waste diversion?
1 Government policies, programs, regulations and enforcement 2 Organic waste disposal ban 3 Government funding to develop infrastructure
Q20 What tools, best practices and/or lessons learned would assist ICI
stakeholders in reducing food waste or diverting organic waste? 1 Tool kit on how to reduce and divert food waste from the ICI sector 2 Summary of best practices from jurisdictions including services offered, by-laws and
enforcement at the municipal level 3 Summary of best practices from jurisdictions, including policy, programs, and
regulations at the provincial level Q21 What data, if any, does your organization collect on the types and quantities
of ICI organic waste generated, disposed or diverted by your organization and/or its members? • Tonnage and volumes (i.e., inputs
and outputs) • Generation, collection and diversion
rates • Waste audits • Amount of materials sold to end
users

GHD | 2cg | Opportunities and Barriers for Organic Waste Reduction and Diversion | 11103231 (2) | 28
Q22 What tools and/or best practices, if any, does your organization use to reduce and/or divert ICI organic wastes? • Public education and awareness
campaigns (i.e., door-to-door visits, ICI businesses)
• Lower disposal tipping fees for organic waste
• On-site organics management procedures
• Employee training programs
• Volume based-rate system for garbage (no charge for organic waste)
• Composting and diversion containers and equipment
Q23 Please include any other thoughts or opinions you have on the barriers and
opportunities to ICI organic waste reduction and diversion. • Opportunities to implement and
encourage provincial regulations (i.e., mandatory organics diversion in ICI or organics ban in ICI sector)
• Lack of/ limited political direction in ICI sectors and prioritization
• Implementation of tax incentives • Lack of understanding or awareness of programs available for ICI businesses
• Encourage cross-sectoral dialogue • High costs (cheaper to landfill than compost)
The following table presents the results of the government representatives from a CRD perspective. 32 survey responses are included in these results, which provide the top 3 answers (1 being the highest) Full results are included in Appendix B.8.
Q25 What are the barriers to clean untreated wood waste reduction? 1 Low disposal costs of clean untreated wood waste 2 Lack of education on how to better manage clean untreated wood so that it does
not become waste 3 Lack of government policies or programs
Q26 What are the barriers to clean untreated wood waste diversion?
1 Cost difference between diversion and disposal 2 Lack of government regulations and enforcement 3 Lack of government policies or programs
Q27 What are the opportunities for clean untreated wood waste reduction?
1 Educating generators on how to better manage clean untreated wood 2 Government policies, programs, regulations and enforcement 3 Educating generators on how to donate clean untreated wood to charitable
organizations Q28 What are the opportunities for clean untreated wood waste diversion?
1 Government policies, programs, regulations and enforcement 2 Organic waste disposal ban 3 Government funding to develop infrastructure
Q29 What tools, best practices and/or lessons learned would assist CRD
stakeholders in reducing clean untreated wood waste? 1 Summary of best practices from jurisdictions, including policy, programs, and
regulations at the provincial level 2 Detailed data on generation of CRD organic waste streams 3 Summary of best practices from jurisdictions including services offered, by-laws and
enforcement at the municipal level

GHD | 2cg | Opportunities and Barriers for Organic Waste Reduction and Diversion | 11103231 (2) | 29
Q30 What data, if any, does your organization collect on the types and quantities of CRD organic waste generated, disposed or diverted by your organization and/or its members? • Composition studies (i.e., measure
proportion of CRD waste that is considered clean wood)
• Tonnage and volumes (inputs and outputs, weights of diverted CRD material)
Q31 What tools and/or best practices, if any, does your organization use to reduce
and/or divert CRD organic wastes? • Reduced tipping fees for CRD (i.e.,
wood) materials • Guidelines and regulations
• Public education and awareness campaigns (i.e., educate business and contractors on wood waste)
• CRD (i.e., wood) waste bans in landfills
Q32 Please include any other thoughts or opinions you have on the barriers and
opportunities to CRD organic waste reduction and diversion. • Opportunities to implement a tax to
fund/subsidize for CRD organic waste
• Restrictive provincial regulations and legislation
• Opportunities to implement and encourage provincial regulations
• Lack of end markets/ Develop more end markets/ make them less restrictive
The following table presents the results of the government representatives from an end user perspective. 24 survey responses are included in these results, which provide the top 3 answers (1 being the highest). Full results are included in Appendix B.8.
Q34 What are the barriers to selling compost? 1 Low value competing products 2 Low organic waste product value 3 Lack of government policies and regulations requiring/specifying compost usage
Q35 What are the barriers to buying compost?
1 Lack of consumer awareness about products 2 Cheaper competing products such as topsoil and peat moss 3 Poor quality products
Q36 What are the opportunities to selling/buying compost?
1 Educating buyers on how to use compost 2 Undertaking compost usage trials 3 Continue developing/encourage the use of certification programs (e.g., Compost
Quality Alliance) Q37 What tools, best practices and/or lessons learned would assist sellers and
buyers of compost? 1 Detailed data on compost quality 2 Summary of best practices from jurisdictions, including policy, programs, and
regulations at the provincial level 3 Guidelines on how to develop procurement specifications for products
Q38 What are the barriers to selling electricity or biogas?
1 Unable to connect to the electricity or natural gas grid 2 Lack of government policies and regulations such as feed-in tariffs (FIT) 3 No market for these products

GHD | 2cg | Opportunities and Barriers for Organic Waste Reduction and Diversion | 11103231 (2) | 30
Q39 What are the opportunities for selling electricity or biogas? 1 Expanded ability to connect to electricity or natural gas grid 2 Government policies, programs and regulations such as feed-in tariffs (FIT) 3 Other (note – respondent was able to provide additional commentary within open
ended question) Q40 What data, if any, does your organization collect on the selling/buying
compost, electricity or biogas? • Tonnage and revenues • Energy produced, gas generation
rates • Sales of materials (i.e., type,
quantity, volumes) • Nutrient analysis of compost
Q41 What tools and/or best practices, if any, does your organization use to assist
with selling/buying compost, electricity or biogas? • Public education campaigns (i.e.,
organic demonstration gardens, improving customer relationships)
• Composting containers/ equipment
• CQA methodology and analysis for final product
Q42 Please include any other thoughts or opinions you have on the barriers and
opportunities to selling/buying compost, electricity or biogas. • Lack and restrictive of government
regulations and programs • Product not being sold at high
enough price for the value of the material provided
• High operation and disposal costs • Limited incentives for electricity/biogas
• Public perception of compost (i.e., it is made from garbage)
• Lack of product uptake in the Agricultural sector
• Opportunities to educate the public on the benefits of using compost
3.3.2 Organic Waste Associations/Organizations
The following table presents the results of the organic waste associations/organizations from a Residential perspective. Seventeen survey responses are included in these results, which provide the top 3 answers (1 being the highest). Full results are included in Appendix B.9.
Q3 What are the barriers to residential food waste reduction? 1 Residents don’t understand the extent of food waste generation 2 Low disposal costs of food waste 3 Lack of government policies or programs
Q4 What are the barriers to residential food waste reduction faced by the average
person? 1 Behaviours and attitudes 2 Inefficient shopping 3 Lack of understanding of best before/ expiration dates
Q5 What are the barriers to residential food waste diversion? 1 Lack of government policies or programs 2 Cost difference between diversion and disposal 3 Lack of government funding for programs, infrastructure, etc.

GHD | 2cg | Opportunities and Barriers for Organic Waste Reduction and Diversion | 11103231 (2) | 31
Q6 What are the barriers to organic waste diversion faced by the average person?
1 Lack of opportunities 2 Lack of interest in fully participating in available opportunities 3 Lack of understanding of how programs work
Q7 What are the opportunities for residential food waste reduction? 1 Educating generators on how to better manage food 2 Government policies or programs 3 Government regulations and enforcement
Q8 What are the opportunities for residential organic waste diversion? 1 Government policies or programs 2 Government funding to develop infrastructure 3 Organic waste disposal ban
Q9 What tools, best practices and/or lessons learned would assist residential
stakeholders in reducing food waste or diverting organic waste? 1 Tool kit on how to reduce and divert food waste from the residential sector 2 Summary of best practices from jurisdictions including services offered, by-laws and
enforcement at the municipal level 3 Summary of best practices from jurisdictions, including policy, programs, and
regulations at the provincial level Q10 What data, if any, does your organization collect on the types and quantities
of residential organic waste generated, disposed or diverted by your organization and/or its members? • Tonnages (i.e., inputs and outputs) • Residential curbside collection rates • Diversion rates • Composition of waste through waste
audits • Specific tool – ReTrac Connect
Q11 What tools and/or best practices, if any, does your organization use to reduce
and/or divert residential organic wastes? • Public education and awareness
campaigns (i.e., diversion initiatives, social media, training programs, source separation)
• Provide materials to use the system (i.e., green carts/ bags)
• Yard waste and organic curbside collection programs
• Subsidize programs and materials
• Political initiatives (i.e., bylaws banning organics from landfills, mandatory source separation)
• Setting up food waste cooperatives
Q12 Please include any other thoughts or opinions you have on the barriers and
opportunities to residential organic waste reduction and diversion. • Inconvenience and odours • High costs for program
implementation • Lack of understanding and public
awareness on social and environmental responsibility as well as the benefits of organic waste diversion
• Lack of political direction and investment in diversion and program implementation - need political will/champion
• Limited availability of funding • Lack of appropriate processing locations and technologies

GHD | 2cg | Opportunities and Barriers for Organic Waste Reduction and Diversion | 11103231 (2) | 32
The following table presents the results of the organic waste associations/organizations from an ICI perspective. Eighteen survey responses are included in these results, which provide the top 3 answers (1 being the highest). Full results are included in Appendix B.9.
Q14 What are the barriers to ICI food waste reduction? 1 Lack of government policies or programs 2 Lack of government regulations and enforcement 3 Low disposal costs of food waste
Q15 What are the barriers to food waste reduction faced by the average business?
1 Behaviours and attitudes 2 Low cost of disposal 3 Portion sizes
Q16 What are the barriers to ICI food waste diversion?
1 Lack of government policies or programs 2 Lack of government regulations and enforcement 3 Cost difference between diversion and disposal
Q17 What are the barriers to organic waste diversion faced by the average
business? 1 Low cost of disposal 2 Lack of opportunities 3 Lack of interest in fully participating in available opportunities
Q18 What are the opportunities for ICI food waste reduction?
1 Government policies or programs, regulations and enforcement 2 Educating generators on how to better manage food 3 Educating generators on how to donate food to charitable organizations
Q19 What are the opportunities for ICI organic waste diversion?
1 Government funding to develop infrastructure 2 Government policies, programs, regulations and enforcement 3 Organic waste disposal ban
Q20 What tools, best practices and/or lessons learned would assist ICI
stakeholders in reducing food waste or diverting organic waste? 1 Tool kit on how to reduce and divert food waste from the ICI sector 2 Summary of best practices from jurisdictions including services offered, by-laws and
enforcement at the municipal level 3 Summary of best practices from jurisdictions, including policy, programs, and
regulations at the provincial level Q21 What data, if any, does your organization collect on the types and quantities
of ICI organic waste generated, disposed or diverted by your organization and/or its members? • Tonnage and volumes (i.e., inputs
and outputs) • Generation, collection and diversion
rates • Food value • Amount of materials sold to end
users • Waste audits

GHD | 2cg | Opportunities and Barriers for Organic Waste Reduction and Diversion | 11103231 (2) | 33
Q22 What tools and/or best practices, if any, does your organization use to reduce and/or divert ICI organic wastes? • Public education and awareness
campaigns (i.e., door-to-door visits, ICI businesses)/ Tool Kit
• Lower disposal tipping fees for organic waste
• On-site organics management procedures
• Employee training programs
• Volume based-rate system for garbage (no charge for organic waste)
• Composting and diversion containers and equipment
Q23 Please include any other thoughts or opinions you have on the barriers and
opportunities to ICI organic waste reduction and diversion. • Opportunities to implement and
encourage provincial regulations (i.e., mandatory organics diversion in ICI or organics ban in ICI sector)
• Lack of/ limited political direction in ICI sectors and prioritization
• Implementation of tax incentives • Lack of understanding or awareness of programs available for ICI businesses
• Encourage cross-sectoral dialogue • High costs (cheaper to landfill than compost)
• Focus on food waste at the source, waste reduction
The following table presents the results of the organic waste associations/organizations from a CRD perspective. seven survey responses are included in these results, which provide the top 3 answers (1 being the highest). Full results are provided in Appendix B.9.
Q25 What are the barriers to clean untreated wood waste reduction? 1 Lack of government policies or programs 2 CRD generators don’t understand the extent of clean untreated wood waste
generation 3 Lack of education on how to better manage clean untreated wood so that it does
not become waste Q26 What are the barriers to clean untreated wood waste diversion?
1 Lack of government policies or programs 2 Cost difference between diversion and disposal 3 Contamination or inconsistency of waste stream
Q27 What are the opportunities for clean untreated wood waste reduction?
1 Educating generators on how to better manage clean untreated wood 2 Government policies, programs, regulations and enforcement 3 Educating generators on how to donate clean untreated wood to charitable
organizations Q28 What are the opportunities for clean untreated wood waste diversion?
1 Government policies, programs, regulations and enforcement 2 Waste disposal tax to fund organic waste diversion 3 Government funding to develop infrastructure
Q29 What tools, best practices and/or lessons learned would assist CRD
stakeholders in reducing clean untreated wood waste? 1 Summary of best practices from jurisdictions, including policy, programs, and
regulations at the provincial level

GHD | 2cg | Opportunities and Barriers for Organic Waste Reduction and Diversion | 11103231 (2) | 34
2 Summary of best practices from jurisdictions including services offered, by-laws and enforcement at the municipal level
3 Detailed data on generation of CRD organic waste streams Q30 What data, if any, does your organization collect on the types and quantities
of CRD organic waste generated, disposed or diverted by your organization and/or its members? • Composition studies (i.e., measure
proportion of CRD waste that is considered clean wood)
• Tonnage and volumes (inputs and outputs, weights of diverted CRD material)
Q31 What tools and/or best practices, if any, does your organization use to reduce
and/or divert CRD organic wastes? • Mobile chipper/grinder to use at
compost facility
Q32 Please include any other thoughts or opinions you have on the barriers and
opportunities to CRD organic waste reduction and diversion. • Streamline compost operations to
make regulations for small time operators fair
• Lack of end markets/ Develop more end markets/ make them less restrictive
The following table presents the results of the organic waste associations/organizations from an end user perspective. Thirteen survey responses are included in these results, which provide the top 3 answers (1 being the highest). Full results, as well as adjusted results (based on the n-factor applied) are included in Appendix B.9.
Q34 What are the barriers to selling compost? 1 Lack of government policies and regulations requiring/specifying compost usage 2 Low organic waste product value 3 Inability to add value to compost
Q35 What are the barriers to buying compost?
1 Lack of consumer awareness about products 2 Cheaper competing products such as topsoil and peat moss 3 Poor quality products
Q36 What are the opportunities to selling/buying compost?
1 Government policies, programs, regulations and enforcement 2 Continue developing/encourage the use of certification programs (e.g., Compost
Quality Alliance) 3 Educating buyers on how to use compost
Q37 What tools, best practices and/or lessons learned would assist sellers and
buyers of compost? 1 Detailed data on compost quality 2 Summary of best practices from jurisdictions, including policy, programs, and
regulations at the provincial level 3 Guidelines on how to develop procurement specifications for products
Q38 What are the barriers to selling electricity or biogas?
1 Unable to connect to the electricity or natural gas grid 2 Lack of government policies and regulations such as feed-in tariffs (FIT) 3 Other (note – respondent was able to provide additional commentary within open
ended question)

GHD | 2cg | Opportunities and Barriers for Organic Waste Reduction and Diversion | 11103231 (2) | 35
Q39 What are the opportunities for selling electricity or biogas? 1 Government policies, programs and regulations such as feed-in tariffs (FIT) 2 Expanded ability to connect to electricity or natural gas grid 3 Other
Q40 What data, if any, does your organization collect on the selling/buying
compost, electricity or biogas? • Tonnage and revenues • Energy produced, gas generation
rates (Canadian Biogas Association has database of member biogas installations)
• Sales of materials (i.e., type, quantity, volumes)
Q41 What tools and/or best practices, if any, does your organization use to assist
with selling/buying compost, electricity or biogas? • Public education campaigns (i.e.,
organic demonstration gardens, improving customer relationships)
• CQA methodology and analysis for final product
Q42 Please include any other thoughts or opinions you have on the barriers and
opportunities to selling/buying compost, electricity or biogas. • Lack of and restrictive government
regulations and programs • Growth of biogas sector is limited
primarily by availability of feedstock • Limited incentives for
electricity/biogas • Public perception of compost (i.e., it
is made from garbage) • Opportunities to educate the public
on the benefits of using compost • Lack of product uptake in the
Agricultural sector
3.3.3 Private Sector
The following table presents the results of the private sector from a Residential perspective. 25 survey responses are included in these results, which provide the top 3 answers (1 being the highest). Full results are included in Appendix B.10.
Q3 What are the barriers to residential food waste reduction? 1 Lack of government policies or programs 2 Lack of government regulations and enforcement 3 Low disposal costs of food waste
Q4 What are the barriers to residential food waste reduction faced by the average
person? 1 Behaviours and attitudes 2 Inefficient shopping 3 Lack of understanding of best before/ expiration dates
Q5 What are the barriers to residential food waste diversion? 1 Lack of government policies or programs 2 Lack of government regulations and enforcement 3 Lack of collection capacity
Q6 What are the barriers to organic waste diversion faced by the average
person? 1 Lack of interest in fully participating in available opportunities 2 Lack of understanding of how programs work 3 Lack of opportunities

GHD | 2cg | Opportunities and Barriers for Organic Waste Reduction and Diversion | 11103231 (2) | 36
Q7 What are the opportunities for residential food waste reduction? 1 Educating generators on how to better manage food 2 Government policies or programs 3 Educating generators on how to donate food to charitable organizations
Q8 What are the opportunities for residential organic waste diversion? 1 Organic waste disposal ban 2 Government policies or programs 3 Government funding to develop infrastructure
Q9 What tools, best practices and/or lessons learned would assist residential
stakeholders in reducing food waste or diverting organic waste? 1 Tool kit on how to reduce and divert food waste from the residential sector 2 Summary of best practices from jurisdictions including services offered, by-laws and
enforcement at the municipal level 3 Detailed data on generation of residential organic waste streams
Q10 What data, if any, does your organization collect on the types and quantities
of residential organic waste generated, disposed or diverted by your organization and/or its members? • Tonnages (i.e., inputs and outputs) • Residential curbside collection rates • Diversion rates • Composition of waste through waste
audits • Contamination rates • Edible vs. non-edible food waste
disposed of • Full mass balance of what is
received and what is sent out • Results from Pilot Studies
Q11 What tools and/or best practices, if any, does your organization use to reduce
and/or divert residential organic wastes? • Public education and awareness
campaigns (i.e., diversion initiatives, social media, training programs, source separation)
• Provide materials to use the system (i.e., green carts/ bags)
• Yard waste and organic curbside collection programs
• Subsidize programs and materials
• Political initiatives (i.e., bylaws banning organics from landfills, mandatory source separation)
• Best practice methodologies relative to dealing with the social issues (odor, insects/ rodents/ convenience/ cost) in the collection process by Resident or commercial end user
Q12 Please include any other thoughts or opinions you have on the barriers and
opportunities to residential organic waste reduction and diversion. • Inconvenience and odours • Municipalities should embrace in-
sink food waste disposers as essential component of toolkit, especially in multi-residential buildings
• Lack of understanding and public awareness on social and environmental responsibility as well as the benefits of organic waste diversion
• Lack of political direction and investment in diversion and program implementation

GHD | 2cg | Opportunities and Barriers for Organic Waste Reduction and Diversion | 11103231 (2) | 37
• Limited availability of funding • General market data is sought from industry sources. The accuracy and completeness is a concern
The following table presents the results of the private sector from an ICI perspective. 30 survey responses are included in these results, which provide the top 3 answers (1 being the highest) Full results are included in Appendix B.10.
Q14 What are the barriers to ICI food waste reduction? 1 Lack of government policies or programs 2 Low disposal costs of food waste 3 Lack of government regulations and enforcement
Q15 What are the barriers to food waste reduction faced by the average business?
1 Behaviours and attitudes 2 Low cost of disposal 3 Portion sizes
Q16 What are the barriers to ICI food waste diversion?
1 Lack of government policies or programs 2 Cost difference between diversion and disposal 3 Lack of government regulations and enforcement
Q17 What are the barriers to organic waste diversion faced by the average
business? 1 Lack of interest in fully participating in available opportunities 2 Low cost of disposal 3 Lack of opportunities
Q18 What are the opportunities for ICI food waste reduction?
1 Government policies or programs, regulations and enforcement 2 Educating generators on how to better manage food 3 Educating generators on how to donate food to charitable organizations
Q19 What are the opportunities for ICI organic waste diversion?
1 Organic waste disposal ban 2 Government policies, programs, regulations and enforcement 3 Government funding to develop infrastructure
Q20 What tools, best practices and/or lessons learned would assist ICI
stakeholders in reducing food waste or diverting organic waste? 1 Tool kit on how to reduce and divert food waste from the ICI sector 2 Summary of best practices from jurisdictions including services offered, by-laws and
enforcement at the municipal level 3 Detailed data on generation of ICI organic waste streams
Q21 What data, if any, does your organization collect on the types and quantities
of ICI organic waste generated, disposed or diverted by your organization and/or its members? • Tonnage and volumes (i.e., inputs
and outputs) • Generation, collection and diversion
rates • Annual waste audits • Amount of materials sold to end
users

GHD | 2cg | Opportunities and Barriers for Organic Waste Reduction and Diversion | 11103231 (2) | 38
Q22 What tools and/or best practices, if any, does your organization use to reduce and/or divert ICI organic wastes? • Public education and awareness
campaigns (i.e., door-to-door visits, ICI businesses)
• Lower disposal tipping fees for organic waste
• On-site organics management procedures/guides
• Employee training programs
• Volume based-rate system for garbage (no charge for organic waste)
• Encourage our clients to follow appropriate regulations
Q23 Please include any other thoughts or opinions you have on the barriers and
opportunities to ICI organic waste reduction and diversion. • Opportunities to implement and
encourage provincial regulations (i.e., mandatory organics diversion in ICI or organics ban in ICI sector)
• Lack of/ limited political direction in ICI sectors and prioritization
• Implementation of tax incentives • Lack of understanding or awareness of programs available for ICI businesses
• Encourage cross-sectoral dialogue • High costs (cheaper to landfill than compost)
The following table presents the results of the private sector from a CRD perspective. 10 survey responses are included in these results, which provide the top 3 answers (1 being the highest). Full results are included in Appendix B.10.
Q25 What are the barriers to clean untreated wood waste reduction? 1 Lack of education on how to better manage clean untreated wood so that it does
not become waste 2 Lack of government regulations and enforcement 3 CRD generators don’t understand the extent of clean untreated wood waste
generation Q26 What are the barriers to clean untreated wood waste diversion?
1 Contamination or inconsistency of waste stream 2 Lack of government regulations and enforcement 3 Cost difference between diversion and disposal
Q27 What are the opportunities for clean untreated wood waste reduction?
1 Educating generators on how to better manage clean untreated wood 2 Government policies, programs, regulations and enforcement 3 Educating generators on how to donate clean untreated wood to charitable
organizations Q28 What are the opportunities for clean untreated wood waste diversion?
1 Organic waste disposal ban 2 Government funding to develop infrastructure 3 Government policies, programs, regulations and enforcement
Q29 What tools, best practices and/or lessons learned would assist CRD
stakeholders in reducing clean untreated wood waste? 1 Summary of best practices from jurisdictions including services offered, by-laws and
enforcement at the municipal level 2 Summary of best practices from jurisdictions, including policy, programs, and
regulations at the provincial level

GHD | 2cg | Opportunities and Barriers for Organic Waste Reduction and Diversion | 11103231 (2) | 39
3 Detailed data on generation of CRD organic waste streams Q30 What data, if any, does your organization collect on the types and quantities
of CRD organic waste generated, disposed or diverted by your organization and/or its members? • Composition studies (i.e., measure
proportion of CRD waste that is considered clean wood)
• Tonnage and volumes (inputs and outputs, weights of diverted CRD material)
Q31 What tools and/or best practices, if any, does your organization use to reduce
and/or divert CRD organic wastes? • Increase tipping fees • Inspection and levy’s for
contamination • Disposal bans in landfills
Q32 Please include any other thoughts or opinions you have on the barriers and
opportunities to CRD organic waste reduction and diversion. • Re-use all clean wood as part of
bulking during composting process
The following table presents the results of the private sector from an end user perspective. 16 survey responses are included in these results, which provide the top 3 answers. Full results are included in Appendix B.10.
Q34 What are the barriers to selling compost? 1 Low value competing products 2 Lack of government policies and regulations requiring/specifying compost usage 3 Low organic waste product value
Q35 What are the barriers to buying compost?
1 Lack of consumer awareness about products 2 Cheaper competing products such as topsoil and peat moss 3 Poor quality products
Q36 What are the opportunities to selling/buying compost?
1 Educating buyers on how to use compost 2 Government policies, programs, regulations and enforcement 3 Undertaking compost usage trials
Q37 What tools, best practices and/or lessons learned would assist sellers and
buyers of compost? 1 Detailed data on compost quality 2 Guidelines on how to develop procurement specifications for products 3 Summary of best practices from jurisdictions, including policy, programs, and
regulations at the municipal level Q38 What are the barriers to selling electricity or biogas?
1 No market for these products 2 Lack of government policies and regulations such as feed-in tariffs (FIT) 3 Unable to connect to the electricity or natural gas grid

GHD | 2cg | Opportunities and Barriers for Organic Waste Reduction and Diversion | 11103231 (2) | 40
Q39 What are the opportunities for selling electricity or biogas? 1 Expanded ability to connect to electricity or natural gas grid 2 Government policies, programs and regulations such as feed-in tariffs (FIT) 3 Other (note – respondent was able to provide additional commentary within open
ended question) Q40 What data, if any, does your organization collect on the selling/buying
compost, electricity or biogas? • Tonnage and revenues • Collect data on type of compost sold
to individual markets (i.e., golf course, agriculture) as well as what grade of product is purchased
• Sales of materials (i.e., type, quantity, volumes)
• Nutrient analysis of compost
Q41 What tools and/or best practices, if any, does your organization use to assist
with selling/buying compost, electricity or biogas? • Public education campaigns (i.e.,
organic demonstration gardens, improving customer relationships)
• Composting containers/ equipment
• CQA methodology and analysis for final product
• Organic demonstration gardens
Q42 Please include any other thoughts or opinions you have on the barriers and
opportunities to selling/buying compost, electricity or biogas. • Lack and restrictive of government
regulations and programs • Product not being sold at high
enough price for the value of the material provided
• High operation and disposal costs • Limited incentives for electricity/biogas
• Public perception of compost (i.e., it is made from garbage)
• Lack of product uptake in the Agricultural sector
3.3.4 Key Barriers
Segregating the data into different user types rather than on a geographical level provided a lens on the ranking of importance, but the barriers were quite common across the three user types, as demonstrated in the tables above. A summary of the key common barriers is as follows:
• Residents don’t understand the extent of food waste generation
• Lack of government policies, programs, regulations and enforcement
• Cost difference between diversion and disposal
• Behaviours and attitudes
• Portion sizes
• Low value competing products
• Consumer awareness
• Low value of compost related to limited awareness of agronomic benefits and promotion of compost quality

GHD | 2cg | Opportunities and Barriers for Organic Waste Reduction and Diversion | 11103231 (2) | 41
The responses noted above demonstrate that there is a realization and recognition of a lack of appropriate policies and regulations coming from the government level. Granted, the respondents of the survey are from all three levels of government and local level governments may only be able to influence policies, which would be set at the Provincial and potentially the Federal level. Nevertheless, this user type (government) pointed out that without some leadership and initiative on the policy and regulation side, implementation will suffer.
One of the main issues that present itself is the connection between the items noted above. For example, the cost difference between diversion and disposal is largely a function of the elevated costs of processing materials rather than landfilling them; in some contexts, landfilling cost base further relates to access to cheap tipping fees in other jurisdictions such as the United States (see Ontario). However, technological options such as anaerobic digestion offer the potential for multiple product streams – digestate/compost is a value-added fertilizer and biogas produced can be commoditized as electricity, renewable natural gas, vehicle fuel, and potentially even liquid fuel. However, the overall market for renewable energy streams from anaerobic digestion is not consistent across the country, and there are a variety of markets where, for example, electricity produced from this technology would need to be competitive with very low electricity prices. The implementation of feed-in tariff pricing for anaerobic digestion would mitigate a number of the above barriers as a result.
A further key barrier for producers of material is the market value of the organic products created by diversion technologies such as composting or anaerobic digestion, and/or a lack of awareness of agronomic benefits and promotion of compost quality.
Typically, revenue streams for facilities that process organic materials are heavily-weighted to the incoming tipping fee, with very small value derived from sale of organic materials. Nevertheless, organic materials from these technologies do offer a complement to commercial fertilizer, albeit at a fraction of the price. Effective market base for the material, via regulation or by inclusion of compost and digestate as a required component of new construction projects, can dramatically improve the revenue stream from these products, which would in turn have a downwards pull on tipping fees, where this downward migration would begin to mitigate the price differential against disposal.
3.3.5 Opportunities
Similar to barriers for user types, segregating the data into different user types rather than on a geographical level provided a lens on the ranking of importance, but the opportunities were common across the three user types, as demonstrated in the tables above. A summary of the common key opportunities is as follows:
• Education – this should be tailored to address generators and managers. End Users, particularly those selling material (i.e., compost) could have a part in the education, particularly as it relates to the perception that compost is not as valuable a product to utilize.
• Government policies, programs, regulations and enforcement – A scan of existing legislation in other jurisdictions would be an appropriate starting point. Policies and programs must look at the full spectrum of organic waste and cannot be implemented in isolation. That is, the Policy/Program must factor in: Generation of organic waste Collection Processing End Markets. This should also be coupled with how the policy will be regulated and enforced.

GHD | 2cg | Opportunities and Barriers for Organic Waste Reduction and Diversion | 11103231 (2) | 42
• Landfill disposal ban – Similar to the above, this cannot be the only policy enacted and it cannot be implemented in isolation of other policies and programs that address Collection, Processing and End Markets.
• Government funding to develop infrastructure – Subsidies or tax breaks should be considered, which would assist in the gap between diversion vs disposal. Consideration should also be given to Public-Private Partnerships (PPP).
• Develop compost quality certification programs – This will assist in marketing the end product effectively and equitably.
• Maintain high level compost quality standards equivalent to international quality standards (US CCS) to ensure end user confidence in product use across Canada.
• Connect benefits of organic waste diversion and various processing technologies to international GHG emission reduction objectives using IPC protocols.
3.4 Summary of Technical, Social and Economic Barriers
One of the key objectives of this report was to identify the technical, social and economic barriers preventing the diversion of organics residuals across Canada.
Technical Barriers
From a technical perspective, the following key barriers were identified:
• Consistency with compost output quality
• Contamination or inconsistency of waste stream
• Operating an organics processing facility properly (i.e., minimize nuisance effects like odour, ensure end product is of a high quality, either compost, digestate or biogas)
For the most part, the technical barriers were limited and the responses were geared towards the social and the economic.
Social Barriers
From a social perspective, the following key barriers were identified:
• Lack of regulations, policies and programs implemented and enforced by government
• Lack of awareness, behaviours and attitudes
• Public perception of processing facilities (i.e., Not In My Backyard)
Lack of government policies was the main, overarching theme that was continually mentioned across all regions, sectors and users. Other social barriers relate to existing programs/facilities and require additional promotion and education to remove them as a barrier to further organics diversion.

GHD | 2cg | Opportunities and Barriers for Organic Waste Reduction and Diversion | 11103231 (2) | 43
Economic Barriers
From an economic perspective, the following key barriers were identified:
• Lack of funding
• Cost difference between organics processing vs landfill disposal costs
• Perceived low value of output (i.e., compost) and therefore minimal returns
• Public perception of costs for collection and processing facilities (i.e., taxpayer dollars being spent on Capital and operating)
Outside of establishing policies and programs, economic barriers were highlighted the most, across all regions, sectors and users. It is clear that in order to increase the amount of organic material diverted from disposal, the solutions must be economically feasible and palatable for the public, the organics processers, the end users of the product and government.
3.5 Overview of Organic Waste Quantification
3.5.1 Data sets
With respect to data collection, the survey asked respondents to identify the type of data they collect as it relates to types and quantities of organic waste generated, disposed or diverted, as well as data on selling/buying compost, electricity or biogas. Understanding the types of data and the methods of collecting the data will assist in creating best management practices for each sector going forward. The following common themes were provided by stakeholders with respect to data collection:
• Tonnages and revenues, including sale of materials (i.e., type, quantity)
• Annual audits and composition studies
• Nutrient analysis of compost (compost quality testing and quality standard)
• Data call requirements
• Edible vs. non-edible food waste disposed of
• Contamination rates
• Mass balance of material received and what is sent out
• Internet based reporting tool and national data base
Generally speaking, there were many variations on the type of data collected as well as how that data was collected. Creating a standardized approach that could be applied across one or multiple jurisdictions would assist in tracking generation rates as well as disposal/processing rates – all of which would lead to better management of the material and inform decision-makers on the most appropriate regulations and policies to implement.
3.5.2 Information availability
Data availability is limited in the Provinces and Territories and the most reliable datasets are derived from local municipal data calls and diversion rates as well as Statistics Canada data. As shown in

GHD | 2cg | Opportunities and Barriers for Organic Waste Reduction and Diversion | 11103231 (2) | 44
Section 1 of this report, the latest data from Statistics Canada (June, 2015) show that the 2012 diversion of organic waste in Canada has increased by about 11 percent, from 2010.
The question of data accuracy is an important one. For example, comparing the Waste Diversion Ontario (WDO) 2012 data call numbers, it was estimated that 930,000 tonnes of residential organic waste were diverted in Ontario, which would leave approximately 140,000 tonnes per year diverted by the ICI sector (i.e., to equal the 1.070 million tonnes diverted in Ontario in Table 1.1). However, the Ontario Waste Management Association (OWMA) and Regional Public Works Commissioners Ontario Organic Waste Management Report 2013-2033, (van der Werf, 2014), using 2011 data, provides estimates that are higher, with about 1.25 million tonnes of organic waste diverted in Ontario, with 300,000 tonnes of this coming from the more difficult to estimate ICI sector. While the Statistics Canada data looks reasonable for Ontario, it also points out the challenge of estimating organic waste diversion from the ICI sector, and there is a good possibility that not all of this diversion is being captured by Statistics Canada.
It is estimated, through calculation, that Canadians generate about 9.7 million tonnes of organic waste, and that we are currently capturing only about 25 per cent of organic waste generated. Furthermore, if we roughly assume that half of organic waste is food waste and half of that is edible food waste, we have 2.4 million tonnes per year of edible food waste that are thrown out. In round numbers, that means each Canadian throws out between $170-$375 worth of food annually (van der Werf, 2015).
Some difficulties may exist with respect to CRD waste as the organic fraction of this stream tends to be comingled with other construction material and debris and the data in some provinces does not provide the type of breakdown required to track and manage the organic material.
3.5.3 Recommendations
Based on the existing data sets available, coupled with Statistics Canada, it is reasonable to state that the majority of jurisdictions would be able to establish organics generation and diversion numbers, with a high degree of confidence – from a residential perspective. The ICI sector is much more difficult to estimate, mainly due to the fact that reliable data sets on ICI composition, generation and capture do not exist. Across all jurisdictions, no system is in place to measure and track ICI organics – estimates are the only method for the ICI sector. Until legislation/policies are established with respect to the ICI sector, it will be difficult to obtain reliable data from an ICI perspective. CRD would be in a similar position of difficulty, given that some jurisdictions require CRD diversion, but do not always require a segregation of the organic fraction of CRD.
In addition, while the municipal data is much more reliable due to a more robust reporting system (mandatory municipal data call), this is not the case in every Province/Territory.
The following recommendations with respect to data collection are put forward for consideration:
• Implement a standardized accounting/tracking method for organic generation rates, diversion and disposal rates for the residential (municipal) sector on a national or sub-national level (Provincial/Territory)
• Encourage the ICI and CRD sector to implement and contribute to a database that would assist Provinces establish baseline ICI generation/disposal rates in order to inform future policy directions

GHD | 2cg | Opportunities and Barriers for Organic Waste Reduction and Diversion | 11103231 (2) | 45
3.6 Tools and Best Practices
3.6.1 Recommendations
Through the surveys completed with Stakeholders, a number of common tools and best practices were described with respect to addressing food waste and organics waste diversion, a number of which have been highlighted in this report. At the highest level, a majority of respondents felt that the development of a tool kit on how to reduce and divert food waste, in order to educate the various sectors, would assist in addressing some of the common barriers identified. Further, providing a summary of best practices from other jurisdictions within the toolkit, including policies, programs and regulations, would assist in setting the overarching framework for increasing reduction and diversion nationally. The following common responses should be considered, either within a future Tool Kit, or when implementing a food waste reduction/organic waste diversion program:
• Establish a champion of the program that will foster the political will and public engagement toparticipate
• Set policies that support the program taking into consideration the full cycle of the system –reducing at source (generation), collection, processing, end markets
• Ensure appropriate budgets and funding are available and provided to implement organicswaste diversion
• Promotion and Education are essential – engaging the users of the system ia key as they willlive the program and the system every day
• Promotion of a national compost quality standard to support end-user confidence in compost
• Connect benefits of organic waste diversion to international GHG emission reduction objectivesusing IPC protocols
4. What’s Next?
4.1 Next Steps
In terms of next steps, CCME could consider developing the following key documents:
• Develop a protocol for tracking and managing data on organics generation, diversion anddisposal for the residential sector as well as for ICI.
• Complete a legislative scan of the Regulatory tools available (i.e., landfill ban) in otherjurisdictions and determine what policies are helping or hindering organic waste diversion.Where there are examples of policies that have assisted in the implementation of successfulorganic waste diversion programs, highlight these as Best Policy Practices and summarize forProvincial/Municipal governments and Managers for potential implementation.
• Develop a Best Practices Guide to implementing source separated organics collection andprocessing for small, medium and large municipalities. Matching appropriate collection andprocessing methods/technologies to each size of municipalities will assist in developingappropriate policies/regulations, as well as setting aside the necessary Capital and Operatingbudgets to implement the program.

GHD | 2cg | Opportunities and Barriers for Organic Waste Reduction and Diversion | 11103231 (2) | 46
• Review National, Provincial and Territorial Building Codes to determine how organics wastediversion policies could be included. This may come in the form of mandating appropriateinternal collection and storage within a Multi-Residential building, to requiring futuredevelopments to include/utilize compost for landscaping, parks, etc.
• Conduct research and prepare a discussion paper on the potential for PPP with respect toorganics processing facilities, which would assist municipalities from a cost perspective andincentivize participation from an ICI organic waste perspective.
• Develop a national compost quality standard.
• Conduct research on GHG reduction of organics diversion based on accepted internationalprotocols, carbon credit opportunities and implications of regulated approaches on carboncredits.