Embed Size (px)
Citation preview

National Skills Bulletin 2014
National Skills Bulletin 2014
BLEE
D
July 2014
Expert Group on Future Skills Needsc/o Skills and Labour Market Research Unit (SLMRU)
SOLASCastleforbes HouseCastleforbes Road Dublin 1, Ireland
Tel: +353 1 5332464Email: [email protected] www.skillsireland.ie
EGFSN Cover - 112-120 pages+FAS.indd 1 13/06/2014 17:06:15

National Skills Bulletin 2014 1 July 2014
National Skills Bulletin 2014 A Report by the Skills and Labour Market Research Unit (SLMRU) in SOLAS for the Expert Group on Future Skills Needs Authors Jasmina Behan Joan McNaboe Caroline Shally Nina Burke Research support Anne Marie Hogan

National Skills Bulletin 2014 2 July 2014

National Skills Bulletin 2014 3 July 2014
Foreword
The National Skills Bulletin 2014 is the tenth in an annual series of reports produced by the Skills and Labour Market Research Unit (SLMRU) in SOLAS on behalf of the Expert Group on Future Skills Needs (EGFSN). The analysis undertaken in the Bulletin draws from the information gathered and maintained in the National Skills Database (NSD), which allows for an overview of the Irish labour market at occupational level.
Almost all indicators show improvements in the Irish labour market. Between 2012 and 2013, increases in labour force participation and numbers employed occurred, along with a concomitant decline in the number of persons unemployed. There was also a significant decline in the number of redundancies since 2012. However, challenges continue to exist with high unemployment rates persisting for those previously employed in construction and elementary occupations, younger age cohorts and persons with less than higher secondary education attainment.
Analysis of labour market transitions shows that a large volume of activity is occurring in the Irish labour market. It is estimated that during 2013 there were over a million transitions between employment, unemployment and economic inactivity, as well as between and within occupations. The analysis points to the flexibility of the Irish labour market, but also to the difficulties in securing sustainable employment for certain occupations including sales assistants, teachers, carers and those working in catering occupations.
Shortages are occurring across many occupations, although they continue to be confined to niche skill areas and in most instances remain of low magnitude. Skills shortages have been identified in the areas of ICT, science, engineering, sales, marketing, business, finance and healthcare, with signs of shortages emerging in areas related to logistics, manufacturing and even construction (limited at present to surveyors).
The National Skills Bulletin, together with its companion publication, Monitoring Ireland’s Skills Supply 2014, continues to support policy formulation in the areas of education and training provision, labour market activation and immigration, and serves as a valuable career guidance tool for job seekers and students.
Una Halligan,
Chairperson, Expert Group on Future Skills Needs

National Skills Bulletin 2014 4 July 2014

National Skills Bulletin 2014 5 July 2014
Table of Contents
Executive Summary 7
Introduction 14
Section 1 General Labour Market Trends 16
Section 2 Employment by Economic Sector 25
Section 3 Employment by Broad Occupation 36
Section 4 Unemployment 41
Section 5 Labour Market Transitions 46
Section 6 Employment Permits 55
Section 7 Vacancies 59
Section 8 Occupational Employment Profiles 66

National Skills Bulletin 2014 6 July 2014

National Skills Bulletin 2014 7 July 2014
Executive Summary
The National Skills Bulletin 2014 is the tenth in an annual series of reports produced by the Skills and Labour Market Research Unit (SLMRU) in SOLAS on behalf of the Expert Group on Future Skills Needs (EGFSN). By providing an overview of the Irish labour market at occupational level, the Bulletin aims to assist policy formulation in the areas of employment, education/training and immigration. It also aims to inform career guidance advisors, students and other individuals making career and educational choices.
When interpreting the data, the following should be borne in mind:
the employment level for each occupation is expressed as an annual average (i.e. the average of four quarters)
the trend analysis of occupations covers the five-year period 2008-2013, unless otherwise specified
the employment composition (i.e. age, gender etc.) is based on quarter 4 2013 data
unless otherwise specified, the annual change in employment is measured between quarter 4 2012 and quarter 4 2013.
Irish Labour Market in 2013 Almost all indicators for 2013 show improvements in the labour market. For instance, between 2012 and 2013,
▪ The labour force: grew by 10,000, or 0.4%; the labour force participation rate increased by 0.3 percentage points to 60.2%
▪ Employment increased by 43,300 and the employment rate by 1.4 percentage points to 60.5%
▪ Unemployment levels declined by almost 34,000; there were also declines in the unemployment rate (to 13.1%), the long term unemployment rate and the broad unemployment measure (combining unemployed and part-time underemployed persons)
Redundancies declined from 33,072 to 13,628.
However, a number of issues persist:
in quarter 4 2013, the unemployment rate continued to be high for certain segments of the labour market (e.g. persons previously employed in construction (30%), persons aged under 25 (19%), persons holding less than higher secondary education (18%), elementary occupations (15%)
▪ while there was a decline in net outward migration between 2012 and 2013 (of 1,300), the net number of Irish emigrants increased.
Employment and Unemployment by Broad Occupation In quarter 4 2013, one in every two jobs
were in ‘white collar’ occupations (managerial, professional, associate professional and administrative).
Between 2012 and 2013, employment increased in all occupational groups, excluding services occupations.
▪ Professional, associate professional and administrative occupations combined accounted for 24% of employment growth (10,600); in quarter 4 2013, these

National Skills Bulletin 2014 8 July 2014
occupations, along with managers, had the lowest unemployment rates, while elementary occupations (15%) and skilled trades (13%) had the highest.
Sectoral Employment and Unemployment ▪ Between quarter 4 2012 and quarter 4
2013, employment increased strongly in the agriculture, accommodation/food and professional, scientific & technical sectors, with each of these sectors growing by over 10%; over this period, employment in the financial sector declined by 6%; in all other sectors, employment remained broadly in line with the level recorded one year previously, with changes amounting to less than 3%.
▪ Over the five-year period, quarter 4 2008 to quarter 4 2013, the strongest employment growth was recorded in the ICT sector, where the numbers in employment increased by 19%.
▪ Although the increase in employment in the construction sector between quarter 4 2012 and quarter 4 2013 was small in absolute terms, it was the first quarter 4-on-quarter 4 increase since 2007; however, at 30%, the unemployment rate of persons previously employed in the construction sector remains the highest of all sectors.
National Skills Strategy Progress The educational attainment of the labour force (aged 15-64) and the 2020 targets set out in the National Skills Strategy (NSS) are presented in Figure A.1. In quarter 4 2013, the share of third level graduates was 45.3%, which is two percentage points higher than in quarter 4 2012. The share of persons with at most lower secondary qualifications was
15.6%, which is 1.2 percentage points lower than one year previously. These shifts in the educational distribution indicate further improvements in the educational attainment of the labour force.
Figure A.1 Labour Force (aged 15-64) by Education
Source: Analysis by SLMRU (SOLAS) based on CSO data
Labour Market Transitions During 2013 there were over a million transitions between employment, unemployment and economic inactivity, as well as between and within occupations pointing to the flexibility of the Irish labour market. The key findings from the analysis of labour market transitions between employment, unemployment and inactivity are outlined below.
Average transition probabilities: Most individuals did not change their labour market status between successive quarters in 2013; for instance, on average, 97% of persons in employment in one quarter remained employed in the
27.1
%
25.5
%
24.5
%
22.6
%
20.3
%
19.2
%
18.1
%
16.8
%
15.6
%
7.0%
40.0
%
40.0
%
39.6
%
39.7
%
40.4
%
39.4
%
40.1
%
39.9
%
39.1
%
45.0
%
32.9
%
34.4
%
35.9
%
37.7
%
39.4
%
41.4
%
41.8
%
43.3
%
45.3
%
48.0
%
0%
10%
20%
30%
40%
50%
60%
70%
80%
90%
100%
Q4
2005
Q4
2006
Q4
2007
Q4
2008
Q4
2009
Q4
2010
Q4
2011
Q4
2012
Q4
2013
.
2020
NSS
Lower secondary or less Higher secondary/FET
Third level

National Skills Bulletin 2014 9 July 2014
subsequent quarter; this is in line with the findings for 2012; however, compared to 2012, the average quarterly probability of transitioning from unemployment to employment increased by two percentage points to 12%.
Total absolute transitions: In terms of the total transitions, based on quarterly flows, in 2013, over one million movements were identified:
over 200,000 transitions between employment and unemployment (135,000 from unemployment to employment and 98,000 from employment to unemployment)
almost 300,000 between employment and inactivity (156,000 from inactivity to employment and 134,000 from employment to inactivity)
almost 200,000 transitions within employment, either due to a change of employer (intra-occupational transitions) or a change of occupation (inter-occupational transitions)
▪ 400,000 between unemployment and inactivity.
▪ Between employment and unemployment: the occupational distributions of flows between employment and unemployment were broadly similar, although professionals, operatives, managers and tradespersons were somewhat more represented in the transitions from unemployment to employment; the inflows into employment exceeded outflows to unemployment for all occupational groups except administrative, personal services and elementary occupations; individual occupations with the highest number of transitions both ways were construction labourers, cleaners, waiters, carpenters, chefs, care workers, child-minders,
business sales executives, sales assistants, personal assistants, general clerks and teachers.
▪ Between employment and inactivity: individual occupations with the highest number of transitions in and out of inactivity (e.g. retirement, study, home duties etc.) included waiters, cleaners, care workers, child-minders, general clerks, teachers, taxi drivers and elementary workers in catering, construction and storage.
Inter-occupational transitions: managers and associate professionals were the greatest net gainers in terms of inter-occupational flows (i.e. transitions inwards were greater than transitions out of these occupations), while elementary occupations were the greatest net losers.
Intra-occupational transitions: the highest number of intra-occupational transitions was observed for teachers, nurses, doctors, programmers, civil engineers, accountants, catering and bar staff, cleaners, storage and construction labourers, sales workers (including customer service), chefs, fitters, carers (including childcare), hairdressers, various clerks, taxi drivers, food operatives, assemblers and routine testers.
Retirement rate: higher than average retirement rates were observed for care workers, farmers and teachers.
Replacement rate: above average replacement rates (based on exits to inactivity and net losses from inter-occupational movements) were observed for elementary (farm, construction, security, cleaning, storage), some clerical (e.g. general admin), some operative (e.g. food) and services occupations (care workers, child-minders); below average rates were recorded for managers,

National Skills Bulletin 2014 10 July 2014
professionals, associate professionals and tradespersons in general.
Turnover rate: higher than average turnover rates (based on intra-occupational and neutral inter-occupational transitions) were observed for sales persons (including customer service), carers (including childcare), clerks (receptionists, general admin), chefs, IT technicians, production and financial accounts managers, hairdressers, many elementary occupations (e.g. waiters, catering assistants, routine testers, construction and farm labourers), some operatives (e.g. food, assemblers), some construction trades, and some professionals (e.g. doctors, civil engineers, IT professionals and teachers).
Vacancies Job vacancies, as advertised through the
Department of Social Protection (DSP) Jobs Ireland databank and IrishJobs.ie, continued to arise across all occupational groups in 2013.
In 2013, vacancies advertised through IrishJobs.ie were mostly concentrated in professional and associate professional occupations (e.g. IT and engineering professionals, sales, business and finance associate professionals); vacancies advertised through DSP Jobs Ireland were primarily concentrated in elementary, caring and associate professional occupations (e.g. care workers, business sales executives, security guards and catering occupations).
The most recent survey of recruitment agencies points to an increase in the number of mentions of difficult-to-fill vacancies; the mentions were most frequent for professional (IT, engineering, science, health and business) and
multilingual sales and customer care posts.
Sourcing of Skills from Outside the European Economic Area (EEA) During 2013, employers continued to
source skills from outside the EEA; there were approximately 3,000 new employment permits issued - an increase of 3% on 2012, but a decline of 16% on 2009.
Employment permits issued to the IT sector in 2013 accounted for over a half of all new permits issued, while services and healthcare accounted for approximately 10% each.
Shortage1 Although the Irish labour market continued to be characterised with an excess supply of labour in 2013, improvements were evident in almost all labour market indicators. Moreover, there was an increase in the number of mentions of skill shortages. In most cases, shortages remained confined to specialised areas and were small in magnitude.
Science
Difficult-to-fill vacancies have been identified in the areas of microbiology, product development, active pharmaceutical ingredients (API) and pharmacovigilance (product validation (PV), drug safety etc.). While very small in numbers, addressing these shortages is crucial, as they concern high level expertise in critical roles within companies.
1 The term ‘shortage’ in this report refers only to a situation where the supply of skills or labour from within the Irish labour force is insufficient to meet demand (which does not imply a shortage at the European Economic Area (EEA) level).

National Skills Bulletin 2014 11 July 2014
Engineering
Difficult-to-fill posts requiring engineering skills have been identified in the areas of
production and process engineering (automation (e.g. computer numerical control, computer aided design and manufacturing, programmable logic control (PLC)), process safety and system control)
quality and validation (e.g. Computer Validation Systems (CVS))
product development and design (in the areas of chemicals, biotechnology, pharmaceuticals, ICT, food and medical devices)
precision engineering (tool making and design for automotive, pharmaceutical and medical devices sectors)
energy (power generation and transmission)
telecommunications (mobile telephony)
project management and production planning.
ICT
Shortages of ICT skills have been identified in the following areas:
software development
programming languages, technologies and frameworks (e.g. Java, JavaScript, C#, C++, Summit, Objective C, J2EE, Spring, Struts, Hibernate ORM, jQuery, AJAX, JSP, PHP, HTML, CSS, Python, Ruby,.NET)
cloud (e.g. SaaS, web service, API, REST, SOAP, backbone.js)
web/mobile content management (e.g. Interactive visual, UX/UI Visual designer, Drupal, Joomla, AngularJsS, Sencha Touch, Magneto)
IT project management and business analysis
testing and troubleshooting
databases/big data (e.g. NoSQL, SQL, MySQL, Oracle, MS SQL Server, IBMS DB2, Hadoop)
specific product knowledge (e.g. SAP Crystal Reports, Lotus Domino, KANA, InelliPrint Analytics etc.)
IT security
technical support
networking and infrastructure.
Business and Financial
Occupations for which shortages have been identified include:
accountants (financial, tax, compliance, solvency and rationalisation)
quantitative analysts, such as financial analysts, statisticians, economists, actuaries, risk analysts with expertise in data analysis, quantitative modelling, data visualisation, big data, web analytics, forecasting, evaluation and reporting
management consultants with expertise in organisational change (e.g. takeovers), resource planning (e.g. ERP) and performance management (e.g. Oracle and Hyperion, key performance indicators, dashboards)
multilingual financial clerks in credit control/debt recovery.
Construction professionals
Strong growth is expected for construction, as this sector emerges from the lows to which it had fallen following the financial crisis and the bursting of the housing bubble. While the skills overhang from the recessionary period is sufficient to meet current demand, shortages

National Skills Bulletin 2014 12 July 2014
may emerge in the medium term. Indeed, there are already some indications of shortages of construction and property surveyors.
Construction craft
While an overhang of construction craft skills still exists, the demand and supply of construction tradespersons should be closely monitored in the context of anticipated strong growth in construction activity over the medium term.
Other craft
Shortages have been identified for:
tool makers – recent developments in tool making technology have enabled many Irish based companies to successfully compete for contracts previously outsourced to low cost locations; this, accompanied with the strong performance of the medical devices and pharmaceutical sectors, has created demand for tradespersons with expertise in making highly complex, regulated and precise tools; this has also been illustrated in the upsurge in the recruitment of apprentices in this craft
welders (tungsten inert gas (TIG) and metal inert gas (MIG)) – specialised welding skills are required across many sectors, including utilities, high tech and traditional manufacturing as well as construction activity associated with the expansion of facilities for high technology sectors.
While no shortages of meat processing skills have been identified, it is recognised that many food processing companies are experiencing difficulty in attracting and retaining skilled butchers/de-boners.
Arts, Sport and Tourism
No skill shortages have been identified in the areas of art and sport.
There is also no indication of shortages of
culinary skills at present, although it is recognised that some employers may be experiencing difficulty in attracting and retaining chefs. Sourcing from outside the EEA continues for the ethnic cuisine niche, with 90 employment permits issued to non-EEA chefs in 2013.
Healthcare
Although employment opportunities for healthcare workers remain limited, reflecting the Government’s continued efforts to reduce public expenditure in the healthcare sector, skills shortages continue to persist for the following occupations:
doctors: general practitioners (GPs) and non-consultant hospital doctors; this shortage should be alleviated once the additional supply of medical graduates, stemming from the implementation of the Fottrell Report2 (2006), emerges from the education system
nurses: advanced nurse practitioners and specialist nurses in the areas of intensive care, theatre, oncology, paediatrics and geriatric care
radiographers: computed tomography (CT), magnetic resonance imaging (MRI) and sonography.
Transport
Shortages have been identified for
multilingual supply chain and logistics managers and clerks
2 Medical Education in Ireland: A New Direction, Department of Health, 2006.

National Skills Bulletin 2014 13 July 2014
heavy goods vehicle drivers (with E+ and C1 licence)
forklift drivers (with very narrow aisle (VNA) and/or turret licence; Reach Truck, Stand-up and Electrical Pallet Jack Operators).
Social & Care
While there are no shortages of carers at present, it is recognised that some employers may be experiencing difficulty in attracting and retaining qualified care and child-care workers.
Sales & Customer Service
Difficult-to-fill vacancies were reported for the following sales areas:
market research and product strategy
digital sales and marketing (e.g. ‘pay per click’)
business to business (B2B) and business to consumer (B2C) technical sales in the areas of ICT, healthcare, medical devices and pharmaceuticals
multilingual customer support (Nordic languages, German and French).
Operatives
While there is currently no shortage of operatives in general, it is recognised that some manufacturing companies in engineering, medical devices and pharmaceuticals are experiencing difficulty in sourcing operatives with CNC skills.
In May 2013, there were over 300 job seekers who were machine tool setters and engineering operatives registered on the DSP client system. However, it is likely that many job seekers were trained in traditional operative skills and are deficient in the digital competencies required for technology-intensive manufacturing environments.
In addition, there appears to be an issue with retention, particularly for food operatives, whose turnover rate was above average in 2013.

National Skills Bulletin 2014 14 July 2014
Introduction
The National Skills Bulletin 2014 is the tenth in an annual series of reports produced by the Skills and Labour Market Research Unit (SLMRU) in SOLAS on behalf of the Expert Group on Future Skills Needs (EGFSN). It provides an overview of the Irish labour market at occupational level. The Bulletin aims to assist policy formulation in the areas of employment, education/training and immigration, as well as to inform career guidance advisors, students and other individuals making career and educational choices.
The analysis presented in the Bulletin is based primarily on the data held in the SLMRU National Skills Database, although it also draws on information from the EGFSN’s sectoral studies and other relevant research. The data is classified using the Standard Occupational Classification (SOC 2010). In cases where the number of persons employed in an occupation is too small to allow for meaningful statistical analysis, two or more occupations were merged to form an occupational group. The analysis covers over 130 occupations.
Each occupation is examined in terms of the following:
employment level and recent employment trend; the analysis is based on the data from the Central Statistics Office (CSO) Quarterly National Household Survey (QNHS); when interpreting the employment data, the following should be borne in mind:
the employment level for each occupation is expressed as an annual average (i.e. the average of four quarters in a calendar year)
the trend analysis covers the five-year period 2008-2013, unless otherwise specified; growth over this period is calculated in terms of the annualised growth rate, sometimes referred to as the ‘average annual growth rate’ for ease of reading (although the two terms are not technically identical)
unless otherwise stated, annual changes year-on-year cover the period quarter 4 2012 - quarter 4 20133
employment profile in terms of age, gender, nationality, employment type and education level; the analysis is based on the QNHS data for quarter 4 2013
unemployment rate; the analysis is based on the QNHS data for quarter 4 2013
vacancies advertised through Jobs Ireland (the public employment service provided by the Department of Social Protection (DSP)) and IrishJobs.ie (a private on-line vacancy advertising service)
the level of difficulty in filling vacancies; the analysis is based on data from the SLMRU Recruitment Agency Survey, April 2014
the number of new employment permits issued to non-EEA nationals by the Department of Jobs, Enterprise and Innovation (DJEI)
announcements of job creation and job losses in the media and job creation expected to arise from foreign direct
3By examining the change in the level of employment one can assess the net result of total job creation and job losses. If an increase in the employment level was observed between two time points, it implies that more jobs were created than lost over that period ‒ this is referred to as ‘net job creation’; conversely, if a decrease in the employment level was observed, it implies that more jobs were lost than created.
National Skills Bulletin 2014 15 July 2014
investment supported by the Industrial Development Agency (IDA)
▪ replacement demand and turnover based on the analysis of labour market transitions (QNHS)
▪ current balance between demand and supply4; the analysis is based on all of the above data and other available information; the occupations for which shortages5 have been identified are highlighted and comments are made regarding the nature of the shortage (e.g. a skill shortage or labour shortage, niche area etc.); while the aim is to identify occupations for which shortages exist, further research is necessary to identify the cause and magnitude of these shortages and to recommend the appropriate (if any) policy response.
The National Skills Bulletin 2014 is structured as follows:
Section 1: presents an overview of key labour market indicators and the composition of national employment
Section 2: examines employment trends and the economic outlook by sector
Section 3: presents employment by broad occupational group
Section 4: focuses on the profile of unemployed persons, particularly in terms of gender, occupation, nationality, education and age
Section 5: presents the research on labour market transitions between
4 Forecasts of shortages are not provided, unless implicit in the available data. 5 The term ‘shortage’ in this report refers only to the situation where the supply of skills or labour from within the Irish labour force is insufficient to meet demand. It is possible that a sufficient supply of skills or labour for an occupation in question may be found within the European Economic Area (EEA).
unemployment, employment and inactivity
Section 6: examines the inflow of labour from non-EEA countries through employment permit schemes
Section 7: provides an overview of vacancies advertised through DSP Jobs Ireland and IrishJobs.ie; it also provides the results of the latest SLMRU Recruitment Agency Survey on difficult-to-fill vacancies
Section 8: presents labour market indicators for over 130 occupations grouped into 17 occupational groups.

National Skills Bulletin 2014 16 July 2014
Section 1 General Labour Market Trends
1.1 Labour Market Status of the Population
Figure 1.1 presents the labour market status (defined by International Labour Organisation (ILO)) of the population in Ireland. In quarter 4 2013, Ireland’s population exceeded 4.6 million. This is an increase of 14,000 compared to quarter 4 2012.
In quarter 4 2013, the working age population (15-64 years) was 3.02 million, declining by 17,000 compared to quarter 4 2012. In contrast, the number of children (under 15 years) and persons aged 65 and over increased by almost 13,000 and 18,000 respectively. The over 65s was the fastest growing cohort, in both absolute and relative terms.
Figure 1.1 Population by Labour Market Status (ILO defined), Quarter 4 2013
Source: SLMRU (SOLAS) analysis of CSO data
Note: Discrepancies are due to rounding.
Population
4,611,000
Children (<15)
1,013,600
Working age population (15-64)
3,019,300
65 and older
578,100
In employment part-
time
433,200
Unemployed (ILO)
252,600
Not in employment
1,165,000
In employment 55,600
Not in employment
522,500
Seeking full time
employment
216,300
Inactive
912,400
Seeking
employment as
self-employed
8,500
Other
112,200
Home duties
281,500
Student
354,400
Retired
59,000
In employment full-
time
1,421,000
Ill health/disability
105,400
Seeking part time
employment
27,700

National Skills Bulletin 2014 17 July 2014
Over the period quarter 4 2012 to quarter 4 2013, the total age dependency ratio6 (youth and older age) increased by 1.2 percentage points to 52.7%. The youth age dependency ratio was 33.6%, while the older age dependency ratio was 19.1%, each increasing by 0.6 percentage points.
In quarter 4 2013, 1.85 million persons of working age were in employment, while 1.17 million were not. Of those who were not in employment, just over 250,000 were unemployed and 912,000 were classified as economically inactive.7 Compared to quarter 4 2012, employment of the working age population increased by 55,000, while the number of unemployed and economically inactive decreased by over 40,000 and 30,000 respectively.
Within the economically inactive group, there were:
▪ just over 354,000 students – 6,000 more than in quarter 4 2012
▪ approximately 280,000 persons engaged in home duties – 18,000 fewer than in quarter 4 2012
▪ 59,000 retired persons – 8,000 fewer than in quarter 4 2012
▪ 105,000 persons inactive due to ill health or disability – just over 2,000 more than one year previously
▪ just less than 19,000 discouraged workers – a decline of over 10,000 compared to quarter 4 2012
▪ 94,000 persons inactive for other reasons.
6 The age dependency ratio compares the non-working age population to those of working age. 7 Those economically inactive are defined as persons who are not in employment or unemployed (actively seeking employment).
On balance, over the period quarter 4 2012 to quarter 4 2013, the inactivity rate8 of the working age population decreased by almost one percentage point to 30%, while the economic dependency ratio9 decreased from almost 1.15 to 1.13.
1.2 Labour Market and Related Indicators
In 2013, the labour force averaged just over 2.16 million, which is an increase of almost 10,000 (0.4%) when compared to the average for 2012 (Figure 1.2). The participation rate increased by 0.3 percentage points to 60.2% (Table 1.1), which is the first increase observed since 2007. Further increases in the labour force are expected for 2014 and 2015, reaching almost 2.20 million by 2015 (Figure 1.2).
In 2013, there were 1.88 million persons in employment. This represents an increase of 43,000 compared to the average for 2012. Further increases are projected for 2014 and 2015, with employment expected to reach 1.97 million by 2015 (Figure 1.2). Between 2012 and 2013, the employment rate also increased, rising from 59.1% to 60.5% (Table 1.1).
In 2013, the number of unemployed persons was 282,000. Compared to 2012, unemployment declined by almost 34,000 or by 10.7%. This is the first significant decline in unemployment since the beginning of the recession. This decline is expected to
8 The inactivity rate is the proportion of the population that is not in the labour force. The focus here is on the inactivity rate for the 15-64 age group (headline inactivity rate), which is lower than the general inactivity rate. 9 The economic dependency ratio compares the total population not in the labour force to the number of those who are in the labour force.

National Skills Bulletin 2014 18 July 2014
continue, with unemployment expected to fall to 230,000 by 2015 (Figure 1.2).
Figure 1.2 Labour Force, Employment & Unemployment (000s), Annual Averages
Source: Analysis by SLMRU (SOLAS) based on CSO data; Central Bank of Ireland, Quarterly Bulletin (April 2014) 10
In 2013, the unemployment rate averaged 13.1%, which is 1.3 percentage points below the rate recorded in 2012 (Table 1.1). By quarter 4 2013, the unemployment rate decreased further, to 11.7%. The broad unemployment measure, which combines unemployed and part-time underemployed, declined from 21% in quarter 4 2012 to 18% in quarter 4 2013.
In quarter 4 2013, 61% of unemployed persons had been seeking work for at least 12 months. However, at 7.2%, the long term unemployment rate was one percentage point lower compared to quarter 4 2012. Almost
10 Although at a somewhat lower rate, growth in employment is also forecast by the Department of Finance in A Strategy for Growth Medium-Term Economic Strategy 2014-2020.
70% of long term unemployed persons were males, with the long term unemployment rate for males exceeding that for females by over 4 percentage points (9.1% compared to 4.8%).
Table 1.1 Participation, Employment and Unemployment Rates (Annual Averages)
Source: CSO
Migration estimates for the period 2008 to 2013 are presented in Table 1.2. During 2013, outward migration continued to outstrip inward migration, leaving a balance of negative net migration of 33,000. EU (including Irish) nationals accounted for the significant majority of inward and outward migration (70% and 88% respectively). Irish nationals accounted for 28% of all immigrants and 57% of emigrants.
Table 1.2 Migration Estimates (000s)
Year Inward Outward
Net
migration
2008 113.5 49.2 64.3
2009 73.7 72.0 1.7
2010 41.8 69.2 -27.4
2011 53.3 80.6 -27.3
2012 52.7 87.1 -34.4
2013 55.9 89.0 -33.1
Source: CSO
0
50
100
150
200
250
300
350
1,000
1,200
1,400
1,600
1,800
2,000
2,200
2,400
2005
2006
2007
2008
2009
2010
2011
2012
2013
2014
f
2015
f
Une
mpl
oym
ent
Labo
ur F
orce
and
Em
ploy
men
t
Labour force Employment
Unemployment
Participation rate (%) (15+)
Employment rate (%) (15-64)
Unemployment rate (%) (15+)
2008 63.6 67.4 6.4
2009 62.0 61.9 12.0
2010 60.7 59.7 13.9
2011 60.2 58.9 14.6
2012 59.9 59.1 14.4
2013 60.2 60.5 13.1

National Skills Bulletin 2014 19 July 2014
Net migration estimates by nationality are presented in Figure 1.3. In 2013, net migration was positive for non-EU and UK nationals, while it was negative for all other EU nationals. Net outward migration for Irish nationals continues to grow, with an additional 9,300 persons in 2013 compared to 2012.
Figure 1.3 Net Migration Estimates 2008-2013 by Nationality (000s)
Source: SLMRU (SOLAS) analysis of CSO data
1.3 Employment Composition In quarter 4 2013, there were 1.91 million persons aged 15 and over in employment. The gender breakdown of this employment is presented in Figure 1.4. In quarter 4 2013, there were 1.04 million males in employment, accounting for 54.4% of national employment. The gender distribution of employment shifted slightly, with the share of males increasing by one percentage point compared to quarter 4 2012.
Figure 1.4 Employment by Gender, Quarter 4 2013
Source: SLMRU (SOLAS) analysis of CSO data
Figure 1.5 shows the breakdown between full-time and part-time employment. In quarter 4 2013, just over three quarters of employment was full-time. Of those working part-time, just under one third was underemployed.
Compared to quarter 4 2012, the share of full-time employment increased by almost half a percentage point, while the share of part-time employment declined (mostly due to the decline in the share of part-time underemployed).
The employment growth observed between quarter 4 2012 and quarter 4 2013 was due to an increase in both full-time and part-time employment, with full-time employment increasing at a higher rate (3.9% compared to 1.5% for part-time).
-55
-35
-15
5
25
45
65
85
2008
2009
2010
2011
2012
2013
Irish UK
EU15 excluding Irish and UK EU15 to EU27
Other nationalities All nationalities
45.6% 54.4%
Females Males

National Skills Bulletin 2014 20 July 2014
Figure 1.5 Employment by Employment Type, Quarter 4 2013
Source: SLMRU (SOLAS) analysis of CSO data
Figure 1.6 shows the distribution of employment by employment status. In quarter 4 2013, 82% of persons in employment were employees, of which 2.4% were employees on Government supported employment schemes. Self-employment accounted for 17% of total employment, of which almost three quarters was self-employment with no paid employees.
Between quarter 4 2012 and quarter 4 2013, there was a 1.2 percentage point decline in the share of employees and an increase of a similar magnitude in the share of self-employed with no paid employees.
Employment growth observed between quarter 4 2012 and quarter 4 2013 was due to an increase in the number of employees and self-employed without employees, with employment in each of these categories increasing by similar magnitude of almost 30,000 each.
Figure 1.6 Employment by Employment Status, Quarter 4 2013
Source: SLMRU (SOLAS) analysis of CSO data
In quarter 4 2013, just over three quarters of employment was in the 25-54 age category; those aged under 25 accounted for 8% and those aged 55+ for 16% (Figure 1.7).
Between quarter 4 2012 and quarter 4 2013, the age distribution shifted towards the older age cohorts, with the share aged under 35 declining and the share aged 35 and over increasing. The most pronounced change was a 1.5 percentage point loss in the share of 25-34 year olds.
Figure 1.7 Employment by Age, Quarter 4 2013
Source: SLMRU (SOLAS) analysis of CSO data
76.1%
16.4%
7.5%
Full-time employedPart-time not underemployedPart-time underemployed
4.6% 12.4%
82.3%
0.7%
Self-employed with paid employeesSelf employed with no paid employeesEmployeesAssisting relatives
1.5%
6.5%
26.1% 27.5%
22.2%
8.2%
5.0% 2.9%
0%
5%
10%
15%
20%
25%
30%
15-19 20-24 25-34 35-44 45-54 55-59 60-64 65+

National Skills Bulletin 2014 21 July 2014
The education profile of employment in Ireland is presented in Figure 1.8. In quarter 4 2013, almost 16% of persons in employment held at most lower secondary qualifications; 37.3% held higher secondary/further education and training (FET) qualifications, while 47.1% were third level graduates.
Between quarter 4 2012 and quarter 4 2013, the share of those holding at most lower secondary qualifications remained at over 15%. A decrease of one percentage point was observed for holders of higher secondary/FET qualifications, with a concomitant increase in the share of third level graduates.
Employment growth observed over the period quarter 4 2012 to quarter 4 2013 was concentrated in the third level graduate cohort, with employment of third level graduates increasing by over 40,000 (90% of which was at honours degree level).
Figure 1.8 Employment by Education, Quarter 4 2013
Source: SLMRU (SOLAS) analysis of CSO data
Figure 1.9 shows employment by nationality. In quarter 4 2013, non-Irish nationals accounted for 14.9% of total employment or 284,000 persons. EU nationals accounted for
almost three quarters of all non-Irish nationals.
Between quarter 4 2012 and quarter 4 2013, the distribution of employment by nationality did not change markedly, with a 0.3 percentage point decrease in the share of Irish nationals and an increase in the share of non-EU nationals of the same magnitude.
Figure 1.9 Employment by Nationality, Quarter 4 2013
Source: SLMRU (SOLAS) analysis of CSO data
As presented in Figure 1.10, in quarter 4 2013, non-Irish nationals had higher participation and unemployment rates, a broadly similar employment rate and a lower inactivity rate compared to Irish nationals (Figure 1.10).
Between quarter 4 2012 and quarter 4 2013, employment and participation rates of both Irish and non-Irish nationals increased, while unemployment and inactivity rates of both groups decreased. Changes in the rates over that period were of a similar magnitude for both nationality groups.
15.6%
37.3%
47.1%
Lower secondary and below Higher secondary/FET
Third level or above
85.1%
2.6%
1.4%
6.8% 1.7% 2.3%
Ireland UKEU 15 (excl. Irish & UK) EU 15 to EU 27Asia Other

National Skills Bulletin 2014 22 July 2014
Figure 1.10 Participation, Employment, Unemployment and Inactivity Rates by Nationality, Quarter 4 2013
Source: SLMRU (SOLAS) analysis of CSO data
1.4 Redundancies Figure 1.11 shows the number of redundancies and redundancy rates for the period 2005 to 2013. Following sharp increases in 2008 and 2009, the number of redundancies has been declining steadily since. The total number of redundancies in 2013 was 13,000, which was less than half the number recorded in 2012 and less than one fifth the number recorded in 2009.
The redundancy rate for 2013 was 9 redundancies per 1,000 employees. The redundancy rate has been mirroring the evolution of total redundancies, declining steadily since 2009, when it was almost 50.
Figure 1.11 Redundancies and Redundancy Rate
Source: SLMRU (SOLAS) analysis of CSO data
1.5 Hours Worked and Earnings Average weekly paid hours and average hourly earnings are presented in Figure 1.12. In quarter 4 2013, the number of average weekly paid hours was 31.7, which was 0.1 hours higher than one year previously, although still almost an hour less than in quarter 4 2008.
In quarter 4 2013, average hourly earnings were €21.7, which was 20 cent less than in quarter 4 2012 and 50 cent less than in quarter 4 2008.
59% 61%
11%
31%
69%
62%
15%
28%
0%
10%
20%
30%
40%
50%
60%
70%
Participationrate
Employmentrate
Unemploymentrate
Inactivity rate
Irish Non-Irish
0
10
20
30
40
50
60
0
10,000
20,000
30,000
40,000
50,000
60,000
70,000
80,000
90,000
2005
2006
2007
2008
2009
2010
2011
2012
2013
Rate
(pe
r 1,
000)
Redundancies Redundancy rate

National Skills Bulletin 2014 23 July 2014
Figure 1.12 Average Weekly Paid Hours & Average Hourly Earnings
Source: CSO, Earnings, Hours and Employment Costs Survey
Average weekly paid hours by broad economic sector are presented in Figure 1.13. In quarter 4 2013, the average number of weekly paid hours worked was the highest in industry (37.8) and the lowest in the education sector (23.8).
Between quarter 4 2012 and quarter 4 2013, the average number of weekly paid hours declined in administrative services, transport and financial sectors, while it increased in all other sectors, except health where the hours remained unchanged. The greatest increase in average weekly paid hours was observed in public administration and defence (1 hour).
Figure 1.13 Average Weekly Paid Hours by Sector
Source: CSO, Earnings, Hours and Employment Costs Survey
Average hourly earnings by sector are presented in Figure 1.14. In quarter 4 2013, the highest average hourly earnings were recorded in the education sector (€34.50), with the lowest in the accommodation and food sector (€12.30).
Between quarter 4 2012 and quarter 4 2013, average hourly earnings decreased in the health, education, PAD, administrative services and accommodation and food sectors. The largest decrease was recorded in public administration and education (€0.80 and €1 respectively). Average hourly earnings increased in all other sectors, with the largest
31.6
21.9
31.7
21.7
0.0
5.0
10.0
15.0
20.0
25.0
30.0
35.0
Average weekly paidhours
Average hourly earnings €
Quarter 4 2012 Quarter 4 2013
0 10 20 30 40
Education
Accommodation & food
Arts, entertainment,recreation
Human health & social work
Wholesale & retail trade
Administrative & supportservice
All NACE economic sectors
Professional, scientific &technical
Financial, insurance & realestate
Transportation & storage
Construction
Public administration &defence
Information &communication
Industry
Quarter 4 2013 Quarter 4 2012

National Skills Bulletin 2014 24 July 2014
increase recorded in transport and arts and entertainment (€1.50 and €0.70 respectively).
Figure 1.14 Average Hourly Earnings by Sector
Source: CSO, Earnings, Hours and Employment Costs Survey
1.6 National Skills Strategy: Progress to Date The educational attainment of the labour force (15-64 years) and the 2020 targets set out in the National Skills Strategy (NSS) are presented in Figure 1.15. In quarter 4 2013, the share of third level graduates was 45.3%, which is two percentage points higher than the share observed in quarter 4 2012. The
share of persons with at most lower secondary qualifications was 15.6% in quarter 4 2013, which is 1.2 percentage points lower than one year previously.
These shifts in the educational distribution indicate further improvements in the educational attainment of the labour force. However, while the share of third level graduates observed in quarter 4 2013 is less than three percentage points below the NSS target for 2020, the gap in relation to the share of those with at most lower secondary education is 8.6 percentage points.
Figure 1.15 Labour Force (15-64 years) by Education and the NSS Target
Source: SLMRU (SOLAS) analysis of CSO data
0 10 20 30 40
Accommodation & food
Administrative & supportservice
Arts, entertainment,recreation
Wholesale & retail trade
Construction
Manufacturing
Transportation & storage
All NACE economic sectors
Industry
Human health & social work
Professional, scientific &technical
Public administration &defence
Information &communication
Financial, insurance & realestate
Education
EURO (€)
Quarter 4 2013 Quarter 4 2012 27.1
%
25.5
%
24.5
%
22.6
%
20.3
%
19.2
%
18.1
%
16.8
%
15.6
%
7.0%
40.0
%
40.0
%
39.6
%
39.7
%
40.4
%
39.4
%
40.1
%
39.9
%
39.1
%
45.0
%
32.9
%
34.4
%
35.9
%
37.7
%
39.4
%
41.4
%
41.8
%
43.3
%
45.3
%
48.0
%
0%
10%
20%
30%
40%
50%
60%
70%
80%
90%
100%
Q4
2005
Q4
2006
Q4
2007
Q4
2008
Q4
2009
Q4
2010
Q4
2011
Q4
2012
Q4
2013
.
2020
NSS
Lower secondary or less Higher secondary/FET
Third level

National Skills Bulletin 2014 25 July 2014
Section 2 Employment by Economic Sector
2.1 Employment by Broad Economic Sector The breakdown of national employment by broad economic sector is presented in Figure 2.1. In quarter 4 2013, wholesale and retail was the largest economic sector employing just over 270,000 persons. This was followed by healthcare (including social care) and industry (manufacturing, mining and utilities), each employing just under a quarter of a million persons.
Figure 2.1 Employment by Sector (000s), Quarter 4 2013
Source: SLMRU (SOLAS) analysis of CSO data
* Other NACE sectors include activities such as entertainment, repair of goods, a range of personal service activities, etc. **The information and communication sector includes computer programming, telecommunications, information services, publishing and broadcasting; it does not include ICT equipment manufacturing or the wholesale of computers, computer peripheral equipment and software.
Between quarter 4 2012 and quarter 4 2013, employment increased strongly in the agriculture*, accommodation/food and professional, scientific & technical sectors, with each of these sectors growing by over 10% (Figure 2.2). Over this period, employment in the financial sector declined by 6%. In all other sectors, employment remained broadly in line with the level recorded one year previously, with changes amounting to less than 3%. Although less than 1%, the increase in employment in construction was the first quarter 4 to quarter 4 increase since quarter 4 2007.
Figure 2.2 Employment Growth by Sector
Source: SLMRU (SOLAS) analysis of CSO data
*Note: Estimates of employment in the agriculture, forestry and fishing sector are sensitive to sample changes over time and growth rates in this sector should be interpreted with caution.
64.5
82.5
89.6
95.0
97.1
98.0
103.6
115.2
116.8
135.7
146.9
243.6
249.6
270.4
0 100 200 300
Administrative & supportservices
Information &communication**
Transportation & storage
Public administration &defence
Financial, insurance & realestate
Other NACE activities*
Construction
Professional, scientific &technical
Agriculture, forestry & fishing
Accommodation & foodservices
Education
Industry
Human health & social work
Wholesale & retail trade
-6%
-1%
-1%
-1%
0%
0%
1%
1%
2%
2%
2%
3%
13%
15%
30%
-12%
-9%
-11%
19%
-11%
-53%
-2%
-5%
8%
-2%
-6%
-13%
2%
14%
0%
-60% -40% -20% 0% 20% 40%
Financial, insurance & realestate
Wholesale & retail trade
Public administration &defence
Information & communication
Total employment
Construction
Transportation & storage
Education
Human health & social work
Other NACE activities
Administrative & supportservices
Industry
Professional, scientific &technical
Accommodation & foodservices
Agriculture, forestry & fishing
Q4 2008-Q4 2013 Q4 2012-Q4 2013

National Skills Bulletin 2014 26 July 2014
Over the five-year period - quarter 4 2008 to quarter 4 2013 - employment increased in the ICT, accommodation and food, healthcare, and professional, scientific and technical services sectors. Expanding by 19% (or by 3.5% on average annually), the ICT sector was the fastest growing sector over this period.
Industry
With employment of 243,600, industry was the third largest economic sector in quarter 4 2013, accounting for 13% of national employment. Between quarter 4 2012 and quarter 4 2013, industrial employment increased by 2.7% or 6,000. However, in quarter 4 2013, industrial employment was almost 37,000 (or 13%) below the level recorded in quarter 4 2008, translating into an average annual decline of 2.8%.
In quarter 4 2013, almost 90% of industrial employment was in manufacturing (215,900 persons), with utilities and extraction/mining accounting for 9% and 2% respectively (Figure 2.3).
Figure 2.3 Industrial Employment by Sector, Quarter 4 2013
Source: SLMRU (SOLAS) analysis of CSO data
Between quarter 4 2012 and quarter 4 2013, employment in utilities increased by 28.4% or
almost 5,000 (Figure 2.4). Within this sub-sector, employment increased in all areas, including electricity, gas, steam and air conditioning supply, water supply and waste collection activities. Over the same period, employment in extraction/mining declined by 6.3% to just below 6,000, which is half the level recorded in quarter 4 2008. Employment in manufacturing in quarter 4 2013 remained broadly in line with the level recorded one year previously.
Employment in each of the industry sectors in quarter 4 2013 remained below levels recorded in quarter 4 2008, indicating a contraction of 2% on average annually in manufacturing and utilities and 14% in extraction/mining.
Figure 2.4 Industrial Employment Growth by Sub-Sector
Source: SLMRU (SOLAS) analysis of CSO data
Manufacturing employment by technological intensity in presented in Figure 2.5. In quarter 4 2013, low technology manufacturing accounted for 41% of manufacturing employment, followed by high technology (26%), medium-high (19%) and medium-low
Manuf. 215,900,
89%
Mining, 5,900,
2% Utilities, 21,700,
9%
-11.1%
-53.5%
-11.4%
0.9%
-6.3%
28.4%
-60% -40% -20% 0% 20% 40%
Manufacturing
Extraction/mining
Utilities
Q4 2012-Q4 2013 Q4 2008-Q4 2013

National Skills Bulletin 2014 27 July 2014
(14%).11 Compared to quarter 4 2008, the share of employment in high and medium-high technology manufacturing increased by two and five percentage points respectively, while the share of employment in medium-low and low technology manufacturing declined by seven and one percentage points respectively.
Figure 2.5 Manufacturing Employment by Technological Intensity, Quarter 4 2013
Source: SLMRU (SOLAS) analysis of CSO data
Between quarter 4 2012 and quarter 4 2013, employment increased in the medium-high and low technology manufacturing sectors (by 15% and 3% respectively), while it declined in the medium-low and high technology manufacturing sectors (by 12% and 3% respectively) (Figure 2.6).
When compared to quarter 4 2008, employment was almost 20,000 lower in medium-low manufacturing and 12,500 lower in low technology manufacturing; while high
11 High technology: pharmaceuticals, computers, etc. Medium-high: chemicals, electrical equipment, machinery, medical instruments, etc.; Medium-low: petroleum products, rubber and plastic, other non-metallic mineral products, fabricated metal products etc. Low technology: food, beverages, textiles, leather, wood, paper, printing, etc.
technology manufacturing remained broadly in line with the levels recorded five years previously, employment in the medium-high technology sector expanded by 6,500.
Figure 2.6 Manufacturing Employment Growth by Technological Intensity
Source: SLMRU (SOLAS) analysis of CSO data
Employment in the high and medium-high technology manufacturing sub-sectors are presented in Figure 2.7. In quarter 4 2013, 95,100 persons employed in manufacturing were working in high or medium-high technology sub-sectors. Pharmaceuticals and machinery and equipment manufacturing accounted for one third of this employment each, while computer, electronics etc. manufacturing accounted for a quarter.
56,900 26%
40,700 19%
29,900 14%
88,500 , 41%
High technology Medium-high technology
Medium-low technology Low technology
-3%
15%
-12%
3%
1%
-2%
19%
-40%
-12%
-11%
-60% -40% -20% 0% 20% 40%
High technology
Medium-high technology
Medium-low technology
Low technology
Total manufacturing
Q4 2008-Q4 2013 Q4 2012-Q4 2013

National Skills Bulletin 2014 28 July 2014
Figure 2.7 High & Medium-High Tech Manufacturing Employment, Quarter 4 201312
Source: SLMRU (SOLAS) analysis of CSO data
Between quarter 4 2012 and quarter 4 2013, employment decreased in computer, electronics etc. manufacturing and increased in electrical equipment, machinery and pharmaceuticals manufacturing (Figure 2.8). The three latter sectors combined expanded by 7,600 to reach employment of over 70,000, which was more than 13,000 above the quarter 4 2008 level.
Figure 2.8 High and Medium-High Technology Intensive Manufacturing Employment
Source: SLMRU (SOLAS) analysis of CSO data
12 Manufacturing of chemicals is not presented because employment level is under 3,000 and there is a higher than typical risk of sampling error.
Construction
In quarter 4 2013, the construction sector employed 103,600 persons, accounting for 5.4% of national employment. Between quarter 4 2012 and quarter 4 2013, employment remained almost unchanged, with a less than 1% increase recorded. Over this period, employment increased in the construction of buildings and civil engineering, while it contracted in specialised construction activities (e.g. bricklaying, scaffolding, construction equipment renting etc.).
In quarter 4 2013, the employment level remained more than 50% (116,000 persons) below the level recorded in quarter 4 2008. However, the small increase in employment recorded in the 12-month period to quarter 4 2013 suggests a halt in the continuous contraction observed since quarter 4 2007.
Agriculture
In quarter 4 2013, 116,800 persons were employed in agriculture, representing 6.1% of national employment. Over 90% of this employment was in crop and animal production, with the remainder in forestry, fishing and aquaculture.
Between quarter 4 2012 and quarter 4 2013, agricultural employment expanded by 26,800 or 30%.13 This increase brought employment up to the level recorded in quarter 4 2008.
Services
In quarter 4 2013, three quarters of national employment was in the services sector. Of
13 Estimates of employment in the agriculture, forestry and fishing sector are sensitive to sample changes over time and growth rates in this sector should be interpreted with caution.
6,700
23,600
31,500
33,500
0 20,000 40,000
Electrical and transportequip.
Computer, electronicand optical
Machinery andequipment
Pharmaceuticals
4.1%
15.0%
-12.3%
48.9%
22%
23%
-24%
29%
-60% -40% -20% 0% 20% 40% 60%
Pharmaceuticals
Machinery and equipment
Computer, electronic andoptical
Electrical and transportequp.
Q4 2008-Q4 2013 Q4 2012-Q4 2013

National Skills Bulletin 2014 29 July 2014
total services sector employment of almost 1.5 million, 59% (847,300) was in knowledge intensive services (ICT, financial, legal, accounting, engineering, R&D, education, health and arts) ,14 and the remainder was in less knowledge intensive services (wholesale & retail, warehousing & transport, accommodation & food, office administration, real estate, travel, etc.)15 (Figure 2.9).
Figure 2.9 Services Sector Employment, Quarter 4 2013
Source: SLMRU (SOLAS) analysis of CSO data
Between quarter 4 2012 and quarter 4 2013, employment in the services sector increased by 2.1%, with an increase of 3% (or 17,500) in less knowledge intensive services and 1.4% (or 11,900) in knowledge intensive services (Figure 2.10). This increase has brought employment in knowledge intensive services to just above the level recorded in quarter 4 2008. Despite the increase in employment observed in the year to quarter 4 2013, employment in less knowledge intensive services remained below the level recorded in quarter 4 2008, with 17,000 fewer persons employed.
14 NACE Rev. 2 50, 51, 58, 59, 60, 61, 62, 63, 64, 65, 66, 69, 70, 71, 72, 73, 74, 75, 78, 80, 84, 85, 86, 87, 88, 90, 91, 92, 93. 15 NACE Rev. 2 45, 46, 47, 49, 52, 53, 55, 56, 68, 77, 79, 81, 82, 94, 95, 96, 97, 98, 99.
Over the five-year period (quarter 4 2008 to quarter 4 2013), the greatest absolute increase in knowledge intensive services was in computer programming and information services (over 15,000), while the greatest decline was in public administration (11,400). In less knowledge intensive services, the greatest increase was in accommodation and food services (16,400), while the greatest decline was in wholesale and retail (28,000).
Figure 2.10 Services Sector Employment Growth by Knowledge Intensity
Source: SLMRU (SOLAS) analysis of CSO data
Wholesale and Retail Trade
In quarter 4 2013, there were just over 270,000 persons employed in the wholesale and retail trade sector, accounting for 14.2% of national employment. Of these, 180,000 persons were in retail trade, 57,000 in wholesale and 33,500 in motor trade.
Over the period quarter 4 2012 to quarter 4 2013, all sub-sectors contracted slightly, resulting in a total sector employment decline of just over 1% or 3,000. As a result, wholesale and retail employment remained below the level recorded in quarter 4 2008 (by 28,000), with the gap to full recovery remaining at almost 20,000 for the retail
0 40,000 80,000120,000
Less knowledgeintensive services
Knowledge intensiveservices
2.1%
3.0%
1.4%
-1.1%
-2.8%
0.2%
-4% -2% 0% 2% 4%
All services
Less knowledge intensiveservices
Knowledge intensiveservices
Q4 2008-Q4 2013 Q4 2012-Q4 2013

National Skills Bulletin 2014 30 July 2014
sector and 5,500 and 3,000 for motor trade and other wholesale trade respectively.
Accommodation and Food Services
In quarter 4 2013, there were 135,700 persons employed in accommodation and food services, accounting for just over 7% of national employment. Of this, accommodation services accounted for 37%, while food and beverage services accounted for the remainder.
Between quarter 4 2012 and quarter 4 2013, employment increased by almost 15% or 17,400. Over this period, employment increased in both sub-sectors, with accommodation services expanding by 4,800 (11%) and food and beverage services by 12,500 (17%). As a result, employment in accommodation and food services in quarter 4 2013, was above that recorded in quarter 4 2008, with 6,800 and 9,600 additional persons employed in accommodation and food services respectively.
Professional, Scientific and Technical Activities
In quarter 4 2013, there were 115,200 persons employed in professional, scientific and technical activities, accounting for 6% of national employment. One quarter of employment was in legal and accounting services, over a fifth in engineering activities (including architectural activities and technical testing), with the remainder spread across other services such as scientific R&D, market research and management consultancy.
Between quarter 4 2012 and quarter 4 2013, the sector expanded by almost 13% or 13,000. With the exception of scientific R&D, all professional, scientific and technical
activities expanded over that period. The strongest growth in absolute terms was observed in legal and accounting services (5,500).
As a result of the recently observed growth in the professional, scientific and technical activities sector (including management consultancy), there were 2,500 additional persons employed in quarter 4 2013 compared to that recorded in quarter 4 2008. Within the sector, however, employment in architectural and engineering activities remained below quarter 4 2008 levels.
Financial, Insurance and Real Estate Services
In quarter 4 2013, 97,000 persons were employed in the provision of financial, insurance and real estate services. This represented 5% of national employment. Two thirds of employment was in financial services (e.g. banking), one fifth in insurance, with the remainder in auxiliary and real estate activities.
Between quarter 4 2012 and quarter 4 2013, employment contracted by 5.6% or 5,700. Over this period, the decline was concentrated in financial services, activities auxiliary to financial services and, to a smaller degree, in real estate activities, while there was no change in employment levels in the insurance sector.
As a result of these changes, employment in the sector as a whole, as well as its sub-sectors, remained below the levels recorded in quarter 4 2008.
Transportation and Storage
In quarter 4 2013, employment in transportation and storage related activities

National Skills Bulletin 2014 31 July 2014
was almost 90,000, accounting for 4.7% of national employment. Land transport accounted for just over half of this employment, 18% was in postal and courier activities, 17% in warehousing and support activities for transportation, while air and water transport accounted for 11% and 3% respectively.
Between quarter 4 2012 and quarter 4 2013, employment in the sector as a whole remained broadly at the same level. An increase in warehousing activities was off-set by the decline of a similar magnitude in postal and courier activities.
In quarter 4 2013, employment in the sector as a whole remained below the quarter 4 2008 level. Within the sector, employment in warehousing, air and water transport in quarter 4 2013 was above the levels recorded five years previously, while employment in land transport and postal and courier activities remained below the quarter 4 2008 levels by 5,800 and 1,800 respectively.
Information and Communications (ICT)
In quarter 4 2013, there were 82,500 persons employed in the ICT sector, accounting for 4.3% of national employment. Over half of overall employment in the sector was in computer programming activities, over a fifth in telecommunications and the remainder was spread across various services such as broadcasting, publishing and motion picture production.
There was very little change in employment levels in the ICT sector as a whole between quarter 4 2012 and quarter 4 2013, although there was some decline in computer programming activities and
telecommunications, but an increase in publishing and motion picture activities.
In quarter 4 2013, the employment level in the sector as a whole was 13,000 more than that recorded five years previously. With the exception of telecommunications, all sub-sectors were either at, or above, the employment levels recorded in quarter 4 2008. For example, employment in computer programming activities was 40% above the levels recorded five years previously.
Administrative and Support Service Activities
In quarter 4 2013, there were 64,500 persons employed in administrative and support services, accounting for 3.4% of national employment. One third of employment in this sector was in services to buildings and landscape, followed by 23% in office administrative activities, 17% in security, 10% in travel services, 9% in employment activities and 8% in renting and leasing.
Between quarter 4 2012 and quarter 4 2013, employment in the administrative and support services sector as a whole increased by 2%. Within the sector, the increase in employment in office administrative activities was to a large degree off-set by the decline in employment activities and services to buildings, while other sub-sectors recorded little change in employment levels.
In quarter 4 2013, employment in the overall sector remained below the level recorded in quarter 4 2008, although employment in office administrative and travel services exceeded the levels recorded five years previously.

National Skills Bulletin 2014 32 July 2014
Health
In quarter 4 2013, there were just under a quarter of a million persons employed in human health and social work activities, accounting for 13.1% of national employment. Over 60% of employment was in human health activities, 28% in social work activities and the remaining 10% in residential care activities.
Between quarter 4 2012 and quarter 4 2013, employment increased by 1.6% or almost 4,000. Almost all of this increase was concentrated in social work activities.
In quarter 4 2013, employment in the human health and social work activities sector as a whole was almost 20,000 higher than the level recorded in quarter 4 2008.
Education
In quarter 4 2013, there were 147,000 persons employed in the education sector, accounting for 7.7% of national employment.
Between quarter 4 2012 and quarter 4 2013, employment grew by 1.1%; however, it remained below the quarter 4 2008 level, with 7,700 fewer persons employed.
Public Administration and Defence (PAD)
In quarter 4 2013, there were 95,000 persons employed in PAD, accounting for 5% of national employment. Between quarter 4 2012 and quarter 4 2013, employment contracted by 1%. As a result, the employment level was 11,400 below the quarter 4 2008 level.
Other NACE activities
In quarter 4 2013, employment in other NACE activities was 98,000, accounting for 5.1% of national employment. Almost one third of employment was in personal services activities, followed by one fifth in sports activities, 13% in arts activities, with the remainder distributed between other activities, such as cultural, gambling etc. Although there was some expansion and contraction at sub-sector level, employment in this sector as a whole remained relatively unchanged when compared to quarter 4 2012, as well as quarter 4 2008.
2.2 Economic Outlook by Sector
Economy
Between 2012 and 2013, a growth of 3.4% was recorded for the Gross National Product (GNP), while the Gross Domestic Product (GDP) contracted by 0.3% (Figure 2.11). The difference in performance was mostly due to the negative impact of the expiry of patents in the pharmaceutical sector on net factor income payments to the rest of the world. Over this period, employment also increased, by 2.1%.
Further improvements in macroeconomic indicators are expected for 2014 and 2015:
▪ GDP is expected to grow by 2% in 2014 and a further 2.3%-3.2% in 2015
▪ GNP is expected to grow by 2.7% and 2.6% in 2014 and 2015 respectively
▪ employment is expected to grow by 1.5%-2.6% in 2014 and further a 1.3%-2.2% in 2015.16
16 Central Bank of Ireland, Quarterly Bulletin April 2014 and Department of Finance, A Strategy for Growth 2014-2020, Decmeber 2013.

National Skills Bulletin 2014 33 July 2014
In December 2013, Ireland exited the Troika programme and the Government successfully returned to the international bond markets. Fiscal consolidation has been on target, with the government deficit reduced to 7.2% of GDP in 2013. Further consolidation through tax and expenditure is expected in 2014 and 2015 in order to reach the targets set for the fiscal deficit and debt to GDP ratio.17
Figure 2.11 Economic Growth and Employment, Annual Change, 2008-2015
Source: CSO Quarterly National Accounts; Central Bank of Ireland, Quarterly Bulletin April 2014; SLMRU (SOLAS) analysis of CSO data
Foreign Direct Investment (FDI) flows to Ireland were strong during 2013, with employment in foreign-owned agency-assisted companies reaching approximately 172,000.18 Further employment creation through FDI is lined up for 2014.19
While Ireland’s overall competitiveness has improved in recent years20, recent upwards pressures on costs have been observed in a number of areas: 17 Department of Finance, Ireland’s Stability Programme, April 2014. 18 Forfás, Annual Employment Survey 2013, April 2014. 19 IDA, Ireland Quarterly Update, Quarter 1 2014. 20 IMD World Competitiveness Yearbook 2014 ranks Ireland at number 15, up 6 places compared to 2010.
▪ unit labour costs, which increased by 1.4% in 2013 and are expected to increase further in 2014
▪ property costs (particularly commercial) are on the rise
▪ transport (e.g. fuel prices), utility (e.g. electricity, waste and water costs etc.) and other business costs (e.g. computer consultancy) remain comparably high.21
Tackling costs and achieving other improvements in competitiveness will be critical for Ireland’s ability to compete internationally and to remain an attractive business location.
Agriculture
Agricultural employment had been declining continuously between the late 1990s and 2007. Over this period, the numbers employed fell from over 140,000 to just over 110,000. Since the beginning of the economic crisis in 2007, the numbers employed in agriculture have moved in a less discernible pattern, with the latest official data suggesting significant increases. Nonetheless, agricultural employment is expected to decline in the long term, with employment levels by 2020 expected to be below those recorded at present.22 This is despite the increases in the agricultural output expected to be stimulated by various policy measures (e.g. removal of the milk quota (EU Common Agricultural Policy) and Harvest 2020). In the long term, the sector is expected to become even more capital and less labour intensive.
Manufacturing
Manufacturing employment declined from over 300,000 in the late 1990s to less than
21 NCC, Cost of Doing Business, March 2014. 22 ESRI, Medium Term Review 2013-2020, July 2013.
-15%
-10%
-5%
0%
5%
10%
2008
2009
2010
2011
2012
2013
2014f
2015f
GDP GNP Employment

National Skills Bulletin 2014 34 July 2014
250,000 in 2013, while the volume of industrial output, particularly in the modern sectors, increased significantly. These trends are expected to continue in the long run, as technological changes, the implementation of lean processes and labour-capital substitution continues.
However, in the medium run, employment growth is possible for a number of reasons. High levels of IDA supported investment are expected to positively impact on employment levels, particularly in the modern manufacturing sectors (e.g. medical devices and pharmaceuticals).23 In addition, it is expected that Ireland will continue to expand its market share beyond the EU and US markets. The widespread implementation of leaner business and production processes in combating recessionary pressures have reduced the potential of further automation to reduce the labour intensity of the manufacturing sector in the medium run. As a result of these developments, there is potential for an increase in employment of over 40,000 by 2020.24
Construction
Strong growth in construction employment is expected as this sector recovers from the collapse it experienced as a result of the credit crunch and bursting of the housing market bubble. Over the medium term, employment growth in construction is expected to outstrip growth in other sectors, in absolute and relative terms. The initial impetus for growth will come from expansion in other sectors (e.g. ICT and pharmaceuticals), but will extend to residential building as recovery in the
23 IDA. 24 EGFSN, Future Skills Requirements of the Manufacturing Sector to 2020, April 2013.
domestic demand takes hold. However, despite the expected strong growth, construction employment in 2020 is likely to remain approximately 100,000 below the peak level recorded in 2007.25
Distribution
The distribution sector (wholesale, retail and motor trade) is projected to grow broadly in line with the economy, with a full recovery to pre-recession employment levels possible by 2020. However, a failure of domestic policy to resolve outstanding issues with the banking system and flow of credit to households and businesses would continue to negatively impact on domestic demand and have an adverse effect on employment growth in the distribution sector. 26
Transport
In the medium term, employment in the transport sector is projected to grow above average. Employment is expected to recover fully and even exceed the pre-recession level by 2020.27
Other Market Services
Employment growth in all other market services is expected to be strong in the medium and long run, although growth rates are likely to vary by sub-sector. The strongest employment growth is expected in the ICT sector. Above average employment growth is also expected in the financial services sector and other professional services sectors, with more than a full recovery in employment levels expected by 2020. Employment in the accommodation and food services and all
25 ESRI, Medium Term Review 2013-2020, July 2013. 26 Ibid. 27 Ibid.

National Skills Bulletin 2014 35 July 2014
other services sectors is expected to grow in line with the overall economy. 28
Public Administration and Defence (PAD), Health and Education
The expected persistence of a tight fiscal policy over the short to medium term is expected to adversely affect employment growth in public administration and defence, as well as publicly funded education and healthcare services. Employment growth in these sectors is expected to lag behind most other sectors.
28 SOLAS, Occupational Employment Projections 2020, January 2014.

National Skills Bulletin 2014 36 July 2014
Section 3 Employment by Broad Occupation
3.1 Employment Figure 3.1 presents employment by broad occupational group. In this section, farmers are presented as an occupation separate from other skilled trades. In quarter 4 2013, persons employed as managers, professionals, associate professionals and clerks (‘white collar’ workers) accounted for almost half of the national workforce. Those employed in elementary occupations and skilled trades accounted for 11% each, while farmers accounted for 4.4%.
Between quarter 4 2012 and quarter 4 2013, the share of ‘white collar’ workers marginally decreased, while the share of skilled tradespersons and farmers increased by 0.6 and 0.9 percentage points each.
Figure 3.1 Employment by Broad Occupational Group (%), Quarter 4 2013
Source: SLMRU (SOLAS) analysis of CSO data
Employment levels by occupational group are presented in Figure 3.2. In quarter 4 2013, there were over a half a million persons
employed in professional and associate professional occupations. There were over 200,000 persons employed in each of the following occupational groups: skilled trades, elementary and administrative occupations.
Figure 3.2 Employment by Broad Occupational Group (000s), Quarter 4 2013
Source: SLMRU (SOLAS) analysis of CSO data
3.2 Employment Growth Figure 3.3 presents average annual employment growth by broad occupational group. Over the period 2008 and 2013, employed declined in all occupational groups, except for managers, professionals and associate professionals. The greatest decline was observed for skilled trades, with employment declining by 8.7% on average annually. This was followed by elementary and administrative occupations, with employment declining by 5.2% and 4.3% on average annually respectively.
7.9%
18.6%
11.6%
11.1% 11.6%
7.7%
8.4%
7.5%
11.2%
4.4%
Managers, directors and senior officialsProfessionalAssociate professional and technicalAdministrative and secretarialSkilled tradesCaring, leisure and other serviceSales and customer serviceProcess, plant and machine operativesElementaryFarmers
6.1
83.6
143.0
147.5
150.9
160.4
210.7
212.5
220.1
220.9
354.0
0 100 200 300 400
Not stated
Farmers
Operatives
Services
Managers
Sales
Administrative
Elementary
Assoc. prof.
Skilled trades
Professional

National Skills Bulletin 2014 37 July 2014
Figure 3.3 Annualised Employment Growth by Broad Occupational Group, 2008-2013
Source: SLMRU (SOLAS) analysis of CSO data
The absolute and relative change in employment by broad occupational group is presented in Figure 3.4. Between 2012 and 2013, employment increased in all occupational groups, with the exception of services occupations. The most pronounced positive change, in absolute and relative terms, was observed for farmers and elementary occupations.
Figure 3.4 Employment Growth by Broad Occupational Group, Annualised Data, 2012-2013
Source: SLMRU (SOLAS) analysis of CSO data
3.3 Employment by Gender Figure 3.5 presents the distribution of employment in broad occupational groups by gender. In quarter 4 2013, the share of males was greater in six out of the ten occupational groups. Over 80% of all farmers, skilled tradespersons and operatives were male. In contrast, over 80% of services workers and clerks were female. Professional occupations were almost gender balanced.
Between quarter 4 2012 and quarter 4 2013, the share of female professionals decreased by three percentage points, while the share of female managers and farmers increased by three and one percentage points respectively.
Figure 3.5 Employment by Gender and Broad Occupational Group (%), Quarter 4 2013
Source: SLMRU (SOLAS) analysis of CSO data
3.4 Employment by Age The age distribution of employment in broad occupational groups is presented in Figure 3.6. In quarter 4 2013, employment in most occupational groups was in the 25-54 age cohort. With almost one quarter younger than 25, sales workers were the youngest
-8.7%
-5.2%
-4.3%
-3.3%
-2.5%
-1.5%
-0.6%
0.9%
1.2%
1.3%
-15% -10% -5% 0% 5%
Skilled trades
Elementary
Admin.
Farmers
Operatives
Sales
Services
Assoc. prof.
Managers
Professional
-25%
-20%
-15%
-10%
-5%
0%
5%
10%
15%
20%
25%
-4
-2
0
2
4
6
8
10
12
14
Skill
ed T
rade
s
Serv
ices
Man
ager
s
Sale
s
Adm
in.
Asso
c. p
rof.
Ope
rati
ves
Prof
essi
onal
s
Elem
enta
ry
Farm
ers
000s %
0%
20%
40%
60%
80%
100%
Farmers
Skilled trades
Operatives
Managers
Assoc. prof.
Elementary
Professional
Sales
Admin.
Services
Male Female

National Skills Bulletin 2014 38 July 2014
occupational group. In contrast, one in two farmers were 55 or older, while less than 2% were younger than 25.
Between quarter 4 2012 and quarter 4 2013, employment in almost all occupational groups shifted towards older age cohorts. The share of 15-24 year-olds declined for most occupational groups (sales, associate professionals, farmers, operatives, services and elementary occupations). In contrast, the share of persons aged 55 and over increased in all occupational groups, except for professionals, services and farmers.
Figure 3.6 Employment by Age and Broad Occupational Group (%), Quarter 4 2013
Source: SLMRU (SOLAS) analysis of CSO data
3.5 Employment by Education Figure 3.7 presents the educational distribution of employment in broad occupational groups. In quarter 4 2013, the highest share of third level graduates was amongst professionals (95%), associate professionals (70%) and managers (55%). In contrast, 10% of farmers and 16% of operatives were third level graduates. Moreover, just over 50% of farmers and just
over one third of operatives had educational attainment of less than higher secondary level.
Between quarter 4 2012 and quarter 4 2013, there was an increase in the share of third level graduates in all occupations. The most notable improvement in the educational distribution was observed for services occupations, where the share of employment at less than higher secondary education level declined by four percentage points to 16%.
Figure 3.7 Employment by Education and Broad Occupational Group (%), Quarter 4 2013
Source: SLMRU (SOLAS) analysis of CSO data
3.6 Employment by Nationality The distribution of occupational employment by nationality is presented in Figure 3.8. In quarter 4 2013, the share of non-Irish nationals was the lowest amongst farmers (1%), clerks (8%) and managers (10%). Almost one third of all elementary workers and two out of every five salespersons were non-Irish.
0%
20%
40%
60%
80%
100%
Managers
Farmers
Professional
Admin.
Assoc. prof.
Operatives
Skilled trades
Services
Elementary
Sales
55+ 25-54 15-24
0%
20%
40%
60%
80%
100%
Farmers
Operatives
Elementary
Skilled trades
Sales
Services
Admin.
Managers
Assoc. prof.
Professional
Third level or aboveHigher secondary or FETLower secondary or less

National Skills Bulletin 2014 39 July 2014
Between quarter 4 2012 and quarter 4 2013, the share of non-Irish nationals decreased in professional and services occupations. In contrast, the share of non-Irish employed in sales and elementary occupations increased by two percentage points each.
Figure 3.8 Employment by Nationality and Broad Occupational Group (%), Quarter 4 2013
Source: SLMRU (SOLAS) analysis of CSO data
3.7 Employment Status Figure 3.9 presents employment in broad occupational groups by employment status. In quarter 4 2013, the majority of persons working in each occupational group, with the exception of farmers, were employees. Over 90% of those working in sales, administrative and elementary occupations were employees. Over 90% of farmers and 60% of managers (e.g. shop owners, publicans, etc.) were self-employed. Farmers had the greatest share of those assisting a relative (4%).
Between quarter 4 2012 and quarter 4 2013, the distribution of employment between employees, self-employed and those assisting
relatives remained broadly unchanged across occupational groups.
Figure 3.9 Employment by Employment Status and Broad Occupational Group (%), Quarter 4 2013
Source: SLMRU (SOLAS) analysis of CSO data
Note: The scheme employee refers to employees on community employment schemes (CES) and other employment schemes (e.g. Job Bridge and Work Placement) based on the CSO’s standard employment status classification.
Employment in broad occupational groups by full-time and part-time work is presented in Figure 3.10. In quarter 4 2013, over 50% of employment in each occupational group was full-time. The highest share of part-time workers was found in sales (49%), services (46%), elementary (41%) and administrative (30%) occupations.
Between quarter 4 2012 and quarter 4 2013, the share of full-time operatives and sales workers increased by two percentage points each. In contrast, the share decreased by two percentage points for both associate professional and administrative occupations.
0%
20%
40%
60%
80%
100%
Farmers
Admin.
Assoc. prof.
Managers
Professional
Services
Sales
Skilled trades
Operatives
Elementary
Non-Irish Irish
0%
20%
40%
60%
80%
100%
Admin.
Sales
Elementary
Services
Professionals
Assoc. prof.
Operatives
Skilled Trades
Managers
Farmers
Assisting relative Scheme employee
Employee Self-employed or other

National Skills Bulletin 2014 40 July 2014
Figure 3.10 Full-Time and Part-Time Employment by Broad Occupational Group (%), Quarter 4 2013
Source: SLMRU (SOLAS) analysis of CSO data
3.8 Employment by Region29 The regional distribution of employment in broad occupational groups is presented in Figure 3.11. In quarter 4 2013, over 30% of employment in each occupational group, except farmers, was located in Dublin and the Mid-East. Over 50% of ‘white collar’ employment (professionals, associate professionals, managers and administrators) was located in Dublin and the Mid-East. Over 40% of farmers and over 30% of operatives were located in the BMW region.
Between quarter 4 2012 and quarter 4 2013, the share of elementary workers and skilled tradespersons employed in Dublin and the Mid-East increased by four and three percentage points respectively. Over the same period, the share of farmers employed in the BMW and South-West regions increased
29While regions are defined by NUTS3, for presentation purposes the Border, Midlands and Western Regions were grouped into the BMW region while the Dublin region and the Mid-East region were grouped to form the Dublin and Mid-East region.
by three and two percentage points respectively. The share of sales workers employed in the South-East region increased by three percentage points.
Figure 3.11 Employment by Region and Broad Occupational Group (%), Quarter 4 2013
Source: SLMRU (SOLAS) analysis of CSO data
0%
10%
20%
30%
40%
50%
60%
70%
80%
90%
100%
Managers
Farmers
Assoc. prof.
Professionals
Skilled trades
Operatives
Admin.
Elementary
Services
Sales
Part-time Full-time0%
10%
20%
30%
40%
50%
60%
70%
80%
90%
100%
Farmers
Operatives
Skilled trades
Elementary
Services
Sales
Admin.
Professional
Managers
Assoc. prof.
BMW South-WestSouth-East Mid-WestDublin and Mid-East

National Skills Bulletin 2014 41 July 2014
Section 4 Unemployment
4.1 Unemployment and Unemployment Rate The average annual unemployment levels and rates for the period 1998-2013 are presented in Figure 4.1. In 2013, there were 282,000 persons looking for employment. This is almost 34,000 below the number recorded in 2012. Despite this improvement, unemployment remains over 200,000 above the levels recorded at the turn of the century.
In 2013, the average unemployment rate was 13.1%, which was a 1.6 percentage point decrease on the 2012 average rate. This was the first decrease in the annual unemployment rate since the beginning of the economic crisis in 2008.
Figure 4.1 Annual Average Unemployment Level (000s) and Unemployment Rate (%)
Source: SLMRU (SOLAS) analysis of CSO data
4.2 Unemployment by Occupation Figure 4.2 presents the distribution of unemployment by broad occupational group. In quarter 4 2013, over a quarter of unemployed persons did not state their previous occupation (e.g. looking for work for the first time, entering employment from inactivity). Skilled tradespersons (including
farmers) accounted for 17% of unemployment, with elementary occupations accounting for 15%.
Between quarter 4 2012 and quarter 4 2013, the share of unemployed persons previously working in skilled trades declined by four percentage points. All other changes in occupational shares amounted to one percentage point or less.
Figure 4.2 Unemployment by Occupation (000s; %), Quarter 4 2013
Source: SLMRU (SOLAS) analysis of CSO data
The unemployment rate by broad occupation is presented in Figure 4.3. In quarter 4 2013, the unemployment rate was the highest for elementary occupations (15%) and skilled trades (13%). The unemployment rates for ‘white collar’ occupations remained in single digits, with the lowest unemployment rate observed for professionals (3%).
Between quarter 4 2012 and quarter 4 2013, the unemployment rate declined for all occupations except for services occupations. The greatest decrease was observed for elementary occupations and skilled trades,
0%2%4%6%8%10%12%14%16%
0
50
100
150
200
250
300
350
1998199920002001200220032004200520062007200820092010201120122013
%
Unemployed Unemployment rate
Managers 8.6 3%
Professional 12.0 4%
Assoc. prof. 14.5 6%
Admin 17.2 7%
Skilled Trades 44.1 17%
Services 14.0 6%
Sales 17.4 7%
Operatives 20.0 8%
Elementary 36.9 15%
No Occupation
67.8 27%
Not Stated 1.3 0%

National Skills Bulletin 2014 42 July 2014
with the unemployment rate declining by six and four percentage points respectively.
Figure 4.3 Unemployment Rate by Occupation, Quarter 4 2013
Source: SLMRU (SOLAS) analysis of CSO data
Note: Excludes persons who did not state their previous occupation.
4.3 Unemployment by Gender The gender distribution of unemployed persons is presented in Figure 4.4. In quarter 4 2013, 63% of unemployed persons were male. Between quarter 4 2012 and quarter 4 2013, the share of males in unemployment decreased by four percentage points.
Figure 4.4 Unemployment by Gender, Quarter 4 2013
Source: SLMRU (SOLAS) analysis of CSO data
In quarter 4 2013, the unemployment rate for females (9.8%) was lower than that of males (13.3%) (Figure 4.5). Between quarter 4 2012 and quarter 4 2013, the unemployment rate decreased for both genders, but the decline was more pronounced for males (by 3.3 percentage points).
Figure 4.5 Unemployment Rate by Gender, Quarter 4 2012 & Quarter 4 2013
Source: SLMRU (SOLAS) analysis of CSO data
4.4 Unemployment by Age Figure 4.6 presents the age distribution of unemployed persons. In quarter 4 2013, the share of unemployed persons aged 25-54 was 70%; one in five unemployed persons was under 25 years.
Between quarter 4 2012 and quarter 4 2013, the share of unemployed persons aged 55 and over increased by two percentage points, while the share of those younger than 25 years declined by one percentage point.
5%
3%
6%
8%
13%
9% 10%
12%
15%
0%
5%
10%
15%
Man
ager
s
Prof
essi
onal
Asso
c. p
rof.
Adm
in.
Skill
ed t
rade
s
Serv
ices
Sale
s
Ope
rati
ves
Elem
enta
ry
158.9 63%
94.3 37%
Male Female
16.6%
10.3%
13.3%
9.8%
0%
5%
10%
15%
20%
Male Female
Q4 2012 Q4 2013

National Skills Bulletin 2014 43 July 2014
Figure 4.6 Unemployment by Age, Quarter 4 2013
Source: SLMRU (SOLAS) analysis of CSO data
Figure 4.7 presents unemployment rates for different age cohorts. At 24.2%, the unemployment rate for those younger than 25 years was three times higher than the rate for those aged 55 and above.
Between quarter 4 2012 and quarter 4 2013, the unemployment rate decreased for all age groups: the most pronounced decline was observed for the under 25 age cohort, with a four percentage point decrease.
Figure 4.7 Unemployment Rate by Age, Quarter 4 2013
Source: SLMRU (SOLAS) analysis of CSO data
4.5 Unemployment by Education Unemployment by educational attainment is presented in Figure 4.8. In quarter 4 2013,
one in two unemployed persons held a higher secondary or FET qualification. The other half was divided almost equally between those with at most lower secondary education and those holding third level qualifications.
Between quarter 4 2012 and quarter 4 2013 the share of unemployed persons with lower secondary or less education decreased by five percentage points, while the share with third level and higher secondary/FET education increased by two percentage points each.
Figure 4.8 Unemployment by Education, Quarter 4 2013
Source: SLMRU (SOLAS) analysis of CSO data
Figure 4.9 presents the unemployment rates for each educational level. In quarter 4 2013, the unemployment rate was the highest for persons with lower secondary education or less (18%). At 7%, the unemployment rate for third level graduates was the lowest.
Between quarter 4 2012 and quarter 4 2013, the unemployment rate decreased for all education levels, with the greatest decrease observed for persons with lower secondary education or less (five percentage points).
48.8 19%
176.0 70%
28.5 11%
<25 25-54 55+
24.2%
10.8% 8.4%
0%
5%
10%
15%
20%
25%
30%
<25 25-54 55+
63.4 26%
120.4 49%
62.4 25%
Lower secondary or lessHigher secondary or FETThird level or above

National Skills Bulletin 2014 44 July 2014
Figure 4.9 Unemployment Rate by Education, Quarter 4 2012 & Quarter 4 2013
Source: SLMRU (SOLAS) analysis of CSO data
The unemployment rates for the three education and age categories are presented in Figure 4.10. In quarter 4 2013, across all education levels, the under-25s had the highest unemployment rates. The under-25s with lower secondary education or less were more than twice as likely to be unemployed compared to third level graduates in the same age cohort. In all age categories third level graduates had the lowest unemployment rates.
Between quarter 4 2012 and quarter 4 2013, the unemployment rate decreased for all age and education categories (except for those aged 55 or older with higher secondary or FET education). The greatest decrease was observed for those younger than 25 with lower secondary education or less, with a ten percentage point decline.
Figure 4.10 Unemployment Rate by Education and Age, Quarter 4 2013
Source: SLMRU (SOLAS) analysis of CSO data
4.6 Unemployment by Nationality Figure 4.11 presents the distribution of unemployed persons by nationality. In quarter 4 2013, four out of five persons looking for work were Irish nationals. Between quarter 4 2012 and quarter 4 2013, the share of non-Irish nationals in unemployment increased by one percentage point.
Figure 4.11 Unemployed by Nationality (%), Quarter 4 2013
Source: SLMRU (SOLAS) analysis of CSO data
Figure 4.12 presents the unemployment rate for Irish and non-Irish nationals. In quarter 4
23%
16%
7%
18%
15%
7%
0%
5%
10%
15%
20%
25%
Lowersecondary or
less
Highersecondary or
FET
Third level orabove
Q4 2012 Q4 2013
37%
26%
15%
21%
14%
6%
10%
9%
5%
Lowersecondary
or less
Highersecondary
or FET
Thirdlevel orabove
55+ 25-54 <25
204.7, 81%
48.5, 19%
Irish Non-Irish

National Skills Bulletin 2014 45 July 2014
2013, the unemployment rate for Irish nationals (11.2%) was 3.4 percentage points lower than that of non-Irish nationals. Between quarter 4 2012 and quarter 4 2013, there was a decrease of two percentage points in the unemployment rate of both Irish and non-Irish nationals.
Figure 4.12 Unemployment Rate by Nationality, Quarter 4 2012 & Quarter 4 2013
Source: SLMRU (SOLAS) analysis of CSO data
4.7 Unemployment by Sector Table 4.1 presents unemployment levels and unemployment rates by sector. In quarter 4 2013, the largest number of unemployed persons was those previously employed in construction, followed by the wholesale/retail and industry sectors.
In quarter 4 2013, the highest unemployment rate was observed in construction (30%), considerably above the second highest rate
recorded in administration services (12%). Outside of agriculture and the public sector (PAD, education and health), unemployment rates of below 7% were recorded in ICT, finance, professional services and transport.
Between quarter 4 2012 and quarter 4 2013, the unemployment rates decreased in almost all sectors. The most pronounced declines were observed for construction (nine percentage points), professional services, accommodation and food services and wholesale and retail (three percentage points each respectively). In contrast, the most pronounced increase was observed for financial services (two percentage points).
Table 4.1 Unemployment by Sector, Quarter 4 2013
Sector Unemployed Unemployment
rate
Agriculture 4.2 3.5%
Industry 24.9 9.3%
Construction 43.6 29.6%
Wholesale/retail 28.2 9.5%
Transportation 6.0 6.3%
Accomm./food 16.4 10.8%
ICT 5.2 6.0%
Finance 6.4 6.2%
Prof. services 6.9 5.7%
Admin. service 8.8 12.0%
PAD 2.5 2.5%
Education 7.5 4.9%
Health 12.7 4.8%
Other 10.7 9.8%
Total 253.2 13.3%
Source: SLMRU (SOLAS) analysis of CSO data
13.2%
16.6%
11.2%
14.6%
0%
5%
10%
15%
20%
Irish Non-Irish
Q4 2012 Q4 2013

National Skills Bulletin 2014 46 July 2014
Section 5 Labour Market Transitions
5.1 Overall Transitions This section deals with labour market flows - transitions. Transitions are calculated by examining how the labour market status of individuals who participated in the QNHS panel changed between two subsequent quarters.30 Here, labour market status is ILO defined and expressed in three categories: employed, unemployed and economically inactive.
Transitions analysis suggests that most individuals do not change their labour market status between successive quarters: in 2013, on average, 97% of individuals who were in employment, remained employed in the subsequent quarter; 94% of those economically inactive, continued to be outside the labour force and 70% of those unemployed continued to actively look for work. However, between quarters, there were significant flows between employment, unemployment and inactivity: 3% of individuals transitioned out of employment – 2% to inactivity and 1% to unemployment; 30% of individuals transitioned out of unemployment – 18% to inactivity and 12% to employment.
While the distribution of movements remained broadly in line with 2012; in 2013, there was an increase in the share of flows from unemployment to employment, from 10% to 12%. In fact, the share of unemployed persons transitioning into employment
30 On average, just under 70% of respondents reappeared from one quarter to another; each repeat respondent’s weight was inflated to approximate for the total population; as a result of this (and the assumption of zero population growth and net migration), employment, unemployment and inactivity levels derived from transitions analysis do not equate to the actual levels reported by the CSO QNHS.
increased continuously during the year, reaching 15% between quarter 3 and quarter 4 2013.
Table 5.1 Average Quarterly Transitions by ILO Status, 2013 (Persons aged 15+)
ILO end Q
ILO start Q E UE Inactive
E 97% 1% 2%
UE 12% 70% 18%
Inactive 3% 3% 94%
Source: SLMRU (SOLAS) analysis of CSO data
Figure 5.1 shows estimated annual transitions31, based on quarterly flows32, for 2013. It is estimated that over one million transitions occurred, indicating a significant level of activity in the Irish labour market during 2013. There were over 230,000 transitions between employment and unemployment, almost 290,000 between employment and inactivity and 400,000 between unemployment and inactivity. In addition, almost 200,000 transitions occurred within employment, either due to a change of employer (intra-occupational transitions) or change of occupation (inter-occupational transitions).
31 One person can change labour market status several times in a year; for this reason, transitions, rather than persons, are counted. 32 Sum of transitions between quarter 4 2012 to quarter 1 2013, quarter 1 2013 to quarter 2 2013, quarter 2 2013 to quarter 3 2013, quarter 3 2013 to quarter 4 2013.

National Skills Bulletin 2014 47 July 2014
Figure 5.1 Labour Market Transitions, 2013 (Sum of Four Quarters)
Source: SLMRU (SOLAS) analysis of CSO data
Compared to 2012, there were fewer transitions out of employment into unemployment and inactivity (by over 20,000 and over 15,000 respectively), with more transitions into employment from unemployment and inactivity (by approximately 5,000 each). The level of movement within an occupation, but between employers, (intra-occupational) remained unchanged compared to 2012; however there was a decline in the number of transitions between occupations (inter-occupational) by almost 40,000.
5.2 Transitions between Employment and Unemployment Figure 5.2 illustrates the composition of transitions between employment and unemployment across a variety of variables.
▪ A significant majority of transitionsbetween employment and unemploymentwere within the employee category, withsimilar distributions regarding exits andentries into employment from various
employment status categories; the flows in the labour market had somewhat greater concentration in the employee category than in the national employment stock; this is similar to flows observed in 2012; of those transitioning from unemployment into employment as an employee, 12% were associated with employment schemes, which is four percentage points above the 2012 share.
▪ In terms of permanency of tenure, exitsto unemployment were skewed towardspermanent jobs (49%), while entries intoemployment were towards temporary jobs(40%), which is in line with the patternobserved in 2012.
▪ The age distributions of exits from andentries to employment differed in thatthe share of persons under 25 was greaterin entries to employment, compared totheir share in exits to unemployment (23%compared to 17%).
▪ The education distributions of exits andentries varied markedly: the share ofpersons holding less than highersecondary education in transitions fromemployment to unemployment was higherthan their share in transitions fromunemployment to employment (16%compared to 4%); the opposite was thecase for holders of higher secondary andthird level qualifications.
Employment
Unemployment
134,500
97,700
Inactivity
Inter-occupational
51,500
Intra-occupational 139,000
133,500
155,000
207,
600
193,
800

National Skills Bulletin 2014 48 July 2014
Figure 5.2 Transitions between Employment and Unemployment, 2013
Source: SLMRU (SOLAS) analysis of CSO data
▪ The distribution of part-time and full-time jobs in exits from and entries to employment was very similar, with full-time employment accounting for just over a half of flows in each direction.
▪ Just over a third of transitions from unemployment to employment were from long-term unemployment, which is somewhat less than in 2012.
5.3 Transitions between Employment and Inactivity Figure 5.3 illustrates the composition of transitions between employment and inactivity across different categories.
▪ Almost a third (30%) of transitions from employment into inactivity was to study, 16% to retirement33, 12% to home duties, 8% was accounted for by exits due to disability and the remainder for other reasons; this is broadly in line with the flow pattern observed in 2012, although there was a decline in the share exiting to study between 2012 and 2013; in terms of entries to employment from inactivity, almost a half (47%) of flows were from study, 16% from home duties, with the remainder from other forms of inactivity.
▪ Over 80% of flows between employment and inactivity was associated with employees.
▪ In terms of permanency of tenure, exits to inactivity were skewed towards permanent jobs (46%), while entries into employment were skewed towards temporary jobs (42%), which is similar to the distribution observed in 2012.
33 Total transitions to retirements were estimated at 40,000; however, not all retired persons became inactive (some continued to be employed, others were still actively looking for work (unemployed)).
0% 20% 40% 60% 80% 100%
E to UE
UE to E
Self employed Employee Assisting relative
0% 20% 40% 60% 80% 100%
E to UE
UE to E
Not stated Permanent Temporary Not employee
0% 20% 40% 60% 80% 100%
E to UE
UE to E
<25 25-55 55+
0% 20% 40% 60% 80% 100%
E to UE
UE to E
Not stated Below higher secondaryHigher secondary FETHE
0% 20% 40% 60% 80% 100%
E to UE
UE to E
Full time Part time
0% 20% 40% 60% 80% 100%
UE to E
Not stated Short term UE Long term UE

National Skills Bulletin 2014 49 July 2014
Figure 5.3 Transitions between Employment and Inactivity, 2013
Source: SLMRU (SOLAS) analysis of CSO data
▪ The education distributions of exits and entries to employment were similar: 28% of flows in each direction was accounted for by persons with less than higher secondary education, approximately one third by persons with higher secondary education, approximately 10% by holders of FET qualifications and just over a quarter by third level graduates.
▪ The age distributions of exits from and entries to employment differed in that the share of persons under 25 was greater in entries to employment, compared to their share in exits from employment (45% compared to 31%).
▪ Over 60% of flows between employment and inactivity were associated with part-time employment, with the distribution of flows from inactivity to employment particularly skewed towards part-time employment.
5.4 Transitions between Unemployment and Inactivity Figure 5.4 compares the characteristics of flows between unemployment and inactivity.
▪ Over 60% of flows between unemployment and inactivity were associated with persons who did not want a job for various reasons; a further 20% was associated with persons who did want a job but were passive in job search or discouraged; the remainder were transitioning for other reasons.
▪ Transitions from unemployment to inactivity were distributed as follows: 40% of persons moving from unemployed to inactivity continued to be unemployed, but were not actively looking for work for various reasons (e.g. a passive job seeker, discouraged, had a job lined up in the coming period,
0% 20% 40% 60% 80% 100%
E to I
I to E
Student Home Duties Retired Disability Other
0% 20% 40% 60% 80% 100%
E to I
I to E
Self employed Employee Assisting relative
0% 20% 40% 60% 80% 100%
E to I
I to E
Not stated Permanent Temporary Not employee
0% 20% 40% 60% 80% 100%
E to I
I to E
Not stated Below higher secondaryHigher secondary FETHE
0% 20% 40% 60% 80% 100%
E to I
I to E
<25 25-55 55+
0% 20% 40% 60% 80% 100%
E to I
I to E
Full time Part time

National Skills Bulletin 2014 50 July 2014
wanted a job but were not available etc.); one quarter transitioned into study, 23% moved to home duties and the remainder transitioned into inactivity for other reasons; in contrast, 37% of persons moving from inactivity to unemployment were students, 36% transitioned from inactive job seeking to active job search, 17% from home duties and the remainder from other forms of inactivity.
Figure 5.4 Transitions between Unemployment and Inactivity, 2013
Source: SLMRU (SOLAS) analysis of CSO data
5.5 Transitions by Occupation Table 5.2 presents quarterly labour market transitions by broad occupational group for 2013, while Table 5.3 gives the list of individual occupations within each occupational group with the highest number of transitions.
The occupational distribution of flows between employment and unemployment were broadly similar, although professionals, operatives, managers and tradespersons were
somewhat more represented in the transitions from unemployment to employment. In absolute terms, the greatest flows between employment and unemployment were observed for skilled trades and elementary occupations. The inflows into employment exceeded outflows to unemployment for all occupational groups except for administrative, personal services and elementary occupations (Table 5.2).
Table 5.2 Labour Market Transitions by Occupational Group, 2013 (All Quarters)
E to UE UE to E* E to I I to E* Inter out Inter in Intra
Managers
4,100
5,800
6,400
3,100
3,400
4,400
6,600
Professionals
8,000
10,900
14,300
8,400
6,300
5,900
23,900
Assoc. prof.
10,800
12,300
9,400
5,500
5,900
7,200
15,500
Admin.
10,900
9,600
13,300
7,900
6,100
6,000
12,500
Trades
18,800
22,100
16,000
7,500
5,300
5,500
16,700
Services
8,700
7,100
16,700
5,000
3,000
3,400
11,600
Sales
11,900
12,600
18,600
7,300
7,400
7,000
18,900
Operatives
8,200
11,700
9,900
4,400
4,700
5,000
11,200
Elementary
16,100
16,000
28,400
12,200
8,600
6,900
22,000
Total
97,700
108,300
133,500
61,400
51,500
51,500
139,000
*Excludes persons with no previous occupation (e.g. new entrants into the labour market).
Source: SLMRU (SOLAS) analysis of CSO data
A number of individual occupations featured as the most frequent movers in both directions (Table 5.3). These occurred in most broad occupational groups, although the most common ones were amongst elementary (e.g. construction labourers, cleaners, waiters), trades (e.g. carpenters, chefs) and services (e.g. care workers, child-minders) occupations; a high number of transitions was also observed for sales (e.g. sales assistants) and administrative (e.g. personal assistants,
0% 20% 40% 60% 80% 100%
UE to I
I to UE
Not available Passive job-seekers
Discouraged workers Does not want job
0% 20% 40% 60% 80% 100%
UE to I
I to UE
Unemployed Student Home duties Other

National Skills Bulletin 2014 51 July 2014
general clerks) occupations, as well as some professional (teachers) and associate professional occupations (business sales executives).
The occupational distribution of flows between employment and inactivity were broadly in line, with the greatest share of transitions (20%) occurring in elementary occupations. However, ‘white collar’ occupations (e.g. professionals, associate professionals and clerks) were somewhat more represented in the transitions from inactivity to employment than in the exits to inactivity. In absolute terms, the greatest number of transitions in each direction was associated with elementary occupations.34
Individual occupations most frequently transitioning in and out of inactivity included elementary (e.g. waiters, elementary construction workers, cleaners, etc.), services (e.g. care workers and child-minders), administrative occupations (general clerks) and professionals (teachers). Occupations most frequently transitioning from unemployment into study included general clerks, sales assistants and some elementary occupations (e.g. waiters, bar staff, catering assistants, construction labourers).
Occupations most frequently exiting employment in order to engage in home duties included care workers, sales assistants and female farm workers. Occupations with the highest number of transitions into inactivity due to retirement included teachers, farmers and care workers.
34 Transitions from inactivity to employment exclude new entrants into the labour market (e.g. students) because they cannot be assigned an occupation based on previous employment.
In 2013, inter-occupational transitions35 occurred in all occupational groups (Table 5.2). Managers and associate professionals were the greatest net gainers in terms of inter-occupational flows (i.e. transitions in were greater than transitions out of these occupations), while elementary occupations were the greatest net losers. For all other occupational groups, inter-occupational movements were broadly neutral. In absolute terms, most of the inter-occupational movements in both directions were observed in elementary and sales occupations. At individual occupational level, the most inter-occupational movements were observed for general clerks, sales and catering assistants.
In 2013, a high number of intra-occupational movements36 were observed in all occupational groups (Table 5.2). The highest number of transitions was observed for professional and elementary occupations, accounting for 17% and 16% of intra-occupational transitions respectively. Amongst professionals, teachers, nurses, doctors, programmers, civil engineers and accountants had the highest number of transitions between employers (Table 5.3). Frequent changes of employers were also observed amongst sales workers at both associate professional and lower levels. Amongst elementary occupations, inter-occupational movements were high for catering and bar staff, cleaners, storage and construction labourers; amongst tradespersons for chefs and fitters; amongst services occupations for care and childcare workers, as well as hairdressers; amongst operatives for assemblers, food operatives, taxi drivers and routine testers.
35 Persons who remained in employment between the two quarters, but changed occupation. 36 Persons who remained employed in the same occupation between the two quarters, but who changed employer during the months of the starting quarter.

National Skills Bulletin 2014 52 July 2014
Table 5.3 Occupations with Most Frequent Transitions, 2013 (All quarters)
Managers Professionals Associate prof. Clerks Tradespersons Services Sales Operatives Elementary
From emp. to unemp.
Teachers Sales exec. General Carpenters Care Sales assistants Construction Construction
IT technician PA Chefs Child-minders Assemblers Cleaners
Plumbers Hairdressers Catering
Construction trades Bar staff
Fitters Waiters
From unemp. to emp.
Production Teachers Sales exec. General Carpenters Care Sales assistants Machine drivers Construction
Accountants PA Construction Child-minders Taxi drivers Waiters
Electricians Truck drivers Storage
Painters Assemblers Cleaners
Chefs Bar staff
Plasterers
Bricklayers
From emp. to inactivity
Functional Nurses Sales exec. General Farmers Care Sales assistants Assemblers Construction
Teachers Sport coaches Bank Painters Child-minders Taxi drivers Waiters
Accountants Fitters Hairdressers Construction Cleaners
Bus drivers Catering
Bar staff
Farm workers
Storage
Security guards
From inactivity to emp.
Teachers General Care Sales assistants Taxi drivers Waiters
PA Child-minders Construction
Catering
Bar staff
Cleaners
Storage
General Sales assistants Waiters
Bar staff From employment to study Catering
Construction From employment to home duties Care Sales assistants Farm workers From emp. to inactive retirement Teachers Farmers Care
From emp. to disablity Care Sales assistants Inter-occupational out
General Care Sales assistants Food Catering
Bar staff
Farm workers Inter-occupational in
Production Sales exec. General Sales assistants Construction
Catering
Intra-occupational
Doctors Sales exec. General Chefs Care Sales assistants Assemblers Construction
Teachers Sales accounts Payroll Fitters Child-minders Customer serv. Food Waiters
Accountants Bank Construction Hairdressers Taxi drivers Bar staff
Programmers Testers Catering
Civil engineers Cleaners
Nurses Elementary storage

National Skills Bulletin 2014 53 July 2014
5.6 Replacement and Turnover Table 5.4 presents employment levels, replacement and turnover rates for broad occupational groups.
The replacement demand was estimated by exits from employment, either due to retirement, other forms of inactivity or as net losses to other occupational groups (through inter-occupational transitions).37
Table 5.4 Employment, Replacement and Turnover Rates by Occupational Group, 2013 (All quarters)
Replacement Turnover
Employment Retirement
Exits to inactivity (including
retirements) and net
exits due to inter-
occupational movement
Intra-occupation
al
Intra occupational and neutral inter-
occupational
movements
Managers
150,200 1.1% 3.6% 4.4% 6.0%
Professionals
354,700 1.3% 4.1% 6.7% 7.5%
Assoc. prof.
216,600 0.6% 3.7% 7.2% 8.7%
Admin.
208,500 1.1% 6.4% 6.0% 7.9%
Trades
285,400 1.6% 5.5% 5.9% 6.7%
Personal
serv.
144,600 1.7% 11.3% 8.0% 9.8%
Sales
166,100 0.4% 11.4% 11.4% 14.4%
Operatives
144,900 1.2% 6.6% 7.7% 9.7%
Elementary
210,100 1.0% 14.3% 10.5% 12.9%
Total
1,881,200 1.1% 7.1% 7.4% 9.0%
Source: SLMRU (SOLAS) analysis of CSO data
Exits from employment due to economically inactive retirements were low for a significant majority of occupations, suggesting that retirements alone make a small contribution
37 It is recognised that this approach has its limitations: it overestimates demand where there is no intention to replace those who leave; it underestimates demand as it ignores emigration and deaths and assumes that exits to unemployment arise due to job closures only, rather than dismissals or voluntary exits.
to the total demand for labour. In 2013, retirements accounted for just over 20,000 transitions or just over 1% of the total employment. Higher than average retirement rates were observed for services, skilled trades and professional occupations. Lower than average retirement rates were observed for sales and associate professional occupations (some of which included sales associate professional occupations). In terms of individual occupations, the highest retirement rates were observed for teachers, care workers and farmers (Table 5.5).
As an alternative measure of replacement (Table 5.4, column 4), exits to inactivity (due to retirements, home duties, study, disability and other reasons) were adjusted for net losses from inter-occupational movements. While for some occupations, the inclusion of net losses from inter-occupational transitions increased replacement demand (transitions out of an occupation were greater than transitions in), for others it decreased replacement demand (transitions in were greater than transitions out). In 2013, exits to inactivity accounted for just over 7%. Above average replacement rates were observed for elementary, sales and services occupations; below average rates were observed for managers, professionals, associate professionals and tradespersons. At individual occupational level, the highest replacement demand was observed for carers (care workers, child-minders, youth workers), bar and restaurant staff (waiters, catering assistants), clerks (general, bank, receptionists), sales assistants, labourers (farm, construction, security, cleaning, storage), operatives (food, assembling) and painters.
In 2013, the turnover rate, based on the intra-occupational movements, was 7.4%. A higher

National Skills Bulletin 2014 54 July 2014
than average rate of intra-occupational movements was observed for sales and elementary occupations; turnover rates were the lowest for managers, tradespersons and administrators. At individual occupational level, transitions arising due to a change of employer were most frequent for care (child-minders, care workers), sales (sales assistants, business sales executives, sales accounts managers, customer service workers), bar and restaurant (chefs, waiters, bar staff, catering assistants), elementary (routine testers, construction, storage, cleaners) etc. At professional level, higher than average rates were observed for doctors, civil engineers, programmers and teachers.
When the turnover estimates were adjusted to account for neutral inter-occupational transitions (transitions between occupations where exits from an occupation were compensated in full by entries to that occupation), the average turnover rate increased to 9%. Deviation from the average remained similar to those observed for intra-occupational movements alone, with higher than average turnover observed for sales and elementary occupations. At individual occupational level, the highest turnover was estimated for carers, hospitality workers, doctors, IT staff (IT engineers and technicians), sales workers, etc.
Table 5.5 Occupations with Above Average Replacement and Turnover Rates, 2013
Replacement Turnover
Retirement Inactivity plus
net inter occupational
Intra-occupational
Intra-occupational plus neutral
inter-occupational
Sec. school teachers Farm workers Child-minders Child-minders
Care workers Painters Waiters Waiters
Farmers Waiters Doctors Doctors
Bar staff Bar staff Bar staff
Youth workers Routine testers Packers
Nursery nurses Customer service Routine testers
Catering assistants
Elementary construction Farm workers
Care workers Civil engineers Customer service
Gardeners Food operatives Elementary construction
Child-minders Sales assistants IT engineers
Bank clerks Assemblers Civil engineers
Sales assistants Catering assistants Food operatives
Elementary construction Sales executives Sales assistants
Security guards General admin Assemblers
Cleaners Chefs Catering assistants
Food operatives Hairdressers Sales executives
Receptionists Construction trades General admin
Taxi drivers Sales acc. managers
Fin. accounts managers
Elementary storage Programmers IT technicians
Assemblers Care workers Chefs
Fitters Sec. school teachers Hairdressers
General admin Elementary storage Receptionists
Fitters Construction trades
Cleaners Sales accounts managers
Bank clerks Production managers
Payroll clerks Carpenters
Source: SLMRU (SOLAS) analysis of CSO data

National Skills Bulletin 2014 55 July 2014
Section 6 Employment Permits
6.1 Introduction An employment permit is a requirement for all non-EEA nationals who wish to take up employment in Ireland. An analysis of the occupations for which employment permits are issued allows policymakers to ascertain the areas where employers are having difficulty in sourcing suitably qualified candidates from the Irish and EU labour market.
In order to attain an employment permit an individual must have a valid job offer from a prospective Irish employer who has made every effort to recruit an Irish or EEA national for the post. There are a number of permit types which a person can avail of.38
Work permits are issued for occupations which have been identified as being difficult to source in the Irish labour market and for which the annual salary on offer is above €30,000.
Green cards are issued for all occupations, except those on the ineligible occupations list and those contrary to public interest, with an annual salary of €60,000 or more; they are also issued to a restricted list of occupations (where high level strategic skills shortages exist) with an annual gross salary of €30,000 or more.
Training/Intra company transfer permits are issued to facilitate the transfer of senior management, key personnel or trainees who are non-EEA nationals from an overseas branch of a multinational corporation to its Irish branch.
38 The regulation regarding access to the Irish labour market by non-EEA nationals will change in line with the forthcoming Employment Permits (Amendment) Bill 2014.
Spousal/dependant permits allow for the spouses and dependants of green cards holders, certain work permit holders and third country researchers to apply for an employment permit to work in Ireland.
6.2 Overall Trends There were approximately 3,000 new employment permits issued in 2013, an increase of 3% on 2012, but a decline of 16% on 2009 (Figure 6.1). The number of new work permits issued halved since 200939, while the number of green cards doubled in the same period. There was also an increase in the number of intra-company transfers, while the number of spousal/dependant permits declined by 76%40. The number of permits issued for the purposes of training was small in the period examined.
Figure 6.1 New Permits by Type, 2009-2013
Source: DJEI
39 The decline in the number of work permits issued is due in part to the lifting of restrictions on labour market access for Romanian and Bulgarian nationals in 2012. 40 The eligibility criteria for spousal/dependant permits have changed with only spouses and/or dependants of employment permit holders who applied for their first employment permit on or before 1 June 2009 being eligible to apply.
0 1,000 2,000 3,000 4,000
2009
2010
2011
2012
2013
Work Permit Green CardIntra-Company Tranfer Spousal/ DependantTraining

National Skills Bulletin 2014 56 July 2014
6.3 Employment Permits by Sector A breakdown of employment permits by sector41 is detailed in Figure 6.2. In 2013, the IT sector accounted for 52% of all new employment permits issued, with services and healthcare accounting for a further 10% and 11% respectively.
Figure 6.2 New Employment Permits by Sector, 2013
Source: DJEI
Between 2012 and 2013, the share of new employment permits issued to the IT sector increased by ten percentage points; the share issued to financial services and manufacturing increased by one and two percentage points respectively.
In absolute terms, the greatest decline in the number of permits issued between 2012 and 2013 was to the services and catering sectors. The number of permits issued to the healthcare sector has been in decline in recent years; this is primarily related to a change in the channels available for doctors to avail of employment in Ireland.
6.4 Permits by Occupation Figure 6.3 details all new employment permits issued by occupation. Over the period
41 Sectors are defined by the DJEI.
2009 to 2013, the number of new permits issued declined for all occupational groups, except professionals. This, along with the doubling of the number of permits issued to professionals, resulted in the share of permits issued to non-professional occupations declining from 70% to 32%.
Figure 6.3 New Employment Permits by Broad Occupation, 2009-2013
Source: DJEI
Managers In 2013, approximately 180 new permits
were issued for managerial occupations accounting for 6% of all employment permits issued (the share has been constant in recent years)
Almost a half of permits issued to managers were for intra-company transfers in sectors including manufacturing, financial services and IT; a further 41% were for green cards, primarily in services, financial services and IT
Occupations most often cited included:
chief executives/vice presidents
financial managers/directors
general managers in manufacturing.
52%
11%
10%
9%
7% 3%
8%
IT
Healthcare
Services
Financial
Manufacturing
Catering
Other
0% 20% 40% 60% 80% 100%
2009
2010
2011
2012
2013
Managers ProfessionalsAssociate professionals AdminSkilled trades Personal servicesSales OperativesElementary

National Skills Bulletin 2014 57 July 2014
Professionals In 2013, professional occupations
accounted for 68% of all new permits issued; the number of new permits has increased significantly in recent years, with a year on year increase of 18% since 2012
Of the 2,000 new permits issued for professionals, the IT sector accounted for 64%, healthcare42 for 12% and services and financial services for 7% each
Of all new permits issued for professional occupations in 2013, 60% were for green cards; professional occupations accounted for over four fifths of all green cards issued
Almost half of new permits issued to professionals in 2013 were issued to Indian nationals
Occupations most often cited included:
programmers and software developers (e.g. analysts, application developers, software/systems engineers)
IT computer systems analysts/ architects, network engineers
medical doctors (interns) and nurses
auditors.
Associate Professionals & Technical In 2013, 465 new employment permits
were issued for associate professional/technical occupations, accounting for 15% of all employment permits issued (an increase of 13% on the previous year)
Over 40% of employment permits for associate professional positions were
42 Over the period 2010 to 2013, doctors entered the Irish labour market through channels other than the employment permit scheme - thus the decline in the number of permits issued for the healthcare sector. A revision to the regulation introduced in 2014 confines the entry route for non-EEA doctors to the employment permit scheme.
issued for the IT sector; services, financial services and the manufacturing sector accounted for a further 43% combined
Of all new permits issued for associate professionals in 2013, 31% were for green cards, while 44% were work permits
Those issued with employment permits for associate professional positions were most likely to come from the USA and India (combined accounting for 39% of all permits issued in this category)
Occupations most often cited included:
IT technicians
business/finance associate professionals (e.g. account strategists, financial analysts)
sales and marketing (e.g. business development, online sales/media)
Administrative and Secretarial Administrative occupations did not
feature strongly in the employment permit statistics in 2013, with just 44 new permits issued (representing 1% of the total permits issued)
Job titles included:
fund accountants
account strategists with language skills.
Skilled Trades In 2013, approximately 135 new
employment permits were issued for skilled trades occupations; this is a decline of 19% on 2012 (primarily related to a falloff in the number of permits issued in the catering sector)
The catering sector accounted for almost two thirds of the permits issued for this occupational group

National Skills Bulletin 2014 58 July 2014
Chefs accounted for 67% of permits issued for this occupational group in 2013; while the share of new work permits issued for chefs has been increasing in recent years, the overall number of permits issued for this occupation continued to decline
Occupations included:
chefs
engineering trades.
Caring, Leisure and Other Services In 2013, 67 new employment permits
were issued for caring, leisure and other services occupations; this is a decline of 48% on 2012 and 91% on 2009
This decline is primarily due to a drop in the number of permits issued to the healthcare sector; this sector accounted for most (82%) of all new caring, leisure and other services permits issued
Permits issued to spousal/dependants accounted for 72% of all caring, leisure and other services permits issued
Permits were most often issued to persons from India and the Philippines
Care workers were the most frequently advertised occupation.
Sales and Customer Services In 2013, 38 new employment permits
were issued for sales and customer service occupations; this is a decline of approximately 25% on 2012
The numbers have been in decline in recent years, primarily due to changes in the eligibility process for the
spousal/dependant permit and the lifting of restrictions for Romanians and Bulgarians
Occupations cited included customer services representatives and sales assistants.
Operatives With 19 new permits, operatives
accounted for 1% of the employment permits issued in 2013, with the number of permits 86% below the 2009 level.
Elementary Occupations Elementary occupations accounted for a
1% share in the employment permits issued in 2013; the number of new permits issued for this occupational group declined by 71% since 2012 and by 84% since 2009
▪ Employment permits for this occupational group were primarily in catering and agriculture and occupations included catering assistants, work riders and cleaners.

National Skills Bulletin 2014 59 July 2014
Section 7 Vacancies
This chapter provides an analysis of vacancies which have appeared in 2013 through Jobs Ireland (Department of Social Protection (DSP) vacancy portal) and IrishJobs.ie (a private recruitment agency). There is also an analysis of the Recruitment Agency Survey conducted by the SLMRU in April 2014 which aims to identify difficult-to-fill vacancies.
A detailed analysis of vacancy activity in Ireland can be found in the Vacancy Overview Report 201343. This chapter reports on the main findings of the report.
7.1 Notified Vacancies It should be borne in mind that several issues arise with vacancy data, including the following:
vacancies may be advertised through channels not captured in the analysis leading to an underestimation of the true demand
vacancies may be advertised simultaneously through several channels leading to double-counting and therefore an overestimation of the true demand
the extent to which each vacancy arises due to expansion demand (the creation of a new position by an employer), replacement demand (a person leaving an existing position) or for other reasons is unclear.
Figure 7.1 shows the vacancy index for the vacancies advertised through DSP Jobs Ireland and IrishJobs.ie. For the most part of the observed period, the DSP Jobs Ireland vacancy index has been at or above the base level
43 Vacancy Overview 2013, SOLAS/EGFSN 2014.
(January 2009). The IrishJobs.ie vacancy index has been increasing over the observed period, with a peak of 342.2 recorded in May 2012. Despite a decline observed since then, it remained more than 100 points above the DSP Jobs Ireland index during 2013.
It should be borne in mind that the number of DSP Jobs Ireland vacancies are more than twice that of IrishJobs.ie in absolute terms (on average 5,300 DSP Jobs Ireland vacancies per month compared to 2,300 for IrishJobs.ie in 2013) and the level of DSP Jobs Ireland vacancies did not fall to as low a base during the recession as did vacancies for IrishJobs.ie.
Figure 7.1 New Notified Job Vacancies Index, (January 2009 = 100), 2009-2013
Source: IrishJobs.ie and DSP Jobs Ireland (3 Month moving average)
7.1.1 Vacancies by Occupation In 2013, vacancies advertised through IrishJobs.ie were mostly concentrated in professional and associate professional occupations (Figure 7.2). Newly advertised vacancies through DSP Jobs Ireland were
-
50.0
100.0
150.0
200.0
250.0
300.0
350.0
Jan-09
May-09
Sep-09
Jan-10
May-10
Sep-10
Jan-11
May-11
Sep-11
Jan-12
May-12
Sep-12
Jan-13
May-13
Sep-13
DSP Jobs Ireland IrishJobs.ie

National Skills Bulletin 2014 60 July 2014
concentrated in elementary, caring and associate professional occupations.
Figure 7.2 Vacancies by Occupational Group (%), 2013
Source: IrishJobs.ie and DSP Jobs Ireland
Managers In 2013, vacancies for managers were
most common in retail, financial services and the IT sector; combined these sectors accounted for almost a third of all notified managerial vacancies to IrishJobs.ie in 2013
In 2013, vacancies were most frequent for operations managers across all sectors; services managers in banking, retail and hotel and catering, and managers in HR, finance, logistics and sales and marketing
A high level of experience was a key requirement for many posts advertised.
Professionals IrishJobs.ie accounted for a larger share
of professional vacancies in 2013; these were primarily in the IT sector, with over a 33% share, followed by science and engineering, health, and business and financial services
Professional job titles most often cited were:
ICT (e.g. software developers, IT business analysts, network experts and web designers)
engineers and scientists (e.g. process engineers in chemical, food, manufacturing and quality control, product development and design engineers, civil/structural engineers, technologists, chemical and biological scientists)
business and finance professionals (e.g. chartered accountants, management consultants, business analysts and regulatory professionals)
health professionals (e.g. nurses, doctors, pharmacists, therapists and radiographers)
▪ Foreign language skills, particularly German and French, were a feature of many professional vacancies in ICT, engineering and finance
▪ Professional occupations had the highest share of vacancies which stated a minimum of a third level degree qualification; the majority of vacancies also stated a requirement of at least two years’ experience.
Associate Professionals Associate professional occupations
accounted for the largest share of notified vacancies in 2013, with 15% of all
0%
5%
10%
15%
20%
25%
30%
35%
Man
ager
s
Prof
essi
onal
s
Asso
c. p
rof.
& t
ech.
Cler
ical
Skill
ed t
rade
s
Cari
ng,
leis
ure
etc.
Sale
s, c
usto
mer
ser
vice
Ope
rati
ves
Elem
enta
ry
IrishJobs.ie DSP Jobs Ireland

National Skills Bulletin 2014 61 July 2014
DSP Jobs Ireland vacancies and 31% of IrishJobs.ie vacancies
▪ Vacancies were primarily in IT, financial services, sales and accounting
Associate professional vacancies were most frequent for:
business associate professionals (with language skills a requirement for the majority of vacancies) e.g. sales representatives, multilingual customer account managers, marketing managers, financial analysts, HR specialists
science, engineering and technology technicians in IT (e.g. technical support, systems/network administration), laboratory technicians (e.g. chemistry, environmental, quality control, pharmaceutical), engineering technicians (e.g. mechanical, building services, manufacturing)
vocational trainers (healthcare, social science, career guidance, health and safety, IT)
interpreters
Language skill requirements were cited in many vacancies for associate professionals (particularly German, French and Nordic languages); business-to-business sales skills were in demand for some sales related roles
Where the level of education required was stated, almost a half of associate professional vacancies specified a requirement for a third level degree qualification; over two thirds required 2-6 years’ experience.
Administrative/Secretarial In 2013, vacancies for
administrative/secretarial positions were
primarily in banking and finance, accountancy, and secretarial/admin
Occupations most frequently occurring included:
financial admin (e.g. cost/fund accountants, accounts payable/ receivable clerks, payroll clerks, multilingual credit controllers)
HR, pension and insurance administrators
multilingual sales/customer support admin roles, marketing assistants
logistics admin (e.g. freight clerks, purchasing admin, stock controllers, logistics co-ordinators)
receptionists, personal assistants
▪ Language skills including German, French, Spanish and Dutch were frequently cited as a requirement for accounts payable/ receivable, customer service/sales administration, credit control and logistics support roles
Third level or professional qualifications were often cited as a requirement for admin positions; part professional or professional qualifications were required for a significant number of jobs in the areas of accountancy and finance; at least two years’ experience was stated in the majority of vacancies.
Skilled Trades Occupations In 2013, vacancies for skilled trade
occupations were primarily in the areas of hotel and catering, the manufacture of food and beverages and construction. Occupations included:
food preparation trades: chefs (accounted for a third of DSP Jobs Ireland vacancies for this occupational group), butchers/deboners and, to a lesser extent, bakers

National Skills Bulletin 2014 62 July 2014
electrical and electronic trades (e.g. electricians)
construction trades (plumbers, industrial plumbers, painters, carpenters, steel fixers/erectors, roofers)
vehicle trades (mechanics, HGV mechanics, panel beaters)
welders (stainless steel, TIG/MIG, orbital, arc, fabricators, pipe fitters)
fitters and toolmakers (CNC machinists, metal fabricators, maintenance, construction plant, setting out engineers, mechanical).
Over half of the vacancies advertised through DSP Jobs Ireland required candidates to be fully experienced, with a further third specifying that some level of experience was required.
Caring Leisure and other Service Occupations Vacancies for caring, leisure and other
service occupations in 2013 were concentrated in:
healthcare (e.g. care workers and home carers (accounting for 12% of total DSP Jobs Ireland vacancies); three quarters of these vacancies were for part-time positions)
personal services (e.g. barbers/ hairdressers, beauticians, nail technicians, spa therapists)
hotel and catering (e.g. housekeepers and accommodation assistants)
Almost two thirds of vacancies advertised through DSP Jobs Ireland required candidates to have some experience, with almost a fifth requiring persons to be fully experienced.
Sales and Customer Service Occupations Vacancies for sales and customer service
occupations in 2013 most often occurred in customer service/call centres, banking, financial services and insurance and sales, with occupation titles including
field sales agents (5% of total vacancies for DSP Jobs Ireland)
sales and retail assistants (approximately half of these positions were for part-time posts)
customer services (primarily multilingual contact centre agents)
other sales/customer services (e.g. tele-sales, merchandisers, credit collection, pharmacy assistants)
Of the sales related vacancies advertised through DSP Jobs Ireland, 46% required no minimum level of experience, the highest level for all occupational groups.
Operatives Vacancies for operatives in 2013 were
most frequent for:
process operatives (e.g. in the food industry, quality control)
drivers (large goods vehicles, delivery, mobile machine drivers, fork-lift truck drivers, bus and coach drivers)
construction operatives (e.g. scaffolders, pipelayers)
plant and machine operatives (e.g. CNC machine operators)
Experience was required for the majority of vacancies advertised through DSP Jobs Ireland for operative positions, with 40% requiring some experience and a further 42% requiring candidates to be fully experienced.

National Skills Bulletin 2014 63 July 2014
Elementary Occupations Vacancies for elementary occupations
accounted for 22% of all vacancies advertised through DSP Jobs Ireland in 2013
Vacancies were most frequent for:
security guards (Loss Prevention Officers, store detectives, retail security)
kitchen and catering assistants (approximately half of these vacancies were for part-time positions)
cleaners (over two thirds of vacancies were for part-time positions)
elementary operatives (signing, lighting and guarding operatives (roadworks), water meter installation operatives, ground workers in construction)
waiters and waitresses
elementary storage (warehouse assistants, bankspersons, retail stock scanning).
Of the vacancies advertised through DSP Jobs Ireland 14%, required no minimum experience.
7.2 SLMRU (SOLAS) Recruitment Agency Survey Every six months the SLMRU (SOLAS) conducts a survey of recruitment agencies in Ireland in order to identify occupations for which difficult-to-fill vacancies (DTFs) exist. In general, the difficulty in filling a vacancy may arise as a result of an insufficient number of skilled candidates, but may also stem from their reluctance or unwillingness to take up employment in a particular occupation.
The most recent survey of recruitment agencies was conducted in April 2014. All recruitment agencies that are members of the National Recruitment Federation of Ireland44 were contacted and 36 agencies reported difficulty in sourcing suitable candidates for their clients. The key findings are summarised below.
When compared to one year previously, there was an increase in the aggregate number of DTF mentions
More than 60% of mentions referred to vacancies as very difficult or extremely difficult to fill
▪ Approximately 90% of DTF mentions attributed a lack of suitable candidates, rather than a perceived lack of attractiveness of the job on offer, as the main reason for the difficulty in filling posts
▪ Three quarters of all DTF mentions were for professional vacancies, with a further 13% for associate professional posts
Two thirds of DTF mentions were related to positions in ICT and industry (e.g. high tech manufacturing); one tenth were for positions in health and social care
Almost half of DTF mentions were associated with posts filled with non-Irish candidates
Almost two in five DTF mentions were for posts requiring at least 5 years of relevant experience
The majority of DTF mentions were for permanent posts
Cross-disciplinary skills particularly sought after were ICT skills combined with
44 The National Recruitment Federation is a voluntary organisation set up to establish and maintain standards and codes of practice for the recruitment industry in Ireland and it is also widely recognised as the representative body for the industry.

National Skills Bulletin 2014 64 July 2014
business/financial skills and supply chain management with technical/managerial /business skills.
The occupations most frequently mentioned as being difficult to source included:
Software designers and developers:
Web applications (e.g. Java, HTML/XHTML, JavaScript and CSS); object oriented AD client computing (JSP, Ruby on Rails and PHP); web design and publishing using OS (e.g. Drupal, Joomla etc.)
Promoting and enhancing user online experience (UX) and user interaction (UI)
Cloud developers (e.g. SaaS)
Big data (e.g. Hadoop)
Database architecture (data warehousing)
Network engineers
Mobile technology applications development (Apple iOS and android platforms).
Engineers:
Production and process engineers (e.g. in the biopharma and medical device industry); also validation and safety engineers
Design and development engineers
Quality assurance engineers
Chemical engineers
Commissioning engineers - overseeing the installation of systems, plant and/or equipment.
Scientists (biologists, chemists and biotechnologists in niche areas such as co-vigilance (clinical trials and drug safety),
and product formulation and development).
Healthcare occupations:
Medical practitioners (e.g. locum general practitioners (GPs) and non-consultant hospital doctors (e.g. emergency medicine, anaesthetists, consultant radiologists))
Nurses (senior roles - clinical nursing managers, advanced nursing practitioners in intensive care, paediatrics, theatre nursing, geriatric nurses)
Cardiac technicians
Radiographers (MRI)
Social care managers – limited to niche areas.
Managers:
IT operations and IT specialist managers
Sales managers (senior managers with industry specific knowledge and experience (e.g. IT B2B sales);
marketing managers (product strategy development and management)
supply chain managers.
Financial professionals:
Credit and risk management (e.g. risk analysts and actuaries) and regulatory compliance
Accountants with expertise in taxation, audit, solvency and financial restructuring and financial management accountants
Business analysts (e.g. financial markets, insurance)
Financial advisors (banking/ insurance).

National Skills Bulletin 2014 65 July 2014
Sales and customer service:
Customer service: contact centre roles, with many posts requiring foreign languages (especially German and Nordic languages) and/or relevant product knowledge
Sales: telesales/sales team leaders, online digital marketing and sales roles; technical sales representatives for the pharmaceutical and medical device industries.
Science, engineering and production technicians:
ICT technical user support with languages (e.g. ‘cloud’ related applications technical support), IT testing and troubleshooting
Instrumentation and quality control in manufacturing (e.g. metrology engineering technicians, electronic technicians).
Skilled trades:
CNC operators
Welders (TIG & MIG Welders– Tungsten/Metal Inert Gas)
Steel erectors/fixers.
Administrative occupations:
Logistics (multilingual supply chain)
Financial clerks (credit control, accounts payable and debt recovery), with many posts requiring a foreign language.
Care: Care assistants/home carers
▪ Operatives:
High tech manufacturing (bio-pharma)
Logistics (warehousing and transport)
Drivers (fork-lift drivers, heavy goods vehicle drivers).

National Skills Bulletin 2014 66 July 2014
Section 8 Occupational Employment Profiles
This section provides a statistical analysis of occupational employment. Most of the indicators used in the analysis are presented in Table 8.1. Employment profiles are provided for over 130 occupations, which are grouped into 17 broad groups.
Column 1 (Table 8.1) contains occupational titles; the list of occupations was based on the Standard Occupational Classification (SOC) 2010. In cases where estimated employment was less than 3,000, two or more occupations were merged to form an occupational group. This was done in order to ensure that a sufficiently large number of observations was used for statistical inference.
Column 2 presents the employment level for each occupation. Employment figures represent the annual average of four quarters in 2013. Source: Analysis by SLMRU (SOLAS) based on data provided by the CSO (QNHS), quarter 1 to quarter 4 2013.
Column 3 shows the percentage of females employed in an occupation. Source: Analysis by SLMRU (SOLAS) based on data provided by the CSO (QNHS), quarter 4 2013.
Column 4 shows the percentage of persons who work part-time. Source: Analysis by SLMRU (SOLAS) based on data provided by the CSO (QNHS), quarter 4 2013.
Column 5 provides an indication of the unemployment level for an occupation. The unemployment rate is calculated by dividing the number of unemployed persons aged 15 and over in an occupation by the sum of the
number of employed and unemployed persons aged 15 and over in that occupation. As only persons who stated their previous occupation were included in the calculations, the estimates may underestimate the true unemployment rate for an occupation.
The unemployment rate is indicated as follows:
▪ ‘B.A.’ for unemployment rates below the national average of 11.7% (quarter 4 2013)
▪ ‘A.’ for unemployment rates of 11.7% (quarter 4 2013)
▪ ‘A.A.’ for unemployment rates above the national average of 11.7%.
To avoid issues with small sample size at this level of disaggregation, the unemployment rate could only be reported for occupations in which at least 1,000 persons were estimated to be unemployed. Source: Analysis by SLMRU (SOLAS) based on data provided by the CSO (QNHS), quarter 4 2013.
Column 6 shows the percentage of persons aged 55 and over in employment in an occupation. The age distribution of a workforce skewed towards older age cohorts indicates likely higher retirement rates in the short to medium-term. Source: Analysis by SLMRU (SOLAS) based on data provided by the CSO (QNHS), quarter 4 2013.
Column 7 shows the percentage of non-Irish nationals in employment. A higher than average proportion of non-Irish nationals in an occupation suggests that Irish employers had to recruit suitable candidates from abroad to fill vacancies. Source: Analysis by SLMRU

National Skills Bulletin 2014 67 July 2014
(SOLAS) based on data provided by the CSO (QNHS), quarter 4 2013.
Column 8 shows the percentage of persons who have attained a third level qualification (NFQ levels 6-10). See Appendix A for the award types placed at these levels. Source: Analysis by SLMRU (SOLAS) based on data provided by the CSO (QNHS), quarter 4 2013.
Column 9 shows the annualised rate of employment growth for the period 2008-2013. Source: Analysis by SLMRU (SOLAS) based on data provided by the CSO (QNHS), 2008-2013.
Column 10 shows the number of new employment permits issued to non-EEA nationals in 2013. This is an indicator of the demand for skills that could not be met from domestic or EEA sources. Source: Department of Jobs, Enterprise and Innovation.
Column 11 presents the results of the SLMRU (SOLAS) Recruitment Agency Survey conducted in April 2014. The occupations with mentions of difficult-to-fill vacancies reported by recruitment agencies are indicated by an ‘X’. Source: SLMRU (SOLAS) Recruitment Agency Survey.
Column 12 presents the expected medium term employment growth rate by occupation. The growth rates are indicated as follows:
▪ ‘B.A.’ for employment growth below the expected national average of 19% for the period 2012-2020
▪ ‘A.’ for expected employment growth of 19%
▪ ‘A.A.’ for employment growth above the expected national average of 19% for the period 2012-2020.
Source: Recovery and competitive manufacturing scenario, Occupational Employment Projections 2020, SLMRU (SOLAS), February 2014.
Column 13 shows the estimated replacement rate for each occupation. The replacement rate was based on the number of identified transitions from employment to inactivity (e.g. retirement, home duties, study, etc.) and net losses from inter-occupational movements. The rates were reported only for occupations for which the estimated number of transitions was above 1,000. Source: Analysis by SLMRU (SOLAS) based on data provided by the CSO (QNHS), quarter 4 2012 – quarter 4 2013.
Column 14 shows the estimated turnover rate for each occupation. The turnover rate was based on the number of identified intra-occupational transitions (changes of employer) and the neutral intra-occupational movements (transitions between occupations where exits from an occupation were compensated in full by entries to that occupation). The rates were reported only for occupations for which the estimated number of transitions was above 1,000. Source: Analysis by SLMRU (SOLAS) based on data provided by the CSO (QNHS), quarter 4 2012 – quarter 4 2013.
Column 15 provides an indication of shortage for each occupation. The following categories were used:
▪ ‘no shortage’ - for occupations for which there were no apparent labour market imbalances
▪ ‘skill shortage’ - where there was an insufficient number of individuals who had the required level of educational attainment, skills set and/or experience

National Skills Bulletin 2014 68 July 2014
to meet the required labour market demand
▪ ‘labour shortage’ – where there was an insufficient number of individuals available to take up employment opportunities in a particular occupation
▪ ‘inconclusive’ - for occupations for which the available quantitative information was insufficient for the identification of shortages.
For grouped occupations, an indication of shortage does not mean that all occupations in the grouping are in short supply.
The term ‘shortage’ within this report refers only to the situation whereby the supply of skills or labour from within the Irish workforce is insufficient to meet demand. It may be the case that there is a sufficient supply of skills or labour for the occupation in question within the EEA. Consequently, there may not be a shortage from a European perspective.
Column 16 provides some further elaboration on the shortages or issues identified for the relevant occupation.
Using data from Table 8.1, individual occupations were examined in detail. The analysis covers the following broad occupational groups:
▪ Science occupations
▪ Engineering occupations
▪ IT occupations
▪ Business and financial occupations
▪ Healthcare occupations
▪ Education occupations
▪ Social and care occupations
▪ Legal and security occupations
▪ Construction professional and associate professional occupations
▪ Construction craft occupations
▪ Other craft occupations
▪ Arts, sports and tourism occupations
▪ Transport and logistics occupations
▪ Administrative and secretarial occupations
▪ Sales and customer service occupations
▪ Operatives
▪ Elementary occupations (labourers).
In general, occupations that are associated with the same sector of employment or occupations with similar duties were grouped together. The following information was provided for each occupational group:
▪ the level of employment (expressed as an annual average figure for 2013)
employment growth for the period 2008-2013
age profile — employment was grouped as follows: persons aged 15-24, 25-54, and 55 years and older (quarter 4 2013)
educational attainment — employment was grouped as follows: persons with lower secondary education or less; higher secondary or further education and training (FET); and third level education (quarter 4 2013).
A summary of the balance between the demand and supply is provided for each occupational group. The estimated recruitment requirement was derived by combining expected expansion and replacement demand. Replacement demand was based on the replacement rates presented in Section 5.

National Skills Bulletin 2014 69 July 2014
The supply of skills was approximated using the expected output from the formal education and training system45. The expected output was derived using third level enrolment and graduation data, as well as any available data on further education and training enrolments and certifications.
Supply data at occupational level is not reported due to the complexity of linking course output to specific occupations (e.g. business courses can be a source of supply for numerous occupations). In addition, for the majority of occupations, there are no mandatory qualification requirements. Thus, the intention is not to provide an exact quantification of the supply for each occupation but rather to obtain a general approximation.
By comparing estimates of demand and supply, an indication of potential shortage was derived. In addition, the other shortage indicators (e.g. employment permits, difficult-to-fill vacancies, etc.) were examined to reinforce the findings. The results also drew on conclusions from previous reports produced by the EGFSN and other qualitative information. The objective was to identify areas of shortages, without quantifying them.
Identified shortages are classified as skill or labour shortages. In some cases, an indication of the persistence of shortages is also discussed. Given that the findings are based on current data, future shortages are only indicated in cases where there is clear evidence that the shortages will persist or if current trends in education provision indicate that future shortages will emerge.
45It should be noted that it is possible that individuals do not work in the occupations for which they are trained.
A skills shortage may arise for a number of different reasons. For example, the shortage may reflect a temporary or a sustained increase in the demand for a particular expertise, or a reduction in the number of students who are acquiring the relevant qualifications. The most effective way to alleviate a shortage will depend on the reason for which the shortage has arisen. For example, if the shortage is of a temporary nature, it may be more effective to source the scarce skills from abroad, rather than to increase the number of student places in the relevant disciplines.
The purpose of this bulletin is solely to identify occupations for which shortages exist. The identification of the cause of these shortages and the appropriate (if any) policy response requires further research. The EGFSN’s research programme includes a number of such studies.

National Skills Bulletin 2014 70 July 2014
Table 8.1 Demand and Shortage Indicators for Selected Occupations
Occ
upat
ion
Num
ber E
mpl
oyed
, 201
3 (A
nnua
l Ave
rage
- '0
00s)
% F
emal
e
% P
art-
Tim
e
Une
mpl
oym
ent R
ate
(%)
% A
ged
55 y
ears
and
ove
r
% N
on-Ir
ish N
atio
nals
% T
hird
Lev
el G
radu
ates
Annu
alise
d Em
ploy
men
t Gr
owth
Rat
e, 2
008-
2013
(%
)
New
Em
ploy
men
t Per
mits
Is
sued
, 201
3 (N
umbe
r)
SLM
RU R
ecru
itmen
t Ag
ency
Sur
vey
Proj
ecte
d M
ediu
m-T
erm
Gr
owth
Rat
e (%
)
Repl
acem
ent R
ate
(%)
Turn
over
rate
(%)
Shor
tage
Indi
cato
r
Com
men
t
Functional managers & directors 48.2 25.1% 8.0% B.A. 21.4% 8.9% 58.9% 0.2% 44 A.A. 4% 4% No shortage
Production managers in manufacturing, mining & energy 11.5 27.1% 8.3% B.A. 9.7% 7.0% 71.7% 1.7% 33 A.A. 10% No shortage
Financial managers & directors 4.3 32.6% 3.9% 7.1% 7.3% 76.5% -0.9% 29 A. No shortage
Advertising, marketing & sales directors 5.4 20.1% 4.1% 14.4% 14.5% 72.5% 8.6% 33 A.A. 18% No shortage
Human resource managers 4.6 78.8% 14.0% 3.3% 8.8% 88.8% 10.3% 7 A.A. No shortage
ICT specialist & project managers 16.5 31.6% 4.2% 8.2% 11.3% 82.6% 6.0% 123 X A.A. 10% Skill shortage
Financial institution managers & directors 5.2 36.5% 1.9% 9.6% 10.0% 85.8% -1.3% 5 A.A. No shortage
Managers & directors in transport & logistics 6.7 10.8% 3.2% 10.6% 7.0% 31.0% -0.9% 4 X A.A. Skill shortage Niche areas
Managers & directors in retail & wholesale 14.0 41.4% 7.3% B.A. 11.7% 11.0% 45.2% -1.2% 8 A.A. 7% No shortage
Hotel & accommodation managers 8.3 42.5% 12.8% 29.1% 14.8% 44.1% 9.3% 0 A. No shortage
Restaurant managers 5.8 49.0% 4.6% 18.0% 31.3% 42.6% -0.9% 0 A.A. No shortage

National Skills Bulletin 2014 71 July 2014
Occ
upat
ion
Num
ber E
mpl
oyed
, 201
3 (A
nnua
l Ave
rage
- '0
00s)
% F
emal
e
% P
art-
Tim
e
Une
mpl
oym
ent R
ate
(%)
% A
ged
55 y
ears
and
ove
r
% N
on-Ir
ish N
atio
nals
% T
hird
Lev
el G
radu
ates
Annu
alise
d Em
ploy
men
t Gr
owth
Rat
e, 2
008-
2013
(%
)
New
Em
ploy
men
t Per
mits
Is
sued
, 201
3 (N
umbe
r)
SLM
RU R
ecru
itmen
t Ag
ency
Sur
vey
Proj
ecte
d M
ediu
m-T
erm
Gr
owth
Rat
e (%
)
Repl
acem
ent R
ate
(%)
Turn
over
rate
(%)
Shor
tage
Indi
cato
r
Com
men
t
Publicans 3.7 29.9% 13.3% 50.3% 6.7% 15.5% -2.5% 0 B.A. No shortage
Leisure & sports managers 1.9 39.8% 7.7% 29.3% 0.0% 70.8% 0.1% 1 A. No shortage
Managers & proprietors in other services 26.6 34.4% 10.5% B.A. 28.8% 8.5% 42.6% 2.2% 7 A.A. 6% No shortage
Chemical, biological & physical scientists 6.5 64.0% 9.6% 8.3% 8.9% 96.6% 0.5% 16 X B.A. Skill shortage Niche areas
Other natural & social scientists; R&D managers 5.6 36.1% 7.7% 10.3% 10.3% 94.8% 1.9% 19 B.A. No shortage
Civil engineers 7.2 8.8% 5.6% 10.8% 8.5% 94.2% -6.8% 1 B.A. 15% No shortage
Electrical & electronic engineers 3.0 6.7% 2.8% 6.2% 10.1% 89.5% 3.4% 32 X A.A. Skill shortage Niche areas
Production, process, design & development engineers 4.2 7.7% 0.0% 1.5% 16.9% 94.2% 6.8% 61 X A.A. Skill shortage
Quality control engineers; other regulatory professionals 4.5 45.1% 2.0% 4.0% 2.9% 97.4% 14.2% 20 X A.A. Skill shortage
Engineering professionals n.e.c. 4.5 14.0% 1.5% 4.7% 15.9% 93.8% 0.6% 39 X A.A. Skill shortage Niche areas
IT Business analysts & systems designers 3.3 30.2% 7.9% 2.8% 19.6% 87.3% 2.3% 356 X A.A. Skill shortage
Programmers & software developers 16.4 17.3% 5.2% B.A. 2.1% 34.7% 93.7% 7.7% 633 X A.A. 9% Skill shortage

National Skills Bulletin 2014 72 July 2014
Occ
upat
ion
Num
ber E
mpl
oyed
, 201
3 (A
nnua
l Ave
rage
- '0
00s)
% F
emal
e
% P
art-
Tim
e
Une
mpl
oym
ent R
ate
(%)
% A
ged
55 y
ears
and
ove
r
% N
on-Ir
ish N
atio
nals
% T
hird
Lev
el G
radu
ates
Annu
alise
d Em
ploy
men
t Gr
owth
Rat
e, 2
008-
2013
(%
)
New
Em
ploy
men
t Per
mits
Is
sued
, 201
3 (N
umbe
r)
SLM
RU R
ecru
itmen
t Ag
ency
Sur
vey
Proj
ecte
d M
ediu
m-T
erm
Gr
owth
Rat
e (%
)
Repl
acem
ent R
ate
(%)
Turn
over
rate
(%)
Shor
tage
Indi
cato
r
Com
men
t
Web designers & developers 1.7 20.0% 11.6% 0.0% 23.3% 71.9% -1.6% 18 X A.A. Skill shortage
ICT professionals n.e.c. 8.1 11.3% 1.1% 3.2% 22.1% 90.3% 3.9% 234 X A.A. Skill shortage
Medical practitioners 14.0 42.0% 8.3% 9.8% 26.7% 99.2% 8.3% 140 X B.A. 19% Skill shortage
Pharmacists 3.1 67.3% 23.9% 15.3% 16.3% 97.4% 0.2% 2 A.A. No shortage
Physiotherapists 3.1 86.4% 38.3% 9.4% 5.1% 100.0% 12.1% 1 A.A. No shortage
Occupational & other therapy professionals 3.8 90.8% 22.5% 8.7% 3.5% 100.0% 0.3% 4 B.A. No shortage
Nurses & midwives 56.8 93.0% 21.9% 16.0% 12.8% 97.1% -0.3% 95 X B.A. 4% 2% Skill shortage
Other health professionals n.e.c. 12.2 66.4% 14.1% 16.8% 14.7% 94.0% 5.7% 10 X B.A. Skill shortage Niche areas
Higher & further education teaching profs. 10.7 47.5% 20.9% 19.2% 13.8% 99.3% -1.5% 27 B.A. No shortage
Secondary teachers 31.5 64.9% 15.0% B.A. 10.3% 4.2% 99.5% 5.5% 1 B.A. 4% 8% No shortage
Primary & nursery teachers 40.9 89.1% 13.5% B.A. 5.6% 2.5% 96.3% -1.3% 0 B.A. 5% 6% No shortage
Teaching & other educational professionals 14.4 70.2% 36.1% 25.8% 12.8% 91.7% 5.1% 6 B.A. No shortage

National Skills Bulletin 2014 73 July 2014
Occ
upat
ion
Num
ber E
mpl
oyed
, 201
3 (A
nnua
l Ave
rage
- '0
00s)
% F
emal
e
% P
art-
Tim
e
Une
mpl
oym
ent R
ate
(%)
% A
ged
55 y
ears
and
ove
r
% N
on-Ir
ish N
atio
nals
% T
hird
Lev
el G
radu
ates
Annu
alise
d Em
ploy
men
t Gr
owth
Rat
e, 2
008-
2013
(%
)
New
Em
ploy
men
t Per
mits
Is
sued
, 201
3 (N
umbe
r)
SLM
RU R
ecru
itmen
t Ag
ency
Sur
vey
Proj
ecte
d M
ediu
m-T
erm
Gr
owth
Rat
e (%
)
Repl
acem
ent R
ate
(%)
Turn
over
rate
(%)
Shor
tage
Indi
cato
r
Com
men
t
Barristers, judges, solicitors & related professionals 11.0 46.1% 6.7% 13.7% 3.1% 98.4% 0.8% 8 A.A. No shortage
Accountants & tax experts 38.3 40.8% 8.9% B.A. 9.1% 7.5% 96.7% -0.9% 115 X A.A. 3% 6% Skill shortage
Mgt. consultants, business analysts & project managers 8.0 34.4% 5.3% 10.3% 12.6% 88.4% 10.4% 88 X A.A. Skill shortage
Actuaries, economists & statisticians; other business professionals 8.1 56.9% 11.3% 13.2% 14.5% 90.5% 4.0% 27 X A.A. 13% 16% Skill Shortage
Architects & town planners 3.8 30.4% 9.8% 13.5% 10.5% 97.5% -12.3% 3 B.A. No shortage
Architectural technologists, construction project managers & surveyors 4.7 15.8% 7.9% 1.5% 5.5% 96.8% -1.3% 7 A.A. Skill shortage Niche areas
Social workers & welfare professionals 6.6 45.8% 11.4% 28.5% 14.7% 96.0% -1.2% 0 B.A. No shortage
Media professionals 5.2 62.5% 14.8% 13.0% 7.6% 91.4% -9.8% 7 A.A. No shortage
Laboratory technicians 7.0 44.1% 8.4% 14.0% 14.3% 69.6% -1.2% 2 B.A. No shortage
Electrical, electronic & engineering technicians 5.5 11.2% 4.2% 4.3% 9.2% 75.5% 8.0% 16 X A.A. Skill shortage Niche areas
Process & quality assurance technicians 4.4 38.6% 4.1% 5.0% 21.3% 61.6% 9.4% 9 X A.A. Skill shortage
Other technicians n.e.c. 4.9 19.4% 7.5% 15.1% 3.0% 73.5% -1.2% 15 A.A. No shortage

National Skills Bulletin 2014 74 July 2014
Occ
upat
ion
Num
ber E
mpl
oyed
, 201
3 (A
nnua
l Ave
rage
- '0
00s)
% F
emal
e
% P
art-
Tim
e
Une
mpl
oym
ent R
ate
(%)
% A
ged
55 y
ears
and
ove
r
% N
on-Ir
ish N
atio
nals
% T
hird
Lev
el G
radu
ates
Annu
alise
d Em
ploy
men
t Gr
owth
Rat
e, 2
008-
2013
(%
)
New
Em
ploy
men
t Per
mits
Is
sued
, 201
3 (N
umbe
r)
SLM
RU R
ecru
itmen
t Ag
ency
Sur
vey
Proj
ecte
d M
ediu
m-T
erm
Gr
owth
Rat
e (%
)
Repl
acem
ent R
ate
(%)
Turn
over
rate
(%)
Shor
tage
Indi
cato
r
Com
men
t
IT operations technicians 8.1 23.9% 9.2% 5.0% 10.7% 70.9% 0.5% 52 X A.A. 13% Skill shortage Multilingual
IT user support technicians 3.0 22.2% 2.5% 2.2% 27.0% 80.6% 2.2% 29 X A.A. Skill shortage Multilingual
Health associate professionals 10.4 71.2% 30.2% 8.8% 18.3% 79.7% 5.0% 20 B.A. No shortage
Youth & community workers 6.4 61.1% 41.2% 26.0% 4.6% 73.5% 0.6% 1 B.A. 18% No shortage
Welfare & housing associate professionals 3.6 76.9% 28.9% 15.8% 2.5% 74.9% -0.3% 0 B.A. No shortage
Army personnel 6.6 13.1% 0.0% 13.4% 0.0% 22.5% -0.9% 0 B.A. No shortage
Gardaí 13.5 23.4% 0.7% 3.4% 1.2% 83.6% 0.3% 0 B.A. No shortage
Protective service occupations 6.0 10.9% 9.7% 5.8% 2.2% 39.6% -2.2% 0 B.A. No shortage
Artistic, literary & media occupations 14.8 41.0% 36.8% B.A. 20.7% 16.9% 68.9% -0.5% 13 A.A. 12% No shortage
Design occupations 6.3 58.8% 22.7% 5.1% 30.2% 86.3% -3.3% 5 B.A. 16% No shortage
Sports & fitness occupations 7.7 43.7% 45.8% 2.0% 12.0% 67.7% 1.8% 29 A.A. 19% No shortage
Aircraft pilots, ship officers, air traffic controllers 2.5 10.1% 0.0% 12.2% 15.1% 73.7% 15.6% 1 A.A. No shortage

National Skills Bulletin 2014 75 July 2014
Occ
upat
ion
Num
ber E
mpl
oyed
, 201
3 (A
nnua
l Ave
rage
- '0
00s)
% F
emal
e
% P
art-
Tim
e
Une
mpl
oym
ent R
ate
(%)
% A
ged
55 y
ears
and
ove
r
% N
on-Ir
ish N
atio
nals
% T
hird
Lev
el G
radu
ates
Annu
alise
d Em
ploy
men
t Gr
owth
Rat
e, 2
008-
2013
(%
)
New
Em
ploy
men
t Per
mits
Is
sued
, 201
3 (N
umbe
r)
SLM
RU R
ecru
itmen
t Ag
ency
Sur
vey
Proj
ecte
d M
ediu
m-T
erm
Gr
owth
Rat
e (%
)
Repl
acem
ent R
ate
(%)
Turn
over
rate
(%)
Shor
tage
Indi
cato
r
Com
men
t
Brokers & insurance underwriters 3.9 39.8% 2.6% 9.7% 4.4% 69.9% -6.6% 3 X A.A. Skill shortage Niche areas
Finance & investment analysts 6.9 29.3% 2.3% 10.9% 10.7% 87.0% 2.3% 20 X A.A. Skill shortage Niche areas
Financial & accounting technicians 3.1 58.4% 26.6% 10.4% 8.2% 72.3% -1.8% 21 X A.A. Skill shortage Niche areas
Financial accounts managers 9.9 46.2% 7.1% 6.4% 19.6% 82.1% 13.0% 23 X A.A. 13% Skill shortage Niche areas
Other business associate profs. 7.0 53.4% 14.3% 12.6% 14.0% 78.8% 4.5% 52 A.A. No shortage
Buyers & procurement officers 2.8 47.2% 7.9% 10.8% 9.4% 76.1% -7.7% 9 A.A. No shortage
Business sales executives 24.9 24.0% 9.4% B.A. 12.7% 12.0% 48.0% -1.7% 45 X A.A. 4% 13% Skill shortage Multilingual Niche areas
Marketing associate professionals 5.8 54.1% 18.4% 11.5% 15.8% 77.9% -1.8% 30 X A.A. Skill shortage Multilingual Niche areas
Sales accounts & bus. dev. managers 16.9 39.3% 5.3% 8.4% 8.1% 79.5% 3.4% 43 X A.A. 10% Skill shortage Multilingual Niche areas
Estate agents etc.; conference & exhibition managers 3.8 51.7% 7.0% 16.0% 14.8% 80.5% -4.8% 0 B.A. No shortage
Environmental & other public services associate professionals 5.3 51.1% 18.3% 34.0% 1.8% 58.3% 6.8% 1 B.A. No shortage
Human resources & industrial relations officers 7.5 67.5% 19.3% 7.3% 8.1% 79.0% 0.2% 8 B.A. No shortage

National Skills Bulletin 2014 76 July 2014
Occ
upat
ion
Num
ber E
mpl
oyed
, 201
3 (A
nnua
l Ave
rage
- '0
00s)
% F
emal
e
% P
art-
Tim
e
Une
mpl
oym
ent R
ate
(%)
% A
ged
55 y
ears
and
ove
r
% N
on-Ir
ish N
atio
nals
% T
hird
Lev
el G
radu
ates
Annu
alise
d Em
ploy
men
t Gr
owth
Rat
e, 2
008-
2013
(%
)
New
Em
ploy
men
t Per
mits
Is
sued
, 201
3 (N
umbe
r)
SLM
RU R
ecru
itmen
t Ag
ency
Sur
vey
Proj
ecte
d M
ediu
m-T
erm
Gr
owth
Rat
e (%
)
Repl
acem
ent R
ate
(%)
Turn
over
rate
(%)
Shor
tage
Indi
cato
r
Com
men
t
Vocational & industrial trainers & instructors 7.8 48.4% 18.1% 32.6% 11.2% 69.0% -0.4% 7 B.A.
No shortage
Regulations inspectors; health & safety officers 3.6 29.3% 19.5% 22.1% 4.1% 83.7% -2.5% 0 A.A.
No shortage
Government admin. occupations 37.1 76.0% 16.4% B.A. 19.8% 1.7% 42.1% -6.4% 1 B.A. 3% No shortage
Financial admin. occupations 55.6 77.7% 27.0% B.A. 14.0% 9.8% 52.8% -3.5% 25 X A.A. 8% 8% Skill shortage Multilingual Niche areas
Records & library clerks etc. 4.3 75.4% 32.9% 23.0% 15.8% 52.0% 5.8% 0 B.A. No shortage
Stock control, transport & distribution admin. occupations 5.5 33.8% 17.9% 9.1% 10.6% 31.6% -3.8% 3 X A.A. Skill shortage
Multilingual Niche areas
Other administrators n.e.c. 58.8 83.1% 34.0% B.A. 16.9% 9.8% 42.9% -2.3% 10 B.A. 7% 13% No shortage
Office managers & supervisors admin. occupations 7.2 73.2% 19.1% 13.7% 12.2% 57.0% -3.0% 2 A.A. No shortage
P.A.s & other secretaries, etc. 29.1 93.3% 40.5% B.A. 19.7% 6.5% 34.2% -7.1% 3 B.A. 4% 6% No shortage
Receptionists 11.0 89.2% 45.9% B.A. 16.4% 13.4% 29.0% -6.9% 0 B.A. 10% 11% No shortage
Farmers 76.6 6.9% 12.9% 50.1% 1.2% 10.1% -3.3% 0 B.A. 5% No shortage
Horticultural, agricultural & fishing trades n.e.c. 16.1 6.3% 29.3% A.A. 29.2% 15.3% 25.9% -1.5% 4 B.A. 12% 7% No shortage

National Skills Bulletin 2014 77 July 2014
Occ
upat
ion
Num
ber E
mpl
oyed
, 201
3 (A
nnua
l Ave
rage
- '0
00s)
% F
emal
e
% P
art-
Tim
e
Une
mpl
oym
ent R
ate
(%)
% A
ged
55 y
ears
and
ove
r
% N
on-Ir
ish N
atio
nals
% T
hird
Lev
el G
radu
ates
Annu
alise
d Em
ploy
men
t Gr
owth
Rat
e, 2
008-
2013
(%
)
New
Em
ploy
men
t Per
mits
Is
sued
, 201
3 (N
umbe
r)
SLM
RU R
ecru
itmen
t Ag
ency
Sur
vey
Proj
ecte
d M
ediu
m-T
erm
Gr
owth
Rat
e (%
)
Repl
acem
ent R
ate
(%)
Turn
over
rate
(%)
Shor
tage
Indi
cato
r
Com
men
t
Metal forming, welding & related trades 7.8 0.0% 11.1% A.A. 12.6% 16.1% 12.6% -8.5% 0 X A.A.
Skill shortage
Metal machining, fitting & instrument making trades 25.2 2.2% 11.9% B.A. 17.2% 9.5% 30.5% -3.9% 2 X A.A. 5% 8% Skill shortage
Vehicle trades 18.8 0.0% 11.5% A.A. 14.4% 16.3% 13.6% -3.8% 1 B.A. 6% No shortage
Electrical & electronic trades, etc. 34.6 6.1% 8.1% B.A. 15.1% 10.9% 42.1% -9.1% 18 A.A. 4% 8% No shortage
Bricklayers 3.4 0.0% 22.0% 17.1% 13.0% 5.7% -21.5% 1 B.A. No shortage
Plumbers 8.5 0.0% 17.3% A.A. 14.6% 6.4% 16.0% -10.3% 0 A.A. No shortage
Carpenters & joiners 13.9 0.5% 15.2% A.A. 15.5% 9.4% 5.5% -19.0% 0 A.A. 10% No shortage
Plasterers 3.0 0.0% 20.2% 16.9% 13.4% 8.5% -24.9% 0 A.A. No shortage
Painters & decorators 5.5 2.6% 21.9% A.A. 15.2% 13.0% 14.2% -12.8% 1 A.A. 20% No shortage
Other construction trades 20.0 1.8% 16.0% A.A. 23.1% 12.4% 16.0% -15.2% 1 X A.A. 5% 12% Skill shortage Niche areas
Printing trades 4.2 8.6% 9.3% 22.7% 15.0% 21.2% -5.9% 2 B.A.
No shortage
Butchers, fishmongers, etc. 8.3 11.5% 14.7% 10.7% 39.2% 10.4% 3.8% 11 A.A.
No shortage Retention
issues

National Skills Bulletin 2014 78 July 2014
Occ
upat
ion
Num
ber E
mpl
oyed
, 201
3 (A
nnua
l Ave
rage
- '0
00s)
% F
emal
e
% P
art-
Tim
e
Une
mpl
oym
ent R
ate
(%)
% A
ged
55 y
ears
and
ove
r
% N
on-Ir
ish N
atio
nals
% T
hird
Lev
el G
radu
ates
Annu
alise
d Em
ploy
men
t Gr
owth
Rat
e, 2
008-
2013
(%
)
New
Em
ploy
men
t Per
mits
Is
sued
, 201
3 (N
umbe
r)
SLM
RU R
ecru
itmen
t Ag
ency
Sur
vey
Proj
ecte
d M
ediu
m-T
erm
Gr
owth
Rat
e (%
)
Repl
acem
ent R
ate
(%)
Turn
over
rate
(%)
Shor
tage
Indi
cato
r
Com
men
t
Bakers & flour confectioners 4.0 36.9% 22.5% 4.8% 46.3% 24.6% 11.3% 2 B.A.
No shortage
Chefs & cooks 23.5 37.4% 25.3% B.A. 7.2% 46.1% 45.0% 0.2% 90 A.
12% No shortage Retention
issues
Catering & bar managers 4.8 32.0% 11.6% 15.4% 7.1% 37.5% -0.1% 0 A.
No shortage
Other skilled trades 7.1 29.6% 33.7% A.A. 22.7% 21.9% 22.6% -10.1% 1 B.A.
No shortage
Nursery nurses & assistants 6.2 94.3% 58.6% A.A. 9.2% 0.0% 31.6% 6.4% 0 B.A. 17% No shortage
Childminders, etc. 17.0 98.4% 50.8% A.A. 7.8% 23.2% 37.6% -2.3% 4 B.A. 16% 22% No shortage
Educational support assistants 13.6 98.7% 32.4% 16.3% 4.9% 49.7% -3.0% 0 B.A. 9% 8% No shortage
Animal carers & pest controllers 1.7 93.4% 41.9% 9.0% 9.0% 46.7% -4.4% 2 B.A. No shortage
Caring personal service occupations 8.8 68.7% 30.1% 17.1% 12.6% 28.7% 1.2% 53 B.A. No shortage
Care workers, home carers, etc. 50.9 86.3% 49.6% B.A. 23.8% 11.4% 31.5% 0.0% 3 X B.A. 16% 8% Inconclusive Retention
issues
Leisure & travel service occupations 7.5 69.7% 42.0% 4.1% 19.3% 57.2% -5.1% 1 A. No shortage
Hairdressers & beauticians, etc. 21.9 88.7% 47.0% B.A. 3.5% 15.9% 28.3% -0.5% 2 A. 5% 11% No shortage

National Skills Bulletin 2014 79 July 2014
Occ
upat
ion
Num
ber E
mpl
oyed
, 201
3 (A
nnua
l Ave
rage
- '0
00s)
% F
emal
e
% P
art-
Tim
e
Une
mpl
oym
ent R
ate
(%)
% A
ged
55 y
ears
and
ove
r
% N
on-Ir
ish N
atio
nals
% T
hird
Lev
el G
radu
ates
Annu
alise
d Em
ploy
men
t Gr
owth
Rat
e, 2
008-
2013
(%
)
New
Em
ploy
men
t Per
mits
Is
sued
, 201
3 (N
umbe
r)
SLM
RU R
ecru
itmen
t Ag
ency
Sur
vey
Proj
ecte
d M
ediu
m-T
erm
Gr
owth
Rat
e (%
)
Repl
acem
ent R
ate
(%)
Turn
over
rate
(%)
Shor
tage
Indi
cato
r
Com
men
t
Housekeepers & caretakers, etc. 14.8 45.5% 50.5% B.A. 34.6% 24.8% 15.1% 1.4% 1 B.A. 8% 8% No shortage
Sales assistants 128.0 68.9% 56.0% B.A. 9.9% 19.9% 22.9% -1.9% 10 A.A. 14% 15% No shortage
Sales related occupations 12.0 36.2% 26.5% B.A. 18.4% 17.3% 43.0% -2.4% 8 A.A. 10% No shortage
Sales supervisors 3.4 67.1% 14.3% 14.3% 23.6% 35.7% -1.2% 1 A.A. No shortage
Customer service occupations 17.1 66.0% 22.7% B.A. 9.3% 17.9% 53.6% 3.3% 19 X A.A. 13% Skill shortage Multilingual
Food, drink & tobacco process operatives 12.5 24.0% 8.3% B.A. 12.1% 34.4% 19.7% 16.2% 3 A.A. 11% 15% No shortage Retention
issues
Chemical & related process operatives 5.6 27.8% 4.0% 6.8% 11.7% 34.2% 4.0% 1 X A.A.
Skill shortage Niche areas
Other process operatives 3.4 42.7% 10.4% 10.0% 24.3% 8.3% -4.0% 1 X A.A.
Skill shortage Niche areas
Plant & machine operatives 7.7 19.8% 13.8% A.A. 19.6% 28.8% 25.3% -9.3% 1 X B.A.
Skill shortage Niche areas
Assemblers 8.5 39.9% 6.6% 4.4% 21.1% 15.5% 14.1% 2 A.A.
No shortage
Routine operatives 24.4 37.5% 11.0% 10.5% 20.1% 27.7% 5.5% 4 A.A. 6% 14% No shortage
Construction operatives 9.6 1.0% 24.9% A.A. 22.3% 12.6% 7.0% -3.4% 6 A.A. 14% No shortage

National Skills Bulletin 2014 80 July 2014
Occ
upat
ion
Num
ber E
mpl
oyed
, 201
3 (A
nnua
l Ave
rage
- '0
00s)
% F
emal
e
% P
art-
Tim
e
Une
mpl
oym
ent R
ate
(%)
% A
ged
55 y
ears
and
ove
r
% N
on-Ir
ish N
atio
nals
% T
hird
Lev
el G
radu
ates
Annu
alise
d Em
ploy
men
t Gr
owth
Rat
e, 2
008-
2013
(%
)
New
Em
ploy
men
t Per
mits
Is
sued
, 201
3 (N
umbe
r)
SLM
RU R
ecru
itmen
t Ag
ency
Sur
vey
Proj
ecte
d M
ediu
m-T
erm
Gr
owth
Rat
e (%
)
Repl
acem
ent R
ate
(%)
Turn
over
rate
(%)
Shor
tage
Indi
cato
r
Com
men
t
Road transport operatives 57.6 2.3% 18.2% B.A. 28.3% 13.7% 10.4% -5.7% 0 X A.A. 6% 7% Skill shortage Niche areas
Mobile machine drivers & operatives 10.7 0.0% 15.1% A.A. 12.3% 10.3% 8.4% -12.6% 1 X A.A.
15% Skill shortage Niche areas
Other drivers & transport operatives 5.0 1.7% 16.3% 15.2% 7.6% 19.1% 1.2% 0 A.A.
No shortage
Elementary agricultural occupations 15.2 30.6% 33.4% A.A. 21.6% 27.4% 12.6% 1.7% 12 B.A. 24% 16% No shortage
Elementary construction occupations 30.7 13.7% 25.4% A.A. 13.4% 22.3% 15.2% -15.7% 0 B.A. 15% 17% No shortage
Elementary process plant occupations 8.9 50.2% 31.2% 10.1% 46.0% 17.3% -17.6% 2 B.A.
17% No shortage
Elementary administration occupations 10.4 17.4% 14.1% 27.0% 8.4% 10.8% -2.2% 1 B.A.
No shortage
Elementary cleaning occupations 39.4 71.5% 54.3% B.A. 22.8% 42.8% 16.5% 0.5% 5 B.A. 11% 7% No shortage
Elementary security occupations 13.1 11.6% 32.5% A.A. 21.6% 26.2% 24.5% -5.7% 0 B.A. 12% No shortage
Elementary sales & storage occupations 22.5 12.0% 23.6% A.A. 12.6% 28.3% 21.8% -2.3% 0 B.A. 8% 7% No shortage
Kitchen & catering assistants 22.8 64.5% 47.8% B.A. 14.4% 40.5% 18.7% -1.5% 18 B.A. 17% 14% No shortage
Waiters & waitresses 24.0 73.4% 58.6% B.A. 2.2% 38.4% 30.9% 1.0% 4 B.A. 19% 20% No shortage

National Skills Bulletin 2014 81 July 2014
Occ
upat
ion
Num
ber E
mpl
oyed
, 201
3 (A
nnua
l Ave
rage
- '0
00s)
% F
emal
e
% P
art-
Tim
e
Une
mpl
oym
ent R
ate
(%)
% A
ged
55 y
ears
and
ove
r
% N
on-Ir
ish N
atio
nals
% T
hird
Lev
el G
radu
ates
Annu
alise
d Em
ploy
men
t Gr
owth
Rat
e, 2
008-
2013
(%
)
New
Em
ploy
men
t Per
mits
Is
sued
, 201
3 (N
umbe
r)
SLM
RU R
ecru
itmen
t Ag
ency
Sur
vey
Proj
ecte
d M
ediu
m-T
erm
Gr
owth
Rat
e (%
)
Repl
acem
ent R
ate
(%)
Turn
over
rate
(%)
Shor
tage
Indi
cato
r
Com
men
t
Bar staff 18.7 33.2% 57.2% A.A. 5.5% 10.8% 28.5% -1.5% 0 B.A. 18% 19% No shortage
Other elementary occupations 4.3 23.2% 39.6% 17.5% 29.7% 16.8% 1.4% 0 B.A.
No shortage
Other/not stated 5.6 29.6% 27.7% 9.1% 22.0% 41.0% -0.6% 0
No shortage
Total 1,881.2 45.6% 23.9% National Average 16.2% 14.9% 47.1% -2.4% 3,061
National Average 7% 9%

National Skills Bulletin 2014 82 July 2014
8.1 Science Occupations In 2013, there were approximately 19,000
persons employed in the selected science occupations, representing 1% of Ireland’s workforce
Two thirds of employment was concentrated in three sectors: manufacturing (mostly pharmaceuticals), professional, scientific and technical activities and human health activities
Just under 65% of total employment in the selected occupations was at professional level, while the remainder was at technician level
Over the period 2008 to 2013, overall employment expanded by 0.3% on average annually; this was in contrast to negative average annual growth of 2.4% nationally; employment of other natural and social scientists and R&D managers; and chemical, biological and physical scientists expanded by 1.9% and 0.5% on average annually respectively; in contrast, employment of laboratory technicians contracted by 1.2% on average annually
Between 2012 and 2013, overall employment contracted by 5.9% ─ in contrast to positive national average growth of 2.4%
The share of science professionals and science technicians in employment aged 25-54 was 90% and 75% respectively
Just over 95% of science professionals and 70% of science technicians in employment held third level qualifications
The overall workforce of science professionals was gender balanced, while males represented 56% of the workforce of science technicians
Most of the overall workforce of both science professionals and technicians worked full-time and were Irish-nationals
The unemployment rate for science occupations was just over 7% in quarter 4 2013 ─ well below the national average rate.
Figure 8.1.1 Numbers Employed (000s) in Selected Science Occupations, 2013
Source: SLMRU (SOLAS) analysis of CSO data
Figure 8.1.2 Average Annual Growth (%) in Selected Science Occupations
Source: SLMRU (SOLAS) analysis of CSO data
Note: Growth rates associated with occupations where employment is comparatively small are less reliable due to a greater risk of sampling error.
5.6
6.5
7.0
0 2 4 6 8
Other natural & socialscientists; R&D managers
Chemical, biological &physical scientists
Laboratory technicians
1.9%
-1.2%
0.5%
-11.2%
-5.8%
-0.8%
-20% -15% -10% -5% 0% 5% 10%
Other natural & socialscientists; R&D managers
Laboratory technicians
Chemical, biological & physicalscientists
2012-2013 2008-2013

National Skills Bulletin 2014 83 July 2014
Figure 8.1.3 Age Profile of Selected Science Occupations, Quarter 4 2013
Source: SLMRU (SOLAS) analysis of CSO data
Figure 8.1.4 Education Profile of Selected Science Occupations, Quarter 4 2013
Source: SLMRU (SOLAS) analysis of CSO data
Shortage Indicators Sustainability and growth of some of the key exporting sectors of the Irish economy, such as pharmaceuticals, medical devices and food processing, are heavily dependent on the availability of science skills. During 2013, vacancies were most frequent for chemical and biological scientists (in particular
microbiologists, biomedical scientists and biochemists). Difficult-to-fill vacancies have been identified in the areas of microbiology, product development, active pharmaceutical ingredients (API) and pharmacovigilance (product validation (PV), drug safety etc.). While very small in numbers, these shortages can be very damaging, as they concern high level expertise in critical roles within companies. In 2013, 35 natural scientists were sourced from outside the EEA.
Over the medium term, the pharmaceuticals, medical devices and food sectors are expected to perform strongly, creating demand for natural scientists. This is illustrated in the recent job announcements by the IDA and media (e.g. BioMarin, Aspen Pharma, Ethicon Biosurgery Ireland, Jazz Pharmaceuticals). Despite this expansion, the overall growth in absolute terms is likely to be modest, as these sectors (NACE 10, 20, 21) employ less than 3,000 scientists in total. Moreover, over 40% of all scientists are employed in health, education and public administration and defence, sectors which are subject to tight fiscal policy and employment controls at present. However, the Government’s commitment to support Ireland as an international centre of excellence in scientific research is illustrated by a number of significant recent investments (e.g. the Irish Photonic Integration Centre in UCC, the Synthesis and Solid State Pharmaceutical Centre in UL). These initiatives are expected to generate additional employment for natural scientists in research.
11%
4%
75%
91%
86%
14%
8%
10%
0% 20% 40% 60% 80% 100%
Laboratory technicians
Chemical, biological &physical scientists
Other natural & socialscientists; R&D managers
15-24 25-54 55+
6% 24%
2%
70%
97%
95%
0% 20% 40% 60% 80% 100%
Laboratory technicians
Chemical, biological &physical scientists
Other natural & socialscientists; R&D
managers
Lower Secondary or Less Higher Secondary or FET Third level

National Skills Bulletin 2014 84 July 2014
8.2 Engineering Occupations In 2013, there were approximately 24,000
persons employed in the selected engineering occupations, representing 1.2% of Ireland’s workforce
Just over half of overall employment in the selected occupations was concentrated in manufacturing (mostly machinery/equipment and pharmaceuticals), while almost an additional one fifth was concentrated in professional, scientific and technical activities (mostly architectural & engineering activities, technical testing and analysis)
Almost 60% of total employment in the selected engineering occupations was at professional level (i.e. engineers); the remainder was at technician level
Of the 17 occupational groups examined in this report, engineering occupations recorded the strongest employment growth between 2008 and 2013 (expanding by 6.8% on average annually); the strongest employment growth was observed for production, design & QC engineers (11.9% on average annually) and process, production & quality assurance technicians (9.4% on average annually)
Between 2008 and 2013, employment increased by 6,500; the largest absolute increase was for production, design & QC engineers (2,600)
Over the period 2012 to 2013, overall employment in the selected engineering occupations contracted by 8.8%
Over four fifths of those employed in each occupation was aged 25-54
Just over 90% of engineering professionals and 70% of technicians in employment were third level graduates
The majority of employed engineering professionals and technicians were male, worked full-time and were Irish-nationals
The unemployment rate for both engineering professionals and technicians was considerably below the national average rate of 11.7%.
Figure 8.2.1 Numbers Employed (000s) in Selected Engineering Occupations, 2013
Source: SLMRU (SOLAS) analysis of CSO data
Figure 8.2.2 Average Annual Growth (%) in Selected Engineering Occupations
Source: SLMRU (SOLAS) analysis of CSO data
*Note: Growth rates associated with occupations where employment is comparatively small are less reliable due to a greater risk of sampling error.
3.0
4.4
4.5
5.5
6.1
0 2 4 6 8
Electrical/electronic engineers
Process, production & qualityassurance technicians
Other engineering professionals
Other engineering technicians
Production, design & QCengineers
3.4%
8.0%
9.4%
0.6%
11.9%
-33.6%
-15.1%
-6.0%
-2.1%
10.7%
-60% -40% -20% 0% 20% 40%
Electrical/electronic engineers
Other engineering technicians
Process, production & qualityassurance technicians
Other engineeringprofessionals
Production, design & QCengineers
2012-2013 2008-2013

National Skills Bulletin 2014 85 July 2014
Figure 8.2.3 Age Profile of Selected Engineering Occupations, Quarter 4 2013
Source: SLMRU (SOLAS) analysis of CSO data
Figure 8.2.4 Education Profile of Selected Engineering Occupations, Quarter 4 2013
Source: SLMRU (SOLAS) analysis o f CSO data
Shortage Indicators During 2013, newly advertised vacancies were numerous for engineering skills at professional and technician levels. Moreover, difficult to
fill posts requiring engineering skills have been identified in the areas of
production and process engineering (automation (e.g. computer numerical control, computer aided design and manufacturing, programmable logic control (PLC)), process safety and system control)
quality and validation (e.g. Computer Validation Systems (CVS))
product development and design (in the areas of chemicals, biotechnology, pharmaceuticals, ICT, food and medical devices)
precision engineering (tool making and design for automotive, pharmaceutical and medical devices sectors)
energy (power generation and transmission)
telecommunications (mobile telephony)
project management and production planning.
Given this shortage, many companies are sourcing engineering skills from abroad: over 150 employment permits were issued to non-EEA engineers in 2013.
Employment opportunities are expected to increase as per recent job creation announcements for engineers and engineering technicians in manufacturing (e.g. Aspen Pharma, BioMarin, Ethicon Biosurgery Ireland, Jazz Pharmaceuticals etc.), ICT (e.g. Intel) and energy (e.g. ENERCON, capSpire, Sure Power Energy etc.). The Government’s investment through Science Foundation Ireland and the establishment of the Irish Photonic Integration Centre in UCC will add to the demand for engineering skills and support growth in high technology sectors.
5%
6%
93%
91%
94%
90%
93%
5%
6%
4%
5%
1%
0% 20% 40% 60% 80% 100%
Process, production & QAtechnicians
Electrical/electronicengineers
Other engineeringtechnicians
Other engineeringprofessionals
Production, design & QCengineers
15-24 25-54 55+
36%
8%
21%
6%
4%
62%
89%
76%
94%
94%
0% 20% 40% 60% 80% 100%
Process, production & QAtechnicians
Electrical/electronicengineers
Other engineeringtechnicians
Other engineeringprofessionals
Production, design & QCengineers
Lower secondary or less Higher secondary or FET Third level

National Skills Bulletin 2014 86 July 2014
8.3 IT Occupations In 2013, there were approximately 57,000
persons employed in the selected IT occupations, representing 3% of the national workforce
Almost 50% of overall employment was concentrated in the IT sector (mostly in computer programming and consultancy), while an additional 15% was in industry (computer manufacturing, etc.)
Just over 80% of employment was at professional level; the remainder was at technician level
Between 2008 and 2013, overall employment in IT occupations expanded by 4.5% on average annually ─ the second highest average annual rate of employment growth recorded amongst the 17 broad occupational groups examined; there were almost a net 11,500 additional jobs created; the most pronounced absolute increase in employment was recorded for programmers and software developers and ICT specialist and project managers
Between 2012 and 2013, overall employment increased by 2.9% ‒ adding a net 1,600 jobs
Most of those employed in IT occupations were aged 25-54
Almost 90% of all employed IT professionals were third level graduates; the corresponding share was 75% for IT technicians
Over three quarters of those employed in IT occupations were male
Over one third of all employed programmers and software developers were non-Irish nationals ─ over double the national average; the share was also relatively high for IT user support technicians, with over one quarter employed classified as non-Irish nationals
At 4.9%, the unemployment rate for IT occupations was well below the national average rate of 11.7% in quarter 4 2013.
Figure 8.3.1 Numbers Employed (000s) in Selected IT Professional Occupations, 2013
Source: SLMRU (SOLAS) analysis of CSO data
Figure 8.3.2 Average Annual Growth (%) in Selected IT Professional Occupations
Source: SLMRU (SOLAS) analysis of CSO data
Note: Growth rates associated with occupations where employment is comparatively small are less reliable due to a greater risk of sampling error.
1.7
3.0
3.3
8.1
8.1
16.4
16.5
0 5 10 15 20
Web designers & developers
IT user support technicians
IT business analysts & systemsdesigners
IT operations technicians
ICT profs. n.e.c.
Programmers & softwaredevelopers
ICT specialist & projectmanagers
2.2%
-1.6%
7.7%
0.5%
3.9%
6.0%
2.3%
-20.8%
-11.7%
-5.0%
-2.7%
6.9%
18.5%
24.4%
-30%-20%-10% 0% 10%20%30%40%
IT user support technicians
Web designers & developers
Programmers & softwaredevelopers
IT operations technicians
ICT profs. n.e.c.
ICT specialist & projectmanagers
IT business analysts &systems designers
2012-2013 2008-2013

National Skills Bulletin 2014 87 July 2014
Figure 8.3.3 Age Profile of Selected IT Professional Occupations, Quarter 4 2013
Source: SLMRU (SOLAS) analysis of CSO data
Figure 8.3.4 Education Profile of Selected IT Professional Occupations, Quarter 4 2013
Source: SLMRU (SOLAS) analysis of CSO data
Shortage Indicators In 2013, vacancies for ICT professionals and technicians were numerous. Some of these vacancies were arising due to turnover: higher than average transitions between employers have been identified for programmers, ICT engineers and technicians. However, a significant share of vacancies is arising due to
expansion demand for ICT skills. Moreover, many of the advertised vacancies are proving difficult to fill. In 2013, over 1,300 ICT professionals and over 80 ICT technicians were sourced from outside the EEA.
Shortages of ICT skills have been identified in the following areas:
software development
programming languages, technologies and frameworks (e.g. Java, JavaScript, C#, C++, Summit, Objective C, J2EE, Spring, Struts, Hibernate ORM, jQuery, AJAX, JSP, PHP, HTML, CSS, Phyton, Ruby,.NET)
cloud (e.g. SaaS, web service, API, REST, SOAP, backbone.js)
web/mobile content management (e.g. Interactive visual, UX/UI Visual designer, Drupal, Joomla, AngularJsS, Sencha Touch, Magneto)
IT project management and business analysis
testing and troubleshooting
databases/big data (e.g. NoSQL, SQL, MySQL, Oracle, MS SQL Server, IBMS DB2, Hadoop)
specific product knowledge (e.g. SAP Crystal Reports, Lotus Domino, KANA, InelliPrint Analytics etc.)
IT security
technical support
networking and infrastructure
Employment growth in ICT occupations is expected to be above average over the short to medium term. This is also illustrated in frequent job announcements for ICT professionals and technicians (e.g. KEMP technologies, VCE, Westbourne IT Global Services, IBM, HP, ZeniMax, Agile Networks).
4%
5%
9%
29%
94%
90%
90%
96%
89%
97%
71%
2%
8%
5%
3%
2%
3%
0% 20% 40% 60% 80% 100%
Programmers & softwaredevelopers
ICT specialist & projectmanagers
IT operations technicians
ICT profs. n.e.c.
IT user support technicians
IT business analysts &systems designers
Web designers & developers
15-24 25-54 55+
5%
14%
26%
8%
19%
10%
24%
94%
83%
71%
90%
81%
87%
72%
0% 20% 40% 60% 80% 100%
Programmers & softwaredevelopers
ICT specialist & projectmanagers
IT operations technicians
ICT profs. n.e.c.
IT user support technicians
IT business analysts &systems designers
Web designers & developers
Lower secondary or less Higher secondary or FET Third level

National Skills Bulletin 2014 88 July 2014
8.4 Business and Financial Occupations In 2013, there were approximately
162,000 persons employed in the selected business and financial occupations, representing 8.6% of the national workforce
Approximately 36% of overall employment was concentrated in financial, insurance and real estate activities, while an additional 20% was in professional, scientific and technical activities (mostly legal and accounting activities)
Just over one third of overall employment in the selected occupations was at administrative level (mostly book-keepers, payroll managers and wages clerks; bank and post office clerks); a further one third was at professional level (mostly accountants and tax experts); almost one quarter was at associate professional level; the remainder was at managerial level
While overall employment in business and financial occupations decreased very modestly between 2008 and 2013 (0.2% on average annually), strong employment growth was recorded for some occupations such as financial accounts managers (13% on average annually) and management consultants, business analysts and project managers (10.4% on average annually); in contrast, the greatest decline was observed for brokers and insurance underwriters (6.6% on average annually) and financial administrative occupations (3.5% on average annually)
Between 2012 and 2013, overall employment in the selected occupations expanded by 4.2%, resulting in approximately 6,600 net additional jobs; the most pronounced absolute increase in
employment was recorded for accountants and tax experts
Over four fifths of persons employed in business and financial occupations were aged 25-54
Approximately 95% of those employed in professional occupations held third level qualifications; in contrast, the share was just over 50% for those employed in administrative occupations
Almost 80% of those employed in both financial administrative occupations and as HR managers were female ─ almost twice the national average share; the share was also relatively high for HR & industrial relations officers, at 68%.
Figure 8.4.1 Numbers Employed (000s) in Selected Business and Financial Occupations, 2013
Source: SLMRU (SOLAS) analysis of CSO data
3.1
3.9
4.3
4.6
5.2
6.9
7.0
7.5
8.0
8.1
9.9
38.3
55.6
0 10 20 30 40 50 60
Financial accounting technicians
Brokers & insurance underwriters
Financial managers & directors
HR managers
Financial institution managers &directors
Finance & investment analysts
Other bus. associate profs.
HR & industrial relations officers
Mgt. consultants, bus. analysts &project managers
Actuaries, economists &statisticians; other business profs.
Financial accounts managers
Accountants & tax experts
Financial admin. occupations

National Skills Bulletin 2014 89 July 2014
Figure 8.4.2 Average Annual Growth (%) in Selected Business and Financial Occupations
Source: SLMRU (SOLAS) analysis of CSO data
Note: Growth rates associated with occupations where employment is comparatively small are less reliable due to a greater risk of sampling error.
Figure 8.4.3 Age Profile of Selected Business and Financial Occupations, Quarter 4 2013
Source: SLMRU (SOLAS) analysis of CSO data
-1.8%
10.3%
-6.6%
-1.3%
2.3%
-3.5%
-0.9%
4.0%
4.5%
10.4%
13.0%
-0.9%
0.2%
-14.9%
-13.6%
-11.2%
-11.1%
-7.8%
-0.8%
6.6%
7.8%
7.8%
8.1%
14.2%
15.6%
29.1%
-40% -20% 0% 20% 40%
Financial accountingtechnicians
HR managers
Brokers & insuranceunderwriters
Financial institution managers& directors
Finance & investment analysts
Financial admin. occupations
Financial managers & directors
Actuaries, economists &statisticians; other business
profs.
Other bus. associate profs.
Mgt. consultants, bus. analysts& project managers
Financial accounts managers
Accountants & tax experts
HR & industrial relationsofficers
2012-2013 2008-2013
6%
7%
4%
9%
3%
4%
5%
80%
84%
91%
87%
85%
88%
84%
90%
84%
94%
86%
88%
90%
14%
9%
6%
13%
11%
10%
13%
10%
7%
3%
10%
7%
10%
0% 20% 40% 60% 80% 100%
Financial admin. occupations
Accountants & tax experts
Financial accounts managers
Actuaries, economists &statisticians; other bus. profs.
Finance & investment analysts
Mgt. consultants, bus. analysts& project managers
Other bus. associate profs.
Financial institution managers& directors
HR & industrial relationsofficers
HR managers
Brokers & insuranceunderwriters
Financial managers & directors
Financial accountingtechnicians
15-24 25-54 55+

National Skills Bulletin 2014 90 July 2014
Figure 8.4.4 Education Profile of Selected Business and Financial Occupations, Quarter 4 2013
Source: SLMRU (SOLAS) analysis of CSO data
Shortage Indicators In 2013, newly advertised vacancies were most frequent for persons with business and financial skills. The most frequent vacancy notifications were for financial clerks (fund, cost, accounts payable/receivable, payroll, credit control), accountants, analysts (financial, credit, pricing, risk), compliance and HR experts.
Many of the vacancies were arising due to labour market replacement and turnover. For
instance, in 2013, almost 4,500 financial clerks transitioned from employment into economic inactivity (retirement, study, home duties etc.); over 4,000 financial clerks and 2,000 accountants transitioned between employers.
Nonetheless, a significant share of vacancies was associated with growing demand for specialist financial and business skills. Many posts requiring these skills were difficult to fill, with over 300 non-EEA nationals with business and financial expertise recruited in 2013. Occupations for which shortages have been identified include:
accountants (financial, tax, compliance, solvency and rationalisation)
quantitative analysts, such as financial analysts, statisticians, economists, actuaries, risk analysts with expertise in data analysis, quantitative modelling, data visualisation, big data, web analytics, forecasting, evaluation and reporting
management consultants with expertise in organisational change (e.g. takeovers), resource planning (e.g. ERP) and performance management (e.g. Oracle and Hyperion, key performance indicators, dashboards)
multilingual financial clerks in credit control/debt recovery.
The outlook for job creation in business and financial occupations is favourable, with employment growth projected to be higher than average over the medium term. This is illustrated in recent job announcements for the financial services sector (e.g. Hedge Serv, Bank of Communications Financial Leasing), as well as other sectors (e.g. pharmaceuticals, ICT, etc.).
5% 42%
3%
16%
7%
13%
11%
19%
12%
20%
11%
30%
22%
28%
53%
97%
82%
91%
87%
88%
79%
86%
79%
89%
70%
76%
72%
0% 20% 40% 60% 80% 100%
Financial admin. occupations
Accountants & tax experts
Financial accounts managers
Actuaries, economists &statisticians
Finance & investment analysts
Mgt. consultants, bus. analysts& project mgrs.
Other bus. associate profs.
Financial institution managers& directors
HR & industrial relationsofficers
HR managers
Brokers & insuranceunderwriters
Financial managers & directors
Financial accountingtechnicians
Lower secondary or less Higher secondary or FET Third level

National Skills Bulletin 2014 91 July 2014
8.5 Healthcare Occupations In 2013, there were approximately
103,000 persons employed in healthcare occupations, representing 5.5% of total national employment
Almost 90% of overall employment in the selected occupations was at professional level (i.e. approximately 93,000 persons)
With approximately 57,000 persons employed, nurses and midwives had the third largest workforce in the economy as a whole, after sales assistants and farmers
Overall employment in the selected healthcare occupations increased by 2.1% on average annually over the period 2008 to 2013; the strongest average annual growth in employment was recorded for physiotherapists, at 12.1% (albeit from a relatively low level in 2008); this was followed by medical practitioners, with average annual growth of 8.3%; on the other hand, employment of pharmacists, occupational and other therapy professionals and nurses remained relatively static
Over that five-year period, there were a net 12,200 additional jobs created; the greatest share of which was for medical practitioners
Between 2012 and 2013, overall employment contracted by 0.5%
Just over four fifths of persons employed in healthcare occupations were aged 25-54
Over 90% and approximately 80% of those employed in healthcare professional and associate professional occupations held third level qualifications respectively
With the exception of medical practitioners, those employed in healthcare occupations were mostly female
Just over one quarter of all employed medical practitioners were non-Irish nationals ‒ one of the highest shares among all professional occupations in the national workforce.
Figure 8.5.1 Numbers Employed (000s) in Selected Healthcare Occupations, 2013
Source: SLMRU (SOLAS) analysis of CSO data
Figure 8.5.2 Average Annual Growth (%) in Selected Healthcare Occupations
Source: SLMRU (SOLAS) analysis of CSO data
Note: Growth rates associated with occupations where employment is comparatively small are less reliable due to a greater risk of sampling error.
3.1
3.1
3.8
10.4
12.2
14.0
56.8
0 20 40 60 80
Physiotherapists
Pharmacists
Occupational & other therapyprofs.
Health associate profs.
Other healthcare profs.
Medical practitioners
Nurses & midwives
0.2%
0.3%
12.1%
-0.3%
5.0%
5.7%
8.3%
-26.4%
-19.3%
-16.6%
-2.1%
0.0%
12.5%
16.6%
-40% -30% -20% -10% 0% 10% 20% 30%
Pharmacists
Occupational & other therapyprofs.
Physiotherapists
Nurses & midwives
Health associate profs.
Other healthcare profs.
Medical practitioners
2012-2013 2008-2013

National Skills Bulletin 2014 92 July 2014
Figure 8.5.3 Age Profile of Selected Healthcare Occupations, Quarter 4 2013
Source: SLMRU (SOLAS) analysis of CSO data
Figure 8.5.4 Education Profile of Selected Healthcare Occupations, Quarter 4 2013
Source: SLMRU (SOLAS) analysis of CSO data
Shortage Indicators Advertised vacancies for healthcare professionals were numerous in 2013. The most frequently advertised vacancies were for doctors, nurses (clinical, theatre, paediatric)
radiographers, clinical psychologists, pharmacists, radiographers, therapists (occupational, speech and language) and other healthcare professionals (e.g. dieticians).
Many of the vacancies arose due to intra-occupational movements (i.e. changes of employer). The recruitment controls in relation to permanent employment contracts in the publicly funded healthcare sector result in frequent movements of doctors and nurses between employers. In addition, over 2,000 transitions from employment to inactivity (i.e. retirement, home duties, education, etc.) were identified in 2013.
Although employment opportunities for healthcare workers remain limited reflecting the Government’s continued efforts to reduce public expenditure in the healthcare sector, shortages continue to persist for the following occupations:
doctors: general practitioners (GPs); non-consultant hospital doctors; this shortage should be alleviated once the additional supply of medical graduates, stemming from the implementation of the Fottrell Report (2006), emerges from the education system
nurses: advanced nurse practitioners and specialist nurses in the areas of intensive care, theatre, oncology, paediatrics and geriatric care
radiographers: computed tomography (CT), magnetic resonance imaging (MRI) and sonography.
Some of the current difficult to fill vacancies are filled by non-EEA candidates: 252 new employment permits were issued to non-EEA healthcare professionals in 2013, mostly doctors and nurses.
4%
5%
11%
81%
87%
79%
86%
91%
74%
91%
16%
10%
17%
9%
9%
15%
9%
0% 20% 40% 60% 80% 100%
Nurses & midwives
Medical practitioners
Other healthcare profs.
Health associate profs.
Therapy profs.
Pharmacists
Physiotherapists
15-24 25-54 55+
6%
18%
97%
99%
94%
80%
100%
97%
100%
0% 20% 40% 60% 80% 100%
Nurses & midwives
Medical practitioners
Other healthcare profs.
Health associate profs.
Therapy profs.
Pharmacists
Physiotherapists
Lower secondary or less Higher secondary or FET Third level

National Skills Bulletin 2014 93 July 2014
8.6 Education Occupations In 2013, there were approximately
119,000 persons employed in the selected education occupations, representing 6.3% of Ireland’s workforce
Just over 80% of overall employment was at professional level (mostly in primary and secondary school teaching)
Between 2008 and 2013, overall employment increased by 0.8% on average annually; employment of secondary teachers and teaching & other educational professionals grew by 5.5% and 5.1% on average annually respectively; in contrast, employment contracted for all other occupations
Between 2012 and 2013, overall employment grew by 2.2%, with a net 2,600 additional jobs created; the largest increase in employment was recorded for primary/nursery school teachers (2,700) while the largest decline was recorded for higher and further education teaching professionals (2,100)
One third of those employed as vocational and industrial trainers/instructors were aged 55 or older ─ one of the most mature associate professional workforces
Over 95% and approximately 70% of all persons employed at professional and associate professional level were third level graduates respectively; approximately 50% of all employed educational support assistants were third level graduates
Most of those employed in education occupations were female, the only exception was observed for higher and further education teaching professionals and vocational and industrial trainers/instructors ‒ their workforces were almost gender balanced.
Figure 8.6.1 Numbers Employed (000s) in Selected Education Occupations, 2013
Source: SLMRU (SOLAS) analysis of CSO data
Figure 8.6.2 Average Annual Growth (%) in Selected Education Occupations
Source: SLMRU (SOLAS) analysis of CSO data
Note: Growth rates associated with occupations where employment is comparatively small are less reliable due to a greater risk of sampling error.
7.8
10.7
13.6
14.4
31.5
40.9
0 10 20 30 40 50
Vocational & industrial trainers& instructors
Higher & further educationteaching profs.
Educational support assistants
Teaching & other educationalprofs.
Secondary teachers
Primary & nursery teachers
-1.5%
-3.0%
5.1%
-0.4%
5.5%
-1.3%
-16.7%
-2.6%
2.1%
3.8%
5.9%
7.1%
-30% -20% -10% 0% 10% 20%
Higher & further educationteaching profs.
Educational supportassistants
Teaching & other educationalprofs.
Vocational & industrialtrainers & instructors
Secondary teachers
Primary & nursery teachers
2012-2013 2008-2013

National Skills Bulletin 2014 94 July 2014
Figure 8.6.3 Age Profile of Selected Education Occupations, Quarter 4 2013
Source: SLMRU (SOLAS) analysis of CSO data
Figure 8.6.4 Education Profile of Selected Education Occupations, Quarter 4 2013
Source: SLMRU (SOLAS) analysis of CSO data
Shortage Indicators There is no evidence of shortages of teachers in Ireland at present. Employment opportunities remain limited, given the employment controls currently in place in the public sector.
A high level of labour market transitions has been identified for primary and secondary level teachers. These include exits from employment into inactivity (i.e. retirements and other forms of economic inactivity), as well as intra-occupational movements. Frequent changes of employer reflect the lack of permanent teaching contracts in the public sector.
The demand for teachers and trainers is expected to be primarily driven by demographic factors. An increase in the population of 5-12 (primary cycle) and 13-18 (secondary cycle) year-olds is expected in the medium term. The CSO projects that, between 2011 and 2021, the primary school age group will increase by 17-20%, while the secondary school age cohort expands by 31-34%, depending on the scenario considered.46 The extent to which these increases translate into employment will largely depend on Government policy.
46 Population and Labour Force Projections 2016-2046, CSO, 2013.
6%
8%
88%
88%
71%
82%
79%
59%
6%
10%
26%
16%
19%
33%
0% 20% 40% 60% 80% 100%
Primary & nurseryteachers
Secondary teachers
Teaching & othereducational profs.
Educational supportassistants
Higher & furthereducation teaching profs.
Vocational & industrialtrainers & instructors
15-24 25-54 55+
5%
6%
4%
1%
7%
45%
1%
25%
96%
99%
92%
50%
99%
69%
0% 20% 40% 60% 80% 100%
Primary & nurseryteachers
Secondary teachers
Teaching & othereducational profs.
Educational supportassistants
Higher & furthereducation teaching
profs.
Vocational & industrialtrainers & instructors
Lower secondary or less Higher secondary or FET Third level

National Skills Bulletin 2014 95 July 2014
8.7 Social and Care Occupations In 2013, there were approximately
100,000 persons employed in the selected social and care occupations, representing 5.3% of Ireland’s workforce
Approximately 51,000 persons were employed as care workers/home carers, accounting for just over 50% of overall employment in the selected occupations
Four fifths of total employment was concentrated in human health and social work activities
Between 2008 and 2013, overall employment in social and care occupations remained relatively static
Over the five-year period, employment of nursery nurses & assistants grew at the strongest pace, by 6.4% on average annually; in contrast, employment of child-minders contracted at the fastest pace, by 2.3% on average annually
The age profile of the workforce of child-minders was the youngest, with one quarter aged 15-24; in contrast, it was the most mature for social workers and welfare professionals, with over one quarter aged 55 or older
The workforce of social workers and welfare professionals had the highest level of educational attainment, with 96% attaining third level qualifications; in contrast, approximately one fifth of the workforces of both care workers/home cares; and caring personal services had attained lower secondary or less qualifications
The workforce of most social and care occupations was predominantly female
The share of those employed in most caring occupations who worked part-time was above the national average of 24%; at 60%, the highest share was for nursery
nurses while it was approximately 50% for both child-minders and care workers
Almost one quarter of the workforce of child-minders were non-Irish nationals, exceeding the national average of 14.9%.
Figure 8.7.1 Numbers Employed (000s) in Selected Social and Care Occupations, 2013
Source: SLMRU (SOLAS) analysis of CSO data
Figure 8.7.2 Average Annual Growth (%) in Selected Social and Care Occupations
Source: SLMRU (SOLAS) analysis of CSO data
Note: Growth rates associated with occupations where employment is comparatively small are less reliable due to a greater risk of sampling error.
3.6
6.2
6.4
6.6
8.8
17.0
50.9
0 20 40 60
Welfare & housing associateprofs.
Nursery nurses & assistants
Youth & community workers
Social workers & welfareprofs.
Caring personal services
Childminders, etc.
Care workers, home carers,etc.
-0.3%
1.2%
-2.3%
-1.2%
0.0%
0.6%
6.4%
-16.6%
-9.8%
-7.5%
1.0%
1.3%
14.1%
14.5%
-30% -20% -10% 0% 10% 20%
Welfare & housing associateprofs.
Caring personal services
Childminders, etc.
Social workers & welfareprofs.
Care workers, home carers,etc.
Youth & community workers
Nursery nurses & assistants
2012-2013 2008-2013

National Skills Bulletin 2014 96 July 2014
Figure 8.7.3 Age Profile of Selected Social and Care Occupations, Quarter 4 2013
Source: SLMRU (SOLAS) analysis of CSO data
Figure 8.7.4 Education Profile of Selected Social and Care Occupations, Quarter 4 2013
Source: SLMRU (SOLAS) analysis of CSO data
Shortage Indicators In 2013, advertised vacancies were frequent for care workers, home carers and childcare workers. Many of the advertised vacancies were for part-time positions.
The data for 2013 indicates that care and childcare occupations were amongst occupations with the highest number of transitions between employment, unemployment and inactivity. These occupations also had higher than average, replacement and intra-occupational turnover rates. In 2013, over 8,000 transitions from employment to inactivity were observed for care workers and just under 3,000 for child-minders. At the same time, over 3,000 transitions between employers were observed for care workers and a similar level of intra-occupational movement was identified for child-minders.
While there are no shortages of carers at present, it is recognised that some employers may be experiencing difficulty in attracting and retaining qualified care and child-care workers.
While employment in publicly funded care is likely to continue to be negatively affected by the on-going fiscal austerity, some job creation has recently been announced in the private sector (e.g. Irish Homecare).
The demand for care workers is expected to grow due to demographic factors. The CSO projects that by 2046, the population aged 65 and over could represent up to 28% of the total population, compared with 12% in 2011. The population aged 80 years and older is projected to rise even more dramatically, increasing from 128,000 in 2011 to up to half a million by 2046.47 The extent to which this translates into employment growth will largely depend on Government policy.
47 Population and Labour Force Projections 2016-2046, CSO, 2013.
8%
27%
7%
68%
65%
76%
69%
74%
88%
84%
24%
8%
17%
28%
26%
9%
16%
0% 20% 40% 60% 80% 100%
Care workers, home carersetc.
Childminders, etc.
Caring personal services
Social workers & welfareprofs.
Youth & communityworkers
Nursery nurses &assistants
Welfare & housingassociate profs.
15-24 25-54 55+
21%
19%
14%
8%
48%
58%
52%
4%
12%
60%
25%
31%
38%
29%
96%
74%
32%
75%
0% 20% 40% 60% 80% 100%
Care workers, home carers,etc.
Childminders, etc.
Caring personal services
Social workers & welfareprofs.
Youth & community workers
Nursery nurses & assistants
Welfare & housing associateprofs.
Lower secondary or less Higher secondary or FET Third level

National Skills Bulletin 2014 97 July 2014
8.8 Legal and Security Occupations In 2013, there were approximately 37,000
persons employed in legal and security occupations, representing 2% of total national employment
Employment was concentrated in two sectors: approximately 70% was in public administration and defence, while a further 25% was in professional, scientific and technical activities
Overall employment in legal and security occupations increased from 38,000 in 2008 to approximately 43,000 in 2010, but then declined in the subsequent three years, reverting back to the 2008 level in 2013
Between 2012 and 2013, employment contracted by 6.6%, in contrast to positive national average growth of 2.4%; employment contracted for all occupations, although it was very modest for army personnel and Gardaí in absolute terms
Most of those employed in legal and security occupations were aged 25-54
Almost all persons employed as legal professionals (i.e. barristers, judges solicitors and related legal professionals) had attained third level qualifications; in contrast, just over one fifth of all employed army personnel had lower secondary or less qualifications
The majority of those employed in most legal and security occupations were Irish males who worked full-time.
Figure 8.8.1 Numbers Employed (000s) in Selected Legal and Security Occupations, 2013
Source: SLMRU (SOLAS) analysis of CSO data
Figure 8.8.2 Average Annual Growth (%) in Selected Legal and Security Occupations
Source: SLMRU (SOLAS) analysis of CSO data
Note: Growth rates associated with occupations where employment is comparatively small are less reliable due to a greater risk of sampling error.
6.0
6.6
11.0
13.5
0 5 10 15
Protective serviceoccupations
Army personnel
Barristers, judges, solicitors &related profs.
Gardai
-2.2%
0.8%
-0.9%
0.3%
-9.9%
-8.6%
-7.2%
-2.9%
-20% -10% 0% 10%
Protective serviceoccupations
Barristers, judges, solicitors& related profs.
Army personnel
Gardai
2012-2013 2008-2013

National Skills Bulletin 2014 98 July 2014
Figure 8.8.3 Age Profile of Selected Legal and Security Occupations, Quarter 4 2013
Source: SLMRU (SOLAS) analysis of CSO data
Figure 8.8.4 Education Profile of Selected Legal and Security Occupations, Quarter 4 2013
Source: SLMRU (SOLAS) analysis of CSO data
Shortage Indicators There is currently no shortage of legal and security skills in Ireland.
7%
97%
86%
80%
94%
3%
13%
13%
6%
0% 20% 40% 60% 80% 100%
Gardaí
Barristers, judges,solicitors & related
profs.
Army personnel
Protective serviceoccupations
15-24 25-54 55+
22%
10%
16%
2%
56%
50%
84%
98%
22%
40%
0% 20% 40% 60% 80% 100%
Gardaí
Barristers, judges, solicitors& related profs.
Army personnel
Protective serviceoccupations
Lower secondary or less Higher secondary or FET Third level

National Skills Bulletin 2014 99 July 2014
8.9 Construction Professional and Associate Professional Occupations In 2013, there were approximately 19,000
persons employed in the selected construction professional and associate professional occupations, representing 1% of Ireland’s workforce
Approximately 83% of employment was at professional level; the remainder was at associate professional level (i.e. construction related technicians)
Almost 60% of employment was concentrated in professional, scientific and technical activities (mostly in architectural and engineering activities), while a further 12% was in construction
Between 2008 and 2013, employment in the selected occupations contracted at an average annual rate of 6.8%, compared to the national average rate of 2.4%
While employment contracted for all occupations over the five-year period, the strongest pace of contraction was recorded for architects and town planners followed by civil engineers, with average annual rates of 12.3% and 6.8% respectively; in absolute terms, overall employment contracted by 8,000 between 2008 and 2013, with the largest decreases recorded for architects and town planners and civil engineers
Between 2012 and 2013, employment contracted by 7% (almost 2,000 net job losses), with the most pronounced decline for the architectural technologists group
Over four fifths of all persons employed in both construction professional and associate professional occupations were aged 25-54; the age profile of employed architects and town planners was the most mature, with 14% aged 55 and over
Just over 95% of persons employed in construction professional occupations
were third level graduates; the share was 77% for those employed in associate professional occupations
Approximately 83% of those employed in the selected occupations were male, well above the national average of 54%; at 30%, architects and town planners had the highest share of females; this group also had the highest share of persons who worked part-time.
Figure 8.9.1 Numbers Employed (000s) in Selected Construction Professional and Associate Professional Occupations, 2013
Source: SLMRU (SOLAS) Analysis of CSO data Figure 8.9.2 Average Annual Growth (%) in Selected Construction Professional and Associate Professional Occupations
Source: SLMRU (SOLAS) Analysis of CSO data
Note: Growth rates associated with occupations where employment is comparatively small are less reliable due to a greater risk of sampling error.
3.2
3.8
4.7
7.2
0 2 4 6 8
Construction relatedtechnicians
Architects & town planners
Architectural technologists,construction project
managers & surveyors
Civil engineers
-6.8%
-12.3%
-1.3%
-5.7%
-2.9%
-11.9%
-18.4%
12.9%
-30% -20% -10% 0% 10% 20%
Civil engineers
Architects & town planners
Architectural technologists,construction project managers
& surveyors
Construction relatedtechnicians
2012-2013 2008-2013

National Skills Bulletin 2014 100 July 2014
Figure 8.9.3 Age Profile of Selected Construction Professional and Associate Professional Occupations, Quarter 4 2013
Source: SLMRU (SOLAS) analysis of CSO data
Figure 8.9.4 Education Profile of Selected Construction Professional and Associate Professional Occupations, Quarter 4 2013
Source: SLMRU (SOLAS) analysis of CSO data
Shortage Indicators Strong growth in absolute and relative terms is expected for construction, as this sector emerges from the lows to which it had fallen following the financial crisis and the bursting of the housing bubble. Despite the strong growth anticipated in the medium term, employment is not expected to reach the levels recorded in 2007 by 2020.
The initial impetus for growth in construction is expected to arise from expansion in other sectors, namely bio-pharma/medical and ICT. The construction of facilities for these sectors (e.g. HP, IBM, Ethicon Biosurgery Ireland, etc.), will create demand for construction skills at all levels. As the economic recovery gathers pace and consumer confidence improves - aided by recent Government initiatives (e.g. the ‘help-to-buy scheme’) - growth will also emerge in the residential construction sector. Indications of growth are evident in the recently observed increase in the recruitment of apprentices and a stronger performance from the property market.
While the skills overhang from the recessionary period is sufficient to meet current demand, shortages may emerge in the medium term. Indeed, there are already some indications of shortages of construction and property surveyors.
10%
4%
86%
88%
85%
88%
14%
2%
11%
12%
0% 20% 40% 60% 80% 100%
Architects & townplanners
Architecturaltechnologists,
construction projectmgrs. & surveyors
Civil engineers
Construction relatedtechnicians
15-24 25-54 55+
3%
5%
23%
97%
97%
94%
77%
0% 20% 40% 60% 80% 100%
Architects & town planners
Architectural technologists,construction mgrs. &
surveyors
Civil engineers
Construction relatedtechnicians
Lower secondary or less Higher secondary or FET Third level

National Skills Bulletin 2014 101 July 2014
8.10 Construction Craft Occupations In 2013, there were approximately 54,000
persons employed in construction craft occupations, representing 2.9% of Ireland’s workforce
Just over 80% of overall employment in construction craft occupations was concentrated in construction
Between 2008 and 2013, employment in construction craft occupations contracted by 16.6% on average annually or 81,000 persons, seven times faster than the national average rate
Over the five-year period, employment contracted in each occupation; the sharpest rates of decline were recorded for plasterers and bricklayers, at 24.9% and 21.5% on average annually respectively ─ the fastest rates of decline among all occupations in the national workforce; the largest absolute decreases in employment were recorded for carpenters and joiners; other construction trades and plasterers
Between 2012 and 2013, overall employment increased by 3.6%, with almost a net 2,000 additional jobs, reversing the downward trend recorded since 2007; the largest absolute increase in employment was recorded for other construction trades
At 70% and over, most of those employed in each occupation was aged 25-54; the age profile of plumbers was the youngest, with 14% aged 15-24; in contrast, it was the most mature for other construction trades, at almost one quarter
Approximately 66% of all persons employed in the selected occupations held higher secondary/FET qualifications, while 22% held lower secondary or less qualifications ─ both shares exceeding the national average
Employment in most occupations was exclusively male
Approximately one fifth of all employed painters and decorators, bricklayers and plasterers worked part-time ─ the highest share among the selected occupations
In quarter 4 2013, the unemployment rate for construction craft workers was 30.4% ─ over two and a half times the national average rate of 11.7%; at 49.2%, the rate for bricklayers was the highest among all occupations in the national labour force.
Figure 8.10.1 Numbers Employed (000s) in Selected Construction Craft Occupations, 2013
Source: SLMRU (SOLAS) analysis of CSO data
Figure 8.10.2 Average Annual Growth (%) in Selected Construction Craft Occupations
Source: SLMRU (SOLAS) analysis of CSO data
Note: Growth rates associated with occupations where employment is comparatively small are less reliable due to a greater risk of sampling error.
3.0
3.4
5.5
8.5
13.9
20.0
0 5 10 15 20 25
Plasterers
Bricklayers
Painters & decorators
Plumbers
Carpenters & joiners
Other construction trades
-15.2%
-21.5%
-10.3%
-19.0%
-24.9%
-12.8%
13.0%
-8.5%
7.7%
-4.8%
-20.1%
16.2%
-40% -20% 0% 20%
Other construction trades
Bricklayers
Plumbers
Carpenters & joiners
Plasterers
Painters & decorators
2012-2013 2008-2013

National Skills Bulletin 2014 102 July 2014
Figure 8.10.3 Age Profile of Selected Construction Craft Occupations, Quarter 4 2013
Source: SLMRU (SOLAS) analysis of CSO data
Figure 8.10.4 Education Profile of Selected Construction Craft Occupations, Quarter 4 2013
Source: SLMRU (SOLAS) analysis of CSO data
Shortage Indicators Strong anticipated growth in construction activity over the medium term will create demand for construction craft skills. Initially, job opportunities will arise due to the construction of facilities to accommodate expansion in the bio-pharma and ICT sectors (e.g. HP, IBM, Ethicon Biosurgery Ireland, etc.). These activities are already creating strong demand for some construction craft skills, such as industrial plumbers. However, the demand for most construction craft skills will be more pronounced when the recovery in residential development gathers pace, given the greater labour intensity of this sub-sector.
Following a number of very quiet years, vacancies advertised for plumbers, painters and carpenters were on the rise in 2013. Many of those vacancies were due to replacement and turnover demand. For example, the replacement rate based on retirements was above average for painters and decorators, while the turnover rate was above average for carpenters. Nonetheless, it is likely that some vacancies were also due to an increase in construction activity.
While no shortage of construction skills have been identified at present and an overhang of these skills still exists, the demand and supply of tradespersons should be closely monitored.
7%
14%
2%
3%
76%
77%
71%
84%
81%
80%
23%
16%
15%
15%
17%
17%
0% 20% 40% 60% 80% 100%
Other cons. trades
Carpenters, joiners
Plumbers
Painters, decorators
Plasterers
Bricklayers
15-24 25-54 55+
29%
15%
12%
22%
25%
32%
55%
80%
72%
64%
66%
62%
16%
5%
16%
14%
9%
6%
0% 20% 40% 60% 80% 100%
Other cons. trades
Carpenters, joiners
Plumbers
Painters, decorators
Plasterers
Bricklayers
Lower secondary or less Higher secondary or FET Third level

National Skills Bulletin 2014 103 July 2014
8.11 Other Craft Occupations In 2013, there were approximately
106,000 persons employed in other craft occupations, representing 5.6% of Ireland’s workforce
Approximately two thirds of overall employment was concentrated in three sectors: manufacturing (33%), wholesale and retail (20%) and construction (14%)
Three quarters of overall employment was concentrated in three trades: electrical/electronic (33%); metal machining, fitting and instrument making (24%) and vehicle (18%)
Between 2008 and 2013, employment in other craft occupations contracted by 6.2% on average annually, compared to the national average rate of 2.4%; with the exception of butchers, fishmongers and related trades, employment in each occupation decreased; the most rapid declines were observed for other skilled trades and electrical and electronic trades, at 10.1% and 9.1% on average annually respectively
Over the five-year period, there were approximately 40,000 net job losses ─ the largest absolute decrease in employment was observed for electrical and electronic trades
Overall employment in 2013 was the same as the 2012 level; employment levels for most occupations remained relatively static during that year
Just over 75% of all persons employed in the selected occupations was aged 25-54
Approximately 56% of all persons employed in the selected occupations held higher secondary/FET qualifications, exceeding the national average of 37%; however, 27% held third level qualifications — considerably below the national average of 47%; the share of
third level graduates varied across the occupations: 42% of those employed in electrical and electronic trades held third level qualifications (within this category almost 90% of computer repair and maintenance engineers held third level qualifications); in contrast, the share was only 10% for butchers, fishmongers and related trades
Almost 40% of overall employment for butchers, fishmongers and related trades was composed of non-Irish nationals — one of the highest shares among skilled trades in the national workforce
The overall workforce of most occupations was predominatly male.
Figure 8.11.1 Numbers Employed (000s) in Selected Other Craft Occupations, 2013
Source: SLMRU (SOLAS) analysis of CSO data
4.2
7.1
7.8
8.3
18.8
25.2
34.6
0 10 20 30 40
Printing trades
Other skilled trades
Metal forming, welding &related trades
Butchers, fishmongers, etc.
Vehicle trades
Metal machining, fitting &instrument making trades
Electrical & electronic trades,etc.

National Skills Bulletin 2014 104 July 2014
Figure 8.11.2 Average Annual Growth (%) in Selected Other Craft Occupations
Source: SLMRU (SOLAS) analysis of CSO data
Note: Growth rates associated with occupations where employment is comparatively small are less reliable due to a greater risk of sampling error.
Figure 8.11.3 Age Profile of Selected Other Craft Occupations, Quarter 4 2013
Source: SLMRU (SOLAS) analysis of CSO data
Figure 8.11.4 Education Profile of Selected Other Craft Occupations, Quarter 4 2013
Source: SLMRU (SOLAS) analysis of CSO data
Shortage Indicators In 2013, vacancies were numerous for electricians (industrial), fitters, toolmakers and welders. Some of the vacancies have been identified as difficult to fill, with a shortage particularly evident for:
tool makers – recent developments in tool making technology have enabled many Irish based companies to successfully compete for contracts previously outsourced to low cost locations; this, accompanied with the strong performance of the medical devices and pharmaceutical sectors, has created demand for tradespersons with expertise in making highly complex, regulated and precise tools; this has also been illustrated by an upsurge in the recruitment of apprentices in this craft
-10.1%
-5.9%
-9.1%
-8.5%
-3.8%
3.8%
-3.9%
-19.1%
-7.5%
-2.5%
0.7%
1.3%
6.1%
9.8%
-30% -20% -10% 0% 10% 20%
Other skilled trades
Printing trades
Electrical & electronic trades,etc.
Metal forming, welding &related trades
Vehicle trades
Butchers, fishmongers, etc.
Metal machining, fitting &instrument making trades
2012-2013 2008-2013
7%
6%
13%
2%
8%
10%
3%
78%
77%
73%
75%
81%
77%
74%
15%
17%
14%
23%
11%
13%
23%
0% 20% 40% 60% 80% 100%
Electrical &electrical trades,
etc.
Metal machining,fitting & instrument
making trades
Vehicle trades
Other skilled trades
Butchers,fishmongers, etc.
Metal forming,welding etc.
Printing trades
15-24 25-54 55+
8%
19%
12%
23%
34%
21%
32%
50%
50%
74%
54%
56%
66%
46%
42%
31%
14%
23%
10%
13%
22%
0% 20% 40% 60% 80% 100%
Electrical & electronic trades,etc.
Metal machining, fitting &instrument making
Vehicle trades
Other skilled trades
Butchers, fishmongers, etc.
Metal forming, welding etc.
Printing trades
Lower secondary or less Higher secondary or FET Third level
National Skills Bulletin 2014 105 July 2014
welders (tungsten inert gas (TIG) and metal inert gas (MIG)) – specialised welding skills are required across many sectors, including, utilities, high tech and traditional manufacturing, as well as construction activity associated with the expansion of facilities for high technology sectors.
The strong anticipated growth in the construction sector will result in a strong demand for electricians, welders and other craft workers.
While no shortages of meat processing skills have been identified, it is recognised that many food processing companies are experiencing difficulty in attracting and retaining skilled butchers/de-boners.
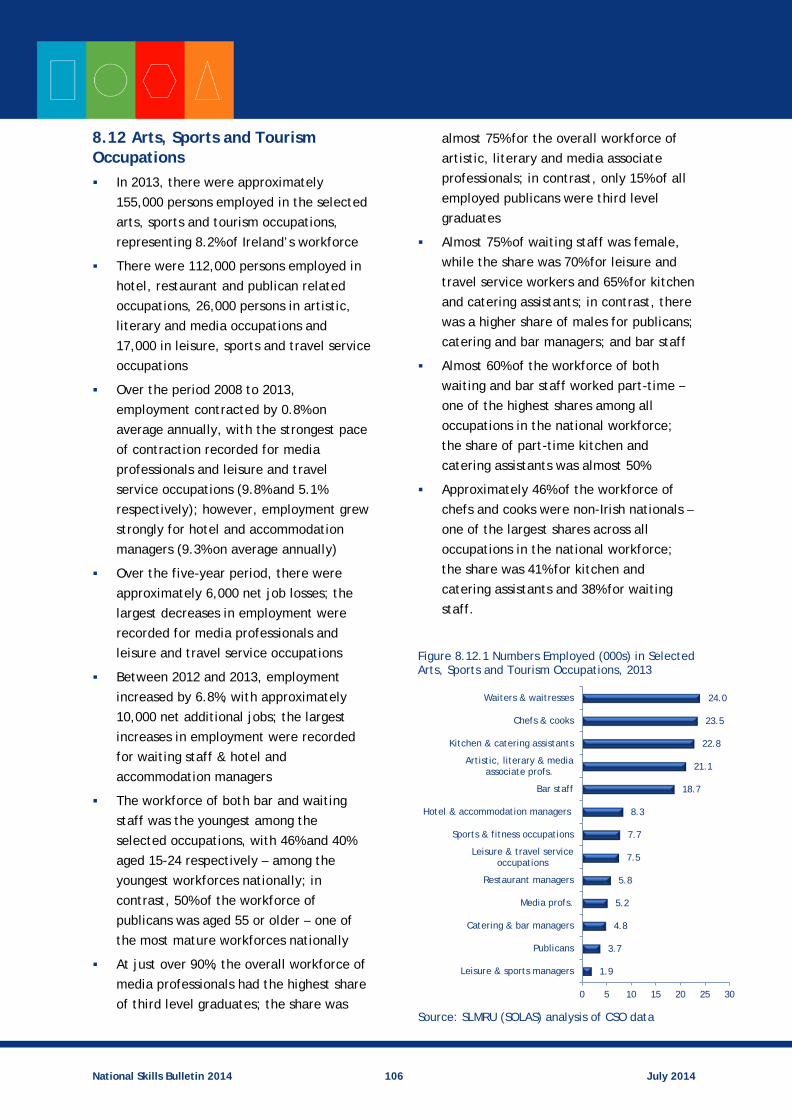
National Skills Bulletin 2014 106 July 2014
8.12 Arts, Sports and Tourism Occupations In 2013, there were approximately
155,000 persons employed in the selected arts, sports and tourism occupations, representing 8.2% of Ireland’s workforce
There were 112,000 persons employed in hotel, restaurant and publican related occupations, 26,000 persons in artistic, literary and media occupations and 17,000 in leisure, sports and travel service occupations
Over the period 2008 to 2013, employment contracted by 0.8% on average annually, with the strongest pace of contraction recorded for media professionals and leisure and travel service occupations (9.8% and 5.1% respectively); however, employment grew strongly for hotel and accommodation managers (9.3% on average annually)
Over the five-year period, there were approximately 6,000 net job losses; the largest decreases in employment were recorded for media professionals and leisure and travel service occupations
Between 2012 and 2013, employment increased by 6.8%, with approximately 10,000 net additional jobs; the largest increases in employment were recorded for waiting staff & hotel and accommodation managers
The workforce of both bar and waiting staff was the youngest among the selected occupations, with 46% and 40% aged 15-24 respectively ─ among the youngest workforces nationally; in contrast, 50% of the workforce of publicans was aged 55 or older ─ one of the most mature workforces nationally
At just over 90%, the overall workforce of media professionals had the highest share of third level graduates; the share was
almost 75% for the overall workforce of artistic, literary and media associate professionals; in contrast, only 15% of all employed publicans were third level graduates
Almost 75% of waiting staff was female, while the share was 70% for leisure and travel service workers and 65% for kitchen and catering assistants; in contrast, there was a higher share of males for publicans; catering and bar managers; and bar staff
Almost 60% of the workforce of both waiting and bar staff worked part-time ‒ one of the highest shares among all occupations in the national workforce; the share of part-time kitchen and catering assistants was almost 50%
Approximately 46% of the workforce of chefs and cooks were non-Irish nationals ─ one of the largest shares across all occupations in the national workforce; the share was 41% for kitchen and catering assistants and 38% for waiting staff.
Figure 8.12.1 Numbers Employed (000s) in Selected Arts, Sports and Tourism Occupations, 2013
Source: SLMRU (SOLAS) analysis of CSO data
1.9
3.7
4.8
5.2
5.8
7.5
7.7
8.3
18.7
21.1
22.8
23.5
24.0
0 5 10 15 20 25 30
Leisure & sports managers
Publicans
Catering & bar managers
Media profs.
Restaurant managers
Leisure & travel serviceoccupations
Sports & fitness occupations
Hotel & accommodation managers
Bar staff
Artistic, literary & mediaassociate profs.
Kitchen & catering assistants
Chefs & cooks
Waiters & waitresses

National Skills Bulletin 2014 107 July 2014
Figure 8.12.2 Average Annual Growth (%) in Selected Arts, Sports and Tourism Occupations
Source: SLMRU (SOLAS) analysis of CSO data
Note: Growth rates associated with occupations where employment is comparatively small are less reliable due to a greater risk of sampling error.
Figure 8.12.3 Age Profile of Selected Arts, Sports and Tourism Occupations, Quarter 4 2013
Source: SLMRU (SOLAS) analysis of CSO data
0.1%
-5.1%
-0.1%
0.2%
-0.9%
1.8%
-1.5%
-2.5%
-1.4%
-1.5%
1.0%
-9.8%
9.3%
-29.2%
-11.1%
-5.7%
1.4%
1.9%
3.0%
6.5%
7.3%
8.3%
9.9%
13.7%
18.1%
44.7%
-40% -20% 0% 20% 40% 60%
Leisure & sports managers
Leisure & travel serviceocc.
Catering & bar managers
Chefs & cooks
Restaurant managers
Sports & fitness occ.
Kitchen & catering assist.
Publicans
Artistic, literary & mediaassociate profs.
Bar staff
Waiters & waitresses
Media profs.
Hotel & accommodationmanagers
2012-2013 2008-2013
10%
19%
40%
5%
46%
15%
15%
4%
6%
4%
6%
4%
83%
67%
58%
79%
48%
81%
83%
67%
76%
81%
81%
50%
67%
7%
14%
2%
16%
6%
4%
2%
29%
18%
15%
13%
50%
29%
0% 20% 40% 60% 80% 100%
Chefs & cooks
Kitchen & cateringassist.
Waiters & waitresses
Artistic associateprofs.
Bar staff
Leisure & travel occ.
Sports & fitness occ.
Hotel &accommodation
managers
Restaurantmanagers
Catering & barmanagers
Media profs.
Publicans
Leisure & sportsmanag.
15-24 25-54 55+

National Skills Bulletin 2014 108 July 2014
Figure 8.12.4 Education Profile of Selected Arts, Sports and Tourism Occupations, Quarter 4 2013
Source: SLMRU (SOLAS) analysis of CSO data
Shortage Indicators In 2013, vacancies for chefs were numerous. However, there is no indication of shortages of culinary skills at present, although it is recognised that some employers may be experiencing difficulty in attracting and retaining chefs. The turnover rate for this occupation is above average, indicating frequent changes of employer. Sourcing from outside the EEA continues for the ethnic
cuisine niche, with 90 employment permits issued to non-EEA chefs in 2013.
Higher than average replacement and intra-occupational turnover rates have been identified for waiters, bar staff and catering assistants.
No skill shortages have been identified in the areas of arts and sport.
9%
29%
16%
4%
16%
2%
7%
10%
12%
13%
35%
9%
46%
52%
53%
22%
56%
41%
25%
46%
45%
50%
9%
50%
20%
45%
19%
31%
74%
28%
57%
68%
44%
43%
37%
91%
15%
71%
0% 20% 40% 60% 80% 100%
Chefs & cooks
Kitchen & cateringassist.
Waiters & waitresses
Artistic associateprofs.
Bar staff
Leisure & travel occ.
Sports & fitness occ.
Hotel & accomm.manag.
Restaurant managers
Catering & barmanagers
Media profs.
Publicans
Leisure & sportsmanag.
Lower secondary or less Higher secondary or FET Third level

National Skills Bulletin 2014 109 July 2014
8.13 Transport and Logistics Occupations In 2013, there were approximately 88,000
persons employed in transport and logistics occupations, representing 4.7% of Ireland’s workforce
By far the largest number of persons (58,000) were employed as road transport operatives (mostly taxi and large goods vehicle drivers), accounting for two thirds of total employment
While overall employment in the selected occupations contracted by 5.7% on average annually over the period 2008 to 2013 (translating into approximately 30,000 net job losses), it was relatively static between 2012 and 2013
Between 2008 and 2013, the fastest pace of contraction in employment was observed for mobile machine drivers and operatives (12.6% on average annually) and road transport operatives (5.7% on average annually); in contrast, the strongest growth was observed for aircraft pilots, ship officers and air traffic controllers, albeit from a relatively low level in 2008
The age profile of those employed as road transport operatives was the most mature, with almost 30% aged 55 or older ‒ one of the highest share of older workers among all occupations in the national workforce
The education profile of those employed in the selected transport and logistics occupations was skewed towards lower levels of educational attainment; only 15% held third level qualifications ─ considerably below the national average of 47%, while almost 40% held lower secondary or less qualifications and 46% held higher secondary/FET qualifications
─ both shares exceeding the respective national averages
With the exception of those employed in administrative occupations in stock control, transport and distribution, employment in each occupation was predominantly male.
Figure 8.13.1 Numbers Employed (000s) in Selected Transport and Logistics Occupations, 2013
Source: SLMRU (SOLAS) analysis of CSO data
Figure 8.13.2 Average Annual Growth (%) in Selected Transport and Logistics Occupations
Source: SLMRU (SOLAS) analysis of CSO data
Note: Growth rates associated with occupations where employment is comparatively small are less reliable due to a greater risk of sampling error.
2.5
5.0
5.5
6.7
10.7
57.6
0 10 20 30 40 50 60
Aircraft pilots, ship officers, airtraffic controllers
Other drivers & transportoperatives
Stock control, transport &distribution admin. occupations
Managers & directors intransport & logistics
Mobile machine drivers &operatives
Road transport operatives
-3.8%
-0.9%
-12.6%
-5.7%
15.6%
1.2%
-10.3%
-6.8%
-2.5%
0.9%
7.7%
20.5%
-30% -20% -10% 0% 10% 20% 30%
Stock control, transport &distribution admin. occupations
Managers & directors in transport& logistics
Mobile machine drivers &operatives
Road transport operatives
Aircraft pilots, ship officers, airtraffic controllers
Other drivers & transportoperatives
2012-2013 2008-2013

National Skills Bulletin 2014 110 July 2014
Figure 8.13.3 Age Profile of Selected Transport and Logistics Occupations, Quarter 4 2013
Source: SLMRU (SOLAS) analysis of CSO data
Figure 8.13.4 Education Profile of Selected Transport and Logistics Occupations, Quarter 4 2013
Source: SLMRU (SOLAS) analysis of CSO data
Shortage Indicators In 2013, vacancies were most frequent for
logistics managers (warehousing and supply chain)
transport and logistics clerks (e.g. supply chain, freight, stock control and co-ordination)
road transport drivers (large goods vehicle, bus/coach, taxi, deliveries)
fork-lift truck drivers (reach, counterbalance and power pallet trucks).
Many vacancies, particularly for drivers, were arising due to replacement demand and turnover. For instance, in 2013, taxi drivers frequently changed employers and the replacement rate in this occupation was above average.
Nonetheless, some vacancies were difficult to fill, particularly for
multilingual supply chain and logistics managers and clerks
heavy goods vehicle drivers (with E+ and C1 licence)
forklift drivers (with very narrow aisle (VNA) and/or turret licence; Reach Truck, Stand-up and Electrical Pallet Jack Operators).
The transport sector is expected to grow above average in the medium term. As an enabler of movement of goods nationally and internationally, the transport sector will benefit from the expansion in the exporting and domestically traded sectors of the Irish economy. Job creation is illustrated in recent job announcements (e.g. SEKO MedTec/Sutherland Global Logistics).
2%
8%
17%
5%
70%
80%
88%
74%
80%
88%
28%
12%
11%
9%
15%
12%
0% 20% 40% 60% 80% 100%
Road transport operatives
Mobile machine drivers &operatives
Managers & directors intransport & logistics
Stock control, transport &distribution admin.
Other drivers & transportoperatives
Aircraft pilots, ship officers, airtraffic controllers
15-24 25-54 55+
45%
48%
19%
13%
28%
45%
44%
50%
55%
53%
26%
10%
8%
31%
32%
19%
74%
0% 20% 40% 60% 80% 100%
Road transport operatives
Mobile machine drivers &operatives
Managers & directors intransport & logistics
Stock control, transport &distribution admin.
Other drivers & transportoperatives
Aircraft pilots, ship officers,air traffic controllers
Lower secondary or less Higher secondary or FET Third level

National Skills Bulletin 2014 111 July 2014
8.14 Administrative and Secretarial Occupations In 2013, there were approximately
145,000 persons employed in administrative and secretarial occupations, accounting for 7.8% of Ireland’s workforce
At almost 25%, the highest share of employment was concentrated in public administration, while the remainder was distributed across all other sectors
Between 2008 and 2013, overall employment in the selected occupations contracted by 4.6% on average annually; with the exception of records and library clerks, employment decreased for all occupations ‒ the fastest rate of decline was recorded for personal assistants (PAs) and other secretaries; and receptionists, each decreasing by 7% on average annually; overall employment of records and library clerks expanded by 5.8% on average annually
Over the five-year period, employment decreased by approximately 40,000; the largest absolute declines were recorded for government administrative occupations and PAs & other secretarial occupations
Between 2012 and 2013, however, employment expanded by 1.6%, resulting in approximately 2,000 net additional jobs; the largest absolute increase in employment was observed for other administrators, while the largest absolute decrease was observed for government administrative occupations
At least 66% of those employed in each occupation was aged 25-54; those employed as receptionists were the youngest, with 17% aged 15-24, which was double the national share
With the exception of records and library clerks and office managers and supervisors, the share of persons employed in each occupation with third level qualifications was below the national average
At least 70% of those employed in each occupation was female
The prevalence of part-time work was the highest for receptionists and PAs and other secretaries, with 46% and 40% of all persons employed in those occupations working part-time.
Figure 8.14.1 Numbers Employed (000s) in Selected Administrative and Secretarial Occupations, 2013
Source: SLMRU (SOLAS) analysis of CSO data
Figure 8.14.2 Average Annual Growth (%) in Selected Administrative & Secretarial Occupations
Source: SLMRU (SOLAS) analysis of CSO data
Note: Growth rates associated with occupations where employment is comparatively small are less reliable due to a greater risk of sampling error.
4.3
7.2
11.0
29.1
37.1
58.8
0 10 20 30 40 50 60 70
Records & library clerks etc.
Office managers & supervisorsadmin. occupations
Receptionists
PAs & other secretaries, etc.
Government admin.occupations
Other administrators
-6.9%
-6.4%
-7.1%
-3.0%
-2.3%
5.8%
-11.9%
-9.2%
-4.0%
7.5%
14.3%
26.8%
-40% -20% 0% 20% 40%
Receptionists
Government admin.occupations
PAs & other secretaries, etc.
Office managers & supervisorsadmin. occupations
Other administrators
Records & library clerks etc.
2012-2013 2008-2013

National Skills Bulletin 2014 112 July 2014
Figure 8.14.3 Age Profile of Selected Administrative and Secretarial Occupations, Quarter 4 2013
Source: SLMRU (SOLAS) analysis of CSO data
Figure 8.14.4 Education Profile of Selected Administrative and Secretarial Occupations, Quarter 4 2013
Source: SLMRU (SOLAS) analysis of CSO data
Shortage Indicators There is currently no shortage of general clerks in Ireland. Higher than average intra-occupational turnover rates have been identified for general admin workers and receptionists.
6%
1%
2%
17%
3%
77%
79%
78%
67%
86%
74%
17%
20%
20%
16%
14%
23%
0% 20% 40% 60% 80% 100%
Other administrators
Government admin.occupations
PAs & othersecretaries etc.
Receptionists
Office managers &supervisors
Records & libraryclerks etc.
15-24 25-54 55+
8%
4%
3%
7%
5%
13%
49%
54%
63%
64%
38%
35%
43%
42%
34%
29%
57%
52%
0% 20% 40% 60% 80% 100%
Other administrators
Government admin.occupations
PAs & othersecretaries etc.
Receptionists
Office managers &supervisors
Records & libraryclerks etc.
Lower secondary or less Higher secondary or FET Third level

National Skills Bulletin 2014 113 July 2014
8.15 Sales and Customer Service Occupations In 2013, there were approximately
220,000 persons employed in sales and customer service occupations, representing 11.7% of Ireland’s workforce
With 128,000 persons employed, ‘sales assistants’ was the largest occupation in the national workforce
Between 2008 and 2013, overall employment in the selected occupations contracted by 1.2% on average annually, compared to the national average rate of decline of 2.4%; within this occupational group, most of the decrease was observed for sales assistants while employment actually increased for sales accounts & business development managers; customer service occupations; and advertising, marketing & sales directors
Between 2012 and 2013, however, overall employment increased by 0.8% or approximately 2,000
Just over one quarter of all employed sales assistants was aged 15-24 ─ the youngest workforce among the selected occupations
Almost 50% of all persons employed in the selected occupations held higher secondary/FET qualifications, while almost 40% held third level qualifications and 15% held lower secondary or less qualifications
Approximately 70% of all employed sales assistants was female, the highest share among the selected occupations; at two thirds each, it was also higher than the national average for sales supervisors and customer service occupations
Approximately 56% of all employed sales assistants worked part-time ─ one of the highest shares among all occupations in the national workforce
▪ One quarter of all employed sales supervisors were non-Irish nationals, while the corresponding share was one fifth for sales assistants.
Figure 8.15.1 Numbers Employed (000s) in Selected Sales and Customer Service Occupations, 2013
Source: SLMRU (SOLAS) analysis of CSO data
Figure 8.15.2 Average Annual Growth (%) in Selected Sales and Customer Service Occupations
Source: SLMRU (SOLAS) analysis of CSO data
Note: Growth rates associated with occupations where employment is comparatively small are less reliable due to a greater risk of sampling error.
2.8
3.4
3.8
5.4
5.8
12.0
16.9
17.1
24.9
128.0
0 40 80 120 160
Buyers & procurement officers
Sales supervisors
Estate agents etc; conferencemanagers
Advertising, marketing & salesdirectors
Marketing associate profs.
Sales related occupations
Sales accounts & bus. dev.managers
Customer service occupations
Business sales executives
Sales assistants
-7.7%
-4.8%
-1.2%
8.6%
3.3%
-1.9%
3.4%
-1.7%
-2.4%
-1.8%
-28.4%
-20.4%
-12.4%
-2.9%
-1.3%
0.1%
0.5%
7.5%
16.9%
23.4%
-60% -40% -20% 0% 20% 40%
Buyers & procurementofficers
Estate agents etc;conference managers
Sales supervisors
Advertising, marketing &sales directors
Customer serviceoccupations
Sales assistants
Sales accounts & bus. dev.managers
Business sales executives
Sales related occupations
Marketing associate profs.
2012-2013 2008-2013

National Skills Bulletin 2014 114 July 2014
Figure 8.15.3 Age Profile of Selected Sales and Customer Service Occupations, Quarter 4 2013
Source: SLMRU (SOLAS) analysis of CSO data
Figure 8.15.4 Education Profile of Selected Sales and Customer Service Occupations, Quarter 4 2013
Source: SLMRU (SOLAS) analysis of CSO data
Shortage Indicators In 2013, vacancies for sales positions were numerous. Advertised positions were most frequent for sales assistants, multilingual business sales executives, telesales, field sales, multilingual sales, multilingual customer support, buyers/procurement officers and marketing managers. Languages most frequently required for multilingual roles included German, French and Nordic.
Many of these vacancies were arising due to replacement and turnover demand. The data for 2013 indicates that the replacement and turnover rates for sales workers were above average. For instance, there were over 18,000 transitions from employment to inactivity for sales/retail assistants alone, of which half was to study.
Nonetheless, a significant share of vacancies is likely to have arisen as a result of the expansion demand. Moreover, difficult-to-fill vacancies were reported for the following sales areas:
market research and product strategy
digital sales and marketing (e.g. ‘pay per click’)
business to business (B2B) and business to consumer (B2C) technical sales in the areas of ICT, healthcare, medical devices and pharmaceuticals
multilingual customer support (Nordic languages, German and French).
The demand for sales skills is expected to remain strong in the short to medium term. As illustrated in recent job announcements, demand is expected to be particularly strong in the area of customer support (e.g. Westbourne IT Global Services, ServiceSource, VCE, One Big Switch, New Relic etc.).
27%
5%
14%
8%
9%
6%
7%
63%
82%
77%
91%
74%
85%
76%
82%
89%
79%
10%
13%
9%
8%
18%
14%
15%
12%
11%
14%
0% 20% 40% 60% 80% 100%
Sales assistants
Business salesexecutives
Customer serviceoccupations
Sales accounts &bus. dev. managers
Sales relatedoccupations
Advert., marketing,sales directors
Estate agents etc.& conference
managers
Marketing associateprofs.
Buyers &procurement
officers
Sales supervisors
15-24 25-54 55+
20%
12%
7%
4%
21%
3%
4%
8%
57%
40%
40%
17%
36%
25%
20%
22%
20%
56%
23%
48%
53%
79%
43%
72%
80%
78%
76%
36%
0% 20% 40% 60% 80% 100%
Sales assistants
Business sales executives
Customer service occupations
Sales accounts & bus. dev.managers
Sales related occupations
Advert., marketing, salesdirectors
Estate agents etc.; conferencemgrs.
Marketing associate profs.
Buyers & procurement officers
Sales supervisors
Lower secondary or less Higher secondary or FET Third level

National Skills Bulletin 2014 115 July 2014
The availability of sales persons with product knowledge, communication skills, as well as cultural awareness and foreign languages, will continue to be paramount for nurturing
existing and building new relationships between Irish companies and their trading partners.

National Skills Bulletin 2014 116 July 2014
8.16 Operatives In 2013, there were approximately 72,000
persons employed in operative occupations, representing 3.8% of Ireland’s workforce
Approximately 70% of total employment of operatives was concentrated in manufacturing (mostly food; machinery and equipment; pharmaceuticals; computer, electronic and optical products)
Between 2008 and 2013, overall employment in the selected occupations increased by 3% on average annually; this was in contrast to an average annual decline of 2.4% in total national employment; the strongest employment growth was observed for food, drink & tobacco operatives (16.2% on average annually), while the strongest decline was observed for plant and machine operatives (9.3% on average annually)
Over the five-year period, there were approximately 10,000 net jobs created; the largest employment increase was observed for food, drink & tobacco operatives (6,600), while the largest employment decline was observed for plant and machine operatives (4,900)
Between 2012 and 2013, overall employment of operatives increased by 2.1%; the largest employment increase was observed for assemblers (1,700), while the largest decline was for food, drink & tobacco operatives (1,800)
The workforce of both construction and plant & machine operatives was the most mature among operative occupations, with approximately one fifth each aged 55 or older, exceeding the national average; in contrast, it was the youngest for food, drink & tobacco (14% aged under 25)
The education profile of operatives was skewed towards the lower end of the educational attainment spectrum; for instance, half of construction operatives had lower secondary or less qualifications
The share of non-Irish nationals employed in each operative occupation (excluding construction and chemical) exceeded the national average; at 34% and almost 30%, the highest share was for food, drink & tobacco and plant & machine operatives respectively.
Figure 8.16.1 Numbers Employed (000s) in Selected Operatives and Related Occupations, 2013
Source: SLMRU (SOLAS) analysis of CSO data
Figure 8.16.2 Average Annual Growth (%) in Selected Operatives and Related Occupations
Source: SLMRU (SOLAS) analysis of CSO data Note: Growth rates associated with occupations where employment is comparatively small are less reliable due to a greater risk of sampling error.
3.4
5.6
7.7
8.5
9.6
12.5
24.4
0 5 10 15 20 25 30
Other process
Chemical & related process
Plant & machine
Assemblers
Construction
Food, drink & tobacco
Routine
-4.0%
16.2%
-3.4%
5.5%
-9.3%
14.1%
4.0%
-14.5%
-12.5%
-5.5%
1.7%
14.3%
24.6%
31.2%
-40% -20% 0% 20% 40%
Other process
Food, drink & tobacco
Construction
Routine
Plant & machine
Assemblers
Chemical & related process
2012-2013 2008-2013

National Skills Bulletin 2014 117 July 2014
Figure 8.16.3 Age Profile of Selected Operatives and Related Occupations, Quarter 4 2013
Source: SLMRU (SOLAS) analysis of CSO data
Figure 8.16.4 Education Profile of Selected Operatives and Related Occupations, Quarter 4 2013
Source: SLMRU (SOLAS) analysis of CSO data
Shortage Indicators In 2013, vacancies were most frequent for process (e.g. food); construction (e.g. scaffolder) and machine (Computer Numerical Control (CNC)) operatives.
Higher than average replacement rates were observed for construction and food operatives, while the later also had a higher than average turnover rate in 2013.
While there is currently no shortage of operatives in general, it is recognised that some manufacturing companies in engineering, medical devices and pharmaceuticals are experiencing difficulty in sourcing operatives with CNC skills.
In May 2013, there were over 300 job seekers registered on the DSP system who were machine tool setters and engineering operatives. However, it is likely that many job seekers were trained in traditional operative skills and are deficient in the digital competencies required for technology-intensive manufacturing environments.
Expected significant capital investment in high technology sectors is likely to positively impact on the demand for operative skills in the medium term. In addition, employment of operatives is expected to be positively affected by the further automation of production processes and the associated replacement of unskilled labour with skilled operatives. However, the operative role is expected to become more knowledge and skill intensive (i.e. super-operative).
7%
14%
4%
3%
3%
2%
11%
82%
74%
74%
93%
77%
91%
79%
11%
12%
22%
4%
20%
7%
10%
0% 20% 40% 60% 80% 100%
Routine
Food, drink &tobacco
Construction
Assemblers
Plant & machine
Chemical & relatedprocess
Other process
15-24 25-54 55+
22%
26%
51%
17%
31%
12%
30%
50%
54%
42%
67%
44%
54%
62%
28%
20%
7%
16%
25%
34%
8%
0% 20% 40% 60% 80% 100%
Routine
Food, drink &tobacco
Construction
Assemblers
Plant & machine
Chemical & relatedprocess
Other process
Lower secondary or less Higher secondary or FET Third level

National Skills Bulletin 2014 118 July 2014
8.17 Elementary occupations48 In 2013, there were approximately
145,000 persons employed in elementary occupations, representing 7.7% of Ireland’s workforce
Approximately 93,000 persons or almost two thirds of those employed in elementary occupations were engaged in cleaning services, construction activities and sales and storage services
Over the period 2008 to 2013, overall employment in the selected occupations contracted by 6.9% on average annually; this was one of the strongest average annual rates of decline among the 17 occupational groups examined
Between 2008 and 2013, employment for most occupations contracted; the strongest rates of decline were observed for elementary process plant and construction occupations, 17.6% and 15.7% on average annually respectively; there were approximately 62,000 net job losses over the five-year period, with the largest absolute employment decreases observed for elementary construction and process plant occupations
Between 2012 and 2013, however, overall employment expanded by 3.6%, compared to 2.4% for total national employment; the largest increases were observed for elementary agricultural and construction occupations (both in absolute and relative terms)
Those employed in elementary administrative occupations (mostly postal workers, mail sorters, etc.) were the most mature, with 27% aged 55 or older, exceeding the national average share
48There are a number of occupations discussed in this section which, for simplicity purposes, are referred to as labourers; these include cleaners, porters, sorters, various types of mates and other occupations not elsewhere classified.
The share employed in each occupation who had lower secondary or less qualifications and higher secondary/FET qualifications was above the national average; in contrast, the share with third level qualifications was well below the national average
Employment in most occupations was predominantly male; however, approximately 70% of cleaners were female
At 54%, the share of persons in part-time employment was the highest for cleaners ─ one of the highest shares among all occupations in the national workforce
Approximately 46% and 43% of elementary process plant labourers and cleaners were non-Irish nationals respectively ─ among the highest shares across all occupations in the national workforce
At 28%, the unemployment rate for elementary construction occupations was one of the highest among all occupations in the national labour force.
Figure 8.17.1 Numbers Employed (000s) as Labourers, 2013
Source: SLMRU (SOLAS) analysis of CSO data
4.3
8.9
10.4
13.1
15.2
22.5
30.7
39.4
0 10 20 30 40 50
Services
Process plant
Administrative
Security
Agriculture
Sales & storage
Construction
Cleaning

National Skills Bulletin 2014 119 July 2014
Figure 8.17.2 Average Annual Growth (%) of Labourers
Source: SLMRU (SOLAS) analysis of CSO data
Note: Growth rates associated with occupations where employment is comparatively small are less reliable due to a greater risk of sampling error.
Figure 8.17.3 Age Profile of Labourers, Quarter 4 2013
Source: SLMRU (SOLAS) analysis of CSO data
Figure 8.17.4 Education Profile of Labourers, Quarter 4, 2013
Source: SLMRU (SOLAS) analysis of CSO data
Shortage Indicators There is currently no shortage of labourers in Ireland.
Higher than average replacement and intra-occupational turnover rates have been identified for cleaners, security guards, routine testers and elementary construction workers.
-17.6%
-5.7%
1.4%
-2.2%
0.5%
-2.3%
-15.7%
1.7%
-7.6%
-7.3%
-5.4%
0.8%
2.0%
4.9%
6.1%
29.1%
-40% -20% 0% 20% 40%
Process plant
Security
Services
Administrative
Cleaning
Sales & storage
Construction
Agriculture
2012-2013 2008-2013
6%
12%
11%
1%
24%
3%
11%
19%
71%
75%
76%
77%
55%
70%
79%
64%
23%
13%
13%
22%
21%
27%
10%
17%
0% 20% 40% 60% 80% 100%
Cleaning
Construction
Sales & storage
Security
Agriculture
Administrative
Process plant
Services
15-24 25-54 55+
42%
38%
28%
29%
41%
41%
26%
23%
42%
47%
50%
47%
46%
48%
57%
60%
16%
15%
22%
24%
13%
11%
17%
17%
0% 20% 40% 60% 80% 100%
Cleaning
Construction
Sales & storage
Security
Agriculture
Administrative
Process plant
Services
Lower secondary or less Higher secondary or FET Third level

National Skills Bulletin 2014 120 July 2014
APPENDIX A
Figure A: National Framework of Qualifications
Source: QQI
The structure of the Framework is based on levels and award types, which are outlined in Figure A above. There are ten award levels, which indicate the standard of learning (ranging from the most basic to doctoral awards). There are four award-type categories, which serve as an indicator of the purpose, volume and progression opportunities associated with a particular award.
A major award is the main class of award made at any given level; examples of major awards include the Leaving Certificate, a QQI-FETAC major certificate or an honours bachelor degree.
A minor award provides recognition for learners who achieve a range of learning outcomes but not the specific combination of learning outcomes required for a major award. A minor award is linked to a major award.
A Special Purpose award is made for very specific purposes; an example of a special-purpose award is site suitability for wastewater treatment.
A Supplemental Award is for learning which is additional to a previous award; it could, for example, relate to updating and refreshing knowledge or skills, or to continuing professional development.

National Skills Bulletin 2014 121 July 2014
APPENDIX B Members of the Expert Group on Future Skills Needs Ms. Una Halligan Chairperson
Ms. Marie Bourke Head of Secretariat and Department Manager, Forfás
Ms. Inez Bailey Director, National Adult Literacy Agency
Mr. Peter Baldwin Assistant Secretary, Department of Education and Skills
Mr. Ray Bowe IDA Ireland
Ms. Liz Carroll Training and Development Manager, ISME
Mr. Ned Costello Chief Executive, Irish Universities Association
Ms. Margaret Cox Managing Director, I.C.E. Group
Mr. Bill Doherty Executive Vice President, EMEA, Cook Medical
Mr. Tony Donohoe Head of Education, Social and Innovation Policy, IBEC
Dr. Bryan Fields Director, Curriculum Development / Programme Innovation, SOLAS
Ms. Sonia Flynn EMEA Director for User Operations, Facebook
Mr. Joe Hogan Founder, Chief Technology Officer & VP Openet Labs & IP Management
Ms. Deirdre McDonnell Principal Officer, Department of Education and Skills
Mr. Jerry Moloney Director of Skills, Enterprise Ireland
Mr. Frank Mulvihill Former President of the Institute of Guidance Counsellors
Dr. Brendan Murphy President, Cork Institute of Technology
Mr. John Bourke Principal Officer, Department of Public Expenditure and Reform
Mr. Alan Nuzum CEO, Skillnets
Dr. Peter Rigney Industrial Officer, ICTU
Mr. Martin Shanagher Assistant Secretary, Department of Jobs, Enterprise and Innovation
Mr. Martin D. Shanahan Chief Executive, Forfás
Ms. Mary-Liz Trant Higher Education Authority

National Skills Bulletin 2014 122 July 2014
APPENDIX C Recent Publications by the Expert Group on Future Skills Needs
Report Date of Publication
Vacancy Overview 2013 May 2014
Assessing the Demand for Big Data and Analytics Skills, 2013 - 2020 May 2014
The Expert Group on Future Skills Needs Statement of Activity 2013 March 2014
Regional Labour Markets Bulletin 2013 March 2014
Guidance for Higher Education Providers on Current and Future Skills Needs of Enterprise: Springboard 2014
February 2014
Addressing Future Demand for High-Level ICT Skills November 2013
Monitoring Ireland’s Skills Supply: Trends in Education and Training Outputs 2013
July 2013
National Skills Bulletin 2013 July 2013
Future Skills Requirements of the Manufacturing Sector to 2020 April 2013
The Expert Group on Future Skills Needs Statement of Activity 2012 April 2013
Guidance for Higher Education Providers on Current and Future Skills Needs of Enterprise: Springboard 2013
February 2013
Vacancy Overview 2012 February 2013
Regional Labour Markets Bulletin 2012 January 2013
Monitoring Ireland’s Skills Supply: Trends in Education and Training Outputs 2012
July 2012
National Skills Bulletin 2012 July 2012
Key Skills for Enterprise to Trade Internationally June 2012
EGFSN Statement of Activity 2011 April 2012
Vacancy Overview 2011 February 2012
Guidance for Higher Education Providers on Current and Future Skills Needs of Enterprise (Forfás report based on EGFSN identified future skills needs)
February 2012
Addressing High–Level ICT Skills Recruitment Needs: Research Findings January 2012
Monitoring Ireland’s Skills Supply: Trends in Education and Training Outputs July 2011
National Skills Bulletin 2011 July 2011
EGFSN Statement of Activity 2010 May 2011

National Skills Bulletin 2014 123 July 2014
Report Date of Publication
Developing Recognition of Prior Learning: The Role of RPL in the Context of the National Skills Strategy Upskilling Objectives
April 2011
Vacancy Overview 2010 March 2011
Future Skills Needs of Enterprise within the Green Economy in Ireland November 2010
Future Skills Requirements of the Biopharma-Pharmachem Sector November 2010
Monitoring Ireland's Skills Supply - Trends in Education and Training Outputs 2010
July 2010
National Skills Bulletin 2010 July 2010
Future Skills Needs of the Wholesale and Retail Sector May 2010
EGFSN Statement of Activity 2009 April 2010
Future Skills Requirements of the Food and Beverage Sector November 2009
Skills in Creativity, Design and Innovation November 2009
Monitoring Ireland’s Skill Supply – Trends in Education and Training Outputs 2009
November 2009
National Skills Bulletin 2009 July 2009
A Quantitative Tool for Workforce Planning in Healthcare: Example Simulations
June 2009
EGFSN Statement of Activity 2008 June 2009
A Review of the Employment and Skills Needs of the Construction Industry in Ireland
December 2008
Statement on Raising National Mathematical Achievement December 2008
National Skills Bulletin 2008 November 2008
All-Island Skills Study October 2008
Monitoring Ireland’s Skills Supply: Trends in Education/Training Outputs 2008 July 2008
The Expert Group on Future Skills Needs Statement of Activity 2007 June 2008
Future Requirement for High-Level ICT Skills in the ICT Sector June 2008
Future Skills Needs of the Irish Medical Devices Sector February 2008
Survey of Selected Multi-National Employers’ Perceptions of Certain Graduates from Irish Higher Education
December 2007
The Future Skills and Research Needs of the International Financial Services Industry
December 2007
National Skills Bulletin 2007 November 2007

National Skills Bulletin 2014 124 July 2014
Report Date of Publication
Monitoring Ireland’s Skills Supply: Trends in Educational/Training Outputs June 2007
Tomorrow’s Skills: Towards a National Skills Strategy March 2007

National Skills Bulletin 2014
National Skills Bulletin 2014
BLEE
D
July 2014
Expert Group on Future Skills Needsc/o Skills and Labour Market Research Unit (SLMRU)
SOLASCastleforbes HouseCastleforbes Road Dublin 1, Ireland
Tel: +353 1 5332464Email: [email protected] www.skillsireland.ie
EGFSN Cover - 112-120 pages+FAS.indd 1 13/06/2014 17:06:15