National Scrapie Eradication Program - USDA APHIS | Home ... · This presentation has hyperlinks...
37
National Scrapie Eradication April 2014 Monthly Report National Scrapie Eradication Program Fiscal Year 2017 Report October 1, 2016 to September 30, 2017 U.S. Department of Agriculture Animal and Plant Health Inspection Service Veterinary Services Surveillance, Response and Preparedness Services Sheep and Goat Health Center Prepared December 15, 2017
National Scrapie Eradication Program - USDA APHIS | Home ... · This presentation has hyperlinks for navigation. Text in . blue. is a hyperlink to the slide or website being discussed
National Scrapie Eradication April 2014 Monthly Report
National Scrapie Eradication ProgramFiscal Year 2017 Report
October 1, 2016 to September 30, 2017
U.S. Department of AgricultureAnimal and Plant Health Inspection Service
Veterinary ServicesSurveillance, Response and Preparedness Services
Sheep and Goat Health Center
Prepared December 15, 2017
This presentation has hyperlinks for navigation. Text in blue is a hyperlink to the slide or website being discussed. Additionally, there are action buttons on each page:
Return to the last slide viewedReturn to 1st page of the Introduction
Please note the following:• The links and action buttons only work when the presentation is viewed in slide
show mode• The links have greater reliability if only 1 monitor is in use• The links may not have the same functionality if viewed using PowerPoint 2003 or
earlier• The links may become “frozen” if the viewer navigates through the presentation
quickly; if this happens, return to the first slide and begin again to reset
A Note on Navigation
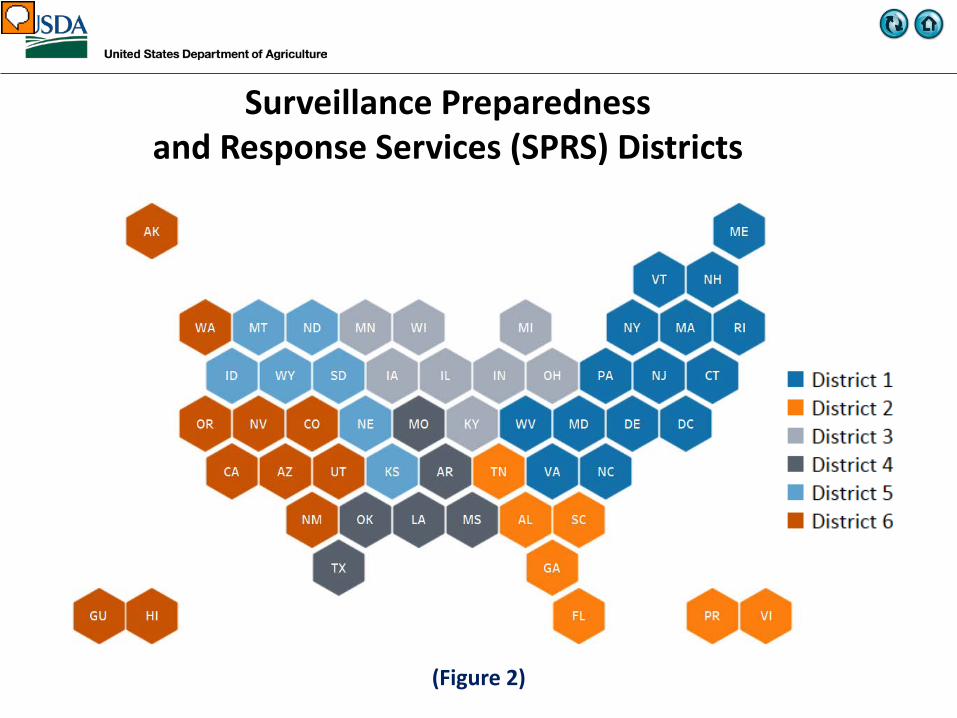
The National Scrapie Eradication Program is transitioning to a new reporting software called Tableau. Tableau is an interactive data visualization tool that allows users to easily select and view data summaries. Since the July 2017 report, some of the graphs in the Monthly Scrapie Report have been from Tableau. Eventually, the public will be able to see and interact with scrapie program reporting data through a web browser linked to Tableau Server. New to the monthly and annual reports are hex maps. Hex maps represent each state as a hexagon of equal size, with geographic affinity loosely maintained. These representations allocate equal area, and therefore equal weight, to each state. Filled colors still represent values, but with equal area allocated to each state, encourage focus on the data values rather than states with the most area. States and territories outside the contiguous US are easily represented, also with equal weight. Figure 1 is the standard map showing administrative districts within APHIS Veterinary Services; Figure 2 is a hex map, showing the 6 districts.
Introduction - New Reporting Format
Presenter
Presentation Notes
The traditional way to show state-level summaries is on state thematic (a.k.a. chloropleth) maps. In these representations, state boundaries are shown on a typical map projection, filled with colors representing values. Large states visually dominate the viewer's perception of the values, skewing interpretations of interstate comparisons. In contrast, hex maps represent each state as a hexagon of equal size, with geographic affinity loosely maintained. These representations allocate equal area, and therefore equal weight, to each state. Filled colors still represent values, but with equal area allocated to each state, encourage focus on the data values rather than states with the most area. An additional benefit is that regions/states outside the contiguous US are easily represented, also with equal weight. Shapes other than hexagons have been used for these types of maps, but hexagons best preserve the overall shape of the US. Other approaches that maintain state shape, but adjust state size to represent values, are not practical for datasets with many zeroes. Hex maps are not appropriate replacements for all maps, though. Datasets for which important variables include latitudinal or longitudinal gradients, or proximity to neighboring states, would be more accurately shown in a traditional map format. But due to their overall flexibility and equal representation of states, I'd recommend that hex maps be the standard form for visualizing national data broken out into states, unless the data justify another representation.
Introduction
The National Scrapie Eradication Program focuses on seven primary areas:
• Education and prevention• Animal identification and compliance• Surveillance [Regulatory Scrapie Slaughter Surveillance (RSSS) and on-farm]• Tracing positive and exposed animals and testing exposed animals• Cleanup of infected and source flocks through genetic susceptibility testing
and indemnification of susceptible exposed animals• Monitoring previously infected and exposed flocks • The Scrapie Free Flock Certification Program (SFCP)
Introduction - Program Summary
Presenter
Presentation Notes
The weighted face color constants incorporate face color distributions in the US sheep population, as estimated by APHIS, Veterinary Services, National Surveillance Unit based on and reported in the NAHMS 2001 Sheep study and the NAHMS 2011 Sheep study. For FY 2003 through FY 2010, the weighted face color constants were based on the data collected in the NAHMS 2001 Sheep study: Black-faced (BF) = 0.111; Mottled-faced (MF) = 0.166; and White-faced-Other* (WF) = 0.723. The percent positive = 0.111(# positive BF/# valid BF samples) + 0.166(# positive MF/# valid MF samples) + 0.723(# positive WF/#valid WF samples). For FY 2011 forward, the weighted face color constants were based on the data collected in the NAHMS 2011 Sheep study: BF = 0.146; MF = 0.082; and WF-Other* = 0.773. The percent positive = 0.146(# positive BF/# valid BF samples) + 0.082(# positive MF/# valid MF samples) + 0.773(# positive WF-Other/#valid WF-Other samples). * Starting in FY 2011, the National Scrapie Database was updated to separate out red-faced sheep, gray-faced sheep, and “other” sheep.
Program SummaryPerformance Measures - At the end of FY 2017, the percent of cull black face sheep found positive at slaughter was 0 percent (Chart 1) and the percent of cull sheep found positive at slaughter and adjusted for face color* was 0 percent (Chart 2).
Positive Animals - No sheep have tested positive for classical scrapie since April 2016. Other than one goat in a herd quarantined since 2005 and depopulated in 2017, no goats have tested positive for scrapie since February 2015.
*White, black and mottled-faced color sheep are weighted based on population; white-faced sheep have the greatest weight. If a white-faced positive sheep is found, this statistic will markedly increase. See slide notes details.
Introduction - Program Summary
Presenter
Presentation Notes
The weighted face color constants incorporate face color distributions in the US sheep population, as estimated by APHIS, Veterinary Services, National Surveillance Unit based on and reported in the NAHMS 2001 Sheep study and the NAHMS 2011 Sheep study. For FY 2003 through FY 2010, the weighted face color constants were based on the data collected in the NAHMS 2001 Sheep study: Black-faced (BF) = 0.111; Mottled-faced (MF) = 0.166; and White-faced-Other* (WF) = 0.723. The percent positive = 0.111(# positive BF/# valid BF samples) + 0.166(# positive MF/# valid MF samples) + 0.723(# positive WF/#valid WF samples). For FY 2011 forward, the weighted face color constants were based on the data collected in the NAHMS 2011 Sheep study: BF = 0.146; MF = 0.082; and WF-Other* = 0.773. The percent positive = 0.146(# positive BF/# valid BF samples) + 0.082(# positive MF/# valid MF samples) + 0.773(# positive WF-Other/#valid WF-Other samples). Starting in FY 2011, the National Scrapie Database was updated to separate out red-faced sheep, gray-faced sheep, and “other” sheep.
Program SummaryInfected and Source Flocks - Infected and source flocks by year are shown in Chart 3. No classical scrapie infected or source flocks were designated in all of FY 2017. Two flocks, one in Colorado and one in Texas, have open statuses (Chart 4), but there are no exposed animals on the premises of these flocks. Cleaning and disinfection of these premises has to be completed before the infect or source status can be closed.
Scrapie in Goats - Only one positive goat (FY 2015) has been found through RSSS since the start of RSSS in 2003. Based on all goats sampled at slaughter, the prevalence of scrapie in U.S. cull goats is 0.002 percent with an upper 95 percent confidence limit of 0.004 percent. Since 2002, the total number of positive field cases in goats is 41. Figure 3 shows the number of positive cases by State and by fiscal year of last reported case.
Introduction - Program Summary
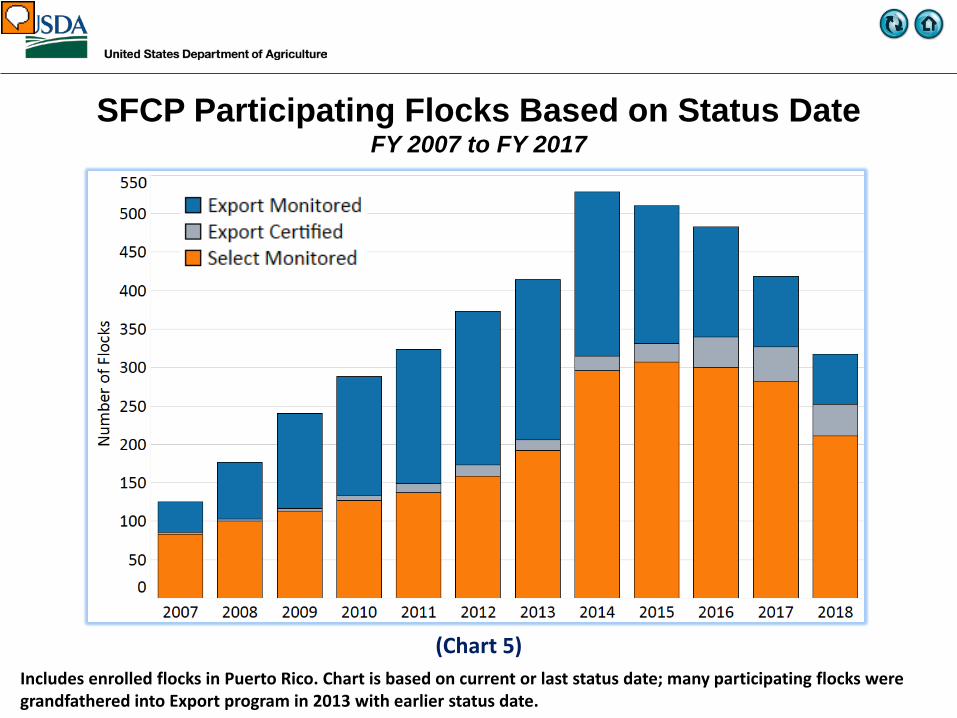
Program SummaryScrapie Flock Certification Program (SFCP) – As of September 30, 2017, there were 333 flocks participating in the Scrapie Flock Certification Program (SFCP). Statuses of these flocks were 67 export monitored, 46 export certified, and 220 select monitored flocks (Figure 4). SFCP open statuses by fiscal year from FY 1997 to FY 2017 are depicted in Chart 5.
* Previous charts of SFCP participation by year were manually updated and used the enrollment date to determine the year of participation in SFCP. With the change to Tableau charts, the start/status date is used. Many participating flocks were grandfathered into the Export category in 2013 with an earlier status date.
SurveillanceSurveillance activities are State-based and are administered as districts by APHIS. For this reason, reporting of surveillance activities is also by District. Surveillance minimums are based on estimated sheep and goat populations in each State. The distribution of sheep and goat populations by District is depicted in Chart 6.
Components of Scrapie Surveillance• Regulatory Scrapie Slaughter Surveillance (RSSS) started April 1, 2003. It is a targeted
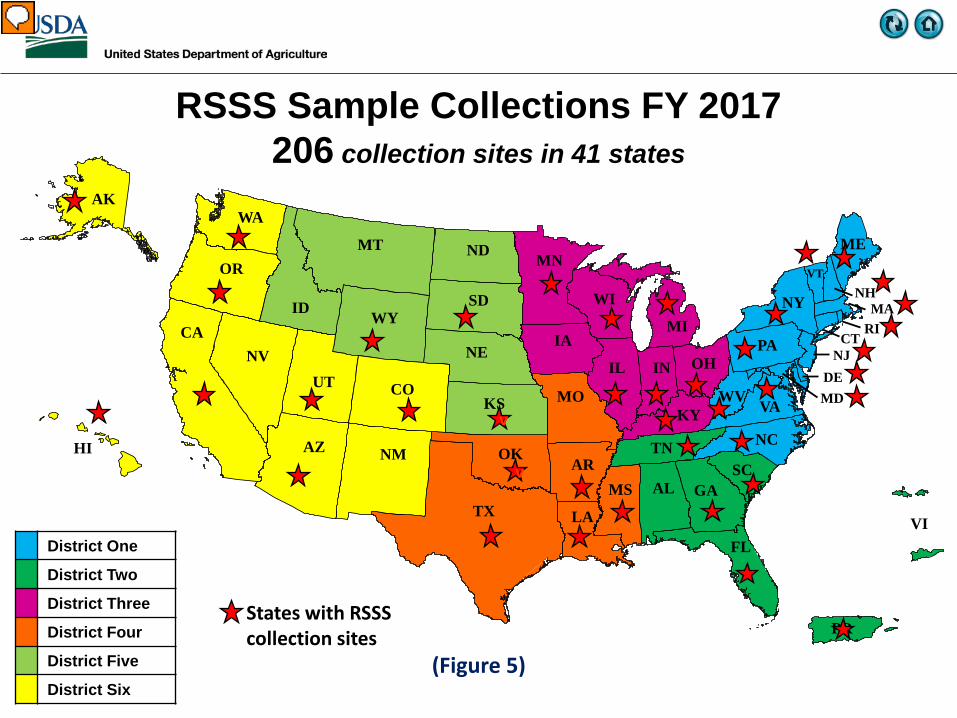
slaughter surveillance program which is designed to identify infected flocks. Samples have been collected from 560,308 animals since April 1, 2003. There have been 482 NVSL confirmed positive animals (471 classical cases and 11 Nor98-like cases) since the beginning of RSSS. 39,804 RSSS samples were collected in FY 2017, 32,767 from sheep and 7,037 from goats. Collection sites by state are shown in Figure 5. None tested positive for classical scrapie; two were positive for Nor98-like scrapie. The number of sheep and goats collected in each District is shown in Chart 7. Figure 6 is a hex map, representing the number of animals collected in each State. Chart 8 compares RSSS sampling by month for the current year with the monthly average of the previous 4 years. The number of RSSS samples collected by face color and species from FY 2003 through FY 2017 is plotted in Chart 9.
Presenter
Presentation Notes
The “Number of animals tested” includes those for which results have not yet been reported. The Sheep and Goat Management Team clarified the protocol for how to report animals that test positive for scrapie after being removed from their flock of origin to an ARS quarantine facility. This resulted in a change in the total number of positives on this map beginning August, 2014. Protocol For animals exposed to scrapie prior to moving to the ARS facility and where the samples that tested positive were collected within the same Fiscal Year (FY) that the animals were moved to the ARS facility: If the samples that tested positive were collected within 30 days after removal The animal will be treated the same as any other positive animal. It will be included in the positive cases section of the introduction slides. It will also be included in the number of positive cases for the State of origin in the ‘positive cases by FY’ map and table. If the samples that tested positive were collected more than 30 days after removal, but still within the same FY The animal will be noted as a positive identified after removal to a research facility in the positive cases section of the introduction slides, and a footnote will be added to the map and table indicating an additional positive was identified after removal to a research facility. The number of total positive animals shown on the map or table will not be changed. The positive will not be included in the total number of positives for the FY. For animals where the samples that tested positive were collected after the conclusion of the FY in which they were moved to ARS: The animal will be noted as a positive identified after removal to a research facility in the positive cases section of the introduction slides, and will not be included on the map and table. The positive will not be included in the total number of positives for the FY.
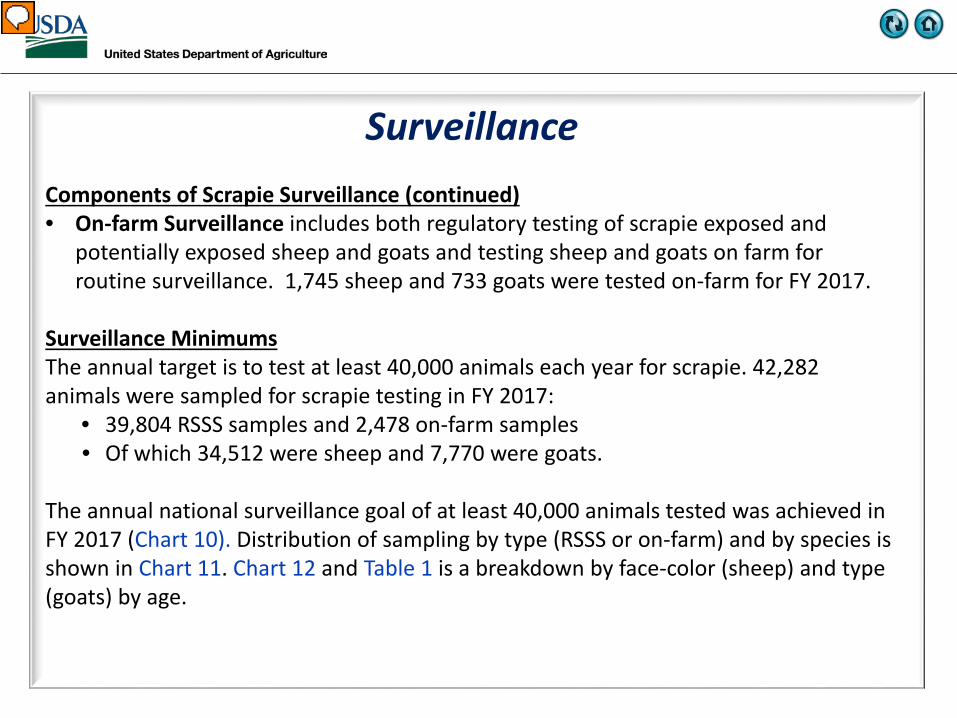
SurveillanceComponents of Scrapie Surveillance (continued)• On-farm Surveillance includes both regulatory testing of scrapie exposed and
potentially exposed sheep and goats and testing sheep and goats on farm for routine surveillance. 1,745 sheep and 733 goats were tested on-farm for FY 2017.
Surveillance MinimumsThe annual target is to test at least 40,000 animals each year for scrapie. 42,282 animals were sampled for scrapie testing in FY 2017:
• 39,804 RSSS samples and 2,478 on-farm samples • Of which 34,512 were sheep and 7,770 were goats.
The annual national surveillance goal of at least 40,000 animals tested was achieved in FY 2017 (Chart 10). Distribution of sampling by type (RSSS or on-farm) and by species is shown in Chart 11. Chart 12 and Table 1 is a breakdown by face-color (sheep) and type (goats) by age.
Presenter
Presentation Notes
The “Number of animals tested” includes those for which results have not yet been reported. The Sheep and Goat Management Team clarified the protocol for how to report animals that test positive for scrapie after being removed from their flock of origin to an ARS quarantine facility. This resulted in a change in the total number of positives on this map beginning August, 2014. Protocol For animals exposed to scrapie prior to moving to the ARS facility and where the samples that tested positive were collected within the same Fiscal Year (FY) that the animals were moved to the ARS facility: If the samples that tested positive were collected within 30 days after removal The animal will be treated the same as any other positive animal. It will be included in the positive cases section of the introduction slides. It will also be included in the number of positive cases for the State of origin in the ‘positive cases by FY’ map and table. If the samples that tested positive were collected more than 30 days after removal, but still within the same FY The animal will be noted as a positive identified after removal to a research facility in the positive cases section of the introduction slides, and a footnote will be added to the map and table indicating an additional positive was identified after removal to a research facility. The number of total positive animals shown on the map or table will not be changed. The positive will not be included in the total number of positives for the FY. For animals where the samples that tested positive were collected after the conclusion of the FY in which they were moved to ARS: The animal will be noted as a positive identified after removal to a research facility in the positive cases section of the introduction slides, and will not be included on the map and table. The positive will not be included in the total number of positives for the FY.
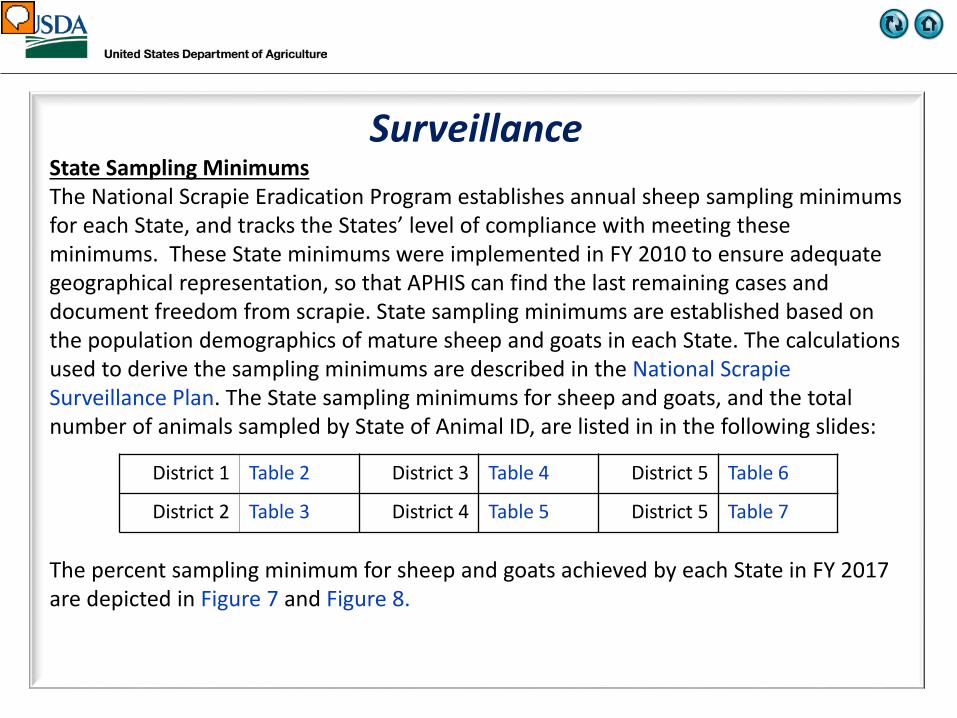
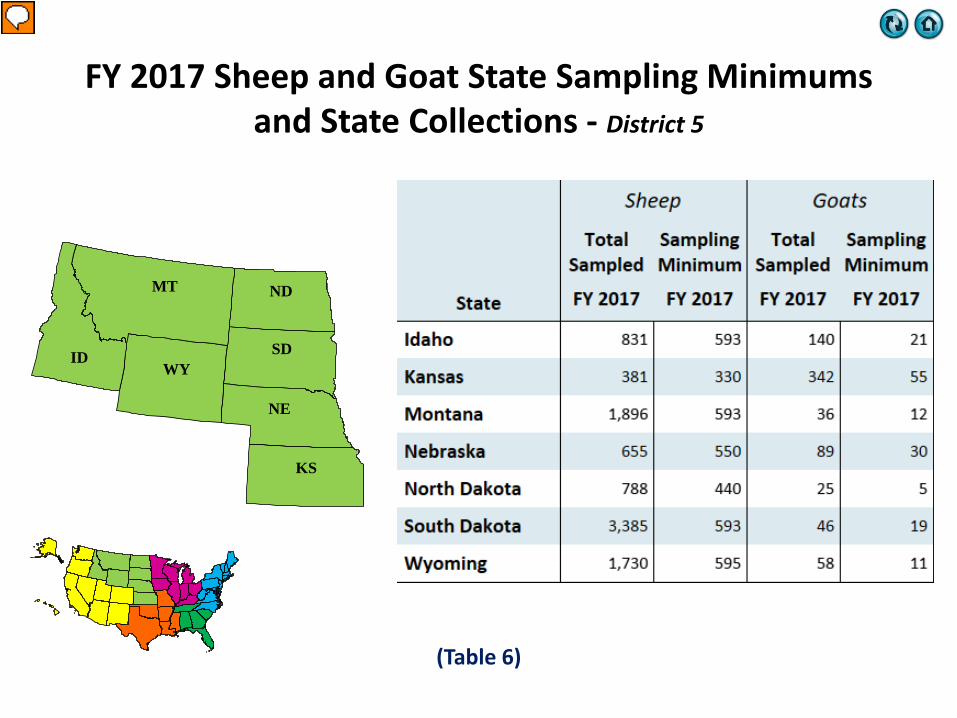
SurveillanceState Sampling MinimumsThe National Scrapie Eradication Program establishes annual sheep sampling minimums for each State, and tracks the States’ level of compliance with meeting these minimums. These State minimums were implemented in FY 2010 to ensure adequate geographical representation, so that APHIS can find the last remaining cases and document freedom from scrapie. State sampling minimums are established based on the population demographics of mature sheep and goats in each State. The calculations used to derive the sampling minimums are described in the National Scrapie Surveillance Plan. The State sampling minimums for sheep and goats, and the total number of animals sampled by State of Animal ID, are listed in in the following slides:
The percent sampling minimum for sheep and goats achieved by each State in FY 2017 are depicted in Figure 7 and Figure 8.
District 1 Table 2 District 3 Table 4 District 5 Table 6
District 2 Table 3 District 4 Table 5 District 5 Table 7
Presenter
Presentation Notes
The “Number of animals tested” includes those for which results have not yet been reported.
Surveillance Preparedness and Response Services (SPRS) Districts
Presenter
Presentation Notes
Adjusted to exclude multiple positive animals from same flock. Mottled- and white-faced combined. Does not include Nor98-like scrapie cases found through RSSS.
(Chart 1)
0.0%0.1%0.2%0.3%0.4%0.5%0.6%0.7%0.8%0.9%1.0%
% Pos '03
% Pos '04
% Pos '05
% Pos '06
% Pos '07
% Pos '08
% Pos '09
% Pos '10
% Pos '11
% Pos '12
% Pos '13
% Pos '14
% Pos '15
% Pos '16
% Pos '17
Percent of RSSS Sheep Samples that Tested Positive for Classical Scrapie - By Face Color - Fiscal Year (2003 – 2017)
Presenter
Presentation Notes
Note: The number of animals sampled annually only allows accurate measurement to about 0.01 percent for the overall rate and about 0.03 percent for when face color is broken out separately, so the changes in the prevalence values smaller than 0.01 or 0.03 percent respectively are within the error of the measure. Nor98-like cases - 2 in FY 2007, 1 in FY 2008, 4 in FY 2010, 1 in FY 2011, 1 in FY 2016, and 2 in FY 2017
Adjusted to exclude multiple positive animals from the same flock. Does not include Nor98-like scrapie cases found through RSSS.
(Chart 2)
0.00%
0.02%
0.04%
0.06%
0.08%
0.10%
0.12%
0.14%
0.16%
% Pos '03% Pos '04
% Pos '05% Pos '06% Pos '07% Pos '08
% Pos '09% Pos '10% Pos '11% Pos '12
% Pos '13% Pos '14% Pos '15% Pos '16
% Pos '17
Percent of RSSS Sheep Samples that Tested Positive for Classical Scrapie - Weighted by Face Color
Fiscal Years 2003 to 2017
Presenter
Presentation Notes
Note: The number of animals sampled annually only allows accurate measurement to about 0.01 percent for the overall rate and about 0.03 percent for when face color is broken out separately, so the changes in the prevalence values smaller than 0.01 or 0.03 percent respectively are within the error of the measure. The weighted face color constants incorporate face color distributions in the US sheep population, as estimated by APHIS, Veterinary Services, National Surveillance Unit based on and reported in the NAHMS 2001 Sheep study and the NAHMS 2011 Sheep study. For FY 2003 through FY 2010, the weighted face color constants were based on the data collected in the NAHMS 2001 Sheep study: Black-faced (BF) = 0.111; Mottled-faced (MF) = 0.166; and White-faced-Other* (WF) = 0.723. The percent positive = 0.111(# positive BF/# valid BF samples) + 0.166(# positive MF/# valid MF samples) + 0.723(# positive WF/#valid WF samples). For FY 2011 forward, the weighted face color constants were based on the data collected in the NAHMS 2011 Sheep study: BF = 0.146; MF = 0.082; and WF-Other* = 0.773. The percent positive = 0.146(# positive BF/# valid BF samples) + 0.082(# positive MF/# valid MF samples) + 0.773(# positive WF-Other/#valid WF-Other samples). Starting in FY 2011, the National Scrapie Database was updated to separate out red-faced sheep, gray-faced sheep, and “other” sheep. Nor98-like cases found through RSSS - 2 in FY 2007, 1 in FY 2008, 4 in FY 2010, 1 in FY 2011, 1 in FY 2016, and 2 in FY 2017
There were no new infected or source flocks in FY 2017.
(Chart 3)
Infected and Source Flocks New Statuses by Year - Fiscal Years 1997 to 2017
0
50
100
150
200
InfectedSource
Presenter
Presentation Notes
Nor98-like flocks are not included. Queries for the number of infected and source flocks by year were rerun on November 1, 2012. This was done for consistency in reporting; beginning in June 2012 the National Scrapie Report that was used to generate these counts was no longer functional, and therefore Discoverer was used from June through September, 2012. Most values were ± 1 or 2 counts. A discrepancy of 17 was found in 2007 (72 vs. 89 total with the Discoverer query); this is attributed to delayed data entry of statuses.
(Chart 4)
Infected and Source FlocksOpen & Closed Statuses by State - FY 1997 - 2017
WY
WV
WI
WA1
VT
VA
UT
TX
TN
SD
SC
RIPA
OR
OK
OH5
NY
NV
NM
NJ
NH
NE
ND
NC
MT
MS
MO
MN
MI6
ME
MD – 2
MA
LA
KYKS
INIL1
IDIA7
HI
GA
FL
DE
CT
CO5*CA
13AZ1 AR
AK
AL
(Figure 3)
* Only RSSS positive goat, identified in November 2014. 41 total cases. The goat from the long term quarantined herd in CO that tested positive in July 2017 is not included. Color code indicates fiscal year of last case by State.
Scrapie Cases in Goats FY 2002 – FY 2017
FY 2015
FY 2014
FY 2013
FY 2011
FY 2010
FY 2009
FY 2008Prior to FY 2008
Presenter
Presentation Notes
The Sheep and Goat Management Team clarified the protocol for how to report animals that test positive for scrapie after being removed from their flock of origin to an ARS quarantine facility. This resulted in a change in the total number of positives on this map beginning August, 2014. Protocol For animals exposed to scrapie prior to moving to the ARS facility and where the samples that tested positive were collected within the same Fiscal Year (FY) that the animals were moved to the ARS facility: If the samples that tested positive were collected within 30 days after removal The animal will be treated the same as any other positive animal. It will be included in the positive cases section of the introduction slides. It will also be included in the number of positive cases for the State of origin in the ‘positive cases by FY’ map and table. If the samples that tested positive were collected more than 30 days after removal, but still within the same FY The animal will be noted as a positive identified after removal to a research facility in the positive cases section of the introduction slides, and a footnote will be added to the map and table indicating an additional positive was identified after removal to a research facility. The number of total positive animals shown on the map or table will not be changed. The positive will not be included in the total number of positives for the FY. For animals where the samples that tested positive were collected after the conclusion of the FY in which they were moved to ARS: The animal will be noted as a positive identified after removal to a research facility in the positive cases section of the introduction slides, and will not be included on the map and table. The positive will not be included in the total number of positives for the FY.
Scrapie Flock Certification Program: Participating FlocksAs of September 30, 2017
SFCP Participating Flocks Based on Status DateFY 2007 to FY 2017
Includes enrolled flocks in Puerto Rico. Chart is based on current or last status date; many participating flocks were grandfathered into Export program in 2013 with earlier status date.
(Chart 5)
Presenter
Presentation Notes
Previous charts of SFCP participation by year were manually updated and used the enrollment date to determine the year of participation in SFCP. With the change to Tableau charts, the Status date (Start date in SCS Scrapie) is used, because the enrollment date is entered into a metadata field associated with the Herd record and is not easily queried, e.g. is not a field in the Herd/Program extractor. Many participating flocks were grandfathered into Export program in 2013 with an earlier status date, so the Tableau graph is skewed to the left.
Total Sheep and Goat Populations by VS District*
0
200,000
400,000
600,000
800,000
1,000,000
1,200,000
1,400,000
1,600,000
1,800,000
2,000,000
District 1 District 2 District 3 District 4 District 5 District 6**
(Chart 6)* Source: NASS Sheep and Goat, January 29, 2016.
** Includes sheep and goats residing in the Navajo Nation.
Sheep
Goats
WY
WV
WI
WA
VT
VI
VAUT
TX
TN
SD
SC
RI
PR
PA
OR
OK
OH
NY
NV
NM
NJNE
ND
NC
MT
MS
MO
MN
MI
ME
MD
LA
KYKS
INIL
ID
IA
HI
GA
FL
DE CO
CA
AZAR
AK
AL
District One
District Two
District Three
District Four
District Five
District Six(Figure 5)
v
v
NHMA
CT
States with RSSS collection sites
RSSS Sample Collections FY 2017206 collection sites in 41 states
Presenter
Presentation Notes
(Figure 6)
Total RSSS Samples Collected by State – FY 2017
States with no RSSS collections
Presenter
Presentation Notes
This hex map tells you where the majority of RSSS samples are being collected. The red outlined states had no RSSS samples collected.
(Chart 7)
District
Total RSSS Samples Collected by District – FY 2017
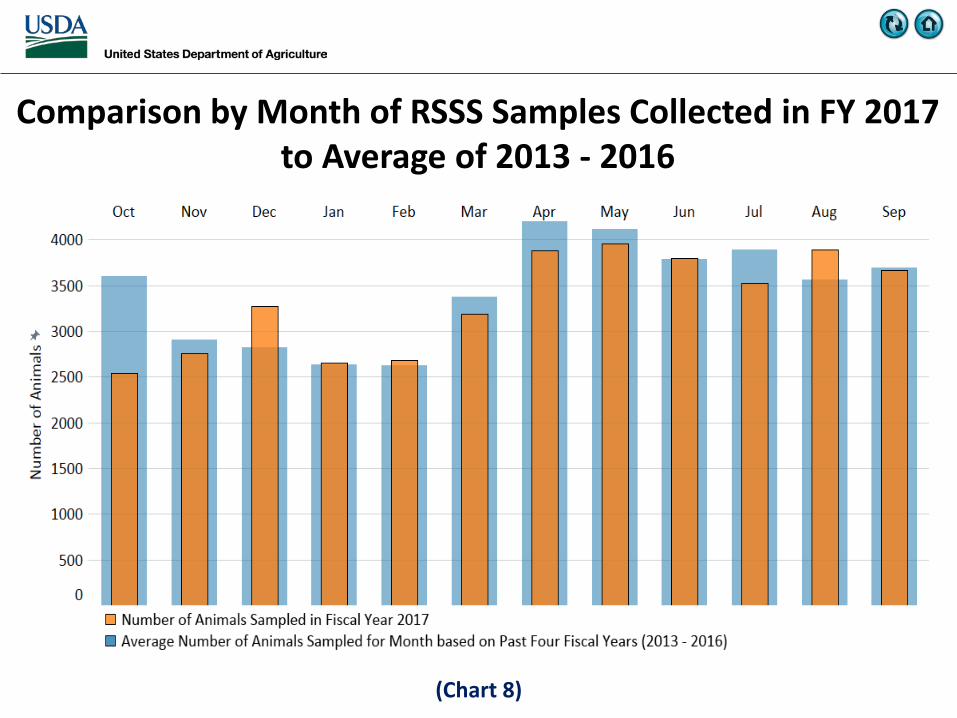
(Chart 8)
Comparison by Month of RSSS Samples Collected in FY 2017 to Average of 2013 - 2016
25
05000
1000015000200002500030000350004000045000
GoatOther SheepWhite FaceMottled <1% BlackMottled >1% BlackBlack Face
Other sheep includes hair sheep (74%) and sheep with gray, red, or unknown face color. Chart includes animals collected for RSSS & CSPS. Percent black of mottled-faced sheep available FY 2009 – 2016.
Surveillance Samples Collected at Slaughter FY 2003 – 2017
(Chart 9)
Presenter
Presentation Notes
This graph shows the breakdown of the different populations of sheep and goats sampled through slaughter surveillance.
(Chart 10) 26
Cumulative Number of Animals Sampled by MonthFY 2017
(Chart 11)
RSSS and On-Farm Surveillance Sampling by Species - FY 2017
39,804 Total 2,478 Total
Presenter
Presentation Notes
On farm sampling of goats is consistent with the sizes of the sheep and goat populations in the US.
(Chart 12)
RSSS and On-Farm Surveillance Testingby Species - FY 2017
Darker shading represents greater number of animals tested that met targeting criteria.
(Table 1)
RSSS and On-Farm Surveillance Testingby Species - FY 2017
FY 2017 Sheep and Goat State Sampling Minimums and State Collections - District 1
(Table 2)
WV
VT
VA
RIPA
NY
NJ
NH
NC
ME
MD
DE
Presenter
Presentation Notes
FY 2017 Sheep and Goat State Sampling Minimums and State Collections - District 2
(Table 3)
TNSC
GA
FL
AL
Presenter
Presentation Notes
FY 2017 Sheep and Goat State Sampling Minimums and State Collections - District 3
(Table 4)
WI
OH
MN
MI
KY
INIL
IA
Presenter
Presentation Notes
FY 2017 Sheep and Goat State Sampling Minimums and State Collections - District 4
(Table 5)
TX
OK
MS
LA
AR
MO
Presenter
Presentation Notes
FY 2017 Sheep and Goat State Sampling Minimums and State Collections - District 5
(Table 6)
WYSD
NE
NDMT
KS
ID
Presenter
Presentation Notes
WA
UT
OR
NV
NMHI
CO
CA
AZ
AK
FY 2017 Sheep and Goat State Sampling Minimums and State Collections - District 6
(Table 7)
Presenter
Presentation Notes
Percent of Sampling Minimum Achievedin FY 2017—RSSS and On-farm Surveillance—Sheep
(Figure 7)
Presenter
Presentation Notes
Prorated percent is based on the average percent of RSSS and On-Farm samples collected through the given month, for sheep, for the previous 3 years. The prorated percentage was calculated by averaging the number of sheep sampled in FY 2012, 13 and 14 through the month covered by this report and dividing that number by the average of the total number of sheep sampled for each FY. The percent of prorated sampling minimum achieved was calculated by multiplying each state’s sheep sampling minimum by the prorated percentage and then dividing the number of samples collected for the state in FY 2015 by that number. Through Oct: 9% Through Nov: 16% Through Dec: 22% Through Jan: 28% Through Feb: 35% Through Mar: 42% Through Apr: 53% Through May: 63% Through Jun: 72% Through Jul: 82% Through Aug: 92% Through Sep: 100%
Percent of Sampling Minimum Achievedin FY 2017—RSSS and On-farm Surveillance—Goats
(Figure 8)
Presenter
Presentation Notes
AK, RI and DE have a sampling minimum of 1. IA and MD had a large increase in their minimums due to finding an infected herd in each State in FY 2014. Prorated percent is based on the average percent of RSSS and On-Farm samples collected through the given month, for sheep, for the previous 3 years. The prorated percentage was calculated by averaging the number of goats sampled in FY 2012, 13 and 14 through the month covered by this report and dividing that number by the average of the total number of goats sampled for each FY. The percent of prorated sampling minimum achieved was calculated by multiplying each state’s goat sampling minimum by the prorated percentage and then dividing the number of samples collected for the state in FY 2015 by that number. Through Oct: 7% Through Nov: 15% Through Dec: 22% Through Jan: 31% Through Feb: 40% Through Mar: 48% Through Apr: 57% Through May: 66% Through Jun: 74% Through Jul: 83% Through Aug: 92% Through Sep: 100%