Embed Size (px)
Citation preview

2010 DIGEST
INDICATORS
KEY SCIENCE ANDENGINEERING
National Science Board

Louis J. Lanzerotti, Distinguished Research Professor of Physics, Center for Solar-Terrestrial Research, Department of Physics, New Jersey Institute of Technology
Alan I. Leshner, Chief Executive Officer, Executive Publisher, Science, American Association for the Advancement of Science, Washington, DC
G. P. “Bud” Peterson, President, Georgia Institute of Technology
Douglas D. Randall, Professor and Thomas Jefferson Fellow, University of Missouri
Arthur K. Reilly, Senior Director, Strategic Technology Policy, Cisco Systems, Inc., Ocean, New Jersey
Diane L. Souvaine, Professor and Chair, Department of Computer Science, Tufts University
Jon C. Strauss, Interim Dean, Edward E. Whitacre Jr. College of Engineering, Texas Tech University
Kathryn D. Sullivan, Director, Battelle Center for Mathematics and Science Education Policy, John Glenn School of Public Affairs, Ohio State University
Thomas N. Taylor, Roy A. Roberts Distinguished Professor, Department of Ecology and Evolutionary Biology, Curator of Paleobotany in the Natural History Museum and Biodiversity Research Center, The University of Kansas
Richard F. Thompson, Keck Professor of Psychology and Biological Sciences, University of Southern California
MEMBER EX OFFICIOArden L. Bement, Jr., Director, National Science
Foundation
Craig R. Robinson, Acting Executive Officer, National Science Board, and National Science Board Office Director
Steven C. Beering, Chairman, President Emeritus, Purdue University
Patricia D. Galloway, Vice Chairman, Chief Executive Officer, Pegasus Global Holdings, Inc., Cle Elum, Washington
Mark R. Abbott, Dean and Professor, College of Oceanic and Atmospheric Sciences, Oregon State University
Dan E. Arvizu, Director and Chief Executive, National Renewable Energy Laboratory, Golden, Colorado
Barry C. Barish,* Director, Global Design Effort for International Linear Collider, Linde Professor of Physics, Emeritus, California Institute of Technology
Camilla P. Benbow, Patricia and Rodes Hart Dean of Education and Human Development, Peabody College of Education and Human Development, Vanderbilt University
Ray M. Bowen, President Emeritus, Texas A&M University
John T. Bruer, President, The James S. McDonnell Foundation, St. Louis
G. Wayne Clough, Secretary, Smithsonian Institution, Washington, DC
France A. Córdova, President, Purdue University
Kelvin K. Droegemeier, Vice President for Research, Regents’ Professor of Meteorology and Weathernews Chair Emeritus, University of Oklahoma
José-Marie Griffiths, Deputy Director (Biomedical Informatics), TraCS Institute, and Professor, School of Information and Library Science, University of North Carolina at Chapel Hill
Esin Gulari, Dean of Engineering and Science, Clemson University
Elizabeth Hoffman,* Executive Vice President and Provost, Iowa State University
NATIONAL SCIENCE BOARD
* Board Consultant

KEY SCIENCE AND ENGINEERING INDICATORS
2010 DIGESTNSB 10-02
JANUARY 2010

PREFACE
The National Science Board (Board) is required
under the National Science Foundation (NSF)
Act, 42 U.S.C. § 1863 (j) (1) to prepare and
transmit the biennial Science and Engineering
Indicators (SEI) report to the President and to the
Congress by January 15 of every even-numbered
year. The report is prepared by the NSF Division
of Science Resources Statistics (SRS) under the
guidance of the Board. It is subject to extensive
review by Board members, outside experts, interested
federal agencies, and SRS internal reviewers for
accuracy, coverage, and balance.
Indicators are quantitative representations—
summaries—of factors relevant to the scope, quality,
and vitality of the science and engineering (S&E)
enterprise. SEI is the major authoritative source of
these high-quality U.S. and international data.
SEI is factual and policy-neutral; it neither offers
policy options nor makes policy recommendations.
The indicators included in the report are intended
to contribute to the understanding of the current
S&E environment.
This digest of key S&E indicators draws from the
Board’s Science and Engineering Indicators 2010,
the 19th volume of this biennial series. The digest
serves to draw attention to important trends and data
points from across SEI 2010 and to introduce readers
to the data resources available in the report. Readers
are invited to explore each of the key indicators
presented here in more detail in the full report. To
that end, each indicator presented in this digest is
matched with the SEI 2010 chapter or chapters from
which it was drawn. The complete SEI 2010 report
and related resources are available on the Web at
www.nsf.gov/statistics/indicators/.
Readers may also be interested in resources
associated with SEI 2010, which include Globalization
of Science and Engineering Research, the Board’s
companion policy piece to SEI 2010. The section
“SEI 2010 Online Resources” at the end of this
digest provides a complete list and descriptions
of these products and tools. The Board hopes that
readers will take advantage of these rich sources
of information.

KEY SCIENCE AND ENGINEERING INDICATORS: 2010 DIGEST 1
2 Introduction
4 Global R&D: Measuring Commitment to Innovation > How much? > Intensity > Where? > Growth
6 U.S. R&D: Funding and Performance > Funding sources > Academic R&D support > Types of R&D > Performers
8 U.S. R&D: Federal Portfolio > Type of work > Focus > Support for S&E fields > Performers > Agency support
10 U.S. S&E Workforce: Trends and Composition > Workforce growth > Field of degree > S&E education > Nationality
12 Research Outputs: Publications and Patents > Publications > Patents > Research portfolios > Science-patent linkage
14 Geography of S&T: Globalization of Capabilities > R&D distribution > High technology manufacturing > Researchers > High technology exports > Cross-border R&D
16 Glossary and Key to Acronyms
17 Explore Further
18 SEI 2010 Online Resources
TABLE OF CONTENTS

2 www.nsf.gov/statistics/digest/
INTRODUCTION
THE UNITED STATES holds a preeminent position in science and engineering (S&E)
in the world, derived in large part from its long history of public and private investment
in S&E research and development (R&D) and education. Investment in R&D, science,
technology, and education correlate strongly with economic growth, as well as the
development of a safe, healthy, and well-educated society.
Many other nations, recognizing the economic and social benefits of such investment,
have increased their R&D and education spending. This trend will challenge the world
leadership role of the United States.

KEY SCIENCE AND ENGINEERING INDICATORS: 2010 DIGEST 3
KEY S&E INDICATORSThe National Science Board has selected 31 S&E indi-
cators for inclusion in this digest. These indicators
have been grouped into six topical areas. Although
each stands alone, collectively these six themes are
a snapshot of U.S. R&D capacity and outputs in a
global context. Exploration of areas that indicate
capacity for innovation is a thread common to many
of the themes presented here. As economies world-
wide grow increasingly knowledge-intensive and
interdependent, capacity for innovation becomes ever
more critical.
Three themes provide a worldwide view, picturing
R&D spending, research outputs, and science and
technology capacities. Three others share a domestic
focus, providing indicators of U.S. R&D: funding
and performance, federal R&D support, and the
U.S. S&E workforce. These topical indicators may
vary in successive volumes of the Science and
Engineering Indicators series as contemporary S&E
policy issues emerge.
WHAT THESE INDICATORS TELL THE NATIONBy selecting a set of general and topical indicators,
the Board seeks to contribute to the assessment
of the state of U.S. science and engineering and
to highlight issues of current opportunity or
concern. These measures address an emerging set
of trends of particular interest to planners and
policymakers at all levels whose decisions affect our
national S&E enterprise.

4 www.nsf.gov/statistics/digest/
GLOBAL R&D: MEASURING COMMITMENT TO INNOVATION
A | HOW MUCH? R&D expenditures worldwide are estimated to have exceeded $1 trillion in 2007, up from $525 billion a decade earlier.
B | WHERE? The United States accounted for about one-third of the $1.1 trillion 2007 worldwide R&D total—more than the EU-27 and more than the eight Asian economies with the largest R&D expenditures.
The rapidly growing R&D expenditures of the Asia-8 economies (China, India, Japan, Malaysia, Singapore, South Korea, Taiwan, Thailand) surpassed those of the EU-27 in 2003.
C | INTENSITYR&D intensity measures how much of a coun-try’s economic activity (gross domestic product) its R&D investment represents.
Japan committed 3.4% of its GDP to R&D in 2007, more than most other large economies, but
was surpassed by South Korea. In comparison, R&D intensity was lower in the United States and the EU-27.
Over the past decade, R&D intensity has grown in Asia and has remained steady in the United States and EU-27.
D | GROWTH Growth of R&D expenditures in the United States and the EU-27 averaged 5%–6% annually over the period 1996–2007. Comparable R&D growth rates of the Asia-8 economies often exceeded 10%, and in China’s case 20%.
Asian R&D growth reflects rising private spending by domestic and foreign firms as well as increased public R&D spending, designed to support strategic policies that aim to raise economic competitiveness through the develop-ment of knowledge-intensive economies.
WHY IS THIS IMPORTANT?
Innovation in the form of new goods, services, or processes builds on new knowl-edge and technologies, contributes to national competitiveness, and furthers social welfare. Investment in research and development, a major driver of innovation, is vital in knowledge-intensive economies. R&D expenditures indicate the priority given to advancing science and technology relative to other national goals.
KEY OBSERVATIONS:

KEY SCIENCE AND ENGINEERING INDICATORS: 2010 DIGEST 5
0
50
100
150
200
250
300
350
400
1996 1997 1998 1999 2000 2001 2002 2003 2004 2005 2006 2007
$ B
ILLI
ON
S
0
100
200
300
400
500
600
700
800
900
1000
1100
1200
1996 1997 1998 1999 2000 2001 2002 2003 2004 2005 2006 2007
$ B
ILLI
ON
S
0
5
10
15
20
25
PE
RC
EN
T
Estimated R&D expenditures worldwide: 1996–2007
R&D expenditures for the United States, EU-27, and Asia-8 economies: 1996–2007
United States
Asia–8EU-27
Average annual growth of R&D expenditures for United States, EU-27, and Asia-8 economies: 1996–2007
EU-27
United
State
s
Japan
India
South
Korea
Taiwan
Thail
and
Singa
pore
Malaysi
a
China
A
B D
SEI 2010: Global Patterns of R&D Expenditures, Chapter 4.
0.0
0.5
1.0
1.5
2.0
2.5
3.0
3.5
4.0
1996 1997 1998 1999 2000 2001 2002 2003 2004 2005 2006 2007P
ER
CE
NT
OF
GR
OS
S D
OM
ES
TIC
PR
OD
UC
T
R&D expenditures as share of economic output for selected countries: 1996–2007
United StatesSouth Korea
Japan
China
EU-27
C
SEI 2010: Comparison of Country R&D Intensities, Chapter 4.
SEI 2010: Global Patterns of R&D Expenditures, Chapter 4. SEI 2010: Global Patterns of R&D Expenditures, Chapter 4.

6 www.nsf.gov/statistics/digest/
U.S. R&D: FUNDING AND PERFORMANCE
A | FUNDING SOURCESIndustry and the federal government are the largest supporters of U.S. R&D. Industry invested $268 billion in R&D in 2008, 67% of the estimated $398 billion national total. It has been the main funding source for U.S. R&D since 1980. Federal R&D support in 2008 stood at $104 billion.
Other sources—chiefly universities and colleges and other not-for-profit organizations—added another $26 billion.
B | TYPES OF R&D Funding sources differ by type of R&D. Industry funds the bulk of applied research and develop-ment ($256 billion of the $328 billion national total in 2008)—work that aims at practical appli-cations, new products, or novel processes.
Basic research, directed primarily toward increasing knowledge or understanding, has long relied on the federal government for about 60% of its support ($39 billion of the 2008 $69 billion national total).
C | ACADEMIC R&D SUPPORTThe bulk of academic R&D is basic research, amounting to more than half of the nation’s total basic research. Sources of support for academic R&D have been stable for nearly two decades: about 60% from the federal government, 20% from institutions’ own funds. Industry funding has gradually declined from 7% to about 6%.
D | PERFORMERSThe nature of R&D varies by performer. Industry is the dominant performer of the nation’s devel-opment and applied research; the federal govern-ment, academic institutions, and other nonprofit organizations combined perform less than 20% of that total.
Universities and colleges are the prime performers of the nation’s basic research, a role they uniquely combine with the training of new researchers. Industry’s share of basic research performance has recently risen after 9 years of decline.
WHY IS THIS IMPORTANT?
Outcomes and benefits of R&D depend not only on the total resources devoted to it but also on the types of R&D these resources support—basic research, applied research, development—and on who performs it.
KEY OBSERVATIONS:

KEY SCIENCE AND ENGINEERING INDICATORS: 2010 DIGEST 7
PE
RC
EN
T
1990 1992 1994 1996 1998 2000 2002 2004 2006 20080
20
40
60
80
PE
RC
EN
T
1990 1992 1994 1996 1998 2000 2002 2004 2006 20080
20
40
60
80
100
PE
RC
EN
T
1990 1992 1994 1996 1998 2000 2002 2004 2006 20080
20
40
60
80
0
50
100
150
200
250
300
350
400
450
1990 1992 1994 1996 1998 2000 2002 2004 2006 2008
$ B
ILLI
ON
S
U.S. R&D expenditures, by source of funds: 1990–2008 Funding sources for U.S. academic R&D: 1990–2008
Performers of U.S. applied research and development: 1990–2008
Performers of U.S. basic research: 1990–2008
A C
D2
SEI 2010: Sources of R&D Funding, Chapter 4.
0
20
40
60
80
PE
RC
EN
T
1990 1992 1994 1996 1998 2000 2002 2004 2006 2008
0
20
40
60
80
PE
RC
EN
T
1990 1992 1994 1996 1998 2000 2002 2004 2006 2008
Funding sources for U.S. applied research and development: 1990–2008
Funding sources for U.S. basic research: 1990–2008
Other
Other
Federal government
Federal government
Industry
Industry
SEI 2010: Sources of R&D Funding and R&D by Character of Work, Chapter 4.
SEI 2010: Sources of R&D Funding and R&D by Character of Work, Chapter 4.
SEI 2010: Financial Resources for Academic R&D, Chapter 5.
NOTES: 2008 data are preliminary. Federal government is intramural only.SEI 2010: Performers of R&D and R&D by Character of Work, Chapter 4.
NOTES: 2008 data are preliminary. Federal government is intramural only.SEI 2010: Performers of R&D and R&D by Character of Work, Chapter 4.
Federal government
Federal government
Federal government
Universities and colleges
All others
All others
All others
Industry
Industry
Industry
Universities and colleges
Other
Federal government
Industry
B1
B2
D1

8 www.nsf.gov/statistics/digest/
U.S. R&D: FEDERAL PORTFOLIO
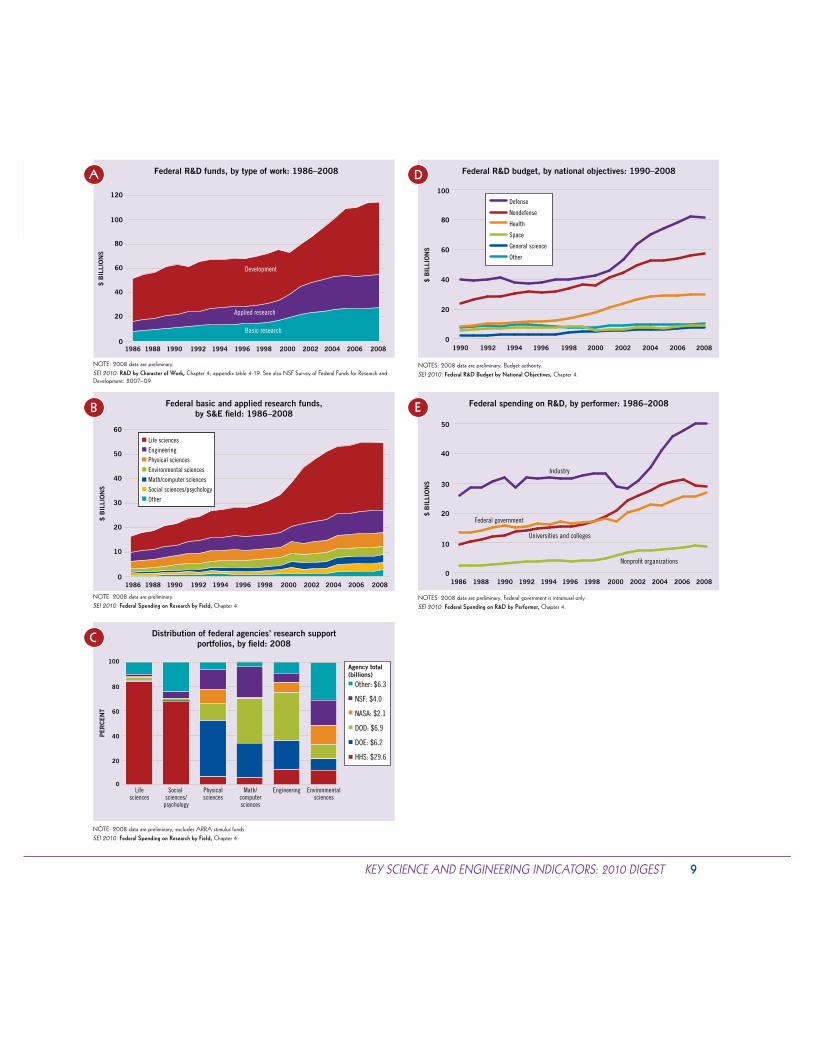
A | TYPE OF WORKFederal funding of R&D has more than doubled over 20 years (not adjusting for inflation). Federal basic and applied research funds have grown more rapidly than funds for development work. Consequently, research now makes up about half of federal R&D funds.
B | SUPPORT FOR S&E FIELDSThe life sciences account for half of the federal portfolio of basic and applied research (develop-ment funds cannot be sorted into S&E fields), up from about 40% two decades earlier. Funding for physical, environmental, and social sciences and funding for engineering have increased at below average rates.
C | AGENCY SUPPORTAgencies of the federal government fund R&D that supports the attainment of agency goals.
The Department of Health and Human Services funds 85% of research in the life sciences ($29.7 billion in 2008), primarily through the National Institutes of Health. The Departments of Defense and Energy and the National Science Founda-tion support 77% of research in math/computer sciences and physical sciences ($8.5 billion).
WHY IS THIS IMPORTANT?
The distribution of R&D funds by the U.S. federal government provides insight into the nation’s broad mission priorities for public expenditures.
KEY OBSERVATIONS:NSF supports research across the range of S&E fields, principally basic academic research.
DOD, DOE, and the National Aeronautics and Space Administration support about 71% of engi-neering research ($9.4 billion in 2008).
D | FOCUSThe Department of Defense, long the largest federal R&D funding agency, has increased its R&D support strongly in recent years. More than half of the federal government’s R&D investment is devoted to defense. More than half of nondefense R&D is related to health, largely funded by the Department of Health and Human Services, primarily through the National Insti-tutes of Health.
E | PERFORMERSDifferent institutions bring different perspec-tives and approaches to R&D. Academic and nonprofit institutions, which tend to concen-trate on basic research, have received steadily increasing federal support. Industry, heavily focused on development and applied research, has recently seen rising federal funding after a decade of no growth.
KEY SCIENCE AND ENGINEERING INDICATORS: 2010 DIGEST 9
$ B
ILLI
ON
S
1990 1992 1994 1996 1998 2000 2002 2004 2006 20080
20
40
60
80
100
Defense
Nondefense
Health
Space
General science
Other
$ B
ILLI
ON
S
1986 1988 1990 1992 1994 1996 1998 2000 2002 2004 2006 20080
10
20
30
40
50
0
20
40
60
80
100
120
1986 1988 1990 1992 1994 1996 1998 2000 2002 2004 2006 2008
$ B
ILLI
ON
S
Federal R&D funds, by type of work: 1986–2008 Federal R&D budget, by national objectives: 1990–2008
Federal spending on R&D, by performer: 1986–2008
A D
E
NOTE: 2008 data are preliminary.SEI 2010: R&D by Character of Work, Chapter 4; appendix table 4-19. See also NSF Survey of Federal Funds for Research and Development: 2007–09.
0
10
20
30
40
50
60
$ B
ILLI
ON
S
1986 1988 1990 1992 1994 1996 1998 2000 2002 2004 2006 2008
Life sciencesEngineeringPhysical sciencesEnvironmental sciencesMath/computer sciencesSocial sciences/psychologyOther
PE
RC
EN
T
0
20
40
60
80
100
Lifesciences
Social sciences/
psychology
Physicalsciences
Math/computersciences
Engineering Environmentalsciences
Other: $6.3
NSF: $4.0
NASA: $2.1
DOD: $6.9
DOE: $6.2
HHS: $29.6
Agency total(billions)
Federal basic and applied research funds, by S&E field: 1986–2008
Distribution of federal agencies’ research support portfolios, by field: 2008
B
C
NOTE: 2008 data are preliminary.SEI 2010: Federal Spending on Research by Field, Chapter 4.
NOTE: 2008 data are preliminary; excludes ARRA stimulus funds.SEI 2010: Federal Spending on Research by Field, Chapter 4.
NOTES: 2008 data are preliminary. Budget authority.SEI 2010: Federal R&D Budget by National Objectives, Chapter 4.
NOTES: 2008 data are preliminary. Federal government is intramural only.SEI 2010: Federal Spending on R&D by Performer, Chapter 4.
Federal government
Universities and colleges
Nonprofit organizations
Industry
Development
Applied research
Basic research
10 www.nsf.gov/statistics/digest/
U.S. S&E WORKFORCE: TRENDS AND COMPOSITION
A | WORKFORCE GROWTHFor nearly five decades, the U.S. S&E workforce (those in S&E jobs) has grown faster than the total civilian workforce. It reached about 5.5 million in 2007.
The increasing number of U.S. S&E degrees earned and rising numbers of foreign-born scientists and engineers have contributed to this growth.
B | S&E EDUCATIONFor nearly two decades, about one-third of all U.S. college freshmen have indicated plans to pursue an S&E degree. Freshman intentions are a leading indicator of future degree distribution.
After about 2000, preferences for the social sciences, psychology, and the biological sciences began rising, and preferences for computer sciences began a steep decline. Engineering dropped sharply after 2004 but rebounded in 2008.
C | FIELD OF DEGREE The changing field composition of new S&E degrees is gradually altering the composition of S&E jobs and the larger U.S. workforce. And emphasis on higher-level S&E skills is growing: advanced S&E degrees have risen faster (70%–75%) than bachelor’s degrees (about 50%) over the past two decades.
Across degree levels, the physical sciences, computer sciences, mathematics, and engineering have had weaker-than-average growth, but engineering doctorates have set records. Bachelor’s and master’s degrees in computer sciences have pulled back from their 2004 record highs to near levels set in 2000. The biological sciences and psychology have shown the strongest gains.
D | NATIONALITYThe U.S. S&E workforce continues to rely heavily on attracting foreign-born scientists and engineers, who are most highly represented in engineering, mathematics, and computer sciences, especially at advanced degree levels.
WHY IS THIS IMPORTANT?
A growing S&E workforce is conducive to increased capacity for innovation. As economies become more knowledge-intensive, S&E skills will be needed by those in jobs not traditionally considered part of the S&E workforce, such as managers, sales representatives, and financial analysts.
KEY OBSERVATIONS:

KEY SCIENCE AND ENGINEERING INDICATORS: 2010 DIGEST 11
THO
US
AN
DS
1989 1991 1993 1995 1997 1999 2001 2003 2005 20070
5
10
15
20
25
30
35
40Social sciences
Biological sciences
Psychology
Engineering
Physical sciences
Computer sciences Mathematics
THO
US
AN
DS
1989 1991 1993 1995 1997 1999 2001 2003 2005 20070
1
2
3
4
5
6
7
8
9Social sciences
Biological sciences
Psychology
Engineering
Physical sciences
Computer sciences Mathematics
PE
RC
EN
T
All S&E fields Engineering Math/computersciences
Physicalsciences
Lifesciences
Social sciences/psychology
0
10
20
30
40
50
60
Bachelor’s
Master’s
Doctorate
PE
RC
EN
T
1960-70 1970-80 1980-90 1990-2000 2000-070
1
2
3
4
5
6
S&E employment
All occupations
Average annual growth in S&E employment and in the total workforce: 1960–2007
S&E master’s degrees earned, by fi eld 1989–2007
S&E doctoral degrees earned, by fi eld 1989–2007
Foreign-born degree holders with highest degree in S&E, by fi eld and degree level: 2003
A
D
SEI 2010: Growth of the S&E Workforce, Chapter 3.
PE
RC
EN
T
1990 1992 1994 1996 1998 2000 2002 2004 2006 20080
2
4
6
8
10
12Social sciences/psychology
Biological sciences
Engineering
Physical sciences
Computer sciences Mathematics
THO
US
AN
DS
1989 1991 1993 1995 1997 1999 2001 2003 2005 20070
20
40
60
80
100
120
140
160Social sciences
Biological sciences
Psychology
Engineering
Physical sciences
Computer sciences Mathematics
College freshmen intending S&E major, by fi eld: 1990–2008
S&E bachelor’s degrees earned, by fi eld 1989–2007
B
SEI 2010: Undergraduate Enrollment in the United States, Chapter 2.
NOTE: Data for 1999 extrapolated.SEI 2010: Undergraduate Degree Awards, Chapter 2.
NOTE: Data for 1999 extrapolated.SEI 2010: S&E Master’s Degrees, Chapter 2.
NOTE: Data for 1999 extrapolated.SEI 2010: S&E Doctoral Degrees, Chapter 2.
SEI 2010: Migration to the United States, Chapter 3.
C1
C2
C3

12 www.nsf.gov/statistics/digest/
RESEARCH OUTPUTS: PUBLICATIONS AND PATENTS
A | PUBLICATIONSThe EU-27 leads the world in numbers of S&E articles published, but the United States continues to be the top country producer.
China, with a rapidly developing science base, produced 8% of the world’s research publications in 2008, becoming the second largest single-country producer. It ranked 14th in 1995, with 2% of world share.
B | RESEARCH PORTFOLIOSThe distribution of a country’s research publica-tions across different fields broadly reflects its research priorities and relative strengths, as well as its ability to absorb advances achieved elsewhere.
More than half of U.S. articles report on research in the medical and life sciences. In contrast, more than half of the research articles published by Asian scientists and engineers are in the natural sciences and engineering.
C | PATENTSPatents protect the property rights of inventors. Patent awards are rising as knowledge-intensive economic activity expands worldwide.
WHY IS THIS IMPORTANT?
Research produces new knowledge, products, or processes. Research publications reflect contributions to knowledge, patents indicate useful inventions, and citations on patents to the scientific and technical literature indicate the linkage between research and practical application.
KEY OBSERVATIONS:Inventors from around the globe seek patent protection in the United States because of its large and open market. U.S. patents awarded to foreign inventors offer a broad indication of the distribu-tion of inventive activity around the globe.
Inventors in the United States, the EU-27, and Japan produce almost all of these patents. U.S. patenting by Asian inventors is on the rise, driven by activity in Taiwan and South Korea, but Chinese and Indian patenting remains modest.
D | SCIENCE-PATENT LINKAGEPatents list the prior scientific and technological knowledge on which they are built. Increasingly, U.S. patent applications have cited scientific articles as one such source.
Article citations have risen from 92,000 in 1998 to 110,000 in 2008, with 68% of these patent citations being to literature in the biological and medical sciences. About half of the 2008 cita-tions were to non-U.S. articles.
Over 60% of the U.S.-authored articles cited on U.S. patents have academic scientists and engi-neers as authors, indicating the link between academic research and valuable inventions.

KEY SCIENCE AND ENGINEERING INDICATORS: 2010 DIGEST 13
0
10
20
30
40
50
60
1998 1999 2000 2001 2002 2003 2004 2005 2006 2007 2008
THO
US
AN
DS
PE
RC
EN
T
0
20
40
60
80
100
All others
Federalgovernment
Nonprofit institutions
Industry
Academic institutions
BiologyChemistry PhysicsMedicalsciences
Engineering
THO
US
AN
DS
1995 1997 1999 2001 2003 2005 2007
0
50
100
150
200
250
300
Science and engineering articles, by selected countries/regions: 1995–2007
Citations in U.S. patents to S&E articles, by selected article field: 1998–2008
U.S. patent citations to U.S.-authored articles, by field and author sector: 2008
A
SEI 2010: S&E Article Output, Chapter 5.
PE
RC
EN
T
0
20
40
60
80
100Social/behavioralsciences
Agricultural/biological sciences
Medicalsciences
Engineering
Naturalsciences
0
10
20
30
40
50
60
70
80
90
100
1990 1992 1994 1996 1998 2000 2002 2004 2006 2008
THO
US
AN
DS
Field shares of research articles, by selected locations: 2007
U.S. patents granted, by country/region of inventor: 1990–2008
B
C
NOTE: Natural sciences include astronomy, chemistry, physics, geosciences, mathematics, and computer sciences.SEI 2010: S&E Article Output, Chapter 5.
NOTES: “Other Asia” is China, India, Indonesia, South Korea, Philippines, Singapore, Taiwan, Thailand, Vietnam. Three-year moving average.SEI 2010: Global Trends in Patenting, Chapter 6.
NOTE: Citation counts lag articles’ publication year; for example, articles cited in 2008 patents were published in 1998–2003.SEI 2010: Patent-to-Literature Citations, Chapter 5.
SEI 2010: Patent-to-Literature Citations, Chapter 5.
United
State
sChin
a
Polan
d
RussiaIndia
Franc
e
Mexico
Singa
pore
Spain
Brazil
Japan
German
y
Israe
l
South
Korea Italy
Switz
erlan
d
Netherl
ands
Turkey
Taiwan
United
King
dom
South
Afric
aCan
ada
Austr
alia
United States
Rest of world
Japan
EU-27
Other Asia
Biological sciences
Medical sciences
ChemistryPhysics
Engineering
United States
Rest of world
China
Japan
India
EU-27
Asia total
D1
D2

14 www.nsf.gov/statistics/digest/
GEOGRAPHY OF S&T: GLOBALIZATION OF CAPABILITIES
WHY IS THIS IMPORTANT?
Today’s interdependent economies rely on science, engineering, and technology for innovations that will keep them competitive. To that end, many governments have adopted policies to build or improve national S&T capabilities.
KEY OBSERVATIONS:
A | R&D DISTRIBUTIONThe distribution of R&D expenditures has shifted from 1996 to 2007. Asia’s share has risen to nearly one-third, driven mostly by China’s rapid R&D growth.
B | RESEARCHERS The estimated number of researchers grew from about 4 million in 1995 to about 5.8 million in 2007, rising more rapidly in developing than in industrialized countries.
The combined U.S./EU-27 share of researchers declined from 51% to 49%; Japan’s share dropped from 17% to 12%. The combined shares of South Korea, Taiwan, China, and Singapore rose from 16% to 31%.
C | CROSS-BORDER R&DOverseas R&D expenditures by foreign affiliates of U.S. multinational companies (MNCs) rose from $12.6 billion in 1995 to $28.5 billion in 2006. Europe’s share of these overseas expen-ditures fell from 73% to 65%, and Asia’s share increased from 15% to 20%.
Foreign MNCs spent $34 billion in the United States in 2006, up from $15 billion in 1995.
European-owned companies’ share of these expenditures was little changed at 75%.
D | HIGH TECHNOLOGY MANUFACTURINGThe U.S. and EU-20 shares of world high tech-nology manufacturing output have remained at high levels for more than a decade, measured in value-added terms (broadly, final product sales less the cost of intermediate goods and services).
China’s rapid growth in high-technology output has driven its substantial world share gain; output decline in Japan in that sector has resulted in a steep share loss.
E | HIGH TECHNOLOGY EXPORTSExports of high technology products (excluding intra-EU trade) expanded from $732 billion in 1995 to $2.3 trillion in 2008, resulting in major shifts in countries’ export positions.
U.S. and Japan’s world high technology export shares fell by about one-third and one-half over the period, respectively; the EU-27’s share was stable.
China’s share more than tripled, reaching 20%. Exports of the Asia-8 economies, steady at about 28%, included substantial intermediate goods trade with China and other Asian economies.

KEY SCIENCE AND ENGINEERING INDICATORS: 2010 DIGEST 15
PE
RC
EN
T G
LOB
AL
TOTA
L
1995 1996 1997 1998 1999 2000 2001 2002 2003 2004 2005 2006 20070
5
10
15
20
25
30
35
40
PE
RC
EN
T G
LOB
AL
TOTA
L
0
5
10
15
20
25
30
1995 1996 1997 1998 1999 2000 2001 2002 2003 2004 2005 2006 2007 2008
PE
RC
EN
T
North America Europe Asia/Pacific Rest of world0
10
20
30
40
50
1996: $525 billion
2007: $1.1 trillion
Location of estimated worldwide R&D expenditures: 1996 and 2007 High-technology manufacturing value-added share, by country/economy: 1995–2007
Exports of high-technology manufactured goods, by country/economy: 1995–2008
A D
E
SEI 2010: Global Patterns of R&D Expenditures, Chapter 4.
PE
RC
EN
T
-4
-2
0
2
4
6
8
10
12
United EU-27 Russia Japan South Taiwan China SingaporeStates Korea
(1.47 m) (1.36 m) (0.47 m) (0.71 m) (0.22 m) (0.10 m) (1.42 m) (0.03 m)
0.40.9
11.425.8
2006
1995
1.64.6
1.95.6
0.3
0.002 0.04
0.02 0.07
0.1 0.8
9.118.6
0.10.2
1.31.61.1
2.5
1.3
CU
RR
EN
T U
.S. D
OLL
AR
S (
BIL
LIO
NS
)
Average annual growth rates in number of researchers, by country/economy: 1995–2007
R&D performed in the United States by U.S. affiliates of foreign companies, by investing region, and R&D performed abroad by foreign affiliates of U.S. MNCs, by host region: 1995 and 2006
B
C
NOTE: Estimated number of researchers (in millions) is for 2007 and shown below country/economy. U.S. 2007 estimate based on long-term growth rate.SEI 2010: Global S&E Labor Force, Chapter 3.
NOTE: China includes Hong Kong.SEI 2010: High-Technology Manufacturing Industries, Chapter 6.
NOTES: China includes Hong Kong. Excludes intra-EU trade.SEI 2010: Trade of High-Technology Goods, Chapter 6.
United States
United States
EU-20
EU-27
Japan
Japan
Rest of world
Rest of world
China
China
Asia-8
NOTE: Data are for majority-owned affiliates only.SEI 2010: R&D by Multinational Companies, Chapter 4.
Asia-8

16 www.nsf.gov/statistics/digest/
Applied research. Systematic study to gain knowledge or understanding to meet a specific, recognized need.
ARRA. American Recovery and Reinvestment Act of 2009.
Asia-8. China, India, Japan, Malaysia, Singapore, South Korea, Taiwan, Thailand.
Basic research. Systematic study to gain more comprehensive knowledge or understanding of the subject under study without specific applications in mind.
Development. Systematic use of the knowledge or understanding gained from research directed toward the production of useful materials, devices, systems, or methods, including the design and development of prototypes and processes.
DOD. Department of Defense.
DOE. Department of Energy.
GDP. Gross domestic product. The market value of all final goods and services produced within a country within a given period of time.
EU-20. The 20 European Union member nations with substantial high technology manufacturing: Austria, Belgium, Bulgaria, Czech Republic, Denmark, Finland, France, Germany, Greece, Hungary, Ireland, Italy, Netherlands, Poland, Portugal, Romania, Slovakia, Spain, Sweden, United Kingdom.
EU-27. The 27 member nations of the European Union: Austria, Belgium, Bulgaria, Cyprus, Czech Republic, Denmark, Estonia, Finland, France, Germany, Greece, Hungary, Ireland, Italy, Latvia, Lithuania, Luxemburg, Malta, the Netherlands, Poland, Portugal, Romania, Slovakia, Slovenia, Spain, Sweden, United Kingdom.
HHS. Department of Health and Human Services.
High technology manufacturing. Manufacturing in five industries, identified by the Organization for Economic Co-operation and Development, that have particularly strong linkages to science and technology: aerospace, communications and semiconductors, computers and office machinery, pharmaceuticals, and scientific instruments.
Knowledge-intensive economy. Economies in which research, its commercial exploitation, and intellectual work play a substantial role.
Majority-owned affiliate. Affiliates in which the ownership stake of parent companies exceeds 50%.
MNC. Multinational company.
NASA. National Aeronautics and Space Administration.
NSB. National Science Board.
NSF. National Science Foundation.
R&D. Research and development.
R&D intensity. R&D as a proportion of gross domestic product.
S&E. Science and engineering.
S&T. Science and technology.
SEI. Science and Engineering Indicators.
SRS. Division of Science Resources Statistics, National Science Foundation.
Value-added. Sales minus the cost of purchased domestic and foreign inputs and materials.
GLOSSARY AND KEY TO ACRONYMS

KEY SCIENCE AND ENGINEERING INDICATORS: 2010 DIGEST 17
GLOSSARY EXPLORE FURTHER
www.nsf.gov/statistics/indicators/
T o read more on the themes presented in this
digest, please see the detailed analysis and
fuller discussion of each of the key indicators
presented in SEI 2010. Each theme is matched with
its source SEI 2010 chapter or chapters in the list
below. SEI 2010 also provides a wealth of detailed
information on U.S. mathematics and science
education at the elementary and secondary levels
(Chapter 1), public attitudes and understanding of
science and engineering (Chapter 7), and state-level
comparisons of selected science and engineering
indicators (Chapter 8).
GLOBAL R&D: MEASURING COMMITMENT TO INNOVATIONChapter 4. Research and Development: National
Trends and International Linkages
U.S. R&D: FUNDING AND PERFORMANCEChapter 4. Research and Development: National
Trends and International Linkages
Chapter 5. Academic Research and Development
U.S. R&D: FEDERAL PORTFOLIOChapter 4. Research and Development: National
Trends and International Linkages
Chapter 5. Academic Research and Development
U.S. S&E WORKFORCE: TRENDS AND COMPOSITIONChapter 2. Higher Education in Science and
Engineering
Chapter 3. Science and Engineering Labor Force
RESEARCH OUTPUTS: PUBLICATIONS AND PATENTSChapter 5. Academic Research and Development
Chapter 6. Industry, Technology, and the Global
Marketplace
GEOGRAPHY OF S&T: GLOBALIZATION OF CAPABILITIESChapter 3. Science and Engineering Labor Force
Chapter 4. Research and Development: National
Trends and International Linkages
Chapter 6. Industry, Technology, and the Global
Marketplace

18 www.nsf.gov/statistics/digest/
The complete SEI 2010 report and its related
resources, described below, are available on
the Web at www.nsf.gov/statistics/indicators/.
An interactive version of this digest is also available
online at www.nsf.gov/statistics/digest/.
Companion piece. The Board’s companion piece,
Globalization of Science and Engineering Research
(NSB 10-03), is a “companion” policy statement to SEI
2010. The Board focuses in this document on trends
that it believes raise important policy concerns and
should be brought to the attention of the President,
Congress, and the public.
State data tool. This interactive data tool is
associated with Chapter 8, “State Indicators.” By
selecting indicators and states, data users can create
custom tables.
Presentation graphics. Presentation graphics,
in PowerPoint slide and image (JPEG) formats,
accompanied by their supporting data (Excel), are
based on figures in the full SEI 2010 text. Selected
figures are modified to fit the presentation-slide
format, and slides can be previewed using the
thumbnail view.
Source data. Data supporting each figure, table, and
appendix table in SEI 2010 are available for download
in Excel format. Links are provided on the SEI
2010 main page to the lists of figures, tables, and
appendix tables, each organized by chapter.
SEI 2010 ONLINE RESOURCES

ACKNOWLEDGMENTSThis digest was developed with guidance from the National Science Board by Rolf Lehming, National Science
Foundation, Division of Science Resources Statistics (SRS), assisted by the Division’s analytic staff. The
volume was edited by Cheryl Roesel, SRS. Eileen Kessler and staff at OmniStudio, Inc., designed the layout.
Development of the Web version was guided by John Gawalt and produced by Robin Pentola, with technical
assistance from staff of Compuware Corporation.
Proprietary data in “Research Outputs: Publications and Patents” were provided by Thomson Reuters, Science
Citation Index and Social Sciences Citation Index, http://thomsonreuters.com/products_services/science/;
analytical support for article and patent data was provided by The Patent BoardTM, http://patentboard.com/.
Proprietary data in “Geography of S&T: Globalization of Capabilities” were provided by IHS Global Insight,
World Industry Service database, and World Trade Service database.
COVER IMAGE The cover design is based on a computer-simulated visualization of Mach 1 homogeneous turbulence, created
by the passage of strong shock fronts through gas. Regions having the weakest vorticity are blue. As the
vorticity increases in strength, regions become red, yellow, and, finally, white. The dynamic visualization was
created at the Laboratory for Computational Science and Engineering (LCSE), a facility in the University of
Minnesota’s Digital Technology Center, where innovative hardware and system software solutions to problems
in computational science and engineering can be tested and applied. Work in the LCSE has been supported
by a series of National Science Foundation equipment grants (most recently CNS 07-08822). (Credit: Paul
Woodward, Laboratory for Computational Science and Engineering, University of Minnesota.)

NSB 10-02