Embed Size (px)
Citation preview

ACCOUNTING OFFICER’S OVERVIEW - continued
National TreasuryDepartment:
REPUBLIC OF SOUTH AFRICA
national treasury
NT AR 10-11_10.indd 1 2011/08/17 10:01 AM

NT AR 10-11_10.indd 2 2011/08/17 10:01 AM

NatioNal treasury aNNual report 2010/11Published by National Treasury
Private Bag X115
Pretoria
0001
South Africa
Tel: +27 12 315 5526
Fax: +27 12 315 5126
The 2010/11 National Treasury
Annual Report is also available on
www.treasury.gov.za
Editorial, coordination and layout:
National Treasury Communications
Chief Directorate
Printing and binding:
Formset Printers
ISBN: 978-0-621-40142-4
RP: 104/2011
NT AR 10-11_10.indd 3 2011/08/17 10:01 AM

NT AR 10-11_10.indd 4 2011/08/17 10:01 AM

Mr p Gordhan
Minister of Finance
I have the honour
of submitting the Annual Report
of the National Treasury for the period
1 April 2010 to 31 March 2011.
l Fuzile
Director-General
National TreasuryDepartment:
REPUBLIC OF SOUTH AFRICA
national treasury
NT AR 10-11_10.indd 5 2011/08/17 10:02 AM

CONTENTS
Accounting Officer’s Overview 2
The Ministry 5
Mission Statement 8
Minister’s Statement on policy and commitment 11
Legislative Mandate 14
Legislation Enacted 15
Programme 1: Administration 17
Programme 2: Public Finance and Budget Management 24
Programme 3: Asset and Liability Management 43
Programme 4: Financial Management and Systems 58
Programme 5: Financial Accounting and Reporting 65
Programme 6: Economic Policy and International Financial Relations 74
Programme 7: Provincial and Local Government Transfers 86
Programme 8: Civil and Military Pensions 91
Programme 9: Fiscal Transfers 96
Annual Financial Statements 99
Report of the Audit Committee 100
Annual Financial Statements of the Project Development Facility 211
Annual Financial Statements of the Technical Assistance Unit 242
Human Resources Management 261
Annexures 289
NT AR 10-11_10.indd 6 2011/08/17 10:02 AM

1
Nat
iona
l Tre
asur
y A
nnua
l Rep
ort 2
010/
11
Accounting Officer’s Overview
ACCOUNTING OFFICER’S OVERVIEW - continued
ACCOUNTING OFFICER’S OVERVIEW
NT AR 10-11_10.indd 1 2011/08/17 10:02 AM

Nat
iona
l Tre
asur
y A
nnua
l Rep
ort 2
010/
11
2
Accounting Officer’s Overview
ACCOUNTING OFFICER’S OVERVIEW
In 2010, Cabinet adopted 12 outcomes to address government’s strategic priorities in a practical and meaningful
manner. The National Treasury fully adopted the outcomes approach in crafting our strategic document last year. This
allowed us to refocus our energies and to further align ourselves with the government programme of action. In
undertaking our work, and as part of the rigorous expenditure reprioritisation, we were able to further give effect to
government’s strategic priorities.
This document covers the period 1 April 2010 to 31 March 2011. The period tells a story of a post crisis recovery which,
though still somewhat fragile, is beginning to strengthen, paving the way for a growth friendly fiscal consolidation. Our
economy gradually recovered from the devastating 2008 financial crisis, growing at 2.7 per cent in 2010. Our February
forecast projects GDP growth at 3.4 per cent this year and is set to rise to 4.4 per cent by 2013. The International Monetary
Fund also raised our growth forecast to 4.0 per cent this year. Inflation remained within the target band with interest rates
at 30 year lows of 5.5 per cent, having been last reduced by 50 basis points in November 2010. In recent months, domestic
economic activity also gathered pace with a pickup in business confidence. Private gross fixed-capital formation increased
in the second and third quarters of 2010 – a marked turnaround after five successive quarters of decline. Importantly,
our prudent debt management structure coupled with sound macro-economic fundamentals ensured that major credit
rating agencies affirmed our country’s investment grade rating and the removal of the negative outlook on our rating by
Fitch and Standard & Poor.
On the downside, the country continues to face chronic unemployment made worse by the massive job losses caused
by the recession, totalling about one million by June 2010. The debt stock also continued to rise which also meant rising
debt service costs.
As part of our work during the reporting period, we continued to respond to the 2008 recession with appropriate fiscal and
monetary measures to ensure that growth returns to pre-recession levels, and accelerates even further. With government
having placed job creation at the heart of policy formulation, we are aiming to create many more jobs as economic
growth picks up, with a particular focus on increasing employment among the young who, at about 50 per cent of the
unemployed, bear the heaviest burden of unemployment.
Over the past financial year, the department supported the reprioritisation of spending in line with outcomes, a process
which resulted in reprioritisation and reallocation of R30.6 billion identified and included in the 2011 Budget. The divisions
also developed a framework which provided for a shift in expenditure planning such that budgeting occurs by function
rather than by department. We also focused our attention on working on several health financing initiatives including on
the National Health Insurance with the first set of budget allocations made in this year’s Budget.
The department also continued to play a leading role in advising and providing project management support and
technical assistance to other public sector departments. This support included assistance provided to the Technical
Co-ordination Committee, Inter-Ministerial Committee and Organising Committee ahead and during the successful
2010 FIFA World Cup. In its support for infrastructure planning and implementation, the Infrastructure Development
Improvement Programme developed a quality assurance model to further improve infrastructure delivery and ensure
increased contribution to sustainable capacity building in departments.
NT AR 10-11_10.indd 2 2011/08/17 10:02 AM

3
Nat
iona
l Tre
asur
y A
nnua
l Rep
ort 2
010/
11
Accounting Officer’s Overview
ACCOUNTING OFFICER’S OVERVIEW - continued
During the reporting period we revised the provincial and local government equitable share formulae, resulting in
the addition of a new health component and more funds being directed towards poor rural municipalities. Further,
conditional grants for infrastructure were restructured and new conditional grants introduced to provide for infrastructure
priorities in education and to upgrade informal settlements in metropolitan municipalities.
Promoting greater accountability and transparency in government remains one of our key focus areas. We developed
fraud detection guidelines and successfully conducted 20 investigations into supply chain management practices. In
addition, we issued instruction notes that dealt with prohibiting collusive bidding or bid-rigging and also amended
guidelines to include functionality as a criterion for evaluating the status of recommended bidders on the database of
restricted suppliers and the Register for Tender Defaulters.
National Treasury continues to be the centre for economic policy formulation and over the past year we continued to
provide advice on and co-ordinate growth-enhancing policies. This included contributing to the G20 Mutual Assessment
Process and Framework for Strong, Sustainable and Balanced growth and providing input to the Economic Sectors and
Employment cluster on Outcome 4 – Decent employment through inclusive growth.
Work continued on environmental fiscal reform with a particular focus on the possible use of taxes and incentives to
deal with environmental challenges such as climate change. In December 2010, we published for public comment a
discussion paper titled “Reducing Greenhouse Emissions: The Carbon Tax Option” and we aim to provide the design
features of this proposed tax when we table the 2012 Budget. We also concluded tax treaties with Seychelles, Sweden,
the United Kingdom and Kenya.
Our relationship with multilateral institutions such as the World Bank, International Monetary Fund and African
Development Bank remains sound. We continued to participate in the G-20, G-24 and BRICS for global coordination of
economic and financial policy issues. Our contribution within regional economic groupings of SADC and SACU remains
strong and relevant.
Having assumed my role as Accounting Officer on 16 May 2011, I wish to thank the previous Director-General, Lesetja
Kganyago, for the leadership he demonstrated during his tenure in the department. The achievements during the period
under review were with him at the tiller of this steady ship.
Finally, I wish to thank the Minister and Deputy Minister of Finance, and the Treasury team, for the profoundly warm
welcome which I have come to enjoy in my new role in the organisation.
Lungisa Fuzile
Director-General
National Treasury
NT AR 10-11_10.indd 3 2011/08/17 10:02 AM

Nat
iona
l Tre
asur
y A
nnua
l Rep
ort 2
010/
11
4
The Ministry
ThE mINISTRy - continued
ThE mINISTRy
NT AR 10-11_10.indd 4 2011/08/17 10:02 AM
5
Nat
iona
l Tre
asur
y A
nnua
l Rep
ort 2
010/
11
The Ministry
ThE mINISTRy
ThE mINISTRyThe Finance Ministry is a leading centre of specialised finance, economic and accounting public sector organisations.
Finance Minister Pravin Gordhan and his deputy Nhlanhla Nene, the two political heads of these organisations continued
to steer and provide political guidance during the reporting period. This ensured high levels of consistent service delivery,
for anything short of hard work short-changes the public.
South Africa continues to have the most transparent budget when surveyed against 94 other countries including the
most powerful economies in the world. The National Treasury continued to improve the quality of information presented
in the Budget – the 2011 Budget included more detailed trendable service delivery information. This will ensure better
accountability by those entrusted with managing public funds.
A recovery in the domestic economy is underway and macro-economic and fiscal policies continue to support stronger
and faster economic growth. Unemployment, especially with the youth remains a challenge. The National Treasury
released a discussion document which sought to contribute toward government’s multi-pronged strategy to tackle youth
unemployment. All stakeholders should move with speed to ensure that debate moves to implementation phase such
that those waiting on government are not further disadvantaged.
The ministry remains committed to having conversations about crucial issues in society especially in the economic
environment.
NT AR 10-11_10.indd 5 2011/08/17 10:02 AM

Nat
iona
l Tre
asur
y A
nnua
l Rep
ort 2
010/
11
6
The Ministry
ThE mINISTRy - continued
INTERNATIONAl VISITS UNdERTAkEN by ThE mINISTER OF FINANCE, PRAVIN GORdhAN, dURING ThE 2010/11 FINANCIAl yEAR
2010
Date Country reason
21-27 April 2010 Washington, USA IMF /WB spring Meetings
4-7 May 2010 Dar es Salaam,Tanzania WEF Africa
27-28 May 2010 Abidjan, Cote d’Ivore AFDB Meetings
2-7 June 2010 Busan, Korea G20 Finance Ministers and Central Bank Governors Meetings
26-27 June 2010 Toronto, Canada G-20 Summit
13 Aug 2010 Windhoek, Namibia SADC Summit of Heads of State
14-18 Aug 2010 Freetown, Sierra Leone African Caucus Meeting
13 – 17 Sept 2010 London, UK UK State Visit with Deputy-President Motlanthe
5-10 Oct 2010 Washington , USAC10, IMF / WB - Africa Group I Constituencies Meetings and IMF / WB - Annual Meeting Plenary Session
20-24 Oct 2010 Korea, Gyeongju, G-20 FM / CBG Meetings
31 Oct – 2 Nov 2010 London, United Kingdom Keynote address at FT: Private Equity in Africa
9 – 13 Nov 2010 Seoul, Hong Kong G-20 Summit
10 -12 Nov -2010 Seoul, Hong Kong G-20 Business Summit
24 Nov – 1 Dec 2010 London, UK Investec CEO’s Conference and Royal African Society Breakfast
201124 – 30 Jan 2011 Davos, Switzerland WEF Meetings
17 – 20 Feb 2011 Paris, France G-20 FM & CBG Meeting
28 Feb – 4 Mar 2011 Paris, France State Visit to Paris with President Zuma
21 – 23 Mar 2011 London, UK The Times CEO Business Summit
29 Mar –2 Apr 2011 Nanjing, China High Level Seminar
INTERNATIONAl VISITS UNdERTAkEN by ThE dEPUTy mINISTER OF FINANCE, NhlANhlA NENE, dURING ThE 2010/11 FINANCIAl yEAR
2010
Date Country Meeting
29 March 2010 Singapore The Signing Ceremony between OM Holdings Limited and Ntsimbintle Mining (OM Holdings Limited)
19 April 2010 Windhoek, Namibia The 21st Meeting of the SACU Council of Ministers Summit
21 to 22 April 2010 Windhoek, Namibia The SACU Heads of State and Government Meeting
27 to 28 May 2010 Paris, France The OECD Ministerial Council Meeting
12 to 13 August 2010 Windhoek, Namibia SADC Ministerial Task Force Regional Economic Integration Council Meeting
16 to 17 August 2010 Freetown, Sierra Leone Meeting of African Governors of the African Caucus
14 to 17 September Seoul, Korea 2010 Korea-Africa Economic Cooperation (KOAFEC) Ministerial Conference
06 to 10 October 2010 Washington, D.C, USACommonwealth Ministers of Finance Meeting and the Annual Meetings of the IMF and World Bank
201131 March to 01 April 2011 London 2nd Commonwealth Secretariat Stakeholders Conference on Debt Management
13 to 15 April 2011 Sanya Hainan Island, China The BRICS Summit
26 to 28 May 2011 Rio de Janeiro, Brazil High Level Seminar on Managing Capital Flows in Emerging Markets
NT AR 10-11_10.indd 6 2011/08/17 10:02 AM

7
Nat
iona
l Tre
asur
y A
nnua
l Rep
ort 2
010/
11
The Ministry
ThE mINISTRy - continued
mISSION STATEmENT
NT AR 10-11_10.indd 7 2011/08/17 10:02 AM

Nat
iona
l Tre
asur
y A
nnua
l Rep
ort 2
010/
11
8
Mission Statement
mISSION STATEmENT
VISION
National Treasury is the custodian of the nation’s financial resources. We hold ourselves accountable to the nation to
discharge our responsibilities professionally and with humility, with the aim of promoting growth and prosperity for all.
We aspire to excellence in the quality of our analysis, our advice and the execution of our financial management
responsibilities. We aim to realise the full potential of South Africa’s economy and people and to mobilise the resources of
the state, business enterprises and the wider community in a partnership of trust and mutual respect.
mISSION ANd ObJECTIVES
National Treasury aims to promote economic development, good governance, social progress and rising living standards
through accountable, economic, efficient, equitable and sustainable management of South Africa’s public finances.
We endeavour to advance economic growth, broad-based empowerment, progressive realisation of human rights and
the elimination of poverty. We are responsible for preparing a sound and sustainable national Budget and an equitable
division of resources among the three spheres of government.
We strive to raise fiscal resources equitably and efficiently and to manage government’s financial assets and liabilities
soundly. We promote transparency and effective financial management.
VAlUES
As custodians of the nation’s financial resources, the National Treasury acknowledges the authority of Parliament through
whom we are accountable to the nation. We value teamwork, sound planning and enthusiasm and strive continually to
improve the quality, accuracy and reliability of our service delivery.
Our people are our most valued assets. We seek to be an employer of choice, we invest in the education and training of
our staff, we cultivate a learning and consultative environment, we make use of the best available technological support
and we aim to mobilise the full potential of our people.
In our dealings with the public and with our colleagues we act transparently and with integrity, showing respect and
demonstrating fairness and objectivity.
In achieving these things, we will honour the faith that the South African public has placed in us.
NT AR 10-11_10.indd 8 2011/08/17 10:02 AM

9
Nat
iona
l Tre
asur
y A
nnua
l Rep
ort 2
010/
11
Organogram
ORGANOGRAm
Mini
ster o
f Fina
nce
Prav
in G
ordh
anDe
puty
Mini
ster o
f Fina
nce
Nhla
nhla
Nen
e
Direc
tor-G
enera
l Lu
ngisa
Fuzil
e Ou
tgoin
g Dire
ctor-G
enera
lLe
setja
Kgan
yago
•MediaLiaison&Communications
•LegalServices
•Legislation
•InternalAuditFunction
•ChiefRiskOfficer
Head
CorporateServices
Mar
ion
Mbi
na-
Mth
embu
•ProjectSupport
Office
•HumanResources
Ope
ration
s • Performance
&Development
•ChiefFinancial
Officer
•ChiefRiskOfficer
•Information
Technology
Head
Intergovernmental
Relations
Kenn
eth
Brow
n
•LocalGovernment
BudgetAnalysis
•Intergovernm
ental
Policy&Planning
•Provincial&Local
Government
Infrastructure
•Provincial
Budget Analysis
H ead
TaxandFinancial
SectorPolicy
Ism
ail
Mom
onia
t
•FinancialSector
Development
•FinancialServices
• FinancialStability
•EconomicTax
Analysis
•LegalTaxDesign
Head
Offi
ceofthe
Accountant-General
Free
man
No
mva
lo
•CapacityBuilding
•MFMA
Implementation
• AccountingSup-
port&Integration
•InternalAudit
Support
•RiskManagement
• Technical
SupportServices
•Governance
Monitoring &
Compliance
• SpecialisedAudit
Services
H ead
PublicFinance
An
drew
Do
nald
son
•ProtectionServices
•EconomicServices
•Administrative
Services
•Education&
RelatedDepart-
ments&Labour
•Health&Social
Development
•Technical
AssistanceUnit
•UrbanDevelop-
ment&Infrastruc-
tur
e • FIFA2010World
Cup
H ead
Asset&Liability
Management
L ung
isa
Fuzil
e
•SectoralOversight
•Liability
M
anagement
• Financial
Ope
ration
s • Strategy&Risk
Management
•Governance&
Analysis
Head
Economic Policy
C h
risto
pher
Lo
ewal
d
• RegulatoryImpact
Assessm
ent
•Modelling&
Fore
casti
ng
•Microeconomic
poli
cy
•Macroeconomic
poli
cy
Actin
g Hea
d BudgetOffi
ce
M
atth
ew
Sim
mon
ds
•Expenditure
Planning
•PublicFinance
Statistics
•International
Development
Coordination
•FiscalPolicy
• PublicPrivate
PartnershipUnit
• PublicEntities
GovernanceUnit
•Neighbourhood
Development
Unit
H ead
SpecialistFunctions
C oen
Kr
uger
•Contract
Management
•Norms&Standards
• SupplyChain
Policy
• FinancialSystems
H ead
International&
R egionalEconomic
Policy
Mm
akgo
shi
Phet
la-L
ekhe
the
• AfricanEconomic
Integration
•International
Finance &
Development
NT AR 10-11_10.indd 9 2011/08/17 10:02 AM

Nat
iona
l Tre
asur
y A
nnua
l Rep
ort 2
010/
11
10
The Ministry
ThE mINISTRy - continued
mINISTER’S STATEmENT ON POlICy ANd COmmITmENT
NT AR 10-11_10.indd 10 2011/08/17 10:02 AM
11
Nat
iona
l Tre
asur
y A
nnua
l Rep
ort 2
010/
11
Minister’s Statement on Policy and Commitment
mINISTER’S STATEmENT ON POlICy ANd COmmITmENT
The past year represents our first year of recovery from the deep recession of 2009 but the global environment
remains uncertain. While rapid growth in the developing countries continues, the pace of recovery in the developed
economies is worryingly slow. At this time of global transition we can expect continuing volatility and frequent
set-backs. In recent months the source of concern has shifted from the private financial systems of the world to the
management of public resources.
In South Africa, by contrast, the commitment to careful management of the fiscus has been strengthened over the last
few years, as we have witnessed the benefits of creating space for effective fiscal action in times of crisis. Thus National
Treasury has played a central role in helping South Africa navigate this difficult global environment thus far, and in spite of
the global risks, our domestic economy continues to recover and our public finances remain strong and robust.
With economic growth of 3.4% projected for 2011, increasing to 4.4% by 2013, we have the challenge of ensuring that this
growth is inclusive so that all our citizens feel its positive effects. To ensure that the next round of growth is truly inclusive
we must act to restructure the economy and maximize the job-intensity of our growth. This is the key to reducing the
unacceptably high level of inequality that exists in our society. From the point of view of the budget, the over-riding
concern should be to ensure that we prioritise spending in areas that will deliver the kind of growth we seek, and act
decisively to shift the composition of our spending towards further infrastructure development.
Whilst the present realities serve to fortify our determination as the political leadership to move with determination and
in unison, they also offer a sobering view of the challenges that lay before us. They validate the notion that, for many years
ahead, employment will have to be at the centre of South Africa’s growth and development path – especially the creation
of work and learning opportunities for young people.
South Africa’s New Growth Path is focussed job creation that forms part of a broad framework for improving living
conditions, greater social cohesion, a competitive economy and a more equal and inclusive society.
Alongside job-creation initiatives, steps are under way to improve income security and social protection of employees,
and to construct an NHI system. These are long-term objectives, yet they must proceed with vigour. Success rests on
stronger economic growth, effective implementation, and sound fiscal and financial management of the economy.
The year was also marked by several achievements such as our exemplary hosting of the Fifa 2010 Soccer World Cup
and being ranked as the top country out of 94 countries in the Open Budget Survey 2010. Our focus on improving value
received for public funds spent, has begun yielding results. The fight against corruption is continuing, and we remain
steadfast in our aim to eliminate this form of wastage over the medium-term. The focus on improving the approach
to procurement is also continuing. Early indications are that improvements are being yielded, with substantial savings
realised in the recent procurement of antiretrovirals (ARV’s).
Whilst the world is recovering from the greatest recession since the Great Depression, the fragility and unevenness of the
recovery promises to remain for a while to come. Although South Africa was relatively well positioned as a result of several
years of prudent fiscal policy, consistently improving revenue collection rates and pro-poor resource focus, we should
remain mindful that the rules of the global economic “game” are being re-written on a daily basis.
Our hard-won gains will be quickly reversed if we as a collective are not strongly committed to taking steps that would
advance us further.
NT AR 10-11_10.indd 11 2011/08/17 10:02 AM
Nat
iona
l Tre
asur
y A
nnua
l Rep
ort 2
010/
11
12
Minister’s Statement on Policy and Commitment
mINISTER’S STATEmENT ON POlICy ANd COmmITmENT - continued
We also have, as a collective, to carefully consider our strategy going forward. We have to recognise that traditional drivers
of economic growth are no longer the preserve of developed economies. Indications are that growth will be driven in a
multipolar fashion, distributed amongst developed and developing economies, and it is important to recognise it in this
context. Various observations relating to the period covered by this report have demonstrated this notion.
I take this opportunity to thank the National Treasury leadership and staff for their unwavering support during these
trying economic times. My sincere thanks and gratitude go to the previous Director-General, Mr. Lesetja Kganyago, whose
commitment and sincerity inspired the rest of the Treasury team. We are already enjoying engaging with him in his
capacity as Deputy-Governor at the SA Reserve Bank.
Finally, I would like to welcome Mr. Lungisa Fuzile as the Director-General of the National Treasury. He assumed this role
on the 16th of May 2011 and has had to acclimatise very quickly, given present turbulent and challenging economic
circumstances.
Pravin Gordhan
Minister of Finance
NT AR 10-11_10.indd 12 2011/08/17 10:02 AM

13
Nat
iona
l Tre
asur
y A
nnua
l Rep
ort 2
010/
11
The Ministry
ThE mINISTRy - continued
lEGISlATIVE mANdATE ANd lEGISlATION ENACTEd
NT AR 10-11_10.indd 13 2011/08/17 10:02 AM

Nat
iona
l Tre
asur
y A
nnua
l Rep
ort 2
010/
11
14
Legislative Mandate
lEGISlATIVE mANdATE
The National Treasury’s mandate is to promote the national government’s fiscal policy and to coordinate macroeconomic
policy, intergovernmental financial and fiscal relations, manage the preparation of the budget, and to ensure that revenue
and expenditure, assets and liabilities, public entities and constitutional institutions are managed in a transparent and
effective manner.
parliaMeNtary serviCes
As the political principal of the department, the Minister of Finance regards collaboration with Parliament as vital.
Consequently, National Treasury continued during the period under review interactions with parliamentary committees,
chief among which include the Standing Committee on Finance; the Standing Committee on Appropriations; Select
Committee on Finance and Select Committee on Appriopriations. Other committees also include the the Standing
Committee on Public Accounts and all other relevant portfolio committees in parliament
The Parliamentary Service Office (PSO) is at the core of maintaining this relationship. The Office is also a vehicle through
which financial policies and pieces of legislation are presented to Parliament for consideration and approval.
During the period under review the PSO coordinated work processes between policy makers and public representatives.
Information continued to flow between the Ministry through Cabinet to Parliament and vice versa.
Other clients of this office include but are not limited to:
• MembersofParliament;
• ParliamentaryCommittees;
• ParliamentaryAdministrativeStaff;
• Civilsocietyinstitutions;and
• Membersofthepublic.
The PSO also maintains collegial and cooperative relationships on behalf of the Ministry with political structures as well as
offices of the Presiding Officers, the Secretary to Parliament and Leader of Government Business.
NT AR 10-11_10.indd 14 2011/08/17 10:02 AM

15
Nat
iona
l Tre
asur
y A
nnua
l Rep
ort 2
010/
11
Legislation Enacted
lEGISlATIVE ENACTEd
1. appropriation act, 2010 (act No. 3 of 2010)
Bill enacted: Appropriation Bill [B 3 – 2010]
English text signed by the President. Assented to 15 June 2010
Published in Government Gazette No.33314, dated 17 June 2010
2. south african reserve Bank amendment act (act No. 4 of 2010)
Bill enacted: South African Reserve Bank Amendment Bill [B10 – 2010]
English text signed by the President. Assented to 8 September 2010
Published in Government Gazette No.33538, dated 9 September 2010
3. taxation laws amendment act, (act No. 7 of 2010)
Bill enacted: Taxation Laws Amendment Bill [B 28 – 2010]
English text signed by the President. Assented to 31 October 2010
Published in Government Gazette No.33726, dated 2 November 2010
4. voluntary Disclosure programme and taxation laws second amendment act, (act No. 8 of 2010)
Bill enacted: Voluntary Disclosure Programme and Taxation Laws Second Amendment Bill [B 29 – 2010]
English text signed by the President. Assented to 31 October 2010
Published in Government Gazette No.33727, dated 2 November 2010
5. Division of revenue amendment act, (act No. 15 of 2010)
Bill enacted: Division of Revenue Amendment Bill [B 35 – 2010]
English text signed by the President. Assented to 26 November 2010
Published in Government Gazette No.33830, dated 2 December 2010
6. adjustments appropriation act, 2010 (act No. 23 of 2010)
Bill enacted: Adjustments Appropriation Bill [B 34 – 2010]
English text signed by the President. Assented to 1 December 2010
Published in Government Gazette No.33840, dated 3 December 2010
NT AR 10-11_10.indd 15 2011/08/17 10:02 AM

Nat
iona
l Tre
asur
y A
nnua
l Rep
ort 2
009/
10
16
The Ministry
PROGRAmmE 1aDMiNistratioN - continued
PROGRAmmE 1AdmINISTRATION
NT AR 10-11_10.indd 16 2011/08/17 10:02 AM

17
Nat
iona
l Tre
asur
y A
nnua
l Rep
ort 2
010/
11
Programme 1 - Administration
PROGRAmmE 1aDMiNistratioN
purpose: Provide strategic management and administrative support to the National Treasury, giving managerial
leadership to the work of the department.
Measurable objective: to provide effective leadership, management and administrative support to the core business
divisions of the National Treasury, through the continuous refinement of organisational strategy and structure, to ensure
compliance with applicable legislation and alignment with appropriate best practice.
The programme is divided into four subprogrammes:
• The Minister subprogramme provides for the Office of the Minister of Finance and includes parliamentary and
ministerial support services.
• TheDeputy Minister subprogramme provides for the Office of the Deputy Minister of Finance and related support
services.
• TheManagement subprogramme incorporates the Office of the Director-General and related support services.
• TheCorporate Services subprogramme supports the administration and effective operation of the department.
SERVICE dElIVERy ObJECTIVES ANd INdICATORS
reCeNt outputs
The Minister and Deputy Minister subprogrammes provide administrative support and report directly to the two political
heads. The Parliamentary Office assisted the Minister and the two organisations under his executive authority (the National
Treasury and the South African Revenue Service) with parliamentary responsibilities, such as the passage of legislation.
The office also co-ordinated interaction between the ministry and the relevant committees in Parliament.
The Management subprogramme is made up of the Office of the Director-General and provided strategic direction
and leadership to the National Treasury during the review period. The Communications, Legal Services, Internal Audit and
Enterprise Risk and Security Management units report directly to this office.
The Communications unit maintained the reliable media liaison service it provides to the department and ministry. It also
continued to manage the editing, layout and design, and printing of key documents. Events managed in the period under
review included the Medium Term Budget Policy Statement in October and the annual Budget tabled in February. The
marketing campaign for the RSA Retail Savings Bond continues to yield positive results, and investments in these savings
products stood at R5.2 billion by the end of March 2011, representing a R2 billion increase from the previous year. The unit
also responded to a high volume of public queries on a range of issues related to the work of the department.
The Legal Services unit provided comprehensive legal support to the department and ministry. It managed more than a
hundred litigations, and continued to provide, procure and manage professional legal advice for the department. The unit
also oversaw the passage of legislation proposed by the department and made comments on legislation proposals from
other ministries.
The Internal Audit unit is in the process of implementing a Shared Service Internal Audit for entities that report to the
Minister of Finance.
NT AR 10-11_10.indd 17 2011/08/17 10:02 AM

19
Nat
iona
l Tre
asur
y A
nnua
l Rep
ort 2
010/
11
Nat
iona
l Tre
asur
y A
nnua
l Rep
ort 2
010/
11
18
Programme 1 - Administration Programme 1 - Administration
PROGRAmmE 1aDMiNistratioN - continued
PROGRAmmE 1aDMiNistratioN - continued
All audits planned were conducted within the set period. The unit also conducted adhoc audits at the request
of management.
The Enterprise Risk and Security Management unit reviewed and implemented a departmental Enterprise Risk Management
strategy in line with the Public Sector Risk Management Framework. Adherence to the strategy continues to be monitored
closely by management and the Audit and Risk Management Committees. Additional enterprise risk management
support was provided to the Accounting Standards Board and the Co-operative Banks Development Agency during
the year. The Fraud Prevention Plan was reviewed in line with Minimum Anti-Corruption Capacity requirements, and
was implemented in support of the department’s zero tolerance to corruption. The Security Management structure was
reviewed, a process which culminated in the establishment of the Vetting Fieldwork unit. The unit also appointed a new
Guarding Service provider to provide physical security within the department.
The Corporate Services subprogramme comprises of the following units: Human Resources, Financial Management,
Information Technology (IT), Facilities Management, and Strategic Projects and Support. The units provided a range of
innovative solutions that enabled the department to achieve its strategic and operational goals.
The Human Resources unit continued to strengthen its partnership with business through its human resources-business
partnership model. The partnership approach contributed to an increase in adherence to performance management
principles. Internal appointments increased to 54 per cent against the target of 45 per cent. The unit continued to
improve the skills of employees by running a successful Leadership Development Programme for senior management,
and increased the number of training days per employee to an average of 8 days per employee. The unit established a
skills database to assist in identifying and recruiting requisite skills.
During the review period the internship programme continued to grow, such that the department’s employee base now
comprises 6 per cent interns. The Employee Wellness Programme was enhanced through the adoption of the SIYAPHILA
initiative that created greater awareness of the services provided and also serves as a health awareness platform in
educating employees.
The Financial Management unit processed all transactions before 31 March 2011.The National Treasury once again, closed
its financial books ahead of all national and provincial departments. The unit implemented demand management and
spend analysis plans to improve financial planning and management. This improved turnaround times of tender processes
from an average of 91 days (2009/10) to 60 days during the reporting period. The unit also managed an asset disposal plan
which included donations to underprivileged educational institutions. In addition, the unit submitted accurate bi-annual
and annual tax reconciliations two weeks before the due date.
The Facilities Unit continued to provide adequate accommodation for the department.
The Information and Communications Technology (ICT) unit established an Enterprise Architecture capability in ICT to
align business processes to technology, allowing for cost savings, standardisation and reduced duplication. The unit also
developed solutions to enhance ICT operations. An archiving capability was implemented by management for better
rewards. The unit also developed a number of solutions to ensure proper records management.
The Project Support Office extended its support function and provided project management support and coaching
on request.
NT AR 10-11_10.indd 18 2011/08/17 10:02 AM

19
Nat
iona
l Tre
asur
y A
nnua
l Rep
ort 2
010/
11
Nat
iona
l Tre
asur
y A
nnua
l Rep
ort 2
010/
11
18
Programme 1 - Administration Programme 1 - Administration
PROGRAmmE 1aDMiNistratioN - continued
PROGRAmmE 1aDMiNistratioN - continued
SERV
ICE
dEl
IVER
y A
ChIE
VEm
ENTS
prog
ram
me
1: a
dmin
istr
atio
n
Mea
sura
ble
obje
ctiv
e: To
ens
ure
effec
tive
lead
ersh
ip, m
anag
emen
t and
adm
inist
rativ
e su
ppor
t to
the
depa
rtm
ent t
hrou
gh th
e co
ntin
uous
refin
emen
t of o
rgan
isatio
nal
stra
tegy
and
str
uctu
re, i
n co
mpl
ianc
e w
ith a
ppro
pria
te le
gisla
tion
and
best
pra
ctic
e.
subp
rogr
amm
eo
utpu
tM
easu
re /
indi
cato
ra
ctua
l per
form
ance
aga
inst
targ
etta
rget
act
ual
Man
agem
ent
Ensu
re th
at th
e de
part
men
t
adhe
res
to a
n in
tegr
ated
risk
man
agem
ent s
yste
m
Dev
elop
and
impl
emen
t a
com
preh
ensi
ve e
nter
pris
e-w
ide
risk
man
agem
ent s
trat
egy
that
prom
otes
and
uph
olds
a c
ultu
re
of ri
sk a
war
enes
s w
ithin
the
depa
rtm
ent
Ente
rpris
e Ri
sk M
anag
emen
t
Stra
tegy
revi
ewed
ann
ually
and
any
chan
ges
impl
emen
ted
The
Ente
rpris
e Ri
sk M
anag
emen
t
Stra
tegy
was
app
rove
d an
d eff
ectiv
ely
impl
emen
ted.
Ris
k as
sess
men
ts w
ere
cond
ucte
d fo
r all
divi
sion
s an
d a
cons
olid
ated
Ris
k A
sses
smen
t Rep
ort
was
dev
elop
ed.
Risk
ass
essm
ents
wer
e
furt
her c
ondu
cted
for t
he A
SB a
nd C
BDA
.
Mon
itore
d de
part
men
tal R
isk
Trea
tmen
t
Act
ion
plan
s Pi
lot t
he B
usin
ess
Cont
inui
ty
Man
agem
ent s
trat
egy
Busi
ness
Con
tinui
ty M
anag
emen
t pla
ns
wer
e de
velo
ped
and
impl
emen
ted
Frau
d Pr
even
tion
Plan
revi
ewed
annu
ally
and
any
cha
nges
impl
emen
ted
The
Frau
d Pr
even
tion
Plan
revi
ewed
and
impl
emen
ted.
A c
orru
ptio
n ca
se
man
agem
ent f
ram
ewor
k w
as a
lso
deve
lope
d. C
ases
from
the
Publ
ic S
ervi
ce
Com
mis
sion
frau
d lin
e w
ere
inve
stig
ated
and
a re
port
sub
mitt
ed to
the
PSC
Ensu
re a
sec
ure
and
enab
ling
wor
king
env
ironm
ent f
or s
taff
Prov
idin
g ap
prop
riate
phy
sica
l
secu
rity
for e
mpl
oyee
s an
d
asse
ts
Ong
oing
Cond
ucte
d 2
emer
genc
y ev
acua
tion
drill
s on
NT
build
ings
and
also
con
duct
ed
form
al se
curit
y aw
aren
ess s
essio
ns fo
r
empl
oyee
s. M
inim
ised
brea
kdow
ns o
n th
e
elec
troni
c se
curit
y sy
stem
Se
curin
g th
e an
nual
bud
get
proc
ess
Secu
re M
TBPS
and
bud
get d
ayIm
prov
ed se
curit
y m
easu
res a
nd n
o
info
rmat
ion
leak
s
NT AR 10-11_10.indd 19 2011/08/17 10:02 AM

21
Nat
iona
l Tre
asur
y A
nnua
l Rep
ort 2
010/
11
Nat
iona
l Tre
asur
y A
nnua
l Rep
ort 2
010/
11
20
Programme 1 - Administration Programme 1 - Administration
PROGRAmmE 1aDMiNistratioN - continued
PROGRAmmE 1aDMiNistratioN - continued
Mea
sura
ble
obje
ctiv
e: To
ens
ure
effec
tive
lead
ersh
ip, m
anag
emen
t and
adm
inist
rativ
e su
ppor
t to
the
depa
rtm
ent t
hrou
gh th
e co
ntin
uous
refin
emen
t of o
rgan
isatio
nal
stra
tegy
and
str
uctu
re, i
n co
mpl
ianc
e w
ith a
ppro
pria
te le
gisla
tion
and
best
pra
ctic
e.su
bpro
gram
me
out
put
Mea
sure
/ in
dica
tor
act
ual p
erfo
rman
ce a
gain
st ta
rget
targ
eta
ctua
lM
anag
emen
tPr
ovid
e an
effe
ctiv
e in
tern
al
audi
t uni
t
Dev
elop
and
impl
emen
t a ri
sk
base
d an
nual
and
thre
e ye
ar
audi
t pla
n in
con
sulta
tion
with
stak
ehol
ders
70%
clie
nt s
atis
fact
ion
achi
eved
75%
clie
nt s
atis
fact
ion
was
ach
ieve
d
(mea
sure
d th
roug
h fe
edba
ck fo
rms)
. A
risk
base
d an
nual
and
thre
e ye
ar a
udit
plan
was
dev
elop
ed in
con
sulta
tion
with
rele
vant
sta
keho
lder
s70
% A
udit
Com
mitt
ee
satis
fact
ion
achi
eved
88.5
% A
udit
Com
mitt
ee s
atis
fact
ion
was
achi
eved
Corp
orat
e Se
rvic
es (C
S)Effi
cien
t HR
func
tion
Dev
elop
, im
plem
ent a
nd
mai
ntai
n an
inte
grat
ed,
prog
ress
ive
and
inno
vativ
e H
R
stra
tegy
Effici
ency
incr
ease
d to
50%
H
R effi
cien
cy in
crea
sed
as fo
llow
s:
85.4
4% o
f new
em
ploy
ees
att
aine
d A
&B
perf
orm
ance
sco
res
in th
eir fi
rst y
ear
with
the
depa
rtm
ent (
qual
ity o
f hire
)
54%
of v
acan
cies
hav
e be
en fi
lled
with
inte
rnal
em
ploy
ees
(inte
rnal
hire
rate
:
late
ral a
nd p
rom
otio
nal m
ovem
ents
)
71%
of
inte
rns
wer
e pl
aced
into
perm
anen
t pos
ition
s in
the
depa
rtm
ent
Trai
ning
and
dev
elop
men
t int
erve
ntio
ns
alig
ned
to o
rgan
isat
iona
l nee
ds re
sulte
d
in a
n av
erag
e of
8.1
5 tr
aini
ng d
ays
per
empl
oyee
. 53%
of D
irect
ors
& C
hief
Dire
ctor
s at
tend
ed th
e Le
ader
ship
Dev
elop
men
t Pro
gram
me
SERV
ICE
dEl
IVER
y A
ChIE
VEm
ENTS
prog
ram
me
1: a
dmin
istr
atio
n - C
ontin
ued
NT AR 10-11_10.indd 20 2011/08/17 10:02 AM

21
Nat
iona
l Tre
asur
y A
nnua
l Rep
ort 2
010/
11
Nat
iona
l Tre
asur
y A
nnua
l Rep
ort 2
010/
11
20
Programme 1 - Administration Programme 1 - Administration
PROGRAmmE 1aDMiNistratioN - continued
PROGRAmmE 1aDMiNistratioN - continued
Roll
out o
f the
tale
nt
man
agem
ent p
rogr
amm
e
Acq
uisi
tion
proc
ess
initi
ated
and
rolle
d ou
t to
70%
of t
he
depa
rtm
ent
Acq
uisit
ion
proc
ess f
ully
impl
emen
ted
in a
ll
divi
sions
. The
recr
uitm
ent o
pera
ting
mod
el
ensu
red
focu
s on
criti
cal a
nd sc
arce
skills
and
help
ed to
redu
ce tu
rnar
ound
tim
es a
nd
high
vac
ancy
rate
. Vac
ancy
rate
is a
t 14%
with
turn
arou
nd ti
mes
of a
n av
erag
e of
14
wee
ks d
ue to
com
petit
iven
ess i
n th
e ar
ea o
f
criti
cal a
nd sc
arce
skills
(eco
nom
ics,
finan
ce
and
acco
untin
g)En
sure
an
inte
grat
ed
busi
ness
sol
utio
ns a
ppro
ach
to im
prov
e kn
owle
dge
man
agem
ent
Cre
atio
n of
a s
tabi
lised
cos
t
effec
tive
ICT
infra
stru
ctur
e to
acco
mm
odat
e th
e st
rate
gic
busi
ness
obj
ectiv
es
App
rove
d en
terp
rise
arch
itect
ure
base
line
Dev
elop
men
t of t
he E
nter
pris
e
Arc
hite
ctur
e fra
mew
ork
unde
rway
Re
vise
d an
d ap
prov
ed IC
T
oper
atio
nal p
lan
ICT
oper
atio
nal p
lan
has
been
revi
sed
Dev
elop
a p
latfo
rm w
here
info
rmat
ion
can
be d
epos
ited
and
shar
ed (k
now
ledg
e sh
arin
g
plat
form
)
Pilo
ted
with
40%
of u
sers
D
evel
oped
an
info
rmat
ion
plat
form
cons
istin
g of
a C
entr
al R
egis
try
for
phys
ical
doc
umen
ts, t
he e
lect
roni
c
regi
stry
for e
lect
roni
c re
cord
s an
d th
e
Pape
r Tra
il do
cum
ent t
rack
ing
syst
em fo
r
curr
ent b
usin
ess
docu
men
ts.
Plat
form
used
by
mor
e th
an 4
0% o
f em
ploy
ees
Soun
d fi
nanc
ial
man
agem
ent a
nd
gove
rnan
ce a
ccor
ding
to
best
pra
ctic
e
Prog
ress
ive
deve
lopm
ent
of a
naly
tical
repo
rtin
g an
d
enha
ncin
g m
anag
emen
t
acco
untin
g
Cha
nges
to th
e in
-yea
r
mon
itorin
g to
ol to
impr
ove
turn
arou
nd re
port
ing
from
6
days
to 2
day
s
Impl
emen
ted
the
in-y
ear m
onito
ring
tool
to im
prov
e th
e tu
rnar
ound
repo
rtin
g fro
m 6
day
s to
2 d
ays
Repo
rt o
n th
e as
sess
men
t of
impl
emen
tatio
n of
pol
icie
s on
a
quar
terly
bas
is
An
asse
ssm
ent t
ool h
as b
een
deve
lope
d,
impl
emen
tatio
n co
mm
ence
d du
ring
the
first
qua
rter
of t
he 2
011/
12 fi
nanc
ial y
ear
Fina
ncia
l gov
erna
nce
com
plia
nce
and
soun
d co
ntro
l
envi
ronm
ent
Redu
ce b
y 60
% th
e fin
ding
s on
com
plia
nce
by In
tern
al A
udit
and
Aud
itor G
ener
al re
sulti
ng in
unqu
alifi
ed a
udit
repo
rt
Redu
ced
by 7
1% th
e fin
ding
s on
com
plia
nce
by In
tern
al A
udit
and
Aud
itor G
ener
al
NT AR 10-11_10.indd 21 2011/08/17 10:02 AM

23
Nat
iona
l Tre
asur
y A
nnua
l Rep
ort 2
010/
11
Nat
iona
l Tre
asur
y A
nnua
l Rep
ort 2
010/
11
22
Programme 1 - Administration Programme 1 - Administration
PROGRAmmE 1aDMiNistratioN - continued
PROGRAmmE 1aDMiNistratioN - continued
Mea
sura
ble
obje
ctiv
e: To
ens
ure
effec
tive
lead
ersh
ip, m
anag
emen
t and
adm
inist
rativ
e su
ppor
t to
the
depa
rtm
ent t
hrou
gh th
e co
ntin
uous
refin
emen
t of o
rgan
isatio
nal
stra
tegy
and
str
uctu
re, i
n co
mpl
ianc
e w
ith a
ppro
pria
te le
gisla
tion
and
best
pra
ctic
e.su
bpro
gram
me
out
put
Mea
sure
/ in
dica
tor
act
ual p
erfo
rman
ce a
gain
st ta
rget
targ
eta
ctua
lCo
rpor
ate
Serv
ices
(CS)
Soun
d fi
nanc
ial
man
agem
ent a
nd
gove
rnan
ce a
ccor
ding
to
best
pra
ctic
e
Ensu
re th
at a
ll st
atut
ory
repo
rtin
g re
gula
tions
and
dead
lines
are
met
31 M
arch
201
1 En
sure
d th
at a
ll tr
ansa
ctio
ns a
re
proc
esse
d be
fore
31
Mar
ch 2
011
Clo
sed
the
finan
cial
reco
rds
on 6
Apr
il
2011
Dev
elop
and
mai
ntai
n
a so
und
supp
ly c
hain
man
agem
ent s
trat
egy
Stra
tegi
c su
pply
cha
in p
rinci
ples
impl
emen
ted
60%
impl
emen
ted
80%
impl
emen
ted
- con
trac
t
man
agem
ent f
ram
ewor
k an
d Sp
end
Ana
lysi
s Fr
amew
ork
appr
oved
and
impl
emen
ted
Elec
tron
ic p
rocu
rem
ent s
yste
m
impl
emen
ted
60%
impl
emen
ted
Not
impl
emen
ted
, IFM
S im
plem
enta
tion
dela
yed
due
to s
yste
m c
ompa
tibili
ty
chal
leng
esPo
licie
s an
d pr
oced
ures
upda
ted
for s
uppl
y ch
ain
man
agem
ent p
rinci
ples
Ong
oing
SC
M p
olic
ies
revi
ewed
SERV
ICE
dEl
IVER
y A
ChIE
VEm
ENTS
prog
ram
me
1: a
dmin
istr
atio
n - C
ontin
ued
NT AR 10-11_10.indd 22 2011/08/17 10:02 AM

23
Nat
iona
l Tre
asur
y A
nnua
l Rep
ort 2
010/
11
Nat
iona
l Tre
asur
y A
nnua
l Rep
ort 2
010/
11
22
Programme 1 - Administration Programme 1 - Administration
PROGRAmmE 1aDMiNistratioN - continued
PROGRAmmE 1aDMiNistratioN - continued
PROGRAmmE 2PUblIC FINANCE ANd bUdGET mANAGEmENT
NT AR 10-11_10.indd 23 2011/08/17 10:02 AM

Nat
iona
l Tre
asur
y A
nnua
l Rep
ort 2
010/
11
24
Programme 2 - Public Finance and Budget Management
PROGRAmmE 2puBliC FiNaNCe aND BuDGet MaNaGeMeNt
purpose: Provide analysis and advice on fiscal policy and public finances, intergovernmental financial relations,
and expenditure planning and priorities. Manage the annual budget process and provide public finance
management support.
Measurable objective: To promote growth, social development and poverty reduction through sound fiscal and financial
policies, and the effective, efficient and appropriate allocation of public funds. Specific aims are to:
• Prepareanationalbudgetthatgiveseffecttogovernment’seconomic,fiscal,socialanddevelopmentalgoalsunder
the umbrella of the outcomes approach.
• PublishtheBudget Review, Estimates of National Expenditure (ENE), Medium Term Budget Policy Statement (MTBPS) and
appropriation legislation containing relevant, accurate and clear financial information, and associated indicators of
service delivery and performance.
• Contribute topublicpolicyandprogrammedevelopment, soundplanning,budgetingandprojectmanagement,
including increased support to public finance reform in provinces and municipalities.
• Support improvedmonitoringandanalysisofpublicexpenditureandservicedelivery,andtheappropriateuseof
public and private financial resources for social and economic development and infrastructure investment.
• Ensurethatallofficialdevelopmentassistance(ODA)providedtogovernmentisalignedwithbudgetprioritiesandis
channelled through South Africa’s public finance management system.
SERVICE dElIVERy ObJECTIVES ANd INdICATORS
reCeNt outputs
Budget Office
The Budget Office coordinates the budget process, provides advice to the Ministers’ Committee on the Budget, and
monitors fiscal and public expenditure trends.
The division produced, on time, the framework for the MTBPS, the Budget Review and an estimate of the structural balance.
The budget documentation was comprehensive and remains widely respected for its quality of coverage, including an
improved set of measurable objectives and trends-based performance indicators.
The Fiscal Policy unit monitors economic and fiscal trends, researches policy issues and models medium to long-term fiscal
scenarios. The unit advises the Minister of Finance on policy options and the budget framework.
In the 2010/11 financial year, the unit developed additional capacity for considering long-term fiscal planning issues. It
also continued to monitor the impact of the economic crisis on the fiscus thereby ensuring appropriate measures were
instituted to deal with the effects of the crisis.
The Expenditure Planning unit manages the medium-term expenditure framework (MTEF) budget process, which
culminates in the publication of the Estimates of National Expenditure (ENE) and the main Appropriation Bill tabled on the
day of the budget. The unit also manages the in-year adjustments process. The Adjustments Budget and the Adjustments
Appropriation Bill is tabled together with the Medium Term Budget Policy Statement (MTBPS). The unit is also responsible
for the medium term expenditure and division of revenue discussions in the MTBPS and the Budget Review.
NT AR 10-11_10.indd 24 2011/08/17 10:02 AM

25
Nat
iona
l Tre
asur
y A
nnua
l Rep
ort 2
010/
11
Programme 2 - Public Finance and Budget Management
PROGRAmmE 2puBliC FiNaNCe aND BuDGet MaNaGeMeNt - continued
In developing the 2011 medium term expenditure framework there was a shift towards budgeting by function rather
than by department to align to the outcomes approach adopted by government. The functional approach focuses on the
purpose for which funds are to be used, and groups together national, provincial and local government, and government
agencies, in terms of the function of government they perform. This means a consolidated functional expenditure amount
is calculated, and monies transferred from one arm of government to another are more transparent to all stakeholders
in the budget process when they are offset against each other. More effective comparison of allocations against service
delivery trends, and assessment of spending proposals and trade-offs between different options, are carried out within
a given function in support of reprioritising funds in line with outcomes. This approach provides more transparency and
better coordination in the budget process. Savings of R30.6 billion were identified by national and provincial government
departments and reprioritised to key outcomes.
The unit also issued the Framework for Strategic Plans and Annual Performance Plans to departments and public entities
and provided training on the framework. The Framework aims to improve the quality of departmental performance
information contained in planning documents. A Performance Information handbook that provides techniques and tools
on how to develop performance information was distributed to departments and public entities.
The Public Finance Statistics unit produces all fiscal data and public finance statistics used in National Treasury
publications. The aim is to improve transparency and accountability by providing the public with information on
government revenue and expenditure outcomes. The data is also submitted to international organisations such as the
International Monetary Fund.
The unit published a consolidated government account in the 2011 Budget which included details of payments and
revenues of state entities largely financed by government (either through taxes, levies and administrative or service fees,
or by direct transfers from the budget) and also provided information on consolidated government borrowing.
In support of the shift towards functional budgeting, the unit produced a revised classification of the programme data
of national and provincial departments and entities for the 2011 budget process. The unit also continued to improve
the quality of existing databases, data collection processes, and models used for data reporting in the consolidated
government account. Combined with the on-going capacity building initiatives at national and provincial departments,
these efforts have resulted in improved quality and accuracy of information.
During the reporting period, the unit together with the Public Administration Leadership and Management Academy
(PALAMA) implemented a training programme on the Standard Chart of Accounts (SCOA), and trained 1 800 officials
at national and provincial government level. Following the receipt of SAQA accreditation and the approval of five unit
standards, the training initiative will be formalised.
The International Development Cooperation (IDC) unit is responsible for coordinating, mobilising and managing
official development assistance (ODA). Work is in progress on a revised framework and procedural guidelines for the
management of ODA, which will lead to better alignment of ODA with the budget, appropriate skills development, and
better monitoring and reporting systems.
The unit focused on:
• Acquiringresourcesinsupportofinterventionsthataddressdevelopmentalchallengesandarealignedtothepriorities
of South Africa;
• IncreasingfundingforinfrastructureprojectsfromdevelopmentfinanceinstitutionsincludingtheEuropeanInvestment
NT AR 10-11_10.indd 25 2011/08/17 10:02 AM
Nat
iona
l Tre
asur
y A
nnua
l Rep
ort 2
010/
11
26
Programme 2 - Public Finance and Budget Management
PROGRAmmE 2puBliC FiNaNCe aND BuDGet MaNaGeMeNt - continued
Bank, German Development Bank, and the French Development Bank, to help cushion the impact of the global financial
crisis on government’s reduced revenue and spending on infrastructure;
• ImprovingthequalityofinformationonODA,especiallytheassistancethatisprovided“inkind”andisthereforefunding
that flows through government financial systems;
• DevelopingspecificplansthatensurethatODApartnerscomplywithglobalframeworksonaideffectivenesssuchasthe
Paris Declaration.
ODA programmes worth more than R3 billion over the MTEF will be implemented through South Africa’s financial and
procurement systems. This includes support for primary education, improving health systems of delivery, enhancing the
role of the legislature in the democracy, restorative justice and job creation.
The IDC also sought to align ODA with priorities outlined in the budget. This included improved reporting on ODA
through the ENE (2011/12) and the use of ODA information from government departments in planning for the MTEF.
The information system on development cooperation is also being upgraded so it can also be used as a management
information system.
The Public Entities Governance (PEGU) unit implements the recommendations of the public entities governance framework
review. The unit continued to roll-out the budgeting framework for all public entities. The unit assisted with preparing
consolidated financial accounts, maintaining budget databases, administrative records of the general government sector,
including public entities. The unit continued with efforts to enhance a coherent regulatory environment that promotes a
consistent approach to governance, human resource management (including development of remuneration frameworks)
and financial management in public entities.
The unit also provided analysis on the government wage bill and worked with other budget group units to ensure that
wages and employment growth is effectively budgeted for. It also consulted with departments on budgets and policy,
including support to the DPSA during public-service wage talks.
Public Finance
The Public Finance division advises the Minister of Finance on sectoral policies and departmental spending programmes;
evaluates budget submissions by national departments, public entities, state-owned enterprises and constitutional institutions;
monitors spending and service delivery trends, and supports improvements to financial administration, including the
implementation of the standard chart of accounts and compliance with the Public Finance Management Act (PFMA).
Within the division, policy work over the reporting period included the following:
The Administrative Services unit oversees the finances and budgets of a number of central government departments
and entities. Key areas of work in 2010/11 included:
• Department of Monitoring and Evaluation: The unit ensured that the department was established as a separate budget
vote and assisted with budgeting, finalisation of their budget structure and the implementation of financial systems.
• Department of International Relations and Cooperation: The unit participated in working group discussions on
the implementation challenges of the Pan African Parliament (PAP) and the establishment of the South African
Development Partnership Agency. The construction of the PAP building was put on hold while a possibility of funding
construction through a PPP arrangement is explored.
NT AR 10-11_10.indd 26 2011/08/17 10:02 AM

27
Nat
iona
l Tre
asur
y A
nnua
l Rep
ort 2
010/
11
Programme 2 - Public Finance and Budget Management
PROGRAmmE 2puBliC FiNaNCe aND BuDGet MaNaGeMeNt - continued
• Department of Home Affairs: Assisted the department to roll out a new movement control system to 34 ports of entry in
preparation for the 2010 FIFA World Cup. The roll-out of the system to the remaining 38 ports of entry planned for 2010/11
was delayed due to the department’s rationalisation exercise. The roll-out will continue in the 2011/12 financial year.
• Stats SA: Assisted in budgeting and planning for household surveys and the 2011 national census. Assisted Stats SA to
find head office accommodation; Treasury approval was granted to obtain the new accommodation through a PPP
agreement.
• National Treasury: Supported initiatives by the South African Revenue Service to strengthen capacity, modernise systems
and improve project management as well as provided support for funding initiatives of the Neighbourhood Development
Partnership Grant. The department’s budget programme structure was amended to improve the presentation of the
National Treasury’s functions.
• Department of Public Works: Participated in a task team advising on the operationalisation of the Property Management
Trading Entity (PMTE) as well as working within the structures of the Border Control Operational Coordinating Committee
(BCOCC) to lead the formulation of a policy on one-stop border posts.
• Department for Women, Children and People with Disabilities: Advised the department on baseline reprioritisation and
affordable approaches for capacity building plans to ensure expenditure remains within the allocated budget.
The Justice and Protection Services (JPS) unit oversees planning, expenditure and service delivery by departments in this
sector. In 2010/11, the unit provided technical assistance and expertise on a number of projects, including:
• Independent Complaints Directorate: assisted with the transformation of the directorate into the Independent Policy
Investigative Directorate.
• AmendmentofthePrivateSecurityIndustryRegulatoryAuthorityAct.
• ThereviewoftheCorrectionalServicesbudgetprogrammestructure.
• ThedraftingandcostingoftheMilitaryVeteransBill.
• OversightofthespecialarmsprocurementprogrammeandevaluationofanewsalarydispensationfortheDepartment
of Military Veterans,
• SupportandguidancetotheOfficeoftheChiefJusticeandtheDepartmentofMilitaryVeterans,
• ManagingofThirdPartyFundsbytheDepartmentofJusticeandConstitutionalDevelopment,and
• Support to the Department of Justice and Constitutional Development on the acquisition and development of
Constitutional Hill as a Justice Precinct.
The Education and Related Departments unit monitors and advises government on several functions, largely implemented
by provinces. During the review period, the unit’s efforts focused on supporting the development of policy and funding
norms, improved monitoring of service delivery, and the costing of services. Key areas of work in 2010/11 included:
• Monitoring and evaluation of the following items: national standards for school funding; implementation of the
workbooks project and administration of the Mpumalanga grade 12 examinations. and provided assistance and
advice on developing norms and standards for school infrastructure;
• AssistanceandadviceonshiftingresponsibilityfortheFETcollegestothenationalDepartmentofHigherEducation
and Training; review of the funding of training for the health sciences professions; proposals for the funding of higher
education and FET College students.
• StrengtheningthemanagementandoversightofcapitalworksprojectsofArtsandCultureentities;resolutionofthe
Financial Services Board directive to close the Pension Fund for the Performing Arts Institutions by 2010/11; ongoing
advice and support in developing norms and standards for library services.
• Monitoringandevaluation of theconditionalgrants to facilitate thefinalpreparation for thehostingof the2010
FIFA World Cup; monitoring of the grants to increase participation in sport for school sport and the 2010 FIFA World
NT AR 10-11_10.indd 27 2011/08/17 10:02 AM
Nat
iona
l Tre
asur
y A
nnua
l Rep
ort 2
010/
11
28
Programme 2 - Public Finance and Budget Management
PROGRAmmE 2puBliC FiNaNCe aND BuDGet MaNaGeMeNt - continued
Cup legacy projects; and advising the department of Sport and Recreation on the support and oversight of sports
federations and entities.
• ReviewofDepartmentofLabour’spublic-privatepartnershipdeal for thesupplyof ITservices tothedepartment;
assistance and advice on the professionalisation of the labour inspectorate, including revisions to salary levels and job
descriptions.
• AdvisedandsupportedtotheDepartmentofPublicWork’sExpandedPublicWorksProgrammeunit inthedesign
of a new EPWP social sector incentive grant, including its funding model, and monitored and advised on the
implementation of the environment and culture sector incentive model.
The Health and Social Development worked on several health financing initiatives particularly on National Health Insurance
and supported development of new tax dispensation around medical expenses; Work on the new health component of
equitable share formula was completed and implemented in Budget 2011/12. The unit supported the Department of Health
on various initiatives, some of which also resulted in additional budget allocations. These include new diagnostic tests for TB
(GeneXpert), expansion of antiretroviral therapy, male circumcision and HIV Counselling and Testing (HCT); introduction of
a third Health OSD which covered 40 therapeutic personnel groups; Provided support for revitalisation of nursing colleges;
stabilisation of provincial finances,establishment of an Office of Standards Compliance (OSC) to enforce standards in public
facilities and supported establishment of a new medicines regulatory body (South African Health Products Regulatory
Authority, SAHPRA). A new Health Infrastructure grant was initiated for the Department of Health (DOH) and the unit
supported measures to strengthen infrastructure delivery programmes.
Policy work on higher old age grant for over 75s was implemented in Budget 2011. The Unit assisted SASSA with renegotiating
extensions of the social grant payment contracts at a reduced price, while developing a concept proposal for the new
payment system; assisted the agency with the tender specification for the request for proposals advertised toward the end
of the year. Improved financial monitoring tools were implemented enabling the unit to track expenditure in line with the
SASSA’s accrual accounting systems. Increased support for SASSA and monitored spending and the austerity measures
implemented to reduce the cumulative deficit. The unit contributed to broader policy work to develop a contributory social
security system for South Africa with improved retirement, death and disability and unemployment benefits
The Economic Services unit analyses policy proposals, funding requests and expenditure plans of departments and state
entities. The focus is on economic development outcomes that would enhance employment and economic growth.
Environmental protection, land reform, agricultural and industrial development, support for distressed sectors and regulatory
oversight is central to the work programme.
Activities over the past year included:
• Transfersofprogrammesbetweendepartmentsandtransfersofagenciesbetweendepartments.
• AssessmentoftheNewGrowthPathandtheIndustrialPolicyActionPlan.
• Assessedprivatesectorinvestmentproposalsinthelandreformprogramme.
• AnalysedproposalsthatledtotheannouncementoftheGreenFund.
• Assessedthescopeforfundingofpost-graduateresearch.
The Urban Development and Infrastructure unit provides public finance support to national departments and their associated
public entities involved in infrastructure provision. Key areas of delivery includes expenditure analysis, policy and programme
support and budget analysis to support the delivery of network and social infrastructure in sectors such as transport,
electricity, water and sanitation, telecommunications, municipal infrastructure and human settlements.
NT AR 10-11_10.indd 28 2011/08/17 10:02 AM

29
Nat
iona
l Tre
asur
y A
nnua
l Rep
ort 2
010/
11
Programme 2 - Public Finance and Budget Management
PROGRAmmE 2puBliC FiNaNCe aND BuDGet MaNaGeMeNt - continued
Over the last year the focus was on the following issues:
• Anewsectorspecificgrantforprovincialroadmaintenancewascreatedtoimproveefficiencyofroadinvestmentand
enhance the focus on preventative maintenance. A funding mechanism for the coal haulage network was put in place.
The no-fault policy has been finalised for the creation of the Road Accident Benefit Scheme and regulatory framework
with FSB put in place. The feasibility for the rail rolling stock procurement programme has been finalised and will
inform the funding approach. Support to the department on the reprioritisation of the Public Transport Infrastructure
and Systems Grant. To support the upgrading of informal settlements and improve human settlement development
at municipal level, the Urban Settlement Development Grant was created. This approach also supports the devolution
of housing planning, management and funding to local government.
• Support to the restructuringof theWaterTradingAccountanda reviewof theRegionalBulk InfrastructureGrant
to ensure greater value for money in infrastructure investments. Economic and financial analysis on De Hoop dam
project. Refocusing the Bekkersdal/Westonaria wastewater treatment works.
• ReviewofSALGA’sfinancialpositionwiththeDepartmentofCooperativeGovernance.
• Participation in the national electricity advisory committee, part of the Integrated Nuclear Infrastructure Review
process. Support in establishment of the National Radioactive Waste Disposal Institute.
• SupportedtheestablishmentofanentityoversightunitattheDepartmentofCommunications.
The Project Management Unit for Social Security and Retirement Reform (PMU) provides administrative support to the
inter-departmental task team on social security and retirement reform. It manages and co-ordinates research, analysis and
technical advice on social security and retirement reform on behalf of the IMC, IDTT, National Treasury and the Minister of
Finance. It is also responsible for co-ordinating communication and engagement with stakeholders, media, as well as the
consideration of public comments on reform options.
During 2010/11 the unit assisted with the preparation of a consolidated government paper, coordinated the work of several
interdepartmental sub-committees and research projects, and advised the Inter-Ministerial Committee responsible for
overseeing the reform, of social security and retirement and National Health Insurance.
Technical and Management Support
The work of the Technical Assistance Unit (TAU) is reflected in the number of projects supported during the 2010/11 financial
year – the target of 73 projects supported, was exceeded by 26 per cent, as the TAU provided support to a total of 92 projects.
TAU’s work is aligned to the priorities of government, but primarily supports Outcome 12, namely the creation of an efficient,
effective and development orientated public service.
Responding to government priorities by ensuring that it informs criteria for decisions regarding provision of support to
government departments, the following development focus areas were covered: Employment Creation; Rural Development;
Education; Health and Crime.
Projects supported,during the year include the following:
• TheEconomicDevelopment and International Relations (EDIR)portfolio supported theDTIDonor-fundedCluster
Support Programme which entailed developing an Employment Creation Fund programme management framework,
toolkit and standard documentation, procurement procedure and monitoring and evaluation system.
• TheGovernanceandAdministration (GA) portfolio supported the DPME in fulfilling a key part of their mandate to
provide support to departments and coordinating structures in develop delivery agreements for each of the 12
outcome areas.
NT AR 10-11_10.indd 29 2011/08/17 10:02 AM

Nat
iona
l Tre
asur
y A
nnua
l Rep
ort 2
010/
11
30
Programme 2 - Public Finance and Budget Management
PROGRAmmE 2puBliC FiNaNCe aND BuDGet MaNaGeMeNt - continued
• The Infrastructure and Rural Development (IRD) portfolio supported the infrastructure Delivery Improvement
Programme (IDIP) by developing a Quality Assurance Model that ensures that the Technical Assistants appointed add
value to provinces, by helping departments resolve key barriers to infrastructure delivery in a manner that contributes
to sustainable capacity building in infrastructure units.
• The Justice,CrimePreventionandSecurity (JCPS)portfolio supported theOfficeof theChief Justice through the
Interim Strategic Management Team in establishing the critical strategic framework, organisational structure and
required support service systems and to flesh out its support service functions and accompanying post establishment.
• TheSocialServices(SS)portfoliosupportedtheCommunityLibrariesRecapitalisationProgrammeoftheDepartment
of Arts and Culture in the Eastern Cape with the implementation of the Conditional Grant for Library Recapitalisation.
This cluster also supported the Council for Medical Schemes with the development of an implementable three-year
strategic plan.
During the course of the year, increasing numbers of requests were received for support with organisational development,
change management, executive coaching and leadership development. There was interest in TAU’s capacity to support the
results based management (RBM) approach that aligns with the required Strategic Planning and Annual Performance Plan
formats. Mainstreaming of gender issues has improved over the past financial year, both within TAU and in work with clients.
TAU’s annual Client Survey confirmed continued high levels of client satisfaction.
TAU hosts a community of practice network, the Project Management Interest Group (PMIG), which was attended by TAU
clients and public service managers with an interest in or responsibility for project management in the public sector. During
the 2010/11 financial year, a total of 275 people (136 females and 139 males) attended the PMIG sessions. The TAU Programme
and Project Management (PPM) Toolkit was also launched.
The 2010 FIFA World Cup unit provided support to the Minister and Deputy Minister of Finance, the Technical Co-ordination
Committee, Inter-Ministerial Committee and Organising Committee, regarding the hosting of the 2010 FIFA World Cup. It was
phased out in July 2010 with the successful completion of the 2010 FIFA World Cup.
Building on the capacity established in supporting the 2010 FIFA World Cup, a National Capital Projects Unit has been
established. It provides support in assessing feasibility studies for major national infrastructure reports, and managing
participation in interdepartmental task teams on individual strategic projects. The initial focus has been on capacitating the
unit with new staff, becoming fully functional as a new unit, determining the need for additional outsourced expertise and
setting up new work streams with other units across the National Treasury that deal with infrastructure.
Within the 2010/11 period, studies were undertaken in the water, energy and transport sectors, as a precursor to undertaking
capital project appraisals. As such, appraisals of liquid fuels refinery expansion projects, solar power generation, a regional
infrastructure review and a major bulk water infrastructure project were completed.
The Public Private Partnership (PPP) unit ensures that PPPs are delivered in terms of applicable legislation. It also provides
technical assistance to institutions in all spheres of government for the appraisal and procurement of PPPs. During 2010/11,
the unit issued the draft revised Standardised PPP contractual provisions for public comment. Comments were collated and
a revised document will be issued.
The unit provided contract management support to a number of PPP projects, including the Gautrain, which was accelerated
so that the O R Tambo Airport-Sandton link could open in time for the 2010 World Cup, and Chapman’s Peak Drive, which was
reopened for traffic after a long closure.
NT AR 10-11_10.indd 30 2011/08/17 10:02 AM

31
Nat
iona
l Tre
asur
y A
nnua
l Rep
ort 2
010/
11
Programme 2 - Public Finance and Budget Management
PROGRAmmE 2puBliC FiNaNCe aND BuDGet MaNaGeMeNt - continued
In the period under review transaction advisors were appointed for both Chris Hani Baragwanath and Limpopo
Academic hospitals. Work on the feasibility studies commenced and will be completed in 2011. There were delays in
concluding agreements with the Development Bank of Southern Africa resulting in one project not being completed at
financial close. The unit also continued assisting the Department of Energy with the procurement of renewable energy
programme. Procurement documents and the legislative review were completed. The unit also provided technical
assistance to the Passenger Rail Agency of South Africa with undertaking the feasibility study for the procurement of
rolling stock.
The Neighbourhood Development Programme (NDP) Unit administers the Neighbourhood Development Partnership
Grant (NDPG). The NDPG is structured as a conditional grant that primarily focuses on stimulating and accelerating
investment in poor, marginalised and undeserved neighbourhoods by providing Technical Assistance (TA) and
Capital Grant (CG) for municipal projects that have either a distinct private sector element or an intention to do so.
The NDPG target areas include dormitory townships, low-income housing estates and informal settlements. The
TA assists municipalities to develop long term township regeneration strategies, area based implementable plans
and to identify catalytic projects that could be funded by the NDPG. The CG is used to implement the identified
catalytic projects by the municipalities. The NDPG funds community infrastructure, places and facilities that will
attract private and public sector investment and enable better access to government services. It strives to create
a balance between township economic development and the quality of life of residents. The NDPG targets over 60
per cent of the country’s poorest people, with R5.2 billion allocated to metros and secondary cities, and R3.6 billion
allocated to rural large and small towns.
The unit’s achievements include:
• Aportfolioof90awards(valuedatR8.8billiontobeexpendedoverthenext10years)in57municipalities;
• ExpenditureofmorethanR831m,or76percentofbudgetedexpenditureduringthereviewperiod;
• Facilitationof185projectssincetheinceptionoftheNDPGin2006;
• ReviewoftheNDPG’sgrantframeworkandawardstructureonanannualbasis
• Development of a Management Information System and a monitoring and evaluation approach to improve
performance indicators and consolidate programme data and reporting; and
• Theco-ordinationoftrainingprogrammestoenhanceandstreamlinetheprocessofNDPGmanagement.
Neighbourhood development partnership grant
Key performance indicator*2006/07 2007/08 2008/09 2009/10 2010/2011
target actual target actual target actual target actual target actualNo. of NDP awards funded 35 33 60 72 80 86 90 90 90 90No. of NDP projects approved - - 4 20 27 70 92 100 185No. of projects commenced
construction- - 2 4 7 27 30 47 35 67
Expenditure (technical assistance)
(Rm) (Schedule 7)50.0 0.0 63.8 3.8 85.0 67.6 110 89.9 125 50
Expenditure (capital grant) (Rm)
(Schedule 6)0.0 0.0 231.2 41.4 289.0 181.5 551.0 508.0 1030 832
Expenditure (NDPG Total) (Rm) 50.0 0.0 295.0 45.1 374.0 249 661.0 597.9 1155 882
NT AR 10-11_10.indd 31 2011/08/17 10:02 AM
Nat
iona
l Tre
asur
y A
nnua
l Rep
ort 2
010/
11
32
Programme 2 - Public Finance and Budget Management
PROGRAmmE 2puBliC FiNaNCe aND BuDGet MaNaGeMeNt - continued
The Infrastructure Delivery Improvement Programme (IDIP) provides technical support to provincial departments of
education, health, public works and treasury to help these departments to improve on their infrastructure planning and
the management of the Infrastructure Delivery Management System (IDMS). IDIP support has also been extended to the
national department of Basic Education and the national department of Health.
Following the completion of phase II in March 2010, the programme was extended for another three years. The extension
is informed by the review of phase II of the programme which found that there was a need for the programme to
build sustainable systems and skills capacity in departments. The need to build sustainable systems is evident in the
performance of infrastructure budgets in the 2009/10 financial year where a number of departments underspent due to
the six months gap in the deployment process of technical assistants for the start of Phase III. The “gap period” delayed the
re-establishment of IDIP in departments resulting in poor performance. Poor performance was as a result of departments
not having built internal capacity during IDIP II – instead they relied on IDIP technical assistance to fill capacity gaps. The
design of phase IDIP III deepens the capacity building in addressing organisational and skills development as well as
institutionalisation of best practises.
Key achievements during the review period include:
• Thedeploymentof34longtermtechnicalassistantsin34departments(health,education,publicworksandtreasury)
in all provinces.
• Fivelongtermtechnicalassistantsappointedintothenationaldepartmentsafollows:
• TwointhenationaldepartmentofHealthtohelpwiththeformulationofinfrastructurenormsandstandardsforthe
health infrastructure.
• OneinthedepartmentofBasicEducationtoconductqualitychecksandoverseetheimplementationofnormsand
standards for the education infrastructure.
• TwoappointedintheIDIPprogrammemanagementUnitintheNationalTreasury;oneisresponsibleforrollingout
of the IDM Toolkit and the institutionalisation thereof, and to assist with formulating the Strategic Human Resource
Framework for infrastructure personnel.
• TherevisionandapprovaloftheInfrastructureDeliveryManagementToolkitasthebestpracticetoolfordelivering
infrastructure.
Intergovernmental Relations
The Intergovernmental Relations (IGR) division coordinates fiscal relations between the national, provincial and local
spheres of government, an important function given that R384.2 billion or 51.7 per cent of non-interest expenditure in
2010/11 was allocated to provinces and municipalities. The bulk of this expenditure went to priority programmes such as
education, health care and the provision of free basic services.
The division coordinates inputs to the division of revenue, the annual Division of Revenue Bill and the development of
the framework for the management of conditional grants. The 2011 Division of Revenue Act was refined in a number
of sections to align planning and reporting requirements with provincial and local government fiscal reforms, especially
regarding infrastructure and the built environment. The provincial equitable share formula was revised and a new health
component was introduced while some of the components were re-weighted. The local government equitable share
formula was also adjusted to direct more funds towards poor rural municipalities. In addition, conditional grants for
infrastructure were restructured and new conditional grants were introduced to cater for specific infrastructure priorities
in education and the upgrading of informal settlements in metropolitan municipalities.
NT AR 10-11_10.indd 32 2011/08/17 10:02 AM

33
Nat
iona
l Tre
asur
y A
nnua
l Rep
ort 2
010/
11
Programme 2 - Public Finance and Budget Management
PROGRAmmE 2puBliC FiNaNCe aND BuDGet MaNaGeMeNt - continued
The division has an internet-based training programme on the essentials of budget formulation and analysis. About 221
officials applied for the programme and 129 completed the training. In addition, there were 170 applicants for the
budget analysis course, with only 88 officials successfully completing the training. The decline in the number of officials
who participated in and completed the training is in part as a result of the roll-out in Limpopo being cancelled. Delays in
other provinces were as a result of the public sector labour actions. The division continued to build financial management
capacity through a number of interventions and provided guidelines, with continuous inputs from stakeholders, to ensure
consistency in the manner budget information is consolidated. In addition, four provincial quarterly reports, in terms of
section 32 of the PFMA, were published.
The local government fiscal framework has been amended to take into account the differences in the capacity of large
urban and smaller rural municipalities to deliver services. The municipal infrastructure grant was amended to take into
account differences in integrated planning, the leveraging of municipal resources to eradicate backlogs, improved
performance in developing integrated human settlements, and effective asset management for cities. The Urban
Settlement Grant has been established to enhance MIG Cities objectives of managing the built environment. For rural
municipalities, the amendments are meant to address infrastructure needs for basic services and rural development.
In this regard the Rural Household Infrastructure Grant was created to attend to the needs of water and sanitation
infrastructure in rural areas. This household infrastructure grant supports the objectives of the original MIG with
specific focus on onsite solutions needed.
During the reporting period, IGR increased its capacity to provide effective budget support to local government. For
the 2010/11 local government financial year, 94 per cent or 272 of the 283 municipalities complied with the Municipal
Budget and Reporting Regulations. In addition, the division commenced with the institutionalisation of the Municipal
Budget and Benchmarking Exercise for the 17 metro and large urban municipalities that report to the National Treasury.
The funding compliance methodology was again successfully applied to all these municipalities’ budgets with an
independent assessment of the results undertaken by IGR. Improvements were noted in the level of understanding
demonstrated by municipalities in the application of the methodology and the requirements for a funded municipal
budget. Only two provincial treasuries applied the methodology to the assessment of municipal budgets for delegated
municipalities in 2010/11. Further training will be provided to the remaining provincial treasuries to ensure the roll-out
of the methodology to all municipalities.
The division has ensured steady progress on the development of the Standard Chart of Accounts for local government.
In the period under review, the design of the chart was completed and stakeholder consultation processes in preparation
for the piloting phase commenced.
The Local Government Budgets and Expenditure Review highlighting the performance of local government for the period
2005/06 to 2011/12 was prepared during the reporting period. The Review to be primarily used as an induction tool for
new councillors is scheduled to be published by August 2011.
All quarterly in-year expenditure reports for local government in terms of section 71 of the MFMA were published within
the required timeframes and posted on the departmental website. There was notable progress in improving the coverage
and quality of the in-year reports. An average of 280 municipalities reported in each quarter. Further, a number of
processes were implemented during the reporting period to improve the overall quality of in-year reporting.
NT AR 10-11_10.indd 33 2011/08/17 10:02 AM

Nat
iona
l Tre
asur
y A
nnua
l Rep
ort 2
010/
11
34
Programme 2 - Public Finance and Budget Management
PROGRAmmE 2puBliC FiNaNCe aND BuDGet MaNaGeMeNt - continued
SERV
ICE
dEl
IVER
y A
ChIE
VEm
ENTS
prog
ram
me
2: p
ublic
Fin
ance
and
Bud
get M
anag
emen
t
Mea
sura
ble
obje
ctiv
e: T
o pr
omot
e gr
owth
, soc
ial d
evel
opm
ent a
nd p
over
ty re
duct
ion
thro
ugh
soun
d fis
cal a
nd fi
nanc
ial p
olic
ies,
and
the
effec
tive,
effi
cien
t and
appr
opria
te a
lloca
tion
of p
ublic
fund
ssu
bpro
gram
me
out
put
Mea
sure
/ in
dica
tor
act
ual p
erfo
rman
ce a
gain
st ta
rget
targ
eta
ctua
lBu
dget
Offi
ceA
nnua
l bud
get f
ram
ewor
k
and
divi
sion
of r
even
ue
Inte
grity
of n
atio
nal b
udge
t
fram
ewor
k
MTB
PS in
Oct
ober
of e
ach
year
sett
ing
out t
he fr
amew
ork
for t
he B
udge
t, in
clud
ing
the
vert
ical
div
isio
n of
reve
nue
Hig
h-qu
ality
bud
get f
ram
ewor
k w
ith
accu
rate
num
bers
, com
plet
ed in
line
with
mac
roec
onom
ic o
bjec
tives
and
budg
et p
roce
ss d
ates
. Th
e Bu
dget
fram
ewor
k an
d di
visi
on o
f rev
enue
was
base
d on
gov
ernm
ent’s
out
com
es.
Allo
catio
ns a
cros
s na
tiona
l, pr
ovin
cial
and
loca
l sph
eres
wer
e gu
ided
by
the
new
ly d
evel
oped
func
tiona
l bud
getin
g
appr
oach
Budg
et R
evie
w , E
stim
ates
of N
atio
nal E
xpen
ditu
re,
appr
opria
tion
legi
slatio
n an
d
publ
ic fi
nanc
e st
atist
ics
Qua
lity
of b
udge
t
docu
men
tatio
n
Tim
ely
publ
icat
ion,
acc
urac
y,
scop
e an
d qu
ality
of c
onte
nt.
Impr
oved
qua
lity
of m
easu
rabl
e
obje
ctiv
es a
nd s
elec
ted
perf
orm
ance
indi
cato
rs b
y
depa
rtm
ents
and
pub
lic e
ntiti
es
in th
e Es
timat
es o
f Nat
iona
l
Expe
nditu
re
Hig
h-qu
ality
Bud
get R
evie
w a
nd E
NE
publ
ishe
d on
tim
e. E
xpen
ditu
re a
nd
perf
orm
ance
info
rmat
ion
publ
ishe
d by
prog
ram
me.
Obj
ectiv
es, m
easu
res
and
perf
orm
ance
indi
cato
rs in
line
with
key
man
date
s an
d go
vern
men
t’s o
utco
mes
wer
e pu
blis
hed.
Sav
ings
and
cos
t
effec
tiven
ess
mea
sure
s w
ere
publ
ishe
d
Expe
nditu
re p
lann
ing
and
budg
et p
roce
ss m
anag
emen
t
Dep
artm
enta
l and
age
ncy
spen
ding
pla
ns a
nd
subm
issi
ons
to M
inis
ters
’
Com
mitt
ee o
n th
e Bu
dget
Impr
oved
qua
lity
of
perf
orm
ance
info
rmat
ion
for
depa
rtm
ents
and
pub
lic e
ntiti
es
used
in b
udge
t dec
isio
n m
akin
g
Ther
e w
as a
shi
ft to
war
ds fu
nctio
nal
budg
etin
g in
dev
elop
ing
the
2011
med
ium
term
exp
endi
ture
fram
ewor
k.
This
app
roac
h gr
oups
toge
ther
nat
iona
l,
prov
inci
al a
nd lo
cal g
over
nmen
t, an
d
gove
rnm
ent a
genc
ies,
in te
rms
of th
e
func
tion
of g
over
nmen
t the
y pe
rfor
m
NT AR 10-11_10.indd 34 2011/08/17 10:02 AM

35
Nat
iona
l Tre
asur
y A
nnua
l Rep
ort 2
010/
11
Programme 2 - Public Finance and Budget Management
PROGRAmmE 2puBliC FiNaNCe aND BuDGet MaNaGeMeNt - continued
SERV
ICE
dEl
IVER
y A
ChIE
VEm
ENTS
prog
ram
me
2: p
ublic
Fin
ance
and
Bud
get M
anag
emen
t
Mea
sura
ble
obje
ctiv
e: T
o pr
omot
e gr
owth
, soc
ial d
evel
opm
ent a
nd p
over
ty re
duct
ion
thro
ugh
soun
d fis
cal a
nd fi
nanc
ial p
olic
ies,
and
the
effec
tive,
effi
cien
t and
appr
opria
te a
lloca
tion
of p
ublic
fund
ssu
bpro
gram
me
out
put
Mea
sure
/ in
dica
tor
act
ual p
erfo
rman
ce a
gain
st ta
rget
targ
eta
ctua
lBu
dget
Offi
ceA
nnua
l bud
get f
ram
ewor
k
and
divi
sion
of r
even
ue
Inte
grity
of n
atio
nal b
udge
t
fram
ewor
k
MTB
PS in
Oct
ober
of e
ach
year
sett
ing
out t
he fr
amew
ork
for t
he B
udge
t, in
clud
ing
the
vert
ical
div
isio
n of
reve
nue
Hig
h-qu
ality
bud
get f
ram
ewor
k w
ith
accu
rate
num
bers
, com
plet
ed in
line
with
mac
roec
onom
ic o
bjec
tives
and
budg
et p
roce
ss d
ates
. Th
e Bu
dget
fram
ewor
k an
d di
visi
on o
f rev
enue
was
base
d on
gov
ernm
ent’s
out
com
es.
Allo
catio
ns a
cros
s na
tiona
l, pr
ovin
cial
and
loca
l sph
eres
wer
e gu
ided
by
the
new
ly d
evel
oped
func
tiona
l bud
getin
g
appr
oach
Budg
et R
evie
w , E
stim
ates
of N
atio
nal E
xpen
ditu
re,
appr
opria
tion
legi
slatio
n an
d
publ
ic fi
nanc
e st
atist
ics
Qua
lity
of b
udge
t
docu
men
tatio
n
Tim
ely
publ
icat
ion,
acc
urac
y,
scop
e an
d qu
ality
of c
onte
nt.
Impr
oved
qua
lity
of m
easu
rabl
e
obje
ctiv
es a
nd s
elec
ted
perf
orm
ance
indi
cato
rs b
y
depa
rtm
ents
and
pub
lic e
ntiti
es
in th
e Es
timat
es o
f Nat
iona
l
Expe
nditu
re
Hig
h-qu
ality
Bud
get R
evie
w a
nd E
NE
publ
ishe
d on
tim
e. E
xpen
ditu
re a
nd
perf
orm
ance
info
rmat
ion
publ
ishe
d by
prog
ram
me.
Obj
ectiv
es, m
easu
res
and
perf
orm
ance
indi
cato
rs in
line
with
key
man
date
s an
d go
vern
men
t’s o
utco
mes
wer
e pu
blis
hed.
Sav
ings
and
cos
t
effec
tiven
ess
mea
sure
s w
ere
publ
ishe
d
Expe
nditu
re p
lann
ing
and
budg
et p
roce
ss m
anag
emen
t
Dep
artm
enta
l and
age
ncy
spen
ding
pla
ns a
nd
subm
issi
ons
to M
inis
ters
’
Com
mitt
ee o
n th
e Bu
dget
Impr
oved
qua
lity
of
perf
orm
ance
info
rmat
ion
for
depa
rtm
ents
and
pub
lic e
ntiti
es
used
in b
udge
t dec
isio
n m
akin
g
Ther
e w
as a
shi
ft to
war
ds fu
nctio
nal
budg
etin
g in
dev
elop
ing
the
2011
med
ium
term
exp
endi
ture
fram
ewor
k.
This
app
roac
h gr
oups
toge
ther
nat
iona
l,
prov
inci
al a
nd lo
cal g
over
nmen
t, an
d
gove
rnm
ent a
genc
ies,
in te
rms
of th
e
func
tion
of g
over
nmen
t the
y pe
rfor
m
Impr
oved
em
phas
is a
nd fo
cus
on s
avin
gs a
nd c
ost e
ffect
ive
serv
ice
deliv
ery
by d
epar
tmen
ts
and
publ
ic e
ntiti
es.
Mor
e
exte
nsiv
e an
alys
is o
f bas
elin
es
of a
ll de
part
men
ts a
nd e
ntiti
es
The
Budg
et p
roce
ss fo
cuse
d ex
tens
ivel
y
on fi
ndin
g sa
ving
s w
ithin
dep
artm
enta
l
and
agen
cy b
udge
t bas
elin
es. T
he fu
nds
iden
tified
(R30
.6 b
illio
n) w
ere
mos
tly
real
loca
ted
with
in th
e fu
nctio
nal b
udge
t
base
lines
, cur
bing
unn
eces
sary
and
was
tefu
l exp
endi
ture
Capi
tal e
xpen
ditu
re p
lann
ing
and
eval
uatio
n
Impr
oved
qua
lity
of c
apita
l
plan
ning
lead
ing
to m
ore
effici
ent b
udge
t allo
catio
ns
and
capi
tal e
xpen
ditu
re
Rollo
ut o
f app
rais
al fr
amew
ork
with
initi
al n
arro
w fo
cus,
broa
deni
ng in
clus
ion
as
capa
city
dev
elop
s
Cons
olid
atio
n pr
oces
s an
d al
ignm
ent
with
the
Cons
truc
tion
Indu
stry
Dev
elop
men
t Boa
rd (C
IDB)
gat
eway
unde
rway
Initi
al im
plem
enta
tion
of
fram
ewor
k, in
clud
ing
the
deve
lopm
ent o
f a p
roje
ct d
riven
data
base
Dis
cuss
ions
hel
d w
ith th
e Pr
esid
ency
,
Inte
rgov
ernm
enta
l Re
latio
ns d
ivis
ion
and
CID
B on
a s
ingl
e da
taba
se
Cha
nges
to re
gula
tions
(whe
re
nece
ssar
y)
Dra
ftin
g pr
oces
s on
-goi
ng a
nd in
tern
al
lega
l adv
ice
bein
g ob
tain
edD
evel
opm
ent a
nd p
ublic
atio
n
of a
ppra
isal
gui
delin
es
Com
plet
ed th
e fir
st p
hase
of i
mpr
ovin
g
the
appr
aisa
l gui
delin
esCo
ntin
ued
roll-
out a
nd
broa
deni
ng o
f tra
inin
g
Inte
ract
ed w
ith P
alam
a to
dev
elop
a
proj
ect a
ppra
isal
cou
rse
Offi
cial
Dev
elop
men
t
Ass
ista
nce
(OD
A) r
esou
rces
alig
ned
to a
nd m
obili
sed
for
gove
rnm
ent p
olic
ies
and
prio
ritie
s
Alig
nmen
t of O
DA
fund
ing
deci
sion
s w
ith th
e bu
dget
proc
ess
Focu
s w
ill b
e br
oade
ned
to
incl
ude
econ
omic
and
rura
l
deve
lopm
ent
Alig
nmen
t was
ach
ieve
d w
ith
prog
ram
mes
in a
reas
of e
cono
mic
deve
lopm
ent,
heal
th a
nd e
duca
tion.
Alig
nmen
t with
the
rura
l dev
elop
men
t
prog
ram
me
has
not c
omm
ence
d Im
prov
ed p
rogr
amm
e
stru
ctur
e of
dep
artm
enta
l
vote
s
Supp
ortin
g de
part
men
ts
in im
prov
ing
stru
ctur
ing
prog
ram
mes
in d
epar
tmen
tal
vote
s
Com
plet
ion
of p
roje
ct
in s
uppo
rt o
f the
cor
rect
impl
emen
tatio
n of
gui
delin
es
Proj
ect c
ompl
eted
. Gui
delin
es u
sed
to
revi
ew a
nd m
ake
impr
ovem
ents
to 2
9 of
38 v
otes
NT AR 10-11_10.indd 35 2011/08/17 10:02 AM
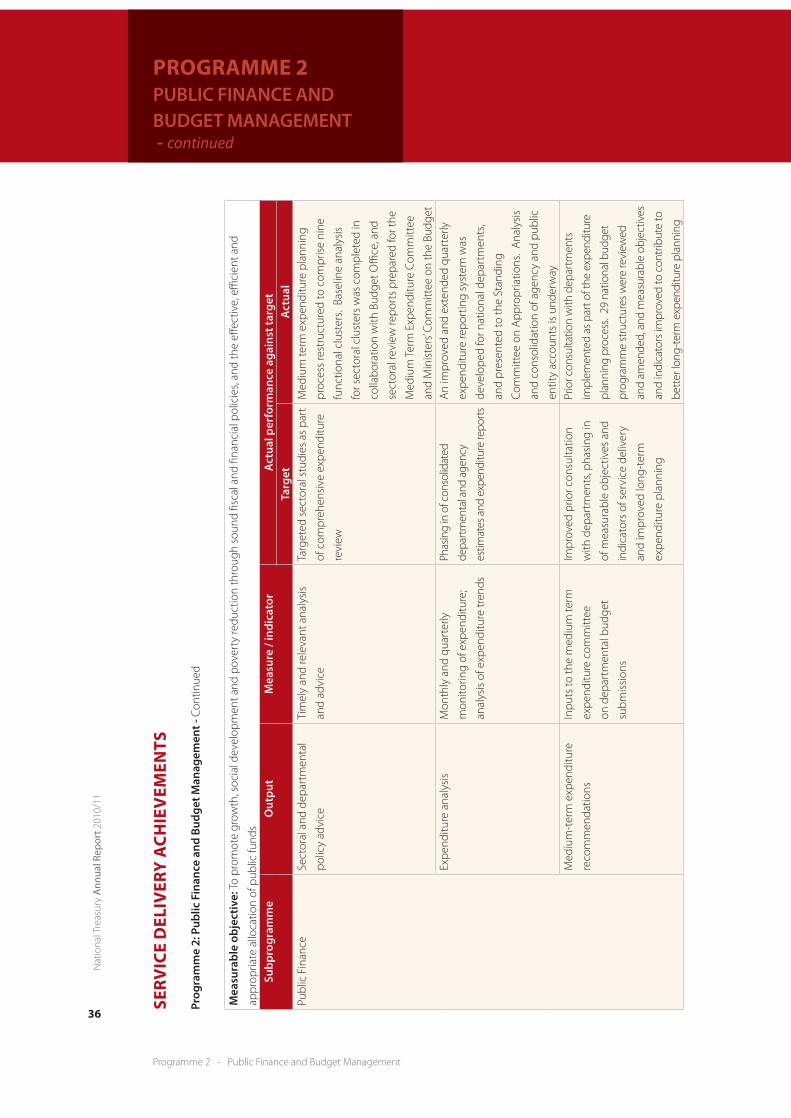
Nat
iona
l Tre
asur
y A
nnua
l Rep
ort 2
010/
11
36
Programme 2 - Public Finance and Budget Management
PROGRAmmE 2puBliC FiNaNCe aND BuDGet MaNaGeMeNt - continued
Mea
sura
ble
obje
ctiv
e: T
o pr
omot
e gr
owth
, soc
ial d
evel
opm
ent a
nd p
over
ty re
duct
ion
thro
ugh
soun
d fis
cal a
nd fi
nanc
ial p
olic
ies,
and
the
effec
tive,
effi
cien
t and
appr
opria
te a
lloca
tion
of p
ublic
fund
ssu
bpro
gram
me
out
put
Mea
sure
/ in
dica
tor
act
ual p
erfo
rman
ce a
gain
st ta
rget
targ
eta
ctua
lPu
blic
Fin
ance
Sect
oral
and
dep
artm
enta
l
polic
y ad
vice
Tim
ely
and
rele
vant
ana
lysi
s
and
advi
ce
Targ
eted
sec
tora
l stu
dies
as
part
of c
ompr
ehen
sive
exp
endi
ture
revi
ew
Med
ium
term
exp
endi
ture
pla
nnin
g
proc
ess
rest
ruct
ured
to c
ompr
ise
nine
func
tiona
l clu
ster
s. B
asel
ine
anal
ysis
for s
ecto
ral c
lust
ers
was
com
plet
ed in
colla
bora
tion
with
Bud
get O
ffice
, and
sect
oral
revi
ew re
port
s pr
epar
ed fo
r the
Med
ium
Ter
m E
xpen
ditu
re C
omm
ittee
and
Min
iste
rs’ C
omm
ittee
on
the
Budg
etEx
pend
iture
ana
lysi
s M
onth
ly a
nd q
uart
erly
mon
itorin
g of
exp
endi
ture
;
anal
ysis
of e
xpen
ditu
re tr
ends
Phas
ing
in o
f con
solid
ated
depa
rtm
enta
l and
age
ncy
estim
ates
and
exp
endi
ture
repo
rts
An
impr
oved
and
ext
ende
d qu
arte
rly
expe
nditu
re re
port
ing
syst
em w
as
deve
lope
d fo
r nat
iona
l dep
artm
ents
,
and
pres
ente
d to
the
Stan
ding
Com
mitt
ee o
n A
ppro
pria
tions
. A
naly
sis
and
cons
olid
atio
n of
age
ncy
and
publ
ic
entit
y ac
coun
ts is
und
erw
ayM
ediu
m-t
erm
exp
endi
ture
reco
mm
enda
tions
Inpu
ts to
the
med
ium
term
expe
nditu
re c
omm
ittee
on d
epar
tmen
tal b
udge
t
subm
issi
ons
Impr
oved
prio
r con
sulta
tion
with
dep
artm
ents
, pha
sing
in
of m
easu
rabl
e ob
ject
ives
and
indi
cato
rs o
f ser
vice
del
iver
y
and
impr
oved
long
-ter
m
expe
nditu
re p
lann
ing
Prio
r con
sulta
tion
with
dep
artm
ents
impl
emen
ted
as p
art o
f the
exp
endi
ture
plan
ning
pro
cess
. 29
nat
iona
l bud
get
prog
ram
me
stru
ctur
es w
ere
revi
ewed
and
amen
ded,
and
mea
sura
ble
obje
ctiv
es
and
indi
cato
rs im
prov
ed to
con
trib
ute
to
bett
er lo
ng-t
erm
exp
endi
ture
pla
nnin
g
SERV
ICE
dEl
IVER
y A
ChIE
VEm
ENTS
prog
ram
me
2: p
ublic
Fin
ance
and
Bud
get M
anag
emen
t - C
ontin
ued
NT AR 10-11_10.indd 36 2011/08/17 10:02 AM

37
Nat
iona
l Tre
asur
y A
nnua
l Rep
ort 2
010/
11
Programme 2 - Public Finance and Budget Management
PROGRAmmE 2puBliC FiNaNCe aND BuDGet MaNaGeMeNt - continued
Mea
sura
ble
obje
ctiv
e: T
o pr
omot
e gr
owth
, soc
ial d
evel
opm
ent a
nd p
over
ty re
duct
ion
thro
ugh
soun
d fis
cal a
nd fi
nanc
ial p
olic
ies,
and
the
effec
tive,
effi
cien
t and
appr
opria
te a
lloca
tion
of p
ublic
fund
ssu
bpro
gram
me
out
put
Mea
sure
/ in
dica
tor
act
ual p
erfo
rman
ce a
gain
st ta
rget
targ
eta
ctua
lPu
blic
Fin
ance
Sect
oral
and
dep
artm
enta
l
polic
y ad
vice
Tim
ely
and
rele
vant
ana
lysi
s
and
advi
ce
Targ
eted
sec
tora
l stu
dies
as
part
of c
ompr
ehen
sive
exp
endi
ture
revi
ew
Med
ium
term
exp
endi
ture
pla
nnin
g
proc
ess
rest
ruct
ured
to c
ompr
ise
nine
func
tiona
l clu
ster
s. B
asel
ine
anal
ysis
for s
ecto
ral c
lust
ers
was
com
plet
ed in
colla
bora
tion
with
Bud
get O
ffice
, and
sect
oral
revi
ew re
port
s pr
epar
ed fo
r the
Med
ium
Ter
m E
xpen
ditu
re C
omm
ittee
and
Min
iste
rs’ C
omm
ittee
on
the
Budg
etEx
pend
iture
ana
lysi
s M
onth
ly a
nd q
uart
erly
mon
itorin
g of
exp
endi
ture
;
anal
ysis
of e
xpen
ditu
re tr
ends
Phas
ing
in o
f con
solid
ated
depa
rtm
enta
l and
age
ncy
estim
ates
and
exp
endi
ture
repo
rts
An
impr
oved
and
ext
ende
d qu
arte
rly
expe
nditu
re re
port
ing
syst
em w
as
deve
lope
d fo
r nat
iona
l dep
artm
ents
,
and
pres
ente
d to
the
Stan
ding
Com
mitt
ee o
n A
ppro
pria
tions
. A
naly
sis
and
cons
olid
atio
n of
age
ncy
and
publ
ic
entit
y ac
coun
ts is
und
erw
ayM
ediu
m-t
erm
exp
endi
ture
reco
mm
enda
tions
Inpu
ts to
the
med
ium
term
expe
nditu
re c
omm
ittee
on d
epar
tmen
tal b
udge
t
subm
issi
ons
Impr
oved
prio
r con
sulta
tion
with
dep
artm
ents
, pha
sing
in
of m
easu
rabl
e ob
ject
ives
and
indi
cato
rs o
f ser
vice
del
iver
y
and
impr
oved
long
-ter
m
expe
nditu
re p
lann
ing
Prio
r con
sulta
tion
with
dep
artm
ents
impl
emen
ted
as p
art o
f the
exp
endi
ture
plan
ning
pro
cess
. 29
nat
iona
l bud
get
prog
ram
me
stru
ctur
es w
ere
revi
ewed
and
amen
ded,
and
mea
sura
ble
obje
ctiv
es
and
indi
cato
rs im
prov
ed to
con
trib
ute
to
bett
er lo
ng-t
erm
exp
endi
ture
pla
nnin
g
Soci
al s
ecur
ity a
nd re
tirem
ent
refo
rm (j
oint
ly w
ith F
inan
cial
Sect
or P
olic
y - P
rogr
amm
e 6)
Polic
y fra
mew
ork
and
impl
emen
tatio
n ro
ad-m
ap
Phas
ed im
plem
enta
tion
of
cont
ribut
ory
soci
al s
ecur
ity
refo
rms
and
retir
emen
t ind
ustr
y
legi
slat
ive
amen
dmen
ts
Dra
ft d
iscu
ssio
n do
cum
ent p
repa
red
and
cons
ider
ed b
y th
e In
ter M
inis
teria
l
Com
mitt
ee. R
evis
ions
requ
este
d be
ing
actio
ned
Com
preh
ensi
ve p
ublic
expe
nditu
re re
view
(in c
onsu
ltatio
n w
ith
Inte
rgov
ernm
enta
l Rel
atio
ns
and
Budg
et O
ffice
)
Ove
rvie
w p
aper
on
expe
nditu
re p
riorit
ies
and
optio
ns fo
r sav
ings
to b
e
cons
ider
ed in
201
1 bu
dget
proc
ess
Sect
oral
exp
endi
ture
revi
ews
com
pile
d in
con
sulta
tion
with
Pre
side
ncy
and
line
depa
rtm
ents
Ove
rvie
w p
aper
s on
exp
endi
ture
prio
ritie
s an
d re
com
men
datio
ns fo
r
savi
ngs
wer
e pr
epar
ed fo
r Med
ium
Ter
m
Expe
nditu
re C
omm
ittee
and
Min
iste
rs’
Com
mitt
ee o
n th
e Bu
dget
. Pre
limin
ary
sect
oral
exp
endi
ture
revi
ews
wer
e
com
pile
d in
the
new
func
tiona
l clu
ster
s
agre
ed fo
r the
MTE
C p
roce
ssIn
terg
over
nmen
tal
Rela
tions
Prov
inci
al b
udge
t fra
mew
ork
Inte
grity
of t
he fr
amew
ork:
fisca
l sus
tain
abili
ty, s
truc
ture
and
tren
ds in
fisc
al in
dica
tors
Prov
inci
al b
udge
t fra
mew
ork
final
ised
by
Sept
embe
r of
budg
et p
lann
ing
year
Prov
inci
al b
udge
t fra
mew
ork
final
ised
in
Sept
embe
r 201
0. P
relim
inar
y al
loca
tions
wer
e co
mm
unic
ated
to p
rovi
nces
in
Dec
embe
r 201
0. F
inal
allo
catio
n w
as
com
mun
icat
ed to
pro
vinc
es in
Janu
ary
2011
and
tabl
ed a
s pa
rt o
f the
201
1
Budg
etLo
cal g
over
nmen
t bud
get
fram
ewor
k
Inte
grity
of t
he fr
amew
ork:
fisca
l sus
tain
abili
ty, s
truc
ture
and
tren
ds in
fisc
al in
dica
tors
Loca
l gov
ernm
ent f
ram
ewor
k
final
ised
by
Sept
embe
r of t
he
budg
et p
lann
ing
year
Loca
l gov
ernm
ent b
udge
t fra
mew
ork
final
ised
in S
epte
mbe
r 201
0. T
he fi
nal
allo
catio
ns w
ere
com
mun
icat
ed to
mun
icip
aliti
es o
n Bu
dget
Day
, 23
Febr
uary
201
1Pr
epar
atio
n of
the
Div
isio
n
of R
even
ue B
ill a
nd
acco
mpa
nyin
g ex
plan
ator
y
mem
oran
dum
and
impl
emen
tatio
n of
the
Act
Tim
ely
publ
icat
ion
and
qual
ity
of th
e D
ivis
ion
of R
even
ue B
ill
and
expl
anat
ory
mem
oran
dum
(Ann
exur
e W
1)
Tabl
ed o
n bu
dget
day
with
no
erro
rs
2011
Div
isio
n of
Rev
enue
Bill
was
tabl
ed
on B
udge
t Day
, 23
Febr
uary
201
1.
Min
or a
men
dmen
ts w
ere
mad
e to
the
Ann
exur
es to
the
Bill
(suc
h as
con
ditio
nal
gran
t fra
mew
orks
) dur
ing
parli
amen
tary
proc
ess
NT AR 10-11_10.indd 37 2011/08/17 10:02 AM

Nat
iona
l Tre
asur
y A
nnua
l Rep
ort 2
010/
11
38
Programme 2 - Public Finance and Budget Management
PROGRAmmE 2puBliC FiNaNCe aND BuDGet MaNaGeMeNt - continued
Mea
sura
ble
obje
ctiv
e: T
o pr
omot
e gr
owth
, soc
ial d
evel
opm
ent a
nd p
over
ty re
duct
ion
thro
ugh
soun
d fis
cal a
nd fi
nanc
ial p
olic
ies,
and
the
effec
tive,
effi
cien
t and
appr
opria
te a
lloca
tion
of p
ublic
fund
ssu
bpro
gram
me
out
put
Mea
sure
/ in
dica
tor
act
ual p
erfo
rman
ce a
gain
st ta
rget
targ
eta
ctua
lIn
terg
over
nmen
tal
Rela
tions
Supp
ort p
rovi
ncia
l
gove
rnm
ent w
ith:
Fina
ncia
l man
agem
ent
refo
rms
Serv
ice
deliv
ery
Num
ber o
f pro
vinc
ial
depa
rtm
ents
in w
hich
fina
ncia
l
man
agem
ent p
rogr
amm
es
and
refo
rms
are
impl
emen
ted
in te
rms
of th
e Pu
blic
Fin
ance
Man
agem
ent A
ct (P
FMA
)
Fina
ncia
l man
agem
ent r
efor
ms
impl
emen
ted
in 4
0 pr
ovin
cial
depa
rtm
ents
Budg
et &
Pro
gram
me
Stru
ctur
es re
view
unde
rtak
en (
40 p
rovi
ncia
l dep
artm
ents
)
Fina
ncia
l Man
agem
ent I
mpr
ovem
ent
Foru
m e
stab
lishe
d (9
pro
vinc
ial t
reas
urie
s)
Supp
ort f
or im
plem
enta
tion
of n
ew
Stra
tegi
c Pe
rfor
man
ce P
lan
and
Ann
ual
Perf
orm
ance
Pla
n fra
mew
ork
(120
prov
inci
al d
epar
tmen
ts)
Estim
ates
of P
rovi
ncia
l Rev
enue
and
Expe
nditu
re G
uide
line
revi
ewed
and
impl
emen
ted
(120
pro
vinc
ial
depa
rtm
ents
)Su
ppor
t mun
icip
al
gove
rnm
ent w
ith:
Infra
stru
ctur
e pl
anni
ng
Serv
ice
deliv
ery
Num
ber o
f mun
icip
aliti
es in
whi
ch in
frast
ruct
ure
plan
ning
and
serv
ice
deliv
ery
initi
ativ
es
are
impl
emen
ted
Impl
emen
tatio
n pr
ogra
mm
e
exte
nded
to 1
5 m
unic
ipal
ities
Impl
emen
tatio
n pr
ogra
mm
e ex
tend
ed
to 1
88 m
unic
ipal
ities
thro
ugh
the
Siye
nza
Man
je p
rogr
amm
e im
plem
ente
d
by D
BSA
The
prog
ram
me
was
rest
ruct
ured
and
will
cont
inue
und
er a
diff
eren
t nam
e an
d fo
rmBu
ildin
g fu
rthe
r cap
acity
in b
udge
t for
mul
atio
n an
d
budg
et a
naly
sis
Num
ber o
f offi
cial
s tr
aine
d
500
offici
als
on b
oth
the
budg
et
form
ulat
ion
and
budg
et a
naly
sis
cour
ses
per y
ear
129
part
icip
ants
com
plet
ed th
e Bu
dget
Form
ulat
ion
cour
se o
ut o
f 221
88 p
artic
ipan
ts c
ompl
eted
the
Budg
et
Ana
lysi
s co
urse
out
170
SERV
ICE
dEl
IVER
y A
ChIE
VEm
ENTS
prog
ram
me
2: p
ublic
Fin
ance
and
Bud
get M
anag
emen
t - C
ontin
ued
NT AR 10-11_10.indd 38 2011/08/17 10:02 AM

39
Nat
iona
l Tre
asur
y A
nnua
l Rep
ort 2
010/
11
Programme 2 - Public Finance and Budget Management
PROGRAmmE 2puBliC FiNaNCe aND BuDGet MaNaGeMeNt - continued
Mea
sura
ble
obje
ctiv
e: T
o pr
omot
e gr
owth
, soc
ial d
evel
opm
ent a
nd p
over
ty re
duct
ion
thro
ugh
soun
d fis
cal a
nd fi
nanc
ial p
olic
ies,
and
the
effec
tive,
effi
cien
t and
appr
opria
te a
lloca
tion
of p
ublic
fund
ssu
bpro
gram
me
out
put
Mea
sure
/ in
dica
tor
act
ual p
erfo
rman
ce a
gain
st ta
rget
targ
eta
ctua
lIn
terg
over
nmen
tal
Rela
tions
Supp
ort p
rovi
ncia
l
gove
rnm
ent w
ith:
Fina
ncia
l man
agem
ent
refo
rms
Serv
ice
deliv
ery
Num
ber o
f pro
vinc
ial
depa
rtm
ents
in w
hich
fina
ncia
l
man
agem
ent p
rogr
amm
es
and
refo
rms
are
impl
emen
ted
in te
rms
of th
e Pu
blic
Fin
ance
Man
agem
ent A
ct (P
FMA
)
Fina
ncia
l man
agem
ent r
efor
ms
impl
emen
ted
in 4
0 pr
ovin
cial
depa
rtm
ents
Budg
et &
Pro
gram
me
Stru
ctur
es re
view
unde
rtak
en (
40 p
rovi
ncia
l dep
artm
ents
)
Fina
ncia
l Man
agem
ent I
mpr
ovem
ent
Foru
m e
stab
lishe
d (9
pro
vinc
ial t
reas
urie
s)
Supp
ort f
or im
plem
enta
tion
of n
ew
Stra
tegi
c Pe
rfor
man
ce P
lan
and
Ann
ual
Perf
orm
ance
Pla
n fra
mew
ork
(120
prov
inci
al d
epar
tmen
ts)
Estim
ates
of P
rovi
ncia
l Rev
enue
and
Expe
nditu
re G
uide
line
revi
ewed
and
impl
emen
ted
(120
pro
vinc
ial
depa
rtm
ents
)Su
ppor
t mun
icip
al
gove
rnm
ent w
ith:
Infra
stru
ctur
e pl
anni
ng
Serv
ice
deliv
ery
Num
ber o
f mun
icip
aliti
es in
whi
ch in
frast
ruct
ure
plan
ning
and
serv
ice
deliv
ery
initi
ativ
es
are
impl
emen
ted
Impl
emen
tatio
n pr
ogra
mm
e
exte
nded
to 1
5 m
unic
ipal
ities
Impl
emen
tatio
n pr
ogra
mm
e ex
tend
ed
to 1
88 m
unic
ipal
ities
thro
ugh
the
Siye
nza
Man
je p
rogr
amm
e im
plem
ente
d
by D
BSA
The
prog
ram
me
was
rest
ruct
ured
and
will
cont
inue
und
er a
diff
eren
t nam
e an
d fo
rmBu
ildin
g fu
rthe
r cap
acity
in b
udge
t for
mul
atio
n an
d
budg
et a
naly
sis
Num
ber o
f offi
cial
s tr
aine
d
500
offici
als
on b
oth
the
budg
et
form
ulat
ion
and
budg
et a
naly
sis
cour
ses
per y
ear
129
part
icip
ants
com
plet
ed th
e Bu
dget
Form
ulat
ion
cour
se o
ut o
f 221
88 p
artic
ipan
ts c
ompl
eted
the
Budg
et
Ana
lysi
s co
urse
out
170
Roll
out M
unic
ipal
Bud
get
and
Repo
rtin
g Re
gula
tions
Num
ber o
f mun
icip
aliti
es
com
plyi
ng w
ith n
ew fo
rmat
s
Budg
ets
of 2
83 m
unic
ipal
ities
in
acco
rdan
ce w
ith fo
rmat
s
94 p
er c
ent s
ucce
ss ra
te in
the
roll
out
of fo
rmat
s fo
r the
201
0/11
bud
gets
(272
mun
icip
aliti
es).
Mun
icip
al B
ench
mar
k
Exer
cise
for 1
7 no
n-de
lega
ted
mun
icip
aliti
es
Fund
ing
com
plia
nce
met
hodo
logy
impl
emen
ted
in li
ne w
ith S
ectio
ns 1
7 an
d
18 o
f the
MFM
A
Num
ber o
f mun
icip
aliti
es u
sing
the
met
hodo
logy
App
ly to
17
non-
dele
gate
d
mun
icip
aliti
es
Ove
rsee
app
licat
ion
of th
e
met
hodo
logy
to a
ll ot
her
mun
icip
aliti
es b
y pr
ovin
cial
trea
surie
s
In-d
epth
ana
lysi
s co
nduc
ted
for 1
7 no
n-
dele
gate
d m
unic
ipal
ities
. Onl
y G
aute
ng
and
Wes
tern
Cap
e Pr
ovin
cial
Tre
asur
ies
have
sta
rted
to a
sses
s th
e fu
ndin
g
com
plia
nce
of d
eleg
ated
mun
icip
aliti
es
Prov
inci
al a
nd lo
cal
gove
rnm
ent B
udge
t and
Expe
nditu
re R
evie
ws
Qua
lity
and
scop
e of
revi
ews
Publ
ish
upda
ted
prov
inci
al d
ata
in Ju
ne
Publ
ishe
d up
date
d p
rovi
ncia
l dat
a in
June
201
0 Pu
blis
h Lo
cal G
over
nmen
t
Budg
et a
nd E
xpen
ditu
re R
evie
w
by e
nd o
f Aug
ust
Com
plet
ed, a
wai
ting
publ
icat
ion
Publ
icat
ion
of p
rovi
ncia
l
and
loca
l gov
ernm
ent
expe
nditu
re re
port
s in
term
s
of th
e PF
MA
(sec
tion
32) a
nd
MFM
A (s
ectio
n 71
) and
DO
RA
(Sec
tion
44(3
))
Tim
ely
and
accu
rate
repo
rts
Publ
ish
prov
inci
al q
uart
erly
repo
rts
a m
onth
aft
er th
e en
d of
the
quar
ter
Publ
ishe
d fo
ur p
rovi
ncia
l qua
rter
ly
repo
rts
in te
rms
of S
ectio
n 32
of t
he
PFM
A p
ublis
hed
Publ
ishe
d fo
ur m
unic
ipal
qua
rter
ly
sect
ion
71 re
port
s on
ave
rage
60
days
afte
r the
end
of e
ach
quar
ter
Cove
rage
and
relia
bilit
y of
mun
icip
al in
form
atio
n
Publ
ish
mun
icip
al re
port
s 45
days
aft
er th
e en
d of
eac
h
quar
ter
Mai
ntai
n co
vera
ge a
t 283
mun
icip
aliti
es
Impr
ove
relia
bilit
y of
dat
a
Mai
ntai
ned
aver
age
quar
terly
cov
erag
e
of 2
80 m
unic
ipal
ities
in s
ectio
n 71
repo
rts
NT AR 10-11_10.indd 39 2011/08/17 10:02 AM

Nat
iona
l Tre
asur
y A
nnua
l Rep
ort 2
010/
11
40
Programme 2 - Public Finance and Budget Management
PROGRAmmE 2puBliC FiNaNCe aND BuDGet MaNaGeMeNt - continued
Mea
sura
ble
obje
ctiv
e: T
o pr
omot
e gr
owth
, soc
ial d
evel
opm
ent a
nd p
over
ty re
duct
ion
thro
ugh
soun
d fis
cal a
nd fi
nanc
ial p
olic
ies,
and
the
effec
tive,
effi
cien
t and
appr
opria
te a
lloca
tion
of p
ublic
fund
ssu
bpro
gram
me
out
put
Mea
sure
/ in
dica
tor
act
ual p
erfo
rman
ce a
gain
st ta
rget
targ
eta
ctua
lTe
chni
cal a
nd
Man
agem
ent S
uppo
rt
Infra
stru
ctur
e de
liver
y
impr
ovem
ent p
rogr
amm
e
Tech
nica
l ass
ista
nts
depl
oyed
in ta
rget
ed p
rovi
ncia
l
depa
rtm
ents
Tech
nica
l sup
port
giv
en to
thre
e de
part
men
ts (e
duca
tion,
heal
th, p
ublic
wor
ks) i
n al
l nin
e
prov
ince
s
34 te
chni
cal a
ssist
ants
dep
loye
d ac
ross
nin
e
prov
ince
s (fo
ur TA
s in
each
pro
vinc
e ex
cept
Mpu
mal
anga
and
Eas
tern
Cap
e w
here
onl
y
thre
e w
ere
depl
oyed
per
pro
vinc
e)Ti
mel
y su
bmis
sion
of
infra
stru
ctur
e pl
ans
by
prov
ince
s th
at c
ompl
y w
ith
guid
elin
es d
evel
oped
by
Nat
iona
l Tre
asur
y
Infra
stru
ctur
e pl
ans
for
targ
eted
dep
artm
ents
com
ply
with
Div
isio
n of
Rev
enue
Act
requ
irem
ents
Infra
stru
ctur
e pl
ans
subm
itted
for 2
5
prov
inci
al d
epar
tmen
ts in
com
plia
nce
with
the
Div
isio
n of
Rev
enue
Act
Proj
ect m
anag
emen
t sup
port
N
umbe
r of p
roje
cts
73 te
chni
cal a
ssis
tanc
e pr
ojec
ts
to im
prov
e th
e effi
cacy
of
gove
rnm
ent i
nstit
utio
ns
86 p
roje
cts
aim
ed a
t im
prov
ing
the
effici
ency
of g
over
nmen
t in
stitu
tions
Ove
rsig
ht o
f nat
iona
l
gove
rnm
ent f
undi
ng to
inst
itutio
ns im
plem
entin
g
2010
FIF
A W
orld
Cup
pro
ject
s
Com
plia
nce
with
fina
ncia
l
man
agem
ent l
egis
latio
n,
prac
tices
and
pro
cedu
res
Ove
rsee
, mon
itor a
nd re
port
on e
xpen
ditu
re o
f nat
iona
l
gove
rnm
ent f
undi
ng to
inst
itutio
ns im
plem
entin
g 20
10
FIFA
Wor
ld C
up p
roje
cts
Ove
rsaw
, mon
itore
d an
d re
port
ed o
n
expe
nditu
re o
f nat
iona
l gov
ernm
ent
fund
ing
to in
stitu
tions
and
hos
t citi
es
impl
emen
ting
2010
FIF
A W
orld
Cup
proj
ects
unt
il Ju
ne 2
010.
The
uni
t was
phas
ed o
ut in
July
201
0 an
d w
as re
plac
ed
by th
e Ca
pita
l Pro
ject
s U
nit a
ssist
ing
with
the
asse
ssm
ent o
f maj
or c
apita
l pro
ject
s N
eigh
bour
hood
deve
lopm
ent p
roje
cts
that
att
ract
priv
ate
sect
or
inve
stm
ent i
nto
tow
nshi
ps
Num
ber o
f pro
ject
s gr
ante
d
awar
d st
atus
100
185
Num
ber o
f pro
ject
s w
here
cons
truc
tion
has
com
men
ced
3567
SERV
ICE
dEl
IVER
y A
ChIE
VEm
ENTS
prog
ram
me
2: p
ublic
Fin
ance
and
Bud
get M
anag
emen
t - C
ontin
ued
NT AR 10-11_10.indd 40 2011/08/17 10:02 AM

41
Nat
iona
l Tre
asur
y A
nnua
l Rep
ort 2
010/
11
Programme 2 - Public Finance and Budget Management
PROGRAmmE 2puBliC FiNaNCe aND BuDGet MaNaGeMeNt - continued
Publ
ic P
rivat
e Pa
rtne
rshi
p
agre
emen
ts
Incr
ease
d PP
P ov
ersi
ght
capa
city
Prov
ide
advi
sory
sup
port
to
all P
PPs
in d
evel
opm
ent a
nd
impl
emen
tatio
n, a
nd a
ssis
t
Nat
iona
l Tre
asur
y in
regu
latio
n
func
tion
Prov
ided
adv
isor
y su
ppor
t to
all P
PPs
Num
ber o
f hos
pita
l PPP
proj
ects
com
plet
ing
feas
ibili
ty
stud
ies
Two
proj
ects
2
proj
ects
; Chr
is H
ani B
arag
wan
eth
and
Lim
popo
Aca
dem
ic h
ospi
tals
Num
ber o
f hos
pita
l PPP
proj
ects
reac
hing
fina
ncia
l
clos
e
One
pro
ject
D
elay
s in
con
clud
ing
agre
emen
ts w
ith
Prov
inci
al H
ealth
Dep
artm
ents
and
Trea
surie
s re
sulte
d in
late
sta
rt o
f the
proj
ects
. All
agre
emen
ts a
re in
pla
ce
and
the
targ
et w
ill b
e m
et in
the
next
18
mon
ths
Publ
ic E
ntiti
es G
over
nanc
e
Uni
t
Legi
slat
ive
refo
rm in
gove
rnan
ce a
nd fi
nanc
ial
man
agem
ent i
ssue
s
Am
endm
ents
to P
FMA
and
Trea
sury
Reg
ulat
ions
Soun
d re
gula
tory
env
ironm
ent
and
cons
iste
ncy
in g
over
nanc
e,
hum
an re
sour
ce m
anag
emen
t
and
finan
cial
man
agem
ent i
n
the
publ
ic s
ecto
r, in
clud
ing
‘ext
ra-b
udge
tary
’ ent
ities
Impl
emen
ted
the
reco
mm
enda
tions
of th
e pu
blic
ent
ities
gov
erna
nce
fram
ewor
k re
view
Adv
ised
on
impr
ovin
g un
ders
tand
ing
of th
e w
age
bill
and
futu
re s
pend
ing
pres
sure
sD
eepe
n th
e pr
inci
ples
of g
over
nanc
e an
d
acco
unta
bilit
y in
pub
lic
entit
ies,
gove
rnm
ent a
genc
ies
and
depa
rtm
enta
l bus
ines
s
ente
rpris
es. I
nstit
utio
nalis
e
budg
etin
g, re
port
ing
and
chan
ge m
anag
emen
t
proc
esse
s
Impl
emen
t a g
over
nanc
e
and
finan
cial
man
agem
ent
mon
itorin
g an
d co
mpl
ianc
e
syst
em fo
r gov
ernm
ent
agen
cies
, pub
lic e
ntiti
es
and
depa
rtm
enta
l bus
ines
s
ente
rpris
es
Sust
aine
d so
und
plan
ning
,
budg
etin
g, g
over
nanc
e an
d
finan
cial
man
agem
ent i
n
gove
rnm
ent a
genc
ies
and
publ
ic e
ntiti
es
Ass
iste
d w
ith th
e pr
epar
atio
n of
cons
olid
ated
fina
ncia
l acc
ount
s,
mai
ntai
ned
a bu
dget
dat
abas
e an
d
appr
opria
ted
adm
inis
trat
ive
reco
rds
of th
e ge
nera
l gov
ernm
ent s
ecto
r,
incl
udin
g pu
blic
ent
ities
NT AR 10-11_10.indd 41 2011/08/17 10:02 AM
Nat
iona
l Tre
asur
y A
nnua
l Rep
ort 2
010/
11
42
Programme 3 - Asset and Liability Management
PROGRAmmE 3asset aND liaBility MaNaGeMeNt - continued
PROGRAmmE 3ASSET ANd lIAbIlITy mANAGEmENT
NT AR 10-11_10.indd 42 2011/08/17 10:02 AM

43
Nat
iona
l Tre
asur
y A
nnua
l Rep
ort 2
010/
11
Programme 3 - Asset and Liability Management
PROGRAmmE 3asset aND liaBility MaNaGeMeNt
purpose: Prudent management of government’s financial assets and liabilities.
Measurable objective: prudent cash and financial management; oversight of state-owned entities (SOEs); and optimal
management of government’s domestic and foreign debt.
There are six subprogrammes:
• Management provides strategic guidance and direction to the overall programme, including managing the divisional
budget.
• Governance and Financial Analysis promotes the optimal allocation and use of financial resources and sound corporate
governance by SOEs, through financial oversight in accordance with government policy.
• Sectoral Oversight promotes SOE restructuring and regulatory and financial oversight, by ensuring alignment with
government policy, conducting sectoral research, and providing required interventions where necessary.
• Liability Management provides for government’s long-term funding needs, manages domestic and foreign debt, and
contributes to the development of domestic capital and retail markets.
• Financial Operations provides for government’s short-term funding needs, the prudent management of cash in all
spheres of government, the efficient accounting for debt and investment transactions, the supply of reliable systems,
and the provision of quality information.
• Strategy and Risk Management develops and maintains a risk management framework for the debt and contingent
liability of the state and SOEs respectively.
SERVICE dElIVERy ObJECTIVES ANd INdICATORS
reCeNt outputs
The division financed government’s gross borrowing requirement and maintained a positive cash position to meet
government’s daily requirements. It also provided support to the development finance institutions (DFIs) and state-
owned entities through guarantees and capital injections to ensure that they deliver on their development mandate.
The Governance and Financial Analysis and Sectoral Oversight units monitored SOEs and development finance institutions,
particularly on progress made in line with agreed strategies by SOEs whose debt had been guaranteed by government.
The units participated in work streams and clusters that contribute to ensuring an efficient, competitive and responsive
economic infrastructure network, and led a work stream on financing, regulation, pricing and procurement.
Further work included:
• GrantedapprovaltoincreasetheguaranteefacilityprovidedtoEskombyR174billiontoatotalofR350billion,toroll-
over Denel’s R1.85 billion guarantee for a period of eighteen months, and to reallocate R615 million of South African
Airways’ R1.6 billion in perpetual guarantees.
• Transferred two payments of R103million and R78million respectively to Denel for the government indemnity
provided to Denel Saab Aerostructures.
• ApprovedborrowinglimitsfortheBloemWaterandTransCaledonTunnelAuthoritytoundertaketheMokoloand
Crocodile (West) Water Augmentation Project.
• EstablishedamonitoringtaskteamtoassessprogressmadebytheSABCinmeetingtheguaranteeconditionsand
implementation of a turnaround strategy. Findings were reported to the Ministers of Finance and Communications.
NT AR 10-11_10.indd 43 2011/08/17 10:02 AM

Nat
iona
l Tre
asur
y A
nnua
l Rep
ort 2
010/
11
44
Programme 3 - Asset and Liability Management
PROGRAmmE 3asset aND liaBility MaNaGeMeNt - continued
• ReviewedcorporateplansofthePIC,SASRIA,DBSAandLandBankandtabledinParliamentthroughtheMinister
of Finance
• Reviewed applications for tariff increases from water boards, considering their socio-economic impact and the
financial sustainability of water boards.
• Provided input to andparticipated in seminars convenedby the Presidential ReviewCommission on state
owned enterprises.
• Key recommendations of theDFI Review regarding thedeepeningof theDFI development impact, including their
financial sustainability, risk management, operational effectiveness and governance being implemented by the Land
Bank and the DBSA. In particular, the DBSA is continuously challenged to extend suppot to low and medium capacity
municipalities through credit enhancement measures such as committing conditional grant funds to service DBSA loans.
• TheLandBankguaranteeofR3.5billionwasreducedtoR1.35billionafter theBankreceivedcapital transfersof
R2.51 billion from government. The Coordinating Committee comprising of the National Treasury; the Department
of Rural Development and Land Reform; and the Department of Agriculture, Forestry and Fisheries, succeeded
in obtaining approval for a Pilot Curatorship and Emerging Farmers Support Facility aimed at assisting qualifying
farmers that are indebted to the Land Bank. The Pilot Curatorship and Emerging Farmers Support Facility is currently
being implemented.
• Inthe2010/11financialyear,itwasestimatedthatSOEsweregoingtoraiseR124.5billiontofinanceinfrastructure
capital investment programmes. SOEs however, raised about R107.5 billion resulting in a shortfall of R17.4 billion.
The shortfall is as a result of delays in draw downs of ECA and multilateral funding mainly by Eskom. DBSA and
Transnet exceeded their funding targets by R2.4 billion and R4.3 billion respectively. Continuous monitoring and co-
ordination of the treasury operations of SOEs continued to take place, complementary to the SOEs being supported to
access funding from multilateral organisations, export credit agencies, and project financing arrangements. All these
processes were aimed at reducing SOE borrowing costs and ease their demand for debt in the domestic market.
• In2010/11thedivisionreviewedatotalof24corporateplansand39annualreportsofSOEsandconsultedstakeholders
on the findings of the reviews.
The Liability Management unit successfully financed the gross borrowing requirement of R190.9 billion, originally budgeted
at R192 billion. Government raised US$750 million in the international capital market and R185.3 billion in the domestic
capital market, which includes R5.4 billion from retail bond investors.
Following a surge in capital inflows, the division accumulated foreign exchange reserves to pre-fund future foreign
currency commitments and partly to build up foreign exchange reserves. This contributed to achieving a more
competitive currency and strengthened South Africa’s ability to respond to sudden changes in market conditions, such as
the reversal in capital flows. During the review period the division purchased US$6 billion of foreign exchange reserves.
Debt service costs dropped from the projected 2.6 per cent of GDP to 2.5 per cent owing to the strong levels of the rand,
and a lower than forecast interest rate environment.
South Africa’s bond market is one of the most liquid in the world. To maintain this liquidity, issuance was concentrated
in benchmark bonds. The repo and scrip lending facilities amounting to R1.6 billion were also provided to ensure the
availability of scrip in the local domestic market. To reduce refinancing risk in 2012/13, R20 billion of the R189 (6.25%; 2013)
bond was exchanged for longer-dated bonds before its (R189) due date.
NT AR 10-11_10.indd 44 2011/08/17 10:02 AM

45
Nat
iona
l Tre
asur
y A
nnua
l Rep
ort 2
010/
11
Programme 3 - Asset and Liability Management
PROGRAmmE 3asset aND liaBility MaNaGeMeNt - continued
In the Financial Operations unit, efficient forecasting of cash flows ensured that government had sufficient money to meet
its daily cash requirements and that surplus cash was optimally invested. Short-term investment and lending between the
national government, provincial government and related SOEs within the Corporation of Public Deposits, saved up to 3.4
per cent on borrowing cost compared to borrowing from commercial banks.
The foreign debt module of the new back office system was implemented while the remaining modules of the new back
office system are on schedule. The construction of the investor relations website is at its final stages and is expected to be
implemented in July 2011.
The Strategy and Risk Management unit ensured that Government’s funding strategy continued to take into account
domestic and foreign debt risk benchmarks.
Increased issuance of inflation-linked bonds due to market demand resulted in a composition of government’s domestic
debt portfolio of 63.2 per cent in fixed and 36.8 per cent in non-fixed rate instruments. Government’s foreign debt
exposure of 9.9 per cent of total gross debt remained well below the set risk benchmark of a maximum of 20-25 per cent.
Net debt and contingent liabilities amounted to 44 per cent of GDP.
The major credit rating agencies reviewed South Africa’s rating and affirmed its investment grade rating. The rating reflects
the sound and prudent management of the economy including its public finances, and the underlying attractiveness of
the country as an investment destination.
NT AR 10-11_10.indd 45 2011/08/17 10:02 AM
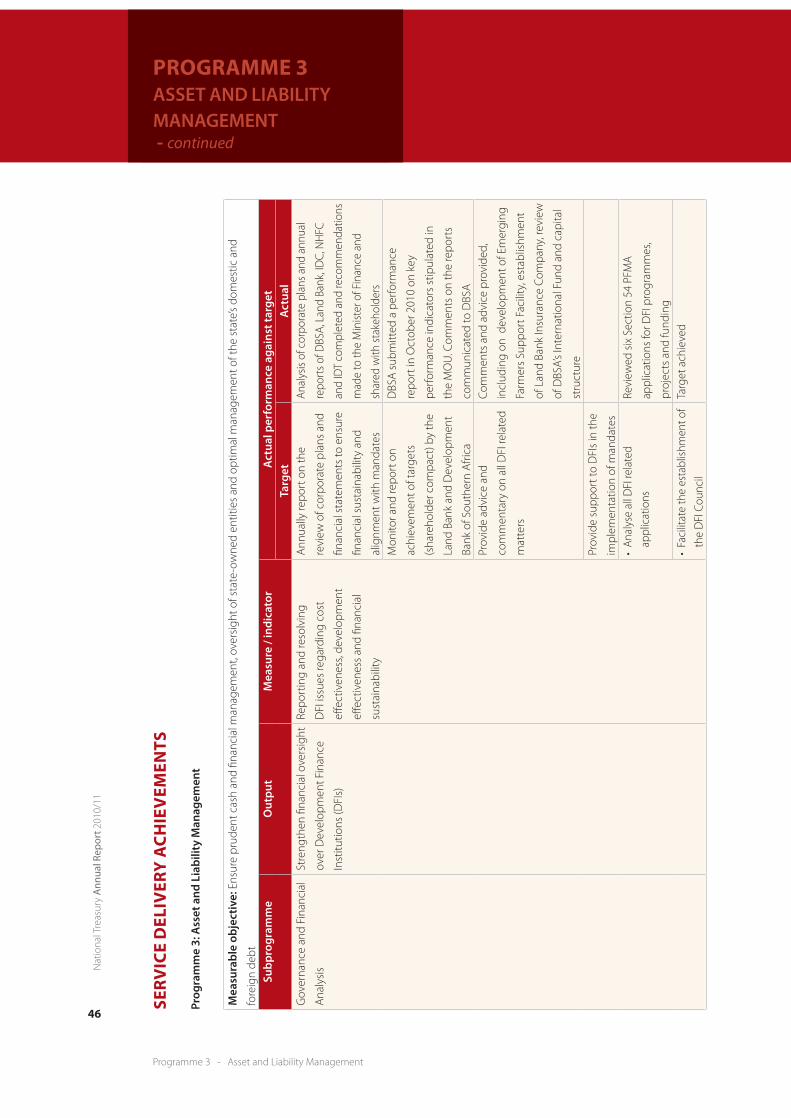
Nat
iona
l Tre
asur
y A
nnua
l Rep
ort 2
010/
11
46
Programme 3 - Asset and Liability Management
PROGRAmmE 3asset aND liaBility MaNaGeMeNt - continued
SERV
ICE
dEl
IVER
y A
ChIE
VEm
ENTS
prog
ram
me
3: a
sset
and
lia
bilit
y M
anag
emen
t
Mea
sura
ble
obje
ctiv
e: E
nsur
e pr
uden
t cas
h an
d fin
anci
al m
anag
emen
t, ov
ersi
ght o
f sta
te-o
wne
d en
titie
s an
d op
timal
man
agem
ent o
f the
sta
te’s
dom
estic
and
fore
ign
debt
subp
rogr
amm
eo
utpu
tM
easu
re /
indi
cato
ra
ctua
l per
form
ance
aga
inst
targ
etta
r get
ac t
ual
Gov
erna
nce
and
Fina
ncia
l
Ana
lysi
s
Stre
ngth
en fi
nanc
ial o
vers
ight
over
Dev
elop
men
t Fin
ance
Inst
itutio
ns (D
FIs)
Repo
rtin
g an
d re
solv
ing
DFI
issu
es re
gard
ing
cost
effec
tiven
ess,
deve
lopm
ent
effec
tiven
ess
and
finan
cial
sust
aina
bilit
y
Ann
ually
repo
rt o
n th
e
revi
ew o
f cor
pora
te p
lans
and
finan
cial
sta
tem
ents
to e
nsur
e
finan
cial
sus
tain
abili
ty a
nd
alig
nmen
t with
man
date
s
Anal
ysis
of c
orpo
rate
pla
ns a
nd a
nnua
l
repo
rts
of D
BSA,
Lan
d Ba
nk, I
DC,
NH
FC
and
IDT
com
plet
ed a
nd re
com
men
datio
ns
mad
e to
the
Min
ister
of F
inan
ce a
nd
shar
ed w
ith s
take
hold
ers
Mon
itor a
nd re
port
on
achi
evem
ent o
f tar
gets
(sha
reho
lder
com
pact
) by
the
Land
Ban
k an
d D
evel
opm
ent
Bank
of S
outh
ern
Afri
ca
DBS
A s
ubm
itted
a p
erfo
rman
ce
repo
rt in
Oct
ober
201
0 on
key
perf
orm
ance
indi
cato
rs s
tipul
ated
in
the
MO
U. C
omm
ents
on
the
repo
rts
com
mun
icat
ed to
DBS
A
Prov
ide
advi
ce a
nd
com
men
tary
on
all D
FI re
late
d
mat
ters
Com
men
ts a
nd a
dvic
e pr
ovid
ed,
incl
udin
g on
dev
elop
men
t of E
mer
ging
Farm
ers
Supp
ort F
acili
ty, e
stab
lishm
ent
of L
and
Bank
Insu
ranc
e Co
mpa
ny, r
evie
w
of D
BSA’
s In
tern
atio
nal F
und
and
capi
tal
stru
ctur
ePr
ovid
e su
ppor
t to
DFI
s in
the
impl
emen
tatio
n of
man
date
s•AnalyseallDFIrelated
appl
icat
ions
Revi
ewed
six
Sec
tion
54 P
FMA
appl
icat
ions
for D
FI p
rogr
amm
es,
proj
ects
and
fund
ing
•Facilitatetheestablish
men
tof
the
DFI
Cou
ncil
Targ
et a
chie
ved
NT AR 10-11_10.indd 46 2011/08/17 10:02 AM

47
Nat
iona
l Tre
asur
y A
nnua
l Rep
ort 2
010/
11
Programme 3 - Asset and Liability Management
PROGRAmmE 3asset aND liaBility MaNaGeMeNt - continued
•Facilitatetheestablish
men
t
of th
e m
onito
ring
and
eval
uatio
n fra
mew
ork
for D
FIs
A d
raft
Mon
itorin
g an
d Ev
alua
tion
Fram
ewor
k de
velo
ped
and
subm
itted
to
Inte
r-M
inis
teria
l Com
mitt
ee (I
MC
)•Facilitatetheap
provalprocess
of th
e D
FI p
olic
y by
Cab
inet
Mem
os m
otiv
atin
g im
port
ance
of
the
esta
blis
hmen
t of t
he D
FI C
ounc
il
appr
oved
by
the
Min
iste
r of F
inan
cePr
omot
e ap
prop
riate
trea
sury
man
agem
ent p
olic
ies
and
prac
tices
in S
OEs
and
maj
or
mun
icip
al tr
easu
ries
(met
ros)
Adh
eren
ce to
trea
sury
guid
elin
es b
y SO
Es a
nd m
etro
s
Cond
uct r
evie
ws
of S
OEs
with
new
trea
surie
s af
ter s
ix m
onth
s
of o
pera
tion
and
com
pile
indi
vidu
al re
port
s w
ithin
a
mon
th a
fter
eac
h re
view
Cond
ucte
d re
view
s an
d co
mpi
led
repo
rts
for M
hlat
huzi
Wat
er B
oard
,
Nat
iona
l Em
pow
erm
ent F
und
(NEF
) an
d
Sout
h A
frica
n Ex
pres
s (S
AX)
NEF
ass
iste
d w
ith d
raft
ing
of tr
easu
ry
polic
ies,
stra
tegi
es a
nd s
truc
ture
A
ssis
ted
SAX
in d
raft
ing
trea
sury
pol
icie
s,
revi
ewin
g co
ntra
ct a
gree
men
t with
outs
ourc
ed s
ervi
ce p
rovi
der a
nd a
ssis
ted
on ri
sk s
trat
egie
s to
ens
ure
best
pra
ctic
eCo
nduc
ted
follo
w u
p re
view
s on
18
entit
ies
rega
rdin
g im
plem
enta
tion
of
prev
ious
reco
mm
enda
tions
on
trea
sury
stru
ctur
e, p
olic
ies,
gove
rnan
ce a
nd ri
sk
fram
ewor
ksRe
view
thre
e m
ajor
met
ros
(Cap
e To
wn,
Dur
ban
and
Joha
nnes
burg
) and
com
pile
indi
vidu
al re
port
s w
ithin
a
mon
th o
f the
revi
ew
Targ
et n
ot m
et d
ue to
cha
lleng
es
face
d in
obt
aini
ng u
nder
stan
ding
and
mun
icip
al s
take
hold
er b
uy-in
Hel
d m
eetin
gs w
ith P
ort E
lizab
eth,
Cap
e
Tow
n, T
shw
ane
and
Joha
nnes
burg
to
expl
ain
prop
osed
trea
sury
revi
ew p
roje
ct
NT AR 10-11_10.indd 47 2011/08/17 10:02 AM

Nat
iona
l Tre
asur
y A
nnua
l Rep
ort 2
010/
11
48
Programme 3 - Asset and Liability Management
PROGRAmmE 3asset aND liaBility MaNaGeMeNt - continued
SERV
ICE
dEl
IVER
y A
ChIE
VEm
ENTS
prog
ram
me
3: a
sset
and
lia
bilit
y M
anag
emen
t - C
ontin
ued
Mea
sura
ble
obje
ctiv
e: E
nsur
e pr
uden
t cas
h an
d fin
anci
al m
anag
emen
t, ov
ersi
ght o
f sta
te-o
wne
d en
titie
s an
d op
timal
man
agem
ent o
f the
sta
te’s
dom
estic
and
fore
ign
debt
subp
rogr
amm
eo
utpu
tM
easu
re /
indi
cato
ra
ctua
l per
form
ance
aga
inst
targ
etta
r get
ac t
ual
Gov
erna
nce
and
Fina
ncia
l
Ana
lysi
s
Coor
dina
te b
orro
win
g
prog
ram
mes
of S
OEs
Com
pila
tion
of b
orro
win
g
cale
ndar
and
con
solid
ated
mat
urity
pro
file
Qua
rter
ly m
eetin
gs w
ith
SOEs
to u
pdat
e bo
rrow
ing
prog
ram
mes
Hel
d fo
ur P
ublic
Sec
tor B
orro
wer
s Fo
rum
mee
tings
link
ed to
MTP
BS, f
orei
gn
road
show
, Bud
get S
peec
h, a
nd d
omes
tic
road
show
: Val
uabl
e in
form
atio
n on
the
mar
ket w
as o
btai
ned
and
it in
form
ed th
e
timin
g an
d si
ze o
f iss
uanc
e by
SO
EsCo
ordi
nate
bor
row
ing
prog
ram
mes
of S
OEs
Com
pila
tion
of b
orro
win
g
cale
ndar
and
con
solid
ated
mat
urity
pro
file
Ann
ual p
ublic
atio
n of
borr
owin
g ca
lend
ar b
y M
arch
The
2011
/12
borr
owin
g ca
lend
ar fo
r
gove
rnm
ent a
nd S
OEs
was
pub
lishe
d in
Mar
ch 2
011
Qua
rter
ly re
port
on
SOEs
capi
tal e
xpen
ditu
re a
nd
borr
owin
g pr
ogra
mm
es
Com
pile
d qu
arte
rly re
port
s on
cap
ex
and
borr
owin
g tr
acki
ng p
erfo
rman
ce
Det
erm
ine
optim
al c
apita
l
stru
ctur
e an
d ap
prop
riate
divi
dend
pol
icie
s fo
r SO
Es
Benc
hmar
k to
det
erm
ine
appr
opria
te ta
rget
cap
ital
stru
ctur
e fo
r SO
Es
67%
(12
SOEs
) com
plet
edCo
mpl
eted
the
benc
hmar
king
pha
se o
f
the
capi
tal s
truc
ture
and
div
iden
d po
licy
proj
ect
The
com
plet
ion
of th
e fin
anci
al
mod
ellin
g ph
ase
of th
e pr
ojec
t del
ayed
due
to d
etai
led
tech
nica
l wor
k re
quiri
ng
com
plet
ion,
and
sub
sequ
ent e
xten
sive
cons
ulta
tion
with
rele
vant
sta
keho
lder
s
whi
ch to
ok lo
nger
than
ant
icip
ated
Com
plet
ed th
e fin
anci
al m
odel
ling
phas
e of
the
capi
tal s
truc
ture
and
divi
dend
pol
icy
proj
ect
NT AR 10-11_10.indd 48 2011/08/17 10:02 AM
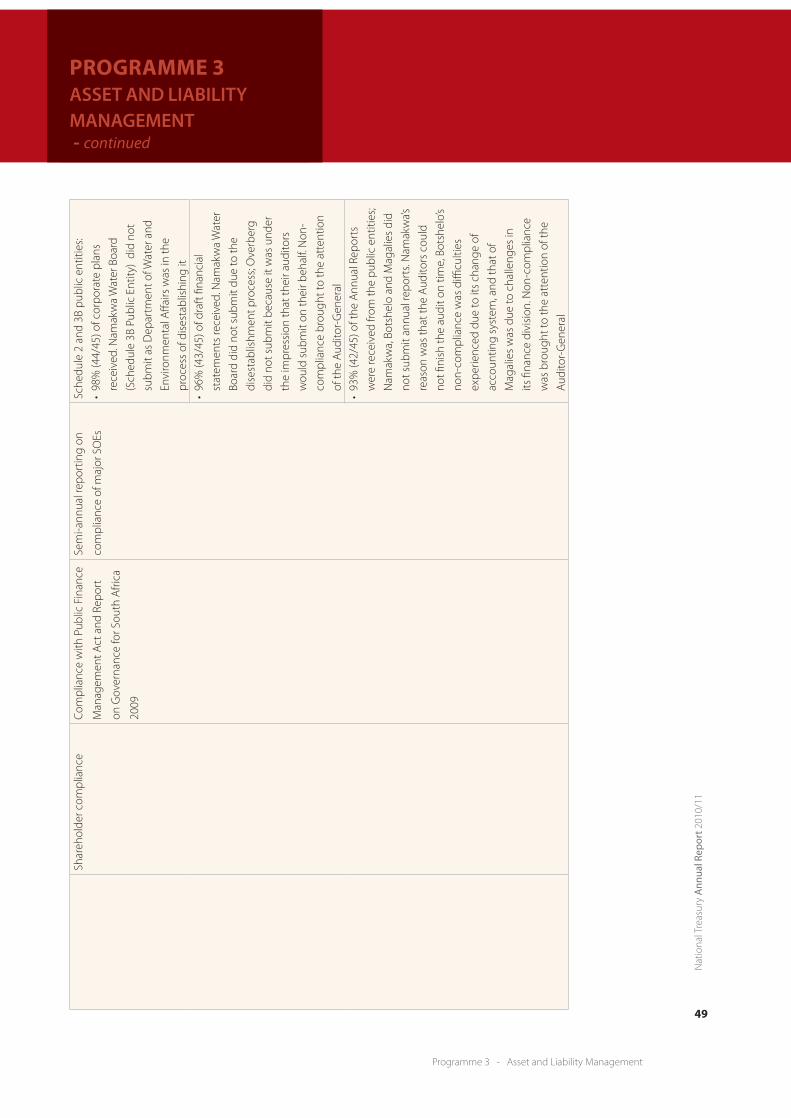
49
Nat
iona
l Tre
asur
y A
nnua
l Rep
ort 2
010/
11
Programme 3 - Asset and Liability Management
PROGRAmmE 3asset aND liaBility MaNaGeMeNt - continued
Mea
sura
ble
obje
ctiv
e: E
nsur
e pr
uden
t cas
h an
d fin
anci
al m
anag
emen
t, ov
ersi
ght o
f sta
te-o
wne
d en
titie
s an
d op
timal
man
agem
ent o
f the
sta
te’s
dom
estic
and
fore
ign
debt
subp
rogr
amm
eo
utpu
tM
easu
re /
indi
cato
ra
ctua
l per
form
ance
aga
inst
targ
etta
rget
act
ual
Gov
erna
nce
and
Fina
ncia
l
Ana
lysi
s
Coor
dina
te b
orro
win
g
prog
ram
mes
of S
OEs
Com
pila
tion
of b
orro
win
g
cale
ndar
and
con
solid
ated
mat
urity
pro
file
Qua
rter
ly m
eetin
gs w
ith
SOEs
to u
pdat
e bo
rrow
ing
prog
ram
mes
Hel
d fo
ur P
ublic
Sec
tor B
orro
wer
s Fo
rum
mee
tings
link
ed to
MTP
BS, f
orei
gn
road
show
, Bud
get S
peec
h, a
nd d
omes
tic
road
show
: Val
uabl
e in
form
atio
n on
the
mar
ket w
as o
btai
ned
and
it in
form
ed th
e
timin
g an
d si
ze o
f iss
uanc
e by
SO
EsCo
ordi
nate
bor
row
ing
prog
ram
mes
of S
OEs
Com
pila
tion
of b
orro
win
g
cale
ndar
and
con
solid
ated
mat
urity
pro
file
Ann
ual p
ublic
atio
n of
borr
owin
g ca
lend
ar b
y M
arch
The
2011
/12
borr
owin
g ca
lend
ar fo
r
gove
rnm
ent a
nd S
OEs
was
pub
lishe
d in
Mar
ch 2
011
Qua
rter
ly re
port
on
SOEs
capi
tal e
xpen
ditu
re a
nd
borr
owin
g pr
ogra
mm
es
Com
pile
d qu
arte
rly re
port
s on
cap
ex
and
borr
owin
g tr
acki
ng p
erfo
rman
ce
Det
erm
ine
optim
al c
apita
l
stru
ctur
e an
d ap
prop
riate
divi
dend
pol
icie
s fo
r SO
Es
Benc
hmar
k to
det
erm
ine
appr
opria
te ta
rget
cap
ital
stru
ctur
e fo
r SO
Es
67%
(12
SOEs
) com
plet
edCo
mpl
eted
the
benc
hmar
king
pha
se o
f
the
capi
tal s
truc
ture
and
div
iden
d po
licy
proj
ect
The
com
plet
ion
of th
e fin
anci
al
mod
ellin
g ph
ase
of th
e pr
ojec
t del
ayed
due
to d
etai
led
tech
nica
l wor
k re
quiri
ng
com
plet
ion,
and
sub
sequ
ent e
xten
sive
cons
ulta
tion
with
rele
vant
sta
keho
lder
s
whi
ch to
ok lo
nger
than
ant
icip
ated
Com
plet
ed th
e fin
anci
al m
odel
ling
phas
e of
the
capi
tal s
truc
ture
and
divi
dend
pol
icy
proj
ect
Shar
ehol
der c
ompl
ianc
eCo
mpl
ianc
e w
ith P
ublic
Fin
ance
Man
agem
ent A
ct a
nd R
epor
t
on G
over
nanc
e fo
r Sou
th A
frica
2009
Sem
i-ann
ual r
epor
ting
on
com
plia
nce
of m
ajor
SO
Es
Sche
dule
2 a
nd 3
B pu
blic
ent
ities
:
•98%(44/45)o
fcorpo
rateplans
rece
ived
. Nam
akw
a W
ater
Boa
rd
(Sch
edul
e 3B
Pub
lic E
ntity
) di
d no
t
subm
it as
Dep
artm
ent o
f Wat
er a
nd
Envi
ronm
enta
l Affa
irs w
as in
the
proc
ess
of d
ises
tabl
ishi
ng it
•96%(43/45)o
fdraftfinancial
stat
emen
ts re
ceiv
ed. N
amak
wa
Wat
er
Boar
d di
d no
t sub
mit
due
to th
e
dise
stab
lishm
ent p
roce
ss; O
verb
erg
did
not s
ubm
it be
caus
e it
was
und
er
the
impr
essi
on th
at th
eir a
udito
rs
wou
ld s
ubm
it on
thei
r beh
alf.
Non
-
com
plia
nce
brou
ght t
o th
e at
tent
ion
of th
e A
udito
r-G
ener
al•
93%
(42/
45) o
f the
Ann
ual R
epor
ts
wer
e re
ceiv
ed fr
om th
e pu
blic
ent
ities
;
Nam
akw
a, B
otsh
elo
and
Mag
alie
s di
d
not s
ubm
it an
nual
repo
rts.
Nam
akw
a’s
reas
on w
as th
at th
e A
udito
rs c
ould
not fi
nish
the
audi
t on
time,
Bot
shel
o’s
non-
com
plia
nce
was
diffi
culti
es
expe
rienc
ed d
ue to
its
chan
ge o
f
acco
untin
g sy
stem
, and
that
of
Mag
alie
s w
as d
ue to
cha
lleng
es in
its fi
nanc
e di
visi
on. N
on-c
ompl
ianc
e
was
bro
ught
to th
e at
tent
ion
of th
e
Aud
itor-
Gen
eral
NT AR 10-11_10.indd 49 2011/08/17 10:02 AM

Nat
iona
l Tre
asur
y A
nnua
l Rep
ort 2
010/
11
50
Programme 3 - Asset and Liability Management
PROGRAmmE 3asset aND liaBility MaNaGeMeNt - continued
Mea
sura
ble
obje
ctiv
e: E
nsur
e pr
uden
t cas
h an
d fin
anci
al m
anag
emen
t, ov
ersi
ght o
f sta
te-o
wne
d en
titie
s an
d op
timal
man
agem
ent o
f the
sta
te’s
dom
estic
and
fore
ign
debt
subp
rogr
amm
eo
utpu
tM
easu
re /
indi
cato
ra
ctua
l per
form
ance
aga
inst
targ
etta
r get
ac t
ual
Gov
erna
nce
and
Fina
ncia
l
Ana
lysi
s
Fina
ncia
l ove
rsig
ht o
ver S
OEs
Ann
ual r
epor
t on
revi
ew o
f
corp
orat
e pl
ans
and
finan
cial
inst
rum
ents
Corp
orat
e pl
ans
and
annu
al fi
nanc
ial
stat
emen
ts o
f tar
gete
d SO
Es re
view
ed.
Cons
ulte
d in
tern
al s
take
hold
ers,
shar
ehol
ders
dep
artm
ents
and
SO
Es o
n
the
findi
ngs
of th
e re
view
Find
ings
of r
evie
ws
pres
ente
d to
the
Min
iste
r of F
inan
ce a
s pa
rt o
f ove
rsig
ht
at th
e ex
ecut
ive
leve
lSe
ctor
al O
vers
ight
Stre
ngth
en fi
nanc
ial o
vers
ight
over
Sch
edul
e 2
and
3B
entit
ies
Fina
ncia
l ove
rsig
ht o
ver S
OEs
Stan
dard
ised
pro
cess
es
impl
emen
ted
for a
sses
sing
and
mon
itorin
g gu
aran
tees
and
eval
uatin
g Se
ctio
n 54
of P
FMA
appl
icat
ions
Doc
umen
t out
linin
g re
spon
sibi
litie
s in
guar
ante
e pr
oces
s ha
s be
en c
ompi
led
and
a fra
mew
ork
for q
uart
erly
repo
rtin
g
has
been
dev
elop
ed
Revi
ew P
FMA
app
licat
ions
and
appl
icat
ions
for g
uara
ntee
s as
rece
ived
App
rove
d D
enel
rollo
ver o
f R1.
85 b
illio
n
in g
uara
ntee
s fo
r 18
mon
ths,
and
incr
ease
d Es
kom
gua
rant
ees
by R
174
billi
on to
R35
0 bi
llion
Real
loca
ted
a po
rtio
n of
SA
A’s
perp
etua
l
guar
ante
e to
cov
er a
ir se
rvic
es c
ounc
il
requ
irem
ents
App
licat
ions
for w
ater
boa
rd b
orro
win
g
limits
app
rove
d
SERV
ICE
dEl
IVER
y A
ChIE
VEm
ENTS
prog
ram
me
3: a
sset
and
lia
bilit
y M
anag
emen
t - C
ontin
ued
NT AR 10-11_10.indd 50 2011/08/17 10:02 AM

51
Nat
iona
l Tre
asur
y A
nnua
l Rep
ort 2
010/
11
Programme 3 - Asset and Liability Management
PROGRAmmE 3asset aND liaBility MaNaGeMeNt - continued
Revi
ewed
cor
pora
te p
lans
and
ann
ual
repo
rts
of S
asria
and
PIC
Revi
ew w
ater
and
ele
ctric
ity
pric
e ap
plic
atio
ns in
term
s of
Sect
ion
42 o
f the
MFM
A a
nd
prov
ide
com
men
ts
Revi
ew
of
wat
er
pric
e ap
plic
atio
ns
com
plet
ed a
nd c
omm
ents
pro
vide
d
No
elec
tric
ity p
rice
appl
icat
ion
rece
ived
Ong
oing
mon
itorin
g of
Esko
m, S
AA
, Den
el a
nd
SABC
, inc
ludi
ng m
onito
ring
com
plia
nce
with
gua
rant
ee
cond
ition
s an
d pr
ovid
ing
sem
i-
annu
al u
pdat
es to
the
Min
iste
r
and
Cabi
net
Stru
ctur
ed m
onito
ring
of E
skom
, SA
A,
Den
el a
nd S
ABC
in p
lace
. A p
roce
ss h
as
been
ini
tiate
d to
rep
ort
to C
abin
et o
n
guar
ante
es e
xten
ded
to S
OEs
Dev
elop
pol
icy
fram
ewor
k
with
in w
hich
SO
Es a
re
man
aged
Repo
rt o
n fu
ndin
g m
odel
and
adm
inis
tere
d pr
ices
Revi
ew o
f fun
ding
mod
el
for c
apita
l exp
endi
ture
in
elec
tric
ity, t
rans
port
and
wat
er
sect
ors
Com
plet
ed d
raft
inte
rnat
iona
l
benc
hmar
king
repo
rt o
n se
ctor
str
uctu
re
and
finan
cing
mod
els
in ra
il, p
orts
and
wat
er s
ecto
r
Inve
stig
ated
fund
ing
optio
ns fo
r Esk
om
culm
inat
ing
in in
crea
se in
gua
rant
ees.
Enga
ging
in a
nd p
rovi
ding
inpu
ts to
task
team
dea
ling
with
SA
NRA
L to
lling
issu
es
Revi
ew o
f adm
inis
tere
d pr
ices
/
regu
lato
ry m
odel
for e
lect
ricity
,
wat
er p
ipel
ines
, avi
atio
n
Com
plet
ed e
valu
atio
n of
cur
rent
regu
lato
ry m
odel
s
Part
icip
ate
in th
e re
view
of
SOEs
and
pro
vide
inpu
t to
the
inte
r-m
inis
teria
l com
mitt
ee
on S
OEs
for w
hich
term
s
of re
fere
nce
have
bee
n
deve
lope
d
Prov
ided
inpu
t to
and
part
icip
ated
in a
ll
sem
inar
s co
nven
ed b
y th
e Pr
esid
entia
l
Revi
ew C
omm
issi
on o
n SO
Es a
nd o
ther
SOE-
rela
ted
foru
ms
NT AR 10-11_10.indd 51 2011/08/17 10:02 AM
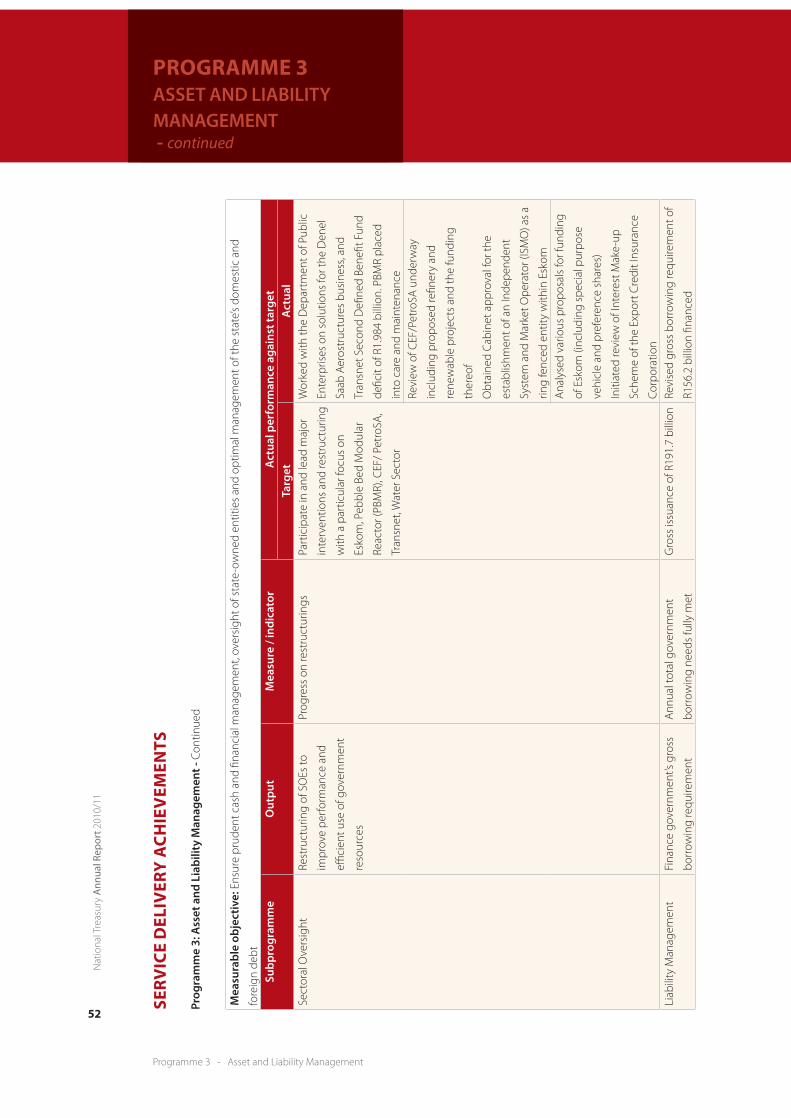
Nat
iona
l Tre
asur
y A
nnua
l Rep
ort 2
010/
11
52
Programme 3 - Asset and Liability Management
PROGRAmmE 3asset aND liaBility MaNaGeMeNt - continued
Mea
sura
ble
obje
ctiv
e: E
nsur
e pr
uden
t cas
h an
d fin
anci
al m
anag
emen
t, ov
ersi
ght o
f sta
te-o
wne
d en
titie
s an
d op
timal
man
agem
ent o
f the
sta
te’s
dom
estic
and
fore
ign
debt
subp
rogr
amm
eo
utpu
tM
easu
re /
indi
cato
ra
ctua
l per
form
ance
aga
inst
targ
etta
rget
act
ual
Sect
oral
Ove
rsig
htRe
stru
ctur
ing
of S
OEs
to
impr
ove
perf
orm
ance
and
effici
ent u
se o
f gov
ernm
ent
reso
urce
s
Prog
ress
on
rest
ruct
urin
gsPa
rtic
ipat
e in
and
lead
maj
or
inte
rven
tions
and
rest
ruct
urin
g
with
a p
artic
ular
focu
s on
Esko
m, P
ebbl
e Be
d M
odul
ar
Reac
tor (
PBM
R), C
EF/
Petr
oSA
,
Tran
snet
, Wat
er S
ecto
r
Wor
ked
with
the
Dep
artm
ent o
f Pub
lic
Ente
rpris
es o
n so
lutio
ns fo
r the
Den
el
Saab
Aer
ostr
uctu
res
busi
ness
, and
Tran
snet
Sec
ond
Defi
ned
Bene
fit F
und
defic
it of
R1.
984
billi
on. P
BMR
plac
ed
into
car
e an
d m
aint
enan
ceRe
view
of C
EF/P
etro
SA u
nder
way
incl
udin
g pr
opos
ed re
finer
y an
d
rene
wab
le p
roje
cts
and
the
fund
ing
ther
eof
Obt
aine
d Ca
bine
t app
rova
l for
the
esta
blis
hmen
t of a
n In
depe
nden
t
Syst
em a
nd M
arke
t Ope
rato
r (IS
MO
) as
a
ring
fenc
ed e
ntity
with
in E
skom
Ana
lyse
d va
rious
pro
posa
ls fo
r fun
ding
of E
skom
(inc
ludi
ng s
peci
al p
urpo
se
vehi
cle
and
pref
eren
ce s
hare
s)
Initi
ated
revi
ew o
f Int
eres
t Mak
e-up
Sche
me
of th
e Ex
port
Cre
dit I
nsur
ance
Corp
orat
ion
Liab
ility
Man
agem
ent
Fina
nce
gove
rnm
ent’s
gro
ss
borr
owin
g re
quire
men
t
Ann
ual t
otal
gov
ernm
ent
borr
owin
g ne
eds
fully
met
Gro
ss is
suan
ce o
f R19
1.7
billi
onRe
vise
d gr
oss
borr
owin
g re
quire
men
t of
R156
.2 b
illio
n fin
ance
d
SERV
ICE
dEl
IVER
y A
ChIE
VEm
ENTS
prog
ram
me
3: a
sset
and
lia
bilit
y M
anag
emen
t - C
ontin
ued
NT AR 10-11_10.indd 52 2011/08/17 10:02 AM

53
Nat
iona
l Tre
asur
y A
nnua
l Rep
ort 2
010/
11
Programme 3 - Asset and Liability Management
PROGRAmmE 3asset aND liaBility MaNaGeMeNt - continued
Mea
sura
ble
obje
ctiv
e: E
nsur
e pr
uden
t cas
h an
d fin
anci
al m
anag
emen
t, ov
ersi
ght o
f sta
te-o
wne
d en
titie
s an
d op
timal
man
agem
ent o
f the
sta
te’s
dom
estic
and
fore
ign
debt
subp
rogr
amm
eo
utpu
tM
easu
re /
indi
cato
ra
ctua
l per
form
ance
aga
inst
targ
etta
rget
act
ual
Sect
oral
Ove
rsig
htRe
stru
ctur
ing
of S
OEs
to
impr
ove
perf
orm
ance
and
effici
ent u
se o
f gov
ernm
ent
reso
urce
s
Prog
ress
on
rest
ruct
urin
gsPa
rtic
ipat
e in
and
lead
maj
or
inte
rven
tions
and
rest
ruct
urin
g
with
a p
artic
ular
focu
s on
Esko
m, P
ebbl
e Be
d M
odul
ar
Reac
tor (
PBM
R), C
EF/
Petr
oSA
,
Tran
snet
, Wat
er S
ecto
r
Wor
ked
with
the
Dep
artm
ent o
f Pub
lic
Ente
rpris
es o
n so
lutio
ns fo
r the
Den
el
Saab
Aer
ostr
uctu
res
busi
ness
, and
Tran
snet
Sec
ond
Defi
ned
Bene
fit F
und
defic
it of
R1.
984
billi
on. P
BMR
plac
ed
into
car
e an
d m
aint
enan
ceRe
view
of C
EF/P
etro
SA u
nder
way
incl
udin
g pr
opos
ed re
finer
y an
d
rene
wab
le p
roje
cts
and
the
fund
ing
ther
eof
Obt
aine
d Ca
bine
t app
rova
l for
the
esta
blis
hmen
t of a
n In
depe
nden
t
Syst
em a
nd M
arke
t Ope
rato
r (IS
MO
) as
a
ring
fenc
ed e
ntity
with
in E
skom
Ana
lyse
d va
rious
pro
posa
ls fo
r fun
ding
of E
skom
(inc
ludi
ng s
peci
al p
urpo
se
vehi
cle
and
pref
eren
ce s
hare
s)
Initi
ated
revi
ew o
f Int
eres
t Mak
e-up
Sche
me
of th
e Ex
port
Cre
dit I
nsur
ance
Corp
orat
ion
Liab
ility
Man
agem
ent
Fina
nce
gove
rnm
ent’s
gro
ss
borr
owin
g re
quire
men
t
Ann
ual t
otal
gov
ernm
ent
borr
owin
g ne
eds
fully
met
Gro
ss is
suan
ce o
f R19
1.7
billi
onRe
vise
d gr
oss
borr
owin
g re
quire
men
t of
R156
.2 b
illio
n fin
ance
d
Soun
d do
mes
tic a
nd fo
reig
n
debt
man
agem
ent p
olic
ies
Enha
nced
liqu
idity
Co
ncen
trat
e is
suan
ce in
benc
hmar
k bo
nds
Of t
he 7
8% d
omes
tic b
ond
fund
ing
in fi
xed-
inco
me
bond
s, 77
% w
as
conc
entr
ated
in th
e R2
03 (8
.25%
; 201
7),
R204
(8.0
%; 2
018)
, R20
7 (7
.25%
; 202
0),
R208
(6.7
5%; 2
021)
and
R20
9 (6
.25%
;
2036
) bon
ds
Infla
tion-
linke
d is
suan
ce w
as fo
cuse
d
in th
e R2
02 (3
.45%
; 203
3), R
210
(2.6
0%;
2028
) and
R21
2 (2
.75%
; 202
2) b
onds
Scrip
lend
ing
and
repo
faci
litie
sSc
rip le
ndin
g an
d re
po fa
cilit
ies
of R
1.6
billi
on p
rovi
ded
Act
ive
debt
man
agem
ent
Buyb
ack
and
switc
hes/
exch
ange
s in
dom
estic
deb
t
to re
duce
loan
rede
mpt
ions
by
R8 b
illio
n (2
011/
12) a
nd R
35
billi
on (2
012/
13)
Redu
ce re
dem
ptio
n in
201
2/13
by
R20
billi
on th
roug
h sw
itch
auct
ions
in th
e
R189
(6.2
5%; 2
013)
bon
d
Man
age
debt
ser
vice
cos
tM
aint
ain
debt
ser
vice
cos
t
as p
erce
ntag
e of
GD
P at
sust
aina
ble
leve
ls
2.6%
of G
DP
2.5%
of G
DP,
mai
nly
due
to th
e st
rong
rand
Cont
ribut
e to
the
deve
lopm
ent o
f fina
ncia
l
mar
kets
Div
ersi
ficat
ion
of fu
ndin
g
inst
rum
ents
Dom
estic
fund
ing
in fi
xed-
inco
me,
infla
tion-
linke
d an
d
reta
il bo
nds,
float
ing
rate
not
es
and
trea
sury
bill
s
Dom
estic
fina
ncin
g of
R18
5.3
billi
on
com
pris
ed s
hort
-ter
m lo
ans
of R
34.9
billi
on a
nd lo
ng-t
erm
loan
s of
R15
0.4
billi
on
Long
-ter
m d
omes
tic is
suan
ce in
clud
ed
R5.4
bill
ion
in re
tail
bond
s, an
d a
furt
her
R28
billi
on in
the
4 ne
wly
intr
oduc
ed
dom
estic
bon
dsIn
tern
atio
nal f
undi
ng th
roug
h
capi
tal m
arke
t and
exp
ort
cred
it ag
ency
loan
s
R5.2
bill
ion
(US$
750
mill
ion)
was
rais
ed
in th
e in
tern
atio
nal c
apita
l mar
kets
and
R470
mill
ion
thro
ugh
expo
rt c
redi
t
agen
cy lo
ans
NT AR 10-11_10.indd 53 2011/08/17 10:02 AM

Nat
iona
l Tre
asur
y A
nnua
l Rep
ort 2
010/
11
54
Programme 3 - Asset and Liability Management
PROGRAmmE 3asset aND liaBility MaNaGeMeNt - continued
Mea
sura
ble
obje
ctiv
e: E
nsur
e pr
uden
t cas
h an
d fin
anci
al m
anag
emen
t, ov
ersi
ght o
f sta
te-o
wne
d en
titie
s an
d op
timal
man
agem
ent o
f the
sta
te’s
dom
estic
and
fore
ign
debt
subp
rogr
amm
eo
utpu
tM
easu
re /
indi
cato
ra
ctua
l per
form
ance
aga
inst
targ
etta
r get
ac t
ual
Liab
ility
Man
agem
ent
Soun
d in
vest
or re
latio
nsRe
tain
cur
rent
inve
stor
s an
d
attr
act n
ew o
nes
Cond
uct t
wo
dom
estic
and
two
fore
ign
road
show
s
Targ
et m
et
Tim
ely
diss
emin
atio
n of
relia
ble
info
rmat
ion
Fille
d th
e 18
k di
sclo
sure
doc
umen
t
with
the
US
Secu
ritie
s of
Exc
hang
e
Com
mis
sion
(SEC
), Ka
nto
loca
l
finan
ce b
urea
u in
Japa
n an
d fil
led
the
pros
pect
us s
uppl
emen
t with
the
Luxe
mbu
rg s
tock
exc
hang
e Fi
nanc
ial O
pera
tions
Soun
d ca
sh fo
reca
sts
Gov
ernm
ent’s
liqu
idity
requ
irem
ents
met
eve
ry ti
me
Fore
cast
ing
R2.5
trill
ion
of c
ash
flow
s
Targ
et m
et
Opt
imis
e re
turn
on
inve
stm
ents
sub
ject
to c
redi
t
limits
Inve
stm
ent o
f sur
plus
cas
h at
mar
ket-
rela
ted
rate
s
Qua
rter
ly a
naly
sis
and
revi
ew
of in
vest
men
t rat
es
Tax
& lo
an a
ccou
nt in
vest
men
t rat
es
revi
ewed
qua
rter
ly
Inte
rest
ear
ned
was
on
aver
age
equa
l to
Trea
sury
bill
yie
ld le
ss 3
4 ba
sis
poin
tsO
ptim
ise
use
of p
ublic
sec
tor
cash
Publ
ic s
ecto
r cas
h co
ordi
nate
d O
ngoi
ng b
road
enin
g of
the
coor
dina
tion
of p
ublic
sec
tor
cash
Borro
win
g an
d le
ndin
g be
twee
n na
tiona
l
gove
rnm
ent,
prov
inci
al g
over
nmen
t
and
rela
ted
SOEs
, tak
ing
plac
e un
der t
he
umbr
ella
of t
he C
orpo
ratio
n fo
r Pub
lic
Dep
osits
(CPD
)
Util
ised
R13.
3 bi
llion
of p
ublic
sec
tor
inve
stm
ents
with
CPD
for s
hort
-ter
m
finan
cing
SERV
ICE
dEl
IVER
y A
ChIE
VEm
ENTS
prog
ram
me
3: a
sset
and
lia
bilit
y M
anag
emen
t - C
ontin
ued
NT AR 10-11_10.indd 54 2011/08/17 10:02 AM

55
Nat
iona
l Tre
asur
y A
nnua
l Rep
ort 2
010/
11
Programme 3 - Asset and Liability Management
PROGRAmmE 3asset aND liaBility MaNaGeMeNt - continued
Savi
ng o
n bo
rrow
ing
cost
by n
atio
nal a
nd p
rovi
ncia
l
gove
rnm
ents
Savi
ng o
f up
to 3
% o
n
borr
owin
g co
sts
com
pare
d to
borr
owin
g fro
m c
omm
erci
al
bank
s
Savi
ng o
f up
to 3
.4%
on
borr
owin
g
cost
s co
mpa
red
to b
orro
win
g fro
m
com
mer
cial
ban
ks a
chie
ved
Ann
ual fi
nanc
ial s
tate
men
ts
and
mar
ket r
epor
ts
Tim
ely
and
accu
rate
repo
rtin
gCo
mpl
ianc
e w
ith P
FMA
repo
rtin
g re
quire
men
ts
rega
rdin
g an
nual
fina
ncia
l
stat
emen
ts
PFM
A re
port
ing
requ
irem
ents
met
Tim
ely
diss
emin
atio
n of
relia
ble
mar
ket i
nfor
mat
ion
Repo
rtin
g re
quire
men
ts fo
r the
spe
cial
data
dis
sem
inat
ion
stan
dard
s of
the
IMF
met
and
relia
ble
mar
ket i
nfor
mat
ion
timeo
usly
dis
sem
inat
edTr
easu
ry m
anag
emen
t
syst
ems
Relia
ble,
aut
omat
ed a
nd
inte
grat
ed s
yste
ms
to b
e
impl
emen
ted
Impl
emen
tatio
n of
the
fore
ign
debt
mod
ule
on th
e ne
w b
ack
office
sys
tem
The
fore
ign
debt
mod
ule
is fu
lly o
pera
tiona
l
Prog
ress
on
dom
estic
and
reta
il bo
nd
mod
ules
are
on
sche
dule
Im
plem
entin
g an
d ac
tivel
y
man
agin
g th
e re
vise
d sy
stem
s
inte
grat
ion
stra
tegy
Colla
bora
ting
with
the
Com
mon
wea
lth
Secr
etar
iat t
o as
sist
with
the
end-
user
requ
irem
ents
for t
he d
evel
opm
ent o
f a
new
Pub
lic D
ebt A
naly
tical
Too
l whi
ch
will
be
pilo
ted
in S
outh
Afri
ca
Stra
tegy
and
Ris
k
Man
agem
ent
Min
imis
e an
d m
itiga
te ri
sks
eman
atin
g fro
m g
over
nmen
t
debt
por
tfolio
(mar
ket r
isk)
and
from
the
inve
stm
ent o
f
surp
lus
cash
Perf
orm
ance
aga
inst
benc
hmar
ks:
•Non
-fixedversusfixeddebt
•Foreigndebtversusd
omestic
debt
Revi
ew o
f str
ateg
ic
benc
hmar
ks o
f 70/
30 fi
xed
vers
us n
on-fi
xed
rate
dom
estic
debt
and
20-
25%
max
imum
fore
ign
debt
exp
osur
e as
a
perc
enta
ge o
f tot
al d
ebt
Impl
emen
t and
mon
itor
stra
tegi
c be
nchm
arks
Qua
rter
ly re
view
of
perf
orm
ance
aga
inst
benc
hmar
ks
A s
ensi
tivity
ana
lysi
s w
as p
erfo
rmed
to
dete
rmin
e ho
w th
e vo
lum
e an
d co
st o
f
debt
cha
nge
whe
n po
rtfo
lio ra
tios
are
alte
red
As
at 3
1 M
ar 2
011
fixed
rate
deb
t
com
pris
ed 6
3.2
per c
ent a
nd n
on-fi
xed
rate
deb
t 36.
8 pe
r cen
t of d
omes
tic
debt
. Fo
reig
n de
bt c
ompr
ised
9.9
per
cent
of t
otal
gro
ss d
ebt,
wel
l bel
ow ri
sk
guid
elin
es o
f 20-
25 p
er c
ent
NT AR 10-11_10.indd 55 2011/08/17 10:02 AM

Nat
iona
l Tre
asur
y A
nnua
l Rep
ort 2
010/
11
56
Programme 3 - Asset and Liability Management
PROGRAmmE 3asset aND liaBility MaNaGeMeNt - continued
Mea
sura
ble
obje
ctiv
e: E
nsur
e pr
uden
t cas
h an
d fin
anci
al m
anag
emen
t, ov
ersi
ght o
f sta
te-o
wne
d en
titie
s an
d op
timal
man
agem
ent o
f the
sta
te’s
dom
estic
and
fore
ign
debt
subp
rogr
amm
eo
utpu
tM
easu
re /
indi
cato
ra
ctua
l per
form
ance
aga
inst
targ
etta
rget
act
ual
Stra
tegy
and
Ris
k
Man
agem
ent
Min
imis
e an
d m
itiga
te ri
sks
eman
atin
g fro
m g
over
nmen
t
debt
por
tfolio
(mar
ket r
isk)
and
from
the
inve
stm
ent o
f
surp
lus
cash
Adh
eren
ce to
sur
plus
cas
h
benc
hmar
k in
vest
men
t rat
ios
and
tota
l lim
its p
er c
ount
erpa
rty
Ann
ual r
evie
w o
f inv
estm
ent
ratio
s an
d lim
its p
er
coun
terp
arty
Sem
i-ann
ual r
epor
ts o
n
adhe
renc
e to
ratio
s an
d lim
its
Inve
stm
ent r
atio
s an
d co
unte
rpar
ty
limits
revi
ewed
Sem
i-ann
ual r
epor
ts o
n ad
here
nce
cond
ucte
d
Min
imis
e an
d m
itiga
te
sove
reig
n cr
edit
ratin
g ris
ks
Qua
ntita
tive
indi
cato
rs o
f
sove
reig
n ris
k
Sem
i-ann
ual s
over
eign
cre
dit
ratin
g re
view
s
PFM
A re
port
ing
requ
irem
ents
met
Repo
rtin
g re
quire
men
ts fo
r the
spe
cial
data
dis
sem
inat
ion
stan
dard
s of
the
IMF
met
and
relia
ble
mar
ket i
nfor
mat
ion
timel
y di
ssem
inat
edM
anag
e co
ntin
gent
liab
ilitie
s
appr
opria
tely
Capp
ing
tota
l gov
ernm
ent d
ebt
plus
con
tinge
nt li
abili
ties
as a
perc
enta
ge o
f GD
P
Revi
ew a
nd m
onito
r
benc
hmar
k of
net
gov
ernm
ent
debt
and
con
tinge
nt li
abili
ties
not e
xcee
ding
50%
of G
DP
Revi
ew a
nd m
onito
ring
cond
ucte
d
quar
terly
with
the
upda
te o
f the
cont
inge
nt li
abili
ty re
gist
er
The
net d
ebt p
lus
cont
inge
nt li
abili
ties
was
abo
ut 4
4% o
f GD
P as
at 3
1 M
arch
SERV
ICE
dEl
IVER
y A
ChIE
VEm
ENTS
prog
ram
me
3: a
sset
and
lia
bilit
y M
anag
emen
t - C
ontin
ued
NT AR 10-11_10.indd 56 2011/08/17 10:02 AM

57
Nat
iona
l Tre
asur
y A
nnua
l Rep
ort 2
010/
11
Programme 3 - Asset and Liability Management
PROGRAmmE 3asset aND liaBility MaNaGeMeNt - continued
PROGRAmmE 4FINANCIAl mANAGEmENT ANd SySTEmS
NT AR 10-11_10.indd 57 2011/08/17 10:02 AM

Nat
iona
l Tre
asur
y A
nnua
l Rep
ort 2
010/
11
58
Programme 4 - Financial Management and Systems
PROGRAmmE 4FiNaNCial MaNaGeMeNt aND systeMs
purpose: Manage and regulate government’s supply chain processes, implement and maintain standardised
financial systems.
Measurable objective: regulate and oversee public-sector supply chain management, and standardise the financial
systems of national and provincial government.
Managed by the Specialist Functions division, activities are carried out under the following subprogrammes:
• Supply Chain Management (SCM) consists of Supply Chain Policy, Norms and Standards, and Contract Management.
SCM develops policy that regulates supply chain management processes in the public sector, monitors policy
outcomes, facilitates and manages transversal term contracts.
• Financial Systems maintains and enhances financial management systems to ensure they comply with the Public
Finance Management Act (PFMA) and Generally Recognised Accounting Practice (GRAP).
SERVICE dElIVERy ObJECTIVES ANd INdICATORS
reCeNt outputs
During the 2010/11 financial year Supply Chain Policy implemented the item identification policy which entails uniform
classification and identification of items for procurement purposes. The unit also undertook regular enhancements and
maintenance of corporate reference data, including the completion of the Oracle vanilla software configuration. The
Supply Chain Management User Requirement for the Integrated Financial Management System (IFMS) was completed
for the Asset Management, Catalogue Management and Inventory Management modules. The generic template for the
Procurement Management Module has also been completed.
The implementation of the strategic sourcing principles was delayed following a decision to reprioritise the IFMS
Procurement Management Module. A new comprehensive roll-out plan will be finalised and executed in 72 municipalities
by March 2012.
Norms and Standards monitored SCM compliance and continued to improve transparency and accountability in terms of
SCM prescripts. The unit issued three instruction notes in terms of the PFMA and two in terms of the MFMA. These dealt
with prohibiting collusive bidding or bid-rigging in the supply chain management environment; they also amended
guidelines to include functionality as a criterion for evaluating the status of recommended bidders on the database
of restricted suppliers and the Register for Tender Defaulters. This will ensure that bidders listed on the databases are
prohibited from doing business with government.
There were delays with aligning the Preferential Procurement Regulations with the aims of the Broad-Based Black
Economic Empowerment Act, (53 of 2003). The draft revised Preferential Procurement Regulations were approved by
Cabinet on 2 March 2011, subject to legal refinement. The draft was submitted to the Office of the Chief State Law Adviser
for legal refinement. The revised regulations will be promulgated by the Minister of Finance and will come into effect in
the third quarter of the 2011/12 financial year.
NT AR 10-11_10.indd 58 2011/08/17 10:02 AM

59
Nat
iona
l Tre
asur
y A
nnua
l Rep
ort 2
010/
11
Programme 4 - Financial Management and Systems
PROGRAmmE 4FiNaNCial MaNaGeMeNt aND systeMs - continued
Contract Management facilitates transversal term contracts on behalf of government departments. Thirty (30) out of the
fifty seven (57) transversal term contracts were due for renewal during the review period. Of these, twenty-six (26) were
renewed and the remaining four (4) will be renewed in the 2011/12 financial year. One contract (RT58 – insurance for
subsidised vehicles) was extended to end in March 2012. Another contract (RT21 – radiographic material) was extended
to end in June 2011 and was awarded in May 2011. Two contracts (RT13 – respiratory aids and RT253 – catheters and
tubes) expired and were renewed in May 2011.
The quantification of two (2) strategic transversal term contracts, namely RT71-antiretroviral drugs and RT57-motor
vehicles, was completed.
In the Financial Systems subprogramme, the financial management systems (BAS, PERSAL, LOGIS and Vulindlela) continued
to operate optimally.
The implementation of the Asset Management Module was completed at four (4) Limpopo Provincial departments
(Provincial Treasury, Roads and Transport, Local Government and Housing and Agriculture) and the National Treasury. The
Human Resource Management Module has been implemented at the Department of Public Service and Administration.
The implementation of the Human Resource Management Module at the Free State Provincial Department of Education
commenced, but is progressing slowly due to inadequate infrastructure within the department and the province.
The National Treasury also experienced delays with implementing the Procurement Management Module due to
insufficient hosting infrastructure at SITA. There was a delay in implementing both the Procurement Management Module
and Asset Management Module at the Department of Defence (DoD); however, implementation of both modules has
commenced.
Following the completion of specifications for the development of the Payroll, Finance and Inventory Management
Modules, SITA will in the 2011/12 financial year publish requests for bids.
NT AR 10-11_10.indd 59 2011/08/17 10:02 AM

Nat
iona
l Tre
asur
y A
nnua
l Rep
ort 2
010/
11
60
Programme 4 - Financial Management and Systems
PROGRAmmE 4FiNaNCial MaNaGeMeNt aND systeMs - continued
SERV
ICE
dEl
IVER
y A
ChIE
VEm
ENTS
prog
ram
me
4: F
inan
cial
Man
agem
ent a
nd s
yste
ms
Mea
sura
ble
obje
ctiv
e: re
gula
te a
nd o
vers
ee p
ublic
-sec
tor s
uppl
y ch
ain
man
agem
ent,
and
stan
dard
ise
the
finan
cial
sys
tem
s of
nat
iona
l and
pro
vinc
ial g
over
nmen
t.su
bpro
gram
me
out
put
Mea
sure
/ in
dica
tor
act
ual p
erfo
rman
ce a
gain
st ta
rget
targ
eta
ctua
lSu
pply
Cha
in P
olic
y
Ove
rall
user
requ
irem
ent
stat
emen
t (U
RS) a
nd u
pdat
ed
supp
ly c
hain
man
agem
ent
(SC
M) U
RS
Mai
ntai
n an
d en
hanc
e U
RS
Ong
oing
Su
pplie
r Dat
abas
e M
anag
emen
t
App
licat
ion
inst
alle
d an
d op
erat
ing
at
lead
site
(Nat
iona
l Tre
asur
y)
The
first
thre
e pr
iorit
ized
Pro
cure
men
t
Mod
ules
(Pro
cure
men
t Man
agem
ent
Mod
ule;
Cat
alog
ue M
anag
emen
t Sys
tem
(CM
S) a
nd A
sset
Reg
iste
r) in
stal
led
and
runn
ing
at le
ad s
ite. T
he u
pgra
ded
vers
ion
II A
sset
regi
ster
has
als
o be
en
impl
emen
ted
at th
ree
prov
inci
al
depa
rtm
ents
in L
impo
po (R
oads
, Hou
sing
and
Agr
icul
ture
)Im
plem
ent i
tem
iden
tifica
tion
polic
y
Impl
emen
tatio
n of
item
iden
tifica
tion
at le
ad s
ites
Roll
out t
o re
st o
f
depa
rtm
ents
Vers
ion
II A
pplic
atio
n To
ol i
nsta
lled
at
Nat
iona
l Tre
asur
y as
the
lead
site
Esta
blis
h co
rpor
ate
refe
renc
e
data
func
tiona
lity
Esta
blis
h U
RS re
posi
tory
O
ngoi
ng e
nhan
cem
ents
and
mai
nten
ance
Corp
orat
e re
fere
nce
data
(CRD
)
func
tiona
lity
esta
blis
hed
Fina
ncia
l Man
agem
ent c
hang
e co
ntro
ls
esta
blis
hed
Cha
nge
cont
rol t
empl
ates
upd
ated
Ora
cle
Vani
lla S
oftw
are
confi
gura
tion
of
the
CRD
has
bee
n co
mpl
eted
NT AR 10-11_10.indd 60 2011/08/17 10:02 AM

61
Nat
iona
l Tre
asur
y A
nnua
l Rep
ort 2
010/
11
Programme 4 - Financial Management and Systems
PROGRAmmE 4FiNaNCial MaNaGeMeNt aND systeMs - continued
Intr
oduc
tion
of s
trat
egic
sour
cing
prin
cipl
es to
all
sphe
res
of g
over
nmen
t
Roll
out s
trat
egic
sou
rcin
g
prin
cipl
es to
the
publ
ic s
ecto
r
and
assi
st in
stitu
tions
with
impl
emen
tatio
n
40 n
atio
nal d
epar
tmen
ts
4 pr
ovin
cial
trea
surie
s
4 co
nstit
utio
nal i
nstit
utio
ns
20 h
igh
capa
city
mun
icip
aliti
es
Intr
oduc
e st
rate
gic
sour
cing
prin
cipl
es to
32
med
ium
capa
city
mun
icip
aliti
es a
nd
38 lo
w c
apac
ity m
unic
ipal
ities
in c
onju
nctio
n w
ith th
e
rele
vant
pro
vinc
ial t
reas
urie
s
Not
ach
ieve
d du
e to
a d
ecis
ion
to
repr
iorit
ise
impl
emen
tatio
n of
the
IFM
S
Proc
urem
ent M
anag
emen
t Mod
ule
Nor
ms
and
Stan
dard
sSC
M c
ompl
ianc
e m
onito
ring
and
com
batin
g SC
M re
late
d
corr
uptio
n
Exte
nt o
f com
plia
nce
to S
CM
proc
edur
es a
nd p
resc
ripts
Ope
ratio
nalis
e th
e SC
M
com
plia
nce
mon
itorin
g un
it
Op
erat
iona
l with
in th
e O
ffice
of t
he
Acc
ount
ant G
ener
alA
dmin
istr
atio
n of
grie
vanc
e
mec
hani
sm
Ong
oing
inve
stig
atio
n of
SCM
rela
ted
grie
vanc
es
Wor
ked
with
the
OA
G to
inve
stig
ate
and
final
ise
grie
vanc
es re
late
d to
non
-
com
plia
nce
with
SC
M p
resc
ripts
Ro
ll ou
t rev
ised
SC
M
fram
ewor
k
Succ
essf
ul im
plem
enta
tion
thro
ugho
ut g
over
nmen
t
Issu
e at
leas
t fou
r pra
ctic
e
note
s fo
r im
plem
entin
g th
e
revi
sed
SCM
fram
ewor
k
Issu
ed th
ree
inst
ruct
ion/
prac
tice
note
s
and
two
circ
ular
s
Alig
n pr
efer
entia
l
proc
urem
ent w
ith th
e ai
ms
of
the
BBBE
E A
ct a
nd it
s re
late
d
stra
tegy
Exte
nt o
f alig
nmen
tIs
sue
SCM
fram
ewor
k to
alig
n
Pref
eren
tial P
rocu
rem
ent
Polic
y Fr
amew
ork
Act
with
BBBE
EA b
y Ju
ly 2
010
Dra
ft re
gula
tions
app
rove
d by
Cab
inet
on
2 M
arch
201
1 an
d re
ferr
ed to
Sta
te L
aw
Adv
isor
s fo
r leg
al re
finem
ent.
Del
ay d
ue
to p
rotr
acte
d pr
oces
ses
NT AR 10-11_10.indd 61 2011/08/17 10:02 AM

Nat
iona
l Tre
asur
y A
nnua
l Rep
ort 2
010/
11
62
Programme 4 - Financial Management and Systems
PROGRAmmE 4FiNaNCial MaNaGeMeNt aND systeMs - continued
SERV
ICE
dEl
IVER
y A
ChIE
VEm
ENTS
prog
ram
me
4: F
inan
cial
Man
agem
ent a
nd s
yste
ms
- Con
tinue
d
Mea
sura
ble
obje
ctiv
e: re
gula
te a
nd o
vers
ee p
ublic
-sec
tor s
uppl
y ch
ain
man
agem
ent,
and
stan
dard
ise
the
finan
cial
sys
tem
s of
nat
iona
l and
pro
vinc
ial g
over
nmen
t.su
bpro
gram
me
out
put
Mea
sure
/ in
dica
tor
act
ual p
erfo
rman
ce a
gain
st ta
rget
targ
eta
ctua
lCo
ntra
ct M
anag
emen
tFa
cilit
ate
and
man
age
tran
sver
sal t
erm
con
trac
ts
Num
ber o
f tra
nsve
rsal
term
cont
ract
s fa
cilit
ated
per
yea
r
30 t
rans
vers
al te
rm c
ontr
acts
due
for r
enew
al d
urin
g
2010
/11
out o
f a to
tal o
f 57
tran
sver
sal t
erm
con
trac
ts
Fina
lised
26
tran
sver
sal t
erm
con
trac
ts
succ
essf
ully
two
cont
ract
s w
ere
not r
enew
ed b
ut
exte
nded
:
RT58
-200
6: E
xten
ded
to e
nd in
Mar
ch 2
012
RT21
-200
9: E
xten
ded
to e
nd Ju
ne 2
011
and
was
onl
y aw
arde
d in
May
201
1
two
cont
ract
s ex
pire
d:
RT13
-200
9 an
d RT
253-
2009
App
ly s
trat
egic
sou
rcin
g to
enha
nce
valu
e fo
r mon
ey
appl
icab
le to
all
tran
sver
sal
term
con
trac
ts
Num
ber o
f tra
nsve
rsal
term
cont
ract
s on
whi
ch s
trat
egic
sour
cing
is a
pplie
d
Qua
ntify
eco
nom
ic b
enefi
ts
for a
pply
ing
stra
tegi
c
sour
cing
met
hods
to c
erta
in
stra
tegi
c tr
ansv
ersa
l ter
m
cont
ract
s
Com
plet
ed e
cono
mic
ben
efit
quan
tifica
tion
on 2
str
ateg
ic tr
ansv
ersa
l
term
con
trac
ts, n
amel
y su
pply
of A
nti-
retr
ovira
ls a
nd M
otor
veh
icle
s co
ntra
cts
Fina
ncia
l Sys
tem
sM
aint
ain
and
supp
ort c
urre
nt
finan
cial
man
agem
ent
syst
ems
Perc
enta
ge a
vaila
bilit
y of
syst
ems
with
in w
orki
ng h
ours
98%
ava
ilabi
lity
of s
yste
ms
durin
g w
orki
ng h
ours
Ach
ieve
d
Roll
out t
he In
tegr
ated
Fina
ncia
l Man
agem
ent
Syst
em (I
FMS)
Impl
emen
t lea
d so
lutio
ns
Impl
emen
t the
Ass
et
Man
agem
ent M
odul
e in
the
follo
win
g de
part
men
ts: N
T
DoD
Lim
popo
(4 p
rovi
ncia
l
depa
rtm
ents
)
The
Ass
et M
anag
emen
t mod
ule
was
impl
emen
ted
at N
T an
d in
4 p
rovi
ncia
l
depa
rtm
ents
in L
impo
po. T
here
wer
e
dela
y ex
perie
nced
with
DoD
sig
ning
the
Proj
ect C
hart
er
NT AR 10-11_10.indd 62 2011/08/17 10:02 AM

63
Nat
iona
l Tre
asur
y A
nnua
l Rep
ort 2
010/
11
Programme 4 - Financial Management and Systems
PROGRAmmE 4FiNaNCial MaNaGeMeNt aND systeMs - continued
Impl
emen
t the
Pro
cure
men
t
Man
agem
ent M
odul
e in
: NT
DoD
The
Proc
urem
ent M
anag
emen
t Mod
ule
was
not
impl
emen
ted
at th
e N
T an
d
DoD
due
to d
elay
s ex
perie
nced
with
SITA
pro
curin
g th
e re
quire
d op
erat
ing
infra
stru
ctur
eIm
plem
ent t
he H
uman
Reso
urce
s M
anag
emen
t
Mod
ule
in: D
PSA
FS D
oE
The
Hum
an R
esou
rces
Man
agem
ent
Mod
ule
was
impl
emen
ted
at th
e D
PSA
.
Expe
rienc
ed c
halle
nges
with
FS
DoE
due
to c
apac
ity c
onst
rain
ts a
t FS
DoE
Cont
ract
sys
tem
deve
lopm
ent p
artn
ers
Dev
elop
IFM
S in
-hou
se
solu
tions
Dev
elop
a B
I pla
tform
The
deve
lopm
ent o
f the
BI p
latfo
rm i
s
unde
rway
D
evel
op a
pay
roll
mod
ule
deve
lop
inve
ntor
y
man
agem
ent m
odul
e
Payr
oll a
nd in
vent
ory
man
agem
ent
mod
ules
- th
e te
nder
spe
cific
atio
ns fo
r
thes
e m
odul
es h
ave
been
dev
elop
edD
evel
op a
n ap
proa
ch fo
r dat
a
mig
ratio
n
Succ
essf
ul d
ata
mig
ratio
n or
syst
em s
witc
h-ov
er
Mig
rate
dep
artm
ents
to
com
plet
ed IF
MS
mod
ules
Ach
ieve
d pr
imar
ily o
n si
tes
whe
re IF
MS
impl
emen
tatio
n ha
s co
mm
ence
dC
reat
e a
user
sup
port
capa
city
at S
ITA
Esta
blis
h an
IFM
S U
ser
Supp
ort C
entr
e
Set u
p a
call
cent
re fo
r IFM
SSI
TA is
in th
e pr
oces
s of
est
ablis
hing
a
Use
r Sup
port
Cen
tre
NT AR 10-11_10.indd 63 2011/08/17 10:02 AM

Nat
iona
l Tre
asur
y A
nnua
l Rep
ort 2
010/
11
64
Programme 5 - Financial Accounting and Reporting
PROGRAmmE 5FiNaNCial aCCouNtiNG aND reportiNG - continued
PROGRAmmE 5FINANCIAl ACCOUNTING ANd REPORTING
NT AR 10-11_10.indd 64 2011/08/17 10:02 AM

65
Nat
iona
l Tre
asur
y A
nnua
l Rep
ort 2
010/
11
Programme 5 - Financial Accounting and Reporting
PROGRAmmE 5FiNaNCial aCCouNtiNG aND reportiNG
purpose: Enhance accountability and governance by promoting the transparent, efficient and prudent management of
revenue, expenditure, assets and liabilities.
Measurable objective: aims to promote accountability to the public by encouraging transparency and effective
management of revenue, expenditure, assets, and liabilities in the public sector.
Financial Accounting and Reporting develops frameworks, guidelines, practice notes and transversal policies for internal
auditing, risk management and accounting for the public service. It sets new government accounting policies and
practices and improves existing ones to ensure compliance with the Generally Recognised Accounting Practice (GRAP).
It also prepares consolidated financial statements for national departments and seeks to improve the timeliness and
accuracy of financial reporting.
The programme consists of eight subprogrammes:
• Technical Support Services develops and publishes frameworks, policies and guidelines on accounting, internal audit
and the management of risks associated with revenue, expenditure, assets and liabilities (REAL).
• Accounting Support and Reporting provides accounting and reporting support to clients in all spheres of government
in respect of REAL management; manages and reports on the National Revenue Fund and the Reconstruction and
Development Fund; renders banking services to all national departments and prepares their annual consolidated
financial statements.
• Internal Audit Support provides departments, constitutional institutions, public entities and municipalities with an
independent assurance of the quality of their business processes.
• Risk Management Support helps departments, constitutional institutions, public entities and municipalities improve
their capacity to manage risks that would otherwise hobble their performance, and ultimately that of the state.
• Capacity Building manages, coordinates, monitors and facilitates the building of financial management capacity within
government.
• Governance Monitoring and Compliance monitors financial management governance and compliance with legislation
by all spheres of government.
• MFMA Implementation develops regulations, co-ordinates, monitors and reports on the implementation of the
Municipal Finance Management Act, and administers the financial management grant in support of financial reforms
in local government.
• Specialised Audit Services provides performance auditing and investigative capacity in all three spheres of government
on a broad range of financial management issues.
poliCy DevelopMeNts
The Technical Support Services unit developed the financial reporting pack for financial statements for national and
provincial departments and provided training and support during implementation.
The Accounting Support and Reporting unit monitored expenditure through the Section 32 reports which are published
monthly. In addition, the unit prepared and tabled the consolidated annual financial statements for national departments
and public entities and the RDP Fund document. The unit also developed accounting manuals for GRAP standards and
offered training to 1 024 officials to assist with implementing the standards in provincial treasuries, municipalities and
public entities.
NT AR 10-11_10.indd 65 2011/08/17 10:02 AM

Nat
iona
l Tre
asur
y A
nnua
l Rep
ort 2
010/
11
66
Programme 5 - Financial Accounting and Reporting
PROGRAmmE 5FiNaNCial aCCouNtiNG aND reportiNG - continued
The Internal Audit unit monitored the performance of audit committees through the attendance of meetings and
made interventions where necessary. Following requests for training, ten audit committees were trained. The unit also
conducted 26 internal audit reviews in municipalities. Officials were trained in 20 priority entities identified for support
with the implementation of the internal audit framework and guidelines.
The Risk Management Support unit provided support for the implementation of the revised Risk Management Framework.
A number of officials (744) were trained on the revised Public Sector Risk Management Framework. In addition, 376
officials obtained the Certificate of Competency in Risk Management, an e-learning course offered by the unit. There were
delays with the implementation of the Learnership. However, negotiations with other potential funders are underway.
The Capacity Building unit continued to support efforts for building a pool of financial management skills through
the Chartered Accountancy Academy. In the public sector 15 participants were put through the support programme
conducted in partnership with the University of Pretoria. Three metros were identified as primary sites for the extension
of the skills building programme. The participants achieved a pass rate of 62.5 per cent. The unit also finalised the donor-
funded Financial Management Improvement Programme, delivering 12 projects as planned. In support of the strategy to
address financial management capacity constraints, the unit surveyed 96 government entities and developed a strategy
to address the identified problems.
The Governance Monitoring and Compliance submitted reports to the Standing Committee on Public Accounts and to
the Standing Committee on Finance on progress made with the improvement of financial management in terms of the
financial management capability maturity model as planned. The submission of the Public Finance Management Bill to
Cabinet was deferred pending supply chain management reforms.
The MFMA Implementation unit continued to support municipalities with implementing the MFMA, including hosting
quarterly meetings for municipalities. In addition, 30 new monitoring indicators were instituted to ensure effective
monitoring and reporting. A series of guideline documents have been developed to assist municipalities to comply with
the legislation. The unit is also consulting with relevant stakeholders on the draft financial misconduct regulations.
The unit also hosted an asset management seminar attended by 594 officials from all municipalities. The seminar provided
diagnostic tools and solutions for challenges related to asset management in municipalities.
The Specialised Audit Services unit conducted 20 investigations into supply chain management practices. Further, the unit
developed discussed fraud detection guidelines for supply chain management processes with law enforcement agencies.
NT AR 10-11_10.indd 66 2011/08/17 10:02 AM

67
Nat
iona
l Tre
asur
y A
nnua
l Rep
ort 2
010/
11
Programme 5 - Financial Accounting and Reporting
PROGRAmmE 5FiNaNCial aCCouNtiNG aND reportiNG - continued
SERV
ICE
dEl
IVER
y A
ChIE
VEm
ENTS
prog
ram
me
5: F
inan
cial
acc
ount
ing
and
repo
rtin
g
Mea
sura
ble
obje
ctiv
e: T
o fa
cilit
ate
acco
unta
bilit
y, g
over
nanc
e an
d ov
ersi
ght b
y pr
omot
ing
tran
spar
ent,
econ
omic
, effi
cien
t and
effe
ctiv
e m
anag
emen
t in
resp
ect
of re
venu
e, e
xpen
ditu
re, a
sset
s an
d lia
bilit
ies
in th
e p
ublic
sec
tor
subp
rogr
amm
eo
utpu
tM
easu
re /
indi
cato
ra
ctua
l per
form
ance
aga
inst
targ
etta
rget
act
ual
Tech
nica
l Sup
port
Serv
ices
Dev
elop
an
annu
al fi
nanc
ial
stat
emen
ts re
port
ing
pack
for n
atio
nal a
nd p
rovi
ncia
l
depa
rtm
ents
Tim
eous
pub
licat
ion
2011
/12
repo
rtin
g fra
mew
ork
publ
ishe
d by
31
Mar
ch 2
011
Publ
ishe
d by
31
Mar
ch 2
011
and
supp
ort
prov
ided
dur
ing
impl
emen
tatio
n as
wel
l as
durin
g th
e ye
ar e
nd
Dev
elop
acc
ount
ing
man
uals
for
GRA
P st
anda
rds
Tim
eous
pub
licat
ion
31 M
arch
201
1 G
RAP
stan
dard
s w
ere
deve
lope
d by
the
end
of F
ebru
ary.
The
fina
l ver
sion
inco
rpor
atin
g
com
men
ts fr
om e
xter
nal i
nter
este
d pa
rtie
s is
sche
dule
d fo
r pub
licat
ion
by th
e en
d of
June
.Co
ntrib
ute
tow
ards
deve
lopi
ng o
f loc
al a
nd
inte
rnat
iona
l sta
ndar
ds o
n
acco
untin
g, a
uditi
ng a
nd ri
sk
man
agem
ent
Att
enda
nce
at m
eetin
gs a
nd
repo
rts
prod
uced
All
IPSA
SB m
eetin
gs a
tten
ded
and
repo
rts
subm
itted
with
in
7 da
ys o
f att
enda
nce
Thre
e m
eetin
gs w
ere
atte
nded
and
repo
rts
subm
itted
. The
Feb
ruar
y m
eetin
g co
uld
not
be a
tten
ded
due
to u
nfor
esee
n ci
rcum
stan
ces
Perc
enta
ge o
f com
men
ts
acce
pted
by
Inte
rnat
iona
l
Publ
ic S
ecto
r Acc
ount
ing
Stan
dard
s Bo
ard
(IPSA
SB)
50%
In
puts
wer
e m
ade
in re
spec
t of 1
00%
of
requ
ests
mad
e to
the
NT.
Com
men
ts a
re s
till
bein
g co
nsid
ered
by
the
IPSA
SB a
nd A
SB, b
ut
no in
cide
nts
of re
ject
ed in
puts
are
kno
wn
at
this
sta
geA
lign
the
Cash
to A
ccru
al
Impl
emen
tatio
n Pl
an w
ith th
e
IFM
S ro
ll-ou
t pla
n
Mon
itor i
mpl
emen
tatio
n of
the
IFM
S ro
ll-ou
t pla
n
On-
goin
g m
onito
ring,
refin
emen
t and
impl
emen
tatio
n
Upd
ated
the
stra
tegy
bas
ed o
n ne
w G
AP
anal
ysis
. Id
entifi
ed a
ccou
ntin
g is
sues
to b
e
addr
esse
d &
prep
ared
acc
rual
acc
ount
ing
polic
ies
iden
tifyi
ng w
ork
to b
e do
ne in
the
tran
sitio
n ph
ase
Acc
ount
ing
Supp
ort a
nd
Repo
rtin
g
Mon
thly
sta
tem
ents
of a
ctua
l
reve
nue
and
expe
nditu
re fo
r
the
Nat
iona
l Rev
enue
Fun
d
Tim
eous
pub
licat
ion
of
accu
rate
repo
rts
Last
wor
king
day
of e
ach
mon
th
All
the
repo
rts
done
and
pub
lishe
d on
tim
e
with
out a
ny e
rror
s
NT AR 10-11_10.indd 67 2011/08/17 10:02 AM

Nat
iona
l Tre
asur
y A
nnua
l Rep
ort 2
010/
11
68
Programme 5 - Financial Accounting and Reporting
PROGRAmmE 5FiNaNCial aCCouNtiNG aND reportiNG - continued
Mea
sura
ble
obje
ctiv
e: T
o fa
cilit
ate
acco
unta
bilit
y, g
over
nanc
e an
d ov
ersi
ght b
y pr
omot
ing
tran
spar
ent,
econ
omic
, effi
cien
t and
effe
ctiv
e m
anag
emen
t in
resp
ect
of re
venu
e, e
xpen
ditu
re, a
sset
s an
d lia
bilit
ies
in th
e pu
blic
sec
tor.
subp
rogr
amm
eo
utpu
tM
easu
re /
indi
cato
ra
ctua
l per
form
ance
aga
inst
targ
etta
r get
ac t
ual
Acc
ount
ing
Supp
ort a
nd
Repo
rtin
g
P ubl
ish c
onso
lidat
ed a
nnua
l
finan
cial
stat
emen
ts fo
r nat
iona
l
depa
rtm
ents
, con
solid
ated
annu
al fi
nanc
ial i
nfor
mat
ion
for
publ
ic e
ntiti
es a
nd p
ublic
atio
n
of a
nnua
l fina
ncia
l sta
tem
ents
for t
he R
DP
Fund
Tim
eous
tabl
ing
in P
arlia
men
t 31
Oct
ober
201
0 Co
nsol
idat
ions
com
plet
ed a
nd p
rese
nted
on
time
S upp
ort t
o pr
ovin
cial
trea
surie
s fo
r pre
para
tion
of p
rovi
ncia
l con
solid
ated
finan
cial
sta
tem
ents
, pro
vinc
ial
reve
nue
fund
sta
tem
ents
and
impl
emen
tatio
n of
GRA
P
stan
dard
s
Num
ber o
f tra
inee
s 67
2 tr
aine
es in
pro
vinc
ial
trea
surie
s, m
unic
ipal
ities
and
publ
ic e
ntiti
es
1 02
4 tr
aine
es tr
aine
d
Inte
rnal
Aud
it Su
ppor
tSu
ppor
t im
plem
enta
tion
of
audi
t com
mitt
ee g
uide
lines
Num
ber o
f wor
ksho
ps
70 w
orks
hops
W
orks
hops
wer
e ab
ando
ned
beca
use
the
need
had
been
redu
ced,
as m
ost a
udit
com
mitt
ees
had
been
trai
ned
in th
e pr
evio
us y
ear. T
rain
ing
occu
rred
on a
nee
ds b
asis
and
10 a
udit
com
mitt
ees w
ere
train
ed
Cond
uct i
nter
nal a
udit
revi
ews
at m
unic
ipal
ities
Num
ber o
f rev
iew
s
com
plet
ed
26 m
unic
ipal
ities
31 M
arch
201
29 re
view
s w
ere
cond
ucte
d fo
r mun
icip
aliti
es
Repo
rt o
n th
e st
atus
of
inte
rnal
aud
iting
in n
atio
nal
and
prov
inci
al d
epar
tmen
ts
and
in m
unic
ipal
ities
Tim
eous
pro
duct
ion
of
repo
rts
Janu
ary
2011
Pu
blis
hed
in Ja
nuar
y 20
11
SERV
ICE
dEl
IVER
y A
ChIE
VEm
ENTS
prog
ram
me
5: F
inan
cial
acc
ount
ing
and
repo
rtin
g - C
ontin
ued
NT AR 10-11_10.indd 68 2011/08/17 10:02 AM

69
Nat
iona
l Tre
asur
y A
nnua
l Rep
ort 2
010/
11
Programme 5 - Financial Accounting and Reporting
PROGRAmmE 5FiNaNCial aCCouNtiNG aND reportiNG - continued
Supp
ort f
or th
e ro
ll ou
t of t
he
Inte
rnal
Aud
it Fr
amew
ork
and
Gui
delin
es
Num
ber o
f tra
inee
s 1
900
trai
nees
(th
e ta
rget
was
refle
cted
inco
rrec
tly a
nd
is a
men
ded
in th
e 20
11/1
4
Stra
tegi
c Pl
an)
The
mas
s tr
aini
ng o
f offi
cial
s ha
s be
en d
e-
emph
asis
ed in
favo
ur o
f tar
gete
d su
ppor
t.
Offi
cial
s w
ere
trai
ned
in 2
0 pr
iorit
y en
titie
s,
whi
ch w
as th
e ta
rget
env
isag
edRi
sk M
anag
emen
t
Supp
ort
Supp
ort f
or th
e ro
ll ou
t
of th
e Pu
blic
Sec
tor R
isk
Man
agem
ent F
ram
ewor
k
Num
ber o
f tra
inee
s 60
0 tr
aine
es
744
offici
als
wer
e tr
aine
d on
the
revi
sed
Publ
ic S
ecto
r Ris
k M
anag
emen
t Fra
mew
ork
Del
iver
risk
man
agem
ent
trai
ning
Num
ber o
f offi
cial
s ob
tain
ing
the
Cert
ifica
te o
f Com
pete
ncy
in R
isk
Man
agem
ent p
er th
e
e-Le
arni
ng M
odul
e
200
offici
als
376
offici
als
com
plet
ed th
e co
urse
Risk
Man
agem
ent L
earn
ersh
ip
(RM
L) im
plem
ente
d
Num
ber o
f lea
rner
s in
the
SAQ
A a
ccre
dite
d pr
ogra
mm
e
15 le
arne
rs
All
prep
arat
ions
for t
he ro
ll ou
t of t
he c
ours
e
have
bee
n pu
t in
plac
e. D
ue to
fund
ing
cons
trai
nts
the
Lear
ners
hip
was
del
ayed
.
Neg
otia
tions
with
oth
er p
oten
tial f
unde
rs
unde
rway
Dev
elop
a ri
sk m
anag
emen
t
mod
ellin
g to
ol
Proj
ect p
rogr
ess
Dev
elop
the
mod
ellin
g to
ol
by 3
1 M
arch
201
1
The
tool
was
dev
elop
ed a
nd w
as p
ilote
d in
two
entit
ies
Capa
city
Bui
ldin
gIm
plem
enta
tion
of a
fina
ncia
l
man
agem
ent c
apac
ity
build
ing
mod
el
Dev
elop
a s
trat
egy
to a
ddre
ss
finan
cial
man
agem
ent s
taff
shor
tage
s
June
201
0 Im
plem
ente
d by
30
June
201
0
Dev
elop
a fi
nanc
ial
man
agem
ent c
apac
ity
build
ing
stra
tegy
July
201
0St
rate
gy d
evel
oped
and
con
sulte
d w
ith
stak
ehol
ders
Repo
rts
subm
itted
to
depa
rtm
ents
refle
ctin
g th
e
iden
tified
ski
lls g
aps
Repo
rts
to 9
6 de
part
men
ts
surv
eyed
by
Mar
ch 2
011
96 d
epar
tmen
ts s
urve
yed
Aca
dem
ic s
uppo
rt
prog
ram
me
for C
hart
ered
Acc
ount
ants
Aca
dem
y (C
AA
)
and
othe
r acc
ount
ants
in
gove
rnm
ent
Num
ber o
f par
ticip
ants
15
par
ticip
ants
15
par
ticip
ants
in th
e pr
ogra
mm
e
NT AR 10-11_10.indd 69 2011/08/17 10:02 AM
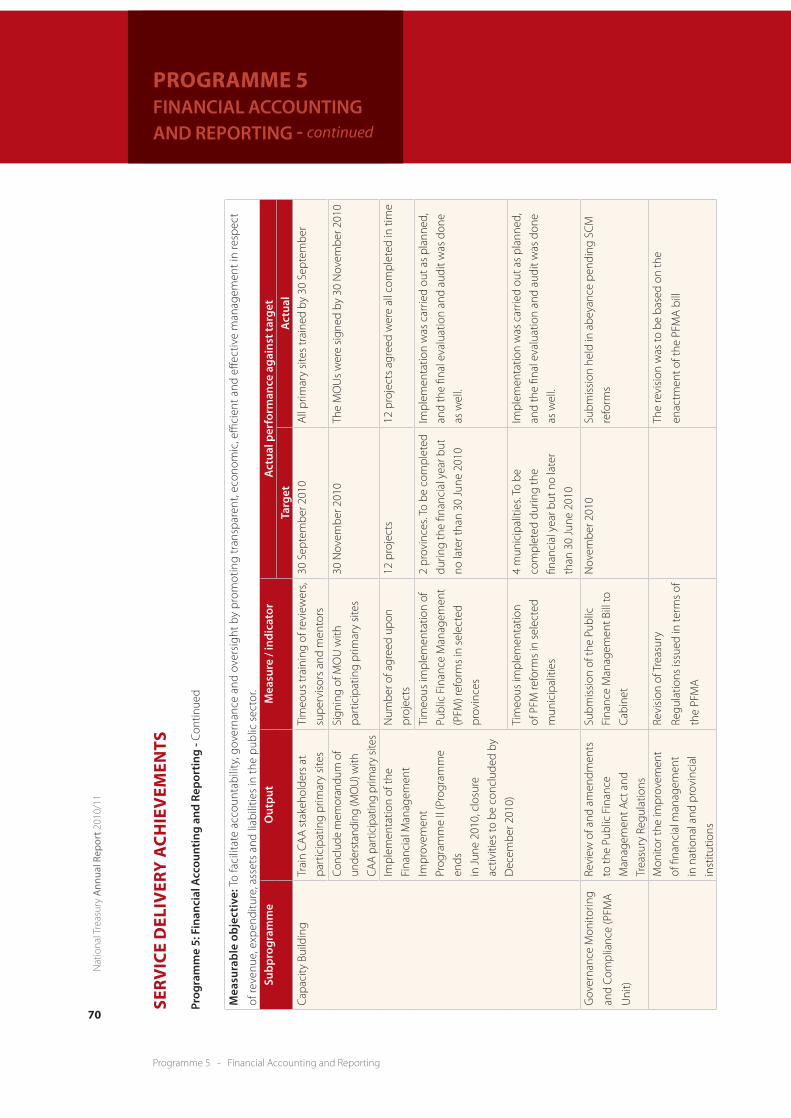
Nat
iona
l Tre
asur
y A
nnua
l Rep
ort 2
010/
11
70
Programme 5 - Financial Accounting and Reporting
PROGRAmmE 5FiNaNCial aCCouNtiNG aND reportiNG - continued
SERV
ICE
dEl
IVER
y A
ChIE
VEm
ENTS
prog
ram
me
5: F
inan
cial
acc
ount
ing
and
repo
rtin
g - C
ontin
ued
Mea
sura
ble
obje
ctiv
e: T
o fa
cilit
ate
acco
unta
bilit
y, g
over
nanc
e an
d ov
ersi
ght b
y pr
omot
ing
tran
spar
ent,
econ
omic
, effi
cien
t and
effe
ctiv
e m
anag
emen
t in
resp
ect
of re
venu
e, e
xpen
ditu
re, a
sset
s an
d lia
bilit
ies
in th
e pu
blic
sec
tor.
subp
rogr
amm
eo
utpu
tM
easu
re /
indi
cato
ra
ctua
l per
form
ance
aga
inst
targ
etta
rget
act
ual
Capa
city
Bui
ldin
gTr
ain
CA
A s
take
hold
ers
at
part
icip
atin
g pr
imar
y si
tes
Tim
eous
trai
ning
of r
evie
wer
s,
supe
rvis
ors
and
men
tors
30 S
epte
mbe
r 201
0A
ll pr
imar
y si
tes
trai
ned
by 3
0 Se
ptem
ber
Conc
lude
mem
oran
dum
of
unde
rsta
ndin
g (M
OU
) with
CAA
part
icip
atin
g pr
imar
y sit
es
Sign
ing
of M
OU
with
part
icip
atin
g pr
imar
y si
tes
30 N
ovem
ber 2
010
The
MO
Us
wer
e si
gned
by
30 N
ovem
ber 2
010
Impl
emen
tatio
n of
the
Fina
ncia
l Man
agem
ent
Impr
ovem
ent
Prog
ram
me
II (P
rogr
amm
e
ends
in Ju
ne 2
010,
clo
sure
activ
ities
to b
e co
nclu
ded
by
Dec
embe
r 201
0)
Num
ber o
f agr
eed
upon
proj
ects
12 p
roje
cts
12 p
roje
cts
agre
ed w
ere
all c
ompl
eted
in ti
me
Tim
eous
impl
emen
tatio
n of
Publ
ic F
inan
ce M
anag
emen
t
(PFM
) ref
orm
s in
sel
ecte
d
prov
ince
s
2 pr
ovin
ces.
To b
e co
mpl
eted
durin
g th
e fin
anci
al y
ear b
ut
no la
ter t
han
30 Ju
ne 2
010
Impl
emen
tatio
n w
as c
arrie
d ou
t as
plan
ned,
and
the
final
eva
luat
ion
and
audi
t was
don
e
as w
ell.
Tim
eous
impl
emen
tatio
n
of P
FM re
form
s in
sel
ecte
d
mun
icip
aliti
es
4 m
unic
ipal
ities
. To
be
com
plet
ed d
urin
g th
e
finan
cial
yea
r but
no
late
r
than
30
June
201
0
Impl
emen
tatio
n w
as c
arrie
d ou
t as
plan
ned,
and
the
final
eva
luat
ion
and
audi
t was
don
e
as w
ell.
Gov
erna
nce
Mon
itorin
g
and
Com
plia
nce
(PFM
A
Uni
t)
Revi
ew o
f and
am
endm
ents
to th
e Pu
blic
Fin
ance
Man
agem
ent A
ct a
nd
Trea
sury
Reg
ulat
ions
Subm
issi
on o
f the
Pub
lic
Fina
nce
Man
agem
ent B
ill to
Cabi
net
Nov
embe
r 201
0Su
bmis
sion
hel
d in
abe
yanc
e pe
ndin
g SC
M
refo
rms
Mon
itor t
he im
prov
emen
t
of fi
nanc
ial m
anag
emen
t
in n
atio
nal a
nd p
rovi
ncia
l
inst
itutio
ns
Revi
sion
of T
reas
ury
Regu
latio
ns is
sued
in te
rms
of
the
PFM
A
The
revi
sion
was
to b
e ba
sed
on th
e
enac
tmen
t of t
he P
FMA
bill
NT AR 10-11_10.indd 70 2011/08/17 10:02 AM

71
Nat
iona
l Tre
asur
y A
nnua
l Rep
ort 2
010/
11
Programme 5 - Financial Accounting and Reporting
PROGRAmmE 5FiNaNCial aCCouNtiNG aND reportiNG - continued
Mea
sura
ble
obje
ctiv
e: T
o fa
cilit
ate
acco
unta
bilit
y, g
over
nanc
e an
d ov
ersi
ght b
y pr
omot
ing
tran
spar
ent,
econ
omic
, effi
cien
t and
effe
ctiv
e m
anag
emen
t in
resp
ect
of re
venu
e, e
xpen
ditu
re, a
sset
s an
d lia
bilit
ies
in th
e pu
blic
sec
tor.
subp
rogr
amm
eo
utpu
tM
easu
re /
indi
cato
ra
ctua
l per
form
ance
aga
inst
targ
etta
rget
act
ual
Capa
city
Bui
ldin
gTr
ain
CA
A s
take
hold
ers
at
part
icip
atin
g pr
imar
y si
tes
Tim
eous
trai
ning
of r
evie
wer
s,
supe
rvis
ors
and
men
tors
30 S
epte
mbe
r 201
0A
ll pr
imar
y si
tes
trai
ned
by 3
0 Se
ptem
ber
Conc
lude
mem
oran
dum
of
unde
rsta
ndin
g (M
OU
) with
CAA
part
icip
atin
g pr
imar
y sit
es
Sign
ing
of M
OU
with
part
icip
atin
g pr
imar
y si
tes
30 N
ovem
ber 2
010
The
MO
Us
wer
e si
gned
by
30 N
ovem
ber 2
010
Impl
emen
tatio
n of
the
Fina
ncia
l Man
agem
ent
Impr
ovem
ent
Prog
ram
me
II (P
rogr
amm
e
ends
in Ju
ne 2
010,
clo
sure
activ
ities
to b
e co
nclu
ded
by
Dec
embe
r 201
0)
Num
ber o
f agr
eed
upon
proj
ects
12 p
roje
cts
12 p
roje
cts
agre
ed w
ere
all c
ompl
eted
in ti
me
Tim
eous
impl
emen
tatio
n of
Publ
ic F
inan
ce M
anag
emen
t
(PFM
) ref
orm
s in
sel
ecte
d
prov
ince
s
2 pr
ovin
ces.
To b
e co
mpl
eted
durin
g th
e fin
anci
al y
ear b
ut
no la
ter t
han
30 Ju
ne 2
010
Impl
emen
tatio
n w
as c
arrie
d ou
t as
plan
ned,
and
the
final
eva
luat
ion
and
audi
t was
don
e
as w
ell.
Tim
eous
impl
emen
tatio
n
of P
FM re
form
s in
sel
ecte
d
mun
icip
aliti
es
4 m
unic
ipal
ities
. To
be
com
plet
ed d
urin
g th
e
finan
cial
yea
r but
no
late
r
than
30
June
201
0
Impl
emen
tatio
n w
as c
arrie
d ou
t as
plan
ned,
and
the
final
eva
luat
ion
and
audi
t was
don
e
as w
ell.
Gov
erna
nce
Mon
itorin
g
and
Com
plia
nce
(PFM
A
Uni
t)
Revi
ew o
f and
am
endm
ents
to th
e Pu
blic
Fin
ance
Man
agem
ent A
ct a
nd
Trea
sury
Reg
ulat
ions
Subm
issi
on o
f the
Pub
lic
Fina
nce
Man
agem
ent B
ill to
Cabi
net
Nov
embe
r 201
0Su
bmis
sion
hel
d in
abe
yanc
e pe
ndin
g SC
M
refo
rms
Mon
itor t
he im
prov
emen
t
of fi
nanc
ial m
anag
emen
t
in n
atio
nal a
nd p
rovi
ncia
l
inst
itutio
ns
Revi
sion
of T
reas
ury
Regu
latio
ns is
sued
in te
rms
of
the
PFM
A
The
revi
sion
was
to b
e ba
sed
on th
e
enac
tmen
t of t
he P
FMA
bill
Repo
rts
to S
tand
ing
Com
mitt
ee o
n Pu
blic
Acc
ount
s an
d to
the
Stan
ding
Com
mitt
ee o
n Fi
nanc
e on
prog
ress
mad
e w
ith th
e
impr
ovem
ent o
f fina
ncia
l
man
agem
ent i
n te
rms
of
the
finan
cial
man
agem
ent
capa
bilit
y m
atur
ity m
odel
Aug
ust 2
010
Repo
rts
subm
itted
to th
e co
mm
ittee
s as
requ
ired
Repo
rt to
Cab
inet
on
the
audi
t out
com
es o
f nat
iona
l
and
prov
inci
al P
FMA
com
plia
nt in
stitu
tions
Nov
embe
r 201
0 Ca
bine
t Mem
oran
dum
on
Aud
it O
utco
mes
and
tabl
ing
of a
nnua
l rep
orts
don
e by
due
date
MFM
A Im
plem
enta
tion
Enha
nce
coor
dina
tion
acro
ss
gove
rnm
ent f
or e
ffect
ive
impl
emen
tatio
n of
MFM
A
An
agen
da th
at e
nsur
es
alig
nmen
t of a
ctiv
ities
of
depa
rtm
ents
con
sist
ent w
ith
agre
ed p
riorit
ies
Qua
rter
ly m
eetin
gs c
onve
ned
and
reso
lutio
ns im
plem
ente
d.
Follo
w u
p vi
sits
to 4
pro
vinc
es
and
10 m
unic
ipal
ities
Hos
ted
4 qu
arte
rly M
FMA
Co-
ordi
natio
n
mee
tings
and
und
erto
ok 1
6 fo
llow
up
visi
ts to
16 m
unic
ipal
ities
Ass
ess
finan
cial
man
agem
ent
skill
s in
mun
icip
al b
udge
t and
Trea
sury
offi
ces
Repo
rts
prod
uced
on
finan
cial
man
agem
ent s
kills
in
mun
icip
aliti
es
Nov
embe
r 201
0 Re
port
on
the
Budg
et a
nd T
reas
ury
Offi
ce
skill
s su
rvey
fina
lised
for 2
83 m
unic
ipal
ities
by
Nov
embe
r 201
0
Resp
ond
to e
nqui
ries,
com
men
ts, a
dvic
e
and
supp
ort t
owar
ds
impl
emen
tatio
n of
the
MFM
A
Tim
eous
resp
onse
s Fi
nalis
e re
spon
ses
with
in 7
days
All
resp
onse
s fin
alis
ed w
ithin
7 d
ays
Refin
emen
t of fi
nanc
ial
man
agem
ent i
ndic
ator
s fo
r
effec
tive
mon
itorin
g an
d
repo
rtin
g
Repo
rt p
rodu
ced
on
impl
emen
tatio
n
Mar
ch 2
011
New
MFM
A m
onito
ring
indi
cato
rs c
onsi
stin
g
of 3
0 in
dica
tors
hav
e be
en p
repa
red
and
the
repo
rt p
rodu
ced
by d
ue d
ate
Revi
ew o
f MFM
A re
gula
tions
Ti
meo
us p
ublic
atio
n of
revi
ewed
regu
latio
ns
Dra
ft re
gula
tions
pub
lishe
d
by M
arch
201
1
Dev
elop
ed a
nd d
raft
ed F
inan
cial
Mis
cond
uct
regu
latio
ns
Stat
e La
w a
dvis
or in
puts
obt
aine
d an
d
awai
ting
final
isat
ion
of M
SA re
gula
tions
curr
ently
bef
ore
Parli
amen
t
NT AR 10-11_10.indd 71 2011/08/17 10:02 AM

Nat
iona
l Tre
asur
y A
nnua
l Rep
ort 2
010/
11
72
Programme 5 - Financial Accounting and Reporting
PROGRAmmE 5FiNaNCial aCCouNtiNG aND reportiNG - continued
SERV
ICE
dEl
IVER
y A
ChIE
VEm
ENTS
prog
ram
me
5: F
inan
cial
acc
ount
ing
and
repo
rtin
g - C
ontin
ued
Mea
sura
ble
obje
ctiv
e: T
o fa
cilit
ate
acco
unta
bilit
y, g
over
nanc
e an
d ov
ersi
ght b
y pr
omot
ing
tran
spar
ent,
econ
omic
, effi
cien
t and
effe
ctiv
e m
anag
emen
t in
resp
ect
of re
venu
e, e
xpen
ditu
re, a
sset
s an
d lia
bilit
ies
in th
e pu
blic
sec
tor.
subp
rogr
amm
eo
utpu
tM
easu
re /
indi
cato
ra
ctua
l per
form
ance
aga
inst
targ
etta
rget
act
ual
MFM
A Im
plem
enta
tion
Dev
elop
sup
port
ing
guid
es/
tool
sTi
meo
us d
evel
opm
ent o
f gu
ides
/too
lsM
arch
201
1Fi
nalis
ed g
uide
in s
uppo
rt o
f the
Ass
et T
rans
fer
Regu
latio
ns, F
inan
cial
Rec
over
y M
odel
and
A
nnua
l Rep
ort T
empl
ate
Dev
elop
ed e
lect
roni
c in
terf
ace
for e
asy
com
pila
tion
and
aggr
egat
ion
of m
unic
ipal
de
part
men
tal i
nfor
mat
ion
into
the
annu
al re
port
Cost
ing
and
Cash
Man
agem
ent G
uide
s re
vise
dPr
ovin
cial
Ove
rsig
ht G
uide
on
mun
icip
al re
port
s fin
alise
d
Revi
ew a
nd re
spon
d to
re
ques
ts fo
r the
dev
elop
men
t of
fina
ncia
l rec
over
y pl
ans
Fina
ncia
l rec
over
y pl
ans
Dev
elop
ed re
cove
ry p
lans
is
sued
with
in 9
0 da
ys
All
reco
very
pla
n is
sues
wer
e ha
ndle
d w
ithin
45
days
of r
eque
st fo
r ass
ista
nce
Spec
ialis
ed A
udit
Serv
ices
Cust
omise
a P
erfo
rman
ce A
udit
met
hodo
logy
for s
peci
al a
udit
Tim
eous
dev
elop
men
t and
ap
prov
al o
f the
met
hodo
logy
Apr
il 20
10M
etho
dolo
gy d
evel
oped
and
impl
emen
ted
Cond
uct p
erfo
rman
ce a
udits
in
targ
eted
ent
ities
Num
ber o
f ent
ities
targ
eted
4In
vest
igat
ions
wer
e do
ne a
t 20
inst
itutio
ns.
Dev
elop
frau
d de
tect
ion
guid
elin
es fo
r sup
ply
chai
n m
anag
emen
t pro
cess
es
Tim
eous
dev
elop
men
t of
guid
elin
esN
ovem
ber 2
010
Dev
elop
ed g
uide
lines
and
con
duct
ed in
form
atio
n se
ssio
ns m
ainl
y w
ith p
olic
e in
vest
igat
ors a
nd
pros
ecut
ors.
A ne
w in
stru
ctio
n no
te w
as fi
nalis
ed
and
will
be
impl
emen
ted
in th
e 20
11/2
012
finan
cial
ye
arPr
ovid
e fra
ud a
war
enes
s an
d in
vest
igat
ive
capa
city
to
depa
rtm
ents
Num
ber o
f wor
ksho
ps
cond
ucte
d on
the
fraud
pr
even
tion
guid
elin
es
-Co
nduc
ted
wor
ksho
ps w
ith th
e po
lice
and
the
NPA
to e
nsur
e an
und
erst
andi
ng o
f the
PFM
A
and
its p
resc
ripts
Num
ber o
f inv
estig
atio
ns
cond
ucte
d4
Ass
iste
d po
lice
in n
umer
ous
inve
stig
atio
ns,
man
y re
sulti
ng in
suc
cess
ful o
utco
mes
NT AR 10-11_10.indd 72 2011/08/17 10:02 AM

73
Nat
iona
l Tre
asur
y A
nnua
l Rep
ort 2
010/
11
Programme 5 - Financial Accounting and Reporting
PROGRAmmE 5FiNaNCial aCCouNtiNG aND reportiNG - continued
PROGRAmmE 6ECONOmIC POlICy ANd INTERNATIONAl FINANCIAl RElATIONS
NT AR 10-11_10.indd 73 2011/08/17 10:02 AM

Nat
iona
l Tre
asur
y A
nnua
l Rep
ort 2
010/
11
74
Programme 6 - Economic Policy and International Financial Relations
PROGRAmmE 6eCoNoMiC poliCy aND iNterNatioNal FiNaNCial relatioNs
purpose: Provide specialist policy analysis and advisory services in macroeconomics, microeconomics, tax policy, financial
and banking sector policy, regulatory reform, regional integration and international financial relations..
Measurable objective: The programme provides advice on policy to promote growth, employment, macroeconomic
stability and regional integration.
There are five subprogrammes:
• Management and Research funds the department’s economic research programme, including international research
on growth, and the promotion of local research capacity.
• Financial Sector Policy provides financial sector policy advice and is responsible for related legislation, regulations and
the regulatory framework. Key strategic focus areas include retirement reform, financial sector transformation, and
improvements to the financial regulatory system to maintain financial stability.
• Tax Policy provides advice on the formulation of tax policy, is responsible for drafting tax legislation, revenue analysis
and forecasting.
• International and Regional Economic Policy focuses on improving South Africa’s participation in international economic
institutions and debates. It facilitates the deepening of South Africa’s role in regional integration (Southern African
Development Community and Southern African Customs Union) and in promoting economic development via African
institutions like the African Development Bank. Outside of Africa, the division facilitates South Africa’s participation in
the IMF, World Bank and G20.
• Economic Policy provides macroeconomic and microeconomic analysis and policy advice, economic forecasting,
regulatory assessment and policy review for the annual budget and other government processes.
SERVICE dElIVERy ObJECTIVES ANd INdICATORS
reCeNt outputs
Programme 6 covers the functions of three National Treasury divisions: Economic Policy, Tax and Financial Sector Policy, and
International and Regional Economic Policy. These divisions coordinate the National Treasury’s interaction with:
• TheReserveBankontheframeworkandconductofmacroeconomicpolicy,supervisionandregulationofbanking,
and exchange controls.
• TheFinancialServicesBoardontheregulationofnon-bankingfinancialservices.
• TheFinancialIntelligenceCentreonanti-money-launderingandcombatingthefinancingofterrorism.
• TheCooperativeBanksDevelopmentAgency,establishedaftertheproclamationoftheCooperativeBanksAct(40of
2007) on 1 August 2008.
Together with the Asset and Liability division, Economic Policy and Tax and Financial Sector Policy co-chair three standing
committees with the Reserve Bank on macroeconomics, financial regulation and financial markets, and prepare
recommendations for bilateral meetings between the Minister of Finance and the Governor of the Reserve Bank.
NT AR 10-11_10.indd 74 2011/08/17 10:02 AM

75
Nat
iona
l Tre
asur
y A
nnua
l Rep
ort 2
010/
11
Programme 6 - Economic Policy and International Financial Relations
PROGRAmmE 6eCoNoMiC poliCy aND iNterNatioNal FiNaNCial relatioNs - continued
Economic Policy
Economic Policy conducted research and also provided advice on and co-ordinated growth-enhancing policies. Areas of
work included:
• Assessmentofpoliciestoachievehighersustainableeconomicgrowthandjobcreation.
• DraftingSouthAfrica’scontributiontotheG20MutualAssessmentProcessandFrameworkforStrong,Sustainableand
Balanced growth.
• Analysis of exchange rate trends, impact on the economy andpolicy options for amore stable and competitive
exchange rate.
• Analysisandmonitoringofcapitalflowsandcapitalaccountmanagementissues.
• EvaluationoftheoptimallevelofforeignexchangereservesfortheSouthAfricaneconomy.
• Inputs to theEconomicSectorsandEmploymentclusteronOutcome4–Decentemployment through inclusive
growth.
• Researchintothedriversofcommoditypricevolatilityandmitigatingpolicies.
• PublicationofdiscussionpaperentitledConfrontingyouthunemployment:policyoptions forSouthAfrica,which
forms the basis for debate with social partners on the proposed youth employment incentive.
• Researchintosingle-payerandmultiplepayerNationalHealthInsurancemodels.
• Daily,weekly,monthlyandquarterlymonitoringandreportingofeconomicdevelopments.
The division also engaged with a number of international organisations, including the IMF, World Bank, and the
Organisation for Economic Cooperation and Development (OECD).
Together with the Public Finance, Tax Policy and Asset and Liability divisions, Economic Policy assessed and advised on
departmental policy proposals and initiatives of state-owned enterprises.
The quarterly forecast, a key output of the Modelling and Forecasting unit, feeds into the budget framework and is
accompanied by other analysis provided to policy makers. Studies conducted in the review period include estimating the
economic impact of National Health Insurance, developing climate change economic modeling capacity and analysis of
the effect of carbon taxes, and modeling on employment scenarios.
The economic forecast for the medium-term expenditure framework and the macroeconomic chapter of the Medium
Term Budget Policy Statement (MTBPS) and Budget Review are key outputs of the work of the division. The division monitors
various economic sectors. The methodology to calculate the structural budget balance and to enhance the accuracy of
tax forecasts continued to be improved upon. The division contributed two chapters to the 2011 Budget Review, on the
economic policy and outlook, and employment.
Tax and Financial Sector Policy
In the Tax Policy unit, work continued on environmental fiscal reform, and the possible use of taxes and incentives to deal
with environmental challenges such as climate change. A discussion paper titled “Reducing Greenhouse Emissions: The
Carbon Tax Option” was finalised and published in December 2010 for public comments. The unit also prepared the Tax
Laws Amendment Bill which was tabled in Paliament in September 2010.
NT AR 10-11_10.indd 75 2011/08/17 10:02 AM

Nat
iona
l Tre
asur
y A
nnua
l Rep
ort 2
010/
11
76
Programme 6 - Economic Policy and International Financial Relations
PROGRAmmE 6eCoNoMiC poliCy aND iNterNatioNal FiNaNCial relatioNs - continued
The publication “2010 Tax Statistics” was released during the year, as a joint project between the National Treasury and the
SA Revenue Service. This publication has been enhanced from the previous two publications in that the document and data
tables have been published electronically as well and this will make the data more accessible to researchers and analysts.
The Mineral and Petroleum Royalty Act was implemented on 01 April 2010. This has resulted in new revenue to the fiscus.
Tax treaties were concluded with Seychelles, Sweden, the United Kingdom and Kenya.
The Financial Sector Policy unit’s extensive work in response to the global financial crisis culminated in the publication of a
policy document containing proposals for financial sector regulatory reform entitled “A safer financial sector to serve South
Africa better”. This document is significant in that it sets out the road map in terms of which the National Treasury will fulfil
its obligation to ensure that a vibrant financial sector continues to serve the economy and that everyone is able to benefit
from, and have access to, reliable financial services.
The unit published two discussion documents entitled “The prudential regulation of foreign exposure for SA institutional
investors” and “A review framework for cross-border direct investment in South Africa, and developed two pieces of legislation
aimed at transforming the regulatory framework in the financial sector, namely the Financial Markets Bill and the Credit
Ratings Services Bill.
The unit also published Regulation 28 that gives effect to Section 36 (1) (bB) of the Pension Funds Act of 1956. The aim of this
regulation is to ensure that the savings South Africans contribute towards their retirement are invested in a prudent manner
that not only protects the retirement fund member, but is channelled in ways that achieve economic growth and development.
International and Regional Economic Policy
The International and Regional Economic Policy division manages South Africa’s relationship with multilateral institutions
such as the World Bank, International Monetary Fund (IMF) and African Development Bank (AfDB); it also ensures high-level
participation in key caucus groups such as the G-20, G-24 and BRICS for global coordination of economic and financial
policy issues, and is a leading player within regional economic groupings of SADC and SACU. The division also worked
closely with departments like DIRCO, DTI and the Presidency to coordinate the country’s international participation on
policy issues relating to G-20, African Union and the United Nations.
Following two SACU Summits and meetings of the SACU Council of Ministers, South Africa ensured that the review of
the SACU revenue-sharing formula was included in the new vision and mission of SACU, where revenue collected by the
customs arrangement will support regional growth and development. A study that was completed in January 2011 will
form the basis of the negotiations between member states.
South Africa’s investment in the African Development Bank was further enhanced with the election of a South African to
the permanent position on the Board of Directors of the Bank. The Collaborative Africa Budget Reform Initiative (CABRI)
actively strengthened its relationship with several regional and international institutions, such as the AfDB, Organisation
for Economic Cooperation and Development, the World Bank Institute and the IMF’s AfriTAC. Outputs by CABRI covered
work in good public financial governance, aid and fiscal relationship, health financing and programme budgeting.
Following intensive engagements with the World Bank an agreement was reached in December 2010 for the replenishment
of IDA16 without moving beyond the country’s burden share.
NT AR 10-11_10.indd 76 2011/08/17 10:02 AM

77
Nat
iona
l Tre
asur
y A
nnua
l Rep
ort 2
010/
11
Programme 6 - Economic Policy and International Financial Relations
PROGRAmmE 6eCoNoMiC poliCy aND iNterNatioNal FiNaNCial relatioNs - continued
SERV
ICE
dEl
IVER
y A
ChIE
VEm
ENTS
prog
ram
me
6: e
cono
mic
pol
icy
and
inte
rnat
iona
l Fin
anci
al r
elat
ions
Mea
sura
ble
obje
ctiv
e: T
he p
rogr
amm
e pr
ovid
es a
dvic
e on
pol
icy
to p
rom
ote
grow
th, e
mpl
oym
ent,
mac
roec
onom
ic s
tabi
lity
and
regi
onal
inte
grat
ion.
su
bpro
gram
me
out
put
Mea
sure
/ in
dica
tor
act
ual p
erfo
rman
ce a
gain
st ta
rget
targ
eta
ctua
lM
anag
emen
t and
Rese
arch
Publ
ish
and
prom
ote
econ
omic
rese
arch
rele
vant
to S
outh
Afri
ca
Num
ber o
f pap
ers
publ
ishe
d
Publ
icat
ion
of re
sear
ch p
aper
s or
disc
ussio
n do
cum
ents
on
econ
omic
grow
th, jo
b cr
eatio
n, v
ario
us
mic
roec
onom
ic st
udie
s, et
c. W
hile
mos
t pap
ers w
ill b
e pu
blish
ed b
y
acad
emic
s and
rese
arch
ers t
hrou
gh
the
Econ
omic
Res
earc
h of
Sou
ther
n
Afric
a in
itiat
ive
(ERS
A) a
nd C
entre
for
Rese
arch
into
Eco
nom
ics a
nd F
inan
ce
in S
outh
ern
Afric
a (C
REFS
A), s
elec
ted
pape
rs m
ay b
e pu
blish
ed b
y th
e
depa
rtm
ent d
irect
ly
ERSA
: 41
pape
rs p
ublis
hed.
CRE
FSA
: Pap
er o
n pr
uden
tial r
egul
atio
n of
fore
ign
expo
sure
for S
A in
stitu
tiona
l inv
esto
rs
publ
ishe
d
Dep
artm
enta
l pap
ers:
•AsaferfinancialsectortoserveSouthAfrica
bette
r
•Redu
cing
greenho
useem
issions:Thecarbo
ntax
optio
n
•Tw
opapersonsaving
svehiclesforhou
singand
educ
atio
n (p
rese
nted
at a
savi
ngs w
orks
hop
in
Sept
embe
r 201
0)
Fina
ncia
l Sec
tor
Polic
y
Fina
ncia
l sta
bilit
ySt
abili
ty o
f fina
ncia
l sys
tem
incl
udin
g fi
rst-
tier b
anks
Publ
ish p
ropo
sals
to im
prov
e
effec
tiven
ess o
f the
fina
ncia
l
regu
lato
ry sy
stem
in S
outh
Afric
a, ta
king
into
acc
ount
G20
reco
mm
enda
tions
Publ
ishe
d a
polic
y do
cum
ent c
onta
inin
g
prop
osal
s fo
r fina
ncia
l sec
tor r
egul
ator
y
refo
rm e
ntitl
ed A
saf
er fi
nanc
ial s
ecto
r to
serv
e
Sout
h A
frica
bet
ter w
ith th
e 20
11 B
udge
t
To fi
nalis
e th
e pr
uden
tial r
egul
ator
y re
gim
e
for f
orei
gn e
xpos
ure,
pub
lishe
d a
disc
ussi
on
docu
men
t ent
itled
The
pru
dent
ial r
egul
atio
n
of fo
reig
n ex
posu
re fo
r SA
inst
itutio
nal
inve
stor
s
NT AR 10-11_10.indd 77 2011/08/17 10:02 AM

Nat
iona
l Tre
asur
y A
nnua
l Rep
ort 2
010/
11
78
Programme 6 - Economic Policy and International Financial Relations
PROGRAmmE 6eCoNoMiC poliCy aND iNterNatioNal FiNaNCial relatioNs - continued
Mea
sura
ble
obje
ctiv
e: T
he p
rogr
amm
e pr
ovid
es a
dvic
e on
pol
icy
to p
rom
ote
grow
th, e
mpl
oym
ent,
mac
roec
onom
ic s
tabi
lity
and
regi
onal
inte
grat
ion.
su
bpro
gram
me
out
put
Mea
sure
/ in
dica
tor
act
ual p
erfo
rman
ce a
gain
st ta
rget
targ
eta
ctua
lFi
nanc
ial S
ecto
r
Polic
y
Fina
ncia
l sta
bilit
ySt
abili
ty o
f fina
ncia
l sys
tem
incl
udin
g fi
rst-
tier b
anks
Supp
ort fi
nanc
ial r
egul
ator
y
agen
cies
to e
nsur
e th
at th
ey
perf
orm
effe
ctiv
ely
in re
gula
ting
the
finan
cial
sec
tor
Dev
elop
ed tw
o pi
eces
of l
egis
latio
n ai
med
at
tran
sfor
min
g th
e re
gula
tory
fram
ewor
k in
the
finan
cial
sec
tor:
Fina
ncia
l Mar
kets
Bill
and
the
Cre
dit R
atin
gs S
ervi
ces
Bill
Seco
nd d
raft
of B
anks
Am
endm
ent B
ill, a
nd
regu
latio
ns, p
ublis
hed
for c
omm
ent o
n 31
Mar
ch 2
011
Nat
iona
l Tre
asur
y al
so le
d th
e Ba
sel
Prot
ect i
nteg
rity
of th
e
finan
cial
sys
tem
in S
outh
Afri
ca
Supp
ort t
he w
ork
of th
e Fi
nanc
ial
Inte
llige
nce
Cent
re to
ens
ure
effec
tive
impl
emen
tatio
n of
gove
rnm
ent-
wid
e st
rate
gy o
n A
nti
Mon
ey L
aund
erin
g /
Com
batin
g
the
Fina
ncin
g of
Ter
roris
m
Cont
inue
d to
att
end
inte
rnat
iona
l and
loca
l AM
L/C
FT m
eetin
gs to
geth
er w
ith th
e
Fina
ncia
l Int
ellig
ence
Cen
tre
Refo
rm th
e sy
stem
of
retir
emen
t fun
ding
, inc
ludi
ng
gove
rnan
ce re
form
s
(Joi
ntly
with
Pub
lic F
inan
ce –
Prog
ram
me
2)
Form
ulat
ion
of p
olic
y
fram
ewor
k an
d pr
ojec
t pla
n
Publ
icat
ion
of p
olic
y fra
mew
ork
for
retir
emen
t ref
orm
Part
ially
ach
ieve
d. F
irst d
raft
of A
ppro
ved
Fund
s Fr
amew
ork
(AFF
) pap
er fi
nalis
ed b
y
IDTT
Tas
k Te
am in
Dec
embe
r 201
0. A
FF
pape
r will
be
publ
ishe
d to
geth
er w
ith th
e
Cons
olid
ated
Gov
ernm
ent P
ositi
on P
aper
on
Soci
al S
ecur
ity a
nd R
etire
men
t Ref
orm
by
June
/Jul
y 20
11Pu
blis
h pr
opos
als
to im
prov
e
trus
tee
perf
orm
ance
ove
r
gove
rnan
ce o
f pen
sion
fund
s
Part
ially
ach
ieve
d. R
elea
sed
docu
men
t on
2011
Bud
get D
ay ti
tled
A s
afer
fina
ncia
l
sect
or to
ser
ve S
outh
Afri
ca b
ette
r lay
ing
out
broa
d pr
opos
als
on T
rust
ee e
duca
tion.
New
Regu
latio
n 28
als
o pr
ovid
es g
uidi
ng p
rinci
ples
in te
rms
of tr
uste
e co
nduc
t
SERV
ICE
dEl
IVER
y A
ChIE
VEm
ENTS
prog
ram
me
6: e
cono
mic
pol
icy
and
inte
rnat
iona
l Fin
anci
al r
elat
ions
- Co
ntin
ued
NT AR 10-11_10.indd 78 2011/08/17 10:02 AM

79
Nat
iona
l Tre
asur
y A
nnua
l Rep
ort 2
010/
11
Programme 6 - Economic Policy and International Financial Relations
PROGRAmmE 6eCoNoMiC poliCy aND iNterNatioNal FiNaNCial relatioNs - continued
Fina
lisat
ion
of p
ropo
sals
pub
lishe
d
in 2
010
Budg
et t
o up
date
Regu
latio
n 28
of t
he P
ensi
on F
und
Act
Fina
l Reg
ulat
ion
28 is
sued
on
Budg
et D
ay
2011
for i
mpl
emen
tatio
n in
July
201
1
Prom
ote
finan
cial
sec
tor
tran
sfor
mat
ion
and
acce
ss
Broa
dene
d an
d im
prov
ed
acce
ss
Fina
lise
resp
onse
of
gove
rnm
ent t
o Ba
nkin
g En
quiry
reco
mm
enda
tions
on
bank
char
ges
Bank
ing
Enqu
iry d
ashb
oard
to re
port
prog
ress
/clo
sure
has
bee
n dr
afte
d an
d is
with
bank
s, Co
mpe
titio
n Co
mm
issi
on a
nd S
ARB
(NPS
D) f
or c
omm
ent
Mon
itor i
mpl
emen
tatio
n of
the
Fina
ncia
l Sec
tor C
hart
er’s
tran
sfor
mat
ion
targ
ets
Ong
oing
par
ticip
atio
n in
wee
kly
Fina
ncia
l
Sect
or C
hart
er G
azet
ting
Com
mitt
ee m
eetin
gs
to ta
ke fo
rwar
d de
velo
pmen
t of F
inan
cial
Sect
or C
ode
with
revi
sed
acce
ss ta
rget
s. Th
e
draf
t cod
e is
exp
ecte
d in
May
201
1
Prom
ote
com
petit
ion
and
entr
y in
to fi
nanc
ial s
ecto
r
Entr
y of
sm
alle
r ban
ks
and
non-
bank
s, in
clud
ing
dedi
cate
d an
d co
-ope
rativ
e
bank
s
Tabl
e D
edic
ated
Ban
ks B
ill in
Parli
amen
t
The
feas
ibili
ty o
f sep
arat
e le
gisl
atio
n is
bei
ng
reco
nsid
ered
in v
iew
of t
he g
loba
l fin
anci
al
cris
isSu
ppor
t and
mon
itor
impl
emen
tatio
n of
the
Co-
oper
ativ
e Ba
nks
Act
Two
co-o
pera
tive
bank
s w
ere
licen
sed
in 2
011
Ong
oing
par
ticip
atio
n in
CBD
A b
oard
mee
tings
Tax
Polic
yTa
x pr
opos
als
and
reve
nue
fore
cast
s fo
r the
ann
ual
budg
et
Hig
h qu
ality
cha
pter
in th
e
annu
al B
udge
t Rev
iew
Publ
icat
ion
on B
udge
t Day
201
1Co
ntrib
uted
a h
igh
qual
ity c
hapt
er in
the
Budg
et R
evie
w ti
meo
usly
Inve
stig
ate
optio
ns to
pric
e
carb
on, a
car
bon
tax,
and
/or
emis
sion
s tr
adin
g
Miti
gate
the
impa
ct o
f
carb
on e
mis
sion
s an
d
addr
ess
conc
erns
rela
ting
to c
limat
e ch
ange
thro
ugh
envi
ronm
enta
l fisc
al re
form
Dra
ft p
olic
y pa
per o
n ca
rbon
pric
ing
Disc
ussio
n pa
per e
ntitl
ed “R
educ
ing
Gre
enho
use
Emiss
ions
: The
Car
bon
Tax
Opt
ion”
was
fina
lised
and
pub
lishe
d in
Dec
embe
r 201
0
for p
ublic
com
men
t
Prep
arat
ion
and
final
isatio
n of
car
bon
tax
wor
ksho
p w
hich
was
hel
d on
16t
h M
arch
201
1
Enga
ged
with
SA
RS a
nd in
dust
ry to
final
ise p
olic
y an
d co
mpl
etio
n of
legi
slativ
e
amen
dmen
ts to
effe
ct im
plem
enta
tion
of th
e ta
x
NT AR 10-11_10.indd 79 2011/08/17 10:02 AM

Nat
iona
l Tre
asur
y A
nnua
l Rep
ort 2
010/
11
80
Programme 6 - Economic Policy and International Financial Relations
PROGRAmmE 6eCoNoMiC poliCy aND iNterNatioNal FiNaNCial relatioNs - continued
Mea
sura
ble
obje
ctiv
e: T
he p
rogr
amm
e pr
ovid
es a
dvic
e on
pol
icy
to p
rom
ote
grow
th, e
mpl
oym
ent,
mac
roec
onom
ic s
tabi
lity
and
regi
onal
inte
grat
ion.
su
bpro
gram
me
out
put
Mea
sure
/ in
dica
tor
act
ual p
erfo
rman
ce a
gain
st ta
rget
targ
eta
ctua
lTa
x Po
licy
The
taxa
tion
of fi
nanc
ial
inst
rum
ents
, diff
eren
tiatin
g
debt
ver
sus
equi
ty, a
s w
ell
as li
miti
ng e
xces
sive
deb
t
dedu
ctio
ns
Revi
ew o
f str
ateg
y to
effec
tivel
y ta
x fin
anci
al
inst
rum
ents
, lim
it ta
x
avoi
danc
e an
d cr
eate
a
leve
l pla
ying
fiel
d in
the
tax
trea
tmen
t of d
ebt a
nd e
quity
Publ
ish
a di
scus
sion
doc
umen
t
to e
xplo
re o
ptio
ns d
ealin
g w
ith
the
tax
trea
tmen
t of fi
nanc
ial
inst
rum
ents
, car
ried
inte
rest
in
priv
ate
equi
ty tr
ansa
ctio
ns a
nd th
e
dedu
ctib
ility
of i
nter
est p
aym
ents
Not
ac
hiev
ed.
Dis
cuss
ion
docu
men
t to
be
com
plet
ed in
the
2011
/12
finan
cial
yea
r
Tax
ince
ntiv
es to
sup
port
indu
stria
l pol
icy
Fram
ewor
k to
resp
ond
to
vario
us re
ques
ts fo
r inc
entiv
es
and
othe
r gov
ernm
ent
supp
ort f
or la
rge
scal
e
inve
stm
ent p
roje
cts
Enga
ge th
e D
epar
tmen
t of T
rade
and
Indu
stry
and
the
Dep
artm
ents
of M
iner
als
and
Ener
gy to
add
ress
the
requ
est t
o su
ppor
t the
indu
stria
l pol
icy
stra
tegy
, min
eral
bene
ficia
tion
and
fuel
/en
ergy
sec
urity
Dra
ft re
gula
tions
com
plet
ed, p
ublis
hed
in
early
201
0
Com
plet
e th
e co
nver
sion
of
the
STC
regi
me
into
the
new
Div
iden
d Ta
x
Impl
emen
tatio
n of
new
Div
iden
d Ta
x
Sign
ing
of re
vise
d ta
x tr
eaty
prot
ocol
s
The
follo
win
g tr
eatie
s w
ere
sign
ed d
urin
g th
e
repo
rtin
g pe
riod:
Seyc
helle
s 04
Apr
il 20
10
Swed
en 0
7 Ju
ly 2
010
Uni
ted
King
dom
08
Nov
embe
r 201
0
Keny
a 26
Nov
embe
r 201
0D
eath
taxe
sRe
view
of a
ll de
ath
taxe
s fo
r
sim
plifi
catio
n an
d eq
uity
Dis
cuss
ions
to b
e he
ld; p
ossi
ble
disc
ussi
on d
ocum
ent
Esta
te d
uty
pape
r was
pre
sent
ed a
t a s
avin
gs
wor
ksho
p, a
nd a
dis
cuss
ion
pape
r com
plet
ed.
Dis
cuss
ion
pape
r to
be e
xpan
ded
into
a p
olic
y
pape
r in
next
fina
ncia
l yea
rTa
x le
gisl
atio
n an
d
amen
dmen
ts
Taxa
tion
Law
s A
men
dmen
t
Bill
Brie
f Com
mitt
ee b
y Ju
ne 2
010
Tabl
ed S
epte
mbe
r 201
0
SERV
ICE
dEl
IVER
y A
ChIE
VEm
ENTS
prog
ram
me
6: e
cono
mic
pol
icy
and
inte
rnat
iona
l Fin
anci
al r
elat
ions
- Co
ntin
ued
NT AR 10-11_10.indd 80 2011/08/17 10:02 AM

81
Nat
iona
l Tre
asur
y A
nnua
l Rep
ort 2
010/
11
Programme 6 - Economic Policy and International Financial Relations
PROGRAmmE 6eCoNoMiC poliCy aND iNterNatioNal FiNaNCial relatioNs - continued
Inte
ract
ive
Gam
blin
g Bi
llA
dra
ft b
ill h
as b
een
com
plet
ed.
The
proc
ess
has
been
sta
lled
pend
ing
the
outc
ome
of th
e
Gam
blin
g Re
view
Com
mis
sion
Initi
ate
a pi
lot p
roje
ct to
rew
rite
the
Inco
me
tax
Act
, or
part
s th
ereo
f
Out
line
of th
e pr
opos
ed re
writ
e
of s
ectio
ns o
f the
Inco
me
Tax
Act
deal
ing
with
em
ploy
men
t inc
ome
and
depr
ecia
tions
allo
wan
ces
Proc
ess
outli
ne h
as b
een
prep
ared
Inte
rnat
iona
l and
Regi
onal
Eco
nom
ic
Polic
y
Prom
ote
Sout
hern
Afri
can
econ
omic
inte
grat
ion
Agr
eem
ent a
nd
impl
emen
tatio
n of
a ro
ad
map
for i
nteg
ratio
n an
d
revi
ew o
f SA
CU
reve
nue-
shar
ing
form
ula
Fina
lise
agre
emen
t on
a ne
w
reve
nue-
shar
ing
form
ula
in S
AC
U
Prop
osed
new
form
ula
for r
even
ue s
harin
g
arra
ngem
ent h
as b
een
final
ised
and
will
be
pres
ente
d to
SA
CU
Cou
ncil
at th
e en
d of
June
2011
Prom
ote
the
deve
lopm
ent
of A
frica
n co
untr
ies
and
atta
inm
ent o
f Mill
enni
um
Dev
elop
men
t Goa
ls
Play
ing
a ca
taly
st ro
le w
ith
dono
r cou
ntrie
s an
d in
capa
city
-bui
ldin
g in
itiat
ives
Part
icip
ate
in A
frica
n D
evel
opm
ent
Bank
, UN
Eco
nom
ic C
omm
issi
on
for A
frica
and
Col
labo
rativ
e A
frica
n
Budg
et R
evie
w In
itiat
ive
Atte
nded
regu
lar s
tatu
tory
mee
tings
and
also
part
icip
ated
in a
num
ber o
f joi
nt p
roje
cts
unde
rtak
en. T
hese
incl
ude:
pro
ject
s on
Goo
d
Publ
ic F
inan
cial
Gov
erna
nce,
sett
ing
up a
bud
get
reso
urce
cen
tre a
nd a
stud
y on
regi
onal
pub
lic
good
sSu
ppor
t Sou
th A
frica
’s pa
rtic
ipat
ion
in in
tern
atio
nal
finan
ce a
nd d
evel
opm
ent
polic
y an
d in
stitu
tions
, in
clud
ing
the
IMF,
Wor
ld B
ank,
G
20 a
nd O
rgan
isat
ion
for
Econ
omic
Co-
oper
atio
n an
d D
evel
opm
ent (
OEC
D),
and
linki
ng th
ese
to n
atio
nal a
nd
regi
onal
inte
rest
s
Enga
gem
ents
bet
wee
n th
ese
inst
itutio
ns a
nd th
e M
inis
ter
of F
inan
ce a
nd N
atio
nal T
reas
ury
Polic
y m
emos
and
pro
posa
ls
for t
iatin
g po
sitio
ns a
nd
disc
ussi
on p
oint
s on
issu
es
tabl
ed fo
r dis
cuss
ion
at
vario
us m
eetin
gs a
nd e
vent
s
Mai
ntai
n th
e fo
cus
of G
20
coun
trie
s on
the
chal
leng
es fa
cing
em
ergi
ng m
arke
ts a
nd d
evel
opin
g co
untr
ies
as a
resu
lt of
the
glob
al
finan
cial
cris
is.
Part
icip
ated
in e
stab
lishm
ent o
f G20
D
evel
opm
ent W
orki
ng G
roup
whi
ch S
outh
A
frica
co-
chai
rs
NT AR 10-11_10.indd 81 2011/08/17 10:02 AM
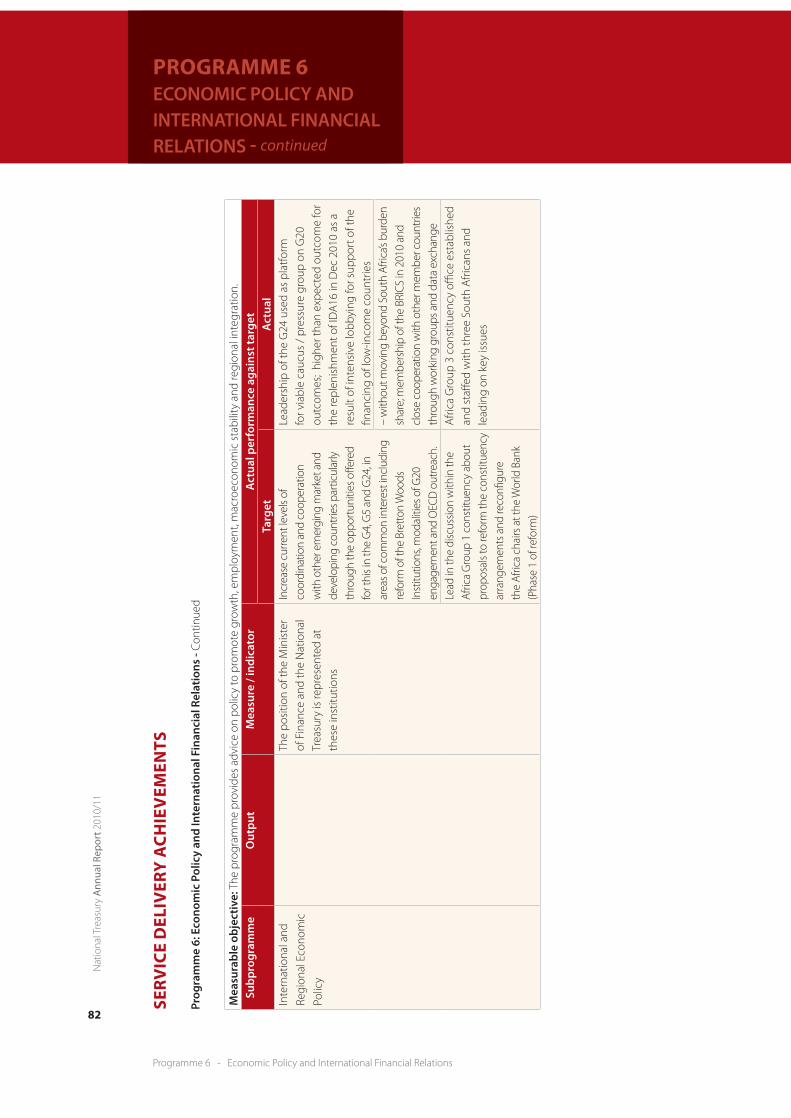
Nat
iona
l Tre
asur
y A
nnua
l Rep
ort 2
010/
11
82
Programme 6 - Economic Policy and International Financial Relations
PROGRAmmE 6eCoNoMiC poliCy aND iNterNatioNal FiNaNCial relatioNs - continued
Mea
sura
ble
obje
ctiv
e: T
he p
rogr
amm
e pr
ovid
es a
dvic
e on
pol
icy
to p
rom
ote
grow
th, e
mpl
oym
ent,
mac
roec
onom
ic s
tabi
lity
and
regi
onal
inte
grat
ion.
su
bpro
gram
me
out
put
Mea
sure
/ in
dica
tor
act
ual p
erfo
rman
ce a
gain
st ta
rget
targ
eta
ctua
lIn
tern
atio
nal a
nd
Regi
onal
Eco
nom
ic
Polic
y
The
posi
tion
of th
e M
inis
ter
of F
inan
ce a
nd th
e N
atio
nal
Trea
sury
is re
pres
ente
d at
th
ese
inst
itutio
ns
I ncr
ease
cur
rent
leve
ls of
co
ordi
natio
n an
d co
oper
atio
n w
ith o
ther
em
ergi
ng m
arke
t and
de
velo
ping
cou
ntrie
s par
ticul
arly
th
roug
h th
e op
port
uniti
es o
ffere
d fo
r thi
s in
the
G4,
G5
and
G24
, in
area
s of c
omm
on in
tere
st in
clud
ing
refo
rm o
f the
Bre
tton
Woo
ds
Inst
itutio
ns, m
odal
ities
of G
20
enga
gem
ent a
nd O
ECD
out
reac
h.
Lead
ersh
ip o
f the
G24
use
d as
pla
tform
fo
r via
ble
cauc
us /
pre
ssur
e gr
oup
on G
20
outc
omes
; hi
gher
than
exp
ecte
d ou
tcom
e fo
r th
e re
plen
ishm
ent o
f ID
A16
in D
ec 2
010
as a
re
sult
of in
tens
ive
lobb
ying
for s
uppo
rt o
f the
fin
anci
ng o
f low
-inco
me
coun
trie
s–
with
out m
ovin
g be
yond
Sou
th A
frica
’s bu
rden
sh
are;
mem
bers
hip
of th
e BR
ICS
in 2
010
and
clos
e co
oper
atio
n w
ith o
ther
mem
ber c
ount
ries
thro
ugh
wor
king
gro
ups a
nd d
ata
exch
ange
Lead
in th
e di
scus
sion
with
in th
e Af
rica
Gro
up 1
con
stitu
ency
abo
ut
prop
osal
s to
refo
rm th
e co
nstit
uenc
y ar
rang
emen
ts a
nd re
confi
gure
th
e Af
rica
chai
rs a
t the
Wor
ld B
ank
(Pha
se 1
of r
efor
m)
Afri
ca G
roup
3 c
onst
ituen
cy o
ffice
est
ablis
hed
and
staff
ed w
ith th
ree
Sout
h A
frica
ns a
nd
lead
ing
on k
ey is
sues
SERV
ICE
dEl
IVER
y A
ChIE
VEm
ENTS
prog
ram
me
6: e
cono
mic
pol
icy
and
inte
rnat
iona
l Fin
anci
al r
elat
ions
- Co
ntin
ued
NT AR 10-11_10.indd 82 2011/08/17 10:02 AM

83
Nat
iona
l Tre
asur
y A
nnua
l Rep
ort 2
010/
11
Programme 6 - Economic Policy and International Financial Relations
PROGRAmmE 6eCoNoMiC poliCy aND iNterNatioNal FiNaNCial relatioNs - continued
Econ
omic
Pol
icy
Econ
omic
pol
icy
anal
ysis
,
rese
arch
, ass
essm
ent a
nd
advi
ce c
over
ing
econ
omic
grow
th, e
mpl
oym
ent
and
labo
ur m
arke
ts, t
rade
and
bala
nce
of p
aym
ents
dyna
mic
s, m
onet
ary
and
exch
ange
rate
pol
icie
s,
infla
tion,
cre
dit e
xten
sion
and
cons
umpt
ion,
inve
stm
ent
and
savi
ngs,
indu
stria
l sec
tors
,
netw
ork
infra
stru
ctur
e,
and
deve
lopm
ent fi
nanc
e
inst
itutio
ns
Qua
lity
polic
y m
emos
and
econ
omic
ass
essm
ent
of p
olic
y pr
opos
als
with
appr
opria
te tu
rnar
ound
tim
es
Inst
itutio
nal d
evel
opm
ent o
f
divi
sion
al c
apac
ity in
mac
ro a
nd
mic
ro. Q
ualit
y be
nchm
arki
ng a
nd
cove
rage
of i
ssue
s
Ass
essm
ent o
f pol
icie
s to
ach
ieve
hig
her,
sust
aina
ble
econ
omic
gro
wth
and
job
crea
tion
in S
outh
Afri
ca u
nder
take
nD
raft
ing
Sout
h A
frica
’s co
ntrib
utio
n to
th
e G
-20
Mut
ual A
sses
smen
t pro
cess
and
Fr
amew
ork
for S
tron
g, S
usta
inab
le a
nd
Bala
nced
Gro
wth
A
naly
sis
of e
xcha
nge
rate
tren
ds a
nd im
pact
s on
the
econ
omy
and
the
asse
ssm
ent o
f po
licy
optio
ns to
pro
mot
e a
mor
e st
able
and
co
mpe
titiv
e ex
chan
ge ra
te
Ana
lysi
s an
d m
onito
ring
of c
apita
l flow
s: tr
ends
, com
posi
tion,
cos
ts a
nd b
enefi
ts
ther
eof a
nd c
apita
l acc
ount
man
agem
ent
issu
esA
sses
smen
t of s
avin
gs tr
ends
in S
outh
Afri
ca
and
anal
ysis
of p
olic
ies
to in
crea
se p
rivat
e se
ctor
sav
ings
. A
n ev
alua
tion
of th
e op
timal
leve
l of r
eser
ves
for S
outh
Afri
ca
Dis
cuss
ion
pape
r ent
itled
Con
front
ing
yout
h un
empl
oym
ent:
polic
y op
tions
for S
outh
A
frica
Ana
lysi
s an
d re
sear
ch in
to th
e dr
iver
s of
co
mm
odity
pric
e vo
latil
ity a
nd p
olic
ies
to
miti
gate
effe
cts
Rese
arch
not
e on
a s
ingl
e an
d m
ultip
le p
ayer
N
HI m
odel
- cl
uste
r inp
uts a
nd m
onito
ring
prog
ress
on
Out
com
e 4:
Dec
ent e
mpl
oym
ent
thro
ugh
incl
usiv
e gr
owth
D
aily
, wee
kly,
mon
thly
and
qua
rter
ly a
naly
sis
of e
cono
mic
dat
a an
d in
tern
atio
nal f
acto
rs
affec
ting
finan
cial
mar
kets
NT AR 10-11_10.indd 83 2011/08/17 10:02 AM
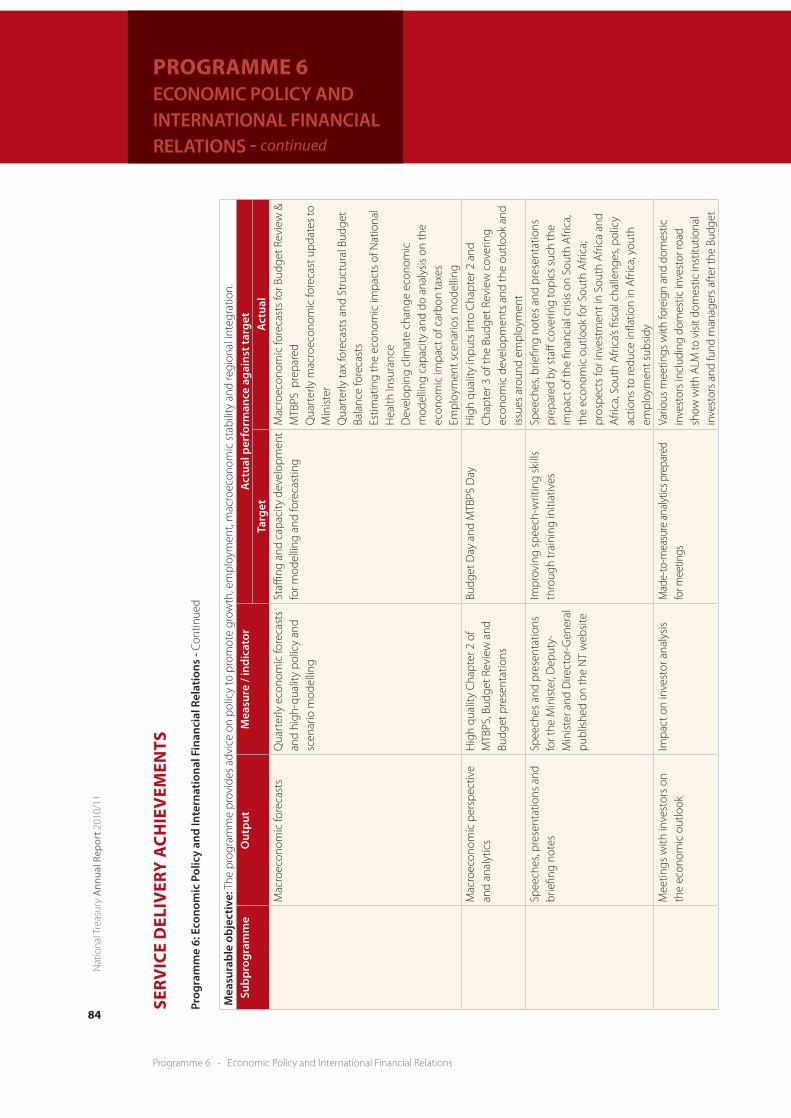
Nat
iona
l Tre
asur
y A
nnua
l Rep
ort 2
010/
11
84
Programme 6 - Economic Policy and International Financial Relations
PROGRAmmE 6eCoNoMiC poliCy aND iNterNatioNal FiNaNCial relatioNs - continued
Mea
sura
ble
obje
ctiv
e: T
he p
rogr
amm
e pr
ovid
es a
dvic
e on
pol
icy
to p
rom
ote
grow
th, e
mpl
oym
ent,
mac
roec
onom
ic s
tabi
lity
and
regi
onal
inte
grat
ion.
su
bpro
gram
me
out
put
Mea
sure
/ in
dica
tor
act
ual p
erfo
rman
ce a
gain
st ta
rget
targ
eta
ctua
lM
acro
econ
omic
fore
cast
s Q
uart
erly
eco
nom
ic fo
reca
sts
and
high
-qua
lity
polic
y an
d sc
enar
io m
odel
ling
Staffi
ng a
nd c
apac
ity d
evel
opm
ent
for m
odel
ling
and
fore
cast
ing
Mac
roec
onom
ic fo
reca
sts
for B
udge
t Rev
iew
&
MTB
PS p
repa
red
Qua
rter
ly m
acro
econ
omic
fore
cast
upd
ates
to
Min
iste
rQ
uart
erly
tax
fore
cast
s an
d St
ruct
ural
Bud
get
Bala
nce
fore
cast
sEs
timat
ing
the
econ
omic
impa
cts
of N
atio
nal
Hea
lth In
sura
nce
Dev
elop
ing
clim
ate
chan
ge e
cono
mic
m
odel
ling
capa
city
and
do
anal
ysis
on
the
econ
omic
impa
ct o
f car
bon
taxe
sEm
ploy
men
t sce
nario
s m
odel
ling
Mac
roec
onom
ic p
ersp
ectiv
e an
d an
alyt
ics
Hig
h qu
ality
Cha
pter
2 o
f M
TBPS
, Bud
get R
evie
w a
nd
Budg
et p
rese
ntat
ions
Budg
et D
ay a
nd M
TBPS
Day
Hig
h qu
ality
inpu
ts in
to C
hapt
er 2
and
C
hapt
er 3
of t
he B
udge
t Rev
iew
cov
erin
g ec
onom
ic d
evel
opm
ents
and
the
outlo
ok a
nd
issu
es a
roun
d em
ploy
men
t Sp
eech
es, p
rese
ntat
ions
and
br
iefin
g no
tes
Spee
ches
and
pre
sent
atio
ns
for t
he M
inis
ter,
Dep
uty-
Min
iste
r and
Dire
ctor
-Gen
eral
pu
blis
hed
on th
e N
T w
ebsi
te
Impr
ovin
g sp
eech
-writ
ing
skill
s th
roug
h tr
aini
ng in
itiat
ives
Spee
ches
, brie
fing
note
s an
d pr
esen
tatio
ns
prep
ared
by
staff
cov
erin
g to
pics
suc
h th
e im
pact
of t
he fi
nanc
ial c
risis
on
Sout
h A
frica
, th
e ec
onom
ic o
utlo
ok fo
r Sou
th A
frica
; pr
ospe
cts
for i
nves
tmen
t in
Sout
h A
frica
and
A
frica
, Sou
th A
frica
’s fis
cal c
halle
nges
, pol
icy
actio
ns to
redu
ce in
flatio
n in
Afri
ca, y
outh
em
ploy
men
t sub
sidy
Mee
tings
with
inve
stor
s on
th
e ec
onom
ic o
utlo
okIm
pact
on
inve
stor
ana
lysi
s M
ade-
to-m
easu
re a
naly
tics p
repa
red
for m
eetin
gsVa
rious
mee
tings
with
fore
ign
and
dom
estic
in
vest
ors
incl
udin
g do
mes
tic in
vest
or ro
ad
show
with
ALM
to v
isit d
omes
tic in
stitu
tiona
l in
vest
ors
and
fund
man
ager
s af
ter t
he B
udge
t
SERV
ICE
dEl
IVER
y A
ChIE
VEm
ENTS
prog
ram
me
6: e
cono
mic
pol
icy
and
inte
rnat
iona
l Fin
anci
al r
elat
ions
- Co
ntin
ued
NT AR 10-11_10.indd 84 2011/08/17 10:02 AM

85
Nat
iona
l Tre
asur
y A
nnua
l Rep
ort 2
010/
11
Programme 6 - Economic Policy and International Financial Relations
PROGRAmmE 6eCoNoMiC poliCy aND iNterNatioNal FiNaNCial relatioNs - continued
PROGRAmmE 7PROVINCIAl ANd lOCAl GOVERNmENT TRANSFERS
NT AR 10-11_10.indd 85 2011/08/17 10:02 AM
Nat
iona
l Tre
asur
y A
nnua
l Rep
ort 2
010/
11
86
Programme 7 - Provincial and Local Government Transfers
PROGRAmmE 7proviNCial aND loCal GoverNMeNt traNsFers
purpose: Manages three conditional grants to provinces and local governments. These grants are in addition to the
equitable share allocations and constitute only a portion of the many conditional grants administered by national
departments.
Measurable objective: improve the pace and quality of provincial infrastructure investment and asset maintenance,
promote financial management reforms in municipalities, and restructure service delivery in municipalities with large
budgets.
This programme includes three conditional grants:
• The infrastructure grant to provinces supplements provincial infrastructure budgets, and is intended to accelerate
the building and maintenance of social and economic infrastructure such as hospitals, clinics, schools, roads and
agricultural infrastructure. The grant also assists provinces in funding labour-intensive infrastructure projects.
• The local government financial management grant provides financial assistance to municipalities to help them
implement the Municipal Finance Management Act (MFMA) as part of capacity-building efforts to modernise financial
management in local government.
• Theneighbourhood development partnership grant (NDPG) supports projects that provide community infrastructure,
create platforms for private-sector development and improve the quality of life of residents in targeted areas. The unit
administering this grant is discussed in Programme 2.
SERVICE dElIVERy ObJECTIVES ANd INdICATORS
reCeNt outputs
Infrastructure grant to provinces
The Infrastructure grant to provinces is (was) a supplementary grant aimed at accelerating the construction of new
infrastructure and the maintenance, upgrading and rehabilitation of existing infrastructure in education, health, roads
and agriculture. The grant grew from R9.2 billion in 2009/10 to R11.3 billion in 2010/11. The increase was mainly due
to additional allocations towards the expansion of Grade R space and to support schools in upgrading infrastructure,
providing secure facilities, building and refurbishing libraries and laboratories and increasing maintenance. The increase
was also due to the maintenance of coal haulage routes in Mpumalanga and Limpopo. An amount of R8.8 billion (78.2
per cent of the R11.3 billion allocation) was transferred to provinces in five instalments. Portions of the instalments were
withheld due to non-compliance with the conditions of the grant framework and under-expenditure. A total of R2.47
billion of the IGP was stopped in 2010/11 due to under-expenditure on provincial infrastructure budgets. Total expenditure
registered by provinces against the grant was R7.2 billion. Therefore, R1.7 billion of the funds that were transferred were
left unspent within provincial accounts.
The provinces affected by the withholding and the amounts withheld are outlined below:
• EasternCape(R502.7Million)
• FreeState(R391.2Million)
• Gauteng(R285.7Million)
• Kwazulu-Natal(R119.8Million)
• Limpopo(R261.6Million)
NT AR 10-11_10.indd 86 2011/08/17 10:02 AM

87
Nat
iona
l Tre
asur
y A
nnua
l Rep
ort 2
010/
11
Programme 7 - Provincial and Local Government Transfers
PROGRAmmE 7proviNCial aND loCal GoverNMeNt traNsFers - continued
• Mpumalanga(R439.4Million)
• NorthernCape(R275.4Million)
• NorthWest(R194.6Million)
Preliminary (un-audited) total infrastructure expenditure in the education, health and roads sectors amounted to R26.5
billion or 86.1 per cent of the total allocation for 2010/11. There were significant improvements in spending trends in
KwaZulu-Natal, Limpopo, North West and Western Cape. These provinces spent more than 90 per cent on their overall
infrastructure budgets, while the remaining provinces spent less than 90 per cent.
Local government financial management grant
The local government financial management grant helps municipalities to improve their budgeting, in-year reporting,
accounting, asset management, supply chain management, internal auditing, annual financial statements and annual
reports. It also supports municipalities in the appointment of suitably qualified Chief Finance Officers and addresses
weaknesses in financial functions. Focus continues to be on assisting municipalities in appointing and training previously
unemployed graduates as part of the financial management internship programme. This will assist in sustaining financial
management skills at a municipal level. To enhance accountability and transparency, the resources are also used to
support municipalities to post relevant information on their websites and to improve general compliance with the MFMA
and its regulations.
An amount of R365 million was transferred to all 283 municipalities in terms of the Division of Revenue Act.
The skills development programme included the facilitation and accreditation of 42 independent service providers, and the
development of quality training material to support the rollout of the minimum competency regulations. Municipalities
also used the grant to fund the graduate internship programme and increased the intake of graduates from 537 in 2009
to 1 298 by the end of the 2010/11 financial year. The National Treasury will continue to use the grant to accelerate skills
development, and develop further training material and guidelines.
Neighbourhood development partnership grant
Since the start of the NDPG, R730.8 million has been disbursed to local government for township capital investment (see
Programme 2 for more details).
NT AR 10-11_10.indd 87 2011/08/17 10:02 AM

Nat
iona
l Tre
asur
y A
nnua
l Rep
ort 2
010/
11
88
Programme 7 - Provincial and Local Government Transfers
PROGRAmmE 7proviNCial aND loCal GoverNMeNt traNsFers - continued
SERV
ICE
dEl
IVER
y A
ChIE
VEm
ENTS
prog
ram
me
7: p
rovi
ncia
l and
loc
al G
over
nmen
t tra
nsfe
rs
Mea
sura
ble
obje
ctiv
e: Im
prov
e th
e pa
ce a
nd q
ualit
y of
pro
vinc
ial i
nfra
stru
ctur
e in
vest
men
t and
ass
et m
aint
enan
ce, p
rom
ote
finai
ncia
l man
agem
ent r
efor
ms
in
mun
icip
aliti
es a
nd re
stru
ctur
e se
rvic
e de
liver
y in
mun
icip
aliti
es w
ith la
rge
budg
ets
subp
rogr
amm
eo
utpu
tM
easu
re /
indi
cato
ra
ctua
l per
form
ance
aga
inst
targ
etta
rget
act
ual
Infra
stru
ctur
e G
rant
to
Prov
ince
s
Mon
itorin
g pr
ovin
cial
infra
stru
ctur
e de
velo
pmen
t
Tran
sfer
s in
com
plia
nce
with
cond
ition
s
Tran
sfer
s m
ade
in a
ccor
danc
e
with
the
Div
isio
n of
Rev
enue
Act
Tran
sfer
s m
ade
in c
ompl
ianc
e w
ith
the
Div
isio
n of
Rev
enue
Act
. Tra
nsfe
rs
amou
ntin
g to
R2.
47 b
illio
n st
oppe
d du
e
to n
on-c
ompl
ianc
e by
gra
nt re
ceiv
ing
depa
rtm
ents
Repo
rt o
n co
mpl
ianc
e,
tran
sfer
s an
d sp
endi
ng
Qua
rterly
repo
rting
by
nine
prov
ince
s on
aggr
egat
e
infra
stru
ctur
e sp
endi
ng a
nd o
utpu
ts
Qua
rter
ly re
port
s su
bmitt
ed b
y al
l
prov
ince
s on
agg
rega
te in
frast
ruct
ure
spen
ding
and
out
puts
Impr
ove
infra
stru
ctur
e de
liver
y
man
agem
ent s
yste
ms,
thro
ugh
impl
emen
tatio
n of
IDIP
in p
rovi
nces
Tech
nica
l ass
ista
nce
team
s
appo
inte
d to
ass
ist e
duca
tion,
heal
th a
nd p
ublic
wor
ks
depa
rtm
ents
in n
ine
prov
ince
s
34 te
chni
cal a
ssist
ants
dep
loye
d ac
ross
nin
e
prov
ince
s (fo
ur TA
s in
each
pro
vinc
e ex
cept
in M
pum
alan
ga a
nd E
aste
rn C
ape
whe
re
thre
e w
ere
depl
oyed
to e
ach
prov
ince
) Te
chni
cal s
uppo
rt w
ill a
lso
be
exte
nded
to n
atio
nal h
ealth
and
educ
atio
n to
str
engt
hen
sect
or p
olic
y de
velo
pmen
t and
over
sigh
t cap
acity
One
tech
nica
l ass
ista
nt d
eplo
yed
to th
e
natio
nal B
asic
Edu
catio
n de
part
men
t and
the
two
tech
nica
l ass
ista
nts
depl
oyed
to
natio
nal D
epar
tmen
t of H
ealth
Educ
atio
n se
ctor
dev
elop
s an
d
pilo
ts n
orm
s an
d st
anda
rds
for
scho
ol in
frast
ruct
ure
Basi
c Ed
ucat
ion
deve
lope
d sc
hool
infra
stru
ctur
e no
rms
and
stan
dard
s.
Thes
e w
ill b
e im
plem
ente
d as
par
t of t
he
plan
ning
pro
cess
for 2
011/
12Ti
mel
y su
bmis
sion
of
infra
stru
ctur
e pl
ans
by p
rovi
nces
whi
ch c
ompl
y w
ith g
uide
lines
deve
lope
d by
Nat
iona
l Tre
asur
y
25 p
rovi
ncia
l dep
artm
ents
sub
mitt
ed
infra
stru
ctur
e pl
ans
in c
ompl
ianc
e
with
the
set g
uide
lines
. O
nly
2 di
d no
t
com
ply
NT AR 10-11_10.indd 88 2011/08/17 10:02 AM

89
Nat
iona
l Tre
asur
y A
nnua
l Rep
ort 2
010/
11
Programme 7 - Provincial and Local Government Transfers
PROGRAmmE 7proviNCial aND loCal GoverNMeNt traNsFers - continued
SERV
ICE
dEl
IVER
y A
ChIE
VEm
ENTS
prog
ram
me
7: p
rovi
ncia
l and
loc
al G
over
nmen
t tra
nsfe
rs
Mea
sura
ble
obje
ctiv
e: Im
prov
e th
e pa
ce a
nd q
ualit
y of
pro
vinc
ial i
nfra
stru
ctur
e in
vest
men
t and
ass
et m
aint
enan
ce, p
rom
ote
finai
ncia
l man
agem
ent r
efor
ms
in
mun
icip
aliti
es a
nd re
stru
ctur
e se
rvic
e de
liver
y in
mun
icip
aliti
es w
ith la
rge
budg
ets
subp
rogr
amm
eo
utpu
tM
easu
re /
indi
cato
ra
ctua
l per
form
ance
aga
inst
targ
etta
rget
act
ual
Infra
stru
ctur
e G
rant
to
Prov
ince
s
Mon
itorin
g pr
ovin
cial
infra
stru
ctur
e de
velo
pmen
t
Tran
sfer
s in
com
plia
nce
with
cond
ition
s
Tran
sfer
s m
ade
in a
ccor
danc
e
with
the
Div
isio
n of
Rev
enue
Act
Tran
sfer
s m
ade
in c
ompl
ianc
e w
ith
the
Div
isio
n of
Rev
enue
Act
. Tra
nsfe
rs
amou
ntin
g to
R2.
47 b
illio
n st
oppe
d du
e
to n
on-c
ompl
ianc
e by
gra
nt re
ceiv
ing
depa
rtm
ents
Repo
rt o
n co
mpl
ianc
e,
tran
sfer
s an
d sp
endi
ng
Qua
rterly
repo
rting
by
nine
prov
ince
s on
aggr
egat
e
infra
stru
ctur
e sp
endi
ng a
nd o
utpu
ts
Qua
rter
ly re
port
s su
bmitt
ed b
y al
l
prov
ince
s on
agg
rega
te in
frast
ruct
ure
spen
ding
and
out
puts
Impr
ove
infra
stru
ctur
e de
liver
y
man
agem
ent s
yste
ms,
thro
ugh
impl
emen
tatio
n of
IDIP
in p
rovi
nces
Tech
nica
l ass
ista
nce
team
s
appo
inte
d to
ass
ist e
duca
tion,
heal
th a
nd p
ublic
wor
ks
depa
rtm
ents
in n
ine
prov
ince
s
34 te
chni
cal a
ssist
ants
dep
loye
d ac
ross
nin
e
prov
ince
s (fo
ur TA
s in
each
pro
vinc
e ex
cept
in M
pum
alan
ga a
nd E
aste
rn C
ape
whe
re
thre
e w
ere
depl
oyed
to e
ach
prov
ince
) Te
chni
cal s
uppo
rt w
ill a
lso
be
exte
nded
to n
atio
nal h
ealth
and
educ
atio
n to
str
engt
hen
sect
or p
olic
y de
velo
pmen
t and
over
sigh
t cap
acity
One
tech
nica
l ass
ista
nt d
eplo
yed
to th
e
natio
nal B
asic
Edu
catio
n de
part
men
t and
the
two
tech
nica
l ass
ista
nts
depl
oyed
to
natio
nal D
epar
tmen
t of H
ealth
Educ
atio
n se
ctor
dev
elop
s an
d
pilo
ts n
orm
s an
d st
anda
rds
for
scho
ol in
frast
ruct
ure
Basi
c Ed
ucat
ion
deve
lope
d sc
hool
infra
stru
ctur
e no
rms
and
stan
dard
s.
Thes
e w
ill b
e im
plem
ente
d as
par
t of t
he
plan
ning
pro
cess
for 2
011/
12Ti
mel
y su
bmis
sion
of
infra
stru
ctur
e pl
ans
by p
rovi
nces
whi
ch c
ompl
y w
ith g
uide
lines
deve
lope
d by
Nat
iona
l Tre
asur
y
25 p
rovi
ncia
l dep
artm
ents
sub
mitt
ed
infra
stru
ctur
e pl
ans
in c
ompl
ianc
e
with
the
set g
uide
lines
. O
nly
2 di
d no
t
com
ply
Div
isio
n Re
venu
e w
ill r
equi
re
impr
ovem
ent i
n th
e qu
ality
of
plan
s w
ith im
prov
ed in
form
atio
n
and
inst
itutio
nalis
atio
n of
sec
tor
norm
s an
d st
anda
rds
Div
isio
n of
Rev
enue
for 2
011
sets
requ
irem
ents
for i
nfra
stru
ctur
e pl
ans,
but s
ecto
r nor
ms
and
stan
dard
s no
t
inst
itutio
nalis
ed
Loca
l Gov
ernm
ent
Fina
ncia
l Man
agem
ent
Gra
nt
Mon
itor o
f mun
icip
al fi
nanc
ial
man
agem
ent r
efor
ms
Tran
sfer
s m
ade
acco
rdin
g to
cond
ition
s
Tran
sfer
s m
ade
by 3
1 M
arch
201
1 A
ll tr
ansf
ers
mad
e by
31
Mar
ch 2
011
App
oint
at l
east
four
inte
rns
in
each
of t
he 2
83 m
unic
ipal
ities
(a
tota
l of 1
132
inte
rns)
1 29
8 in
tern
s ap
poin
ted
Impr
oved
repo
rtin
g in
all
mun
icip
aliti
es
Impr
oved
repo
rtin
g an
d sp
endi
ng o
n th
e
gran
t as
repo
rted
mon
thly
Prog
ress
ive
impl
emen
tatio
n of
MFM
A in
all
mun
icip
aliti
es
252
mun
icip
aliti
es o
r 89
per c
ent t
able
d
budg
ets
on ti
me.
233
mun
icip
aliti
es o
r 82
per c
ent
adop
ted
budg
ets
with
in th
e pr
escr
ibed
perio
d
NT AR 10-11_10.indd 89 2011/08/17 10:02 AM

Nat
iona
l Tre
asur
y A
nnua
l Rep
ort 2
010/
11
90
Programme 8 - Civil and Military Pensions, Contributions to Funds and Other Benefits
PROGRAmmE 8Civil aND Military peNsioNs, CoNtriButioNs to FuNDs aND otHer BeNeFits - continued
PROGRAmmE 8CIVIl ANd mIlITARy PENSIONS, CONTRIbUTIONS TO FUNdS
ANd OThER bENEFITS
NT AR 10-11_10.indd 90 2011/08/17 10:02 AM

91
Nat
iona
l Tre
asur
y A
nnua
l Rep
ort 2
010/
11
Programme 8 - Civil and Military Pensions, Contributions to Funds and Other Benefits
PROGRAmmE 8Civil aND Military peNsioNs, CoNtriButioNs to FuNDs aND otHer BeNeFits
purpose: Payment and administration of special pensions, military pensions, other statutory pensions, and post-retirement
medical subsidies
Measurable objective: The programme aims to ensure the payment of benefits and awards to beneficiaries of
departments, state-aided entities and other specified bodies in terms of various statutes, collective bargaining agreements
and other commitments.
There are two subprogrammes:
• Civil Pensions and Contributions to Medical Aid Schemes provides for the payment of pensions and contributions to
medical aid schemes for pensioners, surviving spouses, dependants and civil pensioners who were not members of
medical schemes during their period of service (by special concession). It ensures payment to medical schemes for
pensioners and widows in the former Development Boards and the National Film Board. The subprogramme also
provides for payment of special pensions to persons who have made sacrifices or served the public interest in the
establishment of the democratic constitutional order.
• Military Pensions and Other Benefits provides for the payment of military pensions and medical claims arising from
treatment for disability, medical assistance devices, and other related expenses in terms of statutory commitments.
The sub programme is responsible for payment of compensation benefits to government employees in cases of
temporary, total or partial disablement; as a result of injuries sustained on duty; and in cases of death to dependants
of such beneficiaries in accordance with the Compensation for Occupational Injuries and Diseases Act (1993). In
addition, it provides for the payment of former presidents, retired judges (pre-1994), parliamentarians, and Venda
and Gazankulu parliamentarians.
SERVICE dElIVERy ObJECTIVES ANd INdICATORS
reCeNt outputs
The following was achieved during the review period:
• Shorteningoftimetakentoprocessapplications.
• TheMilitaryPensionsandthePost-RetirementMedicalbenefitsunitseradicatedtheirbacklog.SpecialPensionshas
reduced their backlog from 4 103 to 190.
The Injury-on-Duty unit improved its processes for the payment of client benefits, and implemented set increases on
time. The unit initiated regular meetings with the Compensation Commissioner to discuss challenges and to improve
stakeholder relations.
Government contributions to medial schemes made payments on behalf of 73 246 members. The amount paid to the
members was R1.6 billion and about 60 per cent went to Medihelp members.
NT AR 10-11_10.indd 91 2011/08/17 10:02 AM

Nat
iona
l Tre
asur
y A
nnua
l Rep
ort 2
010/
11
92
Programme 8 - Civil and Military Pensions, Contributions to Funds and Other Benefits
PROGRAmmE 8Civil aND Military peNsioNs, CoNtriButioNs to FuNDs aND otHer BeNeFits - continued
The targets in the Special Pensions Unit (SP) were met and some exceeded due to improved processes and more capacity
in the unit. The Special Pensions Appeal Board reduced the appeal backlog by 96 per cent. The applications in terms of
the 2008 amendment to the SP Act closed on 31 December 2010.
NT AR 10-11_10.indd 92 2011/08/17 10:02 AM

93
Nat
iona
l Tre
asur
y A
nnua
l Rep
ort 2
010/
11
Programme 8 - Civil and Military Pensions, Contributions to Funds and Other Benefits
PROGRAmmE 8Civil aND Military peNsioNs, CoNtriButioNs to FuNDs aND otHer BeNeFits - continued
SERV
ICE
dEl
IVER
y A
ChIE
VEm
ENTS
prog
ram
me
8: C
ivil
and
Mili
tary
pen
sion
s, C
ontr
ibut
ions
to F
unds
and
oth
er B
enefi
ts
Mea
sura
ble
obje
ctiv
e: To
ens
ure
the
paym
ent o
f ben
efits
and
aw
ards
to b
enefi
ciar
ies
of d
epar
tmen
ts, s
tate
-aid
ed b
odie
s an
d ot
her s
peci
fied
entit
ies
in te
rms
of v
ario
us
stat
utes
, col
lect
ive-
barg
aini
ng a
gree
men
ts a
nd o
ther
com
mitm
ents
subp
rogr
amm
eo
utpu
tM
easu
re /
indi
cato
ra
ctua
l per
form
ance
aga
inst
targ
etta
rget
act
ual
Civ
il Pe
nsio
ns a
nd
Cont
ribut
ions
to M
edic
al
Sche
mes
Paym
ent o
f pen
sion
ben
efits
and
cont
ribut
ions
to fu
nds
(incl
udin
g sp
ecia
l pen
sion
s)
Paym
ent o
f con
trib
utio
ns to
med
ical
aid
sch
emes
Tim
eous
and
acc
urat
e
paym
ent o
f ben
efits
IOD
ben
efic
iarie
s: 9
045
spec
ial p
ensi
ons
ben
efic
iarie
s: 6
486
Ex P
resi
dent
s : 2
IOD
Ben
efic
iarie
s :1
0 68
8
Spec
ial P
ensi
ons
Bene
ficia
ries
:6 7
46
Ex P
resi
dent
s : 2
All
cont
ribut
ions
pai
d
timeo
usly
71 1
17 m
emb
ers
per
mon
th73
246
mem
ber
s p
aid
per
mon
th
Paym
ent o
f ris
k an
d
adm
inis
trat
ion
fees
to th
e
Polit
ical
Offi
ce B
eare
rs’
Pens
ion
Fund
Tim
eous
and
acc
urat
e
paym
ent o
f ris
k an
d
adm
inis
trat
ion
fees
in re
spec
t
of a
ll m
embe
rs m
onth
ly
Paym
ent
of ri
sk a
nd
adm
inis
trat
ion
fees
in
resp
ect
of 9
00 m
emb
ers
mon
thly
Risk
and
adm
inis
trat
ion
fees
in re
spec
t
of 9
00 m
emb
ers
pai
d ev
ery
mon
th
Not
ify b
enefi
ciar
ies
of s
peci
al
pens
ions
am
endm
ents
Succ
essf
ul n
atio
nal a
war
enes
s
cam
paig
n
Proc
ess
all a
pp
licat
ions
by
Mar
ch 2
011
26%
(2 4
60) o
f ap
plic
atio
ns w
ere
pro
cess
ed. T
he re
mai
ning
74%
of
app
licat
ions
wer
e re
ceiv
ed o
n th
e
clos
ing
date
of 3
1 D
ecem
ber
201
0, a
nd
had
outs
tand
ing
info
rmat
ion
NT AR 10-11_10.indd 93 2011/08/17 10:02 AM

Nat
iona
l Tre
asur
y A
nnua
l Rep
ort 2
010/
11
94
Programme 8 - Civil and Military Pensions, Contributions to Funds and Other Benefits
PROGRAmmE 8Civil aND Military peNsioNs, CoNtriButioNs to FuNDs aND otHer BeNeFits - continued
Mea
sura
ble
obje
ctiv
e: To
ens
ure
the
paym
ent o
f ben
efits
and
aw
ards
to b
enefi
ciar
ies
of d
epar
tmen
ts, s
tate
-aid
ed b
odie
s an
d ot
her s
peci
fied
entit
ies
in te
rms
of v
ario
us
stat
utes
, col
lect
ive-
barg
aini
ng a
gree
men
ts a
nd o
ther
com
mitm
ents
subp
rogr
amm
eo
utpu
tM
easu
re /
indi
cato
ra
ctua
l per
form
ance
aga
inst
targ
etta
rget
act
ual
Mili
tary
Pen
sion
s an
d O
ther
Bene
fits
Paym
ent o
f mili
tary
pen
sion
bene
fits
Tim
eous
and
acc
urat
e
paym
ent o
f ben
efits
Bene
ficia
ries
: 7 0
226
834
Bene
ficia
ries
pai
d. (r
educ
ed
as a
resu
lt of
non
-act
ivat
ion
of li
fe
cert
ifica
tes)
Paym
ent t
o se
rvic
e pr
ovid
ers
for m
edic
al e
xpen
ses
All
clai
ms
paid
to s
ervi
ce
prov
ider
s m
onth
ly
Tim
eous
and
acc
urat
e
paym
ent t
o se
rvic
e pr
ovid
ers
for m
edic
al e
xpen
ses
9 51
8 in
voic
es p
aid
accu
rate
ly
Redu
ce b
ackl
ogD
evel
op p
roce
sses
to
erad
icat
e ba
cklo
g
Back
log
redu
ced
to:
•IOD:1
500
•SpecialPensio
ns:4
103
•MilitaryPensions:0
•MedicalSub
sidies:0
Back
log
redu
ced
to:
•IOD:817
•SpecialPensio
ns:190
•MilitaryPension:0
•MedicalSub
sidies:0
Prov
ide
inpu
t to
the
revi
sion
of M
ilita
ry P
ensi
ons
Act
of
1976
Qua
lity
of in
form
atio
n
prov
ided
Acc
urac
y, s
cope
and
qua
lity
of c
onte
nt p
rovi
ded
GPA
A in
pro
cess
of c
onso
lidat
ing
com
men
ts fr
om s
take
hold
ers
to e
nsur
e a
qual
ity in
put i
nto
the
Act
Dev
elop
VIP
cus
tom
er c
are
stra
tegy
for P
resi
dent
s,
Parli
amen
taria
ns, M
agis
trat
es,
Judg
es a
nd fo
rmer
TBV
C’s.
App
rove
d VI
P cu
stom
er c
are
stra
tegy
Impl
emen
tatio
n of
the
VIP
cust
omer
car
e st
rate
gy
Succ
essf
ul im
plem
enta
tion
of th
e VI
P cu
stom
er c
are
stra
tegy
Spec
ial P
ensi
ons:
Ded
icat
ed V
IP s
uppo
rt
base
d in
Par
liam
ent
SERV
ICE
dEl
IVER
y A
ChIE
VEm
ENTS
prog
ram
me
8: C
ivil
and
Mili
tary
pen
sion
s, C
ontr
ibut
ions
to F
unds
and
oth
er B
enefi
ts
NT AR 10-11_10.indd 94 2011/08/17 10:02 AM

95
Nat
iona
l Tre
asur
y A
nnua
l Rep
ort 2
010/
11
Programme 8 - Civil and Military Pensions, Contributions to Funds and Other Benefits
PROGRAmmE 8Civil aND Military peNsioNs, CoNtriButioNs to FuNDs aND otHer BeNeFits - continued
PROGRAmmE 9FISCAl TRANSFERS
NT AR 10-11_10.indd 95 2011/08/17 10:02 AM

Nat
iona
l Tre
asur
y A
nnua
l Rep
ort 2
010/
11
96
Programme 9 - Fiscal Transfers
PROGRAmmE 9FisCal traNsFers - continued
purpose: Finances public authorities and other institutions in terms of legal provisions governing financial relations
between government and the relevant authority or institution, including multilateral development banks and international
development bodies of which South Africa is a member.
Measurable objective: To meet international and other statutory financial obligations, to meet the costs of effectively and
efficiently raising revenue for the state, and to finance intelligence-gathering and other secret services in the national interest.
Domestic transfers are made to:
• TheSouthAfricanRevenueService(SARS),whichisresponsibleforcollectionofrevenueintermsoftheSouthAfrican
Revenue Service Act (34 of 1997).
• The Financial and Fiscal Commission, a constitutional body charged with making recommendations about the
equitable division of revenue between the three spheres of government.
• The Secret Services account, used tofinance the activitiesof theNational IntelligenceAgency, the SouthAfrican
Secret Service, and certain activities of the Detective Service of the South African Police Service.
• TheFinancial IntelligenceCentre,whichcombatsmoney-launderingandworks to strengthenfinancial regulation
capacity.
To fulfil government’s international obligations, foreign transfer payments are made to:
• TheWorldBankGroup
• TheAfricanDevelopmentBank
• MemberstatesoftheCommonMonetaryArea–Lesotho,NamibiaandSwaziland
• TheCommonwealthFundforTechnicalCooperation
• TheGlobalAllianceforVaccinesandImmunisation
SERVICE dElIVERy ObJECTIVES ANd INdICATORS
reCeNt outputs
South Africa contributes to the World Bank Group’s International Development Association (IDA), which is replenished by
donors every three years. Fifty per cent of IDA’s resources are ring-fenced for expenditure in Sub-Saharan Africa. South
Africa is the only Sub-Saharan African country that contributes to IDA resources, and continues to lobby for additional
resources for IDA and improved processes for their effective use.
During the reporting period, South Africa made its last payment to the IDA15 replenishment. The 16th replenishment
of IDA was negotiated during 2010 and totaled US$49.8 billion. South Africa’s share of the donor component of this total
envelope is R242.7 million, with the first payment due in January 2012. IDA 17 will be negotiated by donors in 2014.
South Africa is the only African country that donates to the African Development Fund (ADF) of the African Development
Bank (AfDB), and has been contributing to ADF replenishments since 1998. The fund lends money at reduced interest
rates to low-income African countries in support of poverty alleviation and to foster economic growth and development.
During the 12th ADF replenishment, South Africa increased its contribution by 30 per cent to R120 million over the
2011 MTEF. This contribution is payable in instalments of R40.1 million per year over a three year period. South Africa’s
shareholding in the AfDB currently stands at 4.6 per cent and total transfers to the AfDB for the 2010/11 period stood at
R 55.5 million.
NT AR 10-11_10.indd 96 2011/08/17 10:02 AM

97
Nat
iona
l Tre
asur
y A
nnua
l Rep
ort 2
010/
11
Programme 9 - Fiscal Transfers
PROGRAmmE 9FisCal traNsFers - continued
The Common Monetary Area is made up of South Africa, Lesotho, Namibia and Swaziland. Its purpose is to implement a
common monetary policy. South Africa compensates the other countries for rands circulating in their territories as legal
tender in terms of Article 6 of the Multilateral Monetary Agreement. The compensation is based on the understanding
that South Africa, as the issuing country, benefits from this through seigniorage collection. In 2010/11, R398 million was
transferred for this purpose.
Commonwealth Fund for Technical Cooperation (CFTC) resources are used to further the Commonwealth Secretariat’s
goals and programmes, which are closely aligned to the Millennium Development Goals (MDGs). The fund aims to
assist developing member countries in acquiring the knowledge and institutional capacity needed to address their
development priorities. Public sector development is a central theme of the fund-sponsored activities. The CFTC provides
funding to technical advisors, and funding or scholarships for workshops, seminars, study tours and study programmes.
South Africa contributed R3.5 million to this fund during the review period.
South Africa acceded to the International Finance Facility for Immunisation (IFFIm) in 2007 with a US$ 20 million pledge
over 20 years. The IFFIm is a unique and successful approach to mobilise additional resources to finance the MDGs by
frontloading future flows of ODA. This ensures predictability of aid flows to recipient countries. According to the Global
Alliance for Vaccinations and Immunisation (GAVI) Alliance, which receives the funds, funds provided by IFFIm from its
inception in 2006 have helped to save more than three million lives by accelerating access to immunisation in developing
countries. The total fiscal transfer from South Africa during the 2010-11 fiscal year was $ 970 000 (R9.6 million).
Transfer payments
Name of institution r’000African Development Bank and African Development Fund 55 080Commonwealth Fund for Tech Cooperation 3 029Common Monetary Area Compensation 397 792 Development Bank of Southern Africa (Siyenza Manje) 290 295Eskom 20 000 000 Financial and Fiscal Commission 31 391 Financial Intelligence Centre 181 414International Funding Facility for Immunisation 7 086 Secret Services 3 306 752 South African Revenue Service 8 142 208 World Bank Group and IDA 68 000total: 32 483 047
NT AR 10-11_10.indd 97 2011/08/17 10:02 AM

ANNUAl FINANCIAl STATEmENTS
NT AR 10-11_10.indd 98 2011/08/17 10:02 AM

99
ACCOUNTING OFFICER’S OVERVIEW - continued
Nat
iona
l Tre
asur
y A
nnua
l Rep
ort 2
010/
11
Annual Financial Statements
99
national treasury vote 9
FOR the yeaR ended 31 maRch 2011
ANNUAl FINANCIAl STATEmENTS
TAblE OF CONTENTS
1. Report of the Audit Committee .....................................................................................................................................................................................100
2. Report of the Accounting Officer .................................................................................................................................................................................102
3. Report of the Audtitor General .......................................................................................................................................................................................123
4. Accounting Policies ...............................................................................................................................................................................................................127
5. Appropriation Statement ...................................................................................................................................................................................................137
6. Notes to the Appropriation Statement .....................................................................................................................................................................148
7. Statement of Financial Perfomance ............................................................................................................................................................................151
8. Statement of Financial Position ......................................................................................................................................................................................152
9. Statement of Changes in Net Assets ..........................................................................................................................................................................153
10. Cash Flow Statement ............................................................................................................................................................................................................154
11. Notes to the Annual Financial Statements .............................................................................................................................................................155
12. Disclosures Notes to the Annual Financial Statements ...................................................................................................................................164
13. Annexures ....................................................................................................................................................................................................................................170
NT AR 10-11_10.indd 99 2011/08/17 10:02 AM

100
ACCOUNTING OFFICER’S OVERVIEW - continued
Annual Financial Statements
Nat
iona
l Tre
asur
y A
nnua
l Rep
ort 2
010/
11
100
national treasury vote 9
FOR the yeaR ended 31 maRch 2011
REPORT OF ThE AUdIT COmmITTEE
We are pleased to present our report for the financial year ended 31 March 2011.
auDit CoMMittee MeMBers aND atteNDaNCe:
The Audit Committee consists of the members listed hereunder and has met as reflected below, in line with its approved
terms of reference.
audit Committee Meetings 2011
Name of member *Number of meetings attended
remarks
Mr Vuyo Jack (Chairperson) 6 of 6 Appointment as Chairperson effective from 1 October 2010
Ms Mamoroke Lehobye 4 of 6 Contract renewed effective from 1 October 2010
Ms Lesibana Fosu 4 of 6 Contract renewed effective from 1 October 2010
Mr Joe Lesejane 5 of 6 Appointment effective 1 March 2010
Mr Zach Le Roux 6 of 6 Appointment effective
Ms 'Berenice Francis' 3 of 6 Appointment effective 2 July 2010
Note: The 6 audit committee meetings include two special meetings, one to discuss the Department’s Financials and the Consolidated Financial
Statements and other to discuss the progress on IFMS and Programme 8 issues.
auDit CoMMittee respoNsiBility
The Audit Committee reports that it has complied with its responsibilities arising from section 38(1)(a) of the PFMA and
Treasury Regulation 3.1.13.
The Audit Committee also reports that it has adopted appropriate formal terms of reference as its audit committee charter,
has regulated its affairs in compliance with this charter and has discharged all its responsibilities as contained therein.
tHe eFFeCtiveNess oF iNterNal CoNtrol
The Audit Committee is of the opinion, based on the information and explanations given by management, the internal
auditors, and discussions with the independent external auditors (Auditor-General) on the results of its audits, that the
internal accounting controls are operating to ensure that the financial records may be relied upon for preparing the annual
financial statements, and accountability for assets and liabilities is maintained. From the various reports of the Internal
Auditors, the Audit Report on the Annual Financial Statements and the management letter of the Auditor-General, it was
noted that no significant or material non compliance with prescribed policies and procedures have been reported. We
can report that the system of internal control for the period under review was effective. However, attention is drawn to
the following areas of concern:
• Thereweretwofindingsraisedwithregardto(i)Anirregularexpenditurethatoccurredincontraventionofofthe
Special Pensions Act, Act 69 of 1996, (as amended) (Special Pensions Act) and Treasury Regulation (TR) 8.2.1 and 8.2.2
and (ii) Material losses which was incurred as a result of criminal conduct and ineffectiveness of control activities within
Programme 8: Special Pensions. In order to address this concern, a forensic review is being commissioned to assess if
there were any fraudulent activities that took place relating to the missing files and progress on this will be provided
to the Audit Committee; and
• The State Information Technology Agency (SITA) is responsible for the Wide Area Network (WAN), security and related controls,
such as firewalls for National Treasury. The auditor-General audits this area and provides assurance to the audit Committee of
SITA only. We therefore did not review the IT controls as they relate to SITA and SITA’s functions at National Treasury.
NT AR 10-11_10.indd 100 2011/08/17 10:02 AM

101
ACCOUNTING OFFICER’S OVERVIEW - continued
Nat
iona
l Tre
asur
y A
nnua
l Rep
ort 2
010/
11
Annual Financial Statements
101
national treasury vote 9
FOR the yeaR ended 31 maRch 2011
report of the audit committee - continued
• TheAuditCommitteeisconcernedabouttheslowprogressoftheimplementationoftheIntegratedFinancialManagement
system (IFMS) project. On the recommendation of the Audit Committee, the Auditor-General has been appointed by
National Treasury during 2010 as the assurance provider to express a view on the adequacy and effectiveness of the
governance and project management processes, as well as internal controls for the different modules that form part of
the IFMS project. The Audit Committee are engaging with the Auditor-General with regards to this project on a regular
basis along with the Audit Committees of SITA and the Department of Public Service and Administration.
Other than these matters nothing significant has come to the attention of the Audit Committee to indicate that any material
breakdown in the functioning of these controls, procedures and systems has occurred during the year under review.
tHe eFFeCtiveNess oF iNterNal auDit
The Audit Committee reviewed the effectiveness of internal audit. Internal audit will be merged with the internal audit function
of SARS to increase its independence, capacity and access to specialists especially on the IT risks of the National Treasury.
tHe risK areas oF tHe iNstitutioN’s operatioNs
Risk management is still relatively new in National Treasury. However there is a Risk Management Committee that meets
on a regular basis and shares its reports with the Audit Committee. A risk register is kept and updated continuously to
ensure that all the major risks facing the programs and entities under the National Treasury are recorded.
aCCouNtiNG aND auDitiNG CoNCerNs iDeNtiFieD as a result oF iNterNal aND exterNal auDits
From the various reports of the Internal Auditors, the Audit Report on the Annual Financial Statements and the
management letter of the Auditor-General, it was noted that no significant or material accounting an auditing concerns
were identified other than those mentioned above relating to Programme 8 which were adequately resolved.
tHe iNstitutioN’s CoMpliaNCe witH leGal aND reGulatory provisioNs
From the various reports of the Internal Auditors, the Audit Report on the Annual Financial Statements and the
management letter of the Auditor-General, it was noted that no significant or material non-compliance with legal and
regulatory provisions have been reported.
evaluatioN oF FiNaNCial stateMeNts
The Audit Committee has evaluated the annual financial statements of the National Treasury for the year ended 31
March 2011 and, based on the information provided to the Audit Committee, concurs and accepts the Auditor-General’s
conclusions on the annual financial statements, and is of the opinion that the audited annual financial statements be
accepted and read together with the report of the Auditor-General.
Mr vuyo Jack
Chairperson of the Audit Committee
Date: 4 August 2011
NT AR 10-11_10.indd 101 2011/08/17 10:02 AM

102
ACCOUNTING OFFICER’S OVERVIEW - continued
Annual Financial Statements
Nat
iona
l Tre
asur
y A
nnua
l Rep
ort 2
010/
11
102
national treasury vote 9
FOR the yeaR ended 31 maRch 2011
REPORT OF ThE ACCOUNTING OFFICER
Report by the Accounting Officer to the Executive Authority and Parliament of the Republic of South Africa.
1. GENERAl REVIEW OF ThE STATE OF FINANCIAl AFFAIRS
1.1 strateGiC overview
The overarching aim of the National Treasury is to support and promote economic development, good
governance, social progress and rising standards of living through the accountable, economical, equitable,
and sustainable management of public finances. During the period under review, the National Treasury
continued to accelerate its coordinated implementation of the key strategic priorities, as depicted in the
Department’s Strategic Plan and Estimates of National Expenditure: promoting the fiscal policy framework
of the government, coordinating intergovernmental financial and fiscal relations, managing the budget
preparation process which encompass revenue, expenditure, assets and liability management, exercise
control on the implementation of the national budget, facilitate the implementation of the Division of
Revenue Act, enforce effective financial management practices and contribute meaningfully towards
employment creation. The National Treasury will continue to build on its past achievements and good
performance by giving effect to government commitment of rooting out wastage, promoting cost efficiency
and phasing out of ineffective programmes.
Significant strides have been made in strengthening intergovernmental fiscal relations through Siyenza
Manje capacity building and support programme implemented in municipalities by the Development
Bank of Southern Africa which is co-funded by the National Treasury. The National Treasury also seeks to
ensure prudent management of government’s financial assets and liabilities through financing government
borrowing requirements at the lowest possible cost and within market risk benchmarks, while leveraging
the broader macroeconomic objectives. Attention is also given to operational efficiency of and coordinated
borrowing by the state owned entities as well as review of development finance institutions in their role
to provide strategic direction in the delivery of infrastructure. Key among challenges facing the National
Treasury is the attraction and retention of scarce skills despite the successful internship programme, however,
the Chartered Accountants Academy (CAA) programme which provides an opportunity for prospective
chartered accountants to receive training suggests a real potential for more collaboration between National
Treasury, South African Institute of Chartered Accountants and the local government metros to expand the
programme to the wider public sector.
For a more detailed discussion on the outcome of the aforementioned strategic activities, please refer to the
relevant chapters dealing with programme performance included in the Annual Report.
1.2 Key poliCy DevelopMeNts
Social security and retirement reform
The deepening income inequality necessitates reforms that are focusing on reducing this imbalance through
sustained job creation, combating the abuse of market power and realisation of greater income security. Through
NT AR 10-11_10.indd 102 2011/08/17 10:02 AM

103
ACCOUNTING OFFICER’S OVERVIEW - continued
Nat
iona
l Tre
asur
y A
nnua
l Rep
ort 2
010/
11
Annual Financial Statements
103
report of the accounting officer - continued
national treasury vote 9
FOR the yeaR ended 31 maRch 2011
advancing the work currently in progress on social security and retirement reforms, the National Treasury will
continue to utilise its influence to enhance adequate coverage of all citizens on retirement. As part of the reform
process, education, health, retirement and social security must be sharpened and enhanced to provide the
required balancing mechanisms.
Review of the Division of Revenue Bill
The annual Division of Revenue Bill continues to evolve to ensure that the grant system contributes to improved
accountability and accelerated service delivery. The continuing review process remains a priority in ensuring that
the grant system contributes to better and quicker decision making in tandem with the implementation of the
Municipal Finance Management Act (2003).
Monitoring compliance with the Public Finance Management Act and the Municipal Finance Management Act
The National Treasury has undertaken various initiatives to monitor the implementation of the two
Acts. Amongst these was the introduction of a Financial Management Capability Maturity Model which
culminated in identification of areas that need further attention to accelerate momentum in implementation
of the Acts. These results will be utilised to inform National and Provincial Treasuries including accounting
officers on strategies that need to be put in place to upgrade financial management methodologies within
departments.
National Treasury will also assist provincial and municipal accounting officers and develop corrective plans to
address areas of concern in order to ensure a structured and coherent approach. Analysis of the results will also
be used to compile detailed reports to the Standing Committee on Public Accounts (SCOPA) and to the Portfolio
Committee on Finance on progress made with implementation of the Acts.
Strengthening global financial regulation
The introduction of the Financial Stability Board in 2009 in response to the global economic meltdown by
the G20 necessitated the alignment of South African financial sector policy to the global regulation of the
financial services industry. The rationale is to sharpen and strengthen regulation in significant areas through
bolstering a methodical risk approach to mitigate risks posed by hedge funds and over the counter derivatives,
improving bank resilience to market volatility by raising the quality and level of capital held by these institutions,
encouraging transparent peer review mechanism aimed at adherence to international standards, and improving
universal accounting standards.
Regional integration in the Southern African Development Community and support development of African countries
Emphasis will be placed by the National Treasury on encouraging integration and development through the
Southern African Development Community and fostering new partnerships. Consistent with the regional
integration political, social and economic deliberations, requisite strategic plans are expected to be implemented
soon. This is applicable to the southern and eastern parts of Africa in particular and the Common Market for Eastern
and Southern Africa.
NT AR 10-11_10.indd 103 2011/08/17 10:02 AM

104
ACCOUNTING OFFICER’S OVERVIEW - continued
Annual Financial Statements
Nat
iona
l Tre
asur
y A
nnua
l Rep
ort 2
010/
11
104
report of the accounting officer - continued
national treasury vote 9
FOR the yeaR ended 31 maRch 2011
1.3 aNNual appropriatioN aND vote struCture
The total appropriation for National Treasury for the year ending 31 March 2011 amounted to R50.2 billion
(2009/10: R62.8 billion) and is divided into two main components namely: the operational budget and transfers.
Programmes 1 to 6 constitute National Treasury’s operational budget, which amounted to R1.4 billion (2009/10:
R1.3 billion). The operational budget comprised R552 million (2009/10: R408 million) for compensation of
employees, R810 million (2009/10: R788 million) for goods and services and R16 million (2009/10: R16 million)
for the acquisition of capital assets.
The remaining budget of R48.8 billion (2009/10: R61.6 billion) falls under Programmes 7, 8 and 9 and includes transfers
to provinces, municipalities, universities and technikons, departmental agencies, foreign institutions, payments of post
retirement benefits for a specific category of former employees and members of liberation movements.
1.4 proGraMMe struCture
There are nine programmes which fall under Vote 9: National Treasury: Administration, Public Finance and Budget
Management, Asset and Liability Management, Financial Management and Systems, Financial Accounting and
Reporting, Economic Policy and International Financial Relations, Provincial and Local Government Transfers, Civil and
Military Pensions, Contributions to Funds and Other Benefits, and Fiscal Transfers.
Administration provides strategic management and administrative support to the entire department. This is
achieved by ensuring that activities carried out by the department are mutually aligned and coordinated within
the context of departmental strategy and structure, in compliance with relevant legislation and best practices.
The Administration Programme comprises the Minister, Deputy Minister, Management, Corporate Services and Office
Accommodation sub programmes.
The total appropriation for this Programme amounted to R277 million (2009/10: R247 million). Expenditure
for Administration totalled R249 million (2009/10: R243 million). Expenditure incurred on compensation of
employees was R109 million (2009/10: R92 million), goods and services R134 million (2009/10: R143 million),
transfers R2 million (2009/10: R1.4 million) and capital expenditure R4 million (2009/10: R7.6 million).
Public Finance and Budget Management provides financial and budgetary analysis of government programmes,
advises on fiscal policy and public finance matters, coordinates intergovernmental fiscal relations and manages the
annual budget process as well as expenditure planning. These activities are organised into four sub programmes:
Public Finance, Budget Management, Intergovernmental Relations and Technical and Management Support.
The total appropriation for this Programme amounted to R315 million (2009/10: R265 million). Current expenditure
incurred totalled R230 million (2009/10: R242 million) and comprised compensation of employees R144 million
(2009/10: R123 million) and goods and services R86 million (2009/10: R119 million). Capital expenditure amounted
to R1 million (2009/10: R1 million). Transfer payments amounted to R22 million (2009/10: R20 million).
Asset and Liability Management manages government’s asset and liability portfolio, which includes amongst
others prudent cash management, asset restructuring and optimal management of government debt portfolio
both domestic and foreign. There are five sub programmes namely: Management, Asset Management, Liability
Management, Financial Operations and Strategy and Risk Management.
NT AR 10-11_10.indd 104 2011/08/17 10:02 AM

105
ACCOUNTING OFFICER’S OVERVIEW - continued
Nat
iona
l Tre
asur
y A
nnua
l Rep
ort 2
010/
11
Annual Financial Statements
105
report of the accounting officer - continued
national treasury vote 9
FOR the yeaR ended 31 maRch 2011
The total appropriation amounted to R73 million (2009/10: R61 million). Total expenditure incurred amounted to
R67 million (2009/10: R53 million) and consists of compensation of employees R47 million (2009/10: R38 million),
goods and services R19 million (2009/10: R15 million) and payments for capital expenditure R0.6 million (2009/10:
R0.1 million).
Financial Management and Systems manage and regulate government’s supply chain processes. It also implements
and maintains standardised financial systems in the national and provincial spheres of government. This will culminate
in the migration from the outdated systems to the new integrated financial management system. The Programme
consists of three sub programmes namely: Management, Supply Chain Management and Financial Systems.
The total appropriation for this Programme amounted to R433 million (2009/10: R459 million). The total
expenditure incurred amounted to R395 million (2009/10: R406 million) and comprises compensation of
employees R43 million (2009/10: R40 million), goods and services R352 million (2009/10: R365 million) and
payments for capital expenditure R1 million (2009/10: R1 million). The major cost pressure on this Programme
relates to professional service providers for maintaining the transversal systems and the development of the
Integrated Financial Management Systems (IFMS) project.
Financial Accounting and Reporting enforces and encourages accountability, transparency and effective
management of revenue, expenditure, assets and liabilities of departments, public entities, constitutional
institutions and local government, thus ensuring effective service delivery. The Programme consists of six
sub programmes: Financial Reporting for National Accounts, Financial Management Improvement, Investment
of Public Monies, Service Charges (Commercial Banks), Audit Statutory Bodies and Contingent Liabilities:
Reinsurance Liabilities.
The total appropriation for this Programme amounted to R206 million (2009/10: R139 million) and consisted of
an operational budget of R144 million (2009/10: R86 million). The total amount spent by the Programme was
R164 million (2009/10: R137 million), comprised compensation of employees R66 million (2009/10: R51 million),
goods and services R35 million (2009/10: R33 million), and capital expenditure R1.2 million (2009/10: R1 million).
Transfer payments amounted to R62 million (2009/10: R53 million).
In addition, this Programme is responsible for transfer payments to the Auditor-General of South Africa (AGSA) in terms of
the Public Audit Act (2004), whereby National Treasury is obliged to pay audit costs in respect of the auditing of statutory
bodies for any financial year concerned where such costs exceeds one per cent of the total expenditure of such bodies.
The transfer payments in respect of these statutory audit costs amounted to R21 million (2009/10: R19 million).
Economic Policy and International Financial Relations is responsible for specialist policy analysis and advisory
services in the areas of macroeconomics, microeconomics, financial sector, regulatory reform, tax policies, regional
integration and international financial relations. The Programme is made up of five sub programmes namely:
Management and Research, Financial Sector Policy, Tax Policy, International Economics and Economic Policy.
The total appropriation for this Programme amounted to R130 million (2009/10: R96 million). Total
expenditure incurred amounted to R104 million (2009/10: R94 million) and comprised compensation
of employees R68 million (2009/10: R59 million), goods and services R31 million (2009/10: R30 million)
and capital expenditure R0.5 million (2009/10: R0.5 million). Transfer payments amounted to R5.3 million
(2009/10: R5 million) for economic research.
NT AR 10-11_10.indd 105 2011/08/17 10:02 AM

106
ACCOUNTING OFFICER’S OVERVIEW - continued
Annual Financial Statements
Nat
iona
l Tre
asur
y A
nnua
l Rep
ort 2
010/
11
106
report of the accounting officer - continued
national treasury vote 9
FOR the yeaR ended 31 maRch 2011
Provincial and Local Government Transfers facilitates and manages the transfer of conditional grants to the provincial
and local spheres of government. The final adjusted appropriation for this programme amounted to R12.8 billion
(2009/10: R14.4 billion). The total expenditure amounted to R10.1 billion (2009/10: R14.3 billion) and included
conditional grants transferred directly from National Treasury’s vote to provinces and municipalities amounting to
R8.8 billion (2009/10: R9.2 billion) and R365 million (2009/10: R300 million) respectively. The balance of R882 million
(2009/10: R578 million) was in respect of the Neighbourhood Development Partnership grant to municipalities.
Civil and Military Pensions, Contributions to Funds and Other Benefits provides for non-contributory pensions and
post retirement medical benefits to former government employees and retired members of the military; and the
payment of compensation benefits to government employees in respect of temporary, total or partial disablement.
The total appropriation for this Programme amounted to R2.7 billion (2009/10: R4.9 billion). Expenditure for the
period under review amounted to R2.7 billion (2009/10: R4.9 billion) which comprised civil pensions and other
contributions R2.5 billion (2009/10: R4.8 billion) and military pensions and other contributions R164 million
(2009/10: R164 million) and goods and service amount to R38 million (2009/10: R25 million).
Fiscal Transfers transfer funds to other countries and multilateral and domestic institutions and public entities,
including international development institutions of which South Africa is a member. This Programme comprises
the following sub programmes: Eskom, Domestic Budgetary Transfers, Domestic Programme Transfers, African
Integration and Support, Multilateral Institutions and International Projects.
Transfers are made to the South African Revenue Service, Financial Intelligence Centre and the Financial and Fiscal
Commission for the fulfilment of their statutory obligations, and to the Development Bank of Southern Africa for
specified government programmes. In addition, funds are also paid to augment the Secret Services Account.
Domestic transfers accounted for 96 per cent of the total transfers allocated to this programme and amounted
to R12.7 billion (2009/10: R41.6 billion), of which the largest transfers went to the South African Revenue Service,
Secret Services and Eskom totalling R20 billion (2009/10: R40.2 billion).
Foreign transfer payments were made to:
• TheWorldBankGroup;
• TheAfricanDevelopmentBank(AfDB)andAfricanDevelopmentFund;
• CommonMonetaryAreaCompensationtoLesotho,NamibiaandSwaziland;
• TheAfricanintegrationandsupportprogrammes;and
• Variousinternationalprogrammes,suchasCommonWealthFundforTechnicalCooperation,theInvestment
Climate Facility, and the International Funding Facility for Immunisation.
The total foreign transfers made by National Treasury amounted to R532 million (2009/10: R554 million) of
which the transfer to Lesotho, Namibia and Swaziland makes up the largest portion of foreign transfers totalling
R397 million (2009/10: R410 million).
For more details on the Vote structures, annual appropriation and summarised explanations for variances please
refer to the Appropriation Statement and related notes thereto.
NT AR 10-11_10.indd 106 2011/08/17 10:02 AM
107
ACCOUNTING OFFICER’S OVERVIEW - continued
Nat
iona
l Tre
asur
y A
nnua
l Rep
ort 2
010/
11
Annual Financial Statements
107
report of the accounting officer - continued
national treasury vote 9
FOR the yeaR ended 31 maRch 2011
1.5 DepartMeNtal reveNue
Departmental revenue received during the reporting period amounted to R3.3 billion (2009/10: R3.5 billion) and
consisted of sales of goods and services of R51 million (2009/10: R300 million), fines, interest and dividends of R2.6
billion (2009/10: R2 billion) and other recoveries amounting to R0.7 million (2009/10: R1.2 billion).
For more details on departmental revenue, please refer to Note 2 of the Notes to the Financial Statements.
1.6 utilisatioN oF DoNor FuNDs
Local and foreign assistance received in cash during the reporting period amounted to R11 million (2009/10:
R15 million). Expenditure incurred amounted to R12 million (2009/10: R16 million). Other funds amounting
to R34.2 million (2009/10: R10.3 million) were transferred to external spending agencies on behalf of the
Reconstruction and Development Fund.
However, these amounts are not disclosed on the face of the Annual Financial Statements because National
Treasury was only channelling the funds as a link between the donors and spending agencies.
1.7 eveNts aFter tHe reportiNG Date
Payments amounting to R193 million (2009/10: R71 million) were processed during April 2011, which relate to the
2010/11 financial year. These payments were not included in the financial statements for the 2010/11 financial
year, which were prepared on the modified cash basis of accounting. (Refer to Note 22). Departmental revenue
amounting to R190 million (2009/10: R203 million) was received after year-end and surrendered to the National
Revenue Fund. (Refer to note 24).
1.8 2010 worlD Cup tiCKet expeNDiture
During the period under review there was no expenditure incurred on 2010 World Cup ticket or clothing by
National Treasury, TAU and PDF.
2. SERVICE RENdEREd by ThE dEPARTmENT
The core business of the National Treasury is of a fiscal and financial policy nature, servicing organs of the state
in all three spheres of government and foreign multilateral and national institutions with the exception of
Programme 8 which provides pensions and post retirement civil and military benefits. National Treasury is not
a service delivery department and does not render any services in the public domain on a recoverable basis.
Other technical assistance is disclosed with the Project Development Facility (PDF) and the Technical Assistance
Unit (TAU) trading accounts.
NT AR 10-11_10.indd 107 2011/08/17 10:02 AM

108
ACCOUNTING OFFICER’S OVERVIEW - continued
Annual Financial Statements
Nat
iona
l Tre
asur
y A
nnua
l Rep
ort 2
010/
11
108
report of the accounting officer - continued
national treasury vote 9
FOR the yeaR ended 31 maRch 2011
3. CAPACITy CONSTRAINTS
Human Resources
The human resources business unit has continued strengthening its partnership with business through its human
resources business partnership model. This has highlighted the benefits of internal mobility with internal hires
increasing significantly during the past year (54% against a target of 45%). Although the quality of hire of new
employees has improved to 85.44% (target 85%), there is still a need to focus on the critical and scarce skills to
maintain the human capability and capacity that the organisation needs to operate effectively. A skills database is
being implemented to assist in the identification, possible sourcing and recruitment of required skills.
The Internship programme has shown rewards with the intern conversion rate improving to 71%; the National
Treasury’s employee base now comprises 6% interns which is 4% higher than the 2% recommended by the DPSA.
The improvement can be assigned to the attention that is given to structured and targeted training initiatives that
meet the intern’s personal development needs as well as those of the organisation.
The Employee Wellness Programme was enhanced through the adoption of the SIYAPHILA initiative that created
greater awareness of the services this programme offers and also served as an important health awareness vehicle
in the education of employees regarding their health and the maintenance thereof.
Training remains an important element in capacitating the National Treasury and providing its employees with the
skills and competencies that it needs. The Human Resources Development business unit has expanded its training
portfolio and provided an average of 8.15 training days per employee during the year under review. New training
courses have been added whilst existing course content has been revised in order to provide the correct level of
training. The business unit also introduced its Leadership Development Programme (LDP) for senior management;
from Deputy-Director to DDG level. 53% of staff in these positions has already attended the training.
The human resources management business unit continues to improve its performance management process
through the active engagement of its human resources business partners. This engagement has improved
submission of performance agreements to 95% whilst escalating the submission of performance reviews to 78%.
Information and Communication Technology (ICT)
The ICT business unit has adopted the COBIT compliance framework as recommended by the DPSA, as its
operational standard. This is in line with the business unit’s strategy of developing its strategic information systems
plan that includes revision of existing ICT governance policies, processes and procedures that will also support its
implementation of an Enterprise Architecture.
An ICT forum was established with representatives of all business divisions to assist ICT to understand the real
requirements of business correctly and in so doing help it in the execution of its strategic objectives. ICT forum
outcomes, in collaboration with the knowledge management business unit has resulted in the re-development
of the National Treasury Intranet, the implementation of knowledge portal sites, research sites and ring-fenced
project management sites that provide business with a shared knowledge and secure working work space that
was not previously available. Stakeholder meetings were conducted with SITA to promote the upgrading of the
NT AR 10-11_10.indd 108 2011/08/17 10:02 AM

109
ACCOUNTING OFFICER’S OVERVIEW - continued
Nat
iona
l Tre
asur
y A
nnua
l Rep
ort 2
010/
11
Annual Financial Statements
109
report of the accounting officer - continued
national treasury vote 9
FOR the yeaR ended 31 maRch 2011
external network infrastructure in order to provide management with the access that is needed, not only for the
improved business support model, but also to accommodate the requirements of National Treasury’s business
continuity plan.
An audit was conducted on all operating systems and application software licenses to facilitate the implementation
of the Software Lifecycle Asset Management System, the implementation of which will provide centralised control
of software licenses and resultant cost savings.
Facilities Management
Being in the central business district of Pretoria presents significant challenges to this business unit, specifically
in the provision of parking and conducive working environments. Facilities Management is now providing
an ergonomic working environment in all business environments as well as 100% subsidised parking for all of
National Treasury’s level 9 and above employees. It also achieved a 100% effectiveness rating for its delivery
against occupational health and safety standards and building management and maintenance. The business
unit also achieved a client satisfaction rating of 84% on its services calls resolution and will be implementing a
preventative building maintenance plan to further enhance the customer service experience.
Meeting accommodation requirements remains a priority, with the National Treasury’s employee base expanding
in order to meet its strategic objectives. Although the property portfolio was already rated at 80% above industry
standards, facilities management will continue striving for perfection through the revision of its service level agreements
and creating more awareness of its services and striving towards a better understanding of business needs.
Project Support Office
The project support office has successfully expanded its services by offering basic project management and
workplace management by project, training. It has also extended its support function into other business units
to provide project management coaching, project administration support, as well as assistance with project
initiation, facilitation of project planning, and work break-down structures. It also provides the implementation
and maintenance of secure project collaboration and management sites in conjunction with the knowledge
management and ICT business units.
Knowledge Management
The core function of this business unit is the implementation of an integrated Information and Document
Management System (IDMS) as well as creating an effective environment for the capture and dissemination of the
intellectual capital and institutional memory of the National Treasury. It successfully implemented the PaperTrail
document tracking system and an electronic signature capability that not only enhances the tracking and
management of important business documents but also facilitates a fast and effective approval thereof through
the embedded electronic signature capability.
The National Treasury’s now has a fully functional archiving capability with the implementation of approved
divisional file plans and the establishment of two strategically located central registries to take care of all physical
records (mainly paper) of the organisation. A production-line scanning facility has been established to manage the
bulk scanning of documents as well as facilitating the conversion of paper-based information into text-searchable
NT AR 10-11_10.indd 109 2011/08/17 10:02 AM

110
ACCOUNTING OFFICER’S OVERVIEW - continued
Annual Financial Statements
Nat
iona
l Tre
asur
y A
nnua
l Rep
ort 2
010/
11
110
report of the accounting officer - continued
national treasury vote 9
FOR the yeaR ended 31 maRch 2011
electronic documents that comply with the international electronic archiving standards. Electronic records will
henceforth become available to business via the recently implemented electronic records management system
that was designed and developed to meet the business’ need for rapid access to information. The central registry
has extended its services into the operational environments of all business units in the organisation by providing
effective training of registry staff and office managers in the correct management and maintenance of their
records and files as well as providing guidance and hands-on support to emerging operational registries.
Some business-specific portal sites have already been developed in the Corporate Services division in conjunction
with the ICT business unit for the dissemination of information relating to the products and services that this
division offers. This service has already been extended to other business units in National Treasury and will
continue to grow as the value of these portal sites is being experienced.
4. TRAdING ENTITIES ANd PUblIC ENTITIES
4.1 traDiNG eNtities
Project Development Facility
The Project Development Facility (PDF) is a single function trading entity in the National Treasury’s Public Private
Partnership (PPP) unit, created in accordance with the PFMA. Its mandate is to assist national, provincial and
municipal spheres of government to pay for services provided by consultants (transaction advisors) to conduct
feasibility studies for PPP projects. After the financial closure of the PPP, the funds are recovered from the successful
private party bidder, allowing the PDF to fund further projects. The PDF also disburses technical assistance funds
for municipalities wishing to access capital grants from the Neighbourhood Development Partnership grant.
Technical Assistance Unit
The Technical Assistance Unit (TAU) is a facility that was established in 2001 in the National Treasury. It provides
project management support and technical assistance through a wide range of services to all spheres of
government, it was created as a trading entity. The TAU trading entity plays a major role in the fields of institutional
strengthening, organizational development and strategic, operational and project management support and
capacity building and development at an organizational, team and individual level by improving management
practices and thus contributing to value for money.
4.2 puBliC eNtities aND BusiNess eNterprises reportiNG to tHe MiNister oF FiNaNCe
Various public entities report to the Minister of Finance. This takes place through governance arrangements that
allow reporting institutions the autonomy that they require to meet their mandates. Their links to the Ministry
enable them to develop strategic alignment with Government’s policy goals.
Each entity produces, operates and reports according to its own strategic plan, and its inclusion in this section is to reflect
briefly on the broad approach of each entity and its relevance to the National Treasury’s strategic goals and business.
NT AR 10-11_10.indd 110 2011/08/17 10:02 AM

111
ACCOUNTING OFFICER’S OVERVIEW - continued
Nat
iona
l Tre
asur
y A
nnua
l Rep
ort 2
010/
11
Annual Financial Statements
111
report of the accounting officer - continued
national treasury vote 9
FOR the yeaR ended 31 maRch 2011
The South African Revenue Service, the Accounting Standards Board, and the Financial Intelligence Centre receive
transfers from the National Treasury. Other entities that report to the Minister of Finance, but which do not receive
transfers from the National Treasury, are the Development Bank of Southern Africa, the Financial Services Board,
the Public Investment Corporation and the South African Special Risk Insurance Association (SASRIA).
The Development Bank of Southern Africa (Schedule 2: Major public entity)
The DBSA’s primary purpose is to promote sustainable economic development and growth, and human resource
development and institutional capacity building by mobilising financial and other resources from the national
and international private and public sectors. Given the scope of the development challenge, and limited
financial, institutional and human capital in the SADC region, the Bank aims to proactively broaden and deepen
its development impact to support government in accelerating service delivery, job creation, integrated spatial
development and regional integration. In this context, the Bank is also redefining its role as a government delivery
agent and assuming the role as “Centre of Excellence for Infrastructure Development” focusing on:
• Catalyticinterventionstoenhancenationalcompetitivenessandsocialequity;
• Planninganddesignofprogrammes to boost changes in structure of economy;
• Highimpact,scalableinfrastructureprojects;
• Supportplananddesignofinfrastructure;and
• BeingaleadarrangerforGovernment.
Government and the DBSA have agreed that the Bank will work to improve infrastructure delivery, operations
and maintenance, with spinoffs for local employment and capacity development. The Bank is also encouraged to
champion a model that involves private sector co-financing of infrastructure projects. To support these initiatives,
government committed to raise the Bank’s callable capital by R15.2 billion to R20 billion, increasing its lending
capacity to R140 billion. Government is also exploring ways to reduce the DBSA’s exposure when lending to
municipalities that are credit risks. This will help to accelerate municipal infrastructure programmes.
The DBSA has developed three strategic perspectives that inform the organisation’s Key Performance Indicators
(KPIs) and these will guide delivery in 2011/12 financial year. These three strategic perspectives are:
• DevelopmentImpact(weightedat50%);
• Sustainability,bothdevelopmentalandfinancial(weightedat30%);and
• Organisationalcapability(weightedat20%).
The strategy still involves a strong focus on municipal support through the provision of infrastructure funding and
capacity building support (especially to under resourced municipalities) to increase delivery capacity and reduce
implementation risks in under developed regions. Key capacity building initiatives include Siyenza Manje (the
project implementation task force), Sustainable Communities and the Vulindlela Academy.
Over the medium term, the Bank’s strategic goals are to:
• Catalyse,expandandenabledeliveryofbasicandsocialservices;
• Provideandbuildhumanandinstitutionalcapacity;
• Promote broad-based economic growth (job creation, efficiency, fixed capital formation and regional
integration); and
• Engender sustainability, internally and externally, in financial, environmental, institutional, social and economic terms.
NT AR 10-11_10.indd 111 2011/08/17 10:02 AM

112
ACCOUNTING OFFICER’S OVERVIEW - continued
Annual Financial Statements
Nat
iona
l Tre
asur
y A
nnua
l Rep
ort 2
010/
11
112
report of the accounting officer - continued
national treasury vote 9
FOR the yeaR ended 31 maRch 2011
South African Revenue Service (Schedule 3A: National public entity)
As an innovative revenue and customs agency, South African Revenue Service (SARS) vision is to enhance
economic growth and social development in a manner which supports the country’s integration into the global
economy to the benefit of all South Africans.
Strategically, SARS has distilled its key objectives into four core outcomes, namely:
• Increasedcustomscompliance;
• Increasedtaxcompliance;
• IncreasedeaseandfairnessofdoingbusinesswithSARS;and
• Increasedcosteffectiveness,internalefficiencyandinstitutionalrespectability.
Detailed and tangible measurables have been developed for each of these four core outcomes. These are outlined
in the strategic plan for SARS.
Financial Services Board (Schedule 3A: National public entity)
The Financial Services Board is an independent body which supervises and regulates non-banking financial
services and is responsible for ensuring that regulated entities comply with the relevant legislation thereby
protecting the investing community and financial services customers.
The focus of the FSB for the period ahead will be to:
• Facilitatecommunicationprocesseswithclientsandpartnersinordertoenhanceperformance,accountability
and public confidence;
• Protectallinvestorsbyensuringintegrityandconfidenceinfinancialservices;and
• Implementorganisationaldevelopmentstrategiesthatwillpositivelyimpacttheworkenvironment.
Financial Intelligence Centre (Schedule 3A: National public entity)
The role of the Financial Intelligence Centre (FIC) is to identify the proceeds of acts of crime; identify money
laundering; identify financing of terrorism acts; and to share relevant information with the law enforcement
authorities, the South African Revenue Service and state security agencies. The FIC is also to share relevant
information with its counterparts in other countries.
The FIC has identified six strategic focal areas for the period ahead, namely:
• Improvedcomplianceofaccountableinstitutionsandsociety(inco-operationwiththerelevantsupervisory
bodies);
• Improved capacity in anti-money laundering (AML) and countering thefinancingof terrorism (CFT) in the
Eastern and Southern Africa region
• ImprovedAML/CFTframeworkinSouthAfrica;
• CommissioningandongoingdevelopmentoftheFIC’sinformationandcommunicationtechnologysystem;
• ImprovedutilisationoftheFICsproductsandservices(bylawenforcementauthorities,SouthAfricanRevenue
Service and Intelligence Agencies); and
• ImprovedsustainabilityandcapabilityoftheFIC.
NT AR 10-11_10.indd 112 2011/08/17 10:02 AM

113
ACCOUNTING OFFICER’S OVERVIEW - continued
Nat
iona
l Tre
asur
y A
nnua
l Rep
ort 2
010/
11
Annual Financial Statements
113
report of the accounting officer - continued
national treasury vote 9
FOR the yeaR ended 31 maRch 2011
Accounting Standards Board (Schedule 3A: National public entity)
The Accounting Standard Board (ASB) key function is to set standards of generally recognised accounting practice
for all spheres of government. It also promotes transparency in and effective management of revenue, expenditure,
assets and liabilities by the entities to which the standards apply.
The ASB’s 2011/12 work programme focuses on the following key areas:
• DevelopingastandardofGenerallyRecognisedAccountingPractices(GRAP)onrelatedparties.
• RespondingtoissuesflowingfromtheBoard’sinitiativestosimplifyGRAPstandards.
• Bi-annualreviewofStandardsofGRAPtoidentifyimprovementsthatareneededinresponsetoimplementation
issues identified in South Africa and changes to standards based on international equivalents.
• Co-operationwiththeInternationalPublicSectorAccountingStandardsBoardtodevelopInternationalPublic
Sector Accounting Standards (IPSAS).
• FacilitatingconcurrentexposureofproposedIPSASinSouthAfrica.
• The development of accounting and reporting guidelines, and undertaking research in identified areas of
financial reporting.
Implementation of the Standards of GRAP will lead to improved decision making, allocation of resources, and
improved accountability by having all spheres of government preparing financial statements that are comparable.
Independent Regulatory Board for Auditors (Schedule 3A: National public entity)
The Independent Regulatory Board for Auditors (IRBA) was established in terms of section 3 of the Auditing Profession Act
(2005), and came into effect in April 2006. The strategic focus of the Board is to protect the financial interest of the public
by ensuring that only suitably qualified individuals are admitted to the profession and that registered auditors deliver
services of the highest ethical standards.
South African Special Risk Insurance Association (SASRIA) Limited (Schedule 3B: National government business enterprise)
Sasria Ltd is a short term insurance company that was established by an Act of Parliament (Conversion of Sasria
Act of 1999). The company is wholly owned by the Government of South Africa and reports to the Minister
of Finance. The primary purpose of the company is to provide insurance against extraordinary perils that are
normally excluded by the conventional short term insurers. These risks include amongst others riot, strike, labour
disturbance and terrorism.
Sasria has determined a strategy based on the following five strategic objectives and several value-based initiatives.
The objectives for the 2011-2012 financial year are:
• OptimisationofShareholderValue.
• IntegrationandAlignmentofProcesses.
• EnsuringGoodCorporateGovernance;and
• KnowledgeManagement.
• InvestmentinHumanCapitalDevelopment.
• DevelopmentofaCustomer-centricCulture.
NT AR 10-11_10.indd 113 2011/08/17 10:02 AM

114
ACCOUNTING OFFICER’S OVERVIEW - continued
Annual Financial Statements
Nat
iona
l Tre
asur
y A
nnua
l Rep
ort 2
010/
11
114
report of the accounting officer - continued
national treasury vote 9
FOR the yeaR ended 31 maRch 2011
Key performance indicators include the following:
• Increasegrosswrittenpremium(GWP)incomeonexistingproductsby12.5%toR1,056million;
• AchieveGWPincomeonthenewproducts(SasriaWrap)by14.3%toR40million;
• Renewexistingreinsuranceagreementswithareductionincost.Thereductiontobemeasuredasapercentage
of GWP (from a forecast of 28.2% (2011 financial year) of GWP to a budget of 22.9% of GWP);
• Provideanaveragereturnoninvestmentsof7.4%toR304million.Thisisaconservativeestimatetakinginto
account the current economic climate;
• Maintainmanagementexpenseratioof6.7%(%ofgrossincome);
• IncreasecapitalreserveleveltoR3,741million;
• Improvecustomerservicebyreducingtheclaimsturnaroundtimetolessthan90daysfromclaimsubmission
date as well as improving Agents submission period of claims to 60 days from the date of loss;
• ImproveknowledgeofSasriaproductsbyconducting45industryproductawarenesstrainingsessions;
• Achieve Financial Services Board (FSB) deadline for the implementation of Solvency Assessment and
Management (SAM). The deadline is set January 2014.
• Make an annual contribution to South African Actuarial Development Project of R4,5million towards the
development of future Actuaries;
• Invest in rural development projects through the Futuregrowth Community Property Fund (R157 million invested).
Public Investment Corporation Limited (Schedule 3B: National government business enterprise)
The Public Investment Corporation (PIC) was only established as a corporate entity in 2005, in accordance with
the Public Investment Corporation Act (23 of 2004). The PIC is wholly owned by the South African government
and invests funds on behalf of the state. Major clients include the Government Employees Pension Fund (GEPF),
the Unemployment Insurance Fund (UIF), the Associated Institutions Pension Fund (AIPF), the Compensation
Commissioner: Pension Fund (CC: PF), the Compensation Fund (CF) and the Guardian’s Fund.
The Land and Agricultural Bank of South Africa (Land Bank) (Schedule 3B: National government business enterprise)
The Land and Agricultural Development Bank of South Africa (“Land Bank”) is a development finance institution
with a mandate to address agricultural and rural development in South Africa. The Land Bank operates in the
agricultural and agri-business sectors and is regulated by the Land and Agricultural Development Bank Act (2002)
and the Public Finance Management Act (1999). The Land Bank is keen to resume the development component
of its mandate, and this should be evident in the projects that are moving through the pipeline.
In 2009, National Treasury increased the guarantee to the Land Bank from R1.5 billion to R3.5 billion, in order
to increase the Land Bank credit standing. This guarantee is being reduced progressively through periodic cash
injections into the Land Bank, which will continue until the full R3.5 billion has been transferred. In 2009/10
and 2010/11 financial years, the Land Bank received R1 billion and R750 million, respectively, as part of the
recapitalisation programme, reducing the government guarantee to R1.75 billion. This impacted positively to the
Land Bank as is evident by its ability to restore investor confidence and was able to successfully issue R1.2 billion
paper in the South African corporate bond market in October 2010. In 2011, the Land Bank will receive further
R750 million.
The Land Bank is refocusing to prioritise support for emerging farmers, and to increase South Africa’s production
NT AR 10-11_10.indd 114 2011/08/17 10:02 AM

115
ACCOUNTING OFFICER’S OVERVIEW - continued
Nat
iona
l Tre
asur
y A
nnua
l Rep
ort 2
010/
11
Annual Financial Statements
115
report of the accounting officer - continued
national treasury vote 9
FOR the yeaR ended 31 maRch 2011
of food and fibre. The Land Bank is working with the relevant national departments to implement a support
programme for emerging farmers.
In addition, the Land Bank initiated the following activities to be carried out in the next three financial years in
order to ensure that the Bank achieves its stated objectives of comprehensive rural development agenda.
• EstablishmentoftheRetailEmergingMarketUnittofasttracksupportforemergingmarkets
• Awholesalefinancefacilityforstrategicpartnerstoon-lendtoqualifyingparticipants;and
• Anemergingfarmersupportfacility,approvedbyCabinetandcurrentlyinthepilotphase.
Co-operative Banks Development Agency (Schedule 3A: National public entity)
The Co-operative Banks Development Agency (CBDA) was established in terms of the Co-operative Banks Act
(2007). The objectives of the CBDA are to provide for the registration of co-operative banks comprising deposit
taking financial services co-operatives, savings and credit co-operatives, community banks and village banks, and
the regulation and supervision of these banks. The CBDA will also facilitate, promote and fund the education and
training of co-operative banks.
Government Employees Pension Fund)
Government Employees Pension Fund (GPEF) is a defined benefit fund that provides members with retirement,
resignation, disability and death benefits. The GEPF was established in terms of the Government Employees
Pension (GEP) Law, Proclamation 21 of 1996. Its mandate is to make provision for the payment of pensions and
certain benefits to persons in the employ of Government, certain bodies and institutions; and to the dependants
or nominees of such persons and to provide for matters incidental thereto.
Government Pensions Administration Agency
Government Pensions Administration Agency (GPAA) provides administrative services on behalf of the GEPF and
National Treasury in respect of post-retirement medical subsidies as provided for and regulated by Public Service
Coordinating Bargaining Council resolutions, military pensions in terms of the Military Pensions Act (1976), special
pensions in terms of the Special Pensions Act (1996), injury on duty in terms of the Compensation for Occupational
Injuries and Diseases Act (1993), and other benefits.
5. ORGANISATIONS TO WhOm TRANSFER PAymENTS hAVE bEEN mAdE
Funds to public entities and other institutions in terms of various legal provisions governing financial relations
between Government and those institutions are made available on the Fiscal Transfers Programme. Kindly refer to
annexures 1A to 1J.
In addition to the Fiscal Transfer Programme, funds for the Project Development Facility, Technical Assistance
Unit, Accounting Standards Board and Independent Regulatory Board for Auditors have been provided for, under
Programmes 2 and 5.
NT AR 10-11_10.indd 115 2011/08/17 10:02 AM

116
ACCOUNTING OFFICER’S OVERVIEW - continued
Annual Financial Statements
Nat
iona
l Tre
asur
y A
nnua
l Rep
ort 2
010/
11
116
report of the accounting officer - continued
national treasury vote 9
FOR the yeaR ended 31 maRch 2011
6. CORPORATE GOVERNANCE ARRANGEmENTS
6.1. iNterNal auDit FuNCtioN
The co-sourced Internal Audit Function (IAF) of the National Treasury was established in 2006, in terms of the
Public Finance Management Act (1 of 1999), as an integral part of the National Treasury system of governance.
The IAF provides objective and independent assurance to management and the Audit Committee on the
adequacy and effectiveness of internal controls, risk management and governance processes within National
Treasury. In pursuing this activity the IAF is guided by a fully functional Audit Committee which operates in terms
of an approved Audit Charter.
The IAF organisational structure was approved by the audit committee and the accounting officer. All positions
as per the approved organisational structure have since been filled, which will result in the conclusion of the co-
sourced service provider’s contract by the end of March 2011. The IAF continues to monitor its human capital and
ensures that there are processes in place to make sure that existing staff obtain appropriate qualifications.
The IAF through engagement with internal stakeholders formulated a comprehensive three-year rolling plan,
incorporating an annual plan that was approved by the Audit Committee. The annual audit plan was fully executed
during the year under review. The IAF also performed a number of consulting activities and relationships with
management improved as evidenced by the number of unplanned specialized audits, which, in turn, indicate that
management sees the value of the IAF within its system of governance.
The head of the IAF has complete access and a direct reporting line to the Audit Committee and reports at each
audit committee meeting on control weaknesses and other Internal Audit activities.
6.2 auDit CoMMittee
The Audit Committee continues to operate within its written terms of reference, which are reviewed annually.
The Audit Committee met six times during the financial year under review. In these meetings, the accounting
officer and executive management were always represented. The Auditor-General is always invited to attend, thus
ensuring that such meetings are as effective as possible.
6.3 risK MaNaGeMeNt
The National Treasury has continued to cultivate a culture of risk management through the ongoing support and
initiatives of the Enterprise Risk Management (ERM) Unit. The reviewed Enterprise Risk Management Strategy has
been successfully implemented throughout the department and encourages the integration of risk management
principles in day-to-day activities.
NT AR 10-11_10.indd 116 2011/08/17 10:02 AM

117
ACCOUNTING OFFICER’S OVERVIEW - continued
Nat
iona
l Tre
asur
y A
nnua
l Rep
ort 2
010/
11
Annual Financial Statements
117
report of the accounting officer - continued
national treasury vote 9
FOR the yeaR ended 31 maRch 2011
There has been an increase in risk management awareness through the distribution of regular communiqués
and the Unit continues to champion good governance practices through representation on key governance
committees. The department has an updated Risk Profile which is actively monitored by the Risk Management
Committee and the Audit Committee.
The ERM Unit has facilitated the drafting of Emergency Management and Business Continuity plans and will
support the implementation thereof going forward, ensuring that National Treasury can continue to operate in
a safe environment without disruption. The department monitored the successful implementation of its Fraud
Prevention Plan and encouraged strong ethical values from all of its employees. National Treasury has a zero
tolerance stance on corruption and the mitigation of identified corruption risks receives ongoing support at all
levels. The strengthening of processes to manage corruption has emanated in the drafting of a departmental
Corruption Case Management Framework.
The Risk Management Committee met four times during the year under review, and continues to provide objective
oversight and advice on the institutionalisation of risk management, business continuity and anti-corruption
processes throughout the department.
6.4 iNterNal poliCy review
During the 2010/11 financial year, the composition of the Governance Review Committee (GRC) was revised
and new members were appointed to serve in the committee. In addition, the policy development process was
overhauled through the implementation of the Framework for Development of Departmental Policies as well as
the revised GRC Terms of Reference which refined the mandate of the committee.
This process was informed by the gaps that were identified on the assessment of the work conducted by the GRC
throughout the years. Consequently, the internal policy development and review process has been tremendously
improved in line with the international best practices. This has culminated in extensive and rigorous review of
proposed policy documents tabled in the GRC during the 2010/11 financial year in a manner that facilitates
applicability, relevance and accuracy in order to ensure that approved policies are in line with the strategic
direction of the department and can be effectively implemented.
National Treasury will continue to improve its policies, prescripts and related business processes to ensure good
strategy execution and compliance with statutory requirements and best practices.
6.5 otHer GoverNaNCe Matters
6.5.1 Operational controls
In addition to the abovementioned governance arrangements, the following governance structures have been
complied with or have been given attention:
• FullyimplementedandappliedbusinessprocessesdesignedinthepreviousfinancialperiodforallCorporate
Services business units;
NT AR 10-11_10.indd 117 2011/08/17 10:02 AM
118
ACCOUNTING OFFICER’S OVERVIEW - continued
Annual Financial Statements
Nat
iona
l Tre
asur
y A
nnua
l Rep
ort 2
010/
11
118
report of the accounting officer - continued
national treasury vote 9
FOR the yeaR ended 31 maRch 2011
• EstablishedafullyfunctionalBidSpecificationandAdjudicationCommittee;
• Systemsputinplacetoensure:
• Theeffective,efficient,economicalandtransparentuseofthedepartmentalresources;
• Propermanagement,administration,safeguardingandmaintenanceoftheDepartment’sassetsandliabilities;
• Compliedwithall tax, levy,duty,pensionandauditcommitmentsas requiredby the relevantstatutesand
regulations;
• Settled contractual obligations andpaid outstanding amounts owing, including intergovernmental claims,
within the prescribed or agreed period, except where discrepancies have been identified or circumstances
beyond reasonable control have prevented the timely processing and finalisation of such payments;
• CompliedwiththeprovisionoftheDivisionofRevenueAct(1of2010),priortotransferringfundstoprovincial
or local governments and ensured that all funds transferred to provinces and municipalities were paid to their
primary bank accounts;
• Obtained written assurances from all entities confirming that those entities have implemented effective,
efficient and transparent financial management and internal control systems prior to funds being transferred
to those entities;
• Formulatedtheinternalbudgetguidelinedocumentandsubsistenceandtravellingmanual;and
• Submittedallrequiredreportstotherelevantauthorities.
6.5.2 Improvements implemented by the Special Pensions administration
In the 2000/2001 financial year the two Departments namely Finance & State Expenditure amalgamated to form
the National Treasury in terms of the Public Finance Management Act (Act 1 of 1999) as amended. Programme 8
which is mandated to manage civil and military pensions, contributions to funds and other benefits has been in
operation since the inception of the National Treasury.
The Programme was administered by the Government Employees Pension Fund (GEPF) and recently by the
Government Pensions Administration Agency (GPAA) since 2010. During the period under review, an irrecoverable
accumulated loss of approximately R419.7 million of pension benefits was realised which resulted from
ineffectiveness of control activities. Throughout the period, management has continuously improved the controls
to eliminate identified deficiencies and strengthen operational efficiency of the Programme. In a concerted effort
to root out fraud and corruption, a number of forensic investigations were commissioned, among these were
Percy Sonn, Special Investigations Unit and Nexus Forensic Services.
This revealed some deficiencies which include some of the applicants had Schedule 1 offenses and that
disqualified them from claiming pensions benefits from the programme; and misinterpretation of the Act leading
to disqualified individuals being paid pension benefits.
The following are some of the additional controls which were put in place by management:
• Thefunctionalstructurehasbeenchangedtoimprovesegregationoffunctions.
• TheSpecialPensionsAppealBoardhasbeentrainedbyanindependentlegalfirmandSpecialInvestigations
Unit (SIU) on the Special Pensions Act to prevent any future misinterpretation of the Act.
• Ateamofpersonnelwithlegalqualification,experienceandbackgroundwereappointedatAdjudicationand
Appeal level in order to increase legal capacity and to mitigate the risk of misinterpretation of the Act.
• Verificationhasbeendecentralized inorder tocreateaplatform forRegionalCoordinators tocontinuously
NT AR 10-11_10.indd 118 2011/08/17 10:02 AM

119
ACCOUNTING OFFICER’S OVERVIEW - continued
Nat
iona
l Tre
asur
y A
nnua
l Rep
ort 2
010/
11
Annual Financial Statements
119
report of the accounting officer - continued
national treasury vote 9
FOR the yeaR ended 31 maRch 2011
conduct outreach programmes to sensitize the local political structures on the criteria and requirements for
Special Pensions (SP).
• An independent legalfirm(THIPA Inc.)wasappointedtoreviewanddevelopaproceduremanualwhich
incorporates SIU recommendations.
• TheAdjudicationprocessisnowconductedinaccordancewiththeprovisionsoftheSpecialPensionsAct,
69 of 1996 as amended.
• All SP Staff have completed the National Intelligence Agency Security Vetting forms, and the vetting
process is still in progress. However, a preliminary risk assessment was also conducted by Human Resources
Management Unit before appointment of personnel.
• SPPersonnelhavenowbeengivenadailytargetinordertocloselymonitorandevaluatetheirdailyactivities.
The quality of work is also managed as both quantity and quality of work is important in reducing the
backlogs.
• All GEPF/GPAA Administrators are trained on the Special Pensions Act and the application thereof. This
exercise has provided an added advantage as all Regional offices personnel is capable of attending to both
civilian and Special Pensions clients.
• Cases have been handed over to the Commercial crimes unit and all unlawfully paid monthly Special
Pensions were suspended.
• Thereisaturnaroundstrategywhichisaimedatthemodernizationoftheprogrammetoimprovesystems.
7. dISCONTINUEd dEPARTmENTAl ACTIVITIES
The 2010 FIFA World Cup competition was completed on July 2010 and the mandate of the 2010 World Cup Unit
expired on 31 March 2011. The Unit migrated to the Mega Capital Projects Analysis Unit.
8. NEW dEPARTmENTAl ACTIVITIES
New Mega Capital Projects Analysis Unit
The role of the New Mega Capital Projects Analysis Unit is to support financing decisions in the National Treasury on
major economic infrastructure, typically which are of national strategic importance, by preparing in-depth assessments
on the likely total value to the country, including actual costs and benefits of selected proposed projects.
9. ASSET mANAGEmENT
In terms of Sub-section 38(1) (b) of the Public Finance Management Act (1 of 1999) as amended, the Accounting
Officer for the Department is responsible for the effective, efficient, economical and transparent use of the
resources of the Department.
NT AR 10-11_10.indd 119 2011/08/17 10:02 AM

120
ACCOUNTING OFFICER’S OVERVIEW - continued
Annual Financial Statements
Nat
iona
l Tre
asur
y A
nnua
l Rep
ort 2
010/
11
120
report of the accounting officer - continued
national treasury vote 9
FOR the yeaR ended 31 maRch 2011
In addition to the normal day-to-day administration and management of the National Treasury’s Asset Register,
the Department’s Asset Management Unit undertook several key activities to improve on the overall asset
management environment of the Department. These activities are as follows:
9.1 asset veriFiCatioN
Assets are departmental resources that should be disclosed in the Department’s annual financial statements. As
such the Department ensured that all departmental assets are properly tagged, verified and accounted for and
that any lost or redundant assets are identified and removed from the asset register on a timely basis.
An asset verification process was conducted during the current financial year in order to ensure that departmental
assets are accounted for and reported accurately in the annual financial statements.
9.2 asset Disposal
During the 2010/11 financial year, the Asset Management Unit, in line with National Treasury’s Asset Management
Disposal Policy, Treasury Regulations and the King II Code of Governance report pertaining to corporate social
responsibility managed to dispose redundant and obsolete assets as follows:
• Donated20desktopcomputerstoUkukhanyaKomsingaSpecialSchoolsituatedinKwaZuluNatal.(Theschool
caters for the physically and mentally challenged learners).
• Identifiedanddisposed154assetsthroughabidprocesstoNationalTreasurystaffmembers.Thesecomprised
of 2 motor vehicles, 146 computer equipment items and 6 items of office machinery and equipment.
The department will continue to support needy communities in the 2011/12 financial year.
9.3 aCquisitioN oF iCt assets
The department follows Supply Chain Management processes in the acquisition of assets. There is an Information
Communication and Technology (ICT) Procurement Committee, which comprises Financial Management,
Information Technology and Security Management. The terms of reference of the committee were reviewed
during the 2010/11 financial year. In order to measure the effectiveness of the committee, a questionnaire has
been designed, however the actual evaluation of the committee will be performed during the first quarter of the
2011/12 financial year.
10. INFORmATION ON PREdETERmINEd ObJECTIVES
Divisional heads have reported to the Director-General on a regular basis on the progress made with regard to the
programme delivery and measurable objectives, as contained in the National Treasury’s Strategic Plan.
NT AR 10-11_10.indd 120 2011/08/17 10:02 AM

121
ACCOUNTING OFFICER’S OVERVIEW - continued
Nat
iona
l Tre
asur
y A
nnua
l Rep
ort 2
010/
11
Annual Financial Statements
121
report of the accounting officer - continued
national treasury vote 9
FOR the yeaR ended 31 maRch 2011
11. SCOPA RESOlUTIONS
There were no new SCOPA resolutions relating to the National Treasury from the 2010/11 financial year.
12. PRIOR mOdIFICATIONS TO AUdIT REPORTS
No matters of significance were reported on by the Auditor-General regarding the Department’s administration.
Those minor housekeeping matters highlighted in the management letter were addressed and required control
processes implemented to prevent the re-occurrence of those matters.
13. ExEmPTIONS ANd dEVIATIONS RECEIVEd FROm ThE NATIONAl TREASURy
There were no exemptions and deviations received for the period under review..
14. ACkNOWlEdGEmENTS
I would like to express my appreciation to all the members of staff for their continuous dedication, commitment
and hard work in ensuring the proper execution of the National Treasury’s mandate.
15. APPROVAl
The Annual Financial Statements set out on pages 127 to 208 have been approved by the Accounting Officer.
LUNGISA FUZILE
Director-General, National Treasury
Date: 31 May 2011
NT AR 10-11_10.indd 121 2011/08/17 10:02 AM

For tHe year eNDeD 31 MarCH 2011
puBlisHeD By autHority
REPORT OF ThE AUdITOR-GENERAl TO PARlIAmENT ON VOTE
NO. 9: NATIONAl TREASURy
NT AR 10-11_10.indd 122 2011/08/17 10:02 AM

Annual Financial Statements
123
Nat
iona
l Tre
asur
y A
nnua
l Rep
ort 2
010/
11
national treasury vote 9
FOR the yeaR ended 31 maRch 2011
REPORT OF ThE AUdITOR-GENERAl TO PARlIAmENT ON VOTE 9: NATIONAl TREASURy
For tHe year eNDeD 31 MarCH 2011
puBlisHeD By autHority
REPORT ON ThE FINANCIAl STATEmENTS
iNtroDuCtioN
1. I have audited the accompanying financial statements of the National Treasury, which comprise the appropriation
statement, the statement of financial position as at 31 March 2011, and the statement of financial performance,
statement of changes in net assets and cash flow statement for the year then ended, and a summary of significant
accounting policies and other explanatory information, as set out on pages 127 to 169.
aCCouNtiNG oFFiCer’s respoNsiBility For tHe FiNaNCial stateMeNts
2. The accounting officer is responsible for the preparation of these financial statements in accordance with the
Departmental Financial Reporting Framework prescribed by the National Treasury and the requirements of the
Public Finance Management Act of South Africa, 1999 (Act No. 1 of 1999) (PFMA) and the Division of Revenue
Act of South Africa, 2010 (Act No. 1 of 2010) (DoRA), and for such internal control as management determines
necessary to enable the preparation of financial statements that are free from material misstatement, whether due
to fraud or error.
auDitor-GeNeral’s respoNsiBility
3. As required by section 188 of the Constitution of the Republic of South Africa, 1996 (Act No. 108 of 1996) and section
4 of the Public Audit Act of South Africa, 2004 (Act No. 25 of 2004) (PAA), my responsibility is to express an opinion on
these financial statements based on my audit.
4. I conducted my audit in accordance with International Standards on Auditing and General Notice 1111 of 2010
issued in Government Gazette 33872 of 15 December 2010. Those standards require that I comply with ethical
requirements and plan and perform the audit to obtain reasonable assurance about whether the financial
statements are free from material misstatement.
5. An audit involves performing procedures to obtain audit evidence about the amounts and disclosures in the
financial statements. The procedures selected depend on the auditor’s judgement, including the assessment
of the risks of material misstatement of the financial statements, whether due to fraud or error. In making those
risk assessments, the auditor considers internal control relevant to the entity’s preparation and fair presentation
of the financial statements in order to design audit procedures that are appropriate in the circumstances, but
not for the purpose of expressing an opinion on the effectiveness of the entity’s internal control. An audit also
includes evaluating the appropriateness of accounting policies used and the reasonableness of accounting
estimates made by management, as well as evaluating the overall presentation of the financial statements.
6. I believe that the audit evidence I have obtained is sufficient and appropriate to provide a basis for my audit opinion.
NT AR 10-11_10.indd 123 2011/08/17 10:02 AM

Annual Financial Statements
Nat
iona
l Tre
asur
y A
nnua
l Rep
ort 2
010/
11
124
REPORT OF THE AUDITOR-GENERAL TO PARLIAMENT ON vOTE 9: NATIONAL TREAsURy - continued
national treasury vote 9
FOR the yeaR ended 31 maRch 2011
opiNioN
7. In my opinion, the financial statements present fairly, in all material respects, the financial position of the National
Treasury as at 31 March 2011, and its financial performance and cash flows for the year then ended in accordance with
the Departmental Financial Reporting Framework prescribed by the National Treasury and the requirements of the
PFMA and DoRA.
eMpHasis oF Matters
8. I draw attention to the matters below. My opinion is not modified in respect of these matters:
Irregular expenditure
9. As disclosed in note 26 to the financial statements, irregular expenditure to the amount of R11 142 088 (2009-10:
R12 096 714) were incurred as a result of contravention of the Special Pensions Act, 1996 (Act No. 69 of 1996), (as
amended) (Special Pensions Act) and Treasury Regulations (TR) 8.2.1 and 8.2.2.
Material losses
10. As disclosed in note 28 to the financial statements, material losses to the amount of R3 587 108 (2009-10: R4 500 892)
were reported as a result of criminal conduct and ineffectiveness of control activities within programme 8: special
pensions.
aDDitioNal Matter
11. I draw attention to the matters below. My opinion is not modified in respect of this matter:
Financial reporting framework
12. The financial reporting framework prescribed and applied by the National Treasury is a compliance framework. Thus
my opinion would have reflected that the financial statements had been properly prepared instead of fairly presented
as required by section 20(2)(a) of the PAA, which requires me to express an opinion on the fair presentation of the
financial statements of the National Treasury.
REPORT ON OThER lEGAl ANd REGUlATORy REQUIREmENTS
13. In accordance with the PAA and in terms of General Notice 1111 of 2010, issued in Government Gazette 33872
of 15 December 2010, I include below my findings on the annual performance report as set out on pages 17
to 97 and material non-compliance with laws and regulations applicable to the department.
NT AR 10-11_10.indd 124 2011/08/17 10:02 AM

Annual Financial Statements
125
Nat
iona
l Tre
asur
y A
nnua
l Rep
ort 2
010/
11
REPORT OF THE AUDITOR-GENERAL TO PARLIAMENT ON vOTE 9: NATIONAL TREAsURy - continued
national treasury vote 9
FOR the yeaR ended 31 maRch 2011
preDeterMiNeD oBJeCtives
14. There were no material findings on the annual performance report concerning the presentation, usefulness and
reliability of the information.
CoMpliaNCe witH laws aND reGulatioNs
Strategic planning and performance management
15. The accounting officer did not prepare adequate quarterly reports on the progress made in achieving measurable
objectives and targets as required by TR 5.3.1.
Annual financial statements, performance and annual report
16. The accounting officer did not submit the annual performance report in time as required by Part C of General Notice
1111 of 2010, issued in Government Gazette No. 33872 of 15 December 2010.
17. The accounting officer submitted financial statements for auditing that were not prepared in all material aspects in
accordance with the Departmental Financial Reporting Framework prescribed by the National Treasury as required
by section 40(1)(b) of the PFMA. The material misstatements identified by the Auditor-General of South Africa
with regard to irregular expenditure, material losses and liabilities not fully quantified and disclosed subsequently
corrected.
Expenditure management
18. Expenditure was incurred without approval of a delegated official as per the requirements of section 44 of the PFMA
and TR 8.2.1 and 8.2.2.
Procurement and contract management
19. Payments that were made and identified within programme 8: special pensions were in contravention of the
Special Pensions Act and the PFMA.
INTERNAl CONTROl
20. In accordance with the PAA and in terms of General Notice 1111 of 2010, issued in Government Gazette 33872
of 15 December 2010, I considered internal control relevant to my audit, but not for the purpose of expressing an
opinion on the effectiveness of internal control. The matters reported below are limited to the significant deficiencies
that resulted in the findings on compliance with laws and regulations included in this report.
leaDersHip
21. Management did not adhere to the internal policies, procedures and guides and as a result there were instances of
non-compliance with the PFMA and TR’s. Internal control deficiencies and misinterpretation of the Special Pensions
Act resulted in instances of non-compliance thereof.
NT AR 10-11_10.indd 125 2011/08/17 10:02 AM

Annual Financial Statements
Nat
iona
l Tre
asur
y A
nnua
l Rep
ort 2
010/
11
126
REPORT OF THE AUDITOR-GENERAL TO PARLIAMENT ON vOTE 9: NATIONAL TREAsURy - continued
national treasury vote 9
FOR the yeaR ended 31 maRch 2011
OThER REPORTS
iNvestiGatioNs
22. A forensic investigation was conducted by the internal audit unit and an independent consulting firm into allegations
received from the Public Service Commission. The investigation was initiated based on the allegations of possible
procurement irregularities, the use of public resources for private purposes and leave irregularities. The investigation
has been finalised and the matter is now being dealt with through internal disciplinary processes.
23. An investigation is being conducted by the Specialised Audit Services (SAS) into an allegation received from the
Public Service Commission. The investigation was initiated based on the allegation of possible irregularities in the
appointment of a transversal contract. The investigation is still in progress.
24. An investigation is being conducted by the Public Service Commission into an allegation received by their office in
terms of irregular appointment of service providers by the National Treasury. The investigation is still in progress.
Pretoria
31 July 2011
NT AR 10-11_10.indd 126 2011/08/17 10:02 AM

Annual Financial Statements
127
Nat
iona
l Tre
asur
y A
nnua
l Rep
ort 2
010/
11
ACCOUNTING POlICIES
national treasury vote 7
FOR the yeaR ended 31 maRch 2011
The Financial Statements have been prepared in accordance with the following policies, which have been applied
consistently in all material aspects, unless otherwise indicated. However, where appropriate and meaningful,
additional information has been disclosed to enhance the usefulness of the Financial Statements and to comply
with the statutory requirements of the Public Finance Management Act, Act 1 of 1999 (as amended by Act 29 of
1999), and the Treasury Regulations issued in terms of the Act and the Division of Revenue Act, Act 1 of 2010.
1. PRESENTATION OF ThE FINANCIAl STATEmENTS
1.1 Basis oF preparatioN
The Financial Statements have been prepared on a modified cash basis of accounting, except where stated
otherwise. The modified cash basis constitutes the cash basis of accounting supplemented with additional
disclosure items. Under the cash basis of accounting transactions and other events are recognised when cash is
received or paid.
1.2 preseNtatioN CurreNCy
All amounts have been presented in the currency of the South African Rand (R) which is also the functional
currency of the department.
1.3 rouNDiNG
Unless otherwise stated all financial figures have been rounded to the nearest one thousand Rand (R’000).
1.4 CoMparative FiGures
Prior period comparative information has been presented in the current year’s financial statements. Where
necessary figures included in the prior period financial statements have been reclassified to ensure that the format
in which the information is presented is consistent with the format of the current year’s financial statements.
1.5 CoMparative FiGures - appropriatioN stateMeNt
A comparison between actual amounts and final appropriation per major classification of expenditure is included
in the Appropriation Statement.
NT AR 10-11_10.indd 127 2011/08/17 10:02 AM

Annual Financial Statements
Nat
iona
l Tre
asur
y A
nnua
l Rep
ort 2
010/
11
128
accounting policies - continued
national treasury vote 7
FOR the yeaR ended 31 maRch 2011
2. REVENUE
2.1 appropriateD FuNDs
Appropriated funds comprises of departmental allocations as well as direct charges against revenue fund (i.e.
statutory appropriation).
Appropriated funds are recognised in the financial records on the date the appropriation becomes effective.
Adjustments made in terms of the adjustments budget process are recognised in the financial records on the date
the adjustments become effective.
Unexpended appropriated funds are surrendered to the National/Provincial Revenue Fund. Any amounts owing
to the National/Provincial Revenue Fund at the end of the financial year are recognised as payable in the statement
of financial position.
Any amount due from the National/Provincial Revenue Fund at the end of the financial year is recognised as a
receivable in the statement of financial position.
2.2 DepartMeNtal reveNue
All departmental revenue is recognised in the statement of financial performance when received and is
subsequently paid into the National/Provincial Revenue Fund, unless stated otherwise.
Any amount owing to the National/Provincial Revenue Fund is recognised as a payable in the statement of
financial position.
No accrual is made for amounts receivable from the last receipt date to the end of the reporting period. These
amounts are however disclosed in the disclosure note to the annual financial statements.
2.3 DireCt exCHequer reCeipts
All direct exchequer receipts are recognised in the statement of financial performance when the cash is received
and is subsequently paid into the National/Provincial Revenue Fund, unless stated otherwise.
Any amount owing to the National/Provincial Revenue Funds at the end of the financial year is recognised as a
payable in the statement of financial position.
2.4 DireCt exCHequer payMeNts
All direct exchequer payments are recognised in the statement of financial performance when final authorisation
for payment is effected on the system (by no later than 31 March of each year).
NT AR 10-11_10.indd 128 2011/08/17 10:02 AM

Annual Financial Statements
129
Nat
iona
l Tre
asur
y A
nnua
l Rep
ort 2
010/
11
accounting policies - continued
national treasury vote 7
FOR the yeaR ended 31 maRch 2011
2.5 aiD assistaNCe
Aids assistance is recognised as revenue when received
All in-kind aid assistance is disclosed at fair value on the date of receipt in the annexures to the Annual Financial
Statements
The cash payments made during the year relating to aid assistance projects are recognised as expenditure in the
statement of financial performance when final authorisation for payments is effected on the system (by no later
than 31 March of each year)
The value of the assistance expensed prior to the receipt of funds is recognised as a receivable in the statement of
financial position.
Inappropriately expensed amounts using aid assistance and any unutilised amounts are recognised as payables in
the statement of financial position.
All CARA funds received must be recorded as revenue when funds are received. The cash payments made during the
year relating to CARA earmarked projects are recognised as expenditure in the statement of financial performance
when final authorisation for payments effected on the system (by no later then 31 March of each year).
Inappropriately expensed amounts using CARA funds are recognised as payables in the statement of
financial position. Any unutilised amounts are transferred to retained funds as they are not surrendered to
the revenue fund.
3. ExPENdITURE
3.1 CoMpeNsatioN oF eMployees
3.1.1 Salaries and wages
Salaries and wages are expensed in the statement of financial performance when the final authorisation for
payment is effected on the system (by no later than 31 March of each year).
Other employee benefits that give rise to a present legal or constructive obligation are disclosed in the disclosure
notes to the financial statements at its face value and are not recognised in the statement of financial performance
or position.
Employee costs are capitalised to the cost of a capital project when an employee spends more than 50% of
his/her time on the project. These payments form part of expenditure for capital assets in the statement of
financial performance.
NT AR 10-11_10.indd 129 2011/08/17 10:02 AM

Annual Financial Statements
Nat
iona
l Tre
asur
y A
nnua
l Rep
ort 2
010/
11
130
accounting policies - continued
national treasury vote 7
FOR the yeaR ended 31 maRch 2011
3.1.2 Social contributions
Employer contributions to post employment benefit plans in respect of current employees are expensed in the
statement of financial performance when the final authorisation for payment is effected on the system (by no later
than 31 March of each year).
No provision is made for retirement benefits in the financial statements of the department. Any potential liabilities
are disclosed in the financial statements of the National Revenue Fund and not in the financial statements of the
employer department.
Employer contributions made by the department for certain of its ex-employees (such as medical benefits) are
classified as transfers to households in the statement of financial performance.
3.2 GooDs aND serviCes
Payments made during the year for goods and/or services are recognised as an expense in the statement of
financial performance when the final authorisation for payment is effected on the system (by no later than 31
March of each year).
The expense is classified as capital if the goods and/or services were acquired for a capital project or if
the total purchase price exceeds the capitalisation threshold (currently R5, 000). All other expenditures are
classified as current.
Rental paid for the use of buildings or other fixed structures is classified as goods and services and not as rent on land.
3.3 iNterest aND reNt oN laND
Interest and rental payments are recognised as an expense in the statement of financial performance when the
final authorisation for payment is effected on the system (by no later than 31 March of each year). This item
excludes rental for the use of buildings or other fixed structures. If it is not possible to distinguish between
payment for the use of land and the fixed structures on it, the whole amount should be recorded under goods
and services.
3.4 payMeNts For FiNaNCial assets
Debts are written off when identified as irrecoverable. Debts written-off are limited to the amount of savings
and/or under spending of appropriated funds. The write off occurs at year-end or when funds are available. No
provision is made for irrecoverable amounts but an estimate is included in the disclosure notes to the financial
statements amounts.
All other losses are recognised when authorisation has been granted for the recognition thereof.
NT AR 10-11_10.indd 130 2011/08/17 10:02 AM

Annual Financial Statements
131
Nat
iona
l Tre
asur
y A
nnua
l Rep
ort 2
010/
11
accounting policies - continued
national treasury vote 7
FOR the yeaR ended 31 maRch 2011
3.5 traNsFers aND suBsiDies
Transfers and subsidies are recognised as an expense when the final authorisation for payment is effected on the
system (by no later than 31 March of each year).
3.6 uNautHoriseD expeNDiture
When confirmed unauthorised expenditure is recognised as an asset in the statement of financial position until
such time as the expenditure is either approved by the relevant authority, recovered from the responsible person
or written off as irrecoverable in the statement of financial performance.
Unauthorised expenditure approved with funding is derecognised from the statement of financial position when
the unauthorised expenditure is approved and the related funds are received.
Where the amount is approved without funding it is recognised as expenditure in the statement of financial
performance on the date of approval.
3.7 Fruitless aND wasteFul expeNDiture
Fruitless and wasteful expenditure is recognised as expenditure in the statement of financial performance
according to the nature of the payment and not as a separate line item on the face of the statement. If the
expenditure is recoverable it is treated as an asset until it is recovered from the responsible person or written off as
irrecoverable in the statement of financial performance.
3.8 irreGular expeNDiture
Irregular expenditure is recognised as expenditure in the statement of financial performance. If the
expenditure is not condoned by the relevant authority it is treated as an asset until it is recovered or written
off as irrecoverable.
4. ASSETS
4.1 CasH aND CasH equivaleNts
Cash and cash equivalents are carried in the statement of financial position at cost. Bank overdrafts are shown
separately on the face of the statement of financial position. For the purposes of the cash flow statement, cash
and cash equivalents comprise cash on hand, deposits held, other short-term highly liquid investments and bank
overdrafts.
NT AR 10-11_10.indd 131 2011/08/17 10:02 AM

Annual Financial Statements
Nat
iona
l Tre
asur
y A
nnua
l Rep
ort 2
010/
11
132
accounting policies - continued
national treasury vote 7
FOR the yeaR ended 31 maRch 2011
4.2 otHer FiNaNCial assets
Other financial assets are carried in the statement of financial position at cost.
4.3 prepayMeNts aND aDvaNCes
Amounts prepaid or advanced are recognised in the statement of financial position when the payments are made
and are derecognised as and when the goods/services are received or the funds are utilised. Prepayments and
advances outstanding at the end of the year are carried in the statement of financial position at cost.
4.4 reCeivaBles
Receivables included in the statement of financial position arise from cash payments made that are recoverable
from another party (including departmental employees) and are derecognised upon recovery or write-off.
Receivables outstanding at year-end are carried in the statement of financial position at cost plus any accrued
interest. Amounts that are potentials irrecoverable are included in the disclosure notes.
4.5 iNvestMeNts
Capitalised investments are shown at cost in the statement of financial position.
Investments are tested for an impairment loss whenever events or changes in circumstances indicate that the
investment may be impaired. Any impairment loss is included in the disclosure notes.
4.6 loaNs
Loans are recognised in the statement of financial position when the cash is paid to the beneficiary. Loans that are
outstanding at year-end are carried in the statement of financial position at cost plus accrued interest.
Amounts that are potentially irrecoverable are included in the disclosure notes.
4.7 iNveNtory
Inventories that qualify for recognition must be initially reflected at cost. Where inventories are acquired at no cost,
or for nominal consideration, their cost shall be their fair value at the date of acquisition.
All inventory items at year-end are reflected using the weighted average cost or FIFO cost formula.
NT AR 10-11_10.indd 132 2011/08/17 10:02 AM

Annual Financial Statements
133
Nat
iona
l Tre
asur
y A
nnua
l Rep
ort 2
010/
11
accounting policies - continued
national treasury vote 7
FOR the yeaR ended 31 maRch 2011
4.8 Capital assets
4.8.1 Movable assets
Initial recognition
A capital asset is recorded in the asset register on receipt of the item at cost. Cost of an asset is defined as the total
cost of acquisition. Where the cost cannot be determined accurately, the movable capital asset is stated at fair
value. Where fair value cannot be determined, the capital asset is included in the asset register at R1.
All assets acquired prior to 1 April 2002 are included in the register R1.
Subsequent recognition
Subsequent expenditure of a capital nature is recorded in the statement of financial performance as “expenditure
for capital assets” and is capitalised in the asset register of the department on completion of the project.
Repairs and maintenance is expensed as current “goods and services” in the statement of financial performance.
4.8.2 Immovable assets
Initial recognition
A capital asset is recorded on receipt of the item at cost. Cost of an asset is defined as the total cost of acquisition.
Where the cost cannot be determined accurately, the immovable capital asset is stated at R1 unless the fair value
for the asset has been reliably estimated.
Subsequent recognition
Work-in-progress of a capital nature is recorded in the statement of financial performance as “expenditure for
capital assets”. On completion, the total cost of the project is included in the asset register of the department that
is accountable for the asset.
Repairs and maintenance is expensed as current “goods and services” in the statement of financial performance.
5. lIAbIlITIES
5.1 payaBles
Recognised payables mainly comprise of amounts owing to other governmental entities. These payables are
carried at cost in the statement of financial position.
NT AR 10-11_10.indd 133 2011/08/17 10:02 AM

Annual Financial Statements
Nat
iona
l Tre
asur
y A
nnua
l Rep
ort 2
010/
11
134
accounting policies - continued
national treasury vote 7
FOR the yeaR ended 31 maRch 2011
5.2 CoNtiNGeNt liaBilities
Contingent liabilities are included in the disclosure notes to the financial statements when it is possible that
economic benefits will flow from the department, or when an outflow of economic benefits or service potential is
probable but cannot be measured reliably.
5.3 CoNtiNGeNt assets
Contingent assets are included in the disclosure notes to the financial statements when it is probable that an
inflow of economic benefits will flow to the entity.
5.4 CoMMitMeNts
Commitments are not recognised in the statement of financial position as a liability or as expenditure in the
statement of financial performance but are included in the disclosure notes.
5.5 aCCruals
Accruals are not recognised in the statement of financial position as a liability or as expenditure in the statement
of financial performance but are included in the disclosure notes.
5.6 eMployee BeNeFits
Short-term employee benefits that give rise to a present legal or constructive obligation are disclosed in the
disclosure notes to the financial statements. These amounts are not recognised in the statement of financial
performance or the statement of financial position.
5.7 lease CoMMitMeNts
Finance lease
Finance leases are not recognised as assets and liabilities in the statement of financial position. Finance lease
payments are recognised as an expense in the statement of financial performance and are apportioned between the
capital and interest portions. The finance lease liability is disclosed in the disclosure notes to the financial statements.
Operating lease
Operating lease payments are recognised as an expense in the statement of financial performance. The operating
lease commitments are disclosed in the disclosure notes of the annual financial statements.
NT AR 10-11_10.indd 134 2011/08/17 10:02 AM

Annual Financial Statements
135
Nat
iona
l Tre
asur
y A
nnua
l Rep
ort 2
010/
11
accounting policies - continued
national treasury vote 7
FOR the yeaR ended 31 maRch 2011
5.8 iMpairMeNt aND otHer provisioNs
The department tests for impairment where there is an indication that a receivable, loan or investment
may be impaired. An assessment of whether there is an indication of possible impairment is done at
each reporting date. An estimate is made for doubtful loans and receivables based on a review of all
outstanding amounts at year-end. Impairments on investments are calculated as being the difference
between the carrying amount and the present value of the expected future cash flows / service potential
flowing from the instrument.
Provisions are disclosed when there is a present legal or constructive obligation to forfeit economic benefits as a
result of events in the past and it is probable that an outflow of resources embodying economic benefits will be
required to settle the obligation and a reliable estimate of the obligation can be made.
6. RECEIVAblES FOR dEPARTmENTAl REVENUE
Receivables for departmental revenue are disclosed in the disclosure notes to the annual financial statements.
7. NET ASSETS
7.1 CapitalisatioN reserve
The capitalisation reserve comprises of financial assets and/or liabilities originating in a prior reporting
period but which are recognised in the statement of financial position for the first time in the current
reporting period.
Amounts are recognised in the capitalisation reserves when identified in the current period and are transferred
to the National/Provincial Revenue Fund when the underlining asset is disposed and the related funds are
received.
7.2 reCoveraBle reveNue
Amounts are recognised as recoverable revenue when a payment made in a previous financial year becomes
recoverable from a debtor in the current financial year. Amounts are either transferred to the National/
Provincial Revenue Fund when recovered or are transferred to the statement of financial performance when
written-off.
NT AR 10-11_10.indd 135 2011/08/17 10:02 AM

Annual Financial Statements
Nat
iona
l Tre
asur
y A
nnua
l Rep
ort 2
010/
11
136
accounting policies - continued
national treasury vote 7
FOR the yeaR ended 31 maRch 2011
8. RElATEd PARTy TRANSACTIONS
Specific information with regards to related party transactions is included in the disclosure notes.
9. kEy mANAGEmENT PERSONNEl
Compensation paid to key management personnel including their family members where relevant, is included in
the disclosure notes.
10. PUblIC PRIVATE PARTNERShIPS
A description of the PPP arrangement, the contract fees and current and capital expenditure relating to the PPP
arrangement is included in the disclosure notes.
NT AR 10-11_10.indd 136 2011/08/17 10:02 AM

Annual Financial Statements
137
Nat
iona
l Tre
asur
y A
nnua
l Rep
ort 2
010/
11
national treasury vote 7
FOR the yeaR ended 31 maRch 2011
APPROPRIATION STATEmENT
137
Nat
iona
l Tre
asur
y A
nnua
l Rep
ort 2
009/
10
app
ropr
iatio
n pe
r pro
gram
me
2010
/11
2009
/10
adju
sted
ap
prop
riatio
nsh
iftin
g of
fu
nds
vire
men
tFi
nal
appr
opria
tion
actu
al
expe
nditu
reva
rianc
eex
pend
iture
as
% o
f fina
l ap
prop
riatio
nFi
nal
appr
opria
tion
actu
al
expe
nditu
rer’
000
r’00
0r’
000
r’00
0r’
000
r’00
0%
r’00
0r’
000
1.
adm
inis
trat
ion
Cu
rren
t pay
men
t26
8,80
1-
(4,0
08)
264,
793
242,
715
22,0
7891
.7%
234,
849
233,
803
Tr
ansf
ers
and
subs
idie
s2,
074
-(7
4)2,
000
1,53
546
576
.8%
1,45
41,
373
Pa
ymen
t for
cap
ital a
sset
s10
,071
-(3
13)
9,75
84,
244
5,51
443
.5%
10,5
067,
614
Pa
ymen
t for
fina
ncia
l ass
ets
--
--
167
(167
)-
--
2.
publ
ic F
inan
ce a
nd B
udge
t Man
agem
ent
Cu
rren
t pay
men
t 31
6,75
7-
(26,
700)
290,
057
229,
497
60,5
6079
.1%
243,
307
241,
646
T r
ansf
ers
and
subs
idie
s22
,869
--
22,8
6922
,363
506
97.8
%20
,131
20,1
26
Paym
ent f
or c
apita
l ass
ets
1,70
1-
-1,
701
1,09
760
464
.5%
1,71
21,
144
Pa
ymen
t for
fina
ncia
l ass
ets
--
--
81(8
1)-
--
3.
ass
et a
nd l
iabi
lity
Man
agem
ent
Cu
rren
t pay
men
t 72
,137
--
72,1
3766
,543
5,59
492
.2%
60,6
6753
,070
Tr
ansf
ers
and
subs
idie
s-
-35
3534
197
.1%
--
Pa
ymen
t for
cap
ital a
sset
s31
5-
313
628
598
3095
.2%
307
104
P a
ymen
t for
fina
ncia
l ass
ets
--
--
29(2
9)-
--
4.
Fina
ncia
l Man
agem
ent a
nd s
yste
ms
C u
rren
t pay
men
t46
9,39
1-
(37,
644)
431,
747
394,
108
37,6
3991
.3%
457,
281
404,
299
Tr
ansf
ers
and
subs
idie
s48
--
4848
-10
0.0%
--
Pa
ymen
t for
cap
ital a
sset
s1,
116
--
1,11
696
215
486
.2%
2,19
81,
333
Pa
ymen
t for
fina
ncia
l ass
ets
--
--
1(1
)-
--
5.
Fina
ncia
l acc
ount
ing
and
repo
rtin
g
Curr
ent p
aym
ent
162,
538
(3,4
92)
(17,
000)
142,
046
100,
655
41,3
9170
.9%
84,6
4983
,393
Tr
ansf
ers
and
subs
idie
s58
,589
3,49
239
62,1
2062
,117
310
0.0%
53,2
9852
,832
Pa
ymen
t for
cap
ital a
sset
s2,
145
--
2,14
51,
199
946
55.9
%93
588
5
P aym
ent f
or fi
nanc
ial a
sset
s-
--
-35
(35)
--
-6.
ec
onom
ic p
olic
y an
d in
tern
atio
nal F
inan
cial
rel
atio
ns
Curr
ent p
aym
ent
124,
092
(300
)-
123,
792
98,6
6625
,126
79.7
%90
,223
88,9
05
T ran
sfer
s an
d su
bsid
ies
5,00
030
0-
5,30
05,
300
-10
0.0%
5,01
05,
010
Pa
ymen
t for
cap
ital a
sset
s87
0-
-87
046
740
353
.7%
629
572
Pa
ymen
t for
fina
ncia
l ass
ets
--
--
14(1
4)-
7.
prov
inci
al a
nd l
ocal
Gov
ernm
ent
tran
sfer
s
Tran
sfer
s an
d su
bsid
ies
12,8
34,5
00-
-12
,834
,500
10,0
91,0
082,
743,
492
78.6
%14
,410
,631
14,3
27,3
718.
Ci
vil a
nd M
ilita
ry p
ensi
ons,
Cont
ribut
ions
to F
unds
and
oth
er B
enefi
ts
C urr
ent p
aym
ent
35,0
0112
42,
937
38,0
6237
,904
158
99.6
%25
,499
25,4
97
Tran
sfer
s an
d su
bsid
ies
2,55
5,94
8(1
24)
104,
301
2,66
0,12
52,
659,
787
338
100.
0%4,
929,
803
4,92
9,64
3
Paym
ent f
or fi
nanc
ial a
sset
s-
--
-15
6(1
56)
-9.
F i
scal
tr a
nsfe
rs
Tran
sfer
s an
d su
bsid
ies
12,5
15,4
51-
(21,
886)
12,4
93,5
6512
,492
,356
1,20
910
0.0%
42,2
12,4
8142
,190
,108
P a
ymen
t for
fina
ncia
l ass
ets
20,7
50,0
00-
-20
,750
,000
20,7
46,7
003,
300
100.
0%-
-to
tal a
nnua
l app
ropr
iatio
n pe
r pro
gram
me
50,2
09,4
14-
-50
,209
,414
47,2
60,3
862,
949,
028
94.1
%62
,845
,570
62,6
68,7
28re
conc
iliat
ion
with
sta
tem
ent o
f Fin
anci
al p
erfo
rman
cea
dd:
Dep
artm
enta
l rec
eipt
s3,
340,
611
3,54
3,59
7A
id a
ssis
tanc
e10
,860
14,8
37a
ctua
l am
ount
s pe
r sta
tem
ent o
f Fin
anci
al p
erfo
rman
ce (t
otal
reve
nue)
53,5
60,8
8566
,404
,004
add
:A
id a
ssis
tanc
e11
,780
16,4
76a
ctua
l am
ount
s pe
r sta
tem
ent o
f Fin
anci
al p
erfo
rman
ce (t
otal
exp
endi
ture
)47
,272
,166
62,6
85,2
04
NT AR 10-11_10.indd 137 2011/08/17 10:02 AM

Annual Financial Statements
Nat
iona
l Tre
asur
y A
nnua
l Rep
ort 2
010/
11
138
appropriation statement - continued
national treasury vote 9
FOR the yeaR ended 31 maRch 2011a
ppro
pria
tion
per e
cono
mic
cla
ssifi
catio
n20
10/1
120
09/1
0
econ
omic
class
ifica
tion
adju
sted
ap
prop
riatio
nsh
iftin
g of
fu
nds
vire
men
tFi
nal
appr
opria
tion
actu
al
expe
nditu
reva
rianc
eex
pend
iture
as
% o
f fina
l ap
prop
riatio
n
Fina
l ap
prop
riatio
nac
tual
ex
pend
iture
r’00
0r’
000
r’00
0r’
000
r’00
0r’
000
%r’
000
r’00
0
Curr
ent e
xpen
ditu
reCo
mpe
nsat
ion
of e
mpl
oyee
s55
2,56
7-
-55
2,56
747
6,17
376
,394
86.2
%40
8,55
440
2,07
3G
oods
and
ser
vice
s89
6,15
0(3
,668
)(8
2,41
5)81
0,06
769
3,91
511
6,15
285
.7%
787,
921
728,
123
tran
sfer
s an
d su
bsid
ies
Prov
ince
s an
d m
unic
ipal
ities
12,7
09,5
00-
-12
,709
,500
10,0
41,0
082,
668,
492
79.0
%14
,300
,631
14,2
57,3
71D
epar
tmen
tal a
genc
ies
and
acco
unts
11,8
75,9
373,
535
-11
,879
,472
11,8
04,4
3275
,040
99.4
%10
,573
,420
10,5
10,9
85U
nive
rsiti
es a
nd te
chni
kons
5,50
030
0-
5,80
05,
300
500
91.4
%5,
456
5,45
6Fo
reig
n go
vern
men
ts a
nd in
tern
atio
nal o
rgan
isat
ions
56
4,89
1-
(29,
953)
534,
938
533,
729
1,20
999
.8%
555,
320
555,
186
Publ
ic c
orpo
ratio
ns a
nd p
rivat
e en
terp
rises
282,
595
-7,
700
290,
295
290,
295
-10
0.0%
31,2
67,4
7331
,267
,444
Non
-pro
fit in
stitu
tions
75
-(7
4)1
-1
-71
68H
ouse
hold
s 2,
555,
981
(167
)10
4,74
22,
660,
556
2,65
9,78
377
310
0.0%
4,93
0,43
74,
929,
952
paym
ents
for c
apita
l ass
ets
Mac
hine
ry a
nd e
quip
men
t16
,218
--
16,2
188,
568
7,65
052
.8%
16,2
8711
,652
paym
ents
for fi
nanc
ial a
sset
s20
,750
,000
--
20,7
50,0
0020
,747
,183
2,81
710
0.0%
-41
8*to
tal a
nnua
l app
ropr
iatio
n pe
r eco
nom
ic cl
assi
ficat
ion
50,2
09,4
14-
-50
,209
,414
47,2
60,3
862,
949,
028
94.1
%62
,845
,570
62,6
68,7
28
*Rec
lass
ifica
tion
of p
rior y
ear a
mou
nt in
line
with
the
Dep
artm
enta
l Rep
ortin
g Fr
amew
ork.
NT AR 10-11_10.indd 138 2011/08/17 10:02 AM

Annual Financial Statements
139
Nat
iona
l Tre
asur
y A
nnua
l Rep
ort 2
010/
11
appropriation statement - continued
national treasury vote 9
FOR the yeaR ended 31 maRch 2011
dETAIl PER PROGRAmmE 1: ADMINISTRATION
prog
ram
me
1 pe
r eco
nom
ic c
lass
ifica
tion
2010
/11
2009
/10
adju
sted
ap
prop
riatio
nsh
iftin
g of
fu
nds
vire
men
tFi
nal
appr
opria
tion
actu
al
expe
nditu
reva
rianc
eex
pend
iture
as
% o
f fina
l ap
prop
riatio
n
Fina
l ap
prop
riatio
nac
tual
ex
pend
iture
r’00
0r’
000
r’00
0r’
000
r’00
0r’
000
%r’
000
r’00
0
Curr
ent e
xpen
ditu
reCo
mpe
nsat
ion
of e
mpl
oyee
s12
7,29
8-
-12
7,29
810
8,78
818
,510
85.5
%91
,940
91,8
02G
oods
and
ser
vice
s14
1,50
3-
(4,0
08)
137,
495
133,
927
3,56
897
.4%
142,
909
141,
957
tran
sfer
s an
d su
bsid
ies
Dep
artm
enta
l age
ncie
s an
d ac
coun
ts42
043
-46
342
538
91.8
%38
835
8Pu
blic
cor
pora
tions
and
priv
ate
ente
rpris
es-
--
--
--
6637
Hou
seho
lds
1,65
4(4
3)(7
4)1,
537
1,10
942
872
.2%
1,00
097
7
paym
ents
for c
apita
l ass
ets
Mac
hine
ry a
nd e
quip
men
t10
,071
-(3
13)
9,75
84,
245
5,51
343
.5%
10,5
067,
615
paym
ents
for fi
nanc
ial a
sset
s-
--
-16
7(1
67)
--
44to
tal a
ppro
pria
tion
per e
cono
mic
cla
ssifi
catio
n28
0,94
6-
(4,3
95)
276,
551
248,
661
27,8
9089
.9%
246,
809
242,
790
prog
ram
me
1 pe
r sub
-pro
gram
me
2010
/11
2009
/10
adju
sted
ap
prop
riatio
nsh
iftin
g of
fu
nds
vir e
men
tFi
nal
appr
opria
tion
actu
al
expe
nditu
reva
rianc
ee x
pend
iture
as
% o
f fina
l ap
prop
riatio
n
Fina
l ap
prop
riatio
nac
tual
ex
pend
iture
r’00
0r’
000
r’00
0r’
000
r’00
0r’
000
%r’
000
r’00
0
1.1
Min
iste
r
Curr
ent e
xpen
ditu
re1,
816
--
1,81
61,
567
249
86.3
%1,
549
1,54
3
1.2
Dep
uty
Min
iste
r
Curr
ent e
xpen
ditu
re1,
496
--
1,49
61,
268
228
84.8
%1,
227
1,20
7
1.3
Man
agem
ent
Cu
rren
t exp
endi
ture
56,4
61
(3
67)
(1,7
98)
54,2
9652
,977
1,31
997
.6%
47,8
0747
,310
T r
ansf
ers
and
subs
idie
s-
--
--
--
6637
C a
pita
l exp
endi
ture
580
152
-
732
630
102
86.1
%1,
966
1,84
6
Paym
ent f
or fi
nanc
ial a
sset
s
-
--
-15
9(1
59)
--
-1.
4 Co
rpor
ate
serv
ices
Curr
ent e
xpen
ditu
re15
0,84
4(8
,350
)(2
,003
)14
0,49
112
1,09
119
,400
86.2
%12
8,04
912
7,58
0Tr
ansf
ers
and
subs
idie
s2,
074
-(7
4)2,
000
1,53
546
576
.8%
1,36
21,
310
Capi
tal e
xpen
ditu
re9,
334
(431
)(3
13)
8,59
03,
326
5,26
438
.7%
5,92
13,
963
P a
ymen
t for
fina
ncia
l ass
ets
-
--
-1
(1)
--
-1.
5 pr
oper
ty M
anag
emen
tCu
rren
t exp
endi
ture
58,1
848,
717
(207
)66
,694
65,8
1288
298
.7%
56,2
1756
,163
Tran
sfer
s an
d su
bsid
ies
--
--
--
-26
26Ca
pita
l exp
endi
ture
157
279
-43
628
814
866
.1%
2,61
91,
805
Pa
ymen
t for
fina
ncia
l ass
ets
-
--
-7
(7)
--
-to
tal a
ppro
pria
tion
per p
rogr
amm
e 1
280,
946
-(4
,395
)27
6,55
124
8,66
127
,890
89.9
%24
6,80
924
2,79
0
NT AR 10-11_10.indd 139 2011/08/17 10:02 AM

Annual Financial Statements
Nat
iona
l Tre
asur
y A
nnua
l Rep
ort 2
010/
11
140
appropriation statement - continued
national treasury vote 9
FOR the yeaR ended 31 maRch 2011
dETAIl PER PROGRAmmE 2: PUBLIC FINANCE AND BUDGET MANAGEMENT
prog
ram
me
2 pe
r eco
nom
ic c
lass
ifica
tion
2010
/11
2009
/10
adju
sted
ap
prop
riatio
nsh
iftin
g of
fu
nds
vire
men
tFi
nal
appr
opria
tion
actu
al
expe
nditu
reva
rianc
eex
pend
iture
as
% o
f fina
l ap
prop
riatio
n
Fina
l ap
prop
riatio
nac
tual
ex
pend
iture
r’00
0r’
000
r’00
0r’
000
r’00
0r’
000
%r’
000
r’00
0
Curr
ent e
xpen
ditu
reCo
mpe
nsat
ion
of e
mpl
oyee
s16
4,91
1-
-16
4,91
114
3,90
921
,002
87.3
%12
2,96
412
2,68
7G
oods
and
ser
vice
s15
1,84
6-
(26,
700)
125,
146
85,5
8839
,558
68.4
%12
0,34
311
8,90
6
tran
sfer
s an
d su
bsid
ies
Dep
artm
enta
l age
ncie
s an
d ac
coun
ts22
,363
--
22,3
6322
,363
-10
0.0%
18,8
9818
,898
Uni
vers
ities
and
tech
niko
ns50
0-
-50
0-
500
-45
645
6H
ouse
hold
s 6
--
6-
6-
777
772
paym
ent
for
capi
tal a
sset
sM
achi
nery
and
equ
ipm
ent
1,70
1-
-1,
701
1,09
760
464
.5%
1,71
21,
144
paym
ent
for
finan
cial
ass
ets
--
--
81(8
1)-
-53
tota
l app
ropr
iatio
n pe
r eco
nom
ic c
lass
ifica
tion
341,
327
-(2
6,70
0)31
4,62
725
3,03
861
,589
80.4
%26
5,15
026
2,91
6
prog
ram
me
2 pe
r sub
-pro
gram
me
2010
/11
2009
/10
adju
sted
ap
prop
riatio
nsh
iftin
g of
fu
nds
vir e
men
tFi
nal
appr
opria
tion
actu
al
expe
nditu
reva
rianc
eex
pend
iture
as
% o
f fina
l ap
prop
riatio
n
Fina
l ap
prop
riatio
nac
tual
ex
pend
iture
r’00
0r’
000
r’00
0r’
000
r’00
0r’
000
%r’
000
r’00
0
2.1
publ
ic F
inan
ce
Cu
rren
t exp
endi
ture
58,1
80-
-58
,180
45,6
5012
,530
78.5
%41
,033
40,6
59
Tran
sfer
s an
d su
bsid
ies
500
--
500
-50
0-
953
952
P a
ymen
t for
cap
ital a
sset
s
50
050
036
014
072
.0%
543
405
Pa
ymen
t for
fina
ncia
l ass
ets
--
--
10(1
0)-
--
2.2
Budg
et M
anag
emen
t
Cu
rren
t exp
endi
ture
46,9
71-
-46
,971
42,9
064,
065
91.3
%40
,536
39,9
32Tr
ansf
ers
and
subs
idie
s6
--
6-
6-
280
276
Pa
ymen
t for
cap
ital a
sset
s
42
3-
-42
320
721
648
.9%
379
210
Pa
ymen
t for
fina
ncia
l ass
ets
-
--
-2
(2)
--
-2.
3 in
terg
over
nmen
tal r
elat
ions
Curr
ent e
xpen
ditu
re48
,781
--
48,7
8136
,752
12,0
2975
.3%
32,8
9632
,541
Pa
ymen
t for
cap
ital a
sset
s
36
5-
-36
514
621
940
.0%
450
329
Pa
ymen
t for
fina
ncia
l ass
ets
-
--
-13
(13)
--
-2.
4 te
chni
cal a
nd M
anag
emen
t sup
port
Curr
ent e
xpen
ditu
re16
2,82
5-
(26,
700)
136,
125
104,
189
31,9
3676
.5%
128,
842
128,
514
Tran
sfer
and
sub
sidi
es22
,363
--
22,3
6322
,363
-10
0.0%
18,8
9818
,898
Paym
ent f
or c
apita
l ass
ets
413
--
413
384
2993
.0%
340
200
Pa
ymen
t for
fina
ncia
l ass
ets
-
--
-56
(56)
--
-to
tal a
ppro
pria
tion
per p
rogr
amm
e 2
341,
327
-(2
6,70
0)31
4,62
725
3,03
861
,589
80.4
%26
5,15
026
2,91
6
NT AR 10-11_10.indd 140 2011/08/17 10:02 AM

Annual Financial Statements
141
Nat
iona
l Tre
asur
y A
nnua
l Rep
ort 2
010/
11
appropriation statement - continued
national treasury vote 9
FOR the yeaR ended 31 maRch 2011
dETAIl PER PROGRAmmE 3: ASSET AND LIABILITy MANAGEMENT
prog
ram
me
3 pe
r ec
onom
ic c
lass
ifica
tion
2010
/11
2009
/10
adju
sted
ap
prop
riatio
nsh
iftin
g of
fu
nds
vire
men
tFi
nal
appr
opria
tion
actu
al
expe
nditu
reva
rianc
eex
pend
iture
as
% o
f fina
l ap
prop
riatio
n
Fina
l ap
prop
riatio
nac
tual
ex
pend
iture
r’00
0r’
000
r’00
0r’
000
r’00
0r’
000
%r’
000
r’00
0
Curr
ent e
xpen
ditu
reCo
mpe
nsat
ion
of e
mpl
oyee
s51
,141
--
51,1
4147
,478
3,66
392
.8%
41,3
3338
,070
Goo
ds a
nd s
ervi
ces
20,9
96-
-20
,996
19,0
651,
931
90.8
%19
,334
14,9
99tr
ansf
ers
and
subs
idie
sH
ouse
hold
s -
-35
3534
197
.1%
--
paym
ent
for
capi
tal a
sset
sM
achi
nery
and
equ
ipm
ent
315
-31
362
859
830
95.2
%30
710
4pa
ymen
t fo
r fin
anci
al a
sset
s-
--
-29
(29)
--
1to
tal a
ppro
pria
tion
per e
cono
mic
cla
ssifi
catio
n72
,452
-34
872
,800
67,2
045,
596
92.3
%60
,974
53,1
74
prog
ram
me
3 pe
r sub
-pro
gram
me
2010
/11
2009
/10
adju
sted
ap
prop
riatio
nsh
iftin
g of
fu
nds
vire
men
tFi
nal
appr
opria
tion
actu
al
expe
nditu
reva
rianc
eex
pend
iture
as
% o
f fina
l ap
prop
riatio
n
Fina
l ap
prop
riatio
nac
tual
ex
pend
iture
r’00
0r’
000
r’00
0r’
000
r’00
0r’
000
%r’
000
r’00
0
3.1
Man
agem
ent
Cu
rren
t exp
endi
ture
14,8
93(2
52)
-14
,641
12,6
382,
003
86.3
%13
,362
11,9
82
Pay
men
t for
cap
ital a
sset
s
25
045
313
608
585
2396
.2%
61-
--
--
29(2
9)-
--
3.2
ass
et M
anag
emen
t
Curr
ent e
xpen
ditu
re21
,310
--
21,3
1019
,059
2,25
189
.4%
16,9
0713
,792
Paym
ent f
or c
apita
l ass
ets
--
--
--
-70
67
3.3
liab
ility
Man
agem
ent
C u
rren
t exp
endi
ture
14,1
8515
0-
14,3
3513
,712
623
95.7
%12
,064
11,2
47
Tra
nsfe
rs a
nd s
ubsi
dies
--
3535
341
97.1
%-
-
3.4
F ina
ncia
l ope
r atio
nsCu
rren
t exp
endi
ture
14,2
4210
2-
14,3
4413
,874
470
96.7
%11
,299
10,0
89Pa
ymen
t for
cap
ital a
sset
s65
(45)
-20
137
65.0
%16
930
3.5
stra
tegy
and
ris
k M
anag
emen
tCu
rren
t exp
endi
ture
7,50
7-
-7,
507
7,26
024
796
.7%
7,03
55,
960
Paym
ent f
or c
apita
l ass
ets
--
--
--
-7
7to
tal a
ppro
pria
tion
per p
rogr
amm
e 3
72,4
52-
348
72,8
0067
,204
5,59
692
.3%
60,9
7453
,174
NT AR 10-11_10.indd 141 2011/08/17 10:02 AM

Annual Financial Statements
Nat
iona
l Tre
asur
y A
nnua
l Rep
ort 2
010/
11
142
appropriation statement - continued
national treasury vote 9
FOR the yeaR ended 31 maRch 2011
dETAIl PER PROGRAmmE 4: FINANCIAL MANAGEMENT AND SySTEMS
prog
ram
me
4 pe
r eco
nom
ic c
lass
ifica
tion
2010
/11
2009
/10
adju
sted
ap
prop
riatio
nsh
iftin
g of
fu
nds
vire
men
tFi
nal
appr
opria
tion
actu
al
expe
nditu
reva
rianc
eex
pend
iture
as
% o
f fina
l ap
prop
riatio
n
Fina
l ap
prop
riatio
nac
tual
ex
pend
iture
r’00
0r’
000
r’00
0r’
000
r’00
0r’
000
%r’
000
r’00
0
Curr
ent e
xpen
ditu
reCo
mpe
nsat
ion
of e
mpl
oyee
s44
,138
--
44,1
3842
,509
1,62
996
.3%
40,8
3639
,583
Goo
ds a
nd s
ervi
ces
425,
253
-(3
7,64
4)38
7,60
935
1,59
936
,010
90.7
%41
6,44
536
4,70
8tr
ansf
ers
and
subs
idie
sH
ouse
hold
s 48
--
4848
-10
0.0%
--
paym
ent
for
capi
tal a
sset
sM
achi
nery
and
equ
ipm
ent
1,11
6-
-1,
116
962
154
86.2
%2,
198
1,33
3pa
ymen
t fo
r fin
anci
al a
sset
s-
--
-1
(1)
--
8to
tal a
ppro
pria
tion
per e
cono
mic
cla
ssifi
catio
n 47
0,55
5-
(37,
644)
432,
911
395,
119
37,7
9291
.3%
459,
479
405,
632
prog
ram
me
4 pe
r sub
-pro
gram
me
2010
/11
2009
/10
adju
sted
ap
prop
riatio
nsh
iftin
g of
fu
nds
vire
men
tFi
nal
appr
opria
tion
actu
al
expe
nditu
reva
rianc
eex
pend
iture
as
% o
f fina
l ap
prop
riatio
n
Fina
l ap
prop
riatio
nac
tual
ex
pend
iture
r’00
0r’
000
r’00
0r’
000
r’00
0r’
000
%r’
000
r’00
04.
1 M
anag
emen
t
C u
rren
t exp
endi
ture
1,73
9-
-1,
739
1,53
420
588
.2%
1,73
61,
575
Pa
ymen
t for
cap
ital a
sset
s
15
--
15-
15-
10-
4.2
supp
ly C
hain
Man
agem
ent
Cu
rren
t exp
endi
ture
38,8
62(2
0)-
38,8
4231
,413
7,42
980
.9%
37,4
3730
,436
Tr
ansf
er a
nd s
ubsi
dies
48-
-48
48-
100.
0%-
-
Paym
ent f
or c
apita
l ass
ets
180
--
180
9684
53.3
%32
117
2
Paym
ent f
or fi
nanc
ial a
sset
s-
--
-1
(1)
--
-4.
3 F i
nanc
ial s
y ste
ms
Curr
ent e
xpen
ditu
re42
8,79
020
(37,
644)
391,
166
361,
161
30,0
0592
.3%
418,
108
372,
288
Paym
ent f
or c
apita
l ass
ets
921
--
921
866
5594
.0%
1,86
71,
161
tota
l app
ropr
iatio
n pe
r pro
gram
me
447
0,55
5-
(37,
644)
432,
911
395,
119
37,7
9291
.3%
459,
479
405,
632
NT AR 10-11_10.indd 142 2011/08/17 10:02 AM

Annual Financial Statements
143
Nat
iona
l Tre
asur
y A
nnua
l Rep
ort 2
010/
11
appropriation statement - continued
national treasury vote 9
FOR the yeaR ended 31 maRch 2011
dETAIl PER PROGRAmmE 5: FINANCIAL ACCOUNTING AND REPORTING
prog
ram
me
5 pe
r eco
nom
ic c
lass
ifica
tion
2010
/11
2009
/10
adju
sted
ap
prop
riatio
nsh
iftin
g of
fu
nds
vire
men
tFi
nal
appr
opria
tion
actu
al
expe
nditu
reva
rianc
eex
pend
iture
as
% o
f fina
l ap
prop
riatio
n
Fina
l ap
prop
riatio
nac
tual
ex
pend
iture
r’00
0r’
000
r’00
0r’
000
r’00
0r’
000
%r’
000
r’00
0
Curr
ent e
xpen
ditu
reCo
mpe
nsat
ion
of e
mpl
oyee
s78
,022
--
78,0
2265
,971
12,0
5184
.6%
51,1
8750
,786
Goo
ds a
nd s
ervi
ces
84,5
16(3
,492
)(1
7,00
0)64
,024
34,6
8429
,340
54.2
%33
,462
32,5
89
tran
sfer
s an
d su
bsid
ies
Dep
artm
enta
l age
ncie
s an
d ac
coun
ts58
,189
3,49
2-
61,6
8161
,679
210
0%52
,998
52,8
32H
ouse
hold
s 40
0-
3943
943
81
99.8
%30
0-
paym
ent
for
capi
tal a
sset
sM
achi
nery
and
equ
ipm
ent
2,14
5-
-2,
145
1,19
994
655
.9%
935
884
paym
ent
for
finan
cial
ass
ets
--
--
35(3
5)-
-19
tota
l app
ropr
iatio
n pe
r eco
nom
ic c
lass
ifica
tion
223,
272
-(1
6,96
1)20
6,31
116
4,00
642
,305
79.5
%13
8,88
213
7,11
0
prog
ram
me
5 pe
r sub
-pro
gram
me
2010
/11
2009
/10
adju
sted
ap
prop
riatio
nsh
iftin
g of
fu
nds
vire
men
tFi
nal
appr
opria
tion
actu
al
expe
nditu
reva
rianc
eex
pend
iture
as
% o
f fina
l ap
prop
riatio
n
Fina
l ap
prop
riatio
nac
tual
ex
pend
iture
r’00
0r’
000
r’00
0r’
000
r’00
0r’
000
%r’
000
r’00
0
5.1
Fina
ncia
l rep
ortin
g fo
r Nat
iona
l acc
ount
s
Curr
ent e
xpen
ditu
re51
,446
(92)
-51
,354
39,3
6711
,987
76.7
%45
,715
45,1
72
Tran
sfer
s an
d su
bsid
ies
37,2
34(4
00)
-36
,834
36,8
34-
100.
0%29
,560
29,2
60
Paym
ent f
or c
apita
l ass
ets
835
--
835
513
322
61.4
%54
340
5
Paym
ent f
or fi
nanc
ial a
sset
s
-
--
-34
(34)
--
-5.
2 Fi
nanc
ial M
anag
emen
t im
prov
emen
t
Curr
ent e
xpen
ditu
re11
0,89
2(3
,400
)(1
7,00
0)90
,492
61,1
6429
,328
67.6
%38
,661
38,0
63
Tran
sfer
s an
d su
bsid
ies
-3,
800
393,
839
3,83
9-
100.
0%4,
100
3,93
6
Paym
ent f
or c
apita
l ass
ets
1,31
0-
-1,
310
686
624
52.4
%40
836
6
Paym
ent f
or fi
nanc
ial a
sset
s
-
--
-1
(1)
--
-5.
3 in
vest
men
t of p
ublic
Mon
ies
Tr
ansf
ers
and
subs
idie
s1
--
1-
1-
1-
5.4
serv
ice
Char
ges
(Com
mer
cial
Ban
ks)
Curr
ent e
xpen
ditu
re20
0-
-20
012
476
62.0
%27
315
8
5.5
aud
it st
atut
ory
Bodi
esTr
ansf
ers
and
subs
idie
s21
,353
92-
21,4
4521
,444
110
0.0%
19,6
3619
,636
5.6
Cont
inge
nt l
iabi
litie
s: r
eins
uran
ce l
iabi
litie
sTr
ansf
ers
and
subs
idie
s1
--
1-
1-
1-
tota
l app
r opr
iatio
n pe
r pro
gram
me
522
3,27
2-
(16,
961)
206,
311
164,
006
42,3
0579
.5%
138,
882
137,
110
NT AR 10-11_10.indd 143 2011/08/17 10:02 AM

Annual Financial Statements
Nat
iona
l Tre
asur
y A
nnua
l Rep
ort 2
010/
11
144
appropriation statement - continued
national treasury vote 9
FOR the yeaR ended 31 maRch 2011
dETAIl PER PROGRAmmE 6: ECONOMIC POLICy AND INTERNATIONAL FINANCIAL RELATIONS
prog
ram
me
6 pe
r eco
nom
ic c
lass
ifica
tion
2010
/11
2009
/10
adju
sted
ap
prop
riatio
nsh
iftin
g of
fu
nds
vire
men
tFi
nal
appr
opria
tion
actu
al
expe
nditu
reva
rianc
eex
pend
iture
as
% o
f fina
l ap
prop
riatio
n
Fina
l ap
prop
riatio
nac
tual
ex
pend
iture
r’00
0r’
000
r’00
0r’
000
r’00
0r’
000
%r’
000
r’00
0
Curr
ent e
xpen
ditu
reCo
mpe
nsat
ion
of e
mpl
oyee
s87
,057
--
87,0
5767
,518
19,5
3977
.6%
60,2
9459
,145
Goo
ds a
nd s
ervi
ces
37,0
35(3
00)
-36
,735
31,1
485,
587
84.8
%29
,929
29,7
10
tran
sfer
s an
d su
bsid
ies
Uni
vers
ities
and
tech
niko
ns5,
000
300
-5,
300
5,30
0-
100.
0%5,
000
5,00
0H
ouse
hold
s-
--
--
--
1010
paym
ent
for
capi
tal a
sset
sM
achi
nery
and
equ
ipm
ent
870
--
870
467
403
53.7
%62
957
2pa
ymen
t fo
r fin
anci
al a
sset
s-
--
-14
(14)
--
50to
tal a
ppro
pria
tion
per e
cono
mic
cla
ssifi
catio
n 12
9,96
2-
-12
9,96
210
4,44
725
,515
80.4
%95
,862
94,4
87
prog
ram
me
6 pe
r sub
-pro
gram
me
2010
/11
2009
/10
adju
sted
ap
prop
riatio
nsh
iftin
g of
fu
nds
vire
men
tFi
nal
appr
opria
tion
actu
al
expe
nditu
reva
rianc
eex
pend
iture
as
% o
f fina
l ap
prop
riatio
n
Fina
l ap
prop
riatio
nac
tual
ex
pend
iture
r’00
0r’
000
r’00
0r’
000
r’00
0r’
000
%r’
000
r’00
0
6.1
Man
agem
ent a
nd r
esea
rch
Curr
ent e
xpen
ditu
re22
,567
3,65
3-
26,2
2022
,965
3,25
587
.6%
15,3
6614
,875
Tr
ansf
ers
and
subs
idie
s5,
000
300
-5,
300
5,30
0-
100.
0%5,
000
5,00
0
Paym
ent f
or c
apita
l ass
ets
185
--
185
8996
48.1
%88
86
Paym
ent f
or fi
nanc
ial a
sset
s
-
--
-5
(5)
-
6.2
Fina
ncia
l sec
tor p
olic
y
Cu
rren
t exp
endi
ture
24,4
95-
-24
,495
17,6
106,
885
71.9
%21
,155
20,8
39
Tran
sfer
s an
d su
bsid
ies
--
--
--
-10
10
Paym
ent f
or c
apita
l ass
ets
179
(33)
-14
693
5363
.7%
193
185
Pa
ymen
t for
fina
ncia
l ass
ets
--
--
1(1
)-
6.3
tax
polic
y
Cu
rren
t exp
endi
ture
24,9
01-
-24
,901
19,6
965,
205
79.1
%17
,395
17,2
86
Pay
men
t for
cap
ital a
sset
s
14
533
-17
817
71
99.4
%18
918
1
6.4
inte
rnat
iona
l eco
nom
ics
Curr
ent e
xpen
ditu
re25
,750
(2,0
00)
-23
,750
20,3
493,
401
85.7
%19
,964
19,8
55Pa
ymen
t for
cap
ital a
sset
s14
6-
-14
660
8641
.1%
6459
Pa
ymen
t for
fina
ncia
l ass
ets
-
--
-8
(8)
-
6.5
econ
omic
pol
icy
Curr
ent e
xpen
ditu
re26
,379
(1,9
53)
-24
,426
18,0
466,
380
73.9
%16
,343
16,0
50Pa
ymen
t for
cap
ital a
sset
s21
5-
-21
548
167
22.3
%95
61to
tal a
ppro
pria
tion
per p
rogr
amm
e 6
129,
962
--
129,
962
104,
447
25,5
1580
.4%
95,8
6294
,487
NT AR 10-11_10.indd 144 2011/08/17 10:02 AM

Annual Financial Statements
145
Nat
iona
l Tre
asur
y A
nnua
l Rep
ort 2
010/
11
appropriation statement - continued
national treasury vote 9
FOR the yeaR ended 31 maRch 2011
dETAIl PER PROGRAmmE 7: PROvINCIAL AND LOCAL GOvERNMENT TRANSFERS
prog
ram
me
7 pe
r eco
nom
ic c
lass
ifica
tion
2010
/11
2009
/10
adju
sted
ap
prop
riatio
nsh
iftin
g of
fu
nds
vire
men
tFi
nal
appr
opria
tion
actu
al
expe
nditu
reva
rianc
eex
pend
iture
as
% o
f fina
l ap
prop
riatio
n
Fina
l ap
prop
riatio
nac
tual
ex
pend
iture
r’00
0r’
000
r’00
0r’
000
r’00
0r’
000
%r’
000
r’00
0
tran
sfer
s an
d su
bsid
ies
Prov
ince
s an
d m
unic
ipal
ities
12,7
09,5
00-
-12
,709
,500
10,0
41,0
082,
668,
492
79.0
%14
,300
,631
14,2
57,3
71D
epar
tmen
tal a
genc
ies
and
acco
unts
125,
000
--
125,
000
50,0
0075
,000
40.0
%11
0,00
070
,000
tota
l app
ropr
iatio
n pe
r eco
nom
ic c
lass
ifica
tion
12,8
34,5
00-
-12
,834
,500
10,0
91,0
082,
743,
492
78.6
%14
,410
,631
14,3
27,3
71
prog
ram
me
7 pe
r sub
-pro
gram
me
2010
/11
2009
/10
adju
sted
ap
prop
riatio
nsh
iftin
g of
fu
nds
vire
men
tFi
nal
appr
opria
tion
actu
al
expe
nditu
reva
rianc
eex
pend
iture
as
% o
f fina
l ap
prop
riatio
n
Fina
l ap
prop
riatio
nac
tual
ex
pend
iture
r’00
0r’
000
r’00
0r’
000
r’00
0r’
000
%r’
000
r’00
0
7.1
prov
inci
al in
fras
truc
ture
Gra
nt
Tr
ansf
ers
and
subs
idie
s11
,314
,911
--
11,3
14,9
118,
844,
630
2,47
0,28
178
.2%
9,24
9,24
79,
249,
246
7.2
loca
l G
over
nmen
t Fi
nanc
ial
Man
agem
ent
rest
ruct
urin
g G
rant
s
Tr
ansf
ers
and
subs
idie
s36
4,58
9-
-36
4,58
936
4,58
9-
100.
0%29
9,99
029
9,99
07.
3 N
eigh
bour
hood
Dev
elop
men
t pa
rtne
rshi
p
Gra
nt
Tran
sfer
s an
d su
bsid
ies
1,15
5,00
0-
-1,
155,
000
881,
789
273,
211
76.3
%66
1,39
457
8,13
5
7.4
Gau
trai
n lo
anTr
ansf
ers
and
subs
idie
s-
--
--
--
4,20
0,00
04,
200,
000
tota
l app
ropr
iatio
n pe
r pro
gram
me
712
,834
,500
--
12,8
34,5
0010
,091
,008
2,74
3,49
278
.6%
14,4
10,6
3114
,327
,371
NT AR 10-11_10.indd 145 2011/08/17 10:02 AM

Annual Financial Statements
Nat
iona
l Tre
asur
y A
nnua
l Rep
ort 2
010/
11
146
appropriation statement - continued
national treasury vote 9
FOR the yeaR ended 31 maRch 2011
dETAIl PER PROGRAmmE 8: CIvIL AND MILITARy PENSIONS, CONTRIBUTIONS TO FUNDS AND OTHER BENEFITS
prog
ram
me
8 pe
r eco
nom
ic c
lass
ifica
tion
2010
/11
2009
/10
adju
sted
ap
prop
riatio
nsh
iftin
g of
fu
nds
vire
men
tFi
nal
appr
opria
tion
actu
al
expe
nditu
reva
rianc
ee x
pend
iture
as
% o
f fina
l ap
prop
riatio
n
Fina
l ap
prop
riatio
nac
tual
ex
pend
iture
r’00
0r’
000
r’00
0r’
000
r’00
0r’
000
%r’
000
r’00
0Cu
rren
t exp
endi
ture
Goo
ds a
nd s
ervi
ces
35,0
0112
42,
937
38,0
6237
,904
158
99.6
%25
,499
25,2
54tr
ansf
ers
and
subs
idie
sFo
reig
n go
vern
men
ts a
nd in
tern
atio
nal o
rgan
isat
ions
2,
000
-(3
67)
1,63
31,
633
-10
0.0%
1,38
21,
382
Non
-pro
fit in
stitu
tions
75
-(7
4)1
-1
-71
68H
ouse
hold
s 2,
553,
873
(124
)10
4,74
22,
658,
491
2,65
8,15
433
710
0.0%
4,92
8,35
04,
928,
193
paym
ent
for
finan
cial
ass
ets
--
--
156
(156
)-
243
tota
l app
ropr
iatio
n pe
r eco
nom
ic c
lass
ifica
tion
2,59
0,94
9-
107,
238
2,69
8,18
72,
697,
847
340
100.
0%4,
955,
302
4,95
5,14
0
prog
ram
me
8 pe
r sub
-pro
gram
me
2010
/11
2009
/10
adju
sted
ap
prop
riatio
nsh
iftin
g of
fu
nds
vir e
men
tFi
nal
appr
opria
tion
actu
al
expe
nditu
reva
rianc
eex
pend
iture
as
% o
f fina
l ap
prop
riatio
n
Fina
l ap
prop
riatio
nac
tual
ex
pend
iture
r’00
0r’
000
r’00
0r’
000
r’00
0r’
000
%r’
000
r’00
08.
1 Ci
vil p
ensi
ons
and
Cont
ribu
tions
to F
unds
C urr
ent e
xpen
ditu
re23
,181
124
13,3
0636
,611
36,4
5415
799
.6%
22,5
1122
,510
Tr
ansf
ers
and
subs
idie
s2,
384,
105
10,8
7610
0,55
82,
495,
539
2,49
5,20
633
310
0.0%
4,76
7,85
14,
767,
721
Pa
ymen
t for
fina
ncia
l ass
ets
--
--
156
(156
)-
8.2
Mili
tary
pen
sion
s an
d o
ther
Ben
efits
C u
rren
t exp
endi
ture
11,8
20-
(10,
369)
1,45
11,
450
199
.9%
2,98
82,
987
Tr
ansf
ers
and
subs
idie
s17
1,84
3(1
1,00
0)3,
743
164,
586
164,
581
510
0.0%
161,
952
161,
922
tota
l app
ropr
iatio
n pe
r pro
gram
me
82,
590,
949
-10
7,23
82,
698,
187
2,69
7,84
734
010
0.0%
4,95
5,30
24,
955,
140
NT AR 10-11_10.indd 146 2011/08/17 10:02 AM

Annual Financial Statements
147
Nat
iona
l Tre
asur
y A
nnua
l Rep
ort 2
010/
11
appropriation statement - continued
national treasury vote 9
FOR the yeaR ended 31 maRch 2011
dETAIl PER PROGRAmmE 9: FISCAL TRANSFERS
prog
ram
me
9 pe
r eco
nom
ic c
lass
ifica
tion
2010
/11
2009
/10
adju
sted
ap
prop
riatio
nsh
iftin
g of
fu
nds
vire
men
tFi
nal
appr
opria
tion
actu
al
expe
nditu
reva
rianc
eex
pend
iture
as
% o
f fina
l ap
prop
riatio
n
Fina
l ap
prop
riatio
nac
tual
ex
pend
iture
r’00
0r’
000
r’00
0r’
000
r’00
0r’
000
%r’
000
r’00
0tr
ansf
ers
and
subs
idie
sD
epar
tmen
tal a
genc
ies
and
acco
unts
11,6
69,9
65-
-11
,669
,965
11,6
69,9
65-
100.
0%10
,391
,136
10,3
68,8
97Fo
reig
n go
vern
men
ts a
nd in
tern
atio
nal o
rgan
isatio
ns
562,
891
-(2
9,58
6)53
3,30
553
2,09
61,
209
99.8
%55
3,93
855
3,80
4Pu
blic
cor
pora
tions
and
priv
ate
ente
rpris
es28
2,59
5-
7,70
029
0,29
529
0,29
5-
100.
0%31
,267
,407
31,2
67,4
07pa
ymen
t fo
r fin
anci
al a
sset
s20
,750
,000
--
20,7
50,0
0020
,746
,700
3,30
010
0.0%
tota
l app
ropr
iatio
n pe
r eco
nom
ic c
lass
ifica
tion
33,2
65,4
51-
(21,
886)
33,2
43,5
6533
,239
,056
4,50
910
0.0%
42,2
12,4
8142
,190
,108
prog
ram
me
9 pe
r sub
-pro
gram
me
2010
/11
2009
/10
adju
sted
ap
prop
riatio
nsh
iftin
g of
fu
nds
vire
men
tFi
nal
appr
opria
tion
actu
al
expe
nditu
reva
rianc
eex
pend
iture
as
% o
f fina
l ap
prop
riatio
n
Fina
l ap
prop
riatio
nac
tual
ex
pend
iture
r’00
0r’
000
r’00
0r’
000
r’00
0r’
000
%r’
000
r’00
09.
1 es
k om
Tran
sfer
s an
d su
bsid
ies
20,0
00,0
00-
-20
,000
,000
20,0
00,0
00-
100.
0%-
-9.
2 D
omes
tic B
udge
tar y
tr a
nsfe
r
Tr
ansf
ers
and
subs
idie
s11
,669
,965
--
11,6
69,9
6511
,669
,965
-10
0.0%
41,3
91,1
3641
,368
,897
Pa
ymen
t for
fina
ncia
l ass
ets
750,
000
--
750,
000
746,
700
3,30
099
.6%
--
9.3
Dom
estic
pro
gram
me
tran
sfer
s
Tr
ansf
ers
and
subs
idie
s28
2,59
5-
7,70
029
0,29
529
0,29
5-
100.
0%26
7,40
726
7,40
79.
4 D
omes
tic p
rogr
amm
e tr
ansf
ers
Tran
sfer
s an
d su
bsid
ies
399,
045
-(1
,200
)39
7,84
539
7,79
253
100.
0%40
9,88
040
9,87
89.
5 M
ultil
ater
al in
stitu
tions
Tr
ansf
ers
and
subs
idie
s14
8,56
7-
(25,
486)
123,
081
123,
080
110
0.0%
125,
459
125,
329
9.6
inte
rnat
iona
l pro
ject
sTr
ansf
ers
and
subs
idie
s15
,279
-(2
,900
)12
,379
11,2
241,
155
90.7
%18
,599
18,5
97to
tal a
ppro
pria
tion
per p
rogr
amm
e 9
33,2
65,4
51-
(21,
886)
33,2
43,5
6533
,239
,056
4,50
910
0.0%
42,2
12,4
8142
,190
,108
NT AR 10-11_10.indd 147 2011/08/17 10:02 AM

Annual Financial Statements
Nat
iona
l Tre
asur
y A
nnua
l Rep
ort 2
010/
11
148
national treasury vote 9
FOR the yeaR ended 31 maRch 2011
NOTES TO ThE APPROPRIATION STATEmENT
1. dETAIl OF TRANSFERS ANd SUbSIdIES AS PER APPROPRIATION ACT (AFTER VIREmENT):
Detail of these transactions can be viewed in the note on Transfers and subsidies, disclosure notes and Annexure
1 (A-H) to the Annual Financial Statements.
2. dETAIl OF SPECIFICAlly ANd ExClUSIVEly APPROPRIATEd AmOUNTS VOTEd (AFTER VIREmENT):
Detail of these transactions can be viewed in note 1 (Annual Appropriation) to the Annual Financial Statements.
3. dETAIl ON PAymENTS FOR FINANCIAl ASSETS
Detail of these transactions per programme can be viewed in note (Payment for financial assets) to the Annual
Financial Statements.
NT AR 10-11_10.indd 148 2011/08/17 10:02 AM

Annual Financial Statements
149
Nat
iona
l Tre
asur
y A
nnua
l Rep
ort 2
010/
11
notes to the appropriation statement - continued
national treasury vote 9
FOR the yeaR ended 31 maRch 2011
4.
ExPl
AN
ATIO
NS
OF
mAT
ERIA
l VA
RIA
NCE
S FR
Om
Am
OU
NTS
VO
TEd
(AFT
ER V
IREm
ENT)
:
per p
rogr
amm
eFi
nal
appr
opria
tion
actu
al
expe
nditu
reva
rianc
eva
rianc
e as
a
% o
f fina
l ap
prop
riatio
nex
plan
atio
ns o
f var
ianc
es
r’00
0r’
000
r’00
0%
prog
ram
me
1:A
dmin
istr
atio
n
276,
551
24
8,66
1
27
,890
10.1
Th
e de
viat
ion
is m
ainl
y du
e to
69
vaca
nt p
ositi
ons,
savi
ng o
n op
erat
iona
l exp
endi
ture
an
d de
lays
in
th
e in
form
atio
n te
chno
logy
ba
ckup
so
lutio
n,
the
switc
hboa
rd
infra
stru
ctur
e up
grad
es a
nd th
e ac
quis
ition
of t
he n
ew e
lect
roni
c se
curit
y sy
stem
.
prog
ram
me
2:Pu
blic
Fin
ance
and
Bud
get
Man
agem
ent
31
4,62
7
253,
038
61,5
89
19
.6
The
devi
atio
n is
mai
nly
due
to 2
8 va
cant
pos
ition
s, sa
ving
on
oper
atio
nal e
xpen
ditu
re
and
the
slow
de
ploy
men
t pr
oces
s of
te
chni
cal
assi
stan
ce
by
the
Infra
stru
ctur
e D
evel
opm
ent I
mpr
ovem
ent P
rogr
amm
e (ID
IP) p
roje
ct.
prog
ram
me
3:A
sset
and
Lia
bilit
y M
anag
emen
t
72
,800
67
,204
5,59
6
7.7
Th
e de
viat
ion
is m
ainl
y du
e to
11
vaca
nt p
ositi
ons,
savi
ng o
n op
erat
iona
l exp
endi
ture
an
d th
e de
lay
in th
e fin
alis
atio
n of
the
capi
tal s
truc
ture
and
div
iden
d po
licy
proj
ect.
prog
ram
me
4:Fi
nanc
ial M
anag
emen
t and
Sys
tem
s
432,
911
39
5,11
9
37
,792
8.7
Th
e de
viat
ion
is m
ainl
y du
e to
13
vaca
nt p
ositi
ons,
savi
ng o
n op
erat
iona
l exp
endi
ture
an
d th
e de
lay
in t
he In
tegr
ated
Fin
anci
al M
anag
emen
t Sy
stem
(IFM
S) p
roje
ct a
nd t
he
tran
sver
sal s
yste
ms.
prog
ram
me
5:Fi
nanc
ial A
ccou
ntin
g an
d Re
port
ing
20
6,31
1
164,
006
42,3
05
20
.5
The
devi
atio
n is
mai
nly
due
to 2
5 va
cant
pos
ition
s, sa
ving
on
oper
atio
nal e
xpen
ditu
re
and
the
new
ly e
stab
lishe
d Sp
ecia
lised
Aud
it Se
rvic
es u
nit n
ot b
eing
fully
cap
acita
ted.
prog
ram
me
6:Ec
onom
ic P
olic
y an
d In
tern
atio
nal
Fina
ncia
l Rel
atio
ns
12
9,96
2
104,
447
25,5
15
19
.6
The
devi
atio
n is
mai
nly
due
to 3
6 va
cant
pos
ition
s, sa
ving
on
oper
atio
nal e
xpen
ditu
re
and
the
dela
y in
the
fina
lisat
ion
of p
roce
ss fo
r th
e fir
m le
vel s
urve
y pe
rtai
ning
to
job
crea
tion.
prog
ram
me
7:Pr
ovin
cial
and
Loc
al G
over
nmen
t Tr
ansf
ers
12,8
34,5
00
10,0
91,0
08
2,
743,
492
21
.4
The
devi
atio
n is
due
to
with
hold
ing
of t
he P
rovi
ncia
l Inf
rast
ruct
ure
Gra
nt t
o pr
ovin
ces
and
the
Nei
ghbo
urho
od
Dev
elop
men
t Pa
rtne
rshi
p G
rant
(N
DPG
) du
e to
no
n-su
bmis
sion
of r
epor
ts a
s re
quire
d in
term
s of
the
Div
isio
n of
Rev
enue
Act
(DoR
A).
prog
ram
me
8:Ci
vil a
nd M
ilita
ry P
ensio
ns,
Cont
ribut
ions
to F
unds
and
Oth
er
Bene
fits
2,
698,
187
2,
697,
847
340
0
.0
The
actu
al e
xpen
ditu
re fo
r the
yea
r is
on p
ar w
ith th
e fin
al a
ppro
pria
tion.
prog
ram
me
9:Fi
scal
Tra
nsfe
rs
33
,243
,565
33
,239
,056
4,50
9
0.0
Th
e ac
tual
exp
endi
ture
for t
he y
ear i
s on
par
with
the
final
app
ropr
iatio
n
tota
l per
pro
gram
me
50,2
09,4
1447
,260
,386
2,94
9,02
85.
9
NT AR 10-11_10.indd 149 2011/08/17 10:02 AM

Annual Financial Statements
Nat
iona
l Tre
asur
y A
nnua
l Rep
ort 2
010/
11
150
notes to the appropriation statement - continued
national treasury vote 9
FOR the yeaR ended 31 maRch 2011
Per economic classificationFinal
appropriationActual
expenditureVariance
Variance as a % of finalappropriation
R’000 R’000 R’000 %
Current expenditure 1,362,634 1,1170,088 192,546 14.1Compensation of employees 552,567 476,173 76,394 13.8Goods and services 810,067 693,915 116,152 14.3
transfers and subsidies 28,080,562 25,334,547 2,746,015 9.8Provinces and municipalities 12,709,500 10,041,008 2,668,492 21.0Departmental agencies and
accounts11,879,472 11,804,432 75,040 0.6
Universities and technikons 5,800 5,300 500 8.6Public corporations and private
enterprises290,295 290,295 - 0.0
Foreign governments and international
organisations 534,938 533,729 1,209 0.2
Non-profit institutions 1 - 1 100.0Households 2,660,556 2,659,783 773 0.0
payments for capital assets 16,218 8,568 7,650 47.2Machinery and equipment 16,218 8,568 7,650 47.2
payments for capital assets 20,750,000 20,747,183 2,817 0.0
total per economic classification 50,209,414 47,260,386 2,949,028 5.9
NT AR 10-11_10.indd 150 2011/08/17 10:02 AM

Annual Financial Statements
151
Nat
iona
l Tre
asur
y A
nnua
l Rep
ort 2
010/
11
national treasury vote 9
FOR the yeaR ended 31 maRch 2011
STATEmENT OF FINANCIAl PERFOmANCE
PERFORmANCE Note 2010/11 2009/10R'000 R'000
reveNueAnnual appropriation 1 50,209,414 62,845,570Departmental revenue 2 3,340,611 3,543,597Aid assistance 3 10,860 14,837
total reveNue 53,560,885 66,404,004
expeNDitureCurrent expenditureCompensation of employees 4 476,173 402,073Goods and services 5 693,915 728,123Aid assistance 3 10,975 16,139total current expenditure 1,181,063 1,146,335
transfers and subsidies 25,334,547 61,526,462Transfers and subsidies 7 25,334,547 61,526,462
expenditure for capital assets 9,373 11,989Tangible capital assets 8 9,373 11,989total expenditure for capital assets
payment for financial assets1 6 20,747,183 418
total expeNDiture 47,272,166 62,685,204
surplus/(DeFiCit) For tHe year 6,288,719 3,718,800
reconciliation of net surplus/(deficit) for the yearVoted funds 2,949,028 176,842Annual appropriation 2,949,028 176,842 Departmental revenue 2 3,340,611 3,543,597Aid assistance 3 (920) (1,639)surplus/(DeFiCit) For tHe year 6,288,719 3,718,800
1THE PAYMENT FOR FINANCIAL ASSETS INCLUDES LOANS THAT WERE PREVIOUSLY CLASSIFIED UNDER TRANSFERS AND SUBSIDIES BUT HAVE BEEN RECLASSIFIED SINCE 1 APRIL 2010.
NT AR 10-11_10.indd 151 2011/08/17 10:02 AM

Annual Financial Statements
Nat
iona
l Tre
asur
y A
nnua
l Rep
ort 2
010/
11
152
national treasury vote 7
as at 31 march 2010
STATEmENT OF FINANCIAl POSITION
Note 2010/11 2009/10R'000 R'000
assets
Current assets 497,909 194,233Cash and cash equivalents 9 354,651 50,191Prepayments and advances 10 2,303 1,373Receivables 11 139,782 140,001Aid assistance receivable 3 1,173 2,668 Non-current assets 65,331,409 44,947,667Investments 12 400,956 400,956Loans 13 64,930,453 44,546 711 total assets 65,829,318 45,141,900
liaBilities
Current liabilities 497,640 193,984Voted funds to be surrendered to the Revenue Fund 14 478,747 176,842Departmental revenue to be surrendered to the Revenue Fund 15 7,522 2,841Bank Overdraft 16 1,862 -Payables 17 8,972 11,349Aid assistance repayable 3 379 -Aid assistance unutilised 3 158 2,952 total liaBilities 497,640 193,984
Net assets 65,331,678 44,947,916
represented by:Capitalisation reserve 400,956 400,956Recoverable revenue 64,930,722 44,546,960
total 65,331,678 44,947,916
NT AR 10-11_10.indd 152 2011/08/17 10:02 AM
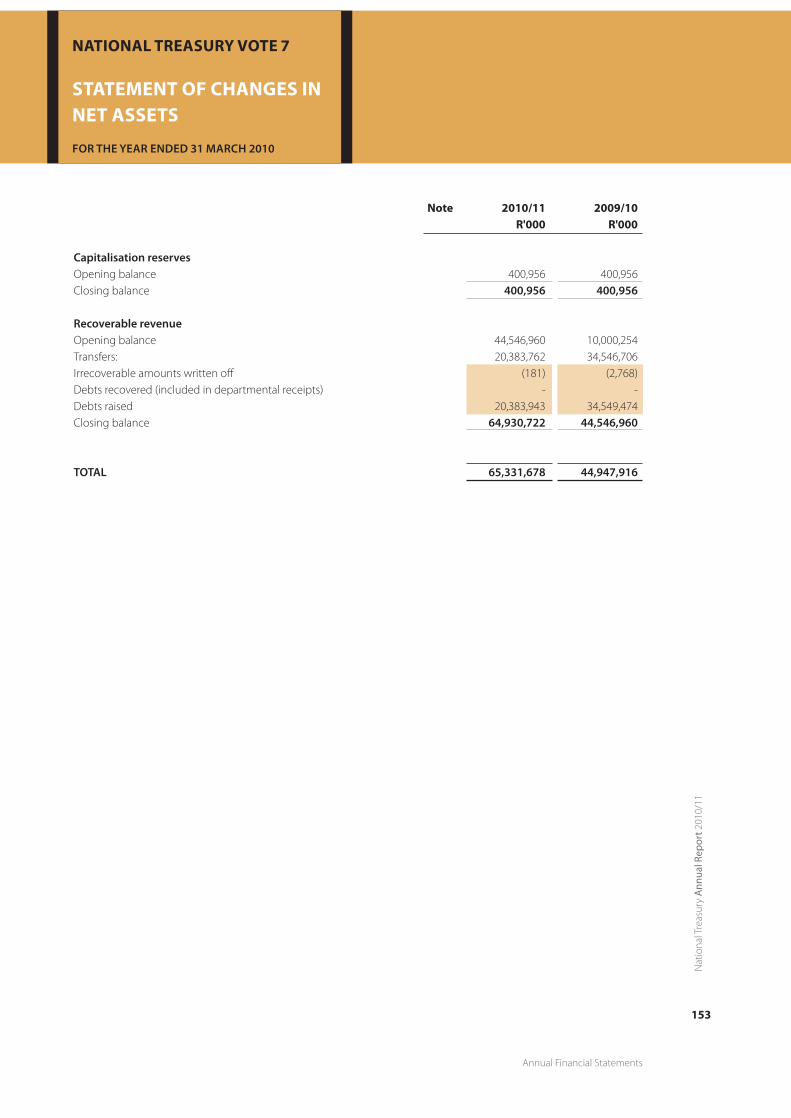
Annual Financial Statements
153
Nat
iona
l Tre
asur
y A
nnua
l Rep
ort 2
010/
11
national treasury vote 7
FOR the yeaR ended 31 maRch 2010
STATEmENT OF ChANGES IN NET ASSETS
Note 2010/11 2009/10R'000 R'000
Capitalisation reservesOpening balance 400,956 400,956Closing balance 400,956 400,956
recoverable revenueOpening balance 44,546,960 10,000,254Transfers: 20,383,762 34,546,706Irrecoverable amounts written off (181) (2,768)Debts recovered (included in departmental receipts) - -Debts raised 20,383,943 34,549,474Closing balance 64,930,722 44,546,960
total 65,331,678 44,947,916
NT AR 10-11_10.indd 153 2011/08/17 10:02 AM

Annual Financial Statements
Nat
iona
l Tre
asur
y A
nnua
l Rep
ort 2
010/
11
154
national treasury vote 7
FOR the yeaR ended 31 maRch 2010
CASh FlOW STATEmENT
CASh FlOW Note 2010/11 2009/10R'000 R'000
CasH Flows FroM operatiNG aCtivities
Receipts 50,937,219 66,324,881Annual appropriated funds received 1 47,739,133 62,845,570Departmental revenue received 2 3,187,226 3,464,474Aid assistance received 3 10,860 14,837
Net decrease/(increase) in working capital (3,088) 6,795Surrendered to Revenue Fund (3,512,772) (3,654,564)Surrendered to RDP Fund/Donor - (7,811)Current payments (1,181,063) (1,146,335)Payments for financial assets2 (20,747,183) (418)Transfers and subsidies paid (25,334,547) (61,526,462)Net cash flow available from operating activities 18 158,566 (3,914)
CasH Flows FroM iNvestiNG aCtivitiesPayments for capital assets 8 (9,373) (11,989)Proceeds from sale of capital assets 2 86 212Increase in loans (20,383,742) (34,546,711)Net cash flows from investing activities (20,393,029) (34,558,488)
CasH Flows FroM FiNaNCiNG aCtivitiesDistribution/dividend received 2 153,299 78,911Increase in net assets 20,383,762 34,546,706Net cash flows from financing activities 20,537,061 34,625,617
Net increase/(decrease) in cash and cash equivalents 302,598 63,215
Cash and cash equivalents at beginning of period 50,191 (13,024)
Cash and cash equivalents at end of period 9 & 19 352,789 50,191
2 The Payment for financial assets includes loans that were previously classified under Transfers and Subsidies but have been reclassified since 1 April 2010.
NT AR 10-11_10.indd 154 2011/08/17 10:02 AM

Annual Financial Statements
155
Nat
iona
l Tre
asur
y A
nnua
l Rep
ort 2
010/
11
national treasury vote 7
FOR the yeaR ended 31 maRch 2010
NOTES TO ThE ANNUAl FINANCIAl STATEmENTS
1. ANNUAl APPROPRIATION
FinalAppropriation
Actual Funds
Received
Funds notrequested/not
received
Appropriationreceived2008/09
R’000 R’000 R’000 R’000
Administration 276,551 276,551 - 246,809Public Finance and Budget Management 314,627 314,627 - 265,150Asset and Liability Management 72,800 72,800 - 60,974Financial Management and Systems 432,911 432,911 - 459,479Financial Accounting and Reporting 206,311 206,311 - 138,882Economic Policy and International Financial Relations
129,962 129,962 95,862
Provincial and Local Government Transfers3 12,834,500 10,364,219 2,470,281 14,410,631Civil and Military Pensions, Contribution
to Funds and Other benefits
2,698,187 2,698,187 - 4,955,302
Fiscal transfers 33,243,565 33,243,565 - 42,212,481
total 50,209,414 47,739,133 2,470,281 62,845,570
3Funds were not requested due to withholding of the Provincial Infrastructure Grant to provinces.
2. dEPARTmENTAl REVENUE
Note 2010/11 2009/10R'000 R'000
Sales of goods and services other than capital assets 2.1 50,960 300,421Interest, dividends and rent on land 2.2 2,609,482 2,085,054Sales of capital assets 2.3 86 212Financial transactions in assets and liabilities 2.4 680,083 1,157,910Departmental revenue collected 3,340,611 3,543,597
2.1 Sales of goods and services other than capital assets
Sales of goods and services produced by the department 50,955 300,418Sales by market establishment 92 85Administrative fees 12 -Other sales 50,851 300,333Sales of scrap, waste and other used current goods 5 3total 50,960 300,421
2.2 Interest, dividends and rent on land
Interest 2,456,183 2,006,143Dividends 153,299 78,911total 2,609,482 2,085,054
NT AR 10-11_10.indd 155 2011/08/17 10:02 AM
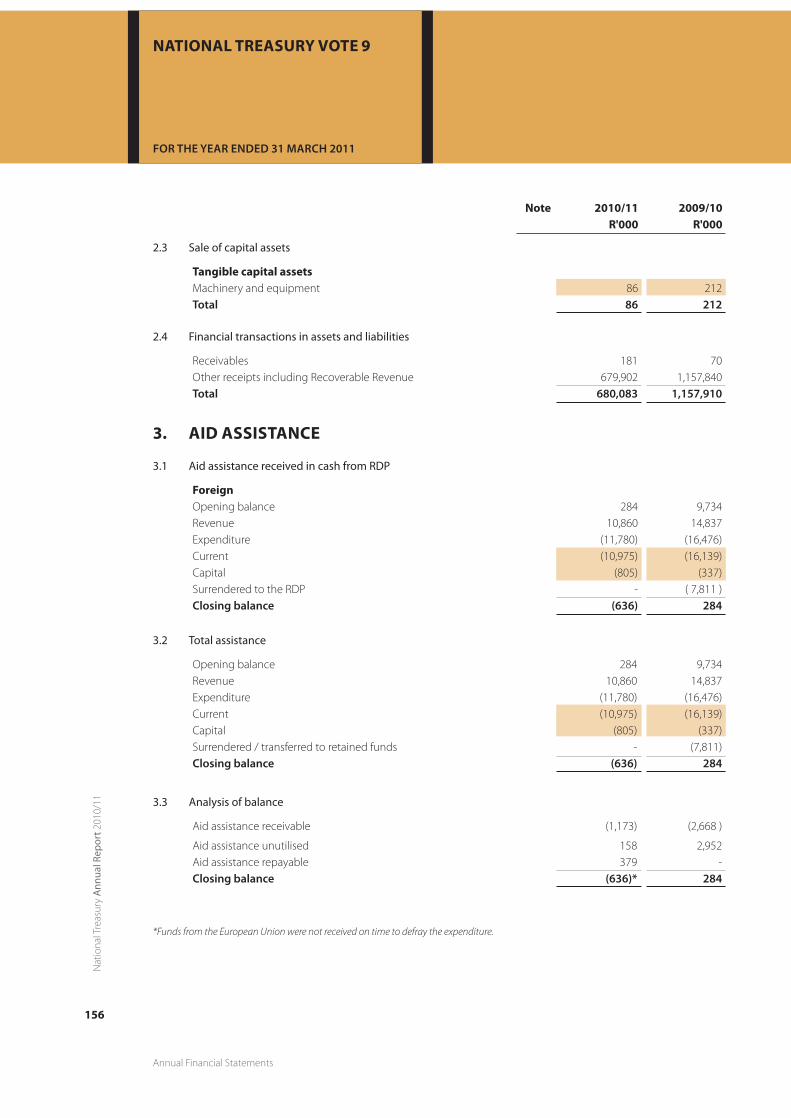
Annual Financial Statements
Nat
iona
l Tre
asur
y A
nnua
l Rep
ort 2
010/
11
156
notes to the annual financial statements - continued
national treasury vote 9
FOR the yeaR ended 31 maRch 2011
Note 2010/11 2009/10R'000 R'000
2.3 Sale of capital assets
Tangible capital assetsMachinery and equipment 86 212total 86 212
2.4 Financial transactions in assets and liabilities
Receivables 181 70Other receipts including Recoverable Revenue 679,902 1,157,840total 680,083 1,157,910
3. AId ASSISTANCE 3.1 Aid assistance received in cash from RDP
ForeignOpening balance 284 9,734Revenue 10,860 14,837Expenditure (11,780) (16,476)Current (10,975) (16,139)Capital (805) (337)Surrendered to the RDP - ( 7,811 )Closing balance (636) 284
3.2 Total assistance
Opening balance 284 9,734Revenue 10,860 14,837Expenditure (11,780) (16,476)Current (10,975) (16,139)Capital (805) (337)Surrendered / transferred to retained funds - (7,811)Closing balance (636) 284
3.3 Analysis of balance
Aid assistance receivable (1,173) (2,668 )
Aid assistance unutilised 158 2,952Aid assistance repayable 379 -Closing balance (636)* 284
*Funds from the European Union were not received on time to defray the expenditure.
NT AR 10-11_10.indd 156 2011/08/17 10:02 AM

Annual Financial Statements
157
Nat
iona
l Tre
asur
y A
nnua
l Rep
ort 2
010/
11
notes to the annual financial statements - continued
national treasury vote 9
FOR the yeaR ended 31 maRch 2011
Note 2010/11 2009/10R'000 R'000
4. COmPENSATION OF EmPlOyEES4.1 Salaries and Wages
Basic salary 301,747 260,326Performance award 21,611 18,087Service Based 889 1,132Compensative/circumstantial 1,910 1,401Periodic payments 76 -Other non-pensionable allowances 103,045 81,788total 429,278 362,734
4.2 Social contributions
employer contributionsPension 35,461 30,319Medical 11,376 8,990Bargaining council 58 30total 46,895 39,339
total compensation of employees 476,173 402,073
Average number of employees 1,089 1,007
5. GOOdS ANd SERVICES Administrative fees 6,190 11,637Advertising 2,177 1,897Assets less then R5,000 5.1 423 1,546Bursaries (employees) 2,726 1,985Catering 1,566 1,973Communication 6,605 7,400Computer services 5.2 371,359 386,698Consultants, contractors and agency/outsourced services 5.3 168,119 183,401Entertainment 191 137Audit cost – external 5.4 9,231 8,468Inventory 5.5 14,635 16,825Operating leases* 42,378 30,739Owned and leasehold property expenditure 5.6 8,568 13,358Travel and subsistence 5.7 38,115 36,214Venues and facilities 8,551 8,458Training and staff development 8,367 9,957Other operating expenditure 5.8 4,714 7,430total 693,915 728,123
NT AR 10-11_10.indd 157 2011/08/17 10:02 AM

Annual Financial Statements
Nat
iona
l Tre
asur
y A
nnua
l Rep
ort 2
010/
11
158
notes to the annual financial statements - continued
national treasury vote 9
FOR the yeaR ended 31 maRch 2011
Note 2010/11 2009/10R'000 R'000
5.1 Assets less than R5,000
Tangible assetsMachinery and equipment 423 1,546total 423 1,546
5.2 Computer services
SITA computer services 28,632 34,303External computer service providers 342,727 352,395total 371,359 386,698
5.3 Consultants, contractors and agency/outsourced services
Business and advisory services 151,938 161,619Legal costs 6,814 10,512Contractors 1,358 2,019Agency and support/outsourced services 8,009* 9,251total 168,119 183,401
*The amount includes payment for forensic investigation that was outsourced.
5.4 Audit cost – External
Regularity audits 9,167 7,603Performance audits 64 731Forensic investigations - 134total 9,231 8,468
5.5 Inventory
Food and food supplies 826 810Fuel, oil and gas 493 341Other consumable materials 1,025 825Maintenance material 69 242Stationery and printing 12,220 14,607Medical supplies 2 -total 14,635 16,825
5.6 Owned and leasehold property expenditure
Municipal services 8,072 -Property management fees 403 8,340Property maintenance and repairs - 4,944Other 93 74total 8,568 13,358
NT AR 10-11_10.indd 158 2011/08/17 10:02 AM

Annual Financial Statements
159
Nat
iona
l Tre
asur
y A
nnua
l Rep
ort 2
010/
11
notes to the annual financial statements - continued
national treasury vote 9
FOR the yeaR ended 31 maRch 2011
Note 2010/11 2009/10R'000 R'000
5.7 Travel and subsistence
Local 21,043 20,786Foreign 17,072 15,428total 38,115 36,214
5.8 Other operating expenditure
Professional bodies, membership and subscription fees 3,936 6,181Resettlement costs 406 916Other 372 333total 4,714 7,430
6. PAymENT FOR FINANCIAl ASSETS Extension of loans for policy purposes4 20,746,700 -Other material losses written off 6.1 360 338Debts written off 6.2 123 80total 20,747,183 418
6.1 Other material losses written off
Nature of lossesAccident damages 184 124Miscellaneous 176 214total 360 338
6.2 Debts written off
Civil and military pension (bad debts) 123 50Staff debt written off - 30total 123 80
7. TRANSFERS ANd SUbSIdIES
Provinces and municipalities
Annex 1A, Annex 1B, Annex 1C, Annex 1D
10,041,008 14,257,373
Departmental agencies and accounts Annex 1E 11,804,432 10,510,985Universities and technikons Annex 1F 5,300 5,456Foreign governments and international organisations Annex 1H 533,729 555,186Public corporations and private enterprises Annex 1G 290,295 31,267,444Non-profit institutions Annex 1I - 68Households Annex 1J 2,659,783 4,929,950total 25,334,547 61,526,462
4 The loans were previously classified under Transfers and Subsidies but have been reclassified under Payment for Financial Assets since 1 April 2010.
NT AR 10-11_10.indd 159 2011/08/17 10:02 AM

Annual Financial Statements
Nat
iona
l Tre
asur
y A
nnua
l Rep
ort 2
010/
11
160
notes to the annual financial statements - continued
national treasury vote 9
FOR the yeaR ended 31 maRch 2011
Note 2010/11 2009/10R'000 R'000
8. ExPENdITURE FOR CAPITAl ASSETS tangible assetsMachinery and equipment 29 9,373 11,989total 9,373 11,989
8.1 Analysis of funds utilised to acquire capital assets – 2010/11
voted funds aid assistance totalr’000 r’000 r’000
tangible assetsMachinery and equipment 8,568 805 9,373total 8,568 805 9,373
8.2 Analysis of funds utilised to acquire capital assets – 2009/10
voted funds aid assistance totalr’000 r’000 r’000
tangible assets Machinery and equipment 11,652 337 11,989total 11,652 337 11,989
9. CASh ANd CASh EQUIVAlENTSConsolidated Paymaster General Account 210,931 42,996
Cash on hand 21 21
Cash with commercial banks (Local) 143,699 7,174
total 354,651 50,191
10. PREPAymENTS ANd AdVANCESTravel and subsistence 58 108Prepayments 2,245 1,265total 2,303 1,373
11. RECEIVAblES2010/11 2009/10
r’000 r’000 r’000 r’000 r’000
Noteless than one
yearone to three
yearsolder than three years total total
Claims recoverable 11.1 2,910 3,713 131,138 137,761 138,434Recoverable expenditure
11.2 280 64 46 390 677*
Staff debt 11.3 610 373 18 1,001 543Other debtors 11.4 630 - - 630 347total 4,430 4,150 131,202 139,782 140,001
NT AR 10-11_10.indd 160 2011/08/17 10:02 AM

Annual Financial Statements
161
Nat
iona
l Tre
asur
y A
nnua
l Rep
ort 2
010/
11
notes to the annual financial statements - continued
national treasury vote 9
FOR the yeaR ended 31 maRch 2011
Note 2010/11 2009/10R’000 R’000
11.1 Claims recoverable
National departments 2,577 2,356Provincial departments 125,153 126,267Foreign governments 661 316Households and non-profit institutions 9,370 9,495
total 137,761 138,434
11.2 Recoverable expenditure
Disallowance damages and losses 222 436*
Disallowance miscellaneous 119 241*
Private telephones 49 -
total 390 677
*Reclassification of prior year figure to be in line with the Departmental Reporting Framework.
11.3 Staff debt
Departmental Debt 1,001 455
Other staff debts - 88total 1,001 543
11.4 Other debtors
Value added tax (SARS) 630 347total 630 347
12. INVESTmENTSNon-Current (non-current shares)Development Bank of Southern Africa Annex 2A & 2B 200,000 200,000Public Investment Corporation Limited Annex 2A & 2B 1 1SASRIA* Annex 2A & 2B - -Land Bank Annex 2A & 2B 200,955 200,955**total 400,956 400,956
analysis of non-current investments
Opening balance 400,956 400,956Closing balance 400,956 400,956
NT AR 10-11_10.indd 161 2011/08/17 10:02 AM

Annual Financial Statements
Nat
iona
l Tre
asur
y A
nnua
l Rep
ort 2
010/
11
162
notes to the annual financial statements - continued
national treasury vote 9
FOR the yeaR ended 31 maRch 2011
Note 2010/11 2009/10R’000 R’000
13. lOANSPublic corporations 64,930,453 44,546,711total 64,930,453 44,546,711
analysis of balanceOpening balance 44,546,711 10,000,000New issues 20,383,742 34,546,711Closing balance 64,930,453 44,546,711
14. VOTEd FUNdS TO bE SURRENdEREd TO ThE REVENUE FUNdOpening balance5 176,842 112,055
Transfer from statement of financial performance 2,949,028 176,842Voted funds not requested/ not received (2,470,281) -Paid during the year (176,842) (112,055)Closing balance 478,747 176,842
15. dEPARTmENTAl REVENUE TO bE SURRENdEREd TO ThE REVENUE FUNdOpening balance 2,841 1,753Transfer from Statement of Financial Performance 3,340,611 3,543,597Paid during the year (3,335,930) (3,542,509)Closing balance 7,522 2,841
16. bANk OVERdRAFTConsolidated Paymaster General Account 1,862 -
total 1,862 -
17. PAyAblES – CURRENTAdvances received 17.1 1,112 93Clearing accounts 17.2 79 66
Other payables 17.3 7,781 11,190
total 8,972 11,349
17.1 Advances received
Local Government - 93
Department of Justice and Constitutional Development 990 -
Pension Administration 122 -
total 1,112 93
5The prior year balance was overstated by 5 due to rounding off.
NT AR 10-11_10.indd 162 2011/08/17 10:02 AM
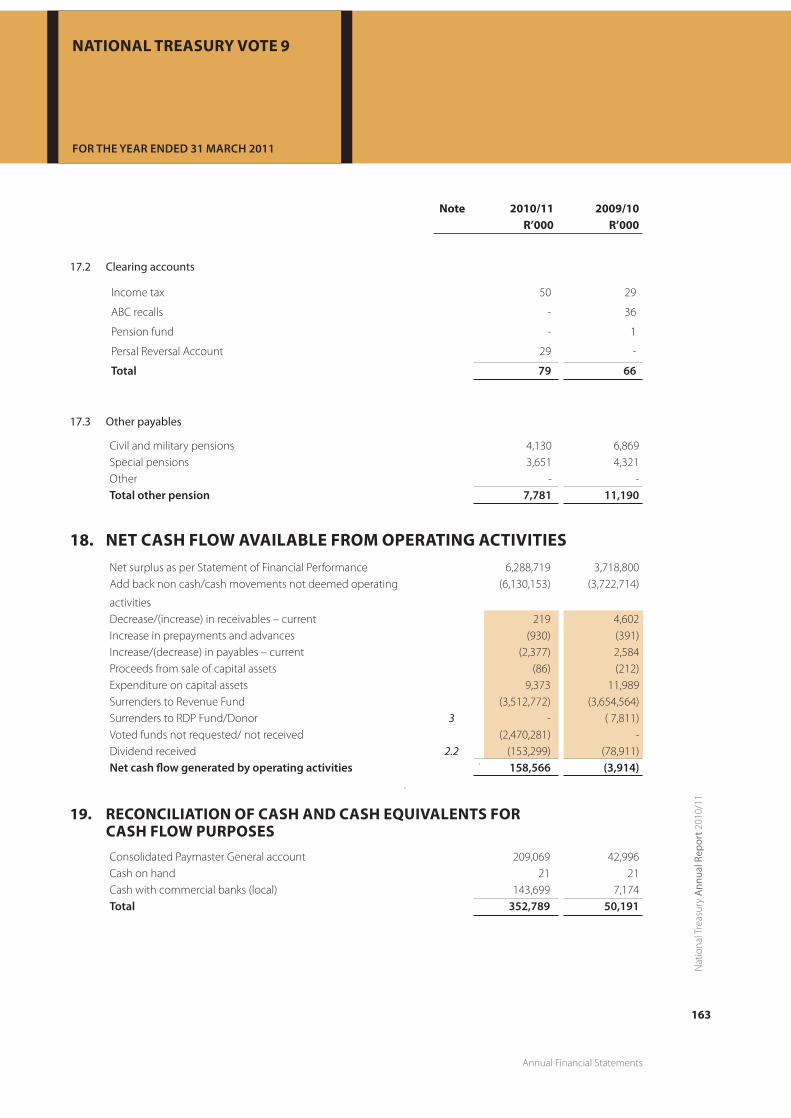
Annual Financial Statements
163
Nat
iona
l Tre
asur
y A
nnua
l Rep
ort 2
010/
11
notes to the annual financial statements - continued
national treasury vote 9
FOR the yeaR ended 31 maRch 2011
Note 2010/11 2009/10R’000 R’000
17.2 Clearing accounts
Income tax 50 29
ABC recalls - 36
Pension fund - 1
Persal Reversal Account 29 -
total 79 66
17.3 Other payables
Civil and military pensions 4,130 6,869Special pensions 3,651 4,321Other - -total other pension 7,781 11,190
18. NET CASh FlOW AVAIlAblE FROm OPERATING ACTIVITIESNet surplus as per Statement of Financial Performance 6,288,719 3,718,800Add back non cash/cash movements not deemed operating
activities
(6,130,153) (3,722,714)
Decrease/(increase) in receivables – current 219 4,602Increase in prepayments and advances (930) (391)Increase/(decrease) in payables – current (2,377) 2,584Proceeds from sale of capital assets (86) (212)Expenditure on capital assets 9,373 11,989Surrenders to Revenue Fund (3,512,772) (3,654,564)Surrenders to RDP Fund/Donor 3 - ( 7,811)Voted funds not requested/ not received (2,470,281) -Dividend received 2.2 (153,299) (78,911)Net cash flow generated by operating activities 158,566 (3,914)
19. RECONCIlIATION OF CASh ANd CASh EQUIVAlENTS FOR CASh FlOW PURPOSESConsolidated Paymaster General account 209,069 42,996Cash on hand 21 21Cash with commercial banks (local) 143,699 7,174total 352,789 50,191
NT AR 10-11_10.indd 163 2011/08/17 10:02 AM
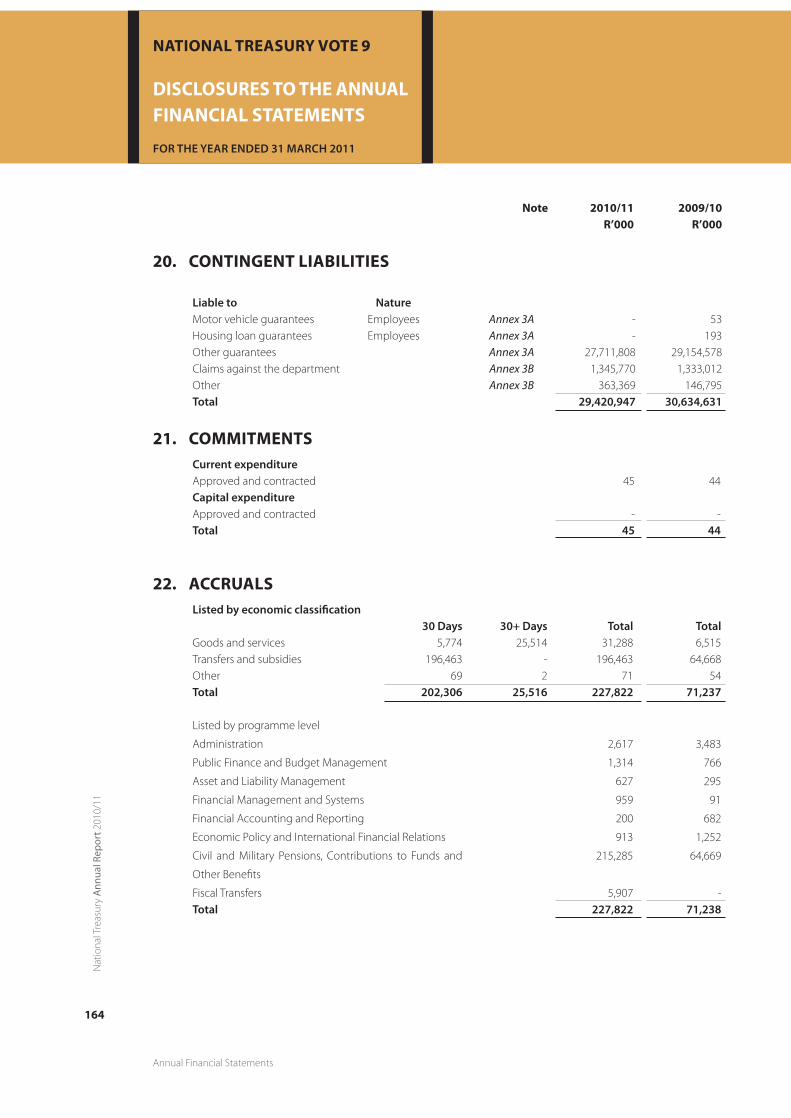
Annual Financial Statements
Nat
iona
l Tre
asur
y A
nnua
l Rep
ort 2
010/
11
164
national treasury vote 9
FOR the yeaR ended 31 maRch 2011
dISClOSURES TO ThE ANNUAl FINANCIAl STATEmENTS
Note 2010/11 2009/10R’000 R’000
20. CONTINGENT lIAbIlITIES
liable to NatureMotor vehicle guarantees Employees Annex 3A - 53Housing loan guarantees Employees Annex 3A - 193Other guarantees Annex 3A 27,711,808 29,154,578Claims against the department Annex 3B 1,345,770 1,333,012Other Annex 3B 363,369 146,795total 29,420,947 30,634,631
21. COmmITmENTSCurrent expenditureApproved and contracted 45 44Capital expenditureApproved and contracted - -total 45 44
22. ACCRUAlSlisted by economic classification
30 Days 30+ Days total totalGoods and services 5,774 25,514 31,288 6,515Transfers and subsidies 196,463 - 196,463 64,668Other 69 2 71 54total 202,306 25,516 227,822 71,237
Listed by programme level
Administration
Public Finance and Budget Management
Asset and Liability Management
Financial Management and Systems
Financial Accounting and Reporting
Economic Policy and International Financial Relations
Civil and Military Pensions, Contributions to Funds and
Other Benefits
Fiscal Transfers
2,617
1,314
627
959
200
913
215,285
5,907
3,483
766
295
91
682
1,252
64,669
-total 227,822 71,238
NT AR 10-11_10.indd 164 2011/08/17 10:02 AM

Annual Financial Statements
165
Nat
iona
l Tre
asur
y A
nnua
l Rep
ort 2
010/
11
disclosures to the annual financial statements - continued
national treasury vote 9
FOR the yeaR ended 31 maRch 2011
Note 2010/11 2009/10R’000 R’000
23. EmPlOyEE bENEFITSLeave entitlement 12,223 11,656Service bonus (thirteenth cheque) 9,326 7,963Performance awards 24,207 17,944Capped leave commitments 14,643 14,103total 60,399 51,666
24. lEASE COmmITmENTS
24.1 Operating leases expenditure
2010/11
Buildings and other fixedstructures
Machinery and equipment total
Not later than 1 year 3,631 2,671 6,302Later than 1 year and not later than 5 years 7,791 541 8,332total lease commitments 11,422 3,212 14,634
2009/10
Buildings and other fixed structures
Machinery and equipment total
Not later than 1 year 2,382 3,020 5,402Later than 1 year and not later than 5 years 5,012 2,561 7,573total 7,394 5,581 12,975
25. RECEIVAblES FOR dEPARTmENTAl REVENUESales of goods and services other than capital assets 126 4,037
Interest, dividends and rent on land 177,151 197,790
Financial transactions in assets and liabilities 13,196 814
total 190,473 202,641
NT AR 10-11_10.indd 165 2011/08/17 10:02 AM

Annual Financial Statements
Nat
iona
l Tre
asur
y A
nnua
l Rep
ort 2
010/
11
166
disclosures to the annual financial statements - continued
national treasury vote 9
FOR the yeaR ended 31 maRch 2011
Note 2010/11 2009/10R’000 R’000
26. IRREGUlAR ExPENdITURE
26.1 Reconciliation of irregular expenditure
Opening balance 12,273 176Add: irregular expenditure - relating to current year 11,142* 12,097*Less: Amounts condoned6 (176) -irregular expenditure awaiting condonation 23,239 12,273
analysis of awaiting condonation per age classificationCurrent year 11,142 12,097Prior years 12,097 176total 23,239 12,273
*Restatement of Irregular expenditure relating to fraudulent cases investigated by the Special Investigations Unit, Percy Sonn and Nexus Forensic on Programme 8 special pensions (2009/10: R6,881m & 2010/11: R8,076m) in line with Departmental Reporting Framework. These payments were made in contravention of the Acts in that invalid payments were made to beneficiaries who did not qualify for the pension due to having Schedule 1 offense, invalid ID numbers, misinterpretation of the Act and some banking details falsified. In addition irregular expenditure relating to Vendzulu Development Agency (2009/10: R5,216m & 2010/11: R3,066m) was also restated in line with the Departmental Reporting Framework.
27. kEy mANAGEmENT PERSONNElNo. of
individuals2010/11
r’0002009/10
r’000
Political office bearers (provide detail below) 2 3,403 3,301Officials:Level 15 to 16 12 14,010 13,457Level 14 (incl. CFO if at a lower level) 70 60,994 54,394total 78,407 71,152
28. PROVISIONSpotential irrecoverable debtsStaff debtors 1,050 298Other debtors - 436total 1,050 734other provisionsMilitary Pension 891 222Injury on duty 28,305 31,377Medical benefits 3,053 2,484Households and non profit institutions - 6,085Special Pension SIU cases 3,587* 4,501*total 35,836 44,669
*Restatement of schedule 2 SIU cases in line with the Departmental Reporting Framework
6Irregular expenditure was condoned by the relevant authority in April 2011.
NT AR 10-11_10.indd 166 2011/08/17 10:02 AM
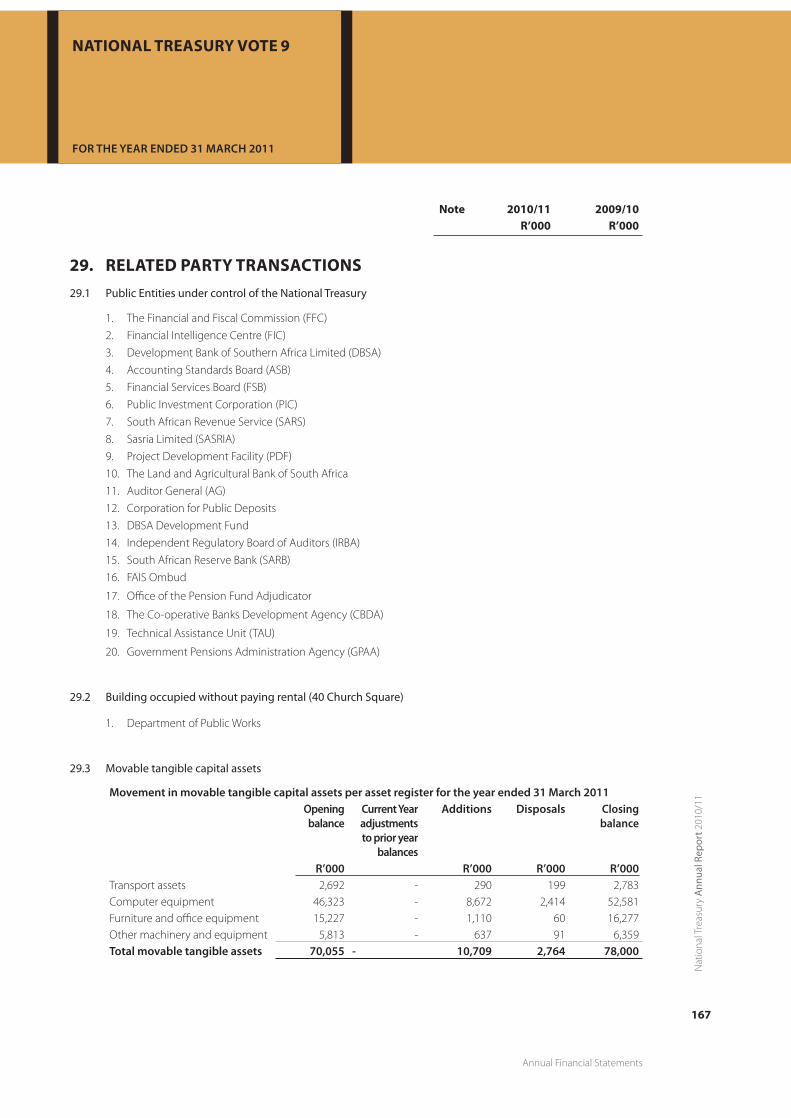
Annual Financial Statements
167
Nat
iona
l Tre
asur
y A
nnua
l Rep
ort 2
010/
11
disclosures to the annual financial statements - continued
national treasury vote 9
FOR the yeaR ended 31 maRch 2011
Note 2010/11 2009/10R’000 R’000
29. RElATEd PARTy TRANSACTIONS29.1 Public Entities under control of the National Treasury
1. The Financial and Fiscal Commission (FFC)
2. Financial Intelligence Centre (FIC)
3. Development Bank of Southern Africa Limited (DBSA)
4. Accounting Standards Board (ASB)
5. Financial Services Board (FSB)
6. Public Investment Corporation (PIC)
7. South African Revenue Service (SARS)
8. Sasria Limited (SASRIA)
9. Project Development Facility (PDF)
10. The Land and Agricultural Bank of South Africa
11. Auditor General (AG)
12. Corporation for Public Deposits
13. DBSA Development Fund
14. Independent Regulatory Board of Auditors (IRBA)
15. South African Reserve Bank (SARB)
16. FAIS Ombud
17. Office of the Pension Fund Adjudicator
18. The Co-operative Banks Development Agency (CBDA)
19. Technical Assistance Unit (TAU)
20. Government Pensions Administration Agency (GPAA)
29.2 Building occupied without paying rental (40 Church Square)
1. Department of Public Works
29.3 Movable tangible capital assets
Movement in movable tangible capital assets per asset register for the year ended 31 March 2011opening balance
Current year adjustments to prior year
balances
additions Disposals Closing balance
r’000 r’000 r’000 r’000Transport assets 2,692 - 290 199 2,783Computer equipment 46,323 - 8,672 2,414 52,581Furniture and office equipment 15,227 - 1,110 60 16,277Other machinery and equipment 5,813 - 637 91 6,359total movable tangible assets 70,055 - 10,709 2,764 78,000
NT AR 10-11_10.indd 167 2011/08/17 10:02 AM

Annual Financial Statements
Nat
iona
l Tre
asur
y A
nnua
l Rep
ort 2
010/
11
168
disclosures to the annual financial statements - continued
national treasury vote 9
FOR the yeaR ended 31 maRch 2011
29.4 Additions
additions to movable tangible capital assets per asset register for the year ended 31 March 2011Cash Non-cash (Capital work
in progress current
costs and finance lease
payments)
received current, not
paid (paid current year,
received prior year)
total
r’000 r’000 r’000 r’000 r’000DescriptionTransport assets 290 - - - 290Computer equipment 7,484 1,188 - - 8,672Furniture and office equipment 967 143 - - 1,110Other machinery and equipment 632 5 - - 637total additions of movable tangible capital assets 9,373 1,336 - - 10,709
29.5 Disposal
Disposals of movable tangible capital assets per asset register for the year ended 31 March 2011sold for cash transfer out or
destroyed or scrapped
total disposals Cash received actual
r’000 r’000 r’000 r’000Transport assets 199 - 199 80Computer equipment 1,264 1,150 2,414 6Furniture and office equipment - 60 60 -Other machinery and equipment - 91 91 -total Disposal of movable tangible capital assets 1,463 1,301 2,764 86
29.6 Movement for 2009/10
Movement in movable tangible capital assets per asset register for the year ended 31 March 2010opening balance
Current year adjustment
to prior year balances
additions Disposal Closing balance
r’000 r’000 r’000 r’000 r’000Transport assets 2,488 (1) 1,440 (1,235) 2,692Computer equipment 45,297 (1,098) 6,862 (4,738) 46,323Furniture and office equipment 14,266 (230) 1,269 (78) 15,227Other machinery and equipment 2,733 7 3,135 (62) 5,813total movable tangible assets 64,784 (1,322) 12,706 (6,113) 70,055
NT AR 10-11_10.indd 168 2011/08/17 10:02 AM

Annual Financial Statements
169
Nat
iona
l Tre
asur
y A
nnua
l Rep
ort 2
010/
11
disclosures to the annual financial statements - continued
national treasury vote 9
FOR the yeaR ended 31 maRch 2011
29.7 Minor assets
Minor assets of the department as at 31 March 2011intangible
assetsHeritage
assetsMachinery
and equipment
Biological assets
Closing balance
r’000 r’000 r’000 r’000 r’000Opening balance - - 33,244 - 33,244Current year adjustment to prior year balances
- - - - -
Additions - - 939 - 939Disposal - - (658) - (658)total - - 33,525 - 33,525
Machinery and equipment
total
Minor assets of the department as at 31 March 2011Minor assets 23 23total minor assets 23 23
Machinery and equipment
total
Number of R1 minor assets - -Number of minor assets at cost 23 23total number of minor assets 23 23
Minor assets of the department as at 31 March 2010specialised
Military assets
intangible assets
Heritage assets
Machinery and
equipment
Closing balance
r’000 r’000 r’000 r’000 r’000Minor assets - - - 33,244 33,244total - - - 33,244 33,244
NT AR 10-11_10.indd 169 2011/08/17 10:02 AM

Annual Financial Statements
Nat
iona
l Tre
asur
y A
nnua
l Rep
ort 2
010/
11
170
national treasury vote 9
FOR the yeaR ended 31 maRch 2011
ANNExURES TO ThE FINANCIAl STATEmENTS
aN
Nex
ure
1a
STAT
EMEN
T O
F CO
ND
ITIO
NA
L G
RAN
TS P
AID
TO
TH
E PR
OvI
NCE
S
Na
Me
oF
pro
viN
Ce /
Gra
Nt
Gra
Nt
all
oCa
tio
Ntr
aN
sFer
sp
eNt
2008
/09
Div
ision
of
re
venu
e ac
t
roll
ove
rsad
just
men
tsto
tal
avai
labl
eac
tual
tr
ansf
erFu
nds
with
held
re-
allo
catio
ns
by N
atio
nal
trea
sury
or
Nat
iona
l De
part
men
t
amou
nt
rece
ived
by
de
part
men
t
amou
nt
spen
t by
depa
rtm
ent
% o
f av
aila
ble
fund
s sp
ent b
y de
part
men
t
Div
ision
of
reve
nue a
ct
r’00
0r’
000
r’00
0r’
000
r’00
0r’
000
%r’
000
r’00
0%
r’00
0Ea
ster
n Ca
pe2,
010,
800
--
2,01
0,80
0 1,
508,
100
502,
700
-1,
508,
100
(see
not
e)-
1,66
1,39
1
Free
Sta
te
869,
338
--
86
9,33
8 47
8,13
739
1,20
1-
478,
137
--
717,
182
Gau
teng
95
2,47
7 -
-
952,
477
666,
735
285,
742
-66
6,73
5-
-77
0,40
0*
Gau
trai
n
-
--
- -
--
--
-4,
200,
000
Kwa-
Zulu
Nat
al
2,
395,
763
--
2,39
5,76
3 2,
275,
974
119,
789
-2,
275,
974
--
1,97
0,93
3
Lim
popo
1,74
3,42
2 -
-
1,
743,
422
1,48
1,90
826
1,51
4-
1,48
1,90
8-
-1,
407,
445
Mpu
mal
anga
976,
347
--
97
6,34
7 53
6,99
043
9,35
7-
536,
990
--
771,
968
Nor
ther
n Ca
pe
598,
847
--
59
8,84
7 32
3,48
327
5,36
4-
323,
483
--
492,
388
Nor
th W
est
97
3,07
2 -
-
973,
072
778,
458
194,
614
-77
8,45
8-
-80
7,57
7
Wes
tern
Cap
e
794,
845
--
79
4,84
5 79
4,84
5-
-79
4,84
5-
-64
9,96
3
tota
l co
nditi
onal
gr
ants
to
prov
ince
s
11,3
14,9
11
-
-
11,3
14,9
11
8,84
4,63
0 2,
470,
281
- 8,
844,
630
--
13,4
49,2
47
Not
e: S
pend
ing
of th
is gr
ant (
Sche
dule
4) i
s su
bsum
ed in
the
spen
ding
of a
rang
e of
pro
gram
mes
acr
oss
prov
inci
al d
epar
tmen
ts a
nd th
eref
ore
no re
port
ing
on e
xpen
ditu
re is
requ
ired
in te
rms
of S
ectio
n
13(3
)(b) o
f the
201
0 D
ivisi
on o
f Rev
enue
Act
(Act
no.
1 o
f 201
0).
*Rec
lass
ifica
tion
of p
rior y
ear a
mou
nt in
line
with
the
Dep
artm
enta
l Rep
ortin
g Fr
amew
ork.
NT AR 10-11_10.indd 170 2011/08/17 10:02 AM

Annual Financial Statements
171
Nat
iona
l Tre
asur
y A
nnua
l Rep
ort 2
010/
11
annexures to the financial statements - continued
national treasury vote 9
FOR the yeaR ended 31 maRch 2011
aN
Nex
ure
1B
STAT
EMEN
T O
F CO
ND
ITIO
NA
L G
RAN
TS P
AID
TO
MU
NIC
IPA
LITI
ES
Na
Me
oF
Mu
NiC
ipa
lity
Gra
Nt
all
oCa
tio
Ntr
aN
sFer
speN
t20
09/1
0
Div
ision
of
reve
nue
a ct
rollo
vers
adju
stm
ents
tota
l av
aila
ble
actu
al
tran
sfer
Fund
s w
ithhe
ld
re-
allo
catio
n by
Nat
iona
l tr
easu
ry
or N
atio
nal
Depa
rtmen
t
amou
ntre
ceive
dby
mun
icipa
lity
amou
nt
spen
t by
mun
icipa
lity
% o
f av
aila
ble
fund
ssp
ent b
ym
unici
palit
y
Divi
sion
of
reve
nue a
ct
r’00
0r’
000
r’00
0r’
000
r’00
0r’
000
r’00
0r’
000
r’00
0r’
000
r’00
0 A
mat
ole
Dis
tric
t Mun
icip
ality
25
,000
-23
,000
48,0
0042
,405
5,59
5-
42,4
0518
,244
43%
4,50
0
Ba-
Phal
abor
wa
10,0
00-
10,0
0020
,000
-20
,000
--
--
10,0
00
Bea
ufor
t Wes
t2,
000
--
2,00
0-
2,00
0-
--
--
Bito
u 15
,000
--
15,0
0014
,709
291
-14
,709
5,34
036
%5,
000
Lang
eber
g (B
reed
e Ri
vier
Win
elan
ds)
2,40
0-
(800
)1,
600
1,60
0-
-1,
600
--
800
Buff
alo
City
13
,000
-(6
,000
)7,
000
-7,
000
--
--
6,00
0
Bus
hbuc
krid
ge
3,00
0-
-3,
000
-3,
000
--
--
2,38
8
Cap
e To
wn
95,0
00-
6,00
0 10
1,00
010
0,90
010
0-
100,
900
53,0
4453
%70
,000
City
of M
atlo
sana
10,2
26(9
,426
)80
0-
800
--
--
-
Dih
labe
ng7,
000
(6,2
00)
800
-80
0-
--
-
Eku
rhul
eni M
etro
58
,236
--
58,2
3634
,035
24,2
01-
34,0
3534
,035
100%
44,4
30
Em
nam
bith
i (La
dysm
ith)
15,0
00-
5,00
020
,000
18,2
931,
707
-18
,293
6,32
035
%-
Eth
ekw
ini
107,
155
-5,
845
113,
000
110,
000
3,00
0-
110,
000
107,
492
98%
98,3
34
Ga-
Sego
nyan
a8,
000
-(7
,200
)80
0-
800
--
--
-
Gre
ater
Tau
ng16
,500
-23
,566
40,0
6630
,654
9,41
2-
30,6
548,
247
27%
-
Gre
ater
Tub
atse
10,0
00-
(10,
000)
--
--
--
--
Gre
ater
Tza
neen
15
,000
--
15,0
0010
,620
4,38
0-
10,6
202,
611
25%
9,50
0
Joh
anne
sbur
g 80
,000
-20
,000
100,
000
99,9
5842
-99
,958
39,7
6940
%64
,837
Kin
g Sa
bata
Dal
indy
ebo
9,00
0-
9,04
818
,048
18,0
48-
-18
,048
18,0
4810
0%20
,000
Kny
sna
12,0
00-
(7,0
00)
5,00
05,
000
--
5,00
0-
-4,
000
Kw
aduk
uza
15,0
00-
-15
,000
5,58
39,
417
-5,
583
--
-
subt
otal
car
ried
forw
ard
528,
517
55,8
3358
4,35
049
1,80
592
,545
491,
805
293,
150
339,
789
NT AR 10-11_10.indd 171 2011/08/17 10:02 AM

Annual Financial Statements
Nat
iona
l Tre
asur
y A
nnua
l Rep
ort 2
010/
11
172
annexures to the financial statements - continued
national treasury vote 9
FOR the yeaR ended 31 maRch 2011
Na
Me
oF
Mu
NiC
ipa
lity
Gra
Nt
all
oCa
tio
Ntr
aN
sFer
speN
t20
09/1
0
Div
ision
of
reve
nue
act
rollo
vers
adju
stm
ents
tota
l av
aila
ble
actu
al
tran
sfer
Fund
s w
ithhe
ld
re-
allo
catio
n by
Nat
iona
l tr
easu
ry
or N
atio
nal
Depa
rtmen
t
amou
ntre
ceive
dby
mun
icipa
lity
amou
nt
spen
t by
mun
icipa
lity
% o
f av
aila
ble
fund
ssp
ent b
ym
unici
palit
y
Divi
sion
of
reve
nue a
ct
r’00
0r’
000
r’00
0r’
000
r’00
0r’
000
r’00
0r’
000
r’00
0r’
000
r’00
0su
btot
al b
roug
ht fo
rwar
d52
8,51
755
,833
584,
350
491,
805
92,5
4549
1,80
529
3,15
033
9,78
9 K
ouga
-
--
--
--
--
-19
,000
Lek
wa
12,0
00-
(3,3
22)
8,67
88,
678
--
8,67
85,
702
66%
21,8
98
Luk
hanj
i5,
000
-(5
,000
)-
--
--
--
-
Mak
ana
20,0
00-
-20
,000
20,0
00-
-20
,000
16,0
5980
%23
,851
Man
deni
15
,000
-(1
,330
)13
,670
13,6
70-
-13
,670
13,6
7010
0%14
,000
Mat
jhab
eng
8,00
0-
(7,2
00)
800
500
300
500
393
79%
-
Mat
zika
ma
5,60
0-
(2,0
00)
3,60
02,
200
1,40
0-
2,20
034
816
%40
0
Mbo
mbe
la
5,86
1-
395
6,25
63,
500
2,75
6-
3,50
03,
018
86%
8,97
6
Met
swed
ing
15,0
00-
-15
,000
-15
,000
--
--
5,00
0
Mog
alak
wen
a8,
000
-37
,000
45,0
0043
,079
1,92
1-
43,0
797,
809
18%
-
Mog
ale
City
20,0
00-
(10,
000)
10,0
00-
10,0
00-
--
--
Msu
nduz
i15
,000
-(1
0,00
0)5,
000
-5,
000
--
--
-
Ndw
edw
e 15
,000
--
15,0
009,
261
5,73
9-
9,26
192
910
%5,
000
Nel
son
Man
dela
Bay
75
,201
--
75,2
0168
,697
6,50
4-
68,6
9740
,613
59%
31,5
00
New
cast
le15
,000
-(9
,700
)5,
300
5,26
238
-5,
262
1,26
424
%-
Non
gom
a15
,000
-2,
500
17,5
0012
,000
5,50
0-
12,0
00-
--
Oud
tsho
orn
8,00
0-
-8,
000
8,00
0-
-8,
000
4,60
758
%5,
000
Ove
rstr
and
8,50
0-
3,00
011
,500
10,9
3656
4-
10,9
365,
852
54%
2,50
0
Pol
okw
ane
12,0
00-
-12
,000
8,15
93,
841
-8,
159
--
-
Por
t St J
ohns
7,00
0-
(7,0
00)
--
--
--
--
Ram
otsh
ere
Moi
loa
6,00
0-
8,00
014
,000
14,0
00-
-14
,000
2,17
716
%7,
000
sub
tota
l car
ried
forw
ard
819,
679
-51
,176
870,
855
719,
747
151,
108
-71
9,74
739
5,59
148
3,91
4
aN
Nex
ure
1B
- CO
NTI
NU
ED
STAT
EMEN
T O
F CO
ND
ITIO
NA
L G
RAN
TS P
AID
TO
MU
NIC
IPA
LITI
ES -
cont
inue
d
NT AR 10-11_10.indd 172 2011/08/17 10:02 AM
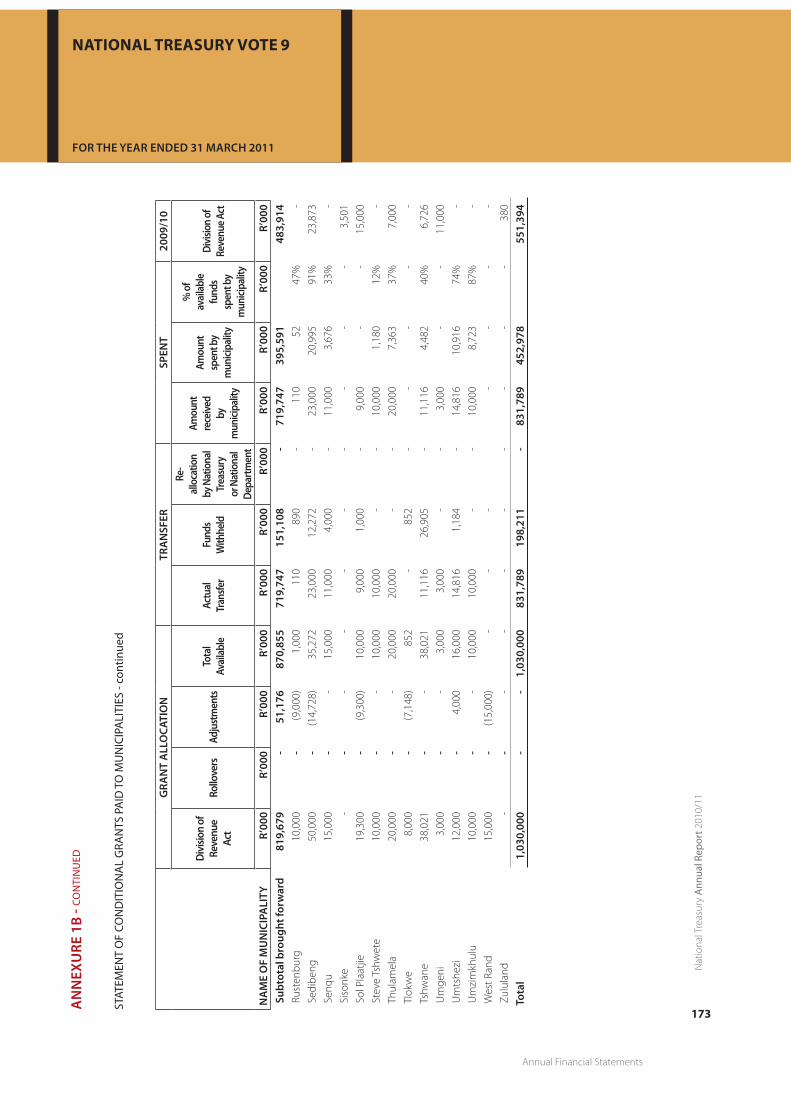
Annual Financial Statements
173
Nat
iona
l Tre
asur
y A
nnua
l Rep
ort 2
010/
11
annexures to the financial statements - continued
national treasury vote 9
FOR the yeaR ended 31 maRch 2011
Na
Me
oF
Mu
NiC
ipa
lity
Gra
Nt
all
oCa
tio
Ntr
aN
sFer
speN
t20
09/1
0
Div
ision
of
reve
nue
act
rollo
vers
adju
stm
ents
tota
l av
aila
ble
actu
al
tran
sfer
Fund
s w
ithhe
ld
re-
allo
catio
n by
Nat
iona
l tr
easu
ry
or N
atio
nal
Depa
rtmen
t
amou
ntre
ceive
dby
mun
icipa
lity
amou
n t
spen
t by
mun
icipa
lity
% o
f av
aila
ble
fund
ssp
ent b
ym
unici
palit
y
Divi
sion
of
reve
nue a
c t
r’00
0r’
000
r’00
0r’
000
r’00
0r’
000
r’00
0r’
000
r’00
0r’
000
r’00
0 s
ubto
tal b
roug
ht fo
rwar
d81
9,67
9-
51,1
7687
0,85
571
9,74
715
1,10
8-
719,
747
395,
591
483,
914
Rus
tenb
urg
10,0
00-
(9,0
00)
1,00
011
089
0-
110
5247
%-
Sed
iben
g 50
,000
-(1
4,72
8)35
,272
23,0
0012
,272
-23
,000
20,9
9591
%23
,873
Sen
qu15
,000
--
15,0
0011
,000
4,00
0-
11,0
003,
676
33%
-
Sis
onke
-
--
--
--
--
-3,
501
Sol
Pla
atjie
19
,300
-(9
,300
)10
,000
9,00
01,
000
-9,
000
--
15,0
00
Ste
ve T
shw
ete
10,0
00-
-10
,000
10,0
00-
-10
,000
1,18
012
%-
Thu
lam
ela
20,0
00-
-20
,000
20,0
00-
-20
,000
7,36
337
%7,
000
Tlo
kwe
8,00
0-
(7,1
48)
852
-85
2-
--
--
Tsh
wan
e 38
,021
--
38,0
2111
,116
26,9
05-
11,1
164,
482
40%
6,72
6
Um
geni
3,
000
--
3,00
03,
000
--
3,00
0-
-11
,000
Um
tshe
zi12
,000
-4,
000
16,0
0014
,816
1,18
4-
14,8
1610
,916
74%
-
Um
zim
khul
u10
,000
--
10,0
0010
,000
--
10,0
008,
723
87%
-
Wes
t Ran
d15
,000
-(1
5,00
0)-
--
--
--
Zul
ulan
d -
--
--
--
--
-38
0
tota
l 1,
030,
000
--
1,03
0,00
083
1,78
919
8,21
1-
831,
789
452,
978
551,
394
aN
Nex
ure
1B
- CO
NTI
NU
ED
STAT
EMEN
T O
F CO
ND
ITIO
NA
L G
RAN
TS P
AID
TO
MU
NIC
IPA
LITI
ES -
cont
inue
d
NT AR 10-11_10.indd 173 2011/08/17 10:02 AM

Annual Financial Statements
Nat
iona
l Tre
asur
y A
nnua
l Rep
ort 2
010/
11
174
annexures to the financial statements - continued
national treasury vote 9
FOR the yeaR ended 31 maRch 2011a
NN
exu
re 1
C
STAT
EMEN
T O
F U
NCO
ND
ITIO
NA
L G
RAN
TS P
AID
TO
MU
NIC
IPA
LITI
ES
Na
Me
oF
Mu
NiC
ipa
lity
Gra
Nt
all
oCa
tio
Ntr
aN
sFer
speN
t20
09/1
0
Div
ision
of
reve
nue a
ctro
llove
rsad
just
men
tsto
tal
avai
labl
eac
tual
tr
ansf
er
% o
f ava
ilabl
e Fu
nds
tran
sfer
red
amou
nt
rece
ived
by
mun
icipa
lity
amou
nt
spen
t by
mun
icipa
lity
% o
f ava
ilabl
e fu
nds s
pent
by
mun
icipa
lity
tota
l ava
ilabl
e
r’00
0r’
000
r’00
0r’
000
r’00
0%
r’00
0r’
000
%r’
000
!Kai
! Gar
ib
1,
200
--
1,20
0
1,
200
100%
1,20
0
1,
048
87%
1,00
0
!Ykh
eis
1,20
0 -
-
1,
200
1,20
0 10
0%
1,
200
1,03
6 86
%75
0
//Kh
ara
Hai
s
1,
200
--
1,20
0
1,
200
100%
1,20
0
384
32%
1,00
0
Aba
qulu
si
1,
200
--
1,20
0
1,
200
100%
1,20
0
1,
112
93%
1,00
0
Aga
nang
1,00
0 -
-
1,
000
1,00
0 10
0%
1,
000
68
3 68
%1,
000
Alb
ert L
uthu
li
3,
000
--
3,00
0
3,
000
100%
3,00
0
606
20%
2,75
0
Alfr
ed N
zo
1,
000
--
1,00
0
1,
000
100%
1,00
0
655
66%
750
Am
ahla
thi
1,25
0 -
-
1,
250
1,25
0 10
0%
1,
250
93
6 75
%1,
500
Am
ajub
a
1,
000
--
1,00
0
1,
000
100%
1,00
0
419
42%
750
Am
atol
e
1,
000
--
1,00
0
1,
000
100%
1,00
0
594
59%
750
Ba-P
hala
borw
a
1,
000
--
1,00
0
1,
000
100%
1,00
0
767
77%
750
Bavi
aans
1,25
0 -
-
1,
250
1,25
0 10
0%
1,
250
1,22
0 98
%1,
000
Beau
fort
Wes
t
1,
000
--
1,00
0
1,
000
100%
1,00
0
883
88%
1,00
0
Bela
-Bel
a
1,
000
--
1,00
0
1,
000
100%
1,00
0
843
84%
750
Berg
rivie
r
1,
000
--
1,00
0
1,
000
100%
1,00
0
962
96%
750
Bito
u
2,
750
--
2,75
0
2,
750
100%
2,75
0
837
30%
2,75
0
Blou
berg
1,25
0 -
-
1,
250
1,25
0 10
0%
1,
250
47
2 38
%1,
000
Blue
Cra
ne R
oute
1,20
0 -
-
1,
200
1,20
0 10
0%
1,
200
53
1 44
%1,
000
subt
otal
car
ried
fo
rwar
d23
,500
--
23,5
0023
,500
23,5
0013
,988
20,2
50
NT AR 10-11_10.indd 174 2011/08/17 10:02 AM

Annual Financial Statements
175
Nat
iona
l Tre
asur
y A
nnua
l Rep
ort 2
010/
11
annexures to the financial statements - continued
national treasury vote 9
FOR the yeaR ended 31 maRch 2011
aN
Nex
ure
1C
- CO
NTI
NU
ED
STAT
EMEN
T O
F U
NCO
ND
ITIO
NA
L G
RAN
TS P
AID
TO
MU
NIC
IPA
LITI
ES -
cont
inue
d
Na
Me
oF
Mu
NiC
ipa
lity
Gra
Nt
all
oCa
tio
Ntr
aN
sFer
speN
t20
09/1
0
Div
ision
of
reve
nue a
ct r
ollo
vers
adju
stm
ents
tota
l av
aila
ble
actu
al
tran
sfer
% o
f ava
ilabl
e Fu
nds
tran
sfer
red
amou
nt
rece
ived
by
mun
icipa
lity
amou
nt
spen
t by
mun
icipa
lity
% o
f ava
ilabl
e fu
nds s
pent
by
mun
icipa
lity
tota
l ava
ilabl
e
r’00
0r’
000
r’00
0r’
000
r’00
0%
r’00
0r’
000
%r’
000
subt
otal
bro
ught
fo
rwar
d23
,500
--
23,5
0023
,500
-23
,500
13,9
88-
20,2
50
Boja
nala
Pla
tinum
1,00
0 -
-1,
000
1,00
010
0%1,
000
85
4 85
%75
0
Dr.
Ruth
Seg
omot
si
Mom
pati
Dis
tric
t
1,
000
--
1,00
01,
000
100%
1,00
0
828
83%
750
Lang
erbe
rg
(Bre
ede
Rivi
er
Win
elan
ds)
1,00
0 -
-1,
000
1,00
010
0%1,
000
568
57%
750
Bree
de V
alle
y
1,
000
--
1,00
01,
000
100%
1,00
0
364
36%
750
Buffa
lo C
ity
1,
200
--
1,20
01,
200
100%
1,20
0
913
76%
1,00
0
Bush
buck
ridge
1,00
0 -
-1,
000
1,00
010
0%1,
000
65
2 65
%75
0
Caca
du
1,
250
--
1,25
01,
250
100%
1,25
0
859
69%
750
Cam
debo
o
2,
000
--
2,00
02,
000
100%
2,00
0
2,
000
100%
2,00
0
Cape
Agu
lhas
1,25
0 -
-1,
250
1,25
010
0%1,
250
97
8 78
%1,
000
Cape
Tow
n
1,
000
--
1,00
01,
000
100%
1,00
0
1,
000
100%
750
Cape
Win
elan
ds
1,
000
--
1,00
01,
000
100%
1,00
0
862
86%
750
Capr
icor
n
1,
000
--
1,00
01,
000
100%
1,00
0
329
33%
750
Cede
rber
g
1,
000
--
1,00
01,
000
100%
1,00
0
585
59%
1,00
0
Cent
ral K
aroo
1,00
0 -
-1,
000
1,00
010
0%1,
000
80
5 81
%75
0
Chr
is H
ani
1,25
0 -
-1,
250
1,25
010
0%1,
250
94
8 76
%75
0
Dan
nhau
ser
3,00
0 -
-3,
000
3,00
010
0%3,
000
1,66
9 56
%2,
750
Del
mas
1,00
0 -
-1,
000
1,00
010
0%1,
000
32
7 33
%75
0
Dih
labe
ng
1,
200
--
1,20
01,
200
100%
1,20
0
607
51%
750
Dik
gatlo
ng
1,
200
--
1,20
01,
200
100%
1,20
0
443
37%
750
Dip
ales
eng
1,00
0 -
-1,
000
1,00
010
0%1,
000
18
9 19
%1,
000
subt
otal
car
ried
fo
rwar
d47
,850
--
47,8
5047
,850
47,8
5029
,768
1052
9
NT AR 10-11_10.indd 175 2011/08/17 10:02 AM

Annual Financial Statements
Nat
iona
l Tre
asur
y A
nnua
l Rep
ort 2
010/
11
176
annexures to the financial statements - continued
national treasury vote 9
FOR the yeaR ended 31 maRch 2011a
NN
exu
re 1
C - C
ON
TIN
UED
STAT
EMEN
T O
F U
NCO
ND
ITIO
NA
L G
RAN
TS P
AID
TO
MU
NIC
IPA
LITI
ES -
cont
inue
d
Na
Me
oF
Mu
NiC
ipa
lity
Gra
Nt
all
oCa
tio
Ntr
aN
sFer
speN
t20
09/1
0
Div
ision
of
reve
nue a
ctro
llove
rsad
just
men
tsto
tal
avai
labl
eac
tual
tr
ansf
er
% o
f ava
ilabl
e Fu
nds
tran
sfer
red
amou
nt
rece
ived
by
mun
icipa
lity
amou
nt
spen
t by
mun
icipa
lity
% o
f ava
ilabl
e fu
nds s
pent
by
mun
icipa
lity
tota
l av a
ilabl
e
r’00
0r’
000
r’00
0r’
000
r’00
0%
r’00
0r’
000
%r’
000
Bala
nce
brou
ght
forw
ard
47,8
50-
-47
,850
47,8
50-
47,8
5029
,768
-39
,500
Dits
obot
la
1,
000
--
1,00
01,
000
100%
1,00
0
1,
000
100%
1,00
0
Dr J
S M
orok
a
3,
000
--
3,00
03,
000
100%
3,00
0
1,
433
48%
2,75
0
Dra
kens
tein
1,00
0 -
-1,
000
1,00
010
0%1,
000
1,00
0 10
0%75
0
Eden
1,00
0 -
-1,
000
1,00
010
0%1,
000
62
4 62
%75
0
Edum
be
1,
200
--
1,20
01,
200
100%
1,20
0
634
53%
750
Ehla
nzen
i
1,
000
--
1,00
01,
000
100%
1,00
0
426
43%
750
Ekur
hule
ni M
etro
1,00
0 -
-1,
000
1,00
010
0%1,
000
1,00
0 10
0%75
0
Elun
dini
1,25
0 -
-1,
250
1,25
010
0%1,
250
1,12
4 90
%1,
000
Emad
lang
eni
1,25
0 -
-1,
250
1,25
010
0%1,
250
84
9 68
%1,
000
Emak
haze
ni
1,
000
--
1,00
01,
000
100%
1,00
0
976
98%
1,00
0
Emal
ahle
ni
(Eas
tern
Cap
e)
1,
250
--
1,25
01,
250
100%
1,25
0
460
37%
1,00
0
Emal
ahle
ni
(Mpu
mal
anga
)
1,
000
--
1,00
01,
000
100%
1,00
0
422
42%
750
Emfu
leni
1,00
0 -
-1,
000
1,00
010
0%1,
000
70
3 70
%75
0
Emna
mbi
thi
(Lad
ysm
ith)
1,20
0 -
-1,
200
1,20
010
0%1,
200
1,18
9 99
%75
0
Emth
anje
ni
1,
200
--
1,20
01,
200
100%
1,20
0
1,
140
95%
750
Endu
men
i
1,
200
--
1,20
01,
200
100%
1,20
0
1,
054
88%
750
Engc
obo
1,20
0 -
-1,
200
1,20
0 10
0%1,
200
1,05
4 88
%1,
000
Ethe
kwin
i
1,
000
--
1,00
01,
000
100%
1,00
0
1,
000
100%
750
Ezin
qole
ni
1,
250
--
1,25
01,
250
100%
1,25
0
1,
250
100%
1,00
0
Feta
kgom
o
1,
250
--
1,25
01,
250
100%
1,25
0
1,
129
90%
1,00
0
subt
otal
car
ried
fo
rwar
d72
,100
--
72,1
0072
,100
72,1
0048
,235
58,5
00
NT AR 10-11_10.indd 176 2011/08/17 10:02 AM
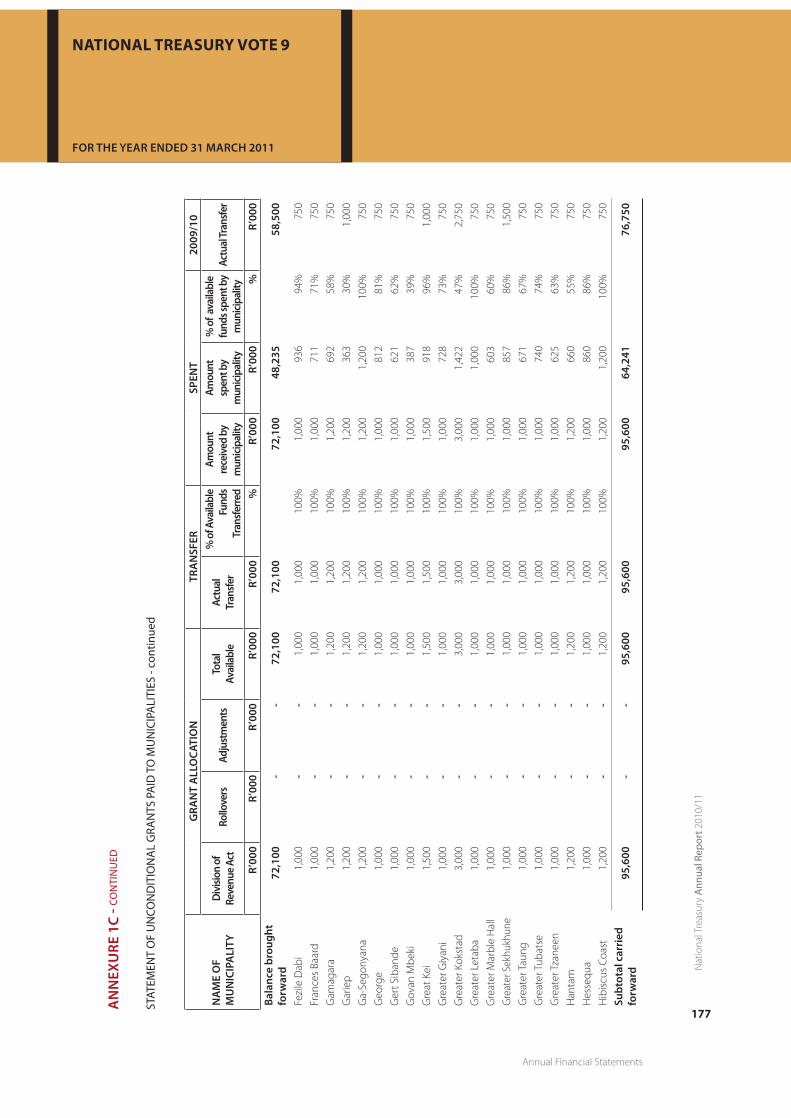
Annual Financial Statements
177
Nat
iona
l Tre
asur
y A
nnua
l Rep
ort 2
010/
11
annexures to the financial statements - continued
national treasury vote 9
FOR the yeaR ended 31 maRch 2011
aN
Nex
ure
1C
- CO
NTI
NU
ED
STAT
EMEN
T O
F U
NCO
ND
ITIO
NA
L G
RAN
TS P
AID
TO
MU
NIC
IPA
LITI
ES -
cont
inue
d
Na
Me
oF
Mu
NiC
ipa
lity
Gra
Nt
all
oCa
tio
Ntr
aN
sFer
speN
t20
09/1
0
Div
ision
of
reve
nue a
ctro
llove
rsad
just
men
tsto
tal
avai
labl
eac
tual
tr
ansf
er
% o
f ava
ilabl
e Fu
nds
tran
sfer
red
amou
nt
rece
ived
by
mun
icipa
lity
amou
nt
spen
t by
mun
icipa
lity
% o
f ava
ilabl
e fu
nds s
pent
by
mun
icipa
lity
actu
al tr
ansf
er
r’00
0r’
000
r’00
0r’
000
r’00
0%
r’00
0r’
000
%r’
000
Bala
nce
brou
ght
forw
ard
72,1
00-
-72
,100
72,1
0072
,100
48,2
3558
,500
Fezi
le D
abi
1,00
0 -
-1,
000
1,00
010
0%1,
000
93
6 94
%75
0
Fran
ces
Baar
d
1,
000
--
1,00
01,
000
100%
1,00
0
711
71%
750
Gam
agar
a
1,
200
--
1,20
01,
200
100%
1,20
0
692
58%
750
Gar
iep
1,20
0 -
-1,
200
1,20
010
0%1,
200
36
3 30
%1,
000
Ga-
Sego
nyan
a
1,
200
--
1,20
01,
200
100%
1,20
0
1,
200
100%
750
Geo
rge
1,00
0 -
-1,
000
1,00
010
0%1,
000
81
2 81
%75
0
Ger
t Sib
ande
1,00
0 -
-1,
000
1,00
010
0%1,
000
62
1 62
%75
0
Gov
an M
beki
1,00
0 -
-1,
000
1,00
010
0%1,
000
38
7 39
%75
0
Gre
at K
ei
1,
500
--
1,50
01,
500
100%
1,50
0
918
96%
1,00
0
Gre
ater
Giy
ani
1,00
0 -
-1,
000
1,00
010
0%1,
000
72
8 73
%75
0
Gre
ater
Kok
stad
3,00
0 -
-3,
000
3,00
010
0%3,
000
1,42
2 47
%2,
750
Gre
ater
Let
aba
1,00
0 -
-1,
000
1,00
010
0%1,
000
1,00
0 10
0%75
0
Gre
ater
Mar
ble
Hal
l
1,
000
--
1,00
01,
000
100%
1,00
0
603
60%
750
Gre
ater
Sek
hukh
une
1,00
0 -
-1,
000
1,00
010
0%1,
000
85
7 86
%1,
500
Gre
ater
Tau
ng
1,
000
--
1,00
01,
000
100%
1,00
0
671
67%
750
Gre
ater
Tub
atse
1,00
0 -
-1,
000
1,00
010
0%1,
000
74
0 74
%75
0
Gre
ater
Tza
neen
1,00
0 -
-1,
000
1,00
010
0%1,
000
62
5 63
%75
0
Han
tam
1,20
0 -
-1,
200
1,20
010
0%1,
200
66
0 55
%75
0
Hes
sequ
a
1,
000
--
1,00
01,
000
100%
1,00
0
860
86%
750
Hib
iscu
s Co
ast
1,20
0 -
-1,
200
1,20
010
0%1,
200
1,20
0 10
0%75
0
subt
otal
car
ried
fo
rwar
d95
,600
--
95,6
0095
,600
95,6
0064
,241
76,7
50
NT AR 10-11_10.indd 177 2011/08/17 10:02 AM

Annual Financial Statements
Nat
iona
l Tre
asur
y A
nnua
l Rep
ort 2
010/
11
178
annexures to the financial statements - continued
national treasury vote 9
FOR the yeaR ended 31 maRch 2011a
NN
exu
re 1
C - C
ON
TIN
UED
STAT
EMEN
T O
F U
NCO
ND
ITIO
NA
L G
RAN
TS P
AID
TO
MU
NIC
IPA
LITI
ES -
cont
inue
d
Na
Me
oF
Mu
NiC
ipa
lity
Gra
Nt
all
oCa
tio
Ntr
aN
sFer
speN
t20
09/1
0
Div
ision
of
reve
nue a
ctro
llove
rsad
just
men
tsto
tal
avai
labl
eac
tual
tr
ansf
er
% o
f ava
ilabl
e Fu
nds
tran
sfer
red
amou
nt
rece
ived
by
mun
icipa
lity
amou
nt
spen
t by
mun
icipa
lity
% o
f ava
ilabl
e fu
nds s
pent
by
mun
icipa
lity
actu
al tr
ansf
er
r’00
0r’
000
r’00
0r’
000
r’00
0%
r’00
0r’
000
%r’
000
Bala
nce
brou
ght
forw
ard
95,6
00-
-95
,600
95,6
0095
,600
64,2
4176
,750
Hla
bisa
1,20
0 -
-1,
200
1,20
010
0%1,
200
42
7 36
%1,
500
Ikw
ezi
1,20
0 -
-1,
200
1,20
010
0%1,
200
1,20
0 10
0%1,
000
iLem
be
1,
000
--
1,00
01,
000
100%
1,00
0
368
37%
750
Imba
baza
ne
1,
250
--
1,25
01,
250
100%
1,25
0
783
63%
1,00
0
Impe
ndle
1,25
0 -
-1,
250
1,25
010
0%1,
250
86
5 69
%1,
000
Inda
ka
1,
250
--
1,25
01,
250
100%
1,25
0
371
30%
1,00
0
Ingw
e
1,
200
--
1,20
01,
200
100%
1,20
0
1,
146
96%
750
Inkw
anca
2,00
0 -
-2,
000
2,00
010
0%2,
000
2,00
0 10
0%1,
750
Ints
ika
Yeth
u
1,
250
--
1,25
01,
250
100%
1,25
0
1,
199
96%
1,00
0
Inxu
ba Y
e Th
emba
1,25
0 -
-1,
250
1,25
010
0%1,
250
1,25
0 10
0%1,
500
City
of
Joha
nnes
burg
1,00
0 -
-1,
000
1,00
010
0%1,
000
10
4 10
%75
0
Jozi
ni
1,
200
--
1,20
01,
200
100%
1,20
0
1,
200
100%
1,50
0
Kagi
sano
1,00
0 -
-1,
000
1,00
010
0%1,
000
48
5 49
%75
0
Kam
iesb
erg
1,20
0 -
-1,
200
1,20
010
0%1,
200
1,04
4 87
%75
0
Kann
alan
d
1,
000
--
1,00
01,
000
100%
1,00
0
702
70%
1,00
0
Kare
eber
g
1,
200
--
1,20
01,
200
100%
1,20
0
769
64%
750
Karo
o H
oogl
and
3,00
0 -
-3,
000
3,00
010
0%3,
000
3,00
0 10
0%2,
750
Kgal
agad
i
1,
000
--
1,00
01,
000
100%
1,00
0
570
57%
750
Kgat
elop
ele
1,25
0 -
-1,
250
1,25
010
0%1,
250
56
1 45
%1,
000
Kget
lenr
ivie
r
3,
000
--
3,00
03,
000
100%
3,00
0
2,
611
87%
2,75
0
subt
otal
car
ried
fo
rwar
d12
3,30
0-
-12
3,30
012
3,30
012
3,30
084
,896
100,
750
NT AR 10-11_10.indd 178 2011/08/17 10:02 AM

Annual Financial Statements
179
Nat
iona
l Tre
asur
y A
nnua
l Rep
ort 2
010/
11
annexures to the financial statements - continued
national treasury vote 9
FOR the yeaR ended 31 maRch 2011
aN
Nex
ure
1C
- CO
NTI
NU
ED
STAT
EMEN
T O
F U
NCO
ND
ITIO
NA
L G
RAN
TS P
AID
TO
MU
NIC
IPA
LITI
ES -
cont
inue
d
Na
Me
oF
Mu
NiC
ipa
lity
Gra
Nt
all
oCa
tio
Ntr
aN
sFer
speN
t20
09/1
0
Div
ision
of
reve
nue a
ctro
llove
rsad
just
men
tsto
tal
avai
labl
eac
tual
tr
ansf
er
% o
f ava
ilabl
e Fu
nds
tran
sfer
red
amou
nt
rece
ived
by
mun
icipa
lity
amou
nt
spen
t by
mun
icipa
lity
% o
f ava
ilabl
e fu
nds s
pent
by
mun
icipa
lity
tota
l av a
ilabl
e
r’00
0r’
000
r’00
0r’
000
r’00
0%
r’00
0r’
000
%r’
000
Blan
ace
brou
ght
forw
ard
123,
300
--
123,
300
123,
300
123,
300
84,8
9610
0,75
0
Khai
-Ma
3,00
0 -
-3,
000
3,00
010
0%3,
000
1,86
9 62
%2,
750
King
Sab
ata
Dal
indy
ebo
1,20
0 -
-1,
200
1,20
010
0%1,
200
35
6 30
%1,
250
Knys
na
1,
000
--
1,00
01,
000
100%
1,00
0
609
61%
1,00
0
Kopa
nong
1,20
0 -
-1,
200
1,20
010
0%1,
200
81
8 68
%75
0
Koug
a
1,
200
--
1,20
01,
200
100%
1,20
0
1,
200
100%
1,00
0
Kouk
amm
a
3,
000
--
3,00
03,
000
100%
3,00
0
850
28%
2,75
0
Kung
win
i
1,
000
--
1,00
01,
000
100%
1,00
0
729
73%
750
Kwa
Duk
uza
1,20
0 -
-1,
200
1,20
010
0%1,
200
58
5 49
%75
0
Kwa
Sani
1,50
0 -
-1,
500
1,50
010
0%1,
500
1,24
8 83
%2,
500
Lain
gsbu
rg
1,
250
--
1,25
01,
250
100%
1,25
0
1,
048
84%
750
Lejw
elep
utsw
a
1,
000
--
1,00
01,
000
100%
1,00
0
1,
000
100%
750
Lekw
a
1,
000
--
1,00
01,
000
100%
1,00
0
702
70%
750
Lekw
a-Te
man
e
1,
250
--
1,25
01,
250
100%
1,25
0
379
30%
1,00
0
Lepe
lle-N
kum
pi
3,
000
--
3,00
03,
000
100%
3,00
0
2,
684
89%
2,75
0
Leph
alal
e
1,
000
--
1,00
01,
000
100%
1,00
0
725
73%
750
Lese
di
3,
000
--
3,00
03,
000
100%
3,00
0
669
22%
2,75
0
Lets
emen
g
1,
200
--
1,20
01,
200
100%
1,20
0
854
71%
1,00
0
Lukh
anji
1,25
0 -
-1,
250
1,25
010
0%1,
250
68
0 54
%1,
000
Elia
s M
otso
aled
i
1,
000
--
1,00
01,
000
100%
1,00
0
869
87%
750
Mad
iben
g
1,
000
--
1,00
01,
000
100%
1,00
0
305
31%
750
subt
otal
car
ried
fo
rwar
d15
3,55
0-
-15
3,55
015
3,55
015
3,55
010
3,07
512
7,25
0
NT AR 10-11_10.indd 179 2011/08/17 10:02 AM

Annual Financial Statements
Nat
iona
l Tre
asur
y A
nnua
l Rep
ort 2
010/
11
180
annexures to the financial statements - continued
national treasury vote 9
FOR the yeaR ended 31 maRch 2011a
NN
exu
re 1
C - C
ON
TIN
UED
STAT
EMEN
T O
F U
NCO
ND
ITIO
NA
L G
RAN
TS P
AID
TO
MU
NIC
IPA
LITI
ES -
cont
inue
d
Na
Me
oF
Mu
NiC
ipa
lity
Gra
Nt
all
oCa
tio
Ntr
aN
sFer
speN
t20
09/1
0
Div
ision
of
reve
nue a
ctro
llove
rsad
just
men
tsto
tal
avai
labl
eac
tual
tr
ansf
er
% o
f ava
ilabl
e Fu
nds
tran
sfer
red
amou
nt
rece
ived
by
mun
icipa
lity
amou
nt
spen
t by
mun
icipa
lity
% o
f ava
ilabl
e fu
nds s
pent
by
mun
icipa
lity
tota
l ava
ilabl
e
r’00
0r’
000
r’00
0r’
000
r’00
0%
r’00
0r’
000
%r’
000
Bala
nce
brou
ght
forw
ard
153,
550
--
153,
550
153,
550
-15
3,55
010
3,07
5-
127,
250
Mafi
keng
1,00
0 -
-
1,
000
1,00
0 10
0%10
0%
753
75%
1,00
0
Maf
ube
1,00
0 -
-
1,
000
1,00
0 10
0%
1,
000
60
7 61
%75
0
Mag
aren
g
1,
250
--
1,25
0
1,
250
100%
1,25
0
854
68%
750
Mak
ana
1,20
0 -
-
1,
200
1,20
0 10
0%
1,
200
98
3 82
%1,
000
Mak
hado
1,00
0 -
-
1,
000
1,00
0 10
0%
1,
000
26
9 27
%75
0
Mak
hudu
tam
aga
1,50
0 -
-
1,
500
1,50
0 10
0%
1,
500
1,08
6 72
%1,
500
Mal
etsw
ai
1,
250
--
1,25
0
1,
250
100%
1,25
0
480
38%
1,00
0
Mal
uti-A
-Pho
fung
1,20
0 -
-
1,
200
1,20
0 10
0%
1,
200
44
1 37
%75
0
Mam
usa
1,00
0 -
-
1,
000
1,00
0 10
0%
1,
000
44
8 45
%75
0
Man
deni
1,
200
--
1,20
0
1,
200
100%
1,20
0
675
56%
750
Man
gaun
g
1,
189
--
1,18
9
1,
189
100%
1,18
9
567
48%
750
Man
tsop
a
3,
000
--
3,00
0
3,
000
100%
3,00
0
3,
000
100%
2,75
0
Map
hum
ulo
1,20
0 -
-
1,
200
1,20
0 10
0%
1,
200
64
8 54
%75
0
Maq
uass
i Hill
1,00
0 -
-
1,
000
1,00
0 10
0%
1,
000
37
5 38
%75
0
Mar
ulen
g
1,
250
--
1,25
0
1,
250
100%
1,25
0
724
58%
1,00
0
Mas
ilony
ana
3,00
0 -
-
3,
000
3,00
0 10
0%
3,
000
3,00
0 10
0%2,
750
Mat
atie
le
1,
200
--
1,20
0
1,
200
100%
1,20
0
238
20%
1,00
0
Mat
jabe
ng
1,
000
--
1,00
0
1,
000
100%
1,00
0
41
4%75
0
City
of M
atlo
sana
1,00
0 -
-
1,
000
1,00
0 10
0%
1,
000
59
1 59
%75
0
Mat
zika
ma
1,00
0 -
-
1,
000
1,00
0 10
0%
1,
000
1,00
0 10
0%75
0
subt
otal
car
ried
fo
rwar
d17
9,98
9-
-17
9,98
917
9,98
917
9,98
911
9,85
514
8,25
0
NT AR 10-11_10.indd 180 2011/08/17 10:02 AM

Annual Financial Statements
181
Nat
iona
l Tre
asur
y A
nnua
l Rep
ort 2
010/
11
annexures to the financial statements - continued
national treasury vote 9
FOR the yeaR ended 31 maRch 2011
aN
Nex
ure
1C
- CO
NTI
NU
ED
STAT
EMEN
T O
F U
NCO
ND
ITIO
NA
L G
RAN
TS P
AID
TO
MU
NIC
IPA
LITI
ES -
cont
inue
d
Na
Me
oF
Mu
NiC
ipa
lity
Gra
Nt
all
oCa
tio
Ntr
aN
sFer
speN
t20
09/1
0
Div
ision
of
reve
nue a
ctro
llove
rsad
just
men
tsto
tal
avai
labl
eac
tual
tr
ansf
er
% o
f ava
ilabl
e Fu
nds
tran
sfer
red
amou
nt
rece
ived
by
mun
icipa
lity
amou
nt
spen
t by
mun
icipa
lity
% o
f ava
ilabl
e fu
nds s
pent
by
mun
icipa
lity
tota
l ava
ilabl
e
r’00
0r’
000
r’00
0r’
000
r’00
0%
r’00
0r’
000
%r’
000
Bala
nce
brou
ght
forw
ard
179,
989
--
179,
989
179,
989
179,
989
119,
855
148,
250
Mbh
ashe
1,25
0 -
-1,
250
1,25
010
0%1,
250
47
0 38
%1,
000
Mbi
zana
1,20
0 -
-1,
200
1,20
010
0%1,
200
1,20
0 10
0%1,
000
Mbo
mbe
la
1,
000
--
1,00
01,
000
100%
1,00
0
1,
000
100%
750
Mbo
nam
bi
1,
200
--
1,20
01,
200
100%
1,20
0
1,
165
97%
750
Mer
afon
g C
ity
1,
000
--
1,00
01,
000
100%
1,00
0
1,
000
100%
750
Met
sim
ahol
o
1,
000
--
1,00
01,
000
100%
1,00
0
710
71%
750
Met
swed
ing
1,25
0 -
-1,
250
1,25
010
0%1,
250
1,10
2 88
%1,
000
Mhl
ontlo
1,20
0 -
-1,
200
1,20
010
0%1,
200
44
2 37
%1,
000
Mid
vaal
1,00
0 -
-1,
000
1,00
010
0%1,
000
1,00
0 10
0%75
0M
ier
1,20
0 -
-1,
200
1,20
010
0%1,
200
98
0 82
%1,
000
Mkh
amba
thin
i
1,
500
--
1,50
01,
500
100%
1,50
0
827
55%
1,50
0M
khon
do
1,
000
--
1,00
01,
000
100%
1,00
0
722
72%
1,00
0M
nqum
a
1,
200
--
1,20
01,
200
100%
1,20
0
1,
138
95%
1,00
0M
odim
olle
3,00
0 -
-3,
000
3,00
010
0%3,
000
2,44
1 81
%2,
750
Mog
alak
wen
a
1,
000
--
1,00
01,
000
100%
1,00
0
904
90%
750
Mog
ale
City
1,00
0 -
-1,
000
1,00
010
0%1,
000
79
2 79
%75
0M
ohok
are
1,25
0 -
-1,
250
1,25
010
0%1,
250
96
7 77
%1,
000
Mol
emol
e
1,
000
--
1,00
01,
000
100%
1,00
0
525
53%
750
Mol
opo
1,25
0 -
-1,
250
1,25
010
0%1,
250
28
3 23
%1,
000
Mpo
fana
1,50
0 -
-1,
500
1,50
010
0%1,
500
1,41
0 94
%1,
500
subt
otal
car
ried
fo
rwar
d20
4,98
9-
-20
4,98
920
4,98
920
4,98
913
8,93
316
9,00
0
NT AR 10-11_10.indd 181 2011/08/17 10:02 AM

Annual Financial Statements
Nat
iona
l Tre
asur
y A
nnua
l Rep
ort 2
010/
11
182
annexures to the financial statements - continued
national treasury vote 9
FOR the yeaR ended 31 maRch 2011a
NN
exu
re 1
C - C
ON
TIN
UED
STAT
EMEN
T O
F U
NCO
ND
ITIO
NA
L G
RAN
TS P
AID
TO
MU
NIC
IPA
LITI
ES -
cont
inue
d
Na
Me
oF
Mu
NiC
ipa
lity
Gra
Nt
all
oCa
tio
Ntr
aN
sFer
speN
t20
09/1
0
Div
ision
of
reve
nue a
ctro
llove
rsad
just
men
tsto
tal
avai
labl
eac
tual
tr
ansf
er
% o
f ava
ilabl
e Fu
nds
tran
sfer
red
amou
nt
rece
ived
by
mun
icipa
lity
amou
nt
spen
t by
mun
icipa
lity
% o
f ava
ilabl
e fu
nds s
pent
by
mun
icipa
lity
tota
l av a
ilabl
e
r’00
0r’
000
r’00
0r’
000
r’00
0%
r’00
0r’
000
%r’
000
Bala
nce
brou
ght
forw
ard
204,
989
--
204,
989
204,
989
204,
989
138,
933
169,
000
Moo
kgop
ong
1,00
0 -
-1,
000
1,00
010
0%1,
000
91
7 92
%75
0
Mop
ani
1,00
0 -
-1,
000
1,00
010
0%1,
000
52
7 53
%75
0
Moq
haka
1,20
0 -
-1,
200
1,20
010
0%1,
200
50
8 42
%75
0
Mor
etel
e
1,
000
--
1,00
01,
000
100%
1,00
0
350
35%
750
Mos
es K
otan
e
1,
000
--
1,00
01,
000
100%
1,00
0
482
48%
750
Mos
haw
eng
1,20
0 -
-1,
200
1,20
010
0%1,
200
44
9 37
%1,
000
Mos
sel B
ay
1,
000
--
1,00
01,
000
100%
1,00
0
552
55%
750
Mot
heo
1,00
0 -
-1,
000
1,00
010
0%1,
000
57
6 58
%75
0
Msi
nga
1,20
0 -
-1,
200
1,20
010
0%1,
200
56
4 47
%1,
000
Msu
kalig
wa
1,00
0 -
-1,
000
1,00
010
0%1,
000
29
5 30
%1,
000
Msu
nduz
i
1,
200
--
1,20
01,
200
100%
1,20
0
29
2%75
0
Mth
onja
neni
1,20
0 -
-1,
200
1,20
010
0%1,
200
1,16
2 97
%75
0
Mtu
batu
ba
3,
000
--
3,00
03,
000
100%
3,00
0
2,
963
99%
2,75
0
Mus
ina
3,00
0 -
-3,
000
3,00
010
0%3,
000
1,59
1 53
%2,
750
Mut
ale
1,00
0 -
-1,
000
1,00
010
0%1,
000
50
4 50
%1,
000
Nal
a
1,
500
--
1,50
01,
500
100%
1,50
0
985
66%
1,50
0
Nal
edi (
Free
Sta
te)
1,20
0 -
-1,
200
1,20
010
0%1,
200
53
2 44
%1,
000
Nal
edi (
Nor
th W
est)
1,25
0 -
-1,
250
1,25
010
0%1,
250
59
3 47
%75
0
Nam
a Kh
oi
1,
200
--
1,20
01,
200
100%
1,20
0
766
64%
750
Nam
akw
a
1,
000
-1,
000
1,00
010
0%1,
000
94
9 95
%75
0
subt
otal
car
ried
fo
rwar
d23
1,13
9-
-23
1,13
923
1,13
923
1,13
915
4,22
719
0,00
0
NT AR 10-11_10.indd 182 2011/08/17 10:02 AM

Annual Financial Statements
183
Nat
iona
l Tre
asur
y A
nnua
l Rep
ort 2
010/
11
annexures to the financial statements - continued
national treasury vote 9
FOR the yeaR ended 31 maRch 2011
aN
Nex
ure
1C
- CO
NTI
NU
ED
STAT
EMEN
T O
F U
NCO
ND
ITIO
NA
L G
RAN
TS P
AID
TO
MU
NIC
IPA
LITI
ES -
cont
inue
d
Na
Me
oF
Mu
NiC
ipa
lity
Gra
Nt
all
oCa
tio
Ntr
aN
sFer
speN
t20
09/1
0
Div
ision
of
reve
nue a
ctro
llove
rsad
just
men
tsto
tal
avai
labl
eac
tual
tr
ansf
er
% o
f ava
ilabl
e Fu
nds
tran
sfer
red
amou
nt
rece
ived
by
mun
icipa
lity
amou
nt
spen
t by
mun
icipa
lity
% o
f ava
ilabl
e fu
nds s
pent
by
mun
icipa
lity
tota
l av a
ilabl
e
r’00
0r’
000
r’00
0r’
000
r’00
0%
r’00
0r’
000
%r’
000
Bala
nce
brou
ght
forw
ard
231,
139
--
231,
139
231,
139
231,
139
154,
227
190,
000
Ndl
ambe
2,00
0 -
-2,
000
2,00
010
0%2,
000
1,99
8 10
0%2,
000
Ndw
edw
e
1,
200
--
1,20
01,
200
100%
1,20
0
1,
200
100%
1,00
0
Nel
son
Man
dela
Bay
1,00
0 -
-1,
000
1,00
010
0%1,
000
1,00
0 10
0%75
0
New
cast
le
1,
200
--
1,20
01,
200
100%
1,20
0
931
78%
1,50
0
Nga
kam
odiri
M
olem
a
1,
000
--
1,00
01,
000
100%
1,00
0
552
55%
1,00
0
Ngq
ushw
a
1,
200
--
1,20
01,
200
100%
1,20
0
668
56%
1,00
0
Ngw
athe
1,00
0 -
-1,
000
1,00
010
0%1,
000
63
0 63
%75
0
Nka
ndla
1,50
0 -
-1,
500
1,50
010
0%1,
500
1,32
7 88
%1,
500
Nka
ngal
a
1,
000
--
1,00
01,
000
100%
1,00
0
201
20%
750
Nke
toan
a
1,
200
--
1,20
01,
200
100%
1,20
0
554
46%
750
Nko
maz
i
1,
000
--
1,00
01,
000
100%
1,00
0
723
72%
750
Nko
nkob
e
1,
200
--
1,20
01,
200
100%
1,20
0
893
74%
1,00
0
Nok
eng
Tsa
Taem
ane
3,00
0 -
-3,
000
3,00
010
0%3,
000
1,63
7 55
%2,
750
Non
gom
a
1,
200
--
1,20
01,
200
100%
1,20
0
587
49%
750
Nqu
thu
1,25
0 -
-1,
250
1,25
010
0%1,
250
99
5 80
%1,
000
Nta
bank
ulu
1,25
0 -
-1,
250
1,25
010
0%1,
250
72
0 58
%1,
000
Nta
mba
nana
1,20
0 -
-1,
200
1,20
010
0%1,
200
1,20
0 10
0%75
0
Nxu
ba
1,
200
--
1,20
01,
200
100%
1,20
0
756
63%
1,00
0
Nya
nden
i
1,
200
--
1,20
01,
200
100%
1,20
0
1,
003
84%
1,50
0
O.R
Tam
bo
1,
000
--
1,00
01,
000
100%
1,00
0
447
45%
750
subt
otal
car
ried
fo
rwar
d25
6,93
9-
-25
6,93
925
6,93
925
6,93
917
2,24
921
2,25
0
NT AR 10-11_10.indd 183 2011/08/17 10:02 AM

Annual Financial Statements
Nat
iona
l Tre
asur
y A
nnua
l Rep
ort 2
010/
11
184
annexures to the financial statements - continued
national treasury vote 9
FOR the yeaR ended 31 maRch 2011a
NN
exu
re 1
C - C
ON
TIN
UED
STAT
EMEN
T O
F U
NCO
ND
ITIO
NA
L G
RAN
TS P
AID
TO
MU
NIC
IPA
LITI
ES -
cont
inue
d
Na
Me
oF
Mu
NiC
ipa
lity
Gra
Nt
all
oCa
tio
Ntr
aN
sFer
speN
t20
09/1
0
Div
ision
of
reve
nue a
ctro
llove
rsad
just
men
tsto
tal
avai
labl
eac
tual
tr
ansf
er
% o
f ava
ilabl
e Fu
nds
tran
sfer
red
amou
nt
rece
ived
by
mun
icipa
lity
amou
nt
spen
t by
mun
icipa
lity
% o
f ava
ilabl
e fu
nds s
pent
by
mun
icipa
lity
tota
l ava
ilabl
e
r’00
0r’
000
r’00
0r’
000
r’00
0%
r’00
0r’
000
%r’
000
Bala
nce
brou
ght
forw
ard
256,
939
--
256,
939
256,
939
256,
939
172,
249
212,
250
Okh
ahla
mba
1,20
0 -
-1,
200
1,20
010
0%1,
200
78
2 65
%75
0
Oud
tsho
orn
1,00
0 -
-1,
000
1,00
010
0%1,
000
77
0 77
%75
0
Ove
rber
g
1,
000
--
1,00
01,
000
100%
1,00
0
722
72%
750
Ove
rstr
and
1,00
0 -
-1,
000
1,00
010
0%1,
000
72
8 73
%75
0
Phok
wan
e
1,
250
--
1,25
01,
250
100%
1,25
0
1,
164
93%
750
Phum
elel
a
3,
000
--
3,00
03,
000
100%
3,00
0
2,
763
92%
2,75
0
Pixl
ey K
a Se
me
(Mpu
mal
anga
)
1,
000
--
1,00
01,
000
100%
1,00
0
440
44%
750
Karo
o D
istr
ict
1,00
0 -
-1,
000
1,00
010
0%1,
000
66
4 66
%75
0
Polo
kwan
e
1,
000
--
1,00
01,
000
100%
1,00
0
448
45%
750
Port
St J
ohn
2,00
0 -
-2,
000
2,00
010
0%2,
000
1,79
8 90
%1,
750
Prin
ce A
lber
t
1,
000
--
1,00
01,
000
100%
1,00
0
301
30%
750
Ngq
uza
Hill
1,20
0 -
-1,
200
1,20
010
0%1,
200
74
8 62
%1,
000
Ram
onts
here
M
oilo
a
1,
250
--
1,25
01,
250
100%
1,25
0
500
40%
1,00
0
Rand
font
ein
1,00
0 -
-1,
000
1,00
010
0%1,
000
89
9 90
%75
0
Ratlo
u
1,
250
--
1,25
01,
250
100%
1,25
0
574
46%
1,00
0
Reno
ster
berg
1,20
0 -
-1,
200
1,20
010
0%1,
200
1,20
0 10
0%75
0
Rich
mon
d
1,
500
--
1,50
01,
500
100%
1,50
0
1,
324
88%
2,50
0
subt
otal
car
ried
fo
rwar
d27
8,78
9-
-27
8,78
927
8,78
927
8,78
918
8,07
423
0,50
0
NT AR 10-11_10.indd 184 2011/08/17 10:02 AM
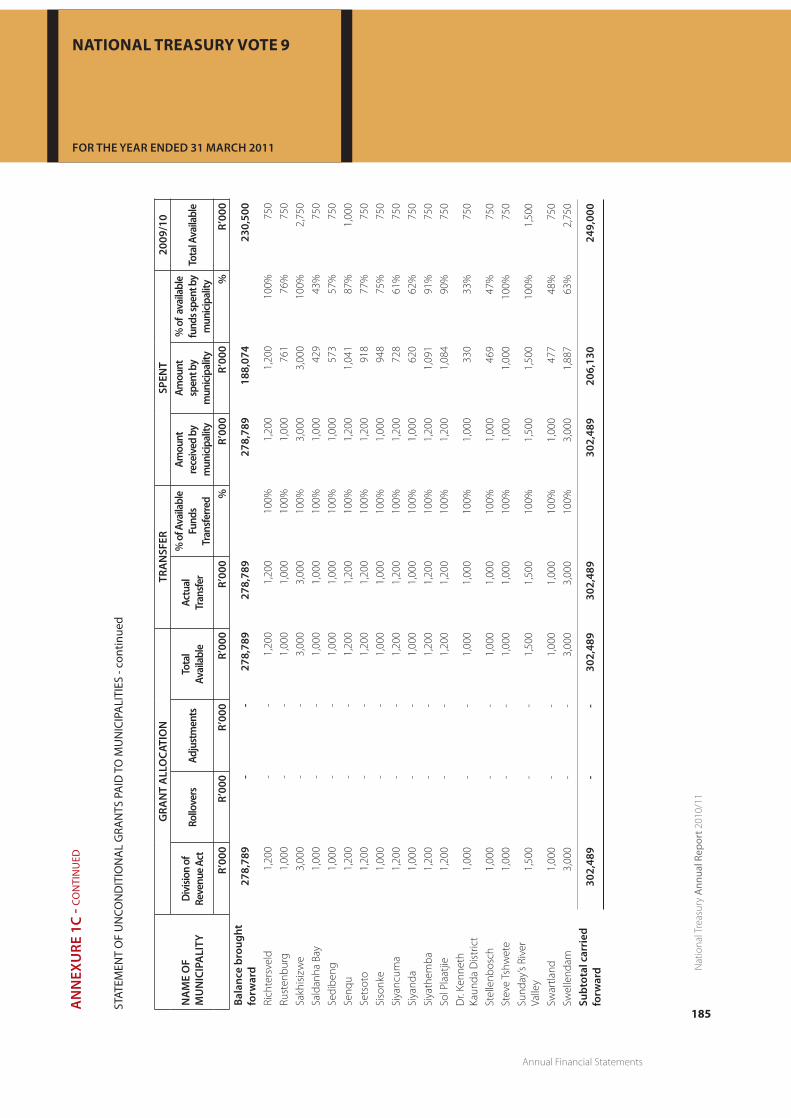
Annual Financial Statements
185
Nat
iona
l Tre
asur
y A
nnua
l Rep
ort 2
010/
11
annexures to the financial statements - continued
national treasury vote 9
FOR the yeaR ended 31 maRch 2011
aN
Nex
ure
1C
- CO
NTI
NU
ED
STAT
EMEN
T O
F U
NCO
ND
ITIO
NA
L G
RAN
TS P
AID
TO
MU
NIC
IPA
LITI
ES -
cont
inue
d
Na
Me
oF
Mu
NiC
ipa
lity
Gra
Nt
all
oCa
tio
Ntr
aN
sFer
speN
t20
09/1
0
Div
ision
of
reve
nue a
ctro
llove
rsad
just
men
tsto
tal
avai
labl
eac
tual
tr
ansf
er
% o
f ava
ilabl
e Fu
nds
tran
sfer
red
amou
nt
rece
ived
by
mun
icipa
lity
amou
nt
spen
t by
mun
icipa
lity
% o
f ava
ilabl
e fu
nds s
pent
by
mun
icipa
lity
tota
l ava
ilabl
e
r’00
0r’
000
r’00
0r’
000
r’00
0%
r’00
0r’
000
%r’
000
Bala
nce
brou
ght
forw
ard
278,
789
--
278,
789
278,
789
278,
789
188,
074
230,
500
Rich
ters
veld
1,20
0 -
-1,
200
1,20
010
0%1,
200
1,20
0 10
0%75
0
Rust
enbu
rg
1,
000
--
1,00
01,
000
100%
1,00
0
761
76%
750
Sakh
isiz
we
3,00
0 -
-3,
000
3,00
010
0%3,
000
3,00
0 10
0%2,
750
Sald
anha
Bay
1,00
0 -
-1,
000
1,00
010
0%1,
000
42
9 43
%75
0
Sedi
beng
1,00
0 -
-1,
000
1,00
010
0%1,
000
57
3 57
%75
0
Senq
u
1,
200
--
1,20
01,
200
100%
1,20
0
1,
041
87%
1,00
0
Sets
oto
1,20
0 -
-1,
200
1,20
010
0%1,
200
91
8 77
%75
0
Siso
nke
1,00
0 -
-1,
000
1,00
010
0%1,
000
94
8 75
%75
0
Siya
ncum
a
1,
200
--
1,20
01,
200
100%
1,20
0
728
61%
750
Siya
nda
1,00
0 -
-1,
000
1,00
010
0%1,
000
62
0 62
%75
0
Siya
them
ba
1,
200
--
1,20
01,
200
100%
1,20
0
1,
091
91%
750
Sol P
laat
jie
1,
200
--
1,20
01,
200
100%
1,20
0
1,
084
90%
750
Dr.
Kenn
eth
Kaun
da D
istr
ict
1,00
0 -
-1,
000
1,00
010
0%1,
000
33
0 33
%75
0
Stel
lenb
osch
1,00
0 -
-1,
000
1,00
010
0%1,
000
46
9 47
%75
0
Stev
e Ts
hwet
e
1,
000
--
1,00
01,
000
100%
1,00
0
1,
000
100%
750
Sund
ay’s
Rive
r Va
lley
1,50
0 -
-1,
500
1,50
010
0%1,
500
1,50
0 10
0%1,
500
Swar
tland
1,00
0 -
-1,
000
1,00
010
0%1,
000
47
7 48
%75
0
Swel
lend
am
3,
000
--
3,00
03,
000
100%
3,00
0
1,
887
63%
2,75
0
subt
otal
car
ried
fo
rwar
d30
2,48
9-
-30
2,48
930
2,48
930
2,48
920
6,13
024
9,00
0
NT AR 10-11_10.indd 185 2011/08/17 10:02 AM

Annual Financial Statements
Nat
iona
l Tre
asur
y A
nnua
l Rep
ort 2
010/
11
186
annexures to the financial statements - continued
national treasury vote 9
FOR the yeaR ended 31 maRch 2011a
NN
exu
re 1
C - C
ON
TIN
UED
STAT
EMEN
T O
F U
NCO
ND
ITIO
NA
L G
RAN
TS P
AID
TO
MU
NIC
IPA
LITI
ES -
cont
inue
d
Na
Me
oF
Mu
NiC
ipa
lity
Gra
Nt
all
oCa
tio
Ntr
aN
sFer
speN
t20
09/1
0
Div
ision
of
reve
nue a
ctro
llove
rsad
just
men
tsto
tal
avai
labl
eac
tual
tr
ansf
er
% o
f ava
ilabl
e Fu
nds
tran
sfer
red
amou
nt
rece
ived
by
mun
icipa
lity
amou
nt
spen
t by
mun
icipa
lity
% o
f ava
ilabl
e fu
nds s
pent
by
mun
icipa
lity
tota
l av a
ilabl
e
r’00
0r’
000
r’00
0r’
000
r’00
0%
r’00
0r’
000
%r’
000
Bala
nce
carr
ied
forw
ard
302,
489
--
302,
489
302,
489
302,
489
206,
130
249,
000
Thab
a C
hweu
1,00
0 -
-1,
000
1,00
010
0%1,
000
54
7 55
%75
0
Thab
azim
bi
1,
500
--
1,50
01,
500
100%
1,50
0
1,
068
71%
750
Thab
o M
ofut
sany
ane
1,00
0 -
-1,
000
1,00
010
0%1,
000
68
4 68
%75
0
The
Big
5 Fa
lse
Bay
1,20
0 -
-1,
200
1,20
010
0%1,
200
82
1 68
%1,
500
Thee
wat
ersk
loof
1,00
0 -
-1,
000
1,00
010
0%1,
000
1,00
0 10
0%1,
000
Them
belih
le
1,
250
--
1,25
01,
250
100%
1,25
0
1,
043
83%
1,00
0
Them
bisi
le
3,
000
--
3,00
03,
000
100%
3,00
0
831
28%
2,75
0
Thul
amel
a
1,
000
--
1,00
01,
000
100%
1,00
0
820
82%
750
Tllo
kwe
1,00
0 -
-1,
000
1,00
010
0%1,
000
1,00
0 10
0%75
0
Toko
logo
1,20
0 -
-1,
200
1,20
010
0%1,
200
24
6 21
%75
0
Tsan
tsab
ane
1,20
0 -
-1,
200
1,20
010
0%1,
200
1,20
0 10
0%1,
000
City
Of T
shw
ane
1,00
0 -
-1,
000
1,00
010
0%1,
000
85
0 85
%75
0
Tsol
wan
a
3,
000
--
3,00
03,
000
100%
3,00
0
2,
258
75%
2,75
0
Tsw
aing
1,25
0 -
-1,
250
1,25
010
0%1,
250
1,16
2 93
%1,
000
Tsw
elop
ele
1,20
0 -
-1,
200
1,20
010
0%1,
200
68
1 57
%75
0
Ubu
hleb
ezw
e
1,
500
--
1,50
01,
500
100%
1,50
0
1,
216
81%
1,50
0
Ubu
ntu
1,20
0 -
-1,
200
1,20
010
0%1,
200
91
7 76
%75
0
subt
otal
car
ried
fo
rwar
d32
5,98
9-
-32
5,98
932
5,98
932
5,98
922
2,47
426
8,25
0
NT AR 10-11_10.indd 186 2011/08/17 10:02 AM

Annual Financial Statements
187
Nat
iona
l Tre
asur
y A
nnua
l Rep
ort 2
010/
11
annexures to the financial statements - continued
national treasury vote 9
FOR the yeaR ended 31 maRch 2011
aN
Nex
ure
1C
- CO
NTI
NU
ED
STAT
EMEN
T O
F U
NCO
ND
ITIO
NA
L G
RAN
TS P
AID
TO
MU
NIC
IPA
LITI
ES -
cont
inue
d
Na
Me
oF
Mu
NiC
ipa
lity
Gra
Nt
all
oCa
tio
Ntr
aN
sFer
speN
t20
09/1
0
Div
ision
of
reve
nue a
ctro
llove
rsad
just
men
tsto
tal
avai
labl
eac
tual
tr
ansf
er
% o
f ava
ilabl
e Fu
nds
tran
sfer
red
amou
nt
rece
ived
by
mun
icipa
lity
amou
nt
spen
t by
mun
icipa
lity
% o
f ava
ilabl
e fu
nds s
pent
by
mun
icipa
lity
tota
l ava
ilabl
e
r’00
0r’
000
r’00
0r’
000
r’00
0%
r’00
0r’
000
%r’
000
Bala
nce
brou
ght
forw
ard
325,
989
--
325,
989
325,
989
325,
989
222,
474
268,
250
Ugu
1,00
0 -
-1,
000
1,00
010
0%1,
000
72
0 72
%75
0
Ukh
ahla
mba
1,00
0 -
-1,
000
1,00
010
0%1,
000
68
5 69
%75
0
Ulu
ndi
1,20
0 -
-1,
200
1,20
010
0%1,
200
66
1 55
%75
0
Um
doni
1,20
0 -
-1,
200
1,20
010
0%1,
200
1,20
0 10
0%1,
500
Um
gung
undl
ovu
1,00
0 -
-1,
000
1,00
010
0%1,
000
87
1 87
%75
0
Um
hlab
uyal
inga
1,20
0 -
-1,
200
1,20
010
0%1,
200
96
5 80
%1,
740
Um
hlat
huze
1,20
0 -
-1,
200
1,20
010
0%1,
200
96
2 80
%75
0
Um
jindi
1,00
0 -
-1,
000
1,00
010
0%1,
000
1,00
0 10
0%75
0
Um
khan
yaku
de
1,
000
--
1,00
01,
000
100%
1,00
0
557
56%
750
Um
lala
zi
1,
200
--
1,20
01,
200
100%
1,20
0
929
77%
1,00
0
Um
ngen
i
1,
200
--
1,20
01,
200
100%
1,20
0
252
21%
750
Um
shw
athi
1,50
0 -
-1,
500
1,50
010
0%1,
500
64
1 43
%1,
500
Um
sobo
mvu
1,20
0 -
-1,
200
1,20
010
0%1,
200
1,20
0 10
0%1,
000
Um
tshe
zi
1,
200
--
1,20
01,
200
100%
1,20
0
780
65%
750
Um
uziw
aban
tu
1,
200
--
1,20
01,
200
100%
1,20
0
944
79%
1,00
0
Um
voti
1,20
0 -
-1,
200
1,20
010
0%1,
200
70
5 59
%75
0
Um
zim
khul
u
1,
200
--
1,20
01,
200
100%
1,20
0
1,
119
93%
750
Um
zim
vubu
1,20
0 -
-1,
200
1,20
010
0%1,
200
1,20
0 10
0%1,
000
Um
ziny
athi
1,00
0 -
-1,
000
1,00
010
0%1,
000
73
8 74
%1,
000
s ubt
otal
car
ried
fo
rwar
d34
7,88
9-
-34
7,88
934
7,88
934
7,88
923
8,60
328
6,24
0
NT AR 10-11_10.indd 187 2011/08/17 10:02 AM
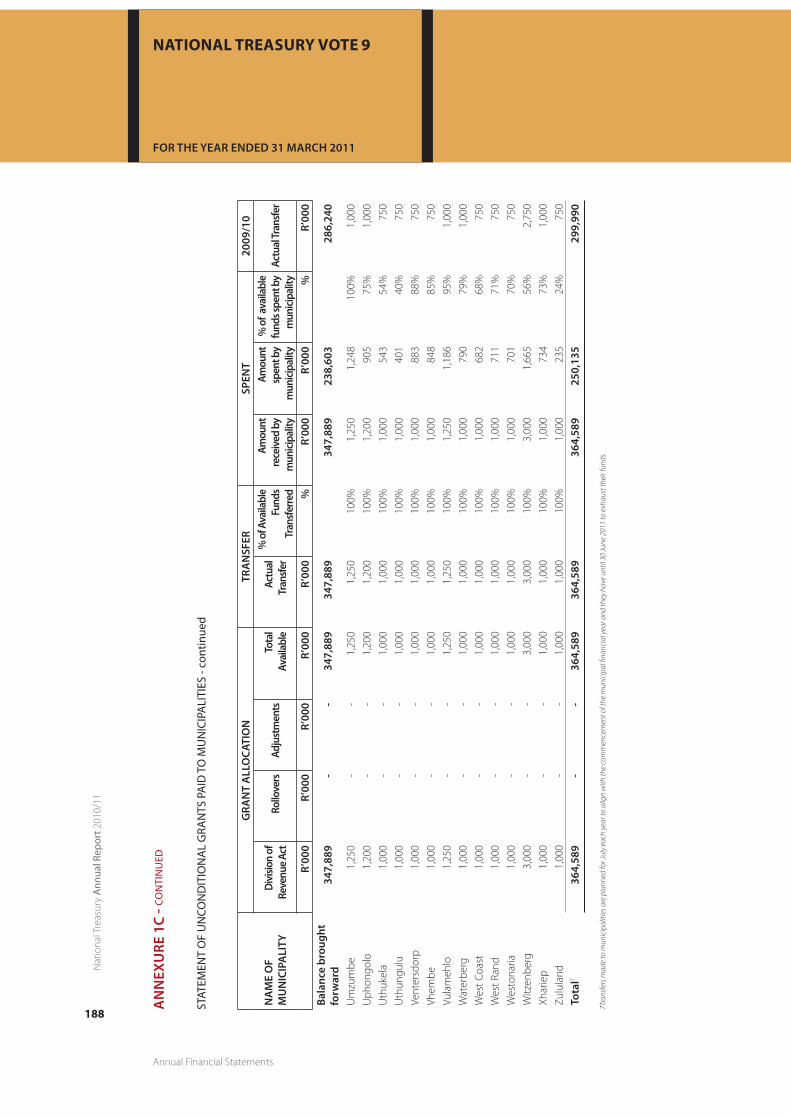
Annual Financial Statements
Nat
iona
l Tre
asur
y A
nnua
l Rep
ort 2
010/
11
188
annexures to the financial statements - continued
national treasury vote 9
FOR the yeaR ended 31 maRch 2011a
NN
exu
re 1
C - C
ON
TIN
UED
STAT
EMEN
T O
F U
NCO
ND
ITIO
NA
L G
RAN
TS P
AID
TO
MU
NIC
IPA
LITI
ES -
cont
inue
d
Na
Me
oF
Mu
NiC
ipa
lity
Gra
Nt
all
oCa
tio
Ntr
aN
sFer
speN
t20
09/1
0
Div
ision
of
reve
nue a
ctro
llove
rsad
just
men
tsto
tal
avai
labl
eac
tual
tr
ansf
er
% o
f ava
ilabl
e Fu
nds
tran
sfer
red
amou
nt
rece
ived
by
mun
icipa
lity
amou
nt
spen
t by
mun
icipa
lity
% o
f ava
ilabl
e fu
nds s
pent
by
mun
icipa
lity
actu
al tr
ansf
er
r’00
0r’
000
r’00
0r’
000
r’00
0%
r’00
0r’
000
%r’
000
Bala
nce
brou
ght
forw
ard
347,
889
--
347,
889
347,
889
347,
889
238,
603
286,
240
Um
zum
be
1,
250
--
1,25
01,
250
100%
1,25
0
1,
248
100%
1,00
0
Uph
ongo
lo
1,
200
--
1,20
01,
200
100%
1,20
0
905
75%
1,00
0
Uth
ukel
a
1,
000
--
1,00
01,
000
100%
1,00
0
543
54%
750
Uth
ungu
lu
1,
000
--
1,00
01,
000
100%
1,00
0
401
40%
750
Vent
ersd
orp
1,00
0 -
-1,
000
1,00
010
0%1,
000
88
3 88
%75
0
Vhem
be
1,
000
--
1,00
01,
000
100%
1,00
0
848
85%
750
Vula
meh
lo
1,
250
--
1,25
01,
250
100%
1,25
0
1,
186
95%
1,00
0
Wat
erbe
rg
1,
000
--
1,00
01,
000
100%
1,00
0
790
79%
1,00
0
Wes
t Coa
st
1,
000
--
1,00
01,
000
100%
1,00
0
682
68%
750
Wes
t Ran
d
1,
000
--
1,00
01,
000
100%
1,00
0
711
71%
750
Wes
tona
ria
1,
000
--
1,00
01,
000
100%
1,00
0
701
70%
750
Witz
enbe
rg
3,
000
--
3,00
03,
000
100%
3,00
0
1,
665
56%
2,75
0
Xhar
iep
1,00
0 -
-1,
000
1,00
010
0%1,
000
73
4 73
%1,
000
Zulu
land
1,00
0 -
-1,
000
1,00
010
0%1,
000
23
5 24
%75
0
tota
l736
4,58
9-
-36
4,58
936
4,58
936
4,58
925
0,13
529
9,99
0
7Tra
nsfe
rs m
ade
to m
unic
ipal
ities
are
pla
nned
for J
uly
each
yea
r to
alig
n w
ith th
e co
mm
ence
men
t of t
he m
unic
ipal
fina
ncia
l yea
r and
they
hav
e un
til 3
0 Ju
ne 2
011
to e
xhau
st th
eir f
unds
.
NT AR 10-11_10.indd 188 2011/08/17 10:02 AM

Annual Financial Statements
189
Nat
iona
l Tre
asur
y A
nnua
l Rep
ort 2
010/
11
annexures to the financial statements - continued
national treasury vote 9
FOR the yeaR ended 31 maRch 2011
aN
Nex
ure
1D
STAT
EMEN
T O
F IN
-KIN
D C
ON
DIT
ION
AL
GRA
NTS
AN
D T
RAN
SFER
S TO
MU
NIC
IPA
LITI
ES
Na
Me
oF
Mu
NiC
ipa
lity
Gra
Nt
all
oC a
tio
Ntr
aN
sFer
speN
t20
09/1
0
Div
ision
of
reve
nue
act
rollo
vers
adju
stm
ents
tota
l av
aila
ble
actu
al
tran
sfer
% o
f av
aila
ble
fund
s tr
ansf
erre
d
amou
nt
rece
ived
by
mun
icipa
lity
amou
nt
spen
t by
mun
icipa
lity
% o
f ava
ilabl
e fu
nds s
pent
by
mun
icipa
lity
tota
l av
aila
ble
r’00
0r’
000
r’00
0r’
000
r’00
0%
r’00
0r’
000
%r’
000
Nei
ghbo
urho
od
Dev
elop
men
t Pa
rtne
rshi
p G
rant
1,03
0,00
0-
-1,
030,
000
831,
789
80.7
%83
1,78
945
2,97
854
.5%
551,
394
tota
l1,
030,
000
--
1,03
0,00
083
1,78
983
1,78
945
2,97
855
1,39
4
NT AR 10-11_10.indd 189 2011/08/17 10:02 AM

Annual Financial Statements
Nat
iona
l Tre
asur
y A
nnua
l Rep
ort 2
010/
11
190
annexures to the financial statements - continued
national treasury vote 9
FOR the yeaR ended 31 maRch 2011a
NN
exu
re 1
e
STAT
EMEN
T O
F TR
AN
SFER
S TO
DEP
ART
MEN
TAL
AGEN
CIES
AN
D A
CCO
UN
TS
Dep
art
MeN
t/ a
GeN
Cy/ a
CCo
uN
t
tra
NsF
er a
llo
Cati
oN
tra
NsF
er20
09/1
0ad
just
edap
prop
riatio
nro
llove
rsad
just
men
tsto
tal
avai
labl
eac
tual
tr
ansf
er%
of a
vaila
ble
fund
s tra
nsfe
rred
app
ropr
iatio
n a
ctr’
000
r’00
0r’
000
r’00
0r’
000
%r’
000
Acc
ount
ing
Stan
dard
s Bo
ard
7,53
8-
-7,
538
7,53
810
0%7,
242
Aud
it St
atut
ory
Bodi
es
21,3
53-
9221
,445
21,4
4410
0%19
,638
Cont
inge
nt L
iabi
litie
s1
--
1-
--
Coop
erat
ive
Bank
Dev
elop
men
t Age
ncy
8,20
0-
-8,
200
8,20
010
0%-
FASS
ET42
0-
4346
342
692
%-
Fina
ncia
l and
Fisc
al C
omm
issio
n31
,391
--
31,3
9131
,391
100%
26,5
80
Fina
ncia
l Int
ellig
ence
Cen
tre
181,
414
--
181,
414
181,
414
100%
157,
884
Fina
nce,
Acc
ount
ing,
Man
agem
ent
Cons
ultin
g an
d ot
her F
inan
cial
Ser
vice
s-
--
--
-38
8
Inde
pend
ent R
egul
ator
y Bo
ard
for
Aud
itors
29,2
96-
-29
,296
29,2
9610
0%22
,018
Inst
itute
of P
ublic
Fin
ance
and
Aud
iting
--
--
--
4,10
0
Inve
stm
ent o
f Pub
lic M
onie
s1
--
1-
--
Proj
ect D
evel
opm
ent F
acili
ty8
128,
000
--
128,
000
53,0
0041
%11
0,00
0
PALA
MA
--
3,40
03,
400
3,40
010
0%-
Secr
et S
ervi
ces
3,30
6,75
2-
-3,
306,
752
3,30
6,75
310
0%3,
052,
226
Sout
h A
frica
n Re
venu
e Se
rvic
e8,
142,
208
--
8,14
2,20
88,
142,
208
100%
7,14
8,44
6
Tech
nica
l Ass
ista
nce
Uni
t Tra
ding
Acc
ount
19,3
63-
-19
,363
19,3
6310
0%18
,898
tota
l tra
nsfe
rs to
dep
artm
enta
l age
ncie
s11
,875
,937
-3,
535
11,8
79,4
7211
,804
,432
-10
,567
,420
8 The
Pro
ject
Dev
elop
men
t Fac
ility
incl
udes
the
tech
nica
l exp
erts
for t
he N
eigh
bour
hood
Dev
elop
men
t Par
tner
ship
pro
gram
me
NT AR 10-11_10.indd 190 2011/08/17 10:02 AM

Annual Financial Statements
191
Nat
iona
l Tre
asur
y A
nnua
l Rep
ort 2
010/
11
annexures to the financial statements - continued
national treasury vote 9
FOR the yeaR ended 31 maRch 2011
aN
Nex
ure
1F
STAT
EMEN
T O
F TR
AN
SFER
S TO
UN
IvER
SITI
ES A
ND
TEC
HN
IKO
NS
uN
iver
sity
/te
CHN
iKo
N
tra
NsF
er a
llo
Cati
oN
tra
NsF
er20
09/1
0
adju
sted
appr
opria
tion
roll
ove
rsad
just
-men
tsto
tal
avai
labl
eac
tual
tran
sfer
amou
nt n
ot
trans
ferre
d%
of a
vaila
ble
fund
s tra
nsfe
rred
appr
o-pr
iatio
n ac
t
r’00
0r’
000
r’00
0r’
000
r’00
0r’
000
%r’
000
Uni
vers
ity o
f Cap
e To
wn
95,
000
-30
05,
300
5,30
0-
100%
5,0
00
Uni
vers
ity o
f Pre
toria
50
0-
-50
0-
500
-
4
56
tota
l tra
nsfe
rs to
un
iver
sitie
s5,
500
-30
05,
800
5,30
050
0
5,4
56
9 The
tran
sfer
s mad
e to
the
Uni
vers
ity o
f Cap
e To
wn
wer
e fo
r the
Eco
nom
ic R
esea
rch
Sout
h Af
rica
initi
ativ
e to
fund
loca
l eco
nom
ic re
sear
ch.
NT AR 10-11_10.indd 191 2011/08/17 10:02 AM

Annual Financial Statements
Nat
iona
l Tre
asur
y A
nnua
l Rep
ort 2
010/
11
192
annexures to the financial statements - continued
national treasury vote 9
FOR the yeaR ended 31 maRch 2011a
NN
exu
re 1
G
STAT
EMEN
T O
F TR
AN
SFER
S/SU
BSID
IES
TO P
UBL
IC C
ORP
ORA
TIO
NS
AN
D P
RIvA
TE E
NTE
RPRI
SES
Na
Me
oF
puBl
iC
Corp
ora
tio
N/
priv
ate
eNte
rpri
se
tra
NsF
er a
llo
Cati
oN
expe
ND
itu
re20
09/1
0ad
just
edap
prop
riatio
n ac
tro
llove
rsad
just
men
tsto
tal
avai
labl
eac
tual
tr
ansf
er
% o
f ava
ilabl
e fu
nds
tran
sfer
red
Capi
tal
Curre
ntap
prop
riatio
n ac
t
r’00
0r’
000
r’00
0r’
000
r’00
0%
r’00
0r’
000
r’00
0pu
blic
Cor
pora
tions
Tran
sfer
s
Esko
m-
--
--
--
-30
,000
,000
Dev
elop
men
t Ban
k of
So
uthe
rn A
frica
(Siy
enza
M
anje
)29
0,29
5-
-29
0,29
529
0,29
510
0%-
-
267
,407
Land
Ban
k -
--
--
--
-1,
000,
000
tota
l29
0,29
5-
-29
0,29
529
0,29
5-
-31
,267
,407
priv
ate
ente
rpri
ses
Tran
sfer
s
Insu
ranc
e (d
epar
tmen
tal v
ehic
les)
--
--
--
--
66
tota
l-
--
--
--
66
tota
l29
0,29
5-
-29
0,29
529
0,29
5-
-31
,267
,473
Not
e: F
unds
tran
sfer
red
to E
skom
and
Lan
d Ba
nk h
ave
been
re-c
lass
ified
sinc
e 01
Apr
il 20
10 a
s Pay
men
t for
Fin
anci
al A
sset
s.
NT AR 10-11_10.indd 192 2011/08/17 10:02 AM
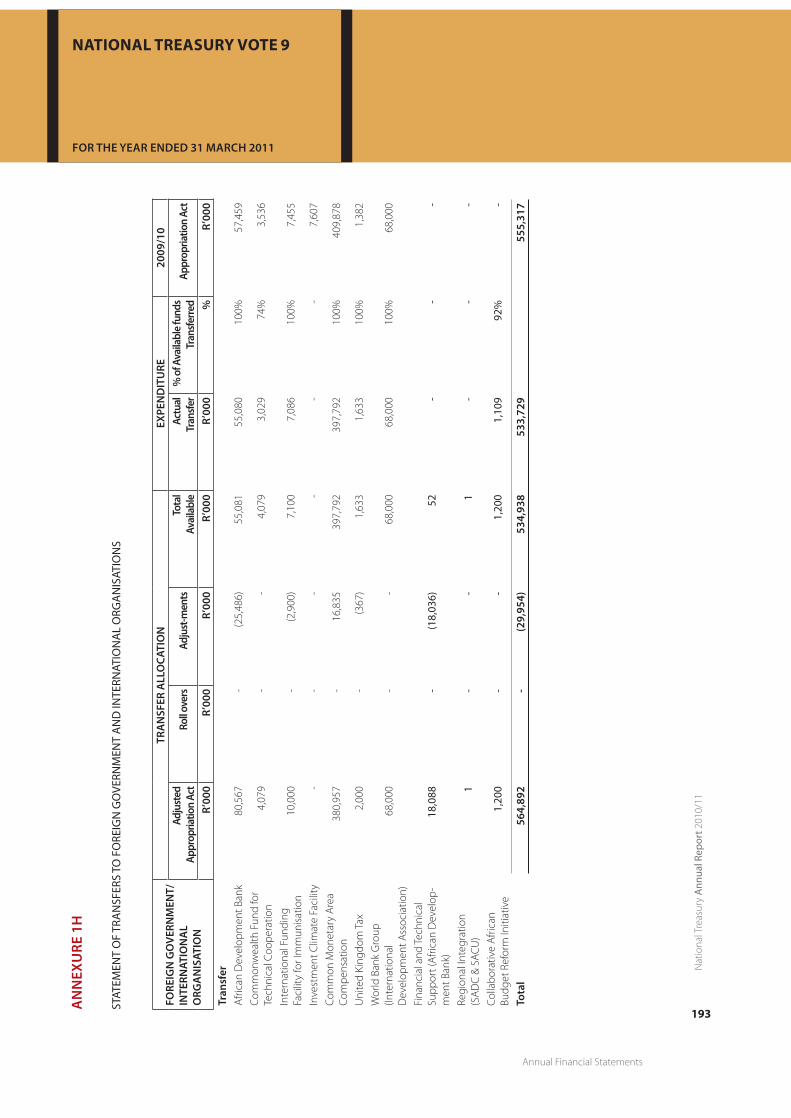
Annual Financial Statements
193
Nat
iona
l Tre
asur
y A
nnua
l Rep
ort 2
010/
11
annexures to the financial statements - continued
national treasury vote 9
FOR the yeaR ended 31 maRch 2011
aN
Nex
ure
1H
STAT
EMEN
T O
F TR
AN
SFER
S TO
FO
REIG
N G
OvE
RNM
ENT
AN
D IN
TERN
ATIO
NA
L O
RGA
NIS
ATIO
NS
Fore
iGN
Go
verN
MeN
t/
iNte
rNat
ioN
al
or G
aN
isat
ioN
tra
NsF
er a
llo
Cati
oN
expe
ND
itu
re20
09/1
0ad
just
edap
prop
riatio
n ac
tro
ll ove
rsad
just
-men
tsto
tal
avai
labl
eac
tual
tr
ansf
er%
of a
vaila
ble f
unds
tr
ansf
erre
dap
prop
riatio
n ac
t
r’00
0r’
000
r’00
0r’
000
r’00
0%
r’00
0tr
ansf
erA
frica
n D
evel
opm
ent B
ank
80,5
67-
(25,
486)
55,0
8155
,080
100%
57,4
59
Com
mon
wea
lth F
und
for
Tech
nica
l Coo
pera
tion
4,07
9-
-4,
079
3,02
974
%3,
536
Inte
rnat
iona
l Fun
ding
Fa
cilit
y fo
r Im
mun
isat
ion
10,0
00-
(2,9
00)
7,10
07,
086
100%
7,45
5
Inve
stm
ent C
limat
e Fa
cilit
y-
--
--
-7,
607
Com
mon
Mon
etar
y A
rea
Com
pens
atio
n38
0,95
7-
16,8
3539
7,79
239
7,79
210
0%40
9,87
8
Uni
ted
King
dom
Tax
2,00
0-
(367
)1,
633
1,63
310
0%1,
382
Wor
ld B
ank
Gro
up
(Inte
rnat
iona
l D
evel
opm
ent A
ssoc
iatio
n)68
,000
--
68,0
0068
,000
100%
68,0
00
Fina
ncia
l and
Tec
hnic
al
Supp
ort (
Afri
can
Dev
elop
-m
ent B
ank)
18,0
88-
(18,
036)
52-
--
Regi
onal
Inte
grat
ion
(SA
DC
& S
AC
U)
1-
-1
--
-
Colla
bora
tive
Afri
can
Budg
et R
efor
m In
itiat
ive
1,20
0-
-1,
200
1,10
992
%-
tota
l56
4,89
2-
(29,
954)
534,
938
533,
729
555,
317
NT AR 10-11_10.indd 193 2011/08/17 10:02 AM

Annual Financial Statements
Nat
iona
l Tre
asur
y A
nnua
l Rep
ort 2
010/
11
194
annexures to the financial statements - continued
national treasury vote 9
FOR the yeaR ended 31 maRch 2011a
NN
exu
re 1
i
STAT
EMEN
T O
F TR
AN
SFER
S TO
NO
N-P
ROFI
T IN
STIT
UTI
ON
S
No
N-p
roFi
t i N
stit
uti
oN
s
tra
NsF
er a
llo
Cati
oN
expe
ND
itu
re20
09/1
0ad
just
edap
prop
riatio
n ac
tro
ll ove
rsad
just
-men
tsto
tal a
v aila
ble
actu
al tr
ansf
er%
of a
vaila
ble f
unds
tra
nsfe
rred
appr
opria
tion
act
r’00
0r’
000
r’00
0r’
000
r’00
0%
r’00
0tr
ansf
ers
SA L
egio
n75
-(7
4)1
--
71
tota
l75
-(7
4)1
--
71
NT AR 10-11_10.indd 194 2011/08/17 10:02 AM

Annual Financial Statements
195
Nat
iona
l Tre
asur
y A
nnua
l Rep
ort 2
010/
11
annexures to the financial statements - continued
national treasury vote 9
FOR the yeaR ended 31 maRch 2011
aN
Nex
ure
1J
STAT
EMEN
T O
F TR
AN
SFER
S TO
HO
USE
HO
LDS
Ho
use
Ho
lDs
tra
NsF
er a
llo
Cati
oN
expe
ND
itu
re20
09/1
0ad
just
edap
prop
riatio
n a c
tro
llove
rsad
just
men
tsto
tal a
vaila
ble
actu
al tr
ansf
er%
of a
vaila
ble f
unds
tr
ansf
erre
dap
prop
riatio
n ac
t
r’00
0r’
000
r’00
0r’
000
r’00
0%
r’00
0tr
ansf
ers
Post
-ret
irem
ent m
edic
al
sche
me
cont
ribut
ions
1,
518,
706
-71
,033
1,58
9,73
91,
589,
738
100%
1,45
1,77
2
Inju
ry o
n du
ty36
5,35
7-
33,7
0339
9,06
039
9,05
910
0%37
6,28
0
Med
ical
ben
efits
- ex
-se
rvic
e m
en32
,766
-1,
109
33,8
7533
,874
100%
22,2
38
Oth
er b
enefi
ts13
6,73
4-
(12,
147)
124,
587
124,
257
100%
2,63
7,96
4
SA C
itize
n Fo
rce
112,
588
-(3
,480
)10
9,10
810
9,10
610
0%10
3,52
1
Soci
al a
ssis
tanc
e (b
ursa
ries)
1,46
8-
-1,
468
1,04
071
%
1,23
1
Spec
ial p
ensi
ons
387,
722
-14
,400
402,
122
402,
121
100%
337,
431
Serv
ice
bene
fits
leav
e gr
atui
ty59
7-
-59
758
898
%-
tota
l2,
555,
938
-10
4,61
82,
660,
556
2,65
9,78
3
4,93
0,43
7
NT AR 10-11_10.indd 195 2011/08/17 10:02 AM

Annual Financial Statements
Nat
iona
l Tre
asur
y A
nnua
l Rep
ort 2
010/
11
196
annexures to the financial statements - continued
national treasury vote 9
FOR the yeaR ended 31 maRch 2011a
NN
exu
re 1
K
STAT
EMEN
T O
F FO
REIG
N A
ID A
SSIS
TAN
CE R
ECEI
vED
Na
Me
oF
Do
No
rpu
rpo
seo
peNi
NG
Bala
NCe
reve
Nue
expe
NDit
ure
surr
eNDe
reD
to r
DpCl
osiN
G
Bala
NCe
r’00
0r’
000
r’00
0r’
000
r’00
0Fo
reig
n ai
d as
sist
ance
rece
ived
in c
ash
Cana
da- A
BRS
AFD
B Pr
ovid
es f
undi
ng f
or t
hree
CA
BRI
proj
ect,
nam
ely:
Bud
get
Prac
tices
and
Pro
cedu
re r
epor
t; Bu
dget
Res
ourc
e Ce
ntre
; Re
gion
al P
ublic
Goo
ds
1,15
391
02,
064
-(1
)*
Euro
pean
Uni
on –
Fin
anci
al
Man
agem
ent I
mpr
ovem
ent
Prog
ram
me
(FM
IP)
Stre
ngth
enin
g go
vern
men
t’s c
apac
ity i
n im
prov
ed fi
nanc
ial
man
agem
ent
thro
ugh
supp
ortin
g po
licy
deve
lopm
ent,
capa
city
bu
ildin
g an
d st
reng
then
ing
publ
ic
finan
cial
m
anag
emen
t at p
rovi
ncia
l and
mun
icip
al le
vel
111
1,81
11,
921
-1*
Euro
pean
Uni
on –
Offi
cial
D
evel
opm
ent A
ssis
tanc
e (O
DA
)Co
ntrib
ute
tow
ards
en
hanc
ed
capa
city
de
velo
pmen
t an
d pr
omot
e ec
onom
ic d
evel
opm
ent,
good
gov
erna
nce
and
soci
al
prog
ress
and
risin
g liv
ing
stan
dard
s
(2,6
67)
7,59
36,
098
-(1
,172
)
Irela
nd –
Col
labo
rativ
e A
frica
n Bu
dget
Ref
orm
Initi
ativ
e (C
ABR
I)Fi
nanc
ing
of th
e an
nual
bud
get r
efor
m s
emin
ar1,
687
-1,
538
-14
9
GTZ
- A
BRS
Prov
ide
finan
cial
man
agem
ent
supp
ort
to t
he C
olla
bora
tive
Afri
can
Budg
et R
efor
m In
itiat
ive
-89
80-
9
JICA
DC
ISEs
tabl
ish
and
oper
atio
nalis
e a
know
ledg
e m
anag
emen
t sy
stem
and
upg
rade
the
DC
MIS
-80
79-
1
USA
- LS
GA
Incr
ease
col
labo
ratio
n an
d jo
int
plan
ning
app
roac
hes
with
in
terv
entio
ns a
s in
dent
ified
on
a ye
arly
bas
is.
-37
7-
-37
7
subt
otal
fore
ign
aid
assi
stan
ce re
ceiv
ed in
cas
h28
410
,860
11,7
80-
(636
)
*The
clo
sing
bala
nces
are
resu
lting
from
roun
ding
off
NT AR 10-11_10.indd 196 2011/08/17 10:02 AM

Annual Financial Statements
197
Nat
iona
l Tre
asur
y A
nnua
l Rep
ort 2
010/
11
annexures to the financial statements - continued
national treasury vote 9
FOR the yeaR ended 31 maRch 2011
aN
Nex
ure
1K
- CO
NTI
NU
ED
STAT
EMEN
T O
F FO
REIG
N A
ID A
SSIS
TAN
CE R
ECEI
vED
- co
ntin
ued
Na
Me
oF
Do
No
rpu
rpo
seo
peNi
NG
Bala
NCe
reve
Nue
expe
NDit
ure
surr
eNDe
reD
to r
DpCl
osiN
G
Bala
NCe
r’00
0r’
000
r’00
0r’
000
r’00
0Fo
reig
n ai
d as
sist
ance
rece
ived
in c
ash
Dep
artm
ent f
or In
tern
atio
nal
Dev
elop
men
t (D
FID
)Su
ppor
t for
the
impl
emen
tatio
n of
MFM
A*
--
--
-
Deu
tsch
e G
esel
lscha
ft fu
r Te
chni
sche
Zus
amm
enar
beit
(GTZ
)Te
chni
cal a
dvis
or to
sup
port
the
impl
emen
tatio
n of
MFM
A*
-99
199
1-
-
Deu
tsch
e G
esel
lscha
ft fu
r Te
chni
sche
Zus
amm
enar
beit
(GTZ
)Pr
ovid
e as
sist
ance
with
the
im
plem
enta
tion
of 2
010
FIFA
W
orld
Cup
pro
ject
s -
18,4
9918
,499
--
Euro
pean
Com
mis
sion
Supp
ortin
g th
e st
reng
then
ing
of p
ublic
fina
ncia
l man
agem
ent
in S
outh
Afri
ca4,
503
1,98
06,
483
--
Nat
iona
l Tre
asur
yPr
ovid
e fin
anci
al m
anag
emen
t su
ppor
t to
the
Col
labo
rativ
e A
frica
n Bu
dget
* Re
form
Initi
ativ
e-
1,08
51,
085
--
Uni
ted
Stat
e A
genc
y fo
r In
tern
atio
nal D
evel
opm
ent
Lim
ited
scop
e gr
ant a
gree
men
t*-
--
--
subt
otal
fore
ign
aid
assi
stan
ce re
ceiv
ed in
cas
h 4
,503
22,5
5527
,058
--
*Rec
lass
ifica
tion
of p
rior y
ear a
mou
nt to
be
in li
ne w
ith th
e D
epar
tmen
tal R
epor
ting
Fram
ewor
k.
NT AR 10-11_10.indd 197 2011/08/17 10:02 AM

Annual Financial Statements
Nat
iona
l Tre
asur
y A
nnua
l Rep
ort 2
010/
11
198
annexures to the financial statements - continued
national treasury vote 9
FOR the yeaR ended 31 maRch 2011a
NN
exu
re 2
a
STAT
EMEN
T O
F IN
vEST
MEN
TS IN
AN
D A
MO
UN
TS O
WIN
G B
y/TO
NAT
ION
AL/
PRO
vIN
CIA
L PU
BLIC
EN
TITI
ES
Na
Me
oF
puBl
iC
eNti
ty
stat
e en
tity’
s pF
Ma
sch
edul
e ty
pe (s
tate
yea
r en
d if
not 3
1 M
arch
)
% H
eld
09/1
0
%
Hel
d 08
/09
Num
ber o
f sha
res
held
Cost
of i
nves
tmen
tN
et a
sset
val
ue o
f in
vest
men
tpr
ofit/
(los
s) fo
r the
ye
arlo
sses
gu
aran
teed
r’00
0r’
000
r’00
0r’
000
2009
/10
2008
/09
2009
/10
2008
/09
2009
/10
2008
/09
2009
/10
2008
/09
yes/
No
Nat
iona
l/pro
vinc
ial p
ublic
ent
ities
Acc
ount
ing
Stan
dard
s Bo
ard
Sche
dule
3A
- -
--
--
399
968
(569
)65
3 N
o
Coop
erat
ive
Bank
D
evel
opm
ent A
genc
ySc
hedu
le 3
A-
--
--
-(2
49)
(382
)13
4(3
82)
No
Dev
elop
men
t Ban
k of
So
uthe
rn A
frica
Sche
dule
210
010
020
0,00
020
0,00
0 20
0,00
020
0,00
0 17
,913
,022
17,8
90,2
8375
,114
53
4,32
7Ye
s
Fina
ncia
l and
Fis
cal
Com
mis
sion
Sche
dule
1-
- -
--
- (1
,662
) (1
,402
)(8
91)
(1,0
55)
No
Fina
ncia
l Int
ellig
ence
Ce
ntre
Sche
dule
3A
- -
- -
- -
98,9
20
50,1
4748
,773
21,3
27N
o
Fina
ncia
l Ser
vice
s Bo
ard
Sche
dule
3A
- -
- -
--
139,
761
138,
475
(18,
666)
(14,
642)
No
Inde
pend
ent R
egul
ator
y Bo
ard
for A
udito
rsSc
hedu
le 3
A-
- -
--
-28
,650
19,
776
7,17
88,
632
No
Land
Ban
kSc
hedu
le 2
100
100
--
200,
955
200,
955
3,89
6,48
6 2
,899
,826
286,
098
379,
089
Yes
Publ
ic In
vest
men
t Co
rpor
atio
n Lt
dSc
hedu
le 3
B10
010
01
1
1
1 51
7,55
7 3
91,4
4215
2,70
214
3,62
5Ye
s
Sout
h A
frica
n Re
venu
e Se
rvic
eSc
hedu
le 3
A-
--
--
- 2,
385,
097
1,3
25,5
571.
102,
169
510,
257
No
SASR
IA L
imite
dSc
hedu
le 3
B10
010
0-
-
- -
3,46
4,96
5 3
,202
,120
416,
144
510,
998
Yes
Soci
al R
espo
nsib
ility
In
vest
men
t Por
tfolio
Not
app
licab
le-
1-
- -
--
--
-N
o
tota
l inv
estm
ent
200,
001
200,
001
400,
956
400,
956
28,4
42,9
4625
,916
,810
2,06
8,18
62,
092,
829
-
The
2010
/11
figur
es/a
mou
nts d
isclo
sed
in th
is sc
hedu
le a
re p
relim
inar
y fig
ures
and
are
una
udite
d
NT AR 10-11_10.indd 198 2011/08/17 10:02 AM
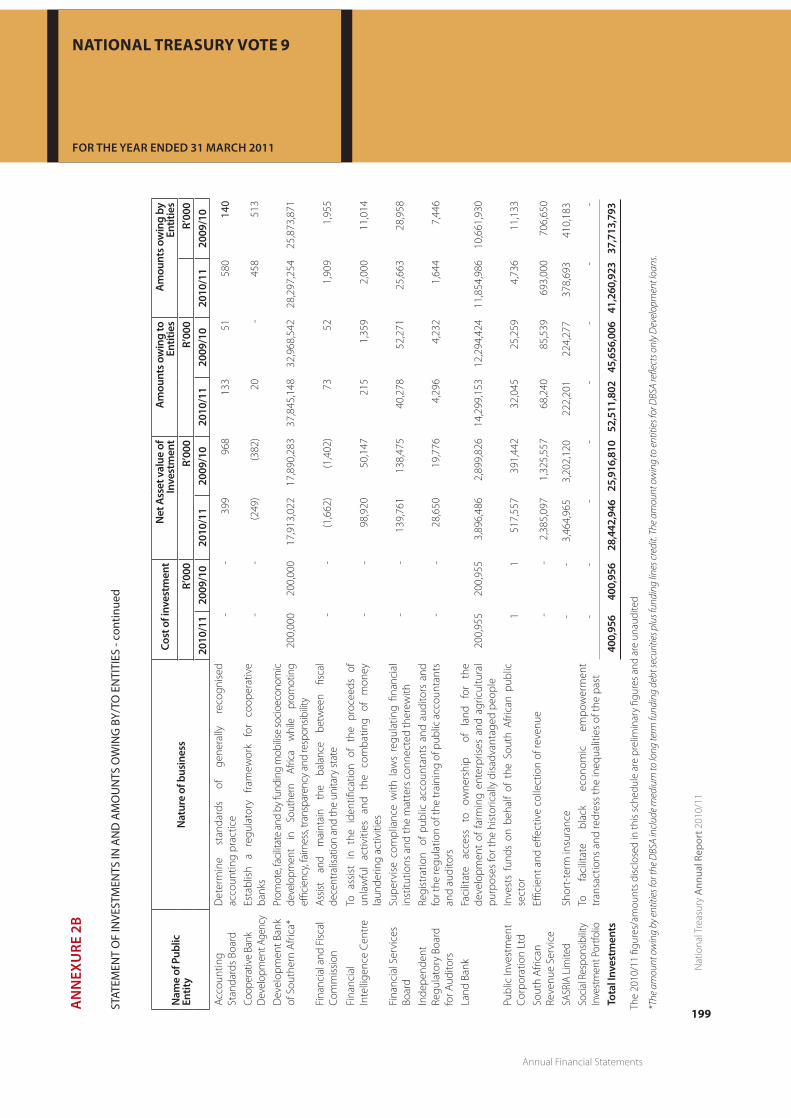
Annual Financial Statements
199
Nat
iona
l Tre
asur
y A
nnua
l Rep
ort 2
010/
11
annexures to the financial statements - continued
national treasury vote 9
FOR the yeaR ended 31 maRch 2011
aN
Nex
ure
2B
STAT
EMEN
T O
F IN
vEST
MEN
TS IN
AN
D A
MO
UN
TS O
WIN
G B
y/TO
EN
TITI
ES -
cont
inue
d
Nam
e of
pub
lic
entit
yN
atur
e of
bus
ines
sCo
st o
f inv
estm
ent
Net
ass
et v
alue
of
inve
stm
ent
amou
nts o
win
g to
en
titie
sam
ount
s ow
ing
by
entit
ies
r’00
0r’
000
r’00
0r’
000
2010
/11
2009
/10
2010
/11
2009
/10
2010
/11
2009
/10
2010
/11
2009
/10
Acc
ount
ing
Stan
dard
s Bo
ard
Det
erm
ine
stan
dard
s of
ge
nera
lly
reco
gnis
ed
acco
untin
g pr
actic
e-
-39
996
8 13
351
580
140
Coop
erat
ive
Bank
D
evel
opm
ent A
genc
yEs
tabl
ish
a re
gula
tory
fra
mew
ork
for
coop
erat
ive
bank
s-
-(2
49)
(382
)20
-45
851
3
Dev
elop
men
t Ban
k of
Sou
ther
n A
frica
*Pr
omot
e, fa
cilit
ate
and
by fu
ndin
g m
obilis
e so
cioe
cono
mic
de
velo
pmen
t in
So
uthe
rn
Afric
a w
hile
pr
omot
ing
effici
ency
, fai
rnes
s, tra
nspa
renc
y an
d re
spon
sibilit
y20
0,00
020
0,00
017
,913
,022
17,8
90,2
83
37,8
45,1
4832
,968
,542
28,2
97,2
5425
,873
,871
Fina
ncia
l and
Fisc
al
Com
miss
ion
Assis
t an
d m
aint
ain
the
bala
nce
betw
een
fisca
l de
cent
ralis
atio
n an
d th
e un
itary
stat
e-
-(1
,662
) (1
,402
)73
521,
909
1,95
5
Fina
ncia
l In
telli
genc
e Ce
ntre
To a
ssis
t in
the
ide
ntifi
catio
n of
the
pro
ceed
s of
un
law
ful
activ
ities
an
d th
e co
mba
ting
of
mon
ey
laun
derin
g ac
tiviti
es-
-98
,920
50,1
4721
51,
359
2,00
011
,014
Fina
ncia
l Ser
vice
s Bo
ard
Supe
rvis
e co
mpl
ianc
e w
ith l
aws
regu
latin
g fin
anci
al
inst
itutio
ns a
nd th
e m
atte
rs c
onne
cted
ther
ewith
--
139,
761
138
,475
40,2
7852
,271
25,6
6328
,958
Inde
pend
ent
Regu
lato
ry B
oard
fo
r Aud
itors
Regi
stra
tion
of
publ
ic a
ccou
ntan
ts a
nd a
udito
rs a
nd
for t
he re
gula
tion
of th
e tr
aini
ng o
f pub
lic a
ccou
ntan
ts
and
audi
tors
--
28,6
50 1
9,77
64,
296
4,23
21,
644
7,44
6
Land
Ban
kFa
cilit
ate
acce
ss
to
owne
rshi
p
of
land
fo
r th
e de
velo
pmen
t of
far
min
g en
terp
rises
and
agr
icul
tura
l pu
rpos
es fo
r the
his
toric
ally
dis
adva
ntag
ed p
eopl
e 20
0,95
5 20
0,95
53,
896,
486
2,8
99,8
2614
,299
,153
12,2
94,4
2411
,854
,986
10,6
61,9
30
Publ
ic In
vest
men
t Co
rpor
atio
n Lt
dIn
vest
s fu
nds
on b
ehal
f of
the
Sou
th A
frica
n pu
blic
se
ctor
11
517,
557
391,
442
32,0
4525
,259
4,73
611
,133
Sout
h A
frica
n Re
venu
e Se
rvic
eEffi
cien
t and
effe
ctiv
e co
llect
ion
of re
venu
e-
-2,
385,
097
1,3
25,5
5768
,240
85,5
3969
3,00
070
6,65
0
SASR
IA L
imite
dSh
ort-
term
insu
ranc
e-
-3,
464,
965
3,2
02,1
2022
2,20
122
4,27
737
8,69
341
0,18
3
Soci
al R
espo
nsib
ility
Inve
stm
ent P
ortfo
lioTo
fa
cilit
ate
blac
k ec
onom
ic
empo
wer
men
t tr
ansa
ctio
ns a
nd re
dres
s th
e in
equa
litie
s of
the
past
--
- -
--
--
tota
l inv
estm
ents
400,
956
400,
956
28,4
42,9
4625
,916
,810
52,5
11,8
0245
,656
,006
41,2
60,9
2337
,713
,793
The
2010
/11
figur
es/a
mou
nts
disc
lose
d in
this
sch
edul
e ar
e pr
elim
inar
y fig
ures
and
are
una
udite
d
*The
am
ount
ow
ing
by e
ntiti
es fo
r the
DBS
A in
clud
e m
ediu
m to
long
term
fund
ing
debt
secu
ritie
s plu
s fun
ding
line
s cre
dit.
The
amou
nt o
win
g to
ent
ities
for D
BSA
refle
cts o
nly
Dev
elop
men
t loa
ns.
NT AR 10-11_10.indd 199 2011/08/17 10:02 AM

Annual Financial Statements
Nat
iona
l Tre
asur
y A
nnua
l Rep
ort 2
010/
11
200
annexures to the financial statements - continued
national treasury vote 9
FOR the yeaR ended 31 maRch 2011a
NN
exu
re 3
a
STAT
EMEN
T O
F FI
NA
NCI
AL
GU
ARA
NTE
ES IS
SUED
AS
AT 3
1 M
ARC
H 2
011
– LO
CAL
Gua
rant
or
inst
itutio
nG
uara
ntee
in
resp
ect o
f
ori
g ina
lgu
aran
teed
capi
tal
amou
nt
ope
ning
ba
lanc
e1
apr
il 20
10
Gua
rant
ees
draw
dow
nsdu
ring
the
year
Gua
rant
ees
repa
ymen
ts/
canc
elle
d/
redu
ced/
re
leas
ed
duri
ng th
e ye
ar
reva
luat
ions
Clos
ing
bala
nce
31 M
arch
201
1
Gua
rant
eed
inte
rest
for
year
end
ed 3
1 M
arch
201
1
real
ised
lo
sses
not
re
cove
rabl
e i.e
. cla
ims
paid
ou
t
r’00
0r’
000
r’00
0r’
000
r’00
0r’
000
r’00
0r’
000
Mot
or v
ehic
les
guar
ante
es
Stan
dard
Ban
k Ve
hicl
e Fi
nanc
eEm
ploy
ees
749
5
3 -
(53)
- -
- -
subt
otal
749
5
3 -
(53)
- -
-
-
Hou
sing
gu
aran
tees
ABS
AEm
ploy
ees
70
70
- (7
0)-
--
-
Firs
t Nat
iona
l Ba
nkEm
ploy
ees
132
35
- (3
5)-
--
-
Ned
bank
Empl
oyee
s11
2
7
5 -
(75)
- -
- -
Stan
dard
Ban
k Em
ploy
ees
124
13
- (1
3)-
--
-
subt
otal
438
1
93
- (1
93)
- -
-
-
NT AR 10-11_10.indd 200 2011/08/17 10:02 AM

Annual Financial Statements
201
Nat
iona
l Tre
asur
y A
nnua
l Rep
ort 2
010/
11
annexures to the financial statements - continued
national treasury vote 9
FOR the yeaR ended 31 maRch 2011
aN
Nex
ure
3a
- co
ntin
ued
STAT
EMEN
T O
F FI
NA
NCI
AL
GU
ARA
NTE
ES IS
SUED
AS
AT 3
1 M
ARC
H 2
011
– LO
CAL
- con
tinue
d
Oth
er l
ocal
Gua
rant
ees
Gua
rant
or
inst
itutio
nG
uara
ntee
in re
spec
t of
orig
inal
gu
aran
teed
ca
pita
l am
ount
ope
ning
ba
lanc
e1
apr
il 20
10
Gua
rant
ees
draw
dow
nsdu
ring
the
year
Gua
rant
ees
repa
ymen
ts/
canc
elle
d/
redu
ced/
re
leas
ed
duri
ng th
e ye
ar
reva
luat
ions
Clos
ing
bala
nce
31 M
arch
20
11
Gua
rant
eed
inte
rest
for
year
end
ed
31 M
arch
20
11
real
ised
lo
sses
not
re
cove
rabl
e i.e
. cla
ims p
aid
out
r’00
0r’
000
r’00
0r’
000
r’00
0r’
000
r’00
0r’
000
Oth
er l
ocal
Gua
rant
ees
Dev
elop
men
t Ban
k of
Sou
ther
n Af
rica
Form
er re
gion
al
auth
oriti
es (f
orm
er C
iskei
)16
,800
7,45
7 -
(1,4
79)
-5,
978
187
-
Dev
elop
men
t Ban
k of
Sou
ther
n Af
rica
Form
er re
gion
al
auth
oriti
es (f
orm
er
Tran
skei
)5,
500
1,24
5 -
(373
)-
872
22
-
Dev
elop
men
t Ban
k of
Sou
ther
n Af
rica
Form
er re
gion
al
auth
oriti
es (f
orm
er
Kwan
gwan
e)3,
667
2,47
4 -
(1,2
68)
- 1,
206
--
Dev
elop
men
t Ban
k of
Sou
ther
n Af
rica
Form
er re
gion
al
auth
oriti
es (f
orm
er
Kwan
debe
le)
55,9
8915
,366
- (1
5,36
6)-
--
-
Dev
elop
men
t Ban
k of
Sou
ther
n Af
rica
Form
er re
gion
al
auth
oriti
es (f
orm
er
Boph
utha
tsw
ana)
199,
770
84,0
00
- (7
61)
- 83
,239
61,9
54-
Dev
elop
men
t Ban
k of
Sou
ther
n Af
rica
Form
er re
gion
al
auth
oriti
es (f
orm
er
Vend
a)3,
494
3,00
9 -
(2,1
91)
- 81
821
-
Dev
elop
men
t Ban
k of
Sou
ther
n Af
rica
Incr
ease
in C
apita
l15
,200
,000
15,2
00,0
00-
--
15,2
00,0
00-
-
Land
Ban
k an
d Ag
ricul
ture
D
evel
opm
ent o
f So
uth
Afric
a
Cons
olid
atio
n of
deb
t10
0,00
092
,728
--
-92
,728
-
-
subt
otal
15,5
85,2
2015
,406
,279
-(2
1,49
1)-
15,3
84,8
4162
,184
-
*Rec
lass
ifica
tion
of th
e pr
ior y
ear a
mou
nt.
NT AR 10-11_10.indd 201 2011/08/17 10:02 AM

Annual Financial Statements
Nat
iona
l Tre
asur
y A
nnua
l Rep
ort 2
010/
11
202
annexures to the financial statements - continued
national treasury vote 9
FOR the yeaR ended 31 maRch 2011a
NN
exu
re 3
a -
cont
inue
d
STAT
EMEN
T O
F FI
NA
NCI
AL
GU
ARA
NTE
ES IS
SUED
AS
AT 3
1 M
ARC
H 2
011
– LO
CAL
- con
tinue
d
Oth
er l
o cal
Gua
rant
ees
Gua
rant
or
inst
itutio
nG
uara
ntee
in
resp
ect o
f
ori
g ina
l gu
aran
teed
ca
pita
l am
ount
ope
ning
ba
lanc
e1
apr
il 20
10
Gua
rant
ees
draw
dow
nsdu
ring
the
year
Gua
rant
ees
repa
ymen
ts/
canc
elle
d/
redu
ced/
re
leas
ed
duri
ng th
e ye
ar
reva
luat
ions
Clos
ing
bala
nce
31 M
arch
20
11
Gua
rant
eed
inte
rest
for
year
end
ed
31 M
arch
20
11
real
ised
lo
sses
not
re
cove
rabl
e i.e
. cla
ims
paid
out
r’00
0r’
000
r’00
0r’
000
r’00
0r’
000
r’00
0r’
000
Oth
er l
ocal
Gua
rant
ees
subt
otal
bro
ught
forw
ard
15,5
85,2
2015
,406
,279
- (2
1,43
8)-
15,3
84,8
4162
,184
-La
nd B
ank
and
Agr
icul
ture
D
evel
opm
ent o
f So
uth
Afri
ca
Gra
in S
ilo L
oans
200,
000
1,54
7-
(111
)-
1,43
661
-
Land
Ban
k an
d A
gric
ultu
re
Dev
elop
men
t of
Sout
h A
frica
Reca
pita
lisat
ion10
3,50
0,00
0 2,
500,
000
-(7
50,0
00)
-1,
750,
000
- -
subt
otal
oth
er
loca
l gua
rant
ees
19,2
85,2
20 1
7,90
7,82
6-
(771
,594
)
-
17,1
36,2
7762
,245
-
tota
l oth
er lo
cal
guar
ante
es19
,286
,407
17,
908,
072
-(7
71,7
95)
- 17
,136
,277
62,2
45
-
10Th
e le
tter
of u
nder
stan
ding
of R
3.5
mill
ion
is pr
opor
tiona
lly d
ecre
asin
g w
ith c
apita
l inj
ectio
n by
gov
ernm
ent t
o th
e La
nd B
ank;
R1
billi
on (2
009/
10),
R750
mill
ion
(201
0/11
and
201
1/12
) and
R1
billi
on (2
012/
13)
NT AR 10-11_10.indd 202 2011/08/17 10:02 AM

Annual Financial Statements
203
Nat
iona
l Tre
asur
y A
nnua
l Rep
ort 2
010/
11
annexures to the financial statements - continued
national treasury vote 9
FOR the yeaR ended 31 maRch 2011
aN
Nex
ure
3a
- co
ntin
ued
STAT
EMEN
T O
F FI
NA
NCI
AL
GU
ARA
NTE
ES IS
SUED
AS
AT 3
1 M
ARC
H 2
011
– FO
REIG
N
Gua
rant
or
inst
itutio
nG
uara
ntee
in re
spec
t of
ori
gina
l gu
aran
teed
ca
pita
l am
ount
ope
ning
ba
lanc
e1
apr
il 20
10
Gua
rant
ees
draw
dow
nsdu
ring
the
year
Gua
rant
ees
repa
ymen
ts/
canc
elle
d/ re
duce
d/
rele
ased
dur
ing
the
year
reva
luat
ions
Clos
ing
bala
nce
31 M
arch
20
11
Gua
rant
eed
inte
rest
for
year
end
ed
31 M
arch
20
11
real
ised
lo
sses
not
re
cove
rabl
e i.e
. cla
ims
paid
out
r’00
0r’
000
r’00
0r’
000
r’00
0r’
000
r’00
0r’
000
Dev
elop
men
t Ban
k of
So
uthe
rn A
frica
Chi
ao T
ung
Bank
Co.
Lt
d
105
,161
18
,123
- (4
,583
)(9
53)
12,5
8720
-
Dev
elop
men
t Ban
k of
So
uthe
rn A
frica
Afri
can
Dev
elop
men
t Ba
nk
475,
472
128,
363
- (5
0,39
7)(6
,645
)71
,321
310
-
Dev
elop
men
t Ban
k of
So
uthe
rn A
frica
Nor
dic
Inve
stm
ent
Bank
67,
925
22,0
05-
(7,2
54)
(1,1
66)
13,5
8521
-
Dev
elop
men
t Ban
k of
So
uthe
rn A
frica
Nor
dic
Inve
stm
ent
Bank
67,9
2512
,944
- (8
,377
)(5
71)
3,99
611
-
Dev
elop
men
t Ban
k of
So
uthe
rn A
frica
Nor
dic
Inve
stm
ent
Bank
67,9
2521
,574
- (8
,377
)(1
,210
)11
,987
32-
Dev
elop
men
t Ban
k of
So
uthe
rn A
frica
Euro
pean
Inve
stm
ent
Bank
482,
638
263,
971
- (2
10,2
21)
(4,3
84)
49,3
6617
-
Dev
elop
men
t Ban
k of
So
uthe
rn A
frica
Euro
pean
Inve
stm
ent
Bank
482,
638
165,
123
- (3
9,57
3)(1
0,86
8)11
4,68
238
-
Dev
elop
men
t Ban
k of
So
uthe
rn A
frica
Euro
pean
Inve
stm
ent
Bank
772,
220
343,
489
- (4
3,90
3)(2
3,91
6)27
5,67
092
-
Dev
elop
men
t Ban
k of
So
uthe
rn A
frica
Afri
can
Dev
elop
men
t Ba
nk67
9,24
562
3,47
5-
(72,
205)
(41,
836)
509,
434
1,95
5-
Dev
elop
men
t Ban
k of
So
uthe
rn A
frica
Age
nce
Fran
cais
se d
e D
evel
opm
ent
147,
155
81,2
70-
(11,
443)
(1,9
09)
67,9
181,
004
-
Dev
elop
men
t Ban
k of
So
uthe
rn A
frica
Kred
itans
talt
fur
Wie
rder
afba
u28
2,21
326
0,50
9-
(13,
296)
(7,3
32)
239,
881
1,21
3-
Dev
elop
men
t Ban
k of
So
uthe
rn A
frica
Kred
itans
talt
fur
Wie
rder
afba
u14
0,65
814
4,26
7-
- (3
,609
)14
0,65
871
1-
Dev
elop
men
t Ban
k of
So
uthe
rn A
frica
Kred
itans
talt
fur
Wie
rder
afba
u12
1,00
212
4,10
5-
-(3
,104
)12
1,00
161
2-
Dev
elop
men
t Ban
k of
So
uthe
rn A
frica
Kred
itans
talt
fur
Wie
rder
afba
u12
3,38
412
3,75
5-
(5,6
94)
(3,4
35)
114,
626
580
-
NT AR 10-11_10.indd 203 2011/08/17 10:02 AM

Annual Financial Statements
Nat
iona
l Tre
asur
y A
nnua
l Rep
ort 2
010/
11
204
annexures to the financial statements - continued
national treasury vote 9
FOR the yeaR ended 31 maRch 2011
Gua
rant
or
inst
itutio
nG
uara
ntee
in re
spec
t of
ori
gina
l gu
aran
teed
ca
pita
l am
ount
ope
ning
ba
lanc
e1
apr
il 20
10
Gua
rant
ees
draw
dow
nsdu
ring
the
year
Gua
rant
ees
repa
ymen
ts/
canc
elle
d/ re
duce
d/
rele
ased
dur
ing
the
year
reva
luat
ions
Clos
ing
bala
nce
31 M
arch
20
11
Gua
rant
eed
inte
rest
for
year
end
ed
31 M
arch
20
11
real
ised
lo
sses
not
re
cove
rabl
e i.e
. cla
ims
paid
out
r’00
0r’
000
r’00
0r’
000
r’00
0r’
000
r’00
0r’
000
Dev
elop
men
t Ban
k of
So
uthe
rn A
frica
Kred
itans
talt
fur
Wie
rder
afba
u13
3,05
912
9,65
0-
(6,2
69)
(3,6
28)
119,
753
605
-
Dev
elop
men
t Ban
k of
So
uthe
rn A
frica
Afri
can
Dev
elop
men
t Ba
nk50
0,00
016
7,60
1-
(41,
901)
- 12
5,70
03,
025
-
Dev
elop
men
t Ban
k of
So
uthe
rn A
frica
Euro
bond
s
8,5
00,0
00
8,50
0,00
0-
- -
8,50
0,00
010
,875
-
subt
otal
fore
ign
guar
ante
es13
,148
,620
11,1
30,2
24-
(523
,493
)(1
14,5
66)
10,4
92,1
6521
,121
tota
l fina
ncia
l gu
aran
tees
tota
l32
,435
,027
29,0
38,2
96-
(1,2
95,2
88)
(114
,566
)27
,628
,442
83,3
66
-
aN
Nex
ure
3a
- co
ntin
ued
STAT
EMEN
T O
F FI
NA
NCI
AL
GU
ARA
NTE
ES IS
SUED
AS
AT 3
1 M
ARC
H 2
011
– FO
REIG
N
NT AR 10-11_10.indd 204 2011/08/17 10:02 AM

Annual Financial Statements
205
Nat
iona
l Tre
asur
y A
nnua
l Rep
ort 2
010/
11
annexures to the financial statements - continued
national treasury vote 9
FOR the yeaR ended 31 maRch 2011
aN
Nex
ure
3B
STAT
EMEN
T O
F CO
NTI
NG
ENT
LIA
BILI
TIES
AS
AT 3
1 M
ARC
H 2
011
Nat
ure
of l
iabi
lity
ope
ning
Bal
ance
1
apr
il 20
10li
abili
ties
incu
rred
du
ring
the
year
liab
ilitie
s pa
id/
canc
elle
d/re
duce
d du
ring
the
year
liab
ilitie
s re
cove
rabl
e (p
rovi
de d
etai
ls
here
unde
r)
Clos
ing
Bala
nce
31 M
arch
201
1
r’00
0r’
000
r’00
0r’
000
r’00
0Cl
aim
s ag
ains
t the
dep
artm
ent
Arr
ears
rent
al c
laim
403
-(4
03)
--
RSC
levi
es c
laim
171,
815
--
-17
1,81
5
SARB
gua
rant
ee c
laim
35,3
36-
- -
35,3
36
Thef
t an
d lo
sses
cla
im 11
786
- (6
2)-
724
Cont
ract
can
cella
tion
clai
m4,
500
576
- -
5,07
6
Relo
catio
n co
sts
clai
m7
- -
-7
Prom
isso
ry n
ote
clai
m1,
000,
000
- -
-1,
000,
000
Ale
xcor
cla
im11
9,00
0-
- -
119,
000
Ada
m S
mith
Inte
rnat
iona
l cla
im-
1,10
0-
-1,
100
Unl
awfu
l use
of p
hoto
grap
h cl
aim
-50
0-
-50
0
Ass
et F
orfe
iture
Uni
t cla
im-
118
--
118
Xia
Xu c
laim
11-
163
-16
3
Callc
om c
laim
-2,
400
--
2,40
0
Nat
iona
l Her
itage
Site
cla
im-
4,88
8-
4,88
8
Sika
nder
Nan
abha
y cl
aim
-2,
151
--
2,15
1
VMA
cou
rt re
cord
s cl
aim
-50
--
50
SARB
mon
ey s
eizu
re c
laim
11-
1,85
9-
-1,
859
Stol
en c
hequ
e cl
aim
-67
--
67
Frau
dule
nt V
AT e
-mai
l cla
im-
516
--
516
tota
l cla
ims
agai
nst t
he d
epar
tmen
t1,
331,
847
14,3
88(4
65)
-1,
345,
770
11 E
xcha
nge
rate
of R
6.79
on
$103
,493
.75,
$24
,000
and
$20
6,00
0 as
at 3
1 M
arch
201
0 w
as a
pplie
d re
spec
tivel
y.
NT AR 10-11_10.indd 205 2011/08/17 10:02 AM

Annual Financial Statements
Nat
iona
l Tre
asur
y A
nnua
l Rep
ort 2
010/
11
206
annexures to the financial statements - continued
national treasury vote 9
FOR the yeaR ended 31 maRch 2011a
NN
exu
re 3
B - c
ontin
ued
STAT
EMEN
T O
F CO
NTI
NG
ENT
LIA
BILI
TIES
AS
AT 3
1 M
ARC
H 2
011
Nat
ure
of l
iabi
lity
ope
ning
Bal
ance
1
apr
il 20
10l i
abili
ties
incu
rred
du
ring
the
year
liab
ilitie
s pa
id/
canc
elle
d/re
duce
d du
ring
the
year
liab
ilitie
s re
cove
rabl
e (p
rovi
de d
etai
ls
here
unde
r)
Clos
ing
Bala
nce
31 M
arch
201
1
r’00
0r’
000
r’00
0r’
000
r’00
0to
tal o
ther
liab
ilitie
s14
6,79
5 21
6,89
9(3
25)
-36
3,36
9M
ilita
ry P
ensi
on2,
955
15,5
92(3
25)
-18
,222
Inju
ry o
n du
ty-
4,37
9-
-4,
379
Spec
ial P
ensi
on14
3,84
014
8,66
2-
-29
2,50
2
Susp
ende
d Pe
nsio
ners
-48
,266
--
48,2
66to
tal c
ontin
gent
liab
ilitie
s1,
478,
642
231,
287
(790
)-
1,70
9,13
9
NT AR 10-11_10.indd 206 2011/08/17 10:02 AM
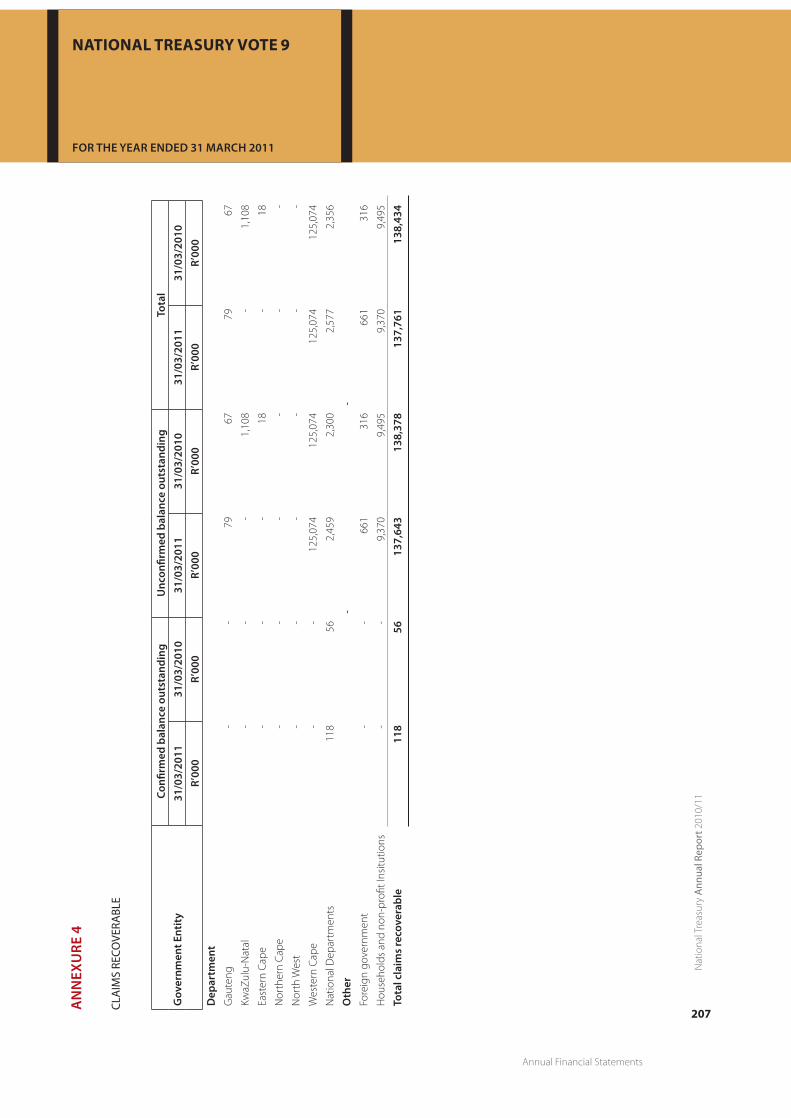
Annual Financial Statements
207
Nat
iona
l Tre
asur
y A
nnua
l Rep
ort 2
010/
11
annexures to the financial statements - continued
national treasury vote 9
FOR the yeaR ended 31 maRch 2011
aN
Nex
ure
4
CLA
IMS
RECO
vERA
BLE
Gov
ernm
ent e
ntit
yCo
nfirm
ed b
alan
ce o
utst
andi
ngu
ncon
firm
ed b
alan
ce o
utst
andi
ngto
tal
31/0
3/20
1131
/03/
2010
31/0
3/20
1131
/03/
2010
31/0
3/20
1131
/03/
2010
r’00
0r’
000
r’00
0r’
000
r’00
0r’
000
Dep
artm
ent
Gau
teng
--
7967
7967
KwaZ
ulu-
Nat
al-
--
1,10
8-
1,10
8
East
ern
Cape
--
-18
-18
Nor
ther
n Ca
pe-
--
--
-
Nor
th W
est
--
--
--
Wes
tern
Cap
e-
-12
5,07
412
5,07
412
5,07
412
5,07
4
Nat
iona
l Dep
artm
ents
118
562,
459
2,30
02,
577
2,35
6
oth
er-
-Fo
reig
n go
vern
men
t-
-66
131
666
131
6
Hou
seho
lds
and
non-
profi
t Ins
itutio
ns-
-9,
370
9,49
59,
370
9,49
5
tota
l cla
ims
reco
vera
ble
118
5613
7,64
313
8,37
813
7,76
113
8,43
4
NT AR 10-11_10.indd 207 2011/08/17 10:02 AM

Annual Financial Statements
Nat
iona
l Tre
asur
y A
nnua
l Rep
ort 2
010/
11
208
annexures to the financial statements - continued
national treasury vote 9
FOR the yeaR ended 31 maRch 2011a
NN
exu
re 5
INvE
NTO
Ry
Gov
ernm
ent e
ntit
y20
10-1
120
09-1
0q
ua
Nti
tyr ’
000
qu
aN
tity
r ’00
0in
vent
ory12
Ope
ning
bal
ance
*
944
159
23
139
Add
/(Le
ss):
Adj
ustm
ents
to p
rior y
ear
bala
nces
-
-
-
Add
: A
dditi
ons/
Purc
hase
s - C
ash
6,0
00
9
52
6,00
01,
008
Add
: A
dditi
ons
- Non
-cas
h
-
- -
(Les
s): D
ispo
sals
-
-
-
(Les
s): I
ssue
s
(5
,603
)
(898
)(5
,287
)(8
88)
Add
/(Le
ss):
Adj
ustm
ents
-
-
Clos
ing
bala
nce
1,3
41
2
13
944
159
*Rec
lass
ifica
tion
of p
rior y
ear a
mou
nt to
be
in li
ne w
ith th
e D
epar
tmen
tal R
epor
ting
Fram
ewor
k.
12A
vera
ge p
rice
rate
s w
ere
used
to a
lign
the
purc
hase
and
issu
e pr
ice
rate
s as
det
erm
ined
by
the
LOG
IS s
yste
m.
PROJECT dEVElOPmENT FACIlITy (PdF)A TRADING ENTITY MANAGED BY THE PPP UNIT OF NATIONAL TREASURY
NT AR 10-11_10.indd 208 2011/08/17 10:02 AM

Annual Financial Statements
209
Nat
iona
l Tre
asur
y A
nnua
l Rep
ort 2
010/
11
annexures to the financial statements - continued
national treasury vote 9
FOR the yeaR ended 31 maRch 2011
ANNUAl FINANCIAl STATEmENTS
PROJECT dEVElOPmENT FACIlITy (PdF)A TRADING ENTITY MANAGED BY THE PPP UNIT OF NATIONAL TREASURY
TEChNICAl ASSISTANCE UNITA TRADING ENTITY MANAGED BY THE TAU UNIT OF NATIONAL TREASURY
NT AR 10-11_10.indd 209 2011/08/17 10:02 AM

annexures to the financial statements - continued
project development facility
FOR the yeaR ended 31 maRch 2011
A TRADING ENTITY MANAGED BY THE PPP UNIT OF NATIONAL TREASURY
PROJECT dEVElOPmENT FACIlITy (PdF)A TRADING ENTITY MANAGED BY THE PPP UNIT OF NATIONAL TREASURY
For tHe year eNDiNG 31 MarCH 2011
ANNUAl FINANCIAl STATEmENTS
NT AR 10-11_10.indd 210 2011/08/17 10:02 AM

annexures to the financial statements - continued
project development facility
FOR the yeaR ended 31 maRch 2011
A TRADING ENTITY MANAGED BY THE PPP UNIT OF NATIONAL TREASURY
ANNUAl FINANCIAl STATEmENTS
project development facility
as at 31 march 2010
A TRADING ENTITY MANAGED BY THE PPP UNIT OF NATIONAL TREASURY
CoNteNts
Report of the Auditor General ......................................................................................................................................................................................................213
Statement of financial position ...................................................................................................................................................................................................216
Statement of comprehensive income ....................................................................................................................................................................................217
Statement of changes in equity ..................................................................................................................................................................................................218
Statement of cash flows ...................................................................................................................................................................................................................219
Accounting policies ............................................................................................................................................................................................................................220
Notes to the Annual Financial Statements ...........................................................................................................................................................................224
PROJECT dEVElOPmENT FACIlITy (PdF)A TRADING ENTITY MANAGED BY THE PPP UNIT OF NATIONAL TREASURY
For tHe year eNDiNG 31 MarCH 2011
NT AR 10-11_10.indd 211 2011/08/17 10:02 AM

Annual Financial Statements
Nat
iona
l Tre
asur
y A
nnua
l Rep
ort 2
010/
11
212
For tHe year eNDeD 31 MarCH 2011
REPORT OF ThE AUdITOR-GENERAl TO PARlIAmENT ON
ThE PROJECT dEVElOPmENT FACIlITy (PdF)
NT AR 10-11_10.indd 212 2011/08/17 10:02 AM
Annual Financial Statements
213
Nat
iona
l Tre
asur
y A
nnua
l Rep
ort 2
010/
11
REPORT OF ThE AUdITOR-GENERAl TO PARlIAmENT ON ThE PROJECT dEVElOPmENT FACIlITy
project development facility
FOR the yeaR ended 31 maRch 2011
A TRADING ENTITY MANAGED BY THE PPP UNIT OF NATIONAL TREASURY
For tHe year eNDeD 31 MarCH 2011
REPORT ON ThE FINANCIAl STATEmENTS
iNtroDuCtioN
1. I have audited the accompanying financial statements of the Project Development Facility, which comprise the
statement of financial position as at 31 March 2011, and the statement of comprehensive income, statement of
changes in equity and cash flow statement for the year then ended, and a summary of significant accounting policies
and other explanatory information, as set out on pages 216 to 238.
aCCouNtiNG oFFiCer’s respoNsiBility For tHe FiNaNCial stateMeNts
2. The accounting officer is responsible for the preparation and fair presentation of these financial statements in
accordance with South African Statements of Generally Accepted Accounting Practice (SA Statements of GAAP) and
the requirements of the Public Finance Management Act of South Africa, 1999 (Act No. 1 of 1999) (PFMA), and for such
internal control as management determines necessary to enable the preparation of financial statements that are free
from material misstatement, whether due to fraud or error.
auDitor-GeNeral’s respoNsiBility
3. As required by section 188 of the Constitution of the Republic of South Africa, 1996 (Act No. 108 of 1996) and section
4 of the Public Audit Act of South Africa, 2004 (Act No. 25 of 2004) (PAA), my responsibility is to express an opinion on
these financial statements based on my audit.
4. I conducted my audit in accordance with International Standards on Auditing and General Notice 1111 of 2010 issued
in Government Gazette 33872 of 15 December 2010. Those standards require that I comply with ethical requirements
and plan and perform the audit to obtain reasonable assurance about whether the financial statements are free from
material misstatement.
5. An audit involves performing procedures to obtain audit evidence about the amounts and disclosures in the financial
statements. The procedures selected depend on the auditor’s judgement, including the assessment of the risks of
material misstatement of the financial statements, whether due to fraud or error. In making those risk assessments, the
auditor considers internal control relevant to the entity’s preparation and fair presentation of the financial statements
in order to design audit procedures that are appropriate in the circumstances, but not for the purpose of expressing
an opinion on the effectiveness of the entity’s internal control. An audit also includes evaluating the appropriateness
of accounting policies used and the reasonableness of accounting estimates made by management, as well as
evaluating the overall presentation of the financial statements.
6. I believe that the audit evidence I have obtained is sufficient and appropriate to provide a basis for my audit opinion.
NT AR 10-11_10.indd 213 2011/08/17 10:02 AM

Annual Financial Statements
Nat
iona
l Tre
asur
y A
nnua
l Rep
ort 2
010/
11
214
project development facility
FOR the yeaR ended 31 maRch 2011
A TRADING ENTITY MANAGED BY THE PPP UNIT OF NATIONAL TREASURY
REPORT OF THE AudiTOR-gEnERAl TO PARliAMEnT On THE PROjEcT dEvElOPMEnT FAciliTy - cont
opiNioN
7. In my opinion, the financial statements present fairly, in all material respects, the financial position of the Project
Development Facility as at 31 March 2011, and its financial performance and cash flows for the year then ended in
accordance with SA Statements of GAAP and the requirements of the PFMA.
eMpHasis oF Matter
8. I draw attention to the mater below. My opinion is not modified in respect of this matter:
Restatement of corresponding figures
9. As disclosed in note 17 to the financial statements, the corresponding figures for 31 March 2010 have been restated as
a result of an error discovered during 2011 in the financial statements of the Project Development Facility at, and for
the year ended, 31 March 2011.
REPORT ON OThER lEGAl ANd REGUlATORy REQUIREmENTS
10. In accordance with the PAA and in terms of General Notice 1111 of 2010, issued in Government Gazette 33872 of
15 December 2010, I include below my findings on the annual performance report as set out on pages 17 to 97 and
material non-compliance with laws and regulations applicable to the Project Development Facility.
preDeterMiNeD oBJeCtives
11. There were no material findings on the annual performance report concerning the presentation, usefulness and
reliability of the information.
CoMpliaNCe witH laws aND reGulatioNs
Strategic planning and performance management
12. The accounting officer did not prepare adequate quarterly reports on the progress made in achieving measurable
objectives and targets were as required by Treasury Regulation (TR) 5.3.1.
Annual financial statements, performance and annual report
13. The accounting officer did not submit the annual performance report in time as required by Part C of General Notice
1111 of 2010, issued in Government Gazette No. 33872 of 15 December 2010.
NT AR 10-11_10.indd 214 2011/08/17 10:02 AM

Annual Financial Statements
215
Nat
iona
l Tre
asur
y A
nnua
l Rep
ort 2
010/
11
REPORT OF THE AudiTOR-gEnERAl TO PARliAMEnT On THE PROjEcT dEvElOPMEnT FAciliTy - cont
project development facility
FOR the yeaR ended 31 maRch 2011
A TRADING ENTITY MANAGED BY THE PPP UNIT OF NATIONAL TREASURY
INTERNAl CONTROl
14. In accordance with the PAA and in terms of General Notice 1111 of 2010, issued in Government Gazette 33872
of 15 December 2010, I considered internal control relevant to my audit, but not for the purpose of expressing an
opinion on the effectiveness of internal control. The matters reported below are limited to the significant deficiencies
that resulted on the findings on compliance with laws and regulations included in this report.
leaDersHip
Oversight responsibility regarding reporting and compliance
15. Management did not adhere to the internal policies and procedures and as a result there were instances of non-
compliance with the PFMA and TR.
Pretoria
29 July 2011
NT AR 10-11_10.indd 215 2011/08/17 10:02 AM

Annual Financial Statements
Nat
iona
l Tre
asur
y A
nnua
l Rep
ort 2
010/
11
216
project development facility
FOR the yeaR ended 31 maRch 2011
A TRADING ENTITY MANAGED BY THE PPP UNIT OF NATIONAL TREASURY
STATEmENT OF FINANCIAl POSITION
Notes2010/2011
R
Restated2009/2010
Rassets
Current assets 27 433 048 60 277 523Receivables 11 83 405 283 478Cash and cash equivalents 12 27 349 643 59 994 045
total assets 27 433 048 60 277 523
equity aND liaBilities
equityRetained earnings 11 507 042 17 823 200
Non Current liabilitiesRevenue Fund 13 0 1 503 940
Current liabilitiesPayables 14 13 557 458 7 278 003Deferred Revenue 15 674 832 411 571Unspent Government Funding 16 1 693 716 33 260 809
total equity and liabilities 27 433 048 60 277 523
NT AR 10-11_10.indd 216 2011/08/17 10:02 AM

Annual Financial Statements
217
Nat
iona
l Tre
asur
y A
nnua
l Rep
ort 2
010/
11
STATEmENT OF COmPREhENSIVE INCOmE
project development facility
for the year ended 31 March 2011
A TRADING ENTITY MANAGED BY THE PPP UNIT OF NATIONAL TREASURY
Notes 2010/11R
2009/10R
Revenue 7 62 704 394 86 826 493
Project expenses 8 (69 440 981) (103 766 249)
Gross profit/(loss) (6 736 587) (16 939 756)
Investment Income
Administration expenses
9
10
1 646 427
(1 225 967)
3 369 931
(1 047 570)
Finance cost (31) (1 162)
loss for the year (6 316 158) (14 618 557)
NT AR 10-11_10.indd 217 2011/08/17 10:02 AM

Annual Financial Statements
Nat
iona
l Tre
asur
y A
nnua
l Rep
ort 2
010/
11
218
project development facility
FOR the yeaR ended 31 maRch 2011
A TRADING ENTITY MANAGED BY THE PPP UNIT OF NATIONAL TREASURY
STATEmENT OF ChANGES IN EQUITy
Notes RetainedEarnings
R
Balance at 1 April 2009 as previously stated 81 829 410Adjustment due to prior period errors 17 (49 387 653)Restated Balance at 1 April 2009 32 441 757
Restated Net Loss for the year ended 31 March 2010 (14 618 557)Restated Balance at 31 March 2010 17 823 200
Net Loss for the year ended 31 March 2011 (6 316 158)Balance at 31 March 2011 11 507 042
NT AR 10-11_10.indd 218 2011/08/17 10:02 AM

Annual Financial Statements
219
Nat
iona
l Tre
asur
y A
nnua
l Rep
ort 2
010/
11
STATEmENT OF CASh FlOWS
project development facility
FOR the yeaR ended 31 maRch 2011
A TRADING ENTITY MANAGED BY THE PPP UNIT OF NATIONAL TREASURY
Notes 2010/11R
2009/10R
CasH Flow FroM operatiNG aCtivities
Cash received from government and other sources 62 704 394 86 826 493Cash paid to suppliers (97 195 265) (124 708 927)Interest Paid (31) (1 162)Cash utilised in operations 18 (34 490 902) (37 883 596)
Interest received 19 1 846 500 3 430 266Net cash inflow/outflow from operating activities (32 644 402) (34 453 330)
Net iNCrease/(DeCrease) iN CasH aND CasH equivaleNts (32 644 402) (34 453 330)
Cash and cash equivalents at beginning of the year 12 59 994 045 94 447 375
CasH aND CasH equivaleNts at eND oF year 12 27 349 643 59 994 045
NT AR 10-11_10.indd 219 2011/08/17 10:02 AM

Annual Financial Statements
Nat
iona
l Tre
asur
y A
nnua
l Rep
ort 2
010/
11
220
project development facility
FOR the yeaR ended 31 maRch 2011
A TRADING ENTITY MANAGED BY THE PPP UNIT OF NATIONAL TREASURY
ACCOUNTING POlICIES
1. GENERAl INFORmATION
The Project Development Fund (PDF) is a Trading Entity that is incorporated in the Republic of South Africa.
The PDF is located within the Public Private Partnership (PPP) unit of National Treasury. Its principal role is to
increase the quality and quantity of commercially viable projects that are processed through the PPP unit’s
project pipeline.
The PDF also supports the:
(1) NDPG (Neighbourhood Development Programme Grant) –
Its role is to accelerate investment in community amenities in poor underserved residential neighbourhoods
by providing technical support and co-financing for municipal projects, which includes the construction of
new and improved social, administrative, commercial and recreational community facilities.
(2) US Grant –
Its role is to facilitate partnership arrangements at municipal level, monitor implementation of the growth and
development summit agreements, and establishes a framework for municipal investment.
2. STANdARdS ANd INTERPRETATIONS EARly AdOPTEd
No new standards and interpretations have been early adopted in the current financial year.
3. SIGNIFICANT ACCOUNTING POlICIES
3.1 stateMeNt oF CoMpliaNCe
The annual financial statements have been prepared in accordance with Statements of Generally Accepted
Accounting Practice (GAAP). These require the use of certain accounting estimates. They also require management
to exercise its judgement in the process of applying the company’s accounting policies based on best available
information at the time of preparation.
3.2 CurreNCy
The financial statements are presented in South African Rand since that is the currency in which the majority of
the entity’s transactions are denominated.
3.3 Basis oF preparatioN
The financial statements have been prepared on the historical cost basis, except where indicated otherwise. The
financial statements incorporate the fundamental assumptions of going concern and accrual.
NT AR 10-11_10.indd 220 2011/08/17 10:02 AM

Annual Financial Statements
221
Nat
iona
l Tre
asur
y A
nnua
l Rep
ort 2
010/
11
accounting policies - continued
project development facility
FOR the yeaR ended 31 maRch 2011
A TRADING ENTITY MANAGED BY THE PPP UNIT OF NATIONAL TREASURY
The principal accounting policies are adopted and set out below. These have been applied consistently with the
previous financial year.
3.4 reveNue reCoGNitioN
Funding Revenue
Funding revenue is recognised when it is probable that future economic benefits will flow to the entity and the entity
will comply with the conditions attaching to it.
Where the resources transferred to the entity are subject to the fulfilment of specific conditions, it recognises an asset
and a corresponding liability. As and when the conditions are fulfilled, the liability is reduced and revenue is recognised.
Funding received by the NDPG is accounted for in the financial statements of the entity as a liability until the related
eligible project expenses are incurred. Investment income related to these funds increases the liability unless the
entity is approved to utilise investment income for unrelated expenses, in which case it is recognised on a time
proportionate basis. Funding received by the PDF is accounted for in the financial statements of the entity on receipt.
Funding received by the US Grant is accounted for in the financial statements of the entity as a liability until the
related eligible project expenses are incurred.
3.5 irreGular aND Fruitless aND wasteFul expeNDiture
Irregular expenditure relates to expenditure incurred in contravention of, or not in accordance with, a requirement
of any applicable legislation, including the Public Financial and Management Act (PFMA), 1999 as amended.
Fruitless and wasteful expenditure relates to expenditure made in vain and could have been avoided had
reasonable care or controls been exercised.
All irregular and fruitless and wasteful expenditure is disclosed in the notes to the financial statement in the period
in which it is incurred.
3.6 FiNaNCial iNstruMeNts
Recognition
Financial instruments are initially recognised when the entity becomes a party to the contractual provisions of the
relevant instrument, and are initially measured at fair value. Subsequent to initial recognition, these instruments are
measured as set out below.
Financial Assets
Loans and receivables
Loans and receivables are non-derivative financial assets with fixed or determinable payments that are not quoted
in an active market. Loans and receivables (including receivables, cash and cash equivalents) are measured at
amortised cost using the effective interest method, less any impairment.
NT AR 10-11_10.indd 221 2011/08/17 10:02 AM

Annual Financial Statements
Nat
iona
l Tre
asur
y A
nnua
l Rep
ort 2
010/
11
222
project development facility
FOR the yeaR ended 31 maRch 2011
A TRADING ENTITY MANAGED BY THE PPP UNIT OF NATIONAL TREASURY
accounting policies - continued
accounting policies - continued
Interest income is recognised by applying the effective interest rate, except for short-term receivables when the
recognition of interest would be immaterial.
Financial Liabilities
All financial liabilities of PDF are classified as other financial liabilities. The classification depends on the nature and
purpose of the financial liabilities and is determined at the time of initial recognition.
Other financial Liabilities
Other financial liabilities are subsequently measured at amortised cost using the effective interest method.
3.7 ForeiGN CurreNCies
In preparing the financial statements of the individual entity, transactions in currencies other than the entity’s functional
currency (foreign currencies) are recognised at the rates of exchange prevailing at the date the funds are received and
are re-valued at the closing rate as at the financial year end 31 March 2011.
3.8 GoiNG CoNCerN
The entity is financially dependent on the funding it receives from National Treasury. On the basis that the funding
has been listed in the Estimates of National Expenditure, management believe that the entity will continue to
be a going concern in the year ahead. For this reason, management continue to prepare the annual financial
statements on a going concern basis.
4. PUblIC SECTOR PRACTICES ANd POlICIES
4.1 iNter-relatioNsHip witH otHer GoverNMeNt eNtities
The entity operates as a trading entity of the National Treasury, within the South African Government environment.
In line with prevailing government practices, the entity is not obliged to pay for certain expenditure such as office
space and utilisation of fixed and moveable assets..
4.2 puBliC FiNaNCe MaNaGeMeNt aCt reportiNG requireMeNts
Section 40(3) (b)
No material losses occurred during the current financial year due to criminal conduct nor any unauthorised
expenditure or irregular expenditure.
NT AR 10-11_10.indd 222 2011/08/17 10:02 AM

Annual Financial Statements
223
Nat
iona
l Tre
asur
y A
nnua
l Rep
ort 2
010/
11
accounting policies - continued
project development facility
FOR the yeaR ended 31 maRch 2010
A TRADING ENTITY MANAGED BY THE PPP UNIT OF NATIONAL TREASURY
5. CONTINGENT lIAbIlITIES
The entity’s main operating activities are to facilitate project developments for municipalities/institutions. Hence
project commitments are provided to facilitate such developments. These commitments range from 2 – 20 years
depending on the nature of the project.
The full commitment less cumulative expenditure results in the future commitment to the municipality/institution.
This is the contingent liability.
Refer to note 20 on the list of contingent liabilities for both the PDF and NDPG projects.
6. CONTINGENT ASSETS
The entity has a legal right to recover expenditure disbursed when a project reaches the final stage of the PPP, from
the private party.
Funds are paid to transaction advisors in accordance with the terms of the contract between the institution or
municipality and the transaction advisor. Disbursed funds may be recovered from the successful private party
bidder when the PPP reaches financial close. The PDF is exposed to the full risk of the project not reaching
financial closure.
To date, the PDF has not recovered any disbursed funds from projects as they have not reached financial closure.
An asset will be recognised once the project has reached financial closure. It is only at this closure where the PDF
will be able to recover the expenditure disbursed.
2010/2011 R
Restated2009/2010
R
7. REVENUE
Funding Income includes R1 503 940 retained from Eastern Cape Department of Health (see note 13) and
R300 000 co-funding received from Free State Department of Health (see note 14).
Revenue includes: - Government Funding Income – PDF 3 000 000 0 - Government Funding Income – NDPG 53 345 758 86 126 844 - US Grant 908 000 699 649 - PDF Alternative Energy 500 000 0 - Project Reimbursive Expenditure 3 146 696 0 - Funding Income 1 803 940 0
62 704 394 86 826 493
NT AR 10-11_10.indd 223 2011/08/17 10:02 AM

Annual Financial Statements
Nat
iona
l Tre
asur
y A
nnua
l Rep
ort 2
010/
11
224
project development facility
FOR the yeaR ended 31 maRch 2011
A TRADING ENTITY MANAGED BY THE PPP UNIT OF NATIONAL TREASURY
NOTES TO ThE ANNUAl FINANCIAl STATEmENTS
2010/2011 R
Restated2009/2010
R
8. PROJECT ExPENSES
Project expenses includes: - PDF 13 172 652 17 053 576 - NDPG (qualifying expenditure) 53 345 758 86 126 844 - NDPG (other) 1 778 884 0 - PDF Alternative Energy 500 000 0 - US Grant 643 687 585 829
69 440 981 103 766 249
9. INVESTmENT INCOmE
Other income includes: - Interest received from PDF bank account 268 315 1 159 791 - Interest received from NDPG bank account 1 378 112 2 210 140
1 646 427 3 369 931
NDPG has the authority to retain the NDPG interest and utilise it for NDPG operations.
10. AdmINISTRATION ExPENSES
Administration expenses comprises the following: - Audit fees 245 853 234 677 - Bank charges 26 446 143 394 - Financial managers’ fees 953 668 669 499
1 225 967 1 047 570
Financial managers’ fees represent amounts paid to Deloitte Consulting (Pty) Ltd for accounting services.
NT AR 10-11_10.indd 224 2011/08/17 10:02 AM

Annual Financial Statements
225
Nat
iona
l Tre
asur
y A
nnua
l Rep
ort 2
010/
11
NOTES TO ThE ANNUAl FINANCIAl STATEmENTS - continued
project development facility
FOR the yeaR ended 31 maRch 2011
A TRADING ENTITY MANAGED BY THE PPP UNIT OF NATIONAL TREASURY
2010/2011 R
Restated2009/2010
R
11. RECEIVAblES
Accrued interest 83 405 283 478
Total receivables consist of interest accrued, but not yet received, from the bank due to a positive material bank balance.
The credit risk exposure of the PDF is disclosed in note 23.
12. CASh ANd CASh EQUIVAlENTS
PDF bank account 6 239 961 11 624 044 PDF - Alternative Energy 648 796 0 PDF - PPPIAF 494 0 NDPG bank account 19 816 532 47 958 430 US Grant bank account 643 860 411 571
27 349 643 59 994 045
13. REVENUE FUNd
Revenue Fund 0 1 503 940
Liability from the Revenue Fund is as a result of over recovery of the project reimbursement from the Eastern Cape
Department of Health, the funds, however, could not be repaid to the Eastern Cape Department of Health.
The process for the money to be retained by the PDF was concluded during the current financial year. The amount of
R1 503 940 was recognised as revenue in the current financial year.
14. PAyAblES
Payables 13 557 458 6 978 003 Free State Department of Health 0 300 000
13 557 458 7 278 003
The average credit period on purchases is 30 days from invoice date. No interest is charged on the trade payables. The
PDF has financial risk management policies in place to ensure that all payables are paid within the credit time frame.
The PDF received co-funding from the Free State Department of Health on the Hospitals project. This amount was
utilised on the project during the current financial period (refer to note 20 – PDF project number 21)
NT AR 10-11_10.indd 225 2011/08/17 10:02 AM
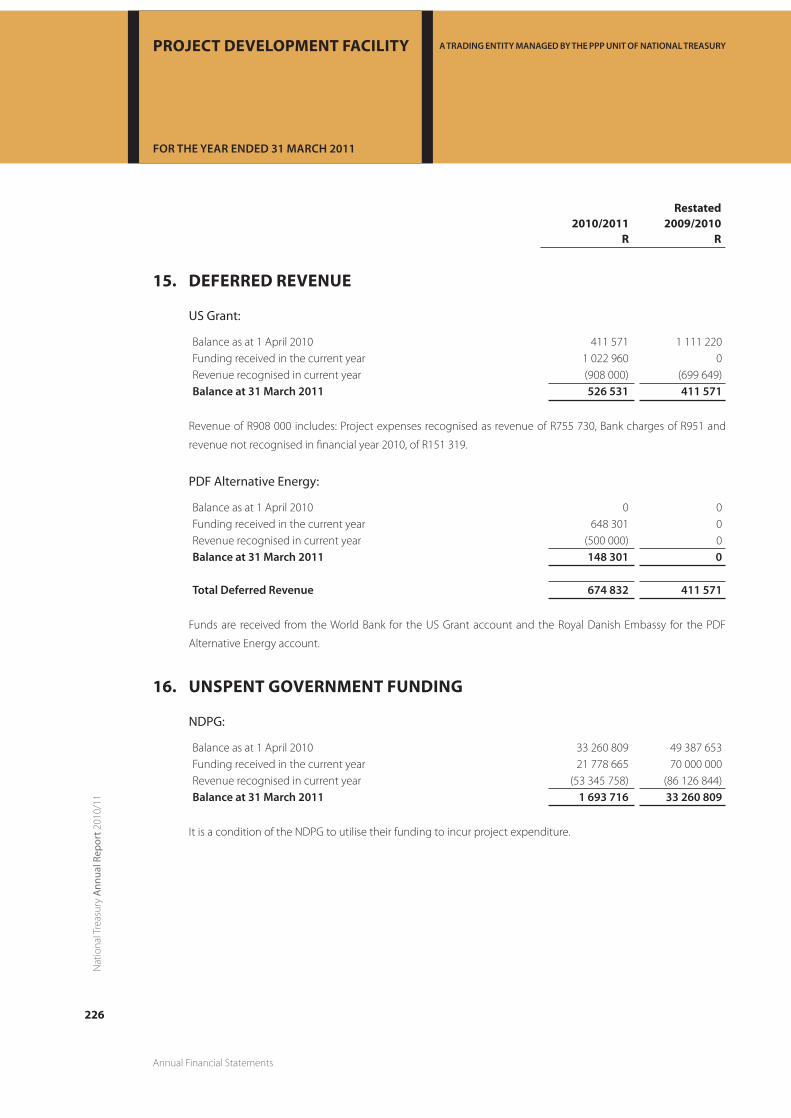
Annual Financial Statements
Nat
iona
l Tre
asur
y A
nnua
l Rep
ort 2
010/
11
226
NOTES TO ThE ANNUAl FINANCIAl STATEmENTS - continued
project development facility
FOR the yeaR ended 31 maRch 2011
A TRADING ENTITY MANAGED BY THE PPP UNIT OF NATIONAL TREASURY
2010/2011 R
Restated2009/2010
R
15. dEFERREd REVENUE
US Grant:
Balance as at 1 April 2010 411 571 1 111 220 Funding received in the current year 1 022 960 0 Revenue recognised in current year (908 000) (699 649) Balance at 31 March 2011 526 531 411 571
Revenue of R908 000 includes: Project expenses recognised as revenue of R755 730, Bank charges of R951 and
revenue not recognised in financial year 2010, of R151 319.
PDF Alternative Energy:
Balance as at 1 April 2010 0 0 Funding received in the current year 648 301 0 Revenue recognised in current year (500 000) 0 Balance at 31 March 2011 148 301 0
total Deferred revenue 674 832 411 571
Funds are received from the World Bank for the US Grant account and the Royal Danish Embassy for the PDF
Alternative Energy account.
16. UNSPENT GOVERNmENT FUNdING
NDPG:
Balance as at 1 April 2010 33 260 809 49 387 653 Funding received in the current year 21 778 665 70 000 000 Revenue recognised in current year (53 345 758) (86 126 844) Balance at 31 March 2011 1 693 716 33 260 809
It is a condition of the NDPG to utilise their funding to incur project expenditure.
NT AR 10-11_10.indd 226 2011/08/17 10:02 AM

Annual Financial Statements
227
Nat
iona
l Tre
asur
y A
nnua
l Rep
ort 2
010/
11
NOTES TO ThE ANNUAl FINANCIAl STATEmENTS - continued
project development facility
FOR the yeaR ended 31 maRch 2011
A TRADING ENTITY MANAGED BY THE PPP UNIT OF NATIONAL TREASURY
2010/2011 R
Restated2009/2010
R
17. AdJUSTmENT dUE TO PRIOR PERIOd ERRORS
The PDF previously treated the NDPG funding received from the National Treasury as an unconditional grant, i.e.
recognising revenue upon receipt of the transfer. The financial statements of 2009/10 have been restated to reflect
the conditionality of this transfer, i.e. recognising a liability to the extent that eligible project expenditure has not
been incurred.
The effect of the restatement on those financial statements is summarised below:
Decrease in opening balance Retained Earnings 614,510 Increase in Revenue / Decrease in Loss for the year 5,887,373
(33 260 809)
Increase in Unspent Government Funding (33 260 809)
Decrease in closing balance Retained Earnings (33 260 809)
18. RECONCIlIATION OF NET lOSS FOR ThE yEAR TO CASh UTIlISEd IN OPERATIONS
Net loss for the year (6 316 158) (14 618 557) Net interest income (1 846 500) (3 430 266) Operating cash flows before working capital changes (8 162 658) (18 048 823) Working capital changes: (26 328 244) (19 834 773)
- Increase/(Decrease) in payables 4 775 514 (3 068 615) - Decrease in receivables 200 073 60 335 - Increase/(Decrease) in Deferred Revenue 263 262 (699 649) - Decrease in Unspent Government Funding (31 567 093) (16 126 844)
Cash utilised in operations (34 490 902) (37 883 596)
19. INTEREST RECEIVEd
Accrued interest income at beginning of year 283 478 343 813 Net finance income received per the statement of comprehensive
income
1 646 427 3 369 931
Accrued net finance income at the end of the year (83 405) (283 478) interest income received 1 846 500 3 430 266
NT AR 10-11_10.indd 227 2011/08/17 10:02 AM

Annual Financial Statements
Nat
iona
l Tre
asur
y A
nnua
l Rep
ort 2
010/
11
228
NOTES TO ThE ANNUAl FINANCIAl STATEmENTS - continued
project development facility
FOR the yeaR ended 31 maRch 2011
A TRADING ENTITY MANAGED BY THE PPP UNIT OF NATIONAL TREASURY
2010/2011 R
Restated2009/2010
R
20. CONTINGENT lIAbIlITIES
Retained Earnings 11 507 042 17 823 200 NDPG projects 417 338 775 453 687 360 PDF projects 19 310 999 26 663 826 PDF projects – Hospital Programme 36 323 349 0
484 480 165 498 174 386
The retained earnings is retained for the funding of transaction advisors costs associated with establishment of
selected NDPG projects approved for funding during the course of the entity normal course of operations. The entity
has obtained permission from National Treasury to retain the retained earnings from the 2009/2010 financial year. The
entity is in the process of requesting permission from National Treasury to retain the 2010/2011 surplus.
Funding is disbursed upon the successful achievement of predefined milestones and Treasury Approvals. The
entity has no control over the performance / non-performance of the party they enter into agreement with, and
therefore no control over whether milestones are met and when they will be met. The project agreement is not
an irrevocable contract as a key condition for performance of the entity (i.e. payment of agreed funds) is fully
dependent upon the external party’s performance.
Management has therefore interpreted the net commitment balance (funding amount per contract less any
disbursements made to the project upon reaching the milestones) for both the PDF and NDPG projects to be a
contingent liability.
Movement on NDPG projects identified for funding during the period:
NEIGHBOURHOOD DEvELOPMENT PROJECT GRANT
# proJeCt NuMBer
proJeCt NaMe & DesCriptioN
Future remaining commitments for
the year ending 31 March 2010
positive (+) and negative
(-) funding adjustments for the year ending 31 March 2011
expenditure for the year ending 31 March 2011
Future remaining
commitments for the year
ending 31 March 2011
1 NDPG1-038Swalala Precinct Development & KwaNyamazane Renewal
5 064 244 -2 217 072 2 847 172
2 NDPG1-043Mphophomeni Multi Service Centre
6 969 - 6 969
3 NDPG1-064Nkowankowa Urban Renewal
1 417 672 1 850 000 -2 809 518 458 154
4 NDPG1-065 High Street Development 1 764 857 -960 043 804 814
NT AR 10-11_10.indd 228 2011/08/17 10:02 AM

Annual Financial Statements
229
Nat
iona
l Tre
asur
y A
nnua
l Rep
ort 2
010/
11
NOTES TO ThE ANNUAl FINANCIAl STATEmENTS - continued
project development facility
FOR the yeaR ended 31 maRch 2011
A TRADING ENTITY MANAGED BY THE PPP UNIT OF NATIONAL TREASURY
20. CONTINGENT lIAbIlITIES (CONTINUED)
# proJeCt NuMBer
proJeCt NaMe & DesCriptioN
Future remaining commitments for
the year ending 31 March 2010
positive (+) and negative
(-) funding adjustments for the year ending 31 March 2011
expenditure for the year ending 31 March 2011
Future remaining
commitments for the year
ending 31 March 2011
5 NDPG1-066
Development of Social, Economic & Community nodes & Large Area Facilities for resident townships
1 650 616 -229 702 1 420 914
6 NDPG1-067 Large area social facilities 6 392 050 - 6 392 050
7 NDPG1-068Economic & Community Node
1 096 918 - 1 096 918
8 NDPG1-069Economic & Community Node
993 994 - 993 994
9 NDPG1-070Economic & Community Node
705 833 - 705 833
10 NDPG1-071Mining belt upliftment of informal settlement & infra development
550 933 - 550 933
11 NDPG1-072Rehabilitation and Urban Renewal
971 977 -338 350 633 627
12 NDPG1-077Eyabantu Community Neighbourhood Centre
1 189 167 - 1 189 167
13 NDPG1-079 New Brighton Renewal 2 820 000 -585 937 2 234 063
14 NDPG1-092Ndwedwe Township Development
3 053 364 930 000 -280 939 3 702 425
15 NDPG1-097Sports Facility & Economic Hub
1 386 316 -1 016 624 369 692
16 NDPG1-103 Masifunde Node Initiative 847 319 -221 205 626 114
17 NDPG1-106Tsosoloso Programme (Public Spaces)
28 419 242 -4 773 138 23 646 104
18 NDPG1-107Imbali Mixed Use Investment Node
1 545 664 - 1 545 664
19 NDPG1-169KwaMashu Town Centre Redevelopment
256 720 - 256 720
20 NDPG1-171INK Urban Renewal Programme
4 998 116 -348 899 4 649 217
21 NDPG1-176Mothibistad Rural Development
800 000 -160 740 639 260
22 NDPG1-182Njoli Square Redevelopment
1 600 000 - 1 600 000
23 NDPG1-183
Motherwell Sustainable Community Development - Social Economic and Demographic Survey
726 468 - 726 468
NT AR 10-11_10.indd 229 2011/08/17 10:02 AM

Annual Financial Statements
Nat
iona
l Tre
asur
y A
nnua
l Rep
ort 2
010/
11
230
NOTES TO ThE ANNUAl FINANCIAl STATEmENTS - continued
project development facility
FOR the yeaR ended 31 maRch 2011
A TRADING ENTITY MANAGED BY THE PPP UNIT OF NATIONAL TREASURY
# proJeCt NuMBer
proJeCt NaMe & DesCriptioN
Future remaining commitments for
the year ending 31 March 2010
positive (+) and negative
(-) funding adjustments for the year ending 31 March 2011
expenditure for the year ending 31 March 2011
Future remaining
commitments for the year
ending 31 March 2011
24 NDPG1-185Transdo Economic Node Development
5 733 843 -681 523 5 052 320
25 NDPG1-189A MPCC/TSC (uPhongolo) 600 000 - 600 000 26 NDPG1-189B Highflats: MPCC/TSC 600 000 - 600 000
27 NDPG1-223Kliptown CBD renewal Parking Base
1 437 671 -1 127 892 - 309 779
28 NDPG1-226 Galeshave Urban renewal 9 341 990 -1 626 579 7 715 411
29 NDPG1-237Oude Molen & Maitland Redevelopment
2 000 000 - 2 000 000
30 NDPG1-241Zeerust MPCC/TSC/Ikageleng
1 276 919 3 799 700 -1 199 998 3 876 621
31 NDPG1-242 Bara Central Development 7 708 936 - 7 708 936 32 NDPG1-243 Orlando Ekhaya 395 514 - 395 514 33 NDPG2-024 Township Restructuring 2 720 119 -1 481 361 1 238 758 34 NDPG2-028 Helenvale 4 335 106 -1 189 531 3 145 575
35 NDPG2-029Sharpville Precinct Development and Others
- - -
36 NDPG2-030Fountain Road Development
700 807 -250 643 450 164
37 NDPG2-031Nyanga Transport Interchange
1 198 316 -300 746 897 570
38 NDPG2-032Athlone Power Station Redevelopment
2 642 204 -1 364 870 1 277 334
39 NDPG2-033 Monwabisi Coastal Node 3 000 000 - 3 000 000
40 NDPG2-034Mitchells Plain & Lentegeur CBDs
4 000 000 - 4 000 000
41 NDPG2-040Diepsloot South - Detailed design & Implementation
1 041 176 -144 624 896 552
42 NDPG2-044Zola Public Space and Nodal Planning
3 039 303 -752 714 2 286 589
43 NDPG2-045New Canada Node Station Development
4 083 461 - 4 083 461
44 NDPG2-049 Kuyasa & Other Nodes 6 988 567 -2 343 065 4 645 502
45 NDPG2-060Townships Regeneration (Rhini & Others)
2 255 915 -1 696 439 559 476
46 NDPG2-079Taxi Bus/Hub & Recreation Centre
2 135 781 5 400 000 -985 885 6 549 896
47 NDPG2-097Secondary Property Markets
2 733 560 - 2 733 560
20. CONTINGENT lIAbIlITIES (CONTINUED)
NT AR 10-11_10.indd 230 2011/08/17 10:02 AM

Annual Financial Statements
231
Nat
iona
l Tre
asur
y A
nnua
l Rep
ort 2
010/
11
NOTES TO ThE ANNUAl FINANCIAl STATEmENTS - continued
project development facility
FOR the yeaR ended 31 maRch 2011
A TRADING ENTITY MANAGED BY THE PPP UNIT OF NATIONAL TREASURY
20. CONTINGENT lIAbIlITIES (CONTINUED)
# proJeCt NuMBer
proJeCt NaMe & DesCriptioN
Future remaining commitments for
the year ending 31 March 2010
positive (+) and negative
(-) funding adjustments for the year ending 31 March 2011
expenditure for the year ending 31 March 2011
Future remaining
commitments for the year
ending 31 March 2011
48 NDPG2-102Stretford Station Precinct
3 065 908 - 3 065 908
49 NDPG2-112 Vilakazi Street Precinct 1 381 693 -52 544 1 329 149
50 NDPG2-127Umlazi Malukazi Economic Development
5 548 684 - 5 548 684
51 NDPG2-128Clermont Urban Renewal
3 857 590 -964 965 2 892 625
52 NDPG2-130Mpumalanga Town Centre Development
56 264 - 56 264
53 NDPG3-004BaPhalaborwa LM - Freedom & memorial Precinct
3 488 733 -328 016 3 160 717
54 NDPG3-005 Vogelfontein Urban Centre 5 000 000 -136 322 4 863 678 55 NDPG3-020 JBC Urban Node 3 360 000 -1 612 640 1 747 360
56 NDPG3-025Nongoma Town Regeneration & Urban Development
-326 000 1 500 000 -734 000 440 000
57 NDPG3-027Township Development of Amathole District Towns
19 886 981 -3 753 621 16 133 360
58 NDPG3-029Greater Taung regeneration Strategy
6 905 764 1 725 000 -1 396 914 7 233 850
59 NDPG3-035Township Regeneration & Investment Plan
5 000 000 - 5 000 000
60 NDPG3-040 Wembezi Urban Renewal 10 338 372 -8 000 000 -342 405 1 995 967
61 NDPG3-044KwaDukuza Priority Clusters
10 096 160 -1 133 004 8 963 156
62 NDPG3-052Sundumbili Urban Development
6 870 000 -329 147 6 540 853
63 NDPG3-053
Identification & Implementation of Appropriate Community Facilities
3 028 356 -1 627 286 1 401 070
64 NDPG3-058 Township Regeneration 24 482 471 -217 056 24 265 415 65 NDPG3-063 Development Planning 26 000 000 - 26 000 000
66 NDPG3-080Bushbuckridge Urban Municipality
12 690 791 - 12 690 791
67 NDPG3-083 Emfuleni LM 12 591 265 -1 141 811 11 449 454
68 NDPG3-084Ikageng Neighboourhood Development Programme
12 000 000 - 12 000 000
69 NDPG3-090 Thulamela Gateway 15 609 581 -776 725 14 832 856
NT AR 10-11_10.indd 231 2011/08/17 10:02 AM

Annual Financial Statements
Nat
iona
l Tre
asur
y A
nnua
l Rep
ort 2
010/
11
232
NOTES TO ThE ANNUAl FINANCIAl STATEmENTS - continued
project development facility
FOR the yeaR ended 31 maRch 2011
A TRADING ENTITY MANAGED BY THE PPP UNIT OF NATIONAL TREASURY
# proJeCt NuMBer
proJeCt NaMe & DesCriptioN
Future remaining commitments for
the year ending 31 March 2010
positive (+) and negative
(-) funding adjustments for the year ending 31 March 2011
expenditure for the year ending 31 March 2011
Future remaining
commitments for the year
ending 31 March 2011
70 NDPG3-093Polokwane Township Urban Renewal
8 578 053 2 699 249 -4 041 176 7 236 126
71 NDPG3-095 Neighbourhood Revit 9 322 920 - 9 322 920
72 NDPG4-010Imvuselelo Developing Economic Spaces
484 518 -299 754 184 764
73 NDPG4-012 Urban Nodal Development 1 198 229 -934 668 263 561
74 NDPG4-018Robertson Township Initiative
1 792 150 -48 000 1 744 150
75 NDPG4-025Metsweding Townships Regeneration Programmes
5 774 000 -1 662 109 4 111 891
76 NDPG4-029 Urban Nodal Development 1 466 917 -511 994 954 923 77 NDPG4-046 Eastern Gateway 5 700 000 - 5 700 000 78 NDPG4-069 Bitou Coming Together 5 208 519 -1 204 288 4 004 231
79 NDPG4-111Integrated Development Project
14 577 095 -231 167 14 345 928
80 NDPG4-120.1 Urban Renewal 3 684 720 - 3 684 720
81 NDPG4-120.3Leratong Intersection Commercial Development
3 600 000 - 3 600 000
82 NDPG4-127 Commercial Development 2 000 000 -652 800 1 347 200 83 NDPG4-130 Various SA 30 000 000 - 30 000 000
84 NDPG4-130.1Mothibistad Rural Development
4 000 000 - 4 000 000
85 NDPG4-130.2General Improvements of Town Centre &
5 300 000 -89 490 5 210 510
86 NDPG4-130.3Township & Town Centre Upgrade
4 000 000 - 4 000 000
87 NDPG4-130.4Rural Town Centre General Upgrades
3 000 000 - 3 000 000
88 NDPG4-130.5 Town Centre Upgrade 4 000 000 - 4 000 000 89 NDPG4-130.6 Town Centre Upgrade 2 840 000 -1 163 712 1 676 288
90 NDPG4-135.2Economic Development Node Others
8 000 000 - 8 000 000
91 PROG0-000 Programme Fees 10 000 000 -1 778 884 8 221 116 total 453 687 360 18 776 057 -55 124 642 417 338 775
The Neighbourhood Development Partnership Grant (NDPG) was announced by the Minister of Finance in his
budget speech on 15 February 2006. It is planned that an amount of R10 billion will be spent over a ten year
period. The primary focus of the grant is to stimulate and accelerate investment in poor, underserved residential
neighbourhoods such as townships by providing technical assistance and grant financing for municipal projects
that have a distinct private sector element in the project.
20. CONTINGENT lIAbIlITIES (CONTINUED)
NT AR 10-11_10.indd 232 2011/08/17 10:02 AM
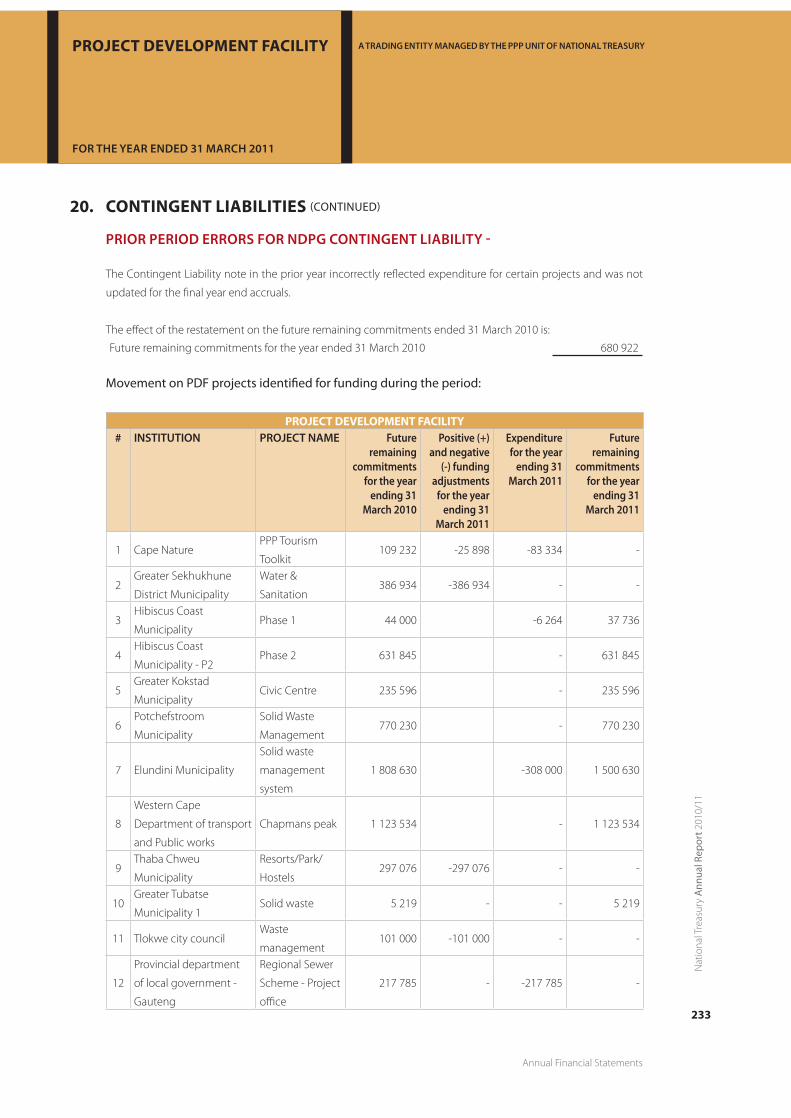
Annual Financial Statements
233
Nat
iona
l Tre
asur
y A
nnua
l Rep
ort 2
010/
11
NOTES TO ThE ANNUAl FINANCIAl STATEmENTS - continued
project development facility
FOR the yeaR ended 31 maRch 2011
A TRADING ENTITY MANAGED BY THE PPP UNIT OF NATIONAL TREASURY
20. CONTINGENT lIAbIlITIES (CONTINUED)
prior perioD errors For NDpG CoNtiNGeNt liaBility -
The Contingent Liability note in the prior year incorrectly reflected expenditure for certain projects and was not
updated for the final year end accruals.
The effect of the restatement on the future remaining commitments ended 31 March 2010 is:
Future remaining commitments for the year ended 31 March 2010 680 922
Movement on PDF projects identified for funding during the period:
PROJECT dEVElOPmENT FACIlITy# iNstitutioN proJeCt NaMe Future
remaining commitments
for the year ending 31
March 2010
positive (+) and negative
(-) funding adjustments
for the year ending 31
March 2011
expenditure for the year
ending 31 March 2011
Future remaining
commitments for the year
ending 31 March 2011
1 Cape NaturePPP Tourism
Toolkit 109 232 -25 898 -83 334 -
2Greater Sekhukhune
District Municipality
Water &
Sanitation 386 934 -386 934 - -
3Hibiscus Coast
MunicipalityPhase 1 44 000 -6 264 37 736
4Hibiscus Coast
Municipality - P2Phase 2 631 845 - 631 845
5Greater Kokstad
Municipality Civic Centre 235 596 - 235 596
6Potchefstroom
Municipality
Solid Waste
Management 770 230 - 770 230
7 Elundini Municipality
Solid waste
management
system
1 808 630 -308 000 1 500 630
8
Western Cape
Department of transport
and Public works
Chapmans peak 1 123 534 - 1 123 534
9Thaba Chweu
Municipality
Resorts/Park/
Hostels 297 076 -297 076 - -
10Greater Tubatse
Municipality 1Solid waste 5 219 - - 5 219
11 Tlokwe city council Waste
management 101 000 -101 000 - -
12
Provincial department
of local government -
Gauteng
Regional Sewer
Scheme - Project
office
217 785 - -217 785 -
NT AR 10-11_10.indd 233 2011/08/17 10:02 AM

Annual Financial Statements
Nat
iona
l Tre
asur
y A
nnua
l Rep
ort 2
010/
11
234
NOTES TO ThE ANNUAl FINANCIAl STATEmENTS - continued
project development facility
FOR the yeaR ended 31 maRch 2011
A TRADING ENTITY MANAGED BY THE PPP UNIT OF NATIONAL TREASURY
PROJECT dEVElOPmENT FACIlITy# iNstitutioN proJeCt NaMe Future
remaining commitments
for the year ending 31
March 2010
positive (+) and negative
(-) funding adjustments
for the year ending 31
March 2011
expenditure for the year
ending 31 March 2011
Future remaining
commitments for the year
ending 31 March 2011
13 EmalahleniTourism
Development 602 169 -419 609 182 560
14 Correctional services 2Fleet
management 2 000 000 -2 000 000 - -
15 LephalaleMunicipal Water
Services 500 000 500 000 -500 175 499 825
16 City of Cape town Waste Water 720 700 -391 019 329 681
17 SiyancumaTourism
Development 930 642 - -394 589 536 053
18 Eastern Cape ParksTourism
Development 1 700 000 - -320 120 1 379 880
19 Science & TechnologyRadiation
Therapy500 -500 - -
20 National Health Biovac 554 110 -554 110 - 21 FS Department of Health Hospitals 241 062 299 641 -540 703 - 22 Overstrand Municipality Waste services 201 562 - -201 562 -
23Western Cape
Department of Health 4
Tygerberg
Hospital 600 000 -600 000 - -
24Northern cape
department of Roads
Fleet
management 700 000 - 700 000
25
Eastern Cape
Department of roads
and transport
Fleet
management 1 000 000 -1 000 000 - -
26KwaDukuza Municipality
2
Waste
management 1 500 000 -9 917 -1 490 083 -
27Blue Crane
Development AgencyContract review 340 000 - -135 000 205 000
28 Thabazimbi Municipality Civic Centre 2 000 000 - -2 000 000 -
29Mogalakwena
Municipality
Olifants River
water resources 3 000 000 -3 000 000 - -
20. CONTINGENT lIAbIlITIES (CONTINUED)
NT AR 10-11_10.indd 234 2011/08/17 10:02 AM

Annual Financial Statements
235
Nat
iona
l Tre
asur
y A
nnua
l Rep
ort 2
010/
11
NOTES TO ThE ANNUAl FINANCIAl STATEmENTS - continued
project development facility
FOR the yeaR ended 31 maRch 2011
A TRADING ENTITY MANAGED BY THE PPP UNIT OF NATIONAL TREASURY
PROJECT dEVElOPmENT FACIlITy# iNstitutioN proJeCt NaMe Future
remaining commitments
for the year ending 31
March 2010
positive (+) and negative
(-) funding adjustments
for the year ending 31
March 2011
expenditure for the year
ending 31 March 2011
Future remaining
commitments for the year
ending 31 March 2011
30Greater Tubatse
Municipality 2
Water
Management
Services
1 700 000 -558 600 1 141 400
31Greater Tubatse
Municipality 3
Water Management
Services 2 000 000 -239 400 1 760 600
32 Mbombela MunicipalityFleet
management 642 000 - 642 000
33 City of JohannesburgAlternative
Waste Treatment - 1 357 000 -974 939 382 061
34 Modimolle MunicipalityAdvisory
Services - 1 000 000 -830 635 169 365
35Renosterberg
Municipality
Vanderkloof
Resort
Development
- 400 000 - 400 000
36 Witzenberg MunicipalityDennebos/Pine
Forest Resort- 500 000 - 500 000
37Dept of Econ. Dev. Env.
& Tourism
Pilgrims Rest
Revitilisation- 1 500 000 - 1 500 000
38 Ekurhuleni Municipality Social Housing - 750 000 - 750 000
39
Northern cape
department of Roads &
Public Works
Fleet
management- 780 000 - 780 000
40FS Department of
Health 2Hospitals - 1 000 000 - 1 000 000
41Dept of Local Gov &
Housing
Sedibeng
Regional Sewer
scheme
- 2 500 000 -352 215 2 147 785
total 26 663 826 3 165 315 -10 518 142 19 310 999
prior perioD errors For NDpG CoNtiNGeNt liaBility -
The Contingent Liability note in the prior year was not updated for the final year end accruals.
The effect of the restatement on the future remaining commitments ended 31 March 2010 is:
Future remaining commitments for the year ended 31 March 2010 876 446
20. CONTINGENT lIAbIlITIES (CONTINUED)
NT AR 10-11_10.indd 235 2011/08/17 10:02 AM

Annual Financial Statements
Nat
iona
l Tre
asur
y A
nnua
l Rep
ort 2
010/
11
236
NOTES TO ThE ANNUAl FINANCIAl STATEmENTS - continued
project development facility
FOR the yeaR ended 31 maRch 2011
A TRADING ENTITY MANAGED BY THE PPP UNIT OF NATIONAL TREASURY
Hospital proGraMMe
In terms of the Memorandum of Understanding signed between the National Department of Health, the PDF and
the DBSA, the PDF will be responsible for a third of the cost incurred on each project in the Hospital Programme.
The full amount of the project cost is recoverable to the PDF on project completion. These projects have started
in the current financial year and it is expected that they will be completed by 2013.
# Hospital Funds allocated
Grant / recoverable
Balance for the year ending 31
March 2010
expenditure for the year ending 31 March 2011
Balance for the year ending 31
March 20111 Chris Hani 3 700 000 Recoverable - -2 709 984 990 0162 George Mukhri 8 000 000 Recoverable - - 8 000 000 3 Limpopo Academic 9 333 333 Recoverable - - 9 333 333 4 Nelson Mandela
Academic Campus 8 000 000 Recoverable - - 8 000 000
5 KZN King Edward 8 000 000 Recoverable - - 8 000 000 6 Project Manager costs Dr
Shaker 2 000 000 Grant - - 2 000 000
total 39 033 333 - -2 709 984 36 323 349
* Funds allocated for projects number 2 to 6 are based on estimated values
21. COmmITmENTS
2010/2011 2009/2010 Payable within the next 12 months: - Financial Managers Fees 500 000 240 000
Payable between 2 and 5 years: - Financial Managers Fees - -
The entity appointed Deloitte & Touche for the outsourced financial management of the Project Development Facility.
22. RISk mANAGEmENT
The focus of risk management in the entity is on identifying, assessing, managing and monitoring all known forms
of risk across the entity. While operating risk cannot be fully eliminated, management endeavours to minimise it
by ensuring that the appropriate infrastructure, controls, systems and ethics are applied throughout the entity and
managed within predetermined procedures and constraints.
As the entity acquires finance from the National Treasury Finance Department and does not have borrowed funds
it does not have major exposure to credit, liquidity, interest and market risk.
20. CONTINGENT lIAbIlITIES (CONTINUED)
NT AR 10-11_10.indd 236 2011/08/17 10:02 AM

Annual Financial Statements
237
Nat
iona
l Tre
asur
y A
nnua
l Rep
ort 2
010/
11
NOTES TO ThE ANNUAl FINANCIAl STATEmENTS - continued
project development facility
FOR the yeaR ended 31 maRch 2011
A TRADING ENTITY MANAGED BY THE PPP UNIT OF NATIONAL TREASURY
23. CREdIT RISk
Credit risk is the risk that one party to a financial instrument will cause a financial loss for the other party by failing to meet an obligation. Credit risk arises from cash and cash equivalents, and deposits with banks and financial
institutions, as well as outstanding receivables and committed transactions. For banks and financial institutions,
only highly reputable financial institutions are used.
24. lIQUIdITy RISk
Liquidity risk is the risk that the entity will not be able to meet its financial obligations as they fall due. Ultimate responsibility for liquidity risk management rests with the National Treasury finance department, which has
built an appropriate liquidity risk management framework for the management of the National Treasury’s short,
medium and long-term funding and liquidity management requirements..
25. INTEREST RATE RISk
The entity has limited exposure to interest risk. The entity’s cash and cash equivalents are subject to interest rate
risk for the portion of interest received. The Interest rate risk is limited as funds are invested with one of the four
major banks and this is assessed annually
26. TAxATION
No provision is made for taxation, as the entity is exempt from taxation in terms of Section 10(1) (a) of the Income
Tax Act No. 58 of 1962.
27. EVENTS AFTER ThE REPORTING dATE
The financial statements have been adjusted with new information received from service providers between the
months of May and June 2011, relating to project liabilities amounting to R1.8 million outstanding at the end of
the reporting period.
The financial statements were submitted for audit on 31 May 2011, and was authorised for issue on 20 July 2011.
28. RElATEd PARTy TRANSACTIONS
The entity received grants from the following related parties:
National Treasury 24 778 665 70 000 000 Free State Department of Health - 300 000
The entity owed the following amount to related parties:
Revenue Fund - 1,503,940 24 778 665 71 803 940
NT AR 10-11_10.indd 237 2011/08/17 10:02 AM

Annual Financial Statements
Nat
iona
l Tre
asur
y A
nnua
l Rep
ort 2
010/
11
238
NOTES TO ThE ANNUAl FINANCIAl STATEmENTS - continued
project development facility
FOR the yeaR ended 31 maRch 2011
A TRADING ENTITY MANAGED BY THE PPP UNIT OF NATIONAL TREASURY
TEChNICAl ASSISTANCE UNITA TRADING ENTITY MANAGED BY THE TAU UNIT OF NATIONAL TREASURY
2010/11r
2009/10r
In 2010, the Free State Department of Health co-funded some projects and deposited R300 000 into PDF for this
reason. This amount was utilised on the project during the current financial period.
Liability from the Revenue Fund is as a result of over recovery of the project reimbursement from the Eastern Cape
Department of Health however, the funds could not be repaid to the Eastern Cape Department of Health.
The process for the money to be retained by the PDF was concluded during the current financial year. The amount
of R1 503 940 was recognised as revenue in the current financial year.
29. FRUITlESS ANd WASTEFUl ExPENdITURE
Reconciliation of fruitless and wasteful expenditure
Fruitless and wasteful expenditure relating to prior year 1 162 101 408
Fruitless and wasteful expenditure relating to current year 31 1 162
Less: Amounts condoned
Less: Amounts recovered
(1 162)
0
0
(101 408) Fruitless and wasteful expenditure awaiting condonation 31 1 162
Current 31 1 162 Capital 0 0 Transfers and Subsidies 0 0 total 31 1 162
Analysis of prior year’s fruitless and wasteful expenditure
The fruitless and wasteful expenditure for the prior year was not recovered during the current financial year.
Analysis of current year’s fruitless and wasteful expenditure
The fruitless and wasteful expenditure for the current year was incurred due to the delay in funds being allocated
to the new PDF sub accounts (PDF Alternative Energy and PPPIAF). The accounts were opened with a nil balance
and incurred monthly bank charges. The accounts went into overdraft for a period of five months, consequently
incurring interest on overdraft.
Management is taking measures to recover the current year’s fruitless and wasteful expenditure from the financial
institution.
For tHe year eNDiNG 31 MarCH 2011
NT AR 10-11_10.indd 238 2011/08/17 10:02 AM

NOTES TO ThE ANNUAl FINANCIAl STATEmENTS - continued
project development facility
FOR the yeaR ended 31 maRch 2011
A TRADING ENTITY MANAGED BY THE PPP UNIT OF NATIONAL TREASURY
TEChNICAl ASSISTANCE UNITA TRADING ENTITY MANAGED BY THE TAU UNIT OF NATIONAL TREASURY
For tHe year eNDiNG 31 MarCH 2011
ANNUAl FINANCIAl STATEmENTS
NT AR 10-11_10.indd 239 2011/08/17 10:02 AM

NOTES TO ThE ANNUAl FINANCIAl STATEmENTS - continued
Technical assisTance UniT (TaU)
FOR the yeaR ended 31 maRch 2011
A TRADING ENTITY MANAGED BY THE TAU UNIT OF NATIONAL TREASURY
CoNteNts
Report of the Auditor General ......................................................................................................................................................................................................242
Statement of Financial Position ...................................................................................................................................................................................................244
Statement of Comprehensive Income....................................................................................................................................................................................245
Statement of Changes in Equity .................................................................................................................................................................................................246
Cash Flow Statement .........................................................................................................................................................................................................................247
Accounting Policies .............................................................................................................................................................................................................................248
Notes to the Annual Financial Statements ...........................................................................................................................................................................251
For tHe year eNDeD 31 MarCH 2011
ANNUAl FINANCIAl STATEmENTS
Technical assisTance UniT (TaU)
FOR the yeaR ended 31 maRch 2011
A TRADING ENTITY MANAGED BY THE TAU UNIT OF NATIONAL TREASURY
NT AR 10-11_10.indd 240 2011/08/17 10:02 AM
Annual Financial Statements
241
Nat
iona
l Tre
asur
y A
nnua
l Rep
ort 2
010/
11
NOTES TO ThE ANNUAl FINANCIAl STATEmENTS - continued
Technical assisTance UniT (TaU)
FOR the yeaR ended 31 maRch 2011
A TRADING ENTITY MANAGED BY THE TAU UNIT OF NATIONAL TREASURY
For tHe year eNDeD 31 MarCH 2011
REPORT OF ThE AUdITOR-GENERAl TO PARlIAmENT ON ThE
TEChNICAl ASSISTANCE UNIT (TAU)
NT AR 10-11_10.indd 241 2011/08/17 10:02 AM

Annual Financial Statements
Nat
iona
l Tre
asur
y A
nnua
l Rep
ort 2
010/
11
242
Technical assisTance UniT (TaU)
FOR the yeaR ended 31 maRch 2011
A TRADING ENTITY MANAGED BY THE TAU UNIT OF NATIONAL TREASURY
REPORT OF ThE AUdITOR-GENERAl TO PARlIAmENT ON ThE TEChNICAl ASSISTANCE UNIT
REPORT ON ThE FINANCIAl STATEmENTS
iNtroDuCtioN
1. I have audited the accompanying financial statements of the Technical Assistance Unit, which comprise the statement
of financial position as at 31 March 2011, and the statement of comprehensive income, statement of changes in
equity and cash flow statement for the year then ended, and a summary of significant accounting policies and other
explanatory information, as set out on pages 244 to 259.
aCCouNtiNG oFFiCer’s respoNsiBility For tHe FiNaNCial stateMeNts
2. The accounting officer is responsible for the preparation and fair presentation of these financial statements in
accordance with South African Statements of Generally Accepted Accounting Practice (SA Statements of GAAP) and
the requirements of the Public Finance Management Act of South Africa, 1999 (Act No. 1 of 1999) (PFMA), and for such
internal control as management determines necessary to enable the preparation of financial statements that are free
from material misstatement, whether due to fraud or error.
auDitor-GeNeral’s respoNsiBility
3. As required by section 188 of the Constitution of the Republic of South Africa, 1996 (Act No. 108 of 1996) and, section
4 of the Public Audit Act of South Africa, 2004 (Act No. 25 of 2004) (PAA), my responsibility is to express an opinion on
these financial statements based on my audit.
4. I conducted my audit in accordance with International Standards on Auditing and General Notice 1111 of 2010 issued
in Government Gazette 33872 of 15 December 2010. Those standards require that I comply with ethical requirements
and plan and perform the audit to obtain reasonable assurance about whether the financial statements are free from
material misstatement.
5. An audit involves performing procedures to obtain audit evidence about the amounts and disclosures in the financial statements.
The procedures selected depend on the auditor’s judgement, including the assessment of the risks of material misstatement
of the financial statements, whether due to fraud or error. In making those risk assessments, the auditor considers internal
control relevant to the entity’s preparation and fair presentation of the financial statements in order to design audit procedures
that are appropriate in the circumstances, but not for the purpose of expressing an opinion on the effectiveness of the entity’s
internal control. An audit also includes evaluating the appropriateness of accounting policies used and the reasonableness of
accounting estimates made by management, as well as evaluating the overall presentation of the financial statements.
6. I believe that the audit evidence I have obtained is sufficient and appropriate to provide a basis for my audit opinion.
opiNioN
7. In my opinion, the financial statements present fairly, in all material respects, the financial position of the Technical
Assistance Unit as at 31 March 2011, and its financial performance and cash flows for the year then ended in accordance
with SA Statements of GAAP and the requirements of the PFMA
NT AR 10-11_10.indd 242 2011/08/17 10:02 AM

Annual Financial Statements
243
Nat
iona
l Tre
asur
y A
nnua
l Rep
ort 2
010/
11
REPORT OF ThE AUdITOR-GENERAl TO PARlIAmENT ON ThE TEChNICAl ASSISTANCE UNIT - cont
Technical assisTance UniT (TaU)
FOR the yeaR ended 31 maRch 2011
A TRADING ENTITY MANAGED BY THE TAU UNIT OF NATIONAL TREASURY
REPORT ON OThER lEGAl ANd REGUlATORy REQUIREmENTS
8. In accordance with the PAA and in terms of General Notice 1111 of 2010, issued in Government Gazette 33872 of
15 December 2010, I include below my findings on the annual performance report as set out on pages 17 to 97 and
material non-compliance with laws and regulations applicable to the Technical Assistance Unit.
preDeterMiNeD oBJeCtives
9. There were no material findings on the annual performance report concerning the presentation, usefulness and
reliability of the information.
CoMpliaNCe witH laws aND reGulatioNs
Strategic planning and performance management
10. The accounting officer did not prepare adequate quarterly reports on the progress made in achieving measurable
objectives and targets were as required by Treasury Regulation (TR) 5.3.1.
Annual financial statements, performance and annual report
11. The accounting officer did not submit the annual performance report in time as required by Part C of General Notice
1111 of 2010, issued in Government Gazette No. 33872 of 15 December 2010.
INTERNAl CONTROl
12. In accordance with the PAA and in terms of General Notice 1111 of 2010, issued in Government Gazette 33872
of 15 December 2010, I considered internal control relevant to my audit, but not for the purpose of expressing an
opinion on the effectiveness of internal control. The matters reported below are limited to the significant deficiencies
that resulted on the findings on compliance with laws and regulations included in this report.
leaDersHip
Oversight responsibility regarding reporting and compliance
13. Management did not adhere to the internal policies and procedures and as a result there were instances of non-
compliance with the PFMA and TR.
Pretoria
31 July 2011
NT AR 10-11_10.indd 243 2011/08/17 10:02 AM

Annual Financial Statements
Nat
iona
l Tre
asur
y A
nnua
l Rep
ort 2
010/
11
244
Technical assisTance UniT (TaU) A TRADING ENTITY MANAGED BY THE TAU UNIT OF NATIONAL TREASURY
as at 31 march 2011
STATEmENT OF FINANCIAl POSITION
Notes 2011r
2010r
assets
Current assetsReceivables 4 6,230,711 14,553,548Cash and cash equivalents 5 49,337,310 7,391,915
total assets 55,568,021 21,945,463
equity aND liaBilities
equityAccumulated surplus 19,900,049 16,172,033
liaBilitiesCurrent liabilitiesTrade and other payables 6 35,667,972 5,773,430
equity and liabilities 55,568,021 21,945,463
NT AR 10-11_10.indd 244 2011/08/17 10:02 AM

Annual Financial Statements
245
Nat
iona
l Tre
asur
y A
nnua
l Rep
ort 2
010/
11
STATEmENT OF COmPREhENSIVE INCOmE
Technical assisTance UniT (TaU)
FOR the yeaR ended 31 maRch 2011
A TRADING ENTITY MANAGED BY THE TAU UNIT OF NATIONAL TREASURY
Notes 2011r
2010r
Revenue 2 84,859,935 55,664,284
Operating expenditure 2 (82,772,242) (48,052,592)
Operating Profit 2,087,693 7,611,692
Interest income 1,640,323 930,779
total comprehensive income for the year 3,728,016 8,542,471
NT AR 10-11_10.indd 245 2011/08/17 10:02 AM

Annual Financial Statements
Nat
iona
l Tre
asur
y A
nnua
l Rep
ort 2
010/
11
246
Technical assisTance UniT (TaU)
FOR the yeaR ended 31 maRch 2011
A TRADING ENTITY MANAGED BY THE TAU UNIT OF NATIONAL TREASURY
STATEmENT OF ChANGES IN EQUITy
accumulated surplus
r
Balance at 1 April 2009 7,629,562
Comprehensive income for the year 8,542,471
Balance at 31 March 2010 16,172,033
Comprehensive income for the year 3,728,016
Balance at 31 March 2011 19,900,049
NT AR 10-11_10.indd 246 2011/08/17 10:02 AM

Annual Financial Statements
247
Nat
iona
l Tre
asur
y A
nnua
l Rep
ort 2
010/
11
CASh FlOW STATEmENT
Technical assisTance UniT (TaU)
FOR the yeaR ended 31 maRch 2011
A TRADING ENTITY MANAGED BY THE TAU UNIT OF NATIONAL TREASURY
Notes 2011r
2010r
CasH Flows FroM operatiNG aCtivities
Cash received from government and other sources 92,844,983 44,710,682
Cash paid to suppliers (52,539,911) (49,647,064)
Cash generated from operations 7 40,305,072 (4,936,382)
Interest Income 1,640,323 930,779
Net cash generated from operating activities 41,945,395 (4,005,603)
Net iNCrease / (DeCrease) iN CasH aND CasH equivaleNts 41,945,395 (4,005,603)
Cash at the beginning of the year 7,391,915 11,397,518
total CasH at eND oF tHe year 5 49,337,310 7,391,915
NT AR 10-11_10.indd 247 2011/08/17 10:02 AM

Annual Financial Statements
Nat
iona
l Tre
asur
y A
nnua
l Rep
ort 2
010/
11
248
Technical assisTance UniT (TaU)
FOR the yeaR ended 31 maRch 2011
A TRADING ENTITY MANAGED BY THE TAU UNIT OF NATIONAL TREASURY
ACCOUNTING POlICIES
1 bASIS OF PRESENTATION
These Annual Financial Statements are presented in South African Rand. They are prepared on the historical cost basis,
unless where indicated otherwise.
The accounting policies have been applied to the results, assets, liabilities and cash flow of the Trading Entity in the
Annual Financial Statements, consistent with those in the previous year.
The Annual Financial Statements have been prepared in accordance with South African Statements of Generally
Accepted Accounting Practices (SA GAAP).
1.1 FiNaNCial assets aND liaBilities
Financial assets and financial liabilities have not been offset in the Statement of Financial Position.
1.1.1 Initial recognition and measurement
Financial instruments are classified, on initial recognition as a financial asset, a financial liability or an equity instrument
in accordance with the substance of the contractual arrangement and are initially measured at fair value.
1.1.2 Receivables
Trade receivables are subsequently carried at amortised cost. Amortised cost refers to the initial carrying amount, less
repayments and impairments. An estimate is made for doubtful receivables based on a review of all outstanding amounts
at year-end. Significant financial difficulties of the debtor, probability that the debtor will enter financial re-organisation,
and default or delinquency in payments (more than 120 days overdue) are considered indicators that the trade receivable
is impaired. Impairments are determined by discounting expected future cash flows to their present value.
The amount of the loss due to impairment, or the reversal of an impairment loss is recognised in the Statement of
Comprehensive Income within operating expenses. When a trade receivable is uncollectible, it is written off. Subsequent
recoveries of amounts previously written off will be recognised as revenue in the Statement of Comprehensive Income.
1.1.3 Trade and other payables
Trade payables and other payables which consist of revenue received in advance are stated at amortised cost,
which, due to short term nature, closely approximate their fair value.
1.1.4 Cash
Cash and cash equivalents are stated at amortised cost, which, due to their short term nature, closely approximate
their fair value. Cash and cash equivalents comprise cash at bank and deposits held on call with banks.
NT AR 10-11_10.indd 248 2011/08/17 10:02 AM

Annual Financial Statements
249
Nat
iona
l Tre
asur
y A
nnua
l Rep
ort 2
010/
11
ACCOUNTING POlICIES - continued
Technical assisTance UniT (TaU)
FOR the yeaR ended 31 maRch 2011
A TRADING ENTITY MANAGED BY THE TAU UNIT OF NATIONAL TREASURY
1.2 reveNue
Revenue is measured at the fair value of the consideration received or receivable.
1.2.1 Appropriated funds
Appropriated and adjusted appropriated funds are recognised when the funds can be measured reliable on the
date the appropriation becomes effective. Appropriated funds are recognised as revenue to the extent that there
is no further obligation arising from the receipt of the transfer payment.
1.2.2 Donor funds
Donor funds are recognised when the funds can be measured reliable on the date the draw down requisition
becomes effective and the cost associated with the revenue has been incurred.
1.2.3 Cost Recovery
Revenue for services rendered is recognised when the amount of revenue can be measured reliable. It is probable
that the economic benefits associated with the services will flow to the entity. The stage of completion of the
transaction at the end of the reporting period can be measured reliably and the cost incurred for the transaction
and the cost to complete the transaction can be measured reliable.
1.2.4 Interest Income
Interest income accrues on a time-proportioned basis, taking into account the principal amount outstanding and
the effective interest rate over the period to maturity.
1.3 irreGular aND Fruitless aND wasteFul expeNDiture
Irregular expenditure means expenditure incurred in contravention of, or not in accordance with, a requirement
of any applicable legislation, including the PFMA. Fruitless and wasteful expenditure means expenditure that
was made in vain and could have been avoided had reasonable care been exercised. In accordance with the
requirements of the PFMA, the details are included in a note to the financial statements. Any irregular, fruitless and
wasteful expenditure is charged against the respective class of expenses in the period in which it occurred.
1.4 relateD parties
The Technical Assistance Unit Trading Entity operates in an economic environment currently dominated by
entities directly or indirectly owned by the South African government. All national departments of government
and state-controlled entities are regarded as related parties in accordance with Circular 4 of 2005: Guidance on the
term “state-controlled entities” in context of IAS 24 (AC 126) - Related Parties, issued by the South African Institute
of Chartered Accountants.
NT AR 10-11_10.indd 249 2011/08/17 10:02 AM

Annual Financial Statements
Nat
iona
l Tre
asur
y A
nnua
l Rep
ort 2
010/
11
250
ACCOUNTING POlICIES - continued
Technical assisTance UniT (TaU)
FOR the yeaR ended 31 maRch 2011
A TRADING ENTITY MANAGED BY THE TAU UNIT OF NATIONAL TREASURY
1.5 siGNiFiCaNt JuDGMeNts, estiMates aND assuMptioNs
The preparation of annual financial statements requires management to make judgment, estimates and assumptions
that affect the application of policies and reported amounts of assets and liabilities, revenue and expenses.
Estimates are made based on the best available information at the time of preparation of the Annual Financial
Statements. The estimates and under-lying assumptions are reviewed on an ongoing basis. Revisions to accounting
estimates are recognised in the period in which the estimate is revised if the revision affects only that period or in
the period of the revision on future periods if the revision affects both current and future periods.
NT AR 10-11_10.indd 250 2011/08/17 10:02 AM

Annual Financial Statements
251
Nat
iona
l Tre
asur
y A
nnua
l Rep
ort 2
010/
11
NOTES TO ThE ANNUAl FINANCIAl STATEmENTS
Technical assisTance UniT (TaU)
FOR the yeaR ended 31 maRch 2011
A TRADING ENTITY MANAGED BY THE TAU UNIT OF NATIONAL TREASURY
2011r
2010r
2 OPERATING PROFIT
Operating surplus is arrived at after taking the following into account
Revenue from:
- Government grants received 19,363,000 18,898,000- Donor grants received 15,269,270 22,453,205- Cost recovery 50,227,665 14,313,079
84,859,935 55,664,284
Expenditure for:- Audit fees (265,869) (246,875)- Movement in the Provision for impairment of Trade receivables - Recognised (300,000) (661,160) - Reversed 661,160 -- Bank charges (12,125) (5,841)- Consultancy fees (82,855,408) (47,137,911)- Staff training - (805)Operating Surplus 2,087,693 7,611,692
The movement in the provision for impairment is made up of a loss recognised of R300,000 outstanding from the
Department of Oceans and Tourism which has been outstanding for longer than 120 days as well as a reversal of
a loss previously recognised where the outstanding monies have subsequently been received.
3. TAxATION
No provision has been made for taxation as the Trading Entity is exempt from income tax in terms of section 10(1)(cA) of the Income Tax Act, 1962 (Act No 58 of 1962). As per agreement with the donor all VAT on services paid with donor funds will be refundable by SARS.
NT AR 10-11_10.indd 251 2011/08/17 10:02 AM

Annual Financial Statements
Nat
iona
l Tre
asur
y A
nnua
l Rep
ort 2
010/
11
252
NOTES TO ThE ANNUAl FINANCIAl STATEmENTS - continued
Technical assisTance UniT (TaU)
FOR the yeaR ended 31 maRch 2011
A TRADING ENTITY MANAGED BY THE TAU UNIT OF NATIONAL TREASURY
2011r
2010r
4. RECEIVAblES
Gross trade receivables 5,400,823 13,385,871Less: Provision for impairment of trade receivables (300,000) (661,160)SARS – VAT 1,129,888 1,828,837
6,230,711 14,553,548
Movement for the provision of impairment of trade receivables is as
follows:
Balance at the beginning of the year 661,160 -Reversed against profit and loss (661,160) -Charged to profit and loss 300,000 661,160Balance at the end of the year 300,000 661,160
Ageing of impaired accounts receivable: 0 – 30 days - - 31 – 60 days - - 61 – 90 days - - 91 – 120 days - - 120 days + 300,000 661,160total 300,000 661,160
At 31 March 2011 receivable amounting to R Nil (2010: R228,686) was
past due but not impaired. This relates to customers who have no recent
history of defaulting.
The period by which these debtors exceed their payment terms is shown
below: 0 – 30 days - - 31 – 60 days - - 61 – 90 days - - 91 – 120 days - 228,686 120 days + - -total - 228,686
NT AR 10-11_10.indd 252 2011/08/17 10:02 AM

Annual Financial Statements
253
Nat
iona
l Tre
asur
y A
nnua
l Rep
ort 2
010/
11
NOTES TO ThE ANNUAl FINANCIAl STATEmENTS - continued
Technical assisTance UniT (TaU)
FOR the yeaR ended 31 maRch 2011
A TRADING ENTITY MANAGED BY THE TAU UNIT OF NATIONAL TREASURY
2011r
2010r
4. RECEIVAblES (CONTINUED)
The ageing of these receivables are shown below: 0 – 30 days - - 31 – 60 days - - 61 – 90 days - - 91 – 120 days - - 120 days + - 228,686total - 228,686
Credit quality of trade receivables
The credit quality of trade receivables that are neither past due nor impaired can be assessed by reference to
counterparty default rates.
Fair value of trade receivables
The net carrying values of receivables are considered to be a close approximation of their fair values.
See note 8 on risk management in relation to the financial assets listed below.
trade receivables
The carrying amount of trade receivables approximates their fair value. There is no foreign currency exposure at
the reporting date.
5. CASh
Cash and cash equivalents consists of :
Cash at bank 2,000 2,701Call account 49,335,310 7,389,214Financial assets 49,337,310 7,391,915
NT AR 10-11_10.indd 253 2011/08/17 10:02 AM

Annual Financial Statements
Nat
iona
l Tre
asur
y A
nnua
l Rep
ort 2
010/
11
254
NOTES TO ThE ANNUAl FINANCIAl STATEmENTS - continued
Technical assisTance UniT (TaU)
FOR the yeaR ended 31 maRch 2011
A TRADING ENTITY MANAGED BY THE TAU UNIT OF NATIONAL TREASURY
2011r
2010r
6. TRAdE ANd OThER PAyAblES FROm ExChANGE TRANSACTIONS
Trade payables 14,477,765 4,273,430Revenue received in advance 21,190,207 1,500,000
35,667,972 5,773,430
Creditors and accruals principally comprise amounts outstanding for
service providers’ services utilised and ongoing costs.
The average credit period taken is less than 30 days. The Trading Entity
considers that the carrying amount of trade and other payables at cost
closely approximates their fair value.
Revenue received in advance consists of cost recovery monies received
and services not rendered yet.
See note 8 on risk management in relation to the financial liabilities listed
above.
7. CASh GENERATEd FROm OPERATIONS
Surplus for the year 3,728,016 8,542,471
adjustments for: (2,001,483) (269,619)
Movement in the Provision for impairment of Trade receivables (361,160) 661,160Interest income (1,640,323) (930,779)
Changes in working capitalTrade and other receivables 8,683,997 (12,782,439)Trade and other payables 29,894,542 (426,795)
40,305,072 (4,936,382)
NT AR 10-11_10.indd 254 2011/08/17 10:02 AM
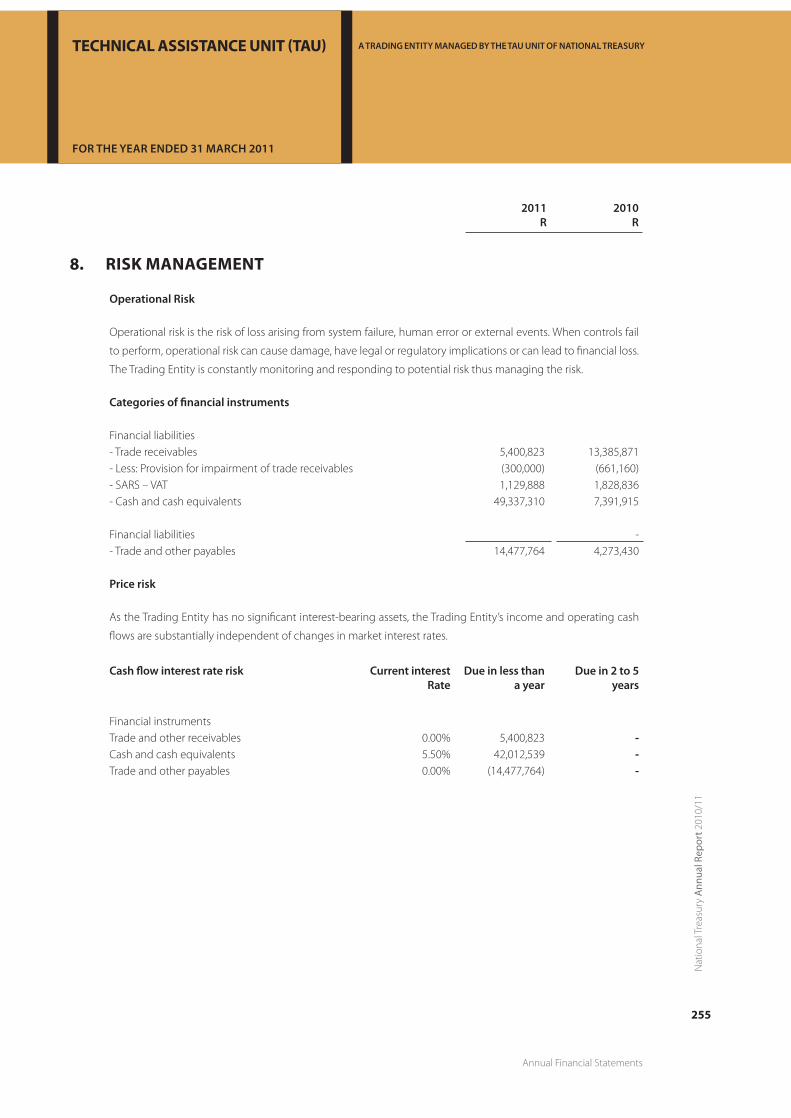
Annual Financial Statements
255
Nat
iona
l Tre
asur
y A
nnua
l Rep
ort 2
010/
11
NOTES TO ThE ANNUAl FINANCIAl STATEmENTS - continued
Technical assisTance UniT (TaU)
FOR the yeaR ended 31 maRch 2011
A TRADING ENTITY MANAGED BY THE TAU UNIT OF NATIONAL TREASURY
2011r
2010r
8. RISk mANAGEmENT
operational risk
Operational risk is the risk of loss arising from system failure, human error or external events. When controls fail
to perform, operational risk can cause damage, have legal or regulatory implications or can lead to financial loss.
The Trading Entity is constantly monitoring and responding to potential risk thus managing the risk.
Categories of financial instruments
Financial liabilities- Trade receivables 5,400,823 13,385,871- Less: Provision for impairment of trade receivables (300,000) (661,160)- SARS – VAT 1,129,888 1,828,836- Cash and cash equivalents 49,337,310 7,391,915
Financial liabilities -- Trade and other payables 14,477,764 4,273,430
price risk
As the Trading Entity has no significant interest-bearing assets, the Trading Entity’s income and operating cash
flows are substantially independent of changes in market interest rates.
Cash flow interest rate risk Current interest rate
Due in less than a year
Due in 2 to 5 years
Financial instrumentsTrade and other receivables 0.00% 5,400,823 -Cash and cash equivalents 5.50% 42,012,539 -Trade and other payables 0.00% (14,477,764) -
NT AR 10-11_10.indd 255 2011/08/17 10:02 AM

Annual Financial Statements
Nat
iona
l Tre
asur
y A
nnua
l Rep
ort 2
010/
11
256
NOTES TO ThE ANNUAl FINANCIAl STATEmENTS - continued
Technical assisTance UniT (TaU)
FOR the yeaR ended 31 maRch 2011
A TRADING ENTITY MANAGED BY THE TAU UNIT OF NATIONAL TREASURY
2011r
2010r
8. RISk mANAGEmENT (CONTINUED)
interest rate risk
This risk is the potential financial loss as a result of adverse movement in interest rates that affects the value of
bank balances. Nominal interest rate can be split into real interest rate risk and inflation risk. Interest rate risk is
managed by investing funds in highly liquid call accounts, at reputable financial institutions, earning market
related interest.
Market risk
No significant fluctuations in the market occurred during the year that affected the Trading Entity.
Credit risk
Financial assets, which potentially subject the TAU Trading Entity to the risk of non-performance by counter
parties, consist mainly of cash and trade receivables.
The Trading Entity limits its treasury counter-part exposure by only dealing with well-established financial
institutions approved by the National Treasury.
Trade receivables consist of other government departments.
liquidity risk
The Trading Entity manages liquidity risk through proper management
of working capital and proper cash flow projections.
9. CONTINGENCIES
In terms of the PFMA, all surplus funds as at the reporting date may be forfeited to National Treasury. A request
for the retention of surplus funds to the value of R 3 728 016 resulting from operations during the financial year
ended 31 March 2011 to National Treasury will be made.
NT AR 10-11_10.indd 256 2011/08/17 10:02 AM

Annual Financial Statements
257
Nat
iona
l Tre
asur
y A
nnua
l Rep
ort 2
010/
11
NOTES TO ThE ANNUAl FINANCIAl STATEmENTS - continued
Technical assisTance UniT (TaU)
FOR the yeaR ended 31 maRch 2011
A TRADING ENTITY MANAGED BY THE TAU UNIT OF NATIONAL TREASURY
2011r
2010r
10. COmmITmENTS
10.1 proJeCt CoMMitMeNts
Current commitments will be funded from this years’ surplus of R 3,728,016 as well as future government grants,
cost recovery and donor funds.
10.2 operatiNG CoMMitMeNts
Payable within the next 12 months
- Contractual commitments 145,405,872 29,837,811
Payable after 12 months but before 60 months
- Contractual commitments 71,515,953 5,534,776
Payable after 60 months Nil Nil
11. mATERIAl lOSSES ThROUGh CRImINAl CONdUCT, IRREGUlAR, FRUITlESS ANd WASTEFUl ExPENdITURE
To the best of our knowledge, no material losses through criminal conduct or irregular, fruitless and wasteful
expenditure were incurred during the year ended 31 March 2011.
12. GOING CONCERN
The annual financial statements have been prepared on the basis of accounting policies applicable to a going
concern. This basis presumes that funds will be available to finance future operations and that the realisation of
assets and settlement of liabilities, contingent obligations and commitments will occur in the ordinary course
of business.
13. EVENTS AFTER ThE REPORTING dATE
The Accounting Authority is not aware of any matter or circumstance, arising since the end of the financial year
to the date of this report in respect of matters which could require adjustments to, or disclosure in, the annual
financial statements.
NT AR 10-11_10.indd 257 2011/08/17 10:02 AM

Annual Financial Statements
Nat
iona
l Tre
asur
y A
nnua
l Rep
ort 2
010/
11
258
NOTES TO ThE ANNUAl FINANCIAl STATEmENTS - continued
Technical assisTance UniT (TaU)
FOR the yeaR ended 31 maRch 2011
A TRADING ENTITY MANAGED BY THE TAU UNIT OF NATIONAL TREASURY
2011r
2010r
14. RElATEd PARTIES
amounts included in trade receivables regarding related parties
Department of Correctional Services 80,000 -North West Provincial Treasury 2,770,601 -Office of the Chief Justice 1,980,000 -Department of Environment and Tourism 570,222 300,000Office of the Premier - 228,606Reconstruction and Development Programme Fund - 12,196,105The Presidency - 399,360SASSA - 661,160
related - party transactions
The following transactions were carried out with related parties:
services provided to related parties
Council of Medical Schemes 163,020 -Department of Co-operative Governance & Traditional Affairs 1,500,000 -Department of Correctional Services 800,000 -Department of Defense and Military Veterans 321,681 378,319Department of Environment and Tourism 270,222 300,000Department of Home Affairs 136,000 -Department of Labour - 206,801Department of Local Government and Traditional Affairs - 4,766,664Department of Local Government and Housing - 319,733Department of Public Service Administration 196,656 900,000Department of Transport 435,000 -Financial Intelligence Centre 573,000 1,045,500National Department of Health 271,807 -National Department of Sports and Recreation 766,194 139,216National Treasury 38,216,559 4,060,018North West Provincial Treasury 2,770,601 -Office of the Chief Justice 1,980,000 -Office of the Municipal Manager - 375,667Office of the Premier - 228,606SALGA 228,902 -SANPARKS 60,000 -Treasury – Limpopo - 1,568,100The Agricultural Research Council - 69,283The Presidency 325,020 -
services provided by related parties
National Treasury 19,363,000 18,898,000
NT AR 10-11_10.indd 258 2011/08/17 10:02 AM

Annual Financial Statements
259
Nat
iona
l Tre
asur
y A
nnua
l Rep
ort 2
010/
11
NOTES TO ThE ANNUAl FINANCIAl STATEmENTS - continued
Technical assisTance UniT (TaU)
FOR the yeaR ended 31 maRch 2011
A TRADING ENTITY MANAGED BY THE TAU UNIT OF NATIONAL TREASURY
15. NEW ACCOUNTING PRONOUNCEmENTS
At the date of authorization of these financial statements, various standards and Interpretations are issued which
are not yet effective. These include the following Standards and Interpretations which are applicable to the
Trading Entity
standard Details of amendment Effective
IFRS 7 – Financial Instruments:
Disclosure
-Amendment clarifies the intended interaction
between qualitative and quantitative
disclosures of the nature and extent of risks
arising from financial instruments and removed
some disclosure items which were seen to be
superfluous or misleading
1 January 2011
-Amendments require additional disclosure
on transfer transactions of financial assets,
including the possible effects of any residual
risks that the transferring entity retains. The
amendments also require additional disclosures
if a disproportionate amount of transfer
transactions are undertaken around the end of
a reporting period.
1 July 2011
IFRS 9 Financial Instruments
-New standard that forms the first part of a
three-part project to replace IAS 39 Financial
Instruments: Recognition and Measurement
1 January 2013
IAS 1 – Presentation of Financial
Statements
-Current/non-current classification of
convertible instruments1 January 2010
-Clarification of statement of changes in equity 1 January 2011
IAS 7 – Statement of Cash Flows-Classification of expenditures on unrecognized
assets1 January 2010
IAS 10 – Events after the Reporting
Period
-Amendment resulting from the issue of IFRIC
171 July 2009
IAS 24 Related Party Disclosures
-Simplification of the disclosure requirements
for government-related entities. 1 January 2011
-Clarification of the definition of a related party 1 January 2011
The impact that these Standards and Interpretations may have on the financial statements of the entity has not
been assessed.
NT AR 10-11_10.indd 259 2011/08/17 10:02 AM

Nat
iona
l Tre
asur
y A
nnua
l Rep
ort 2
010/
11
260
Human Resource Report
hUmAN RESOURCE REPORT - continued
hUmAN RESOURCE REPORT
NT AR 10-11_10.indd 260 2011/08/17 10:02 AM

261
Nat
iona
l Tre
asur
y A
nnua
l Rep
ort 2
010/
11
Human Resource Report
hUmAN RESOURCE REPORT
1. SERVICE dElIVERy
orGaNisatioNal eNviroNMeNt
The National Treasury’s human resources-business partnership model yielded positive results and contributed to an
increase in adherence to performance management principles. Further, the department now has a targeted Leadership
Development Programme for senior managers which encourages stimulating and rigorous discourse within in the
organization while strengthening leadership ability. The strategy also focuses on improved retention, development and
ensuring that the department relies on a capable workforce. Various other policies and systems were also upgraded
during the period under review. Notably, a departmental Enterprise Risk Management strategy in line with the Public
Sector Risk Management Framework was implemented. Adherence to the framework continues to be monitored by
management and the Audit and Risk Management Committees.
FiNaNCial MaNaGeMeNt reForMs
While South Africa exited the recession quicker than most countries financing government programmes remains under
pressure. aAs such budget reforms continue to place value for money high on the agenda of public spending reform. This
is critical in ensuring that scarce resources are allocated in line with the MTSF priorities and identified outcomes.
The financial management systems (BAS, PERSAL, LOGIS and Vulindlela) continued to operate optimally. Over the
MTEF there will be a continued improvements and integration of government’s financial management systems. Efforts
are underway to complete the design and rollout of a standardised chart of accounts for local government. This will
significantly improve transparency of financial management in local government.
The National Treasury continues to invest in building the needed capacity of financial practitioners in national and
provincial government. Interventions again included the Chartered Accountants Academy (CAA) and Standard Chart of
Accounts (SCOA) and risk management training programmes.
eCoNoMiC poliCy
The economic policy environment produces research, provide policy analysis, data assessment, and forecasting in support
of the National Treasury’s needs in the areas of budgeting, macroeconomic policy and factors influencing economic
growth. Working on economic policies that translate to an improved growth trajectory for the country and faster job
creation remains our key area of work.. Studies conducted include estimating the economic impact of National Health
Insurance, developing climate change economic modelling capacity and analysis of the effect of carbon taxes, and
modelling on employment scenarios.
The National Treasury interacts regularly with the markets to assess sentiment and consider changes to risk premia,
exchange rate conditions and bond prices.
NT AR 10-11_10.indd 261 2011/08/17 10:02 AM

Nat
iona
l Tre
asur
y A
nnua
l Rep
ort 2
010/
11
262
Human Resource Report
hUmAN RESOURCE REPORT - continued
tax aND FiNaNCial seCtor poliCy
Climate change is a global concern and South Africa in particular plays an active and important role in the climate change
discourse. A discussion paper titled “Reducing Greenhouse Emissions: The Carbon Tax Option” was finalised and published
in December 2010 for public comments. The document discusses options for the introduction of a carbon tax and as such
seeks to reflect the external costs of greenhouse gas emissions causing climate change.
The Mineral and Petroleum Royalty Act was implemented on 01 April 2010 and is a new revenue source for the fiscus.
At the core of economy lies the financial services sector, as an important step the National Treasury published a document
“A safer financial sector to serve South Africa better” which mainly proposes emphasis on financial stability, consumer
protection and financial inclusion.
BuDGet oFFiCe
Over the reporting period the office continued to ensure that the effects of the recession were addressed in a manner that
does not disadvantage the poor. Spending continued to increase especially in programmes that have a direct impact on
the lives of the most vulnerable in society.
Particular focus was on revising the budgeting process such that it is aligned with the outcomes approach. The new
functional approach focuses on the purpose for which funds are to be used, and groups together national, provincial and
local government, and government agencies, in terms of the function of government they perform.
puBliC FiNaNCe
The division worked on several health financing initiatives particularly on National Health Insurance and supported
development of new tax dispensation around medical expenses; Work on the new health component of equitable share
formula was completed and implemented in Budget 2011/12.
The division also advised and supported the Department of Public Work’s Expanded Public Works Programme unit in
the design of a new EPWP social sector incentive grant, including its funding model, and monitored and advised on the
implementation of the environment and culture sector incentive model.
iNterGoverNMeNtal relatioNs
The division worked to ensure that the 2011 Division of Revenue Act was refined to align planning and reporting
requirements with provincial and local government fiscal reforms. This included the revision of the provincial and local
government equitable share formulae, this resulted in a new health component being introduced and more funds being
directed towards poor rural municipalities
NT AR 10-11_10.indd 262 2011/08/17 10:02 AM

263
Nat
iona
l Tre
asur
y A
nnua
l Rep
ort 2
010/
11
Human Resource Report
hUmAN RESOURCE REPORT - continued
MaNaGiNG puBliC seCtor DeBt
During the review period the division purchased US$6 billion of foreign exchange reserves. Debt service costs dropped
from the projected 2.6 per cent of GDP to 2.5 per cent owing to the strong levels of the rand, and a lower than forecast
interest rate environment.
Short-term investment and lending between the national government, provincial government and related SOEs within
the Corporation of Public Deposits, saved up to 3.4 per cent on borrowing cost compared to borrowing from commercial
banks during the period under review.
In the review period the division successfully financed government’s borrowing and maintained an efficient forecasting
of cash flows ensured that government had sufficient money to meet its daily cash requirements.
iNterNatioNal FiNaNCial relatioNs
South Africa’s investment in the African Development Bank was enhanced with the election of a South African to the
permanent position on the Board of Directors of the Bank. Work in the SADC and SACU community continued apace and
South Africa remains a key player in promoting regional economic integration.
The Collaborative Africa Budget Reform Initiative (CABRI) strengthened its relationship with several regional and
international institutions, such as the AfDB, Organisation for Economic Cooperation and Development, the World Bank
Institute and the IMF’s AfriTAC. Outputs by CABRI covered work in good public financial governance, aid and fiscal
relationship, health financing and programme budgeting.
NT AR 10-11_10.indd 263 2011/08/17 10:02 AM
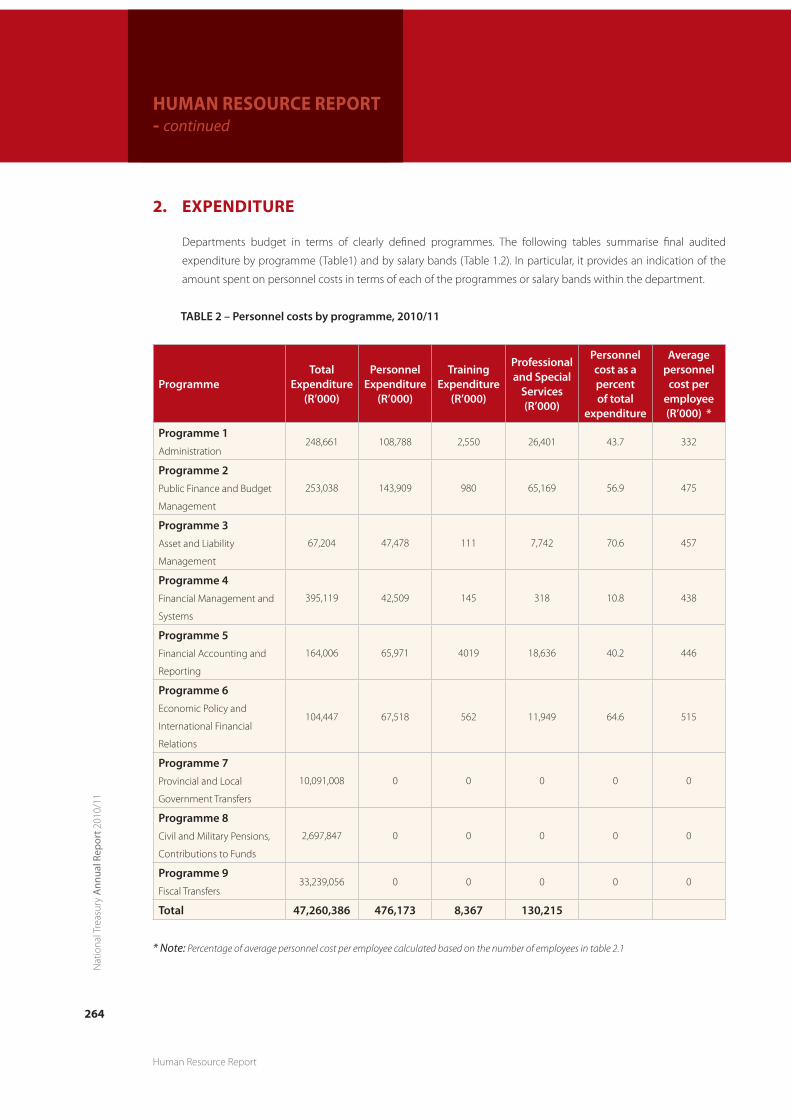
Nat
iona
l Tre
asur
y A
nnua
l Rep
ort 2
010/
11
264
Human Resource Report
hUmAN RESOURCE REPORT - continued
2. ExPENdITURE
Departments budget in terms of clearly defined programmes. The following tables summarise final audited
expenditure by programme (Table1) and by salary bands (Table 1.2). In particular, it provides an indication of the
amount spent on personnel costs in terms of each of the programmes or salary bands within the department.
taBle 2 – personnel costs by programme, 2010/11
programmetotal
expenditure (r’000)
personnel expenditure
(r’000)
training expenditure
(r’000)
professional and special
services (r’000)
personnel cost as a percent of total
expenditure
average personnel
cost per employee (r’000) *
programme 1Administration
248,661 108,788 2,550 26,401 43.7 332
programme 2 Public Finance and Budget
Management
253,038 143,909 980 65,169 56.9 475
programme 3Asset and Liability
Management
67,204 47,478 111 7,742 70.6 457
programme 4 Financial Management and
Systems
395,119 42,509 145 318 10.8 438
programme 5 Financial Accounting and
Reporting
164,006 65,971 4019 18,636 40.2 446
programme 6 Economic Policy and
International Financial
Relations
104,447 67,518 562 11,949 64.6 515
programme 7 Provincial and Local
Government Transfers
10,091,008 0 0 0 0 0
programme 8Civil and Military Pensions,
Contributions to Funds
2,697,847 0 0 0 0 0
programme 9Fiscal Transfers
33,239,056 0 0 0 0 0
total 47,260,386 476,173 8,367 130,215
* Note: Percentage of average personnel cost per employee calculated based on the number of employees in table 2.1
NT AR 10-11_10.indd 264 2011/08/17 10:02 AM

265
Nat
iona
l Tre
asur
y A
nnua
l Rep
ort 2
010/
11
Human Resource Report
taBle 2.2 – personnel costs by salary bands, 2010/11
salary bandspersonnel
expenditure (r’000)
% of total personnel cost
average personnel cost per employee
(r’000) ***
Lower skilled (Levels 1-2) 379 0.08 95
Skilled (Levels 3-5) 7,405 1.57 151
Highly skilled production (Levels 6-8) 69,446 14.69 229
Highly skilled supervision (Levels 9-12) 194,523 41.15 397
Senior management (Levels 13-16) 201,017 42.52 761
total ** 472,770 100 426
** Note: Minister and Deputy Minister personnel expenditure not included in total
***Note: Percentage of average personnel cost per employee calculated based on the number of employees in table 2.2
The following tables provide a summary per programme (Table 1.3) and salary bands (Table 1.4), of expenditure
incurred as a result of salaries, overtime, home owners allowance and medical assistance. In each case, the table
provides an indication of the percentage of the personnel budget that was used for these items.
taBle 2.3 – salaries, overtime, Home owners allowance and Medical assistance by programme, 2010/11
programme salaries overtime Home owners allowance Medical assistance
Amount (R’000)
Salaries as a % of
personnel cost ****
Amount (R’000)
Overtime as a % of
personnel cost ****
Amount (R’000)
HOA as a % of
personnel cost ****
Amount (R’000)
Medical Assistance as a % of
personnel cost ****
Programme 1 72,925 67.03 281 0.26 1,716 3.61 3,072 2.82
Programme 2 87,879 61.07 148 0.10 1,912 1.33 3,186 2.21
Programme 3 30,675 64.61 0 0.00 659 1.39 1,281 2.70
Programme 4 27,837 65.48 0 0.0 350 0.82 1,282 3.02
Programme 5 41,641 63.12 0 0.0 690 1.05 1,265 1.92
Programme 6 40,790 60.41 0 0.0 923 1.37 1,289 1.91
total 301,747 63.37 429 0.09 6,250 1.31 11,375 2.39
**** Note: Percent of personnel cost of salaries, overtime, home owners allowance and medical assistance are calculated on the total personnel
expenditure per programme in table 1.1
NT AR 10-11_10.indd 265 2011/08/17 10:02 AM

Nat
iona
l Tre
asur
y A
nnua
l Rep
ort 2
010/
11
266
Human Resource Report
hUmAN RESOURCE REPORT - continued
taBle 2.4 – salaries, overtime, Home owners allowance and Medical assistance by salary bands, 2010/11
salary Bands salaries overtimeHome owners
allowanceMedical assistance
amount (r’000)
salaries as a % of
personnel cost
amount (r’000)
overtime as a % of
personnel cost
amount (r’000)
Hoa as a % of
personnel cost
amount (r’000)
Medical assistance as a % of
personnel cost
Lower skilled
(Levels 1-2)93 24.50 0 0.00 4 1.10 7 1.80
Skilled
(Levels 3-5)4,396 59.40 49 0.70 296 4.00 496 6.70
Highly skilled
production
(Levels 6-8)
37,681 54.30 187 0.30 1,359 2.00 3,186 4.60
Highly skilled
supervision
(Levels 9-12)
125,190 64.40 193 0.10 1,849 1.00 4,760 2.40
Senior
management
(Levels 13-16)
130,984 65.20 0 0.00 2,742 1.40 2,904 1.40
total ***** 298,344 429 6,250 11,353
***** Note: Minister and Deputy Minister personnel expenditure not included in total
3. EmPlOymENT ANd VACANCIES
The following tables summarise the number of posts on the establishment, the number of employees, the vacancy
rate, and any staff that are additional to the establishment. This information is presented in terms of two key
variables: - programme (Table 2.1) and salary band (Table 2.2). Departments have identified critical occupations that
need to be monitored. The vacancy rate reflects the percentage of posts that are not filled.
NT AR 10-11_10.indd 266 2011/08/17 10:02 AM

267
Nat
iona
l Tre
asur
y A
nnua
l Rep
ort 2
010/
11
Human Resource Report
hUmAN RESOURCE REPORT - continued
taBle 3.1 – employment and vacancies by programme, 31 March 2011
programmeNumber
of funded posts
Headcountvacancy rate %
Number of posts filled additional to the
establishment
programme 1 Administration
397 328 17 15 (1 excess)
programme 2 Public Finance and Budget
Management
331 303 8 26
programme 3Asset and Liability Management
115 104 10 2
programme 4 Financial Management and Systems
108 97 10 5 (3 excess)
programme 5
Financial Accounting and Reporting174 148 15 0
programme 6 Economic Policy and international
Financial Relations
165 131 21 3
total 1290 1111 14 53 (4 excess)
NB: Minister and Deputy Minister included in totals.
DistriButioN oF FilleD positioNs per proGraMMe
Administration, 328
Public Finance and Budget
Management, 303
Economic Policy and international Financial Relations, 131
Asset and Liability Management, 104Financial Accounting and Reporting, 148
Financial Management and Systems, 97
NT AR 10-11_10.indd 267 2011/08/17 10:02 AM

Nat
iona
l Tre
asur
y A
nnua
l Rep
ort 2
010/
11
268
Human Resource Report
hUmAN RESOURCE REPORT - continued
taBle 3.2 – employment and vacancies by salary bands, 31 March 2011
salary bandNumber of
postsHeadcount vacancy
rate %
Number of posts filled additional to the
establishment
Lower skilled (Levels 1-2) 4 4 0 4
Skilled (Levels 3-5) 55 49 11 1
Highly skilled production (Levels 6-8) 324 303 6 17
Highly skilled supervision (Levels 9-12) 598 486 22 14
Senior management (Levels 13-16) 309 269 13 17
total 1290 1111 14 53
NB: Vacancy reduced by additional appointments. Minister and Deputy Minister included in totals.
DistriButioN oF FilleD positioNs per salary BaND
Note: Critical skills occupations for the National Treasury have not been finalised. However, the following areas are being considered: economists,
supply chain consultants, chartered accountants, and tax specialists.
The information in each case reflects the situation as at 31 March 2011. For an indication of changes in staffing
patterns over the year under review, please refer to section 5 of this report.
Highly skilled supervision (Levels 9-12), 486
Senior management (Levels 13-16), 269
Lower skilled (Levels 1-2), 4
Highly skilled production (Levels 6-8), 303
Skilled (Levels 3-5), 49
NT AR 10-11_10.indd 268 2011/08/17 10:02 AM

269
Nat
iona
l Tre
asur
y A
nnua
l Rep
ort 2
010/
11
Human Resource Report
hUmAN RESOURCE REPORT - continued
4. JOb EVAlUATION
The Public Service Regulations, 1999 introduced job evaluation as a way of ensuring that work of equal value is
remunerated equally. Within a nationally determined framework, executing authorities may evaluate or re-evaluate
any job in his or her organisation. In terms of the Regulations all vacancies on salary levels 9 and higher must be
evaluated before they are filled. This was complemented by a decision by the Minister for the Public Service and
Administration that all SMS jobs must be evaluated before 31 December 2002.
The following table (Table 3.1) summarises the number of jobs that were evaluated during the year under review.
The table also provides statistics on the number of posts that were upgraded or downgraded.
taBle4.1 – Job evaluation, 1 april 2010 to 31 March 2011
salary bandNumber of posts
Number of Jobs
evaluated
% of posts evaluated by salary bands
posts upgraded posts downgraded
Number% of posts evaluated
Number% of posts evaluated
Lower skilled
(Levels 1-2)4 0 0 0 0 0 0
Skilled
(Levels 3-5)55 0 0 0 0 0 0
Highly skilled production
(Levels 6-8)324 7 2.16 0 0 0 0
Highly skilled supervision
(Levels 9-12)598 53 8.86 0 0 0 0
Senior Management
Service Band A231 17 7.36 0 0 0 0
Senior Management
Service Band B64 6 9.38 0 0 0 0
Senior Management
Service Band C14 2 14.29 0 0 0 0
Senior Management
Service Band D3 0 0 0 0 0 0
total 1290 85 6.59 0 0 0 0
NB: Minister and Deputy Minister included in totals
The following table provides a summary of the number of employees whose salary positions were upgraded due to
their posts being upgraded. The number of employees might differ from the number of posts upgraded since not
all employees are automatically absorbed into the new posts and some of the posts upgraded could also be vacant.
NT AR 10-11_10.indd 269 2011/08/17 10:02 AM

Nat
iona
l Tre
asur
y A
nnua
l Rep
ort 2
010/
11
270
Human Resource Report
hUmAN RESOURCE REPORT - continued
taBle 4.2 – profile of employees whose salary positions were upgraded due to their posts being
upgraded, 1 april 2010 to 31 March 2011
Beneficiaries african asian Coloured white total
Female 0 0 0 0 0
Male 0 0 0 0 0
Employees with a disability 0 0 0 0 0
total 0 0 0 0 0
The following table summarises the number of cases where remuneration levels exceeded the grade determined
by job evaluation. Reasons for the deviation are provided in each case.
taBle 4.3 – employees whose salary level exceed the grade determined by job evaluation, 1 april 2010 to
31 March 2011 (in terms of psr 1.v.C.3)
occupation Number of employees
Job evaluation level
remuneration level
reason for deviation
Chief Director 2 14 15 Retention
Director 0 0 0 0
Deputy Director 3 11 12 & 13 Retention
Assistant Director 1 9 11 Attraction
Administration 1 8 11 Attraction
Office Assistant 3 7 8 Attraction
total number of employees whose salaries exceeded the level determined by job evaluation in
2010/11
10
percentage of total employment 0.90
Table 4.4 summarises the beneficiaries of the above in terms of race, gender, and disability.
taBle 4.4 – profile of employees whose salary level exceed the grade determined by job evaluation, 1
april 2010 to 31 March 2011 (in terms of psr 1.v.C.3)
Beneficiaries african asian Coloured white total
Female 0 1 1 0 2
Male 5 1 0 2 8
total 5 2 1 2 10
NT AR 10-11_10.indd 270 2011/08/17 10:02 AM

271
Nat
iona
l Tre
asur
y A
nnua
l Rep
ort 2
010/
11
Human Resource Report
hUmAN RESOURCE REPORT - continued
5. EmPlOymENT ChANGES
This section provides information on changes in employment over the financial year.
Turnover rates provide an indication of trends in the employment profile of the department. The following table
provides a summary of turnover rates by salary band (Table 4.1).
taBle 5.1 – annual turnover rates by salary band for the period 1 april 2010 to 31 March 2011
salary BandNumber of employees
per band as on 31 March 2009
appointments and transfers into the department
terminations and transfers out of the department
turnover rate
%
Lower skilled (Levels 1-2) 4 0 0 0.00%
Skilled (Levels 3-5) 51 2 1 1.96%
Highly skilled production(Levels 6-8) 283 71 42 14.84%
Highly skilled supervision(Levels 9-12) 481 56 44 9.15%
Senior Management Service Band A 181 16 16 8.84%
Senior Management Service Band B 56 5 6 10.71%
Senior Management Service Band C 14 0 3 21.43%
Senior Management Service Band D 3 0 0 0.00%
total 1073 150 112 10.44%
NB: *Minister and Deputy Minister included in 31 March 2010 totals
Table 5.2 identifies the major reasons why staff left the department.
taBle 5.2 – reasons why staff are leaving the department
termination type Number % of total
Death 1 0.89%
Resignation 69 61.61%
Expiry of contract 20 17.86%
Dismissal – operational changes 0 0.00%
Dismissal – misconduct 1 0.89%
Dismissal – inefficiency 0 0.00%
Discharged due to ill-health 0 0.00%
Retirement 3 2.68%
Severance Package 0 0.00%
Transfers to other Public Service Departments 18 16.07%
total 112 100%
total number of employees who left as a % of the total employment 10.08%
NT AR 10-11_10.indd 271 2011/08/17 10:02 AM

Nat
iona
l Tre
asur
y A
nnua
l Rep
ort 2
010/
11
272
Human Resource Report
hUmAN RESOURCE REPORT - continued
taBle 5.3 – promotions by salary band
salary Bandemployees
31 March 2010
promotions to another salary
level
salary bands promotions as a % of employees by
salary level
Lower skilled (Levels 1-2) 4 0 0.00%
Skilled (Levels 3-5) 51 4 7.84%
Highly skilled production (Levels 6-8) 283 19 6.71%
Highly skilled supervision (Levels9-12) 481 59 12.27%
Senior management (Levels13-16) 254 18 7.09%
total 1073 100 9.32%
proMotioNs to aNotHer salary level
Highly skilled supervision (Levels9-12), 59
Senior management (Levels13-16), 18
Lower skilled (Levels 1-2), 0 Highly skilled production
(Levels 6-8), 19
Skilled (Levels 3-5), 4
NT AR 10-11_10.indd 272 2011/08/17 10:02 AM
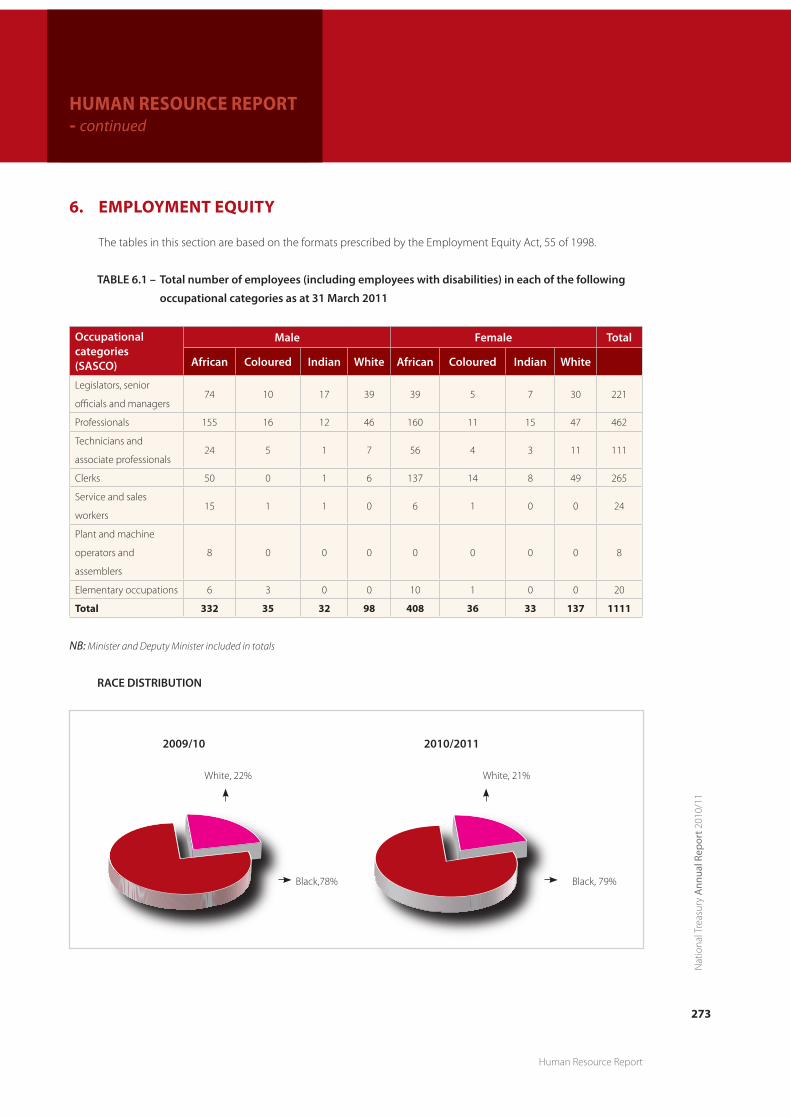
273
Nat
iona
l Tre
asur
y A
nnua
l Rep
ort 2
010/
11
Human Resource Report
hUmAN RESOURCE REPORT - continued
6. EmPlOymENT EQUITy
The tables in this section are based on the formats prescribed by the Employment Equity Act, 55 of 1998.
taBle 6.1 – total number of employees (including employees with disabilities) in each of the following
occupational categories as at 31 March 2011
occupational categories (sasCo)
Male Female total
african Coloured indian white african Coloured indian white
Legislators, senior
officials and managers74 10 17 39 39 5 7 30 221
Professionals 155 16 12 46 160 11 15 47 462
Technicians and
associate professionals24 5 1 7 56 4 3 11 111
Clerks 50 0 1 6 137 14 8 49 265
Service and sales
workers15 1 1 0 6 1 0 0 24
Plant and machine
operators and
assemblers
8 0 0 0 0 0 0 0 8
Elementary occupations 6 3 0 0 10 1 0 0 20
Total 332 35 32 98 408 36 33 137 1111
NB: Minister and Deputy Minister included in totals
raCe DistriButioN
Black, 79%Black,78%
White, 22% White, 21%
2009/10 2010/2011
NT AR 10-11_10.indd 273 2011/08/17 10:02 AM

Nat
iona
l Tre
asur
y A
nnua
l Rep
ort 2
010/
11
274
Human Resource Report
hUmAN RESOURCE REPORT - continued
taBle 6.2 – total number of employees (including employees with disabilities) in each of the following
occupational bands as on 31 March 2011
occupational BandsMale Female
african Coloured indian white african Coloured indian white total
Top Management 6 1 6 4 2 2 0 1 22
Senior Management 76 12 13 47 45 3 9 35 242
Professionally qualified and experienced
specialists and mid-management160 16 10 39 177 12 16 61 491
Skilled technical and academically
qualified workers, junior management,
supervisors, foreman and
superintendents
64 2 3 7 162 17 8 40 303
Semi-skilled and discretionary decision
making24 2 0 1 22 0 0 0 49
Unskilled and defined decision making 2 2 0 0 0 0 0 0 4
total 6 3 0 0 10 1 0 0 20
332 35 32 98 408 36 33 137 1111
GeNDer DistriButioN
Female, 55%Female, 56%
Male, 44% Male, 45%
2009/10 2010/2011
NT AR 10-11_10.indd 274 2011/08/17 10:02 AM

275
Nat
iona
l Tre
asur
y A
nnua
l Rep
ort 2
010/
11
Human Resource Report
hUmAN RESOURCE REPORT - continued
taBle 6.3 – recruitment for the period 1 april 2010 to 31 March 2011
occupational BandsMale Female
african Coloured indian white african Coloured indian white total
Top Management 0 0 0 1 0 0 0 0 1
Senior Management 7 0 1 4 1 0 1 4 18
Professionally qualified and experienced
specialists and mid-management22 1 2 2 17 0 4 2 50
Skilled technical and academically
qualified workers, junior management,
supervisors, foreman and
superintendents
31 0 1 1 39 0 1 5 78
Semi-skilled and discretionary decision
making1 0 0 0 1 0 0 0 2
Unskilled and defined decision making 0 0 0 0 0 0 0 0 0
Employees with disabilities 1 0 0 0 0 0 0 0 1
total 62 1 4 8 58 0 6 11 150
reCruitMeNt proFile
Professionally qualified and experienced specialists and mid-management (9 - 12), 50
Semi-skilled and discretionary
decision making (3 - 5), 2
Unskilled and defined
decision making (1 - 2), 0
Top Management (15 - 16), 1
Senior Management (13 - 14), 18
Skilled technical and academically qualified workers, junior management,
supervisors, foreman and superintendents
(6 - 8), 79
NT AR 10-11_10.indd 275 2011/08/17 10:03 AM

Nat
iona
l Tre
asur
y A
nnua
l Rep
ort 2
010/
11
276
Human Resource Report
hUmAN RESOURCE REPORT - continued
taBle 6.4 – promotions for the period 1 april 2010 to 31 March 2011
occupational BandsMale Female
african Coloured indian white african Coloured indian white total
Top Management 1 0 0 0 0 0 0 0 1
Senior Management 9 0 1 1 2 1 1 2 17
Professionally qualified and experienced
specialists and mid-management20 0 2 6 18 4 4 5 59
Skilled technical and academically
qualified workers, junior management,
supervisors, foreman and
superintendents
5 0 1 0 11 0 0 2 19
Semi-skilled and discretionary decision
making1 0 0 0 3 0 0 0 4
Unskilled and defined decision making 0 0 0 0 0 0 0 0 0
Employees with disabilities 0 0 0 0 0 0 0 0 0
total 36 0 4 7 34 5 5 9 100
taBle 6.5 – terminations for the period 1 april 2010 to 31 March 2011
occupational BandsMale Female
african Coloured indian white african Coloured indian white total
Top Management 0 0 0 3 0 0 0 0 3
Senior Management 5 2 4 1 4 1 1 4 22
Professionally qualified and experienced
specialists and mid-management16 2 2 3 12 2 2 6 45
Skilled technical and academically
qualified workers, junior management,
supervisors, foreman and
superintendents
13 2 0 1 20 3 0 2 41
Semi-skilled and discretionary decision
making0 0 0 0 1 0 0 0 1
Unskilled and defined decision making 0 0 0 0 0 0 0 0 0
total 34 6 6 8 37 6 3 12 112
NT AR 10-11_10.indd 276 2011/08/17 10:03 AM

277
Nat
iona
l Tre
asur
y A
nnua
l Rep
ort 2
010/
11
Human Resource Report
hUmAN RESOURCE REPORT - continued
terMiNatioN oF serviCes proFile
taBle 6.6 – Disciplinary action for the period 1 april 2010 to 31 March 2011
Male Female
african Coloured indian white african Coloured indian white total
disciplinary action 1 0 0 0 0 0 0 0 1
taBle 6.7 – skills development for the period 1 april 2010 to 31 March 2011
occupational categoriesMale Female total
african Coloured indian white african Coloured indian white
Legislators, senior officials and managers
61 8 13 29 33 6 7 25 182
Professionals 143 15 7 36 142 7 13 31 394
Technicians and associate professionals 23 2 1 5 43 4 3 10 91
Clerks 51 13 1 5 129 13 7 38 257
Service and sales workers 15 1 0 0 6 1 0 0 23
Skilled agriculture and fishery workers 0 0 0 0 0 0 0 0 0
Craft and related trades workers 0 0 0 0 0 0 0 0 0
Plant and machine operators and assemblers
2 0 0 0 0 0 0 0 2
Elementary occupations 2 0 0 0 1 1 0 0 4
total 297 39 22 75 354 32 30 104 953
Skilled technical and academically qualified workers,
junior management, supervisors, foreman and superintendents
(6 - 8), 41
Semi-skilled and discretionary decision making (3 - 5), 2
Unskilled and defined decision making (1 - 2), 0
Top Management (15 - 16), 3
Senior Management (13 - 14), 22
Professionally qualified and experienced specialists and mid-management
(9 - 12), 45
NT AR 10-11_10.indd 277 2011/08/17 10:03 AM

Nat
iona
l Tre
asur
y A
nnua
l Rep
ort 2
010/
11
278
Human Resource Report
hUmAN RESOURCE REPORT - continued
7. PERFORmANCE REWARdS
To encourage good performance, the department has granted the following performance rewards during the year
under review. The information is presented in terms of race, gender, and disability (Table 6.1), salary bands (table 6.2)
and critical occupations (Table 6.3).
taBle 7.1 – performance rewards by race, gender, and disability, 1 april 2009 to 31 March 2010
Beneficiary profile Cost
Number of
beneficiaries
total number of
employees in group
% of total
within group
Cost
(r’000)
average cost
per employee
African 440 691 63.7% 15, 893 R36, 121.94
Male 185 306 60.5% 5,319 R28,754.43
Female 255 385 66.2% 10,574 R41,466.99
Asian 51 66 77.3% 2, 898 R56, 843.97
Male 26 34 76.5% 1,090 R41,951.89
Female 25 32 78.1% 1,808 R72,331.74
Coloured 50 80 62.5% 2,198 R43, 978.82
Male 22 39 56.4% 791 R35,981.92
Female 28 41 68.3% 1,407 R50,262.10
White 192 236 81.4% 6, 699 R34, 895.30
Male 81 98 82.7% 3,148 R38,875.00
Female 111 138 80.43% 3,551 R31,991.19
total 744 1073 69.3% 20,489 r27,539.80
taBle 7.2 – performance rewards by salary bands for personnel below senior Management service,
1 april 2009 to 31 March 2010
salary Bands Beneficiary profile Cost
Number of
beneficiaries
Number of
employees
% of total
within
salary
bands
total
Cost
(r’000)
average
cost per
employee
(r’000)
total cost as a
% of the total
personnel
expenditure
Lower skilled (Levels 1-2) 0 0 0 0 0 0.00
Skilled (Levels 3-5) 45 53 84.91% 2,315 5 3.13
Highly skilled production (Levels 6-8) 164 303 54.13% 1,149 7 1.65
Highly skilled supervision (Levels 9-12) 347 485 71.55% 4,642 13 2.39
total 556 841 66.11% 5,791 10 2.13
NT AR 10-11_10.indd 278 2011/08/17 10:03 AM

279
Nat
iona
l Tre
asur
y A
nnua
l Rep
ort 2
010/
11
Human Resource Report
hUmAN RESOURCE REPORT - continued
taBle 7.3 – performance related rewards (cash bonus), by salary band, for senior Management service
salary Band Beneficiary profiletotal Cost
(r’000)average cost per employee
total cost as a % of the total
personnel expenditure
Number of
beneficiaries
Number of
employees
% of total
within band
Band A 125 185 67.6% R2,444 R19,551.70 4.5
Band B 49 60 81.7% R2, 248 R45,879.40 6.0
Band C 14 19 73.7% R 887 R63,396.90 4.6
Band D - - - - - 0.00
Total 188 264 71.2% R3,331 R17,720.90 4.9
8. lEAVE UTIlISATION FOR ThE PERIOd 1 JANUARy 2010 TO 31 dECEmbER 2010
The Public Service Commission identified the need for careful monitoring of sick leave within the public service.
The following tables provide an indication of the use of sick leave (Table 7.1) and disability leave (Table 7.2). In both
cases, the estimated cost of the leave is also provided.
taBle 8.1 – sick leave, 1 January 2010 to 31 December 2010
salary Band total days% days with
medical certification
Number of employees using sick
leave
% of total employees using sick
leave
average days per
employee
estimated Cost (r’000)
Lower skilled (Levels 1-2) 29 93.1 2 0.2 15 6
Skilled (Levels 3-5) 304 75.3 45 5 7 99
Highly skilled production
(Levels 6-8)2077.5 79.3 258 28.7 8 1224
Highly skilled supervision
(Levels9-12)2824.5 78.7 408 45.4 7 3632
Senior management
(Levels 13-16)1142.5 78.9 186 20.7 6 3063
total 6377.5 78.8 899 100 7 8024
NT AR 10-11_10.indd 279 2011/08/17 10:03 AM

Nat
iona
l Tre
asur
y A
nnua
l Rep
ort 2
010/
11
280
Human Resource Report
hUmAN RESOURCE REPORT - continued
taBle 8.2 – Disability leave (temporary and permanent), 1 January 2010 to 31 December 2010
salary Band total days taken
% days with medical
certification
Number of employees
using disability leave
% of total employees
using disability leave
average days per
employee
estimated Cost
(r’000)
Lower skilled (Levels 1-2) 19 100 1 11.1 19 4
Skilled (Levels 3-5) 0 0 0 0 0 0
Highly skilled production
(Levels 6-8)119 100 3 33.3 40 60
Highly skilled supervision
(Levels 9-12)85 100 4 44.4 21 81
Senior management
(Levels 13-16)13 100 1 11.1 13 39
total 236 100 9 100 26 184
Table 8.3 summarises the utilisation of annual leave. The wage agreement concluded with trade unions in the
PSCBC in 2000 requires management of annual leave to prevent high levels of accrued leave being paid at the time
of termination of service.
taBle 8.3 – annual leave, 1 January 2010 to 31 December 2010
salary Bands total days taken average per employee
Lower skilled (Levels 1-2) 67 17
Skilled (Levels 3-5) 1,178 23
Highly skilled production (Levels 6-8) 5,921 20
Highly skilled supervision (Levels 9-12) 10,066 20
Senior management (Levels 13-16) 5,768 20
total 22,300 20
proFile oF aNNual leave taKeN
Highly skilled supervision (levels9-12), 10,066
Senior management (levels13-16); 5,768
Lower skilled (levels 1-2), 67
Skilled (levels 3-5), 1,178 Highly skilled production (levels 6-8), 5,921
NT AR 10-11_10.indd 280 2011/08/17 10:03 AM
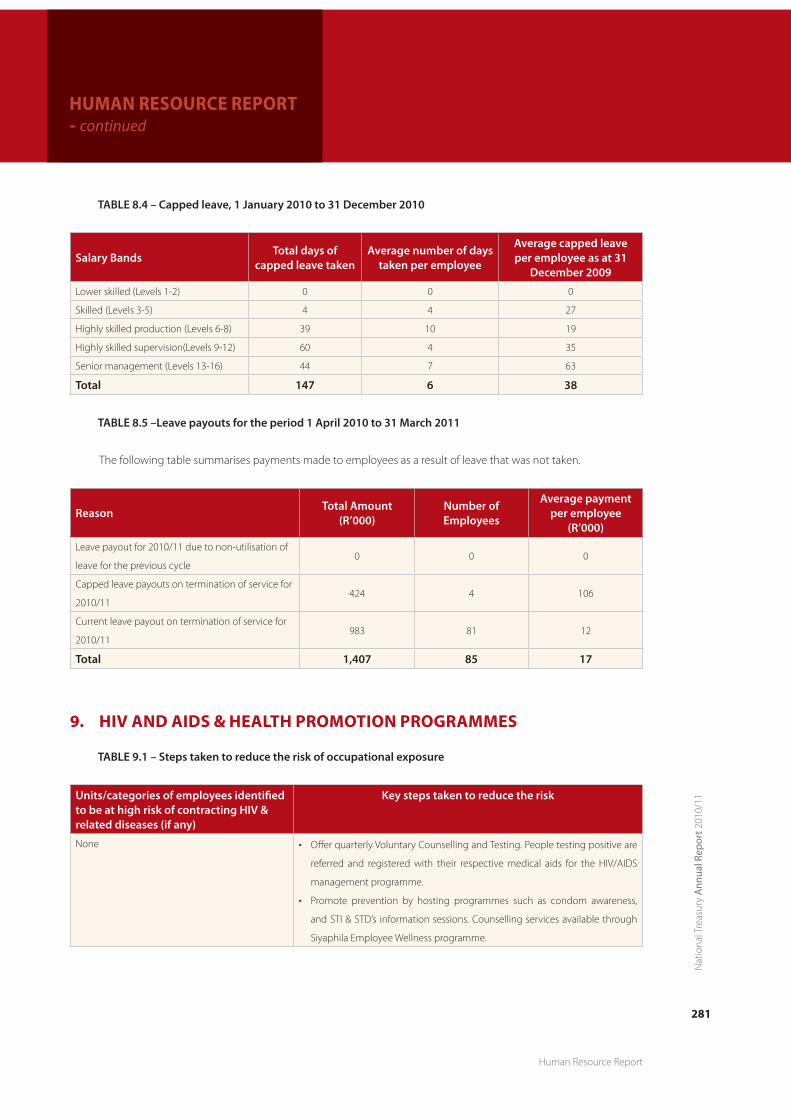
281
Nat
iona
l Tre
asur
y A
nnua
l Rep
ort 2
010/
11
Human Resource Report
hUmAN RESOURCE REPORT - continued
taBle 8.4 – Capped leave, 1 January 2010 to 31 December 2010
salary Bands total days of capped leave taken
average number of days taken per employee
average capped leave per employee as at 31
December 2009
Lower skilled (Levels 1-2) 0 0 0
Skilled (Levels 3-5) 4 4 27
Highly skilled production (Levels 6-8) 39 10 19
Highly skilled supervision(Levels 9-12) 60 4 35
Senior management (Levels 13-16) 44 7 63
total 147 6 38
taBle 8.5 –leave payouts for the period 1 april 2010 to 31 March 2011
The following table summarises payments made to employees as a result of leave that was not taken.
reasontotal amount
(r’000)Number of employees
average payment per employee
(r’000)
Leave payout for 2010/11 due to non-utilisation of
leave for the previous cycle0 0 0
Capped leave payouts on termination of service for
2010/11424 4 106
Current leave payout on termination of service for
2010/11983 81 12
total 1,407 85 17
9. hIV ANd AIdS & hEAlTh PROmOTION PROGRAmmES
taBle 9.1 – steps taken to reduce the risk of occupational exposure
units/categories of employees identified to be at high risk of contracting Hiv & related diseases (if any)
Key steps taken to reduce the risk
None • Offer quarterly Voluntary Counselling and Testing. People testing positive are
referred and registered with their respective medical aids for the HIV/AIDS
management programme.
• Promote prevention by hosting programmes such as condom awareness,
and STI & STD’s information sessions. Counselling services available through
Siyaphila Employee Wellness programme.
NT AR 10-11_10.indd 281 2011/08/17 10:03 AM

Nat
iona
l Tre
asur
y A
nnua
l Rep
ort 2
010/
11
282
Human Resource Report
hUmAN RESOURCE REPORT - continued
taBle 9.2 – Details of Health promotion and Hiv and aiDs programmes (tick the applicable boxes and
provide the required information)
question yes No Details, if yes
1. Has the department designated a member of the
SMS to implement the provisions contained in Part
VI E of Chapter 1 of the Public Service Regulations,
2001? If so, provide her/his name and position.
X Director: Organisational Development
2. Does the department have a dedicated unit
or has it designated specific staff members
to promote the health and well being of your
employees? If so, indicate the number of
employees who are involved in this task and the
annual budget that is available for this purpose.
X One (1) internal Human Resources Specialist: Employee
Wellness Programme (EWP).
Contracted an external Employee Wellness service
provider (Workforce Health Care).
An annual budget of estimated R700 000
3. Has the department introduced an Employee
Assistance or Health Promotion Programme for
employees? If so, indicate the key elements/
services of this Programme.
X • Confidential Counselling
• Assess and refer employees for interventions such as
financial and legal advice, relationships, family matters,
substance abuse, work stress, depression, trauma and
other health issues.
• Host health awareness campaigns – focus on health risk
assessments
• Quartely Voluntary Counselling and Testing (VCT)
4. Has the department established (a) committee(s)
as contemplated in Part VI E.5 (e) of Chapter 1
of the Public Service Regulations, 2001? If so,
please provide the names of the members of
the committee and the stakeholder(s) that they
represent.
X Composed 8 internal members:
• Hilda Mhlongo (CS)
• Sheridan Pillay (ODG)
• Thabsile Shezi (EP)
• Rebecca Modiba (CS)
• Marius Klue (OAG)
• Betty Malope (CS)
• Innocentia Machaba (SF)
• Johnny October (CS)
5. Has the department reviewed its employment
policies and practices to ensure that these do
not unfairly discriminate against employees
on the basis of their HIV status? If so, list the
employment policies/practices so reviewed.
X Yes. No employment policies discriminate against
employees on the basis of their HIV status.
The department’s HIV and AIDS policy gives a solid platform
for ensuring non – discriminatory practices against HIV-
positive employees.
NT AR 10-11_10.indd 282 2011/08/17 10:03 AM

283
Nat
iona
l Tre
asur
y A
nnua
l Rep
ort 2
010/
11
Human Resource Report
hUmAN RESOURCE REPORT - continued
question yes No Details, if yes
6. Has the department introduced measures
to protect HIV-positive employees or those
perceived to be HIV-positive from discrimination?
If so, list the key elements of these measures.
X The HIV/AIDS policy emphasises confidentiality and the
names of all employees tested are kept confidential by an
external Voluntary Counselling and Testing (VCT) service
provider. The disease management process for those who
are positive is done through GEMS and information is also
not disclosed to the employer.
7. Does the department encourage
its employees to undergo Voluntary
Counselling and Testing? If so, list the results
that you have you achieved.
X VCT is conducted quarterly. 57% of our total staff
complement of 1082 employees underwent VCT in the
period 01 April 2010 to 31 March 2011
8. Has the department developed measures/
indicators to monitor and evaluate
the impact of its health promotion
programme? If so, list these measures/
indicators.
X • HIV/AIDSmanagement-VCTtargetof56%
• Healthandproductivitymanagement-Targetof
less than 3% absenteeism rate
• Wellnessmanagement:-EWPtotalutilisationrate
of 25%
10. lAbOUR RElATIONS
The following collective agreements were entered into with trade unions within the department.
taBle 10.1 – Collective agreements, 1 april 2010 to 31 March 2011
subject Matter Date
N/A
The following table summarises the outcome of disciplinary hearings conducted within the department for the
year under review.
NT AR 10-11_10.indd 283 2011/08/17 10:03 AM

Nat
iona
l Tre
asur
y A
nnua
l Rep
ort 2
010/
11
284
Human Resource Report
hUmAN RESOURCE REPORT - continued
taBle 10.2 – Misconduct and disciplinary hearings finalised, 1 april 2010 to 31 March 2011
outcomes of disciplinary hearings Number % of total
Correctional counselling 0 0.0
Verbal warning 2 25.0
Written warning 5 62.5
Final written warning 0 0.0
Suspended without pay 0 0.0
Fine 0 0.0
Demotion 0 0.0
Dismissal 1 12.5
Not guilty 0 0.0
Case withdrawn 0 0.0
total 8 100
taBle 10.3 – types of misconduct addressed at disciplinary hearings
type of misconduct Number % of total
Excessive and Unauthorised Absenteeism 1 100
total 1 100
taBle 10.4 – Grievances lodged for the period 1 april 2010 to 31 March 2011
Number % of total
Number of grievances resolved 10 90.9
Number of grievances not resolved 1 9.1
total number of grievances lodged 11 100
taBle 10.5 – Disputes lodged with Councils for the period 1 april 2009 to 31 March 2010
Number % of total
Number of disputes upheld 1 33.3
Number of disputes dismissed 2 66.7
total number of disputes lodged 3 100
NT AR 10-11_10.indd 284 2011/08/17 10:03 AM

285
Nat
iona
l Tre
asur
y A
nnua
l Rep
ort 2
010/
11
Human Resource Report
hUmAN RESOURCE REPORT - continued
taBle 10.6 – strike actions for the period 1 april 2010 to 31 March 2011
total number of person working days lost 34
Total cost (R’000) of working days lost R22
Amount (R’000) recovered as a result of no work no pay R22
taBle 10.7 – precautionary suspensions for the period 1 april 2010 to 31 March 2011
Number of people suspended 1
Number of people whose suspension exceeded 30 days 1
Average number of days suspended 42
Cost (R’000) of suspensions R114
11. SkIllS dEVElOPmENT
This section highlights the efforts of the department with regard to skills development.
taBle 11.1 – training needs identified 1 april 2010 to 31 March 2011
occupational Categories Gender
Number of employees as at 1 april
2010
training needs identified at start of reporting period
learnerships
skills programmes
& other short
courses
other
forms of
training
total
Legislators, senior officials and
managers
Female 81 0 4 49 53
Male 141 0 34 84 118
ProfessionalsFemale 232 0 32 131 163
Male 229 0 28 157 185
Technicians and associate
professionals
Female 74 0 16 28 44
Male 36 0 5 15 20
Clerks Female 209 0 27 180 207
Male 57 0 2 59 61
Service and sales workersFemale 7 0 0 1 1
Male 17 0 0 4 4
Skilled agriculture and fishery
workers
Female 0 0 0 0 0
Male 0 0 0 0 0
Craft and related trades
workers
Female 0 0 0 0 0
Male 0 0 0 0 0
Plant and machine operators
and assemblers
Female 0 0 0 0 0
Male 8 0 0 1 1
Elementary occupationsFemale 11 0 0 0 0
Male 9 0 1 0 1
NT AR 10-11_10.indd 285 2011/08/17 10:03 AM

Nat
iona
l Tre
asur
y A
nnua
l Rep
ort 2
010/
11
286
Human Resource Report
hUmAN RESOURCE REPORT - continued
occupational Categories Gender
Number of employees as at 1 april
2010
training needs identified at start of reporting period
learnerships
skills programmes
& other short
courses
other
forms of
training
total
Sub TotalFemale 614 0 79 389 468
Male 497 0 70 320 390
total 1111 0 149 709 858
NB: Minister and Deputy Minister not included in totals
taBle 11.2 – training provided 1 april 2009 to 31 March 2010
occupational Categories Gender
Number of employees as at 1 april
2010
training provided within the reporting period
learnerships
skills programmes
& other short
courses
other
forms of
training
total
Legislators, senior officials
and managers
Female 81 0 68 16 84
Male 141 0 104 41 145
Professionals Female 232 0 155 61 216
Male 229 0 102 86 188
Technicians and associate
professionals
Female 74 0 49 15 64
Male 36 0 26 11 37
Clerks Female 209 0 198 21 219
Male 57 0 41 18 59
Service and sales workers Female 7 0 5 1 6
Male 17 0 8 2 10
Skilled agriculture and
fishery workers
Female 0 0 0 0 0
Male 0 0 0 0 0
Craft and related trades
workers
Female 0 0 0 0 0
Male 0 0 0 0 0
Plant and machine operators
& assemblers
Female 0 0 0 0 0
Male 8 0 1 1 2
Elementary occupations Female 11 0 0 0 0
Male 9 0 0 0 0
Sub Total Female 614 0 475 114 589
Male 497 0 282 159 438
total 1111 0 757 273 1030
NT AR 10-11_10.indd 286 2011/08/17 10:03 AM

287
Nat
iona
l Tre
asur
y A
nnua
l Rep
ort 2
010/
11
Human Resource Report
hUmAN RESOURCE REPORT - continued
12. INJURy ON dUTy
The following tables provide basic information on injury on duty.
taBle 12.1 – injury on duty, 1 april 2010 to 31 March 2011
Nature of injury on duty Number % of total
Required basic medical attention only 4 100
Temporary Total Disablement 0 0
Permanent Disablement 0 0
Fatal 0 0
total 4 100
NT AR 10-11_10.indd 287 2011/08/17 10:03 AM

Nat
iona
l Tre
asur
y A
nnua
l Rep
ort 2
010/
11
288
Annexures
ANNExURES - continued
ANNExURES
NT AR 10-11_10.indd 288 2011/08/17 10:03 AM

289
Nat
iona
l Tre
asur
y A
nnua
l Rep
ort 2
010/
11
Annexures
ANNExURES
ANNExURE 1: AbbREVIATIONS
ACCC Anti-Corruption Coordinating CommitteeADB African Development BankADF African Development FundAFIS Automated Fingerprint Identification SystemAPRM African Peer Review MechanismASB Accounting Standards BoardAU African UnionBAS Basic Accounting SystemBIS Bank for International SettlementsCFTC Commonwealth Fund for Technical CooperationCGE Computable General EquilibriumCISNA Securities and Non-banking Financial AuthoritiesCMU Contract Management UnitCMA Common Monetary AreaCPD Corporation for Public DepositsDBSA Development Bank of Southern AfricaDCIS Development Corporation Information SystemDFI Development Finance InstitutionDOC Department of CommunicationsDORA Division of Revenue ActDPE Department of Public EnterprisesDME Department of Minerals and EnergyDPSA Department of Public Service and AdministrationDSGE Dynamic Srochastic General Equilibrium ED Exposure DraftsEU European UnionFATF Financial Action Task ForceFFC Financial and Fiscal CommissionFIC Financial Intelligence CentreFMS Financial Management SystemFOSAD Forum of SA Directors-GeneralFSB Financial Services BoardG20 Group of Twenty CountriesG24 Group of Twenty-Four CountriesGAMAP Generally Accepted Municipal Accounting PracticesGCC Guarantee Certification CommitteeGCIS Government Communications and Information SystemGDS Growth and Development SummitGEPF Government Employee Pension FundGFECRA Gold and Foreign Exchange Contingency Reserve AccountGRAP Generally Recognised Accounting PracticesHDI Historically Disadvantaged IndividualHEDCOM Heads of Education Departments CommitteeHIPC Highly Indebted Poor CountriesHSRC Human Sciences Research CouncilIAS International Accounting StandardsICASA Independent Communications Authority of South AfricaIDC International Development CooperationIFAC International Federation of Accountants
NT AR 10-11_10.indd 289 2011/08/17 10:03 AM

Nat
iona
l Tre
asur
y A
nnua
l Rep
ort 2
010/
11
290
Annexures
ANNExURES - continued
ANNExURE 1: AbbREVIATIONS
IFMS Integrated Financial Management SystemsIJS Integrated Justice SectorIMF International Monetary FundIMFC International Monetary and Financial CommitteeIOSCO International Organisation of Securities CommissionsIPFA Institute for Public Finance and AuditingIPSAS International Public Sector Accounting StandardsISDA International Swaps and Derivatives AssociationLRAD Land Reform for Agricultural DevelopmentMFI Micro-Finance IntermediariesMFMA Municipal Financial Management ActMFMTAP Municipal Finance Management Technical Assistance ProjectMIG Municipal Infrastructure GrantMOU Memorandum of UnderstandingMSP Master Systems PlanMTEF Medium-Term Expenditure FrameworkMYPD Multi-Year Price DeterminationNCOP National Council of ProvincesNEDLAC National Economic Development and Labour CouncilNEPAD New Partnership for Africa’s DevelopmentNERSA National Energy Regulator of South AfricaNERT National Energy Response TeamNIA National Intelligence AgencyNOFP Net Open Forward PositionNPA National Ports AuthorityOAG Office of the Accountant-GeneralPIC Public Investment CorporationPFAI Provident Fund for Associated InstitutionsPFMA Public Finance Management ActPPP Public-Private PartnershipsPPPFA Preferential Procurement Policy Framework ActRDP Reconstruction and Development ProgrammeREDS Regional Electricity DistributorsRISDP Regional Indicative Strategic Development PlanRMF Risk Management FrameworkSACU Southern African Customs UnionSADC Southern African Development CommunitySAFCOL SA Forestry Company LimitedSANReN South African Research NetworkSAPS South African Police ServicesSAPO South African Post OfficeSARB South African Reserve BankSARS South African Revenue ServiceSASRIA South African Special Risks Insurance AssociationSAQA South African Qualifications AuthoritySCM Supply Chain ManagementSCOA Standard Chart of AccountsSEC US Securities and Exchange Commission
NT AR 10-11_10.indd 290 2011/08/17 10:03 AM

291
Nat
iona
l Tre
asur
y A
nnua
l Rep
ort 2
010/
11
Annexures
ANNExURES - continued
SETA Sector Education and Training AuthoritySITA State Information Technology AgencySCOPA Standing Committee on Public Accounts
SMMEs Small, Medium and Micro-EnterprisesSOEs State-owned EnterprisesSTRIPS Separate Trading of Registered Interest and Principal SecuritiesTBPS Treasury Best Practice StandardsTCTA Trans-Caldon Tunnel AuthorityWTO World Trade Organisation
NT AR 10-11_10.indd 291 2011/08/17 10:03 AM

Nat
iona
l Tre
asur
y A
nnua
l Rep
ort 2
010/
11
292
Annexures
ANNExURES - continued
ANNExURE 2: INSTITUTIONS ASSOCIATEd WITh ThE NATIONAl TREASURy
The National Treasury works closely with a number of public institutions. It has operational and institutional independence and, in some instances, constitutionally guaranteed autonomy. It produces its own annual reports.
Accounting Standards BoardSection 87 of the Public Finance Management Act (1 of 1999)
Coin LiabilitiesSA Reserve Bank subsidiary
Corporation for Public DepositsCorporation for Public Deposits Act (46 of 1984)
Development Bank of Southern AfricaDevelopment Bank of Southern Africa Act (13 of 1997)
Financial and Fiscal CommissionFinancial and Fiscal Commission Act (99 of 1997)
Financial Services BoardFinancial Services Board Act (97 of 1990)
The following report to it:
Pension Fund Adjudication
Financial Markets Advisory Board
Pension Funds Advisory Board
Financial Intelligence Centre Financial Intelligence Centre Act (38 of 2001)
Independent Development Trust
Policy Board for Financial Services RegulationPolicy Board for Financial Services and Regulation Act (141 of 1993)
Public Accounts and Auditors Board
Public Investment CorporationPublic Investment Corporation Act, 2004 (23 of 2004)
Registrar of Banks
Reports to SA Reserve Bank
SA Banknote CompanySA Reserve Bank subsidiary
SA Mint CompanySA Reserve Bank subsidiary
South African Reserve BankSA Reserve Bank Act (90 of 1989)
South African Revenue ServiceSA Revenue Service Act (34 of 1997)
South African Special Risk Insurance Association (SASRIA)
Special Pensions Board
Special Pensions Advisory Board
State Tender Board
Statistical CouncilStatistics Act (66 of 1976)Tax Advisory Committee
NT AR 10-11_10.indd 292 2011/08/17 10:03 AM

NOTES
NT AR 10-11_10.indd 293 2011/08/17 10:03 AM

NOTES
NT AR 10-11_10.indd 294 2011/08/17 10:03 AM

NT AR 10-11_10.indd 295 2011/08/17 10:03 AM

hUmAN RESOURCE REPORT - continued
National TreasuryDepartment:
REPUBLIC OF SOUTH AFRICA
national treasury
Private Bag X115, Pretoria, 0001, 40 Church square, Pretoria, 0002,
tel: +27 12 315 5526, Fax: +27 12 315 5126
NT AR 10-11_10.indd 296 2011/08/17 10:03 AM