Embed Size (px)
Citation preview

National, Provincial, and Territorial Economic Impacts of ATVs and Side-By-Sides 2015: Final Report
For
The Canadian Off-Highway Vehicle Distributors Council
3000 Steeles Ave East (Suite 201) Markham ON
L3R 4T9 Canada
Attention Ms. Oksana Buhel
Manager, Rider Federations and Industry Partner Services Canadian Off-Highway Vehicle Distributors Council / Motorcycle and Moped Industry
Council
By
Smith Gunther Associates Ltd. 10 Armagh Way
Nepean ON K2J 4C3
(613) 823-0513
September 19, 2016 Peter E Gunther, President
Sally Smith, Corporate Secretary Ken White, Sr. Associate
Joseph Cunningham, Associate

2
National, Provincial, and Territorial Economic Impacts of
ATVs and Side-By-Sides 2015: Final Report
This report explores how 2015 expenditures on recreational activities utilizing all-terrain
vehicles (ATVs) and side-by-sides (SxSs) impacted on Canadian and provincial economies.1
In 2015, there was an estimated minimum of 629,609 ATVs and 299,624 SxSs in operation. This
minimum estimate is based on an attrition rate of 10% of the current stock of ATVs from 1994
onward when annual sales data were available or could be estimated. Similar adjustments were
calculated on SxSs purchased after 2006 when they started being used for recreational
purposes. The 10% attrition rate is in-line with similar rates for personal watercraft and
snowmobiles and is conservative. Based on Smith Gunther’s survey of ATV and SxS
owner/riders, an 8.6% attrition rate is more likely. Because attrition rates reflect annual
retirement of vehicles, an 8.6% attrition rate means more vehicles remain operational leading
to higher estimates of operational ATVs (705,264) and SxSs (432,219). From those provinces
where licensing data were available this rate is supported by that data.
Annual investments in new purchases of equipment and machinery, including ATVs, SxSs and
related enhanced vehicles2 reached $1.1 billion to $1.2 billion before depreciation, as shown in
Table E-1. Since this data reflects purchases of new ATVs and SxSs, the numbers are not
affected by rates of attrition. Investments in enhanced on-highway vehicles are affected in that
fewer or more vehicles are required to transport the newly purchased stock as well as the stock
still in operation. In the low case (10% attrition), fewer ATVs and SxSs are still in operation
therefore fewer enhanced vehicles are required and less is spent on replacing them. The
opposite is true in the high case (8.6%).
Table E-1: 2015 Investments in ATVs and SxSs ($1,000s)
Items\Cases Low (10%) High (8.6%)
ATVs 643,776 643,776
SxSs 378,628 378,628
Enhanced on-highway vehicles 84,100 159,400
Total 1,106,504 1,181,804 Sources: Smith Gunther Associates Ltd. based on annual sales data of ATVs and survey data for SxSs.
1 Off-highway vehicles used for recreational purposes include ATVs and SxSs less than 80 inches wide. For a full
definition, see COHV Voluntary Standards for Four Wheel All-Terrain Vehicles and for Recreational Off-Highway Vehicles at www.cohv.ca 2 Enhanced vehicles inlcude trailers, trailer hitches and larger vehicles used for purposes of participating in ATV and
SxS recreation.

3
Annual direct operating expenditures amounted to an additional $5.0 billion to $6.7 billion.
Direct operating expenditures encompass those on ATV and SxS gear and activities including
special clothing e.g. helmets and goggles; gasoline and paid repair and maintenance; food and
beverages at ATV and SxS events and shows; accommodations (camping, hotel and motels and
recreational vehicles); travel to and from ATV and SxS events; and related membership fees in
clubs and associations as well as related entertainment.
Table E-2 summarizes 2015 key operating expenditures by ATV and SxS recreationalists for the
10% and the 8.6% attrition cases. Because the number of ATVs and SxSs differ in the two cases
and affects each type of direct operating expenditure, the gap between the 10% case and 8.6%
case widens relative to the investment one where only the enhancement of on-highway
vehicles associated with ATV and SxS recreation was impacted.
Combined, the investment and operating expenditure data have annual impacts of $6.1 billion
to $7.9 billion. These data include licenses and volunteer time which are outside of Statistics
Canada’s analytical framework. Because volunteer time is not covered within Statistic Canda’s
Input/Output (I/O) framework and licensing fees are not recycled back into ATV and SxS
impacts, Smith Gunther has set aside direct volunteer time valued at 40%, standard in cost-
benefit analysis, of provincial average wage and salaries. Had it been included, volunteer time
would have been valued at $554 to $858 million in the 10% and 8.6% cases. Estimated annual
licensing fees amount to a further $99 to $123 million. Inclusion of these expenditures would
have enhanced the impacts from ATV and SxS recreational activities. In particular, inclusion of
volunteer time would add $1.1 to $1.7 billion to total values shipped. Omitting these
expenditures further underlines the conservative nature of the estimates in this report.
Direct and indirect domestic expenditures by Canadian riders of ATVs and SxSs accrue to
Canadian suppliers. Due to a lack of data, these numbers do not cover expenditures by
foreigners riding in Canada. In that way, both the 10% and 8.6% cases are conservative.
Table E-2: 2015 Key Operating Expenditures in ATV and SxS Activities ($millions)
Operating Expenditures\Cases Low (10%) High (8.6%)
Repair & maintenance 1,142.7 1,513.6
Gasoline for ATVs and SxSs 724 948
Food and beverages 652 837
Casualty & liability insurance 568 773
Accommodation excluding RV expenditures 334 378
Ground transportation 177 228

4
Club & trail fees 445 534
Entertainment 196 226
Other 85 306
Total included in further analysis 4,324 5,743
Licenses 99 123
Volunteer time* 584 858
Excluded from further analysis 683 981
Total 5,007 6,724 Sources: Smith Gunther Associates Ltd. based on annual sales data of ATVs and survey data for SxSs.
Note: *The survey established the amount of volunteer time by province which was extrapolated to cover
provincial ATV and SxS recreationalists and evaluated at 40% of average hourly wages and salary rates in
each province in line with standard practices for benefit-cost analysis.
Total expenditures impacted total value shipped – the sum of the value shipped by all
participants in the supply of goods and services to ATV and SxS recreationalists – by $8.5 billion
to $10.8 billion. These expenditures all contributed to improved national economic
performance. But, as explained in the value shipped section, total value shipped includes raw
materials and many other inputs being counted several times, which must be taken into
account when considering the use of this economic indicator.
Table E-3 summarizes other key national economic impacts, presented in greater detail in the
text.
Table E-3: Key 2015 National Economic Impacts of ATV and SxS in Canada Low and High Cases
($1,000 Unless Otherwise Noted)
Cases Low (10%) High (8.6%)
Metric\Type of Impacts
Direct & Indirect
Induced Total Direct & Indirect
Induced Total
Domestic Expenditures
5,501,040* 1,535,382 7,036,422 6,916,210 1,949,127 8,865,337
GDP 3,499,414 1,048,263 4,547,676 4,449,224 1,330,685 5,779,909
Labour income 2,196,606 496,336 2,692,942 2,788,907 630,377 3,419,283
Employment (# FTEs)
39,176 8,753 47,929 50,105 11,108 61,213
Total taxes 1,223,151 317,492 1,540,643 1,499,664 393,081 1,892,746
Taxes on products 669,984 152,925 822,909 848,855 193,918 1,042,773
Taxes on production 135,167 81,099 216,266 171,809 103,293 275,101
Income taxes 418,000 83,469 501,469 479,000 95,871 574,871 Source: Based on Statistics Canada Input/Output (I/O) runs submitted and interpreted by Smith Gunther
Associates Ltd.

5
Note: *Because direct expenditures provide the total impetus for this analysis there are no indirect domestic
expenditures. All rows and tax columns may not add due to rounding. Direct and indirect economic activities
occur within Canadian supply lines of goods and services purchased by ATV and SxS recreationalists. Given the
inclusion of indirect expenditures and other statistical adjustments, “Domestic Expenditures” are similar but not
equal to the sum of direct expenditures from the first two tables.
In the 10% case, direct and indirect domestic expenditures of $5.5 billion – net of product and
production taxes, and imports net of exports but including subsidies – add $3.5 billion to direct
and indirect Gross Domestic Product (GDP). GDP includes direct and indirect labour force
income of $2.2 billion attracting employment measured as 39,176 full-time equivalents (FTEs).
The case also generates $1.2 billion in various direct and indirect taxes.
For the 8.6% case indicate, direct and indirect domestic expenditures of $6.9 billion - net of
product and production taxes, and imports net of exports but including subsidies - add $4.5
billion to direct and indirect Gross Domestic Product (GDP). GDP includes direct and indirect
labour force income of $2.7 billion attracting employment measured as 50,105 full-time
equivalents (FTEs). This 10% case also generates $1.5 billion in various direct and indirect taxes.
After paying income taxes and setting aside savings, incremental labour force incomes facilitate
additional consumption which yields induced impacts, documented in the second and fifth
columns. Added to the direct and indirect impacts these result in total impacts in columns 3
and 6.
Total domestic expenditures range from $7.0 billion to $8.9 billion generating GDP of $4.5
billion to $5.8 billion. GDP includes labour force incomes of $2.7 billion to $3.4 billion. Tax
revenues as a result of ATV and SxS expenditures yield $1.5 billion to $1.9 billion. Further,
these activities and related expenditures generate fuller employment by 47,921 to 61,213
FTEs3.
In the 10% case, total employment impacts were concentrated in retail (20%), paid repair and
maintenance (19%), food and accommodations, (15%) and finance and real estate (8%). Other
sectors attracting 5% or more of total employment were: administrative services,
manufacturing, wholesaling and warehousing, transportation, and entertainment services.
Professional and scientific services including research and development made up another 3% of
additional employment.
In the 8.6% case, total employment impacts were concentrated in retail (20%), paid repair and
maintenance (16%), food and accommodations, (14%) and finance and real estate (8%). Other
3 To convert national FTEs generated from ATV and SxS recreation to jobs, multiply the FTEs by 1.142. Warning:
these ratios do differ between the nation and provinces and among the provinces.

6
sectors attracting 5% or more of total employment were: administrative services,
manufacturing, wholesaling and warehousing, and transportation services. Professional and
scientific services including research and development made up another 3% of additional
employment.
Multipliers, defined here as ratios of total impacts relative to their direct expenditure, were
generally higher for those provinces with positive interprovincial trade balances, especially in
Ontario and British Columbia. The high capital intensity and low labour intensities of fossil fuel
production meant that Alberta’s multipliers were above the national one for GDP, but below
national ones in employment and labour income despite its relatively high wage and salary
levels compared to other provinces in 2015.
When considering Canada’s industry as a whole, the provincial multipliers in this report should
be utilized. When considering the industry solely from a provincial perspective, those with net
interprovincial trade gains, namely Ontario and British Columbia, would no longer benefit from
enhanced provincial impacts, and in this case national multipliers should be used. Multipliers
from all other provinces would not be affected because they are not greatly impacted by net
trade gains.
Detailed level results of provincial impacts are contained in Appendix 2 of this report. They
confirm that multiplier effects are strongest in provinces which are net beneficiaries of
interprovincial trade and where industrial linkages within the province are the strongest.
Ontario has the strongest overall multipliers followed by British Columbia. Alberta benefits
from strong value shipped and GDP multipliers and Quebec has above national employment
and labour force income multipliers.
Appendix 1 includes the survey of riders conducted in Phase 2 of the study. Detailed provincial
impacts are contained in Appendix 2. Appendix 3 contains a Glossary of terms.
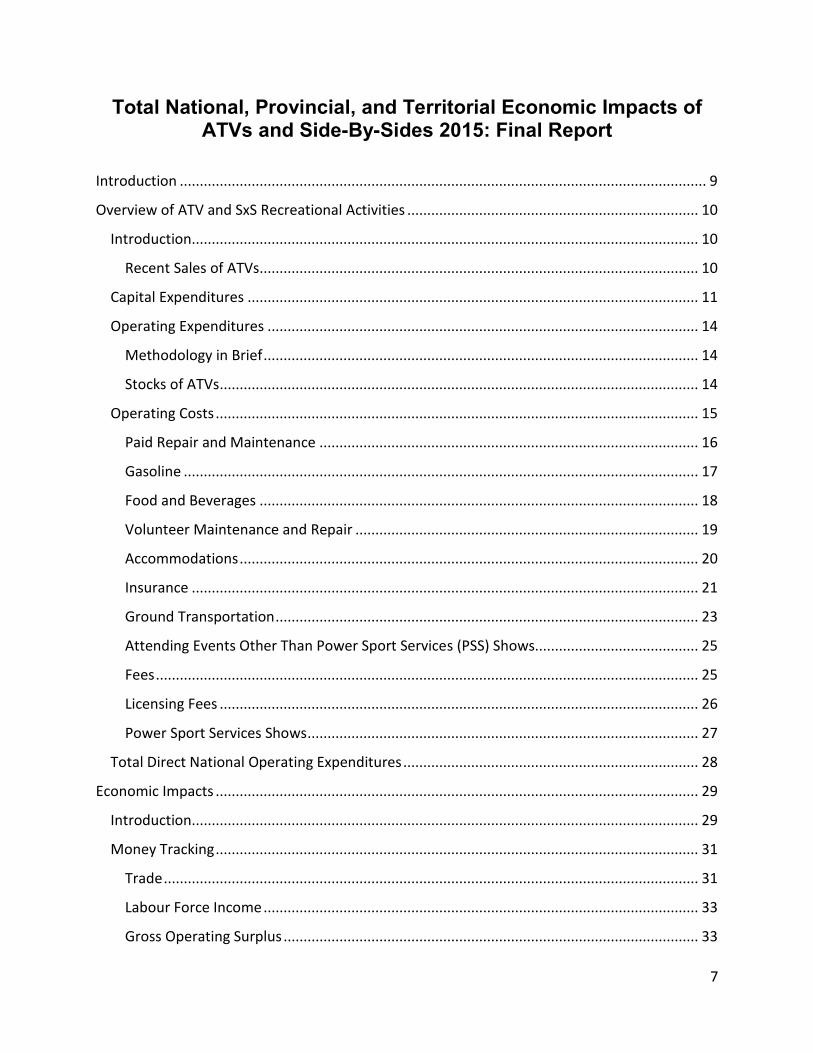
7
Total National, Provincial, and Territorial Economic Impacts of ATVs and Side-By-Sides 2015: Final Report
Introduction .................................................................................................................................... 9
Overview of ATV and SxS Recreational Activities ......................................................................... 10
Introduction............................................................................................................................... 10
Recent Sales of ATVs .............................................................................................................. 10
Capital Expenditures ................................................................................................................. 11
Operating Expenditures ............................................................................................................ 14
Methodology in Brief ............................................................................................................. 14
Stocks of ATVs ........................................................................................................................ 14
Operating Costs ......................................................................................................................... 15
Paid Repair and Maintenance ............................................................................................... 16
Gasoline ................................................................................................................................. 17
Food and Beverages .............................................................................................................. 18
Volunteer Maintenance and Repair ...................................................................................... 19
Accommodations ................................................................................................................... 20
Insurance ............................................................................................................................... 21
Ground Transportation .......................................................................................................... 23
Attending Events Other Than Power Sport Services (PSS) Shows......................................... 25
Fees ........................................................................................................................................ 25
Licensing Fees ........................................................................................................................ 26
Power Sport Services Shows .................................................................................................. 27
Total Direct National Operating Expenditures .......................................................................... 28
Economic Impacts ......................................................................................................................... 29
Introduction............................................................................................................................... 29
Money Tracking ......................................................................................................................... 31
Trade ...................................................................................................................................... 31
Labour Force Income ............................................................................................................. 33
Gross Operating Surplus ........................................................................................................ 33
8
Taxes ...................................................................................................................................... 34
Induced Impacts, Total Impacts, and Multipliers ...................................................................... 34
Value Shipped ........................................................................................................................ 35
GDP ........................................................................................................................................ 37
Labour Income ....................................................................................................................... 39
Employment .......................................................................................................................... 40
Provincial Results ...................................................................................................................... 49
Conclusions ................................................................................................................................... 50
Appendix 1: Smith Gunther Survey of Riders ............................................................................... 56
Appendix 2: Provincial and Territorial Economic Snapshots ........................................................ 61
British Columbia ........................................................................................................................ 62
Alberta ....................................................................................................................................... 66
Saskatchewan ............................................................................................................................ 70
Manitoba ................................................................................................................................... 74
Ontario ...................................................................................................................................... 78
Quebec ...................................................................................................................................... 82
New Brunswick .......................................................................................................................... 86
Prince Edward Island ................................................................................................................. 90
Nova Scotia ................................................................................................................................ 94
Newfoundland ........................................................................................................................... 98
Appendix 3: Glossary .................................................................................................................. 102
9
National, Provincial, and Territorial Economic Impacts Of ATVs and Side-By-Sides 2015: Final Report
Introduction At the outset of 2016, the Canadian Off-Highway Vehicle Distributors Council (COHV) contracted Smith Gunther Associates Ltd. to undertake a national, provincial, and territorial economic impact study of the use of all-terrain vehicles (ATVs) and side-by-sides (SxSs) in Canada. This report first establishes total 2015 provincial and national direct expenditures by off-highway riders on ATVs and side-by-side (SxS) less than 80 inches wide4. Vehicles in excess of 80 inches wide are excluded from the ranks of off-highway recreational vehicles. While current sales of ATVs and SxSs are integral to 2015 expenditures, they are only part of all expenditures on ATV and SxS activities. Other expenditures include upkeep and operations of the entire stock of all ATVs and SxSs that is the surviving stock of ATVs and SxSs sold in all years dating back to 1994 for ATVs and 2006 for SxS5, enhancements of any on-highway vehicles to facilitate ATV or SxS recreational activities, paid repair and maintenance, gasoline for ATVs and SxSs, membership fees, licensing costs, attendance at events and off-highway vehicle shows and related travel, e.g. mileage charges, food and beverages and accommodation. This comprehensive study updates an earlier 2006 study, also conducted by Smith Gunther, which examined the economic impact of ATVs specifically. Both of these reports are a snapshot in time of the economic impacts of ATV and SxS recreational activities. Since the 2006 study, SxSs have become a factor and both data sources and geographic information systems have improved facilitating increased direct expenditures and availability of data to analyze the impacts. To gather data, Smith Gunther attended and interviewed attendees at the Motorcycle and ATV shows owned by Power Sport Services – a for-profit incorporated division of the Canadian Off-Highway Vehicle Distributors Council. Smith Gunther supplemented information gathered through these interviews with telephone calls with club executives. A survey was subsequently developed for ATV and SxS recreationalists, and distributed with the support of the national and provincial clubs. A total of 2,977 enthusiasts responded. The respondents provided sufficient information to be confident in provincial level as well as national responses. In addition to the survey data, COHV records were useful in providing annual sales of ATVs
4 For a full definition, see Canadian standard for All-Terrain Vehicles and Recreational Off-Highway Vehicles at
www.cohv.ca. 5 2006 is the year in which SxSs started being sold for recreational purposes.

10
This report contains national level responses with cross references to the provinces covering
direct, indirect and induced impacts. Direct impacts are those which relate specifically to ATV
and SxS capital expenditures and operating expenses. Indirect impacts occur because goods and
services from industries other than the ones making the final product to satisfy ATV and SxS
recreational expenditures are needed to assemble, manufacture, mine, transport, insure and
finance inputs and final products. Induced impacts are driven by expenditures of direct and
indirect labour force incomes earned by those supplying all demands. The sum of these three
types of impacts is the total impact.
Smith Gunther presents more comprehensive provincial coverage in Appendix 2 with separate
sections for each province. Because the statistical tools utilized to analyze the data provided
unstable responses for areas with small populations, indirect and induced impacts for Prince
Edward Island need to be treated with care and Territorial results are limited to the direct
impacts only.
Overview of ATV and SxS Recreational Activities
Introduction
Among the key metrics by province is the stock of currently operating ATVs and SXSs. The stock
of ATVs and SxSs in each province is an important number because operating expenditures per
ATV or SxS need to be multiplied by the number of vehicles.
This chapter starts with capital expenditures by province including annual sales of ATVs
provided by COHV, . From this point, sales of SxSs were estimated along with other capital
expenditures on enhanced transportation equipment such as trailers and trailer hitches and
larger vehicles for purposes of participating in ATV and SxS recreation. It also establishes two
annual attrition rates applied to current and historical sales to derive estimates for the 2015
stock of ATVs and SxSs in use; a survey-based 8.6% attrition rate and a more conservative
attrition rate of 10% based on attrition rates of other recreational vehicles such as personal
snowmobiles.
Recent Sales of ATVs
Table 1 illustrates ongoing steady national demand for ATVs, 2010-2015. Sales downturns in provinces most heavily dependent on petroleum and other natural resources were generally offset by upturns in other provinces, particularly in the Atlantic Region.

11
Table 1: Retail ATV Sales by Jurisdiction: (Units 2010-2015)
Jurisdiction 2010 2011 2012 2013 2014 2015
British Columbia 4,808 4,143 4,342 4,003 4,200 3,953
Alberta 9,734 8,649 9,245 9,468 9,199 7,472
Saskatchewan 3,998 4,008 4,373 4,026 3,619 3,435
Manitoba 2,914 2,603 2,821 2,463 2,518 2,405
Ontario 12,513 11,073 11,320 11,528 11,244 12,268
Quebec 15,103 12,534 12,027 11,623 11,068 10,645
New Brunswick 2,314 1,887 2,228 2,203 2,319 2,324
Prince Edward Island 159 176 258 240 241 277
Nova Scotia 1,291 1,416 1,638 2,045 2,327 2,460
Newfoundland 2,767 2,752 3,297 3,676 3,973 4,113
Northwest Territories 233 498 257 221 190 276
Yukon Territory 218 205 211 183 186 168
Nunavut 465 224 457 459 488 390
Total 56,517 50,168 52,474 52,138 51,572 50,186
Source: COHV
Alberta's 1,615 downturn in sales in 2015 or -18.44% exceeded that of the nation as noted in the table. 2015 nationally, unit sales were down YTD by 1,511 or -3.12%.
Provinces bucking this national trend were generally less economically reliant on petroleum and other mineral-based resources. Between 2014-15, modest growth was focused in Ontario, the Atlantic Provinces and the Northwest Territories. High percentage growth was concentrated in the small markets of Prince Edward Island and the Northwest Territories.
Nationally, retail ATV sales in units have been relatively flat (51,321±1,153) since 2011 when side-by-sides started being marketed more intensively than previously for recreational purposes. Historically, Quebec has led all other jurisdictions in retail sales followed by Ontario and Alberta. It was not until 2014 that Ontario retail sales exceeded those in Quebec.
Capital Expenditures
Recent annual expenditures on new ATVs are part of what enters Smith Gunther’s macro-economic analysis of investments in ATV recreational activities. Table 2 values estimated national sales in dollars of the year in which sales occurred.
Table 2: Estimated National Sales of ATVs. (Current $1,000s)
Year 2010 2011 2012 2013 2014 2015
Sales 645,199 588,271 672,938 665,804 711,734 643,778 (P)
12
Direct capital expenditures by province included in this study cover new purchases of both ATVs and SxSs less than 80 inches wide. Also included are purchases of larger than otherwise required on-road enhanced vehicles dedicated to off-road activities, e.g. trucks, vans and RVs. The COHV has provided 2015 data on both ATV unit sales and revenues by jurisdiction. In
addition, parallel COHV annual records from previous years have been sufficient to generate
estimates of the stocks of ATVs by jurisdiction. Smith Gunther estimated the current purchases
and stocks of operating SXSs from the above data by utilizing the ratio of SXSs to ATVs by
province derived from the survey (See Appendix 1). It included questions of both the numbers
of ATVs and SXSs and their age so 2015 purchases could be identified by household from the
survey. In keeping with the survey data, the stock data for ATVs stretched back to 19946.
Because the sale of SxSs for recreational purposes began in 2006 and data are generally not
available for those sales, estimates of the stock of SxSs come from the survey results by
jurisdiction on the number of families with access to both ATVs and SxS in 2015.
Smith Gunther and the COHV designed their survey of ATV and SxS operators to specifically
identify additional capital expenditures related to their on-road transportation as well as off-
road activities. These data included purchases of enhanced trucks, larger vehicles than would
otherwise be used by families, as well as RVs and trailers deployed in off-road recreation.
Based on provincial extrapolations by Smith Gunther, the estimated national incremental
capital stock from these enhanced vehicles is $840 million to $1.6 billion. At ten per cent
renewal rates, in 2015 these incremental purchases amount to $84 to 159 million. Noted in
Table 3, 2015 total Canadian ATV and SxS recreationalists’ capital expenditures on new ATVs,
new SxSs and new enhanced vehicles amounted to $1.1 billion $1.2 billion.
6 The attrition rate assumed for the stocks was 10%.

13
Table 3: Capital Expenditures 2015 (Values in Millions $)
Jurisdiction ATVs SxSs Enhanced Transportation
Total
Units Value Units Value Minimum $ Maximum $ Minimum $ Maximum $
BC 3,953 50.7 2,442 37.6 6.1 11.3 94.4 99.6
AB 7,472 95.8 6,508 100.2 36.2 68.8 232.2 264.8
SK 3,435 44.1 1,963 30.2 5.5 13.6 79.8 87.9
MB 2,405 30.9 802 12.3 2.9 4.1 46.1 47.3
ON 12,268 157.4 2,197 33.8 9.5 18.9 200.7 210.1
QC 10,645 136.6 6,083 93.6 18.3 33.0 248.5 263.2
NB 2,324 29.8 1,384 21.3 1.5 2.5 52.6 53.6
PE 277 3.6 82 1.3 0.1 0.1 4.9 4.9
NS 2,460 31.6 1,287 19.8 1.5 2.7 52.9 54.1
NL 4,113 52.8 1,530 23.6 1.7 2.9 78.0 79.2
NW & NU 444 5.7 237 3.7 0.6 1.1 10.0 10.5
YK 390 5.0 82 1.3 0.2 0.4 6.7 6.9
Canada 50,186 644 24,597 379 84.0 159.3 1,107 1,182
Sources: COHV for ATVs and Smith Gunther extrapolations from the Survey.
The provincial leader in the acquisition of enhanced on-road transportation equipment is
Alberta reflective of both greater distances travelled and a relatively high propensity to travel
by RVs. As Chart 1 shows, RV7 usage is concentrated generally in Western Canada and Alberta
in particular.
Chart 1: Capital Outlays for Enhanced Vehicles by Province and Territory 2015 (Millions $)
7 “RV” is meant in the narrow sense to refer to mobile homes throughout.
14
Operating Expenditures
Methodology in Brief
Expenditures on recreational ATV and SxS activities underpin the key tool to carrying out the analysis - Statistic Canada’s Input Output structure. It requires that all direct expenditures on the recreational activity of ATVing and side-by-siding be set in single year dollar values. Once all direct expenditures are estimated, the Input Output (I/O) tables are used to estimate the indirect impacts – those needed to supply inputs to industries producing final new products for recreational ATVing and side-by-siding. In addition, the same I/O framework is used to estimate further economic impacts induced from the incremental wage and salary earnings being spent. It is these derived expenditures by those earning from ATV and side-by-side expenditures that result in the multiplier effects whereby the economy increases by more than the initial direct expenditures by ATV and SxS participants. In addition, these impacts are augmented further by induced impacts as expenditures of increased labour income stimulate the economy. The sum of the direct and indirect impacts divided by direct expenditures is the direct multiplier. Adding induced impacts to the former numerator while still dividing by the direct impacts yields the total multiplier.
Stocks of ATVs
Unlike new retail sales of ATVs, SxS, and new enhanced transportation equipment, which are capital figures, the activities of ATVing and side-by-siding also involve operating costs for the entire operational stock of ATVs, SxSs, and enhanced transportation equipment. From the survey results, Smith Gunther estimated expenditures per ATV and SxS and additional expenditures on enhancements by each vehicle operator, e.g. safety gear, and consumables that are all part of the direct expenditures for the sport. In order to aggregate average expenditures within each province, it is useful to estimates operational stocks of ATVs and side-by-sides. From annual ATV unit sales and historical data back to 1994, Smith Gunther has estimated the current total number of operating ATVs by jurisdiction. In doing so it has used an annual attrition rate of 10%. While this might sound high, it does results in 12.8% of those sold in 1994 still being in operation today. A lower annual attrition rate of 8.6%, results in more ATVs remaining operational. The Smith Gunther survey results favor utilizing the higher case based on the 8.6%, but the lower case is more in-line with attributions on other recreational vehicles. The operational ATVs stocks and SxSs in Table 4 include those used by owners strictly on their own farms and/or private properties which do not require annual licensing in many jurisdictions. For that reason the total stock may exceed those which are licensed.

15
Table 4: Currently Operational ATVs and SxSs (2015 Units)
Jurisdiction Operational ATVs
Operational SxSs
Attrition Rate 10% 8.6% 10% 8.6% British Columbia 48,217 53,399 22,760 32,396 Alberta 114,221 127,406 82,231 106,960 Saskatchewan 37,394 41,113 20,072 29,420 Manitoba 27,681 30,701 11,896 13,726 Ontario 141,135 158,278 38,605 62,265 Quebec 166,395 188,563 81,087 125,740 New Brunswick 28,064 31,697 13,847 19,025 Prince Edward Island 2,155 2,384 486 911 Nova Scotia 24,949 28,440 10,915 16,318 Newfoundland 30,869 33,878 13,836 19,893 Northwest Territories 2,591 2,851 1,181 1,690 Yukon Territory 2,370 2,664 1,081 1,546 Nunavut 3,568 3,891 1,627 2,328 Total 629,609 705.264 299,624 432,219
Estimates of the stock of SxSs come from the survey results by jurisdiction on the number of families with access to both ATVs and SxS in 2015. Because the stock of ATVs had already been estimated the minimum and maximum stocks for the same attrition rates were then estimated for SxSs over the more limited time period over which they have been available.
Operating Costs
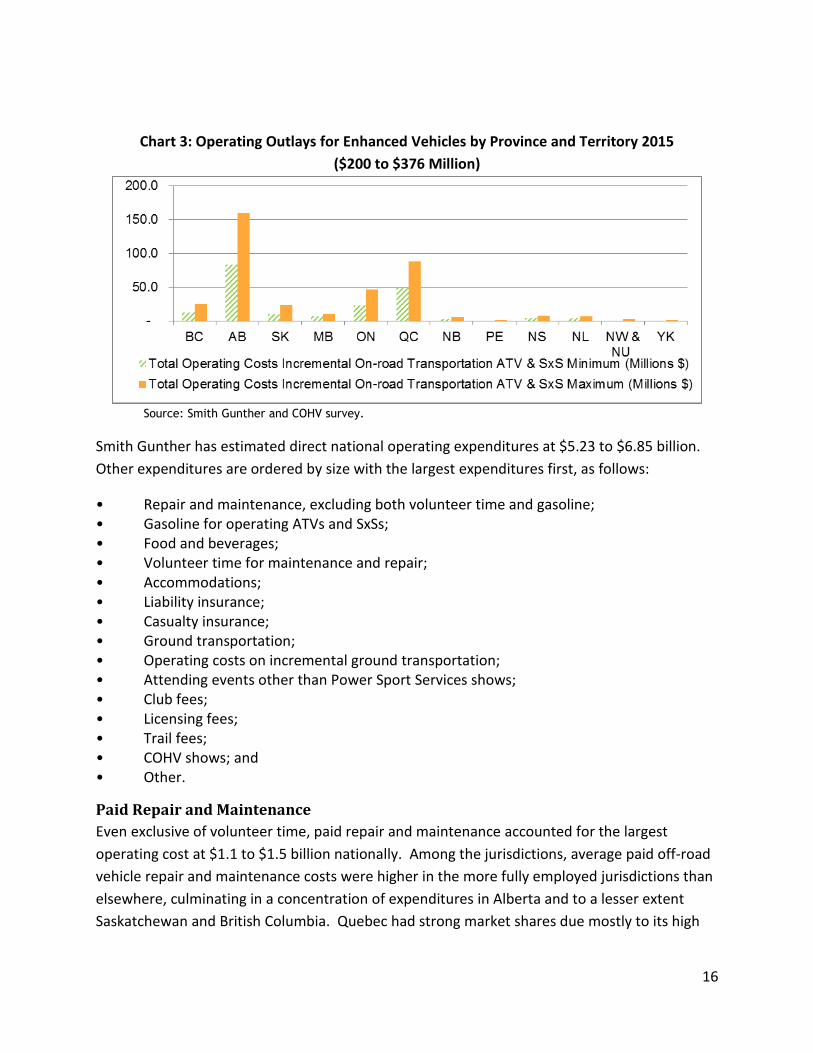
In cooperation with the national and provincial ATV and SxS riding associations, specific operating costs were determined from Smith Gunther’s survey of provincial riders including information on specific expenditures such as licensing, insurance, repair and maintenance and purchases of incidentals and transportation services by ATV and side-by-side owners. Power Sport Services’s separate surveys of attendees at its Motorcycle and ATV shows have been examined to determine expenditures in travelling to and from the shows and on consumables at the shows. According to respondents, operating costs for enhanced vehicles range from $200 to $376
million. Chart 3 illustrates the geographical distribution of operations related to the stock of
enhanced vehicles.
16
Chart 3: Operating Outlays for Enhanced Vehicles by Province and Territory 2015
($200 to $376 Million)
Source: Smith Gunther and COHV survey.
Smith Gunther has estimated direct national operating expenditures at $5.23 to $6.85 billion.
Other expenditures are ordered by size with the largest expenditures first, as follows:
• Repair and maintenance, excluding both volunteer time and gasoline; • Gasoline for operating ATVs and SxSs; • Food and beverages; • Volunteer time for maintenance and repair; • Accommodations; • Liability insurance; • Casualty insurance; • Ground transportation; • Operating costs on incremental ground transportation; • Attending events other than Power Sport Services shows; • Club fees; • Licensing fees; • Trail fees; • COHV shows; and • Other.
Paid Repair and Maintenance
Even exclusive of volunteer time, paid repair and maintenance accounted for the largest
operating cost at $1.1 to $1.5 billion nationally. Among the jurisdictions, average paid off-road
vehicle repair and maintenance costs were higher in the more fully employed jurisdictions than
elsewhere, culminating in a concentration of expenditures in Alberta and to a lesser extent
Saskatchewan and British Columbia. Quebec had strong market shares due mostly to its high

17
participation rates in off-road riding. Despite its dominance of population, repair and
maintenance in Ontario was modest as noted in Chart 4.
Chart 4: Percentage Shares of Paid Repair and Maintenance ($1.14 to $1.5 billion)
Source: Smith Gunther and COHV survey.
Gasoline
For simplification, Smith Gunther has modelled both ATVs and SxSs as being fueled by gasoline
rather than dividing fuels between gasoline and diesel. Despite falling fuel costs during the
year, the second largest operating cost was gasoline used in off-road operations at $724 to
$948 million for the nation. This figure excludes on-road consumption of gasoline from
travelling to and from off-road activities and events. Fuel consumed in transit is included with
ground transportation and comes out of the modelling exercise as an indirect impact.
Jurisdictional shares are determined by the stock of off-road vehicles, average usage and the
price of gasoline by jurisdiction. Due to the scarcity of data for all three territories, the impact
of higher gasoline prices in these areas is not fully taken into account.

18
Chart 5: Percentage Shares of Off-Road Gasoline Consumption ($724 to $948 million)
Source: Smith Gunther and COHV survey.
Food and Beverages
In 2015, off-road riders fueled not only their vehicles but also themselves with food and
beverage consumption valued at $652 to $836 million. These figures include meals on the road
and consumed at off-road events and shows. Regional expenditure patterns are similar to the
shares of expenditures listed in Charts 4 and 5, and reflective of the relative affluence of each
province as noted in Chart 6.

19
Chart 6: Percentage Shares of Food and Beverage Consumption ($652 to $836 million)
Source: Smith Gunther and COHV survey.
Volunteer Maintenance and Repair
In addition to paid expenditures on ATVs and SxSs, owners dedicated volunteer time to that
activity on their own off-road vehicles as well as those of their compatriots. The survey asked
respondents to note the number of days each dedicated to this activity as well as the number
of off-road vehicles owned by them. From that data, Smith Gunther developed the average
volunteer time devoted to each off-road vehicle by jurisdiction which was then extrapolated by
jurisdictional stocks of off-road vehicles amounting nationally to 15.2 and 18.9 million person
days. By valuing this time at 40% of the average wage and salaries in each jurisdiction, Smith
Gunther assessed the value of this volunteer time at $584 to $658 million.
The regional shares illustrated in Chart 7 highlight the greater concentration of this activity in
Quebec and the Atlantic Provinces relative to elsewhere in the country, especially relative to
paid maintenance.

20
Chart 7: Percentage Shares of the Value of Volunteer Repair and Maintenance ($584 to $658
million)
Source: Smith Gunther and COHV survey.
Accommodations
Chart 8 illustrates regional differences in the percentages of respondents staying in different
types of accommodation. Newfoundland and Territorial results have been approximated by
Maritime and National outcomes adjusted to stocks in each jurisdiction. Ready access to
northern Lake Country may influence cabin use in the Prairie Provinces. East of Ontario, there
was greater utilization of motels. Mobile homes/RVs are much more popular in the West than
elsewhere.
Chart 8: Percentages of Respondents Utilizing Types of Accommodations (%)

21
Source: Smith Gunther and COHV survey.
Expenditures on hotel accommodation in each province and territory were valued at the
highest of concessionary Federal government rates in large cities as posted by Treasury Board.
Taking the highest rates allowed by Treasury Board offsets the discounts achieved through
concessionary rates. Smith Gunther applied this rate to cabins and to bed and breakfast
accommodations but discounted it by 20% for motels. Stays with friends and families were cost
at $25 per night again within the confines of Treasury Board rules. Under these conditions,
2015 paid accommodations by off-road riders at events and shows nationally amounted to
$334 to $378 million. Shares of accommodation expenditures among Canadian jurisdictions
were distributed as depicted in Chart 9.
Chart 9: Percentage Shares of Expenditures for Paid Accommodation ($334 to $378 million)
Source: Smith Gunther and COHV survey.
The relatively low shares of paid accommodations in the western provinces, and to some
degree Ontarians, result from their greater use of RVs which were not included in the paid
accommodations because they are included in ground transportation. Relative to their other
expenditures, Atlantic residents make up a relatively large share of those staying in paid
accommodations.
Insurance
Combined off-road riding annually generates liability and casualty insurance premiums of $568
to $720 million.

22
Liability Insurance
Of the two types of insurance, liability is the larger at $316 to $395 million. Chart 10 contains
the regional shares. Of note is that liability insurance is one of the higher expenditures in
Ontario, not because of a concentration of the industry in the province but because Ontario
consumers pay higher liability rates insurance relative to the rest of the country.
Chart 10: Percentage Shares of Liability Insurance ($316 to $395 million)
Source: Smith Gunther and COHV survey.
Casualty Insurance
National premiums for casualty insurance in 2015 were $253 to $325 million. Chart 11 breaks
out regional shares with a greater concentration in Quebec than is present in other provinces.

23
Chart 11: Percentage Shares of Casualty Insurance ($253 to $325 million)
Ground Transportation
Smith Gunther has estimated two aspects of ground transportation. The first has to do with
transportation related to off-road riding, club and show activities in standard vehicles by those
not owning enhanced vehicles. The second involves the incremental costs of utilizing enhanced
vehicles for those same journeys. Together nationally they result in expenditure estimates of
$377 to $598 million.
Ground Transportation in Standard Vehicles
Normal ground transportation is estimated at $176 to $222 million. Given high frequency in
the use of off-road vehicles and low shares of RVs, Quebecers dominate (44%) in this type of
expenditure as noted in Chart 12.

24
Chart 12: Percentage Shares of Normal Ground Transportation ($176 to $222 million)
Source: Smith Gunther and COHV survey.
Enhanced Vehicle Transportation
Investments in enhanced vehicles lead to additional ground transportation operations and
upkeep expenditures. In 2015, these operating expenditures reached $200 to $376 million.
Chart 13 emphasizes the Ontario and Western orientation of enhanced vehicles to undertake
off-road activities. While the province west of Quebec expended 41% of normal ground
transportation, they spent 71% of the larger enhanced ground transportation funds. Ontario
led enhanced ground transportation expenditures at 29%.
Chart 13: Percentage Shares of Ground Transportation Expenditures on Enhanced Vehicle
Operations ($200 to $376 million)

25
Attending Events Other Than Power Sport Services (PSS) Shows
Participants in off-road activities attended several related events for training, competitions,
socializing and simply riding with or without friends. National estimates of additional funds
spent on these activities ranged from $192 to $222 million. Because PSS has separate data
about their own shows, these figures are net of expenditures at PSS shows in order to avoid
double counting.
Chart 14 identifies expenditures to attend these events are concentrated in Quebec and
Alberta.
Chart 14: Percentage Shares of Expenditures Attending Events Other Than PSS Shows ($192 to $222 million)
Source: Smith Gunther and COHV survey.
Fees
Fees are charged for club memberships, use of other club’s trail and for licenses. Smith
Gunther’s national estimate of these combined fees is $297 to $365 million.
Club
Club fees consist of club memberships which include trail passes or, where riders do not belong
the club managing the trail, trail passes must be purchased separately. Smith Gunther’s
estimate for national spending on club fees is between $104 and $127 million. These fees are
concentrated in Quebec as noted in Chart 15.
Encouraging riders to join clubs continues to be an issue particularly in the West. With clubs
responsible for building, extending and maintaining trails, it is necessary for all trail users to
carry their share of the work. The New Brunswick ATV Federation Inc. has been particularly
diligent in expanding its membership, while the Prince Edward Island ATV Federation is in its
infancy. Various Ontario clubs are working together to put trail loops in place capable of
handling week-long excursions. But all these projects require time and effort from club

26
member volunteers not just in maintaining trails but in encouraging trail users to be
considerate of adjacent residences and private property owners.
Chart 15: Percentage Shares of Club Fees ($104 to $127million)
Source: Smith Gunther and COHV survey.
Other Trail Fees
Clubs earn other trail fees from non-members who make use of their trails. Nationally, Smith
Gunther estimates these to be $95 to $115 million. Given ready access to logging roads, the
scarcity of trail fees in British Columbia and Nova Scotia is understandable (see Chart 16). On
the other hand, the hard work that has gone into maintaining trails in Quebec and Ontario is
clearly being rewarded with trail fee revenues concentrated in those jurisdictions.
Chart 16: Percentage Shares of Trail Fees ($95 to $115 million)
Source: Smith Gunther and COHV survey.
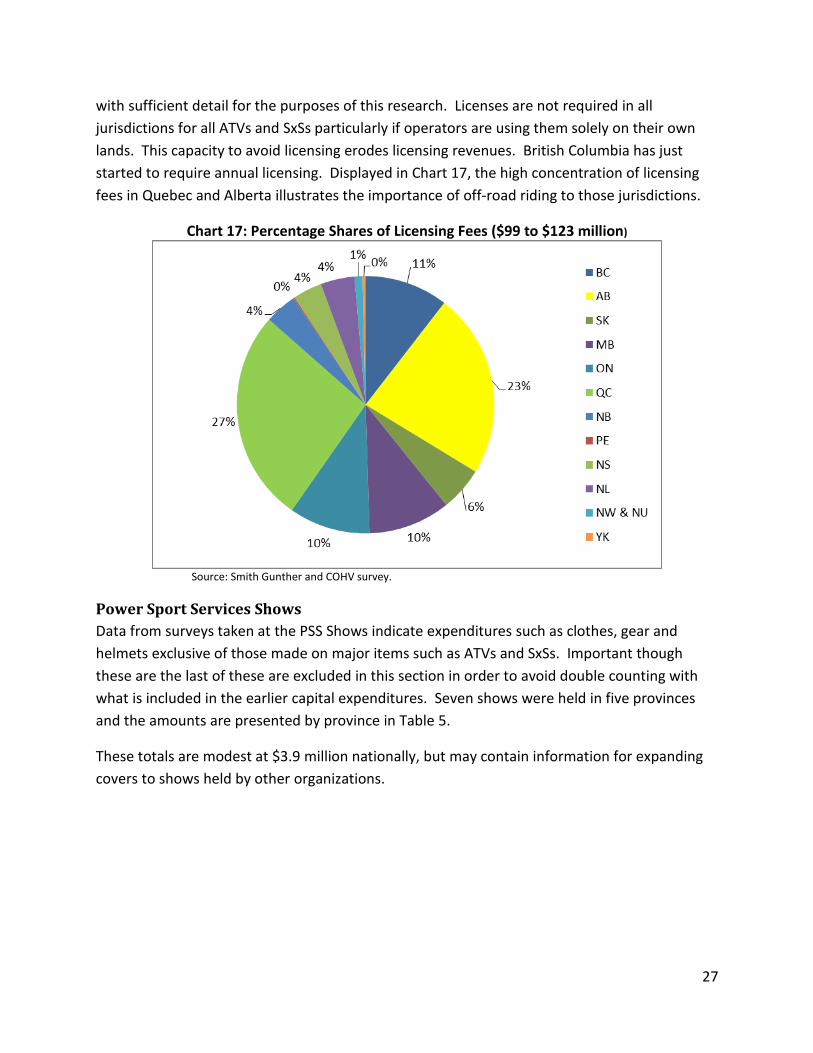
Licensing Fees
Generated from the survey, Smith Gunther’s national estimate of 2015 licensing fees is $99 to
$123 million. While various provincial governments post data on licenses issued, none operate
27
with sufficient detail for the purposes of this research. Licenses are not required in all
jurisdictions for all ATVs and SxSs particularly if operators are using them solely on their own
lands. This capacity to avoid licensing erodes licensing revenues. British Columbia has just
started to require annual licensing. Displayed in Chart 17, the high concentration of licensing
fees in Quebec and Alberta illustrates the importance of off-road riding to those jurisdictions.
Chart 17: Percentage Shares of Licensing Fees ($99 to $123 million)
Source: Smith Gunther and COHV survey.
Power Sport Services Shows
Data from surveys taken at the PSS Shows indicate expenditures such as clothes, gear and
helmets exclusive of those made on major items such as ATVs and SxSs. Important though
these are the last of these are excluded in this section in order to avoid double counting with
what is included in the earlier capital expenditures. Seven shows were held in five provinces
and the amounts are presented by province in Table 5.
These totals are modest at $3.9 million nationally, but may contain information for expanding
covers to shows held by other organizations.

28
Table 5: Incremental Expenditures at COHV Shows
Jurisdiction Expenditures
British Columbia 563,617 Alberta (2 shows) 1,582,337 Ontario 614,541 Quebec (2 shows) 976,020 New Brunswick 199,054 Total 3,935,569
Total Direct National Operating Expenditures
Summing the above operating expenditures, Smith Gunther estimates total direct operating
impacts from $5.0 to $6.72 billion. Total direct operating expenditures emanate from
provincial and territorial activities. Quebec is the strongest followed by Alberta and Ontario in
that order as illustrated in Chart 18. Combined, the Atlantic Regional direct operating
expenditures come within a percent of Ontario’s, suggesting much higher activity per capita in
the Atlantic than in Ontario.
Chart 18: Percentage Shares of Total Direct Operating Expenditures ($5.0 to $6.72 billion)
Source: Smith Gunther and COHV survey

29
The above figures are inclusive of volunteer time of which the Input-Output (I/O) analysis takes
no account. For that reason the direct operating impacts accounted for in the I/O runs will be
net of the value of volunteer time that is net direct operation of $4.52 to $5.87 billion.
Table 6 contains the national direct operating expenditures by type.
Table 6: National Summary of Direct Operating Expenditures by Type 2015 (Million $)
Type of Operating Expenditure Minimum Estimate
Maximum Estimate
Repair and maintenance, excluding volunteer time and gasoline
1,143 1,514
Gasoline for operating ATVs and SxSs 724 948 Food and Beverages 652 836 Volunteer maintenance and repair 584 858 Accommodations 234 378 Liability Insurance 316 395 Casualty Insurance 253 325 Ground Transportation 176 222 Operating costs on Incremental Ground Transportation 200 376 Attending events other than COHV shows 192 222 Club Fees 104 127 Licensing Fees 99 123 Trail fees 95 115 Power Sport Services Shows 4 4 Other 232 282 Total 5,007 6,724
Economic Impacts
Introduction
The previous section establishes 2015 direct impacts of ATVs and side-by-sides (SxS) recreation
activities by province. Those data determine direct economic impacts - which stimulate indirect
and induced impacts - based on 10% and 8.6% case scenarios. For each measure of economic
performance, the I/O analysis yields direct impacts, direct plus indirect, and induced impacts.
Total economic impacts include direct, indirect and induced economic impacts. As noted
previously, indirect impacts occur because industries other than the ones making the final
product to satisfy ATV and SxS recreational expenditures are needed to assemble,
manufacture, mine, transport, and finance inputs into final products. Induced impacts are

30
driven by expenditures of direct and indirect labour force incomes and spending from incomes
of those supplying induced demands.
Adding capital and operating expenses, covered earlier in Table 3 and Table 6, the 10% scenario
involves total expenditures of $6.2 billion and the 8.6% one of $7.9 billion.
Licensing fees and volunteer maintenance and repair were excluded from the Input-Output
(I/O) analysis, leaving the direct expenditures applied to the economy as $5.5 billion in the 10%
case and $6.9 billion in the 8.6% case. Annual license fees on ATVs and SxSs usually accrue to
general revenue funds of provincial governments so that recycling of those funds is diffused
throughout provincial economies by government decisions that have little or nothing to do with
ATVs and SxSs. The second excluded item was estimated volunteer work by club members for
repair of their own and other members’ ATVs and SxSs, trail building, and other work dedicated
to club activities. Because no money exchanged hands, such volunteer activities are excluded
from the purview of I/O analyses which accounts only for money-based transactions.
Included direct expenditures encompass those on new ATVs, SxSs, gear, special clothing e.g.
helmets and goggles; operating expenses e.g. gasoline and paid repair and maintenance for
ATVs and SXSs; accommodations (camping, hotel and motels and recreational vehicles (RVs));
and travel to and from ATV and SxS events including any repairs on enhanced vehicles, trucks
and trailers to facilitate ATV and SxS recreational activities; and, related membership fees in
clubs and associations.
This analysis covers three measures of income: value shipped, GDP, and labour income. Value
shipped measures shipments at factory gates along supply lines from inputs to final products
(see Value Shipped section for a fuller explanation). Value shipped naturally results in double
and even multiple counting. GDP measures the value added (labour income, production taxes
and profits) at each stage of production and therefore avoids multiple counting. Labour income
is a subset of GDP measuring wages and salaries8, supplementary labour income9 and labour
8 Statistics Canada, National Income and Expenditure Accounts Volume 3: A Guide to National Income and
Expenditure Accounts, 1975, p. 120. Wages and salaries, including income in kind (i.e., board and lodging), are
estimated on a "gross" basis, that is, they are reckoned before tax deductions and before deduction of contributions
by employees to unemployment insurance, pensions and other social security schemes. Bonuses, commissions,
directors' fees, taxable allowances and retroactive wage payments are included in the year in which they are paid. 9 Ibid. Supplementary labour income is composed of other expenditures by employers on labour account that can
be regarded as payment for employees' services. Included here are employers' contributions to private pension
funds, the Canada and Quebec Pension Plans, employee welfare funds, the Unemployment Insurance Fund, and
Workmen's Compensation Funds.

31
income from unincorporated companies and individuals10.
The analysis also covers employment measured in full-time employment equivalents (FTEs).
Full-time employment consists of persons who usually work 30 hours or more per week at their
main or only job11. Equivalence to full-time employment occurs when combinations of part-
time workers within the same industry have aggregate hours on the job that equal or exceed 30
hours. There are more jobs than FTEs because some jobs require less than 30 hours per week
of employment.
Money Tracking
This section follows the funds spent directly, indirectly and induced to trace where the $5.5
billion and $6.9 billion of direct and indirect expenditures are percolating through the economy.
Following where the money goes outlines how impacts occur as part of enhancing
understanding of the national and international impacts of ATV and SxS recreational activities.
This brief exercise also identifies how national imports, interprovincial imports, inventory
accumulation, and taxes generate leakages in the flow of funds. Leakages divert funds from
geographic of demand thereby curbing subsequent economic impacts. Any leakage of funds
not recycled in the economy diminishes the total impacts that consumer expenditures will have
on Canadian or provincial economies.
Trade
On imports of units manufactured outside of Canada, most of the indirect and induced
expenditures remain outside of Canada, restricting domestic impacts. Deficits in international
trade (where imports exceed exports) lessen economic impacts while surpluses enhance the
impacts.
Table 7 traces ATV and SxS expenditures nationally and provincially. It begins with the direct
domestic expenditures on goods and services for undertaking ATV and SxS recreational
activities in each of the 10% and 8.6% cases. The next two lines capture imports of
10 Statistics Canada, National Income and Expenditure Accounts Volume 3: A Guide to National Income and
Expenditure Accounts, 1975, p. 131. Net income of non-farm unincorporated business consists of the earnings of
working proprietors from their own businesses. Such businesses are "unincorporated" as distinct from the corporate
form of organization. The estimates represent a mixture of labour and investment income that cannot be
segregated on anything but an arbitrary basis. To the extent that working proprietors supply their own labour, they
earn wages and salaries; to the extent that they supply their own capital, they earn profits, interest and rents.
These elements are inextricably mixed in the estimates of the net income field. The net rental income of persons is
also included here in order to consolidate all forms of income from non-farm unincorporated business activity in a
single category. 11
Statistics Canada, Table 282-0005 - Labour force survey estimates (LFS), by full- and part-time students during school months, sex and age group, unadjusted for seasonality, monthly. (accessed: August 06, 2016 )

32
intermediate and final international products and services with intermediate imports. The
following two lines are interprovincial imports to meet both final expenditures and
intermediate inputs among Canadian provinces and territories. While there are net trade
(exports less imports) differences among the provinces, within Canada the sum of
interprovincial imports (lines 4 and 5) must be equal to interprovincial exports (line 8).
Inventories and other commodity leakages result in relatively minor leakages from cash flows in
each case -$25 million in the 10% case and -$31 million in the 8.6% case.
Interprovincial trade in final and intermediate goods and services does not balance within each
province. In the 10% case, Ontario nets $364 million through its interprovincial exports
exceeding its interprovincial imports as do British Columbia at $25 million and Alberta at $11
million. The 8.6% case yields varying interprovincial trade impacts with Ontario at $509 million,
British Columbia at $20 million while Alberta’s net interprovincial trade results in a deficit of
interprovincial trade with imports exceeding exports by $99 million. All other jurisdictions
leaked funds to experience deficits in interprovincial trade in both the 8.6% and 10% cases.
Table 7: Following the Money: International and Interprovincial Trade ($1,000s)
Low Case (10%) High Case (8.6%)
1. Direct domestic expenditures on commodities 5,501,040 6,916,210 2. International imports (final expenditures) -726,462 - 860,679 3. International imports (intermediate inputs) -637,083 - 796,839 4. Interprovincial imports (final expenditures) -867,573 - 1,093,758 5. Interprovincial imports (intermediate inputs) -581,258 - 736,902 6. Inventories and other commodity leakages -25,231 - 30,695 7. Interprovincial exports 1,448,831 1,830,661 8. Total (GDP at market prices, by definition) 4,112,264 5,227,996
Source: Based on Statistics Canada I/O runs submitted and interpreted by Smith Gunther Associates Ltd. Columns
may not add due to rounding.
The outcome is that international imports, net interprovincial deficits and inventory leakages
reduce domestic impacts at the provincial level. Because national interprovincial trade has to
balance (Line 4+ Line 5 = -Line 7), by definition, interprovincial trade does not influence national
GDP of $4.1 billion in the 10% case and $5.2 billion in the 8.6% case.
GDP at market prices includes taxes on products but is net of product subsidies whereas GDP at
basic prices is net of taxes on products but includes any subsidies on products as indicated in
the first six lines of Table 8. It is GDP at basic prices that appear throughout the rest of the
analysis.

33
Table 8: Following the Money: From GDP to Labour Income and Gross Operating Incomes
($1,000s)
Low Case (10%)
High Case (8.6%)
1. GDP at market prices (Last line of Table 7) 4,112,264 5,227,996 2. Taxes on products (final expenditures) 597,420 756,671 3. Taxes on products (intermediate inputs) 60,020 77,602 4. Taxes on products (import duties) 12,544 14,582 5. Subsidies on products -57,133 - 70,084 6. GDP at basic prices (Line 6= Line1-Sum(Lines 2 to 5)) 3,499,414 4,449,224 7. Subsidies on production -18,503 - 22,215 8. Taxes on production 135,167 171,809 9. Wages and Salaries 1,809,384 2,299,077 10. Supplementary labour income 227,184 283,390 11. Labour income of unincorporated companies and
individuals 160,038 206,440
12. Total labour income (Sum of line 9 to 11) 2,196,606 2,788,907 13. Gross operating surplus (Line 6-sum of Lines(7 to 11)) 1,186,143 1,510,723
Source: Based on Statistics Canada I/O runs submitted and interpreted by Smith Gunther Associates Ltd. Columns
may not add due to rounding.
Labour Force Income
Further subtracting taxes and subsidies on production (lines 7+8) and gross operating surplus
(line 13) used to pay business owners, leaves $2.2 billion (sum line 9 to 11) accruing to total
labour income. Total labour income includes wages and salaries, supplementary labour income
and labour income from unincorporated companies and individuals12. Of the total labour
income, $1.8 billion is paid in annual wages and salaries before personal income tax deductions.
After income taxes of $418 million (not shown in this table) direct wages and salaries amounted
to $1.4 billion.
In the 8.6% case, adjusting GDP at basic prices for subsidies and taxes on production leaves $4.3
billion of which $2.8 billion (sum line 9 to 11) accrues to labour income. After income taxes of
$479 million, (not included in the above table) labour income amounted to $2.3 billion.
Gross Operating Surplus
After production taxes less subsidies and labour force income, the third component of GDP is
the gross operating surplus which initially accrues to business owners before depreciation on
plant and equipment and any corporate income taxes. In the 10% case it is $1.2 billion and in
the 8.6% case $1.5 billion. The bottom line of gross operating surplus should not be interpreted
12
These terms are defined earlier in footnotes on page 5.

34
entirely as profits because gross operating surpluses include depreciation and therefore
overstate real profits accruing to owners.
Taxes
Table 9 identifies government revenues from various tax sources. In the 10% case, direct and
indirect taxes on products result in tax leakages of $670 million. Direct and indirect production
taxes result in further leakages of $135 million. In addition, direct and indirect income taxes
from additional labour force income generate $418 million for a total of $1,223 million in
government revenues. Adding total induced tax revenues brings increases in government
revenues to $1.5 billion.
In the 8.6% case, direct and indirect taxes on products result in revenues for governments of
$849 million. Direct and indirect production taxes add a further leakage of $172 million while
increased labour incomes also generate further direct and indirect personal income taxes worth
$479 million so that the case augments direct and indirect government revenues by $1.5 billion.
Adding total induced tax revenues brings the total increase in revenues to $1.9 billion.
Table 9: Tax Revenues Generated by ATV and SxS Recreational Activities: 2015 ($1,000s)
Cases Low (10%) High (8.6%)
Type of Impacts Direct & Indirect
Induced Total Direct & Indirect
Induced Total
Metric
Total taxes 1,223,151 317,492 1,540,643 1,499,664 393,081 1,892,746
Taxes on products less product subsidies
669,984 152,925 822,909 848,855 193,918 1,042,773
Taxes on production less production subsidies
135,167 81,099 216,266 171,809 103,293 275,101
Income taxes 418,000 83,469 501,469 479,000 95,871 574,871 Source: Based on Statistics Canada I/O runs submitted and interpreted by Smith Gunther Associates Ltd. Columns
may not add due to rounding.
Induced Impacts, Total Impacts, and Multipliers
When income earners spend their direct and indirect incremental incomes, they generate
induced expenditures resulting in induced multiplier effects. As used herein, multipliers are
simply ratios of total impacts relative to their direct expenditures on the same metric. Smith
Gunther with Statistics Canada has estimated total impacts in each case - first for combined
direct and indirect impacts alone and second for total impacts inclusive of induced impacts.
The remaining sections delineate the direct and indirect, induced and total impacts as well as

35
multipliers for three measures of income – value shipped, GDP, and labour force income, as
well as employment in full-time equivalents. For both cases, they appear by jurisdiction in the
following bar charts along with the direct Canadian stimulus in the title of each chart.
Because multipliers among different jurisdictions are impacted by interprovincial shipments
and by the intensity of industrial concentrations, those provinces with more interprovincial
exports than imports have higher multipliers when assessing national level impacts. Multipliers
also vary with the metric being assessed in that they differ among value shipped, GDP, labour
income, and employment.
Value Shipped
Value shipped is the sum of the value shipped by all supply-line manufacturers. For example,
one of the supply lines may begin with a hide used to manufacture leather riding gear. Value
shipped inherently involves some double and multiple counting because as inputs move along
the supply chain, they are captured with each shipment from each stage of production going
into the next one. The hide is captured when shipped from the abattoir to the tannery, and
again from the tannery to a clothes manufacturer and then from the clothing manufacturer to a
wholesaler of leather riding gear.
To meet ATV and SxS expenditures in the low case, Canadian direct value shipped was $4.1
billion, direct and indirect value shipped $6.7 billion and total value shipped $8.5 billion
(inclusive of the induced expenditures). These findings mean that indirect impacts are $2.5
billion topped-up by another $1.8 billion of induced impacts as indicated in Table 10. The 8.6%
case impacts rise at each step of the analysis from direct impacts of $5.3 billion, indirect ones of
$3.2 billion and induced ones of $2.2 billion culminating in total impacts of $10.8 billion
(allowing for rounding).
Table 10: Canadian Value Shipped for ATV and SxS Recreational Activities in 2015 ($Millions)
Cases Low (10%) High (8.6%)
Type of Impacts
Direct Indirect Induced Total Direct Indirect Induced Total
Metric
Value Shipped
4,167 2,532 1,800 8,489 5,275 3,219 2,286 10,780
Source: Based on Statistics Canada I/O runs submitted and interpreted by Smith Gunther Associates Ltd. Rows may
not add due to rounding.

36
The sums of the direct, indirect and induced impacts lead to value shipped national multipliers
of 1.61 directly and indirectly and 2.04 totally13, inclusive of induced demands, shown in the
Canada column of Chart 19a. Total multipliers for each jurisdiction are documented
numerically in the chart. Similar calculations among the provinces result in the highest total
multiplier for Ontario at 2.55 followed by British Columbia at 2.34 and Alberta at 2.05. Because
Alberta’s trade performance is dependent on its role in energy supply, it is clearly vulnerable to
international price swings in fossil fuels. With the decline in fossil fuel prices since 2015, its
2016 multiplier may become less than indicated here. All other provinces have total value
shipped multipliers below the national benchmark.
Chart 19a: 10% Case Value Shipped Multipliers ATV and SxS Recreation
(Direct Canadian Stimulus $4.1 Billion)
Source: Based on Statistics Canada I/O runs submitted and interpreted by Smith Gunther Associates Ltd.
In the 8.6% case, Canadian direct value shipped was $5.3 billion, direct and indirect value
shipped $8.5 billion and total value shipped $10.8 billion. These results lead to national
multipliers of 1.61 for direct and indirect value shipped and 2.04 for total value shipped of
which the total one is documented numerically in Chart 19b. Similar calculations among the
provinces result in the highest multiplier for Ontario at 2.51 for total value shipped followed by
British Columbia at 2.36 for total value shipped. As in the 10% case, Alberta’s performance at
above national results is influenced by fossil fuel prices. With the decline in fossil fuel prices
since 2015, its 2016 multiplier may become less than indicated here. All other provinces have
total value shipped multipliers below the national benchmark.
Aside from the multipliers for Prince Edward Island where I/O results suffer instability due to its
small scale industrialization, the other provincial multipliers are quite similar in both the 10%
13
Multipliers are estimated to 16 decimal places and may differ from those readers might derive from those in the text due to rounding.

37
and 8.6% cases. These multipliers should be used by provinces in establishing provincial value
shipped impacts from ATV and SxS recreational activities.
Chart 19b: 8.6% Case Value Shipped Multipliers ATV and SxS Recreation
(Direct Canadian Stimulus $5.3 Billion)
Source: Based on Statistics Canada I/O runs submitted and interpreted by Smith Gunther Associates Ltd.
GDP
The GDP appearing in these charts and hereafter is GDP at basic prices. Because GDP measures
only the value added at each stage of production, GDP avoids the multiple counting inherent in
value shipped. Table 11 indicates that ATV and SxS expenditures generated direct GDP of $2.1
billion in the 10% case with another $1.4 billion occurring indirectly, and another $1.0 billion
from induced expenditures for a total GDP impact of $4.5 billion. The 8.6% case culminated in
total GDP impacts of $5.8 billion.
Table 8: Canadian GDP Generated from ATV and SxS Recreational Activities in 2015
($Millions)
Cases Low (10%) High (8.6%)
Type of Impacts
Direct Indirect Induced Total Direct Indirect Induced Total
Metric
GDP 2,127 1,372 1,048 4,547 2,704 1,745 1,331 5,780 Source: Based on Statistics Canada I/O runs submitted and interpreted by Smith Gunther Associates Ltd. Rows may
not add due to rounding.
As noted in Charts 20a and 20b, multipliers for GDP are slightly higher than for value shipped.
For the 10% and 8.6% cases, direct and indirect GDP impacts were $3.5 billion and $4.4 billion
respectively, resulting in multipliers for direct and indirect impacts of 1.64 to 1.65 in each case
respectively. Total national GDP impacts resulted in similar total multipliers of 2.14 in both
cases.

38
Chart 20a: 10% Case GDP Multipliers ATV and SxS Recreation
(Direct Canadian Stimulus $2.1 Billion)
Source: Based on Statistics Canada I/O runs submitted and interpreted by Smith Gunther Associates Ltd.
Chart 20b: 8.6% Case GDP ATV and SxS Recreation
(Direct Canadian Stimulus $2.7 Billion)
Source: Based on Statistics Canada I/O runs submitted and interpreted by Smith Gunther Associates Ltd.
The provincial ordering of GDP multipliers is similar to those for value shipped. Because a large
share of Alberta’s input is concentrated in the fossil fuels sector which is capital intensive and
much of the rest of the country is dependent on fossil fuels from there, its GDP multipliers are
even with or slightly above Canada’s. Again, aside from Prince Edward Island, the I/O
multipliers are similar – stable – between the two cases.

39
Labour Income
In the 10% case, direct Canadian labour income impacts of $1.4 billion, net of personal income
taxes, generate direct and indirect impacts of $2.2 billion and total impacts on labour income of
$2.7 billion. In the 8.6% case, direct labour income impacts of $1.8 billion, net of personal
income taxes, generate direct and indirect impacts of $2.8 billion and total impacts on labour
income of $3.4 billion as indicated in Table 12.
Table 12: Canadian Labour Force Income Generated from ATV and SxS Recreational Activities:
2015 ($Millions)
Cases Low (10%) High (8.6%)
Type of Impacts
Direct Indirect Induced Total Direct Indirect Induced Total
Metric
Labour force income
1,416 780 496 2,693 1,800 989 630 3,419
Source: Based on Statistics Canada I/O runs submitted and interpreted by Smith Gunther Associates Ltd. Rows may
not add due to rounding.
The resulting national multipliers for both cases are 1.55 for direct and indirect labour income
and 1.90 for total labour income.
Due to the capital intensive nature of its primary fossil fuel sector and corresponding low labour
intensity, Alberta’s labour force income multipliers fall below those of the nation, despite
higher than average wages and salaries, so that only Ontario’s, British Columbia’s and Quebec’s
labour force income multipliers are above national levels as shown in Charts 3a and 3b. Those
Quebec sectors impacted indirectly and from induced demands tend to be slightly more labour
intensive than those in the rest of the country contributing to its aggregate labour force
incomes being above national averages.
40
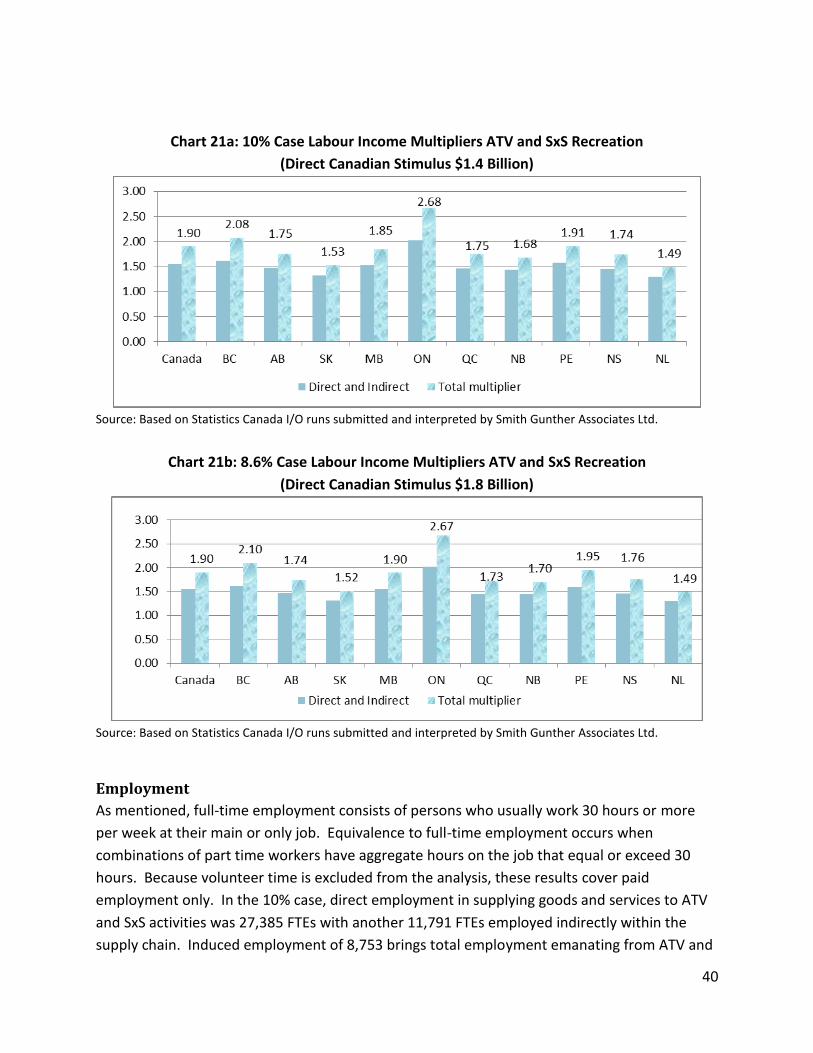
Chart 21a: 10% Case Labour Income Multipliers ATV and SxS Recreation
(Direct Canadian Stimulus $1.4 Billion)
Source: Based on Statistics Canada I/O runs submitted and interpreted by Smith Gunther Associates Ltd.
Chart 21b: 8.6% Case Labour Income Multipliers ATV and SxS Recreation
(Direct Canadian Stimulus $1.8 Billion)
Source: Based on Statistics Canada I/O runs submitted and interpreted by Smith Gunther Associates Ltd.
Employment
As mentioned, full-time employment consists of persons who usually work 30 hours or more
per week at their main or only job. Equivalence to full-time employment occurs when
combinations of part time workers have aggregate hours on the job that equal or exceed 30
hours. Because volunteer time is excluded from the analysis, these results cover paid
employment only. In the 10% case, direct employment in supplying goods and services to ATV
and SxS activities was 27,385 FTEs with another 11,791 FTEs employed indirectly within the
supply chain. Induced employment of 8,753 brings total employment emanating from ATV and
41
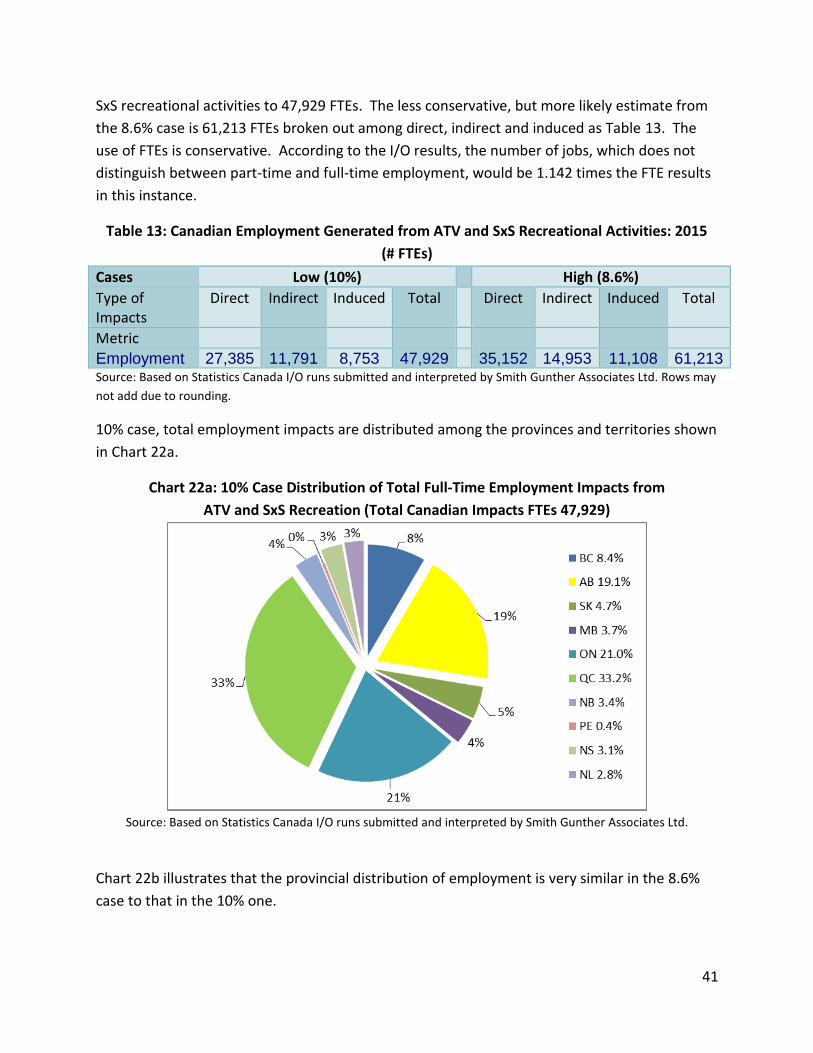
SxS recreational activities to 47,929 FTEs. The less conservative, but more likely estimate from
the 8.6% case is 61,213 FTEs broken out among direct, indirect and induced as Table 13. The
use of FTEs is conservative. According to the I/O results, the number of jobs, which does not
distinguish between part-time and full-time employment, would be 1.142 times the FTE results
in this instance.
Table 13: Canadian Employment Generated from ATV and SxS Recreational Activities: 2015
(# FTEs)
Cases Low (10%) High (8.6%)
Type of Impacts
Direct Indirect Induced Total Direct Indirect Induced Total
Metric
Employment 27,385 11,791 8,753 47,929 35,152 14,953 11,108 61,213 Source: Based on Statistics Canada I/O runs submitted and interpreted by Smith Gunther Associates Ltd. Rows may
not add due to rounding.
10% case, total employment impacts are distributed among the provinces and territories shown
in Chart 22a.
Chart 22a: 10% Case Distribution of Total Full-Time Employment Impacts from
ATV and SxS Recreation (Total Canadian Impacts FTEs 47,929)
Source: Based on Statistics Canada I/O runs submitted and interpreted by Smith Gunther Associates Ltd.
Chart 22b illustrates that the provincial distribution of employment is very similar in the 8.6%
case to that in the 10% one.

42
Chart 22b: 8.6% Case Distribution of Full-Time Employment Impacts ATV and SxS Recreation
(Total Canadian Impacts FTEs 61,213)
Source: Based on Statistics Canada I/O runs submitted and interpreted by Smith Gunther Associates Ltd.
FTE multipliers for the 10% and 8.6% cases appear in Charts 23a and 23b. In the 10% case, ATV
and SxS recreational activities employed 27,385 directly, 39,176 directly and indirectly and
47,929 in total including those employed directly, indirectly and in induced activities. The
resulting multipliers for the 10% case were 1.44 directly and indirectly, and 1.76 in total. There
is some instability in I/O derived multipliers for small economies so that the high multiplier for
Prince Edward Island is a statistical anomaly.
Chart 23a: 10% Case Full-time Employment Multipliers ATV and SxS Recreation (Direct Canadian Stimulus 27,385 FTEs)
Source: Based on Statistics Canada I/O runs submitted and interpreted by Smith Gunther Associates Ltd.

43
In the 8.6% case, ATV and SxS recreational activities employed 35,152 FTEs directly, 50,105 FTEs
directly and indirectly and 61,213 in total including those employed directly indirectly and in
induced activities. The resulting national multipliers were 1.44 directly and indirectly and 1.75
in total.
Chart 23b: 8.6% Case Full-time Employment Multipliers ATV and SxS Recreation
(Direct Canadian Stimulus 35,152 FTEs)
Source: Based on Statistics Canada I/O runs submitted and interpreted by Smith Gunther Associates Ltd.
Sector Concentration of Employment
For the 10% case, Chart 24a illustrates the sector concentration of direct and indirect
employment. The highest percentage concentration is in retail (20%) followed by repair and
maintenance (19%) inclusive of not only ATVs and SxSs but also enhancements to vehicles as
well as all vehicles deployed in supply chain activities or purchased as part of induced demands
and on repair and maintenance of trails. Repair and maintenance is followed by food and
accommodations (15%) and finance and real estate at 8%. Employment in these sectors is
trailed by employment in manufacturing, transportation, entertainment and wholesale trade
and warehousing and administrative services including organizations and similar operations all
at 5% to 6%. Professional scientific and technical services including research and development,
and education, health, social assistance and business services accounted for 2% to 3% each.
Each of the other industries had one percent shares of the direct and indirect employment
impacts.
Chart 24b presents the percentage shares for total employment impacts in the 10% case
inclusive of induced impacts. General expenditures induced from increased labour force

44
incomes have more general expenditure patterns relative to those which allow enthusiasts to
undertake ATV and SxS activities. Because the two sets of expenditures on the goods and
services differ, so will mixes of sectoral employment.
Sector shares for total employment are different from the direct and indirect shares.
Decreased shares are experienced by repair and maintenance (-3%), and both entertainment
and food and accommodations (-1%). Rounding issues aside, among those increasing shares by
a percentage through induced demands were retail, education, health, social assistance, and,
other14.
14
While others appear to be increasing by a percentage in the graphs that optic is attributable to rounding because when the total percentages are subtracted from the direct and induced ones the percentage differences for sectors round down rather than up. Rounding also explains why the sum of the gains does not equal the sum of the losers.

45
Chart 24a: 10% Case Sector Shares of Direct and Indirect Employment 2015
(Direct and Indirect Employment 29,176)
Source: Based on Statistics Canada I/O runs submitted and interpreted by Smith Gunther Associates Ltd.

46
Chart 24b: 10% Case Sector Shares of Total Employment 2015
(Total Employment 47,929)
Source: Based on Statistics Canada I/O runs submitted and interpreted by Smith Gunther Associates Ltd.

47
In the 8.6% case, Chart 24c illustrates the sector concentration of direct and indirect
employment. The highest percentage concentration is in retail and repair and maintenance
each at 20%. Repair and maintenance encompasses not only work on ATVs and SxSs but also
repairs to enhanced vehicles as well as all repairs to supply chain activities or purchased as part
of induced demands on repair and maintenance of trails. Repair and maintenance is followed
by food and accommodations (15%) and finance and real estate (8%). Five other sectors
employ 5% to 6% of those employed directly and indirectly in meeting demands of ATV and SxS
recreationalists. These sectors include manufacturing, construction, wholesale and
warehousing, entertainment and administrative services, et al. Professional and scientific
services employed another 3% of the additional employment while other sectors made up 1%
to 2% of the additional direct and indirect employment.
Chart 24d presents the percentage shares for total employment impacts in the 8.6% case
inclusive of induced impacts. General expenditures induced from increased labour force
incomes have more general expenditure patterns relative to those established by enthusiasts
for undertake ATV and SxS activities. Because the two sets of expenditures on the goods and
services differ, so will mixes of sectoral employment.
Sector shares for total employment are different from the direct and indirect shares.
Decreased shares are experienced by repair and maintenance (-3%), and food and
accommodations (-1%). Among those increasing shares by a percentage through induced
demands were: retail; education, hospitals and social assistance, and “other”15.
15
While ‘other’ appears to be increasing by a percentage in the graphs, that optic is attributable to rounding because when the total percentages are subtracted from the direct and induced ones the percentage differences for sectors round down rather than up. Rounding also explains why the sum of the gains does not equal the sum of the losses.

48
Chart 24c: 8.6% Case Sector Shares of Direct and Indirect Employment 2015
(Direct and Indirect Employment 50,123)
Source: Based on Statistics Canada I/O runs submitted and interpreted by Smith Gunther Associates Ltd.

49
Chart 24d: 8.6% Case Sector Shares of Direct, Indirect and Induced Employment 2015 FTEs
(Total employment 61,231)
Source: Based on Statistics Canada I/O runs submitted and interpreted by Smith Gunther Associates Ltd.
Provincial Results
Detailed provincial Impacts are contained in Appendix 2. They confirm that multiplier effects
are strongest in provinces where interprovincial exports exceed imports and where industrial
linkages within the province are the strongest. Ontario has the strongest overall multipliers
followed by British Columbia. Alberta has stronger labour income multipliers and Quebec has
strong employment multipliers.

50
Conclusions Smith Gunther, with the support of the national and provincial clubs, received excellent
responses to its survey of ATV and SxS recreationalists16. A total of 2,977 responded to Smith
Gunther’s survey. The respondents provided sufficient information to be confident in provincial
level as well as national response. In addition to the survey data, COHV records were useful in
providing annual sales of ATVs as well as expertise and guidance in several jurisdictions. Smith
Gunther attended Power Sport Services shows in Moncton, Montreal, Toronto, and Abbotsford
(catering primarily to British Columbians from the Lower Mainland.) Smith Gunther
supplemented information gathered these meetings with telephone calls with club executives.
They guided our work and encouraged members to respond to the survey.
In 2015, there was an estimated minimum of 629,609 ATVs and 299,624 SxSs in operation. This
minimum estimate is based on an attrition rate of 10% of the current stock of ATVs from 1994
onward when annual sales data were available or could be estimated. Similar adjustments were
calculated on SxSs purchased after 2006 when they started being used for recreational
purposes. The 10% attrition rate is in-line with similar rates for personal watercraft and
snowmobiles and is conservative. Based on Smith Gunther’s survey of ATV and SxS
owner/riders, an 8.6% attrition rate is more likely. Because attrition rates reflect annual
retirement of vehicles, an 8.6% attrition rate means more vehicles remain operational leading
to higher estimates of operational ATVs (705,264) and SxSs (432,219). From those provinces
where licensing data were available this rate is supported by that data.
Participants in ATV and SxS recreational activities made investments in new and replacement
ATVs and SxSs annually, as well as enhanced on-highway vehicles for transporting ATVs and SxS
and accommodating themselves, such as trailers, larger vehicles and mobile homes (RVs). In
2015, annual investments, in the economic meaning of new purchases of equipment and
machinery, including ATVs, SxSs and related enhanced vehicles reached $1.1 billion to $1.2
billion before depreciation shown in Table 14. Since this data reflects purchases of new ATVs
and SxSs, the numbers are not affected by rates of attrition. Investments in enhanced on-
highway vehicles are affected in that fewer or more vehicles are required to transport the
newly purchased stock as well as the stock still in operation. In the low case (10% attrition),
fewer ATVs and SxSs are still in operation therefore fewer enhanced vehicles are required and
less is spent on replacing them. The opposite is true in the high case (8.6%).
16 This report is based largely on metrics from actual gate receipts at ATV and SxS shows operated by Power Sport
Services, Smith Gunther survey results from 2,977 members of ATV and SxS clubs, and ATV sales data provided by
Canadian Off-Highway Vehicle Distributors Council (COHV). The sample size is nearly three times the size relied on
for national political and consumer polling is highly significant and sufficient for provincial level analysis.

51
Table 14: 2015 Investments in ATVs and SxSs ($1,000s)
Items\Cases Low (10%) High (8.6%)
ATVs 643,776 643,776
SxSs 378,628 378,628
Enhanced on-highway vehicles 84,100 159,400
Total 1,106,504 1,181,804 Sources: Smith Gunther Associates Ltd. based on annual sales data of ATVs and survey data for SxSs.
Further, annual operating expenditures amounted to an additional $5.0 billion to $6.7 billion
bringing 2015 direct investment and operating expenditures to $6.2 billion to $7.9 billion. Table
15 summarizes 2015 key operating expenditures by ATV and SxS recreationalists for the 8.6%
and the 10% cases. Because the number of ATVs and SxSs differ in the two cases and affects
each type of direct operating expenditure, the gap between both cases’ direct operating
expenditures widens relative to the investment one where only the enhancement of on-
highway vehicles associated with ATV and SxS recreation was impacted.
Table 15: 2015 Key Operating Expenditures in ATV and SxS Activities ($millions)
Operating Expenditures\Cases Low (10%) High (8.6%)
Repair & maintenance 1,142.7 1,513.6
Gasoline for ATVs and SxSs 724 948
Food and beverages 652 837
Casualty & liability insurance 568 773
Accommodation excluding RV expenditures 334 378
Ground transportation 177 228
Club & trail fess 445 534
Entertainment 196 226
Other 85 306
Total included in further analysis 4,324 5,743
Licenses 99 123
Volunteer time* 584 858
Excluded from further analysis 683 981
Total 5,007 6,724 Sources: Smith Gunther Associates Ltd. based on annual sales data of ATVs and survey data for SxSs.
Notes: *The survey established the amount of volunteer time by province which was extrapolated to
cover provincial ATV and SxS recreationalists and evaluated at 40% of average hourly wages and salary
rates in each province in line with standard practices for benefit-cost analysis.

52
Total expenditures impacted total value shipped – the sum of the value shipped – by $8.5
billion to $10.8 billion. These expenditures all contributed to improved national economic
performance. But, as explained in the value shipped section, total value shipped includes raw
materials and many other inputs being counted several times, which must be taken into
account when considering use of this economic indicator.
Combined, the investment and operating expenditure data have annual impacts of $6.1 billion
to $7.9 billion of which licenses and volunteer time are outside of Statistics Canada’s analytical
framework as discussed later in the report, so that the total expenditures included in the
analysis are $5.5 billion in the 10% case and $6.9 billion in the 8.6% one17.
These expenditures all contributed to improved national economic performance. Table 16
summarizes other key national economic impacts, presented in greater detail in the text. Direct
and indirect impacts occur among Canadian suppliers of goods and services purchased by ATV
and SxS recreationalists and of the inputs into them, and inputs into inputs ad infinitum. The
first three columns provide impact data on the 10% case and the last three on the 8.6% case.
Direct and indirect domestic expenditures occur in Canada by Canadian riders of ATVs and SxSs.
As noted above through its survey and COHV provided data on sales, Smith Gunther has
established domestic expenditures by ATV and SxS recreationalists in Canada and its provinces.
Due to a lack of data, these numbers do not cover expenditures by foreigners riding in Canada.
17
Because volunteer time is outside of Statistics Canada’s I/O, this estimate sets aside the value of volunteer time, worth $554 to $858 million annually. Further because there are no linkages to annual licensing fees of $99 to $123 million, they too are set aside. Included expenditures encompass those on new ATVs, gear, special clothing e.g. helmets and goggles; operating expenses e.g. gasoline and paid repair and maintenance for ATVs and SXSs; accommodations (camping, hotel and motels and recreational vehicles (RVs)); and travel to and from ATV and SxS events including any upgrades to cars, trucks and trailers to facilitate ATV and SxS recreational activities; and, related membership fees in clubs and associations.

53
Table 16: Key 2015 National Economic Impacts of ATV and SxS in Canada 10% and 8.6% Cases
($1,000 Unless Otherwise Noted)
Cases Low (10%) High (8.6%)
Metric\Type of Impacts
Direct & Indirect
Induced Total Direct & Indirect
Induced Total
Domestic Expenditures
5,501,040* 1,535,382 7,036,422 6,916,210 1,949,127 8,865,337
GDP 3,499,414 1,048,263 4,547,676 4,449,224 1,330,685 5,779,909
Labour income 2,196,606 496,336 2,692,942 2,788,907 630,377 3,419,283
Employment (# FTEs)
39,176 8,753 47,929 50,105 11,108 61,213
Total taxes 1,223,151 317,492 1,540,643 1,499,664 393,081 1,892,746
Taxes on products 669,984 152,925 822,909 848,855 193,918 1,042,773
Taxes on production
135,167 81,099 216,266 171,809 103,293 275,101
Income taxes 418,000 83,469 501,469 479,000 95,871 574,871 Source: Based on Statistics Canada I/O runs submitted and interpreted by Smith Gunther Associates Ltd.
Note: *Because direct expenditures provide the total impetus for this analysis there are no indirect domestic
expenditures. All rows and tax columns may not add due to rounding. Direct and indirect economic activities
occur within Canadian supply lines of goods and services purchased by ATV and SxS recreationalists. Given the
inclusion of indirect expenditures and other statistical adjustments, “Domestic Expenditures” are similar but not
equal to the sum of direct expenditures from the first two tables.
In the 10% case, direct and indirect domestic expenditures of $5.5 billion, net of product and
production taxes and imports net of exports but including subsidies, add $3.5 billion to direct
and indirect Gross Domestic Product (GDP). GDP is inclusive of direct and indirect labour force
income of $2.2 billion attracting employment measured as 39,176 full-time equivalents (FTEs).
The case generates another $1.2 billion in various direct and indirect taxes.
In the 8.6% case, direct and indirect domestic expenditures of $6.9 million - net of product and
production taxes, and imports net of exports but including subsidies - add $4.4 billion to direct
and indirect Gross Domestic Product (GDP). GDP is inclusive of direct and indirect labour force
income of $2.8 billion and employment measured as 50,105 full time equivalents (FTEs). This
8.6% case generates another $1.5 billion in the various direct and indirect taxes, specified in the
last three lines.
Adding the induced impacts to the direct and indirect impacts yields total impacts. The totals in
the above table size Canadian ATV and SxS activities in Canada in the range of domestic
expenditures for the 10% and 8.6% cases in the range of $7.0 billion to $8.8 billion generating

54
GDP of $4.5 billion to $5.8 billion including labour force incomes of $2.7 billion to $3.4 billion.
Taxes revenues as a result of ATV and SxS expenditures yield $1.5 billion to $1.9 billion. Further
these activities and related expenditures generate fuller employment by 47,921 to 61,213
FTEs18.
In the 10% case, total employment impacts were concentrated in retail (20%), paid repair and
maintenance (16%), food and accommodations, (14%) and finance and real estate (8%). Other
sectors attracting 5% or more of total employment were; administrative services and other
similar organizations, manufacturing, wholesaling and warehousing, transportation, and
entertainment services. Professional and scientific services including research and
development made up another 3% of additional employment.
In the 8.6% case, total employment impacts were concentrated in retail (20%), paid repair and
maintenance (17%), food and accommodations, (14%) and finance and real estate (8%). Other
sectors attracting 5% or more of total employment were administrative services and other
similar organizations, manufacturing, wholesaling and warehousing, and transportation
services. Professional and scientific services including research and development made up
another 3% of additional employment.
Multipliers, defined here as ratios of total impacts relative to their direct expenditure, were
generally higher for those provinces with positive interprovincial trade balances, especially
Ontario and British Columbia. The high capital intensity and low labour intensities of fossil fuel
production meant that Alberta’s multipliers were above the national one for GDP, but below
national ones in employment and labour income, despite its relatively high wage and salary
levels among provinces in 2015.
When considering Canada’s industry as a whole, the provincial multipliers in this report should
be utilized. When considering the industry solely from a provincial perspective, those with net
interprovincial trade gains, namely Ontario and British Columbia, would no longer benefit from
enhanced provincial impacts, and in this case national multipliers should be used. Multipliers
from all other provinces would not be affected because they are not greatly impacted by net
trade gains.
Detailed level results of provincial impacts are contained in the Appendix 2 of this report. They
confirm that multiplier effects are strongest in provinces which are net beneficiaries of
interprovincial trade and where industrial linkages within the province are the strongest.
Ontario has the strongest overall multipliers followed by British Columbia. Alberta benefits
18
To convert national FTEs generated from ATV and SxS recreation to jobs multiply the FTEs by 1.142. Warning: these ratios do differ between the nation and provinces and among the provinces.

55
from strong value shipped and GDP multipliers and Quebec has above national employment
and labour force income multipliers.
Because volunteer time is not covered within the I/O framework and licensing fees are not
recycled back into ATV and SxS impacts, Smith Gunther has set aside direct volunteer time
valued at $554 to $858 million in the 10% and 8.6% cases respectively as well as annual
licensing fees of $99 to $123 million. Inclusion of these expenditures would have enhanced the
impacts from ATV and SxS recreational activities. In particular, inclusion of volunteer time
would add $1.1 to $1.7 billion to total values shipped.
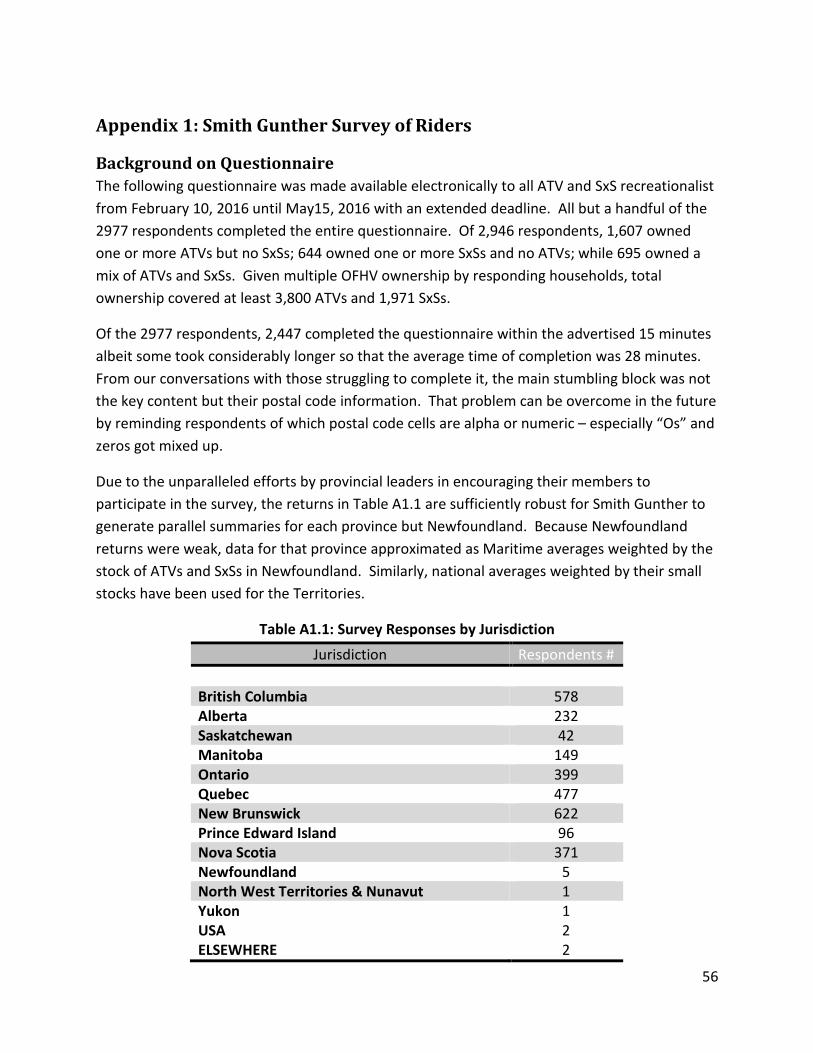
56
Appendix 1: Smith Gunther Survey of Riders
Background on Questionnaire
The following questionnaire was made available electronically to all ATV and SxS recreationalist
from February 10, 2016 until May15, 2016 with an extended deadline. All but a handful of the
2977 respondents completed the entire questionnaire. Of 2,946 respondents, 1,607 owned
one or more ATVs but no SxSs; 644 owned one or more SxSs and no ATVs; while 695 owned a
mix of ATVs and SxSs. Given multiple OFHV ownership by responding households, total
ownership covered at least 3,800 ATVs and 1,971 SxSs.
Of the 2977 respondents, 2,447 completed the questionnaire within the advertised 15 minutes
albeit some took considerably longer so that the average time of completion was 28 minutes.
From our conversations with those struggling to complete it, the main stumbling block was not
the key content but their postal code information. That problem can be overcome in the future
by reminding respondents of which postal code cells are alpha or numeric – especially “Os” and
zeros got mixed up.
Due to the unparalleled efforts by provincial leaders in encouraging their members to
participate in the survey, the returns in Table A1.1 are sufficiently robust for Smith Gunther to
generate parallel summaries for each province but Newfoundland. Because Newfoundland
returns were weak, data for that province approximated as Maritime averages weighted by the
stock of ATVs and SxSs in Newfoundland. Similarly, national averages weighted by their small
stocks have been used for the Territories.
Table A1.1: Survey Responses by Jurisdiction
Jurisdiction Respondents #
British Columbia 578 Alberta 232 Saskatchewan 42 Manitoba 149 Ontario 399 Quebec 477 New Brunswick 622 Prince Edward Island 96 Nova Scotia 371 Newfoundland 5 North West Territories & Nunavut 1 Yukon 1 USA 2 ELSEWHERE 2

57
Smith Gunther Survey
INTRO
Not only are recreational off-highway vehicles fun, they’re also a great contributor to Canada’s
economy.
The Canadian Off-Highway Vehicle Distributors Council needs your help in conducting a
nationwide survey to determine just how significant this contribution is. Please help us figure
this out by completing the attached survey.
The survey will collect information on the economic contribution made by Recreational Off-
Highway Vehicles (ROVs) – specifically ATVs (quads) and side-by-sides - as well as related
activities. While overall survey results will be shared with government, trail-user groups,
municipalities, and other stakeholders to support the growth of the sport, be assured that all
individual responses will remain confidential.
It should take about 15 minutes.
Our deadline is April 30, 2016.
Please complete it to the best of your ability and send the survey to:
Smith Gunther Associates Ltd.
10 Armagh Way
Nepean ON, K2J 4C3
Or, for your convenience, electronic copies are available from [email protected].
If there are questions or concerns, please contact Sally Smith of Smith Gunther Associates at
613-464-1456 or [email protected] or Peter E. Gunther at [email protected].
Thanks for your assistance.

58
N0. Question Response
Q1 Number of Recreational Off-Highway Vehicles (ROVs) in the family
Q1a. Side-by-sides;--------------------------------------------------------
Q1b. ATVs (quads);---------------------------------------------------------
#
2Q2 Number of family members participating in ROV activities #
4Q3 How long has each ROV owned by your family been ridden?
Side by sides Oldest ______
Years Not applicable
Don’t know
Years Not applicable
Don’t know
Newest ROV ______ 2nd newest ROV ______ 3rd newest ROV______ 4th newest ROV______ Oldest ROV ______
Repair and maintenance (excluding gasoline) as spent dollars;
$ ________
Repair and maintenance (excluding gasoline) as volunteer time in 2015
Days________
Gasoline consumed by ROV in 2015 $ ______
Average off-road distances ridden per ROV in 2015 (km)
Km ______
Average per person spending on lunches, dinners, snacks and other food and beverage services in 2015
$ ______
Fees in 2015: $
Average fees to events, other than the show a) ____
For Club membership b) ____
For trail use c) ____
Licenses d) ____
Casualty insurance e) ____
Liability insurance f) ____
Other (Please specify) g) ____

59
Number of ROV events attended in 2015 in order to: #
Compete a) _____
Officiate b) _____
Watch c) _____
Average distances from residence to each event attended (km)
Km _____
Your residential postal code
Related to ROV events, accommodation and nights stayed in each in 2015:
# Nights
Cabin a) ____
Motel b) ____
Hotel c) ____
Bed and Breakfast d) ____
Tent e) ____
Mobile home f) ____
Stay with friends g) ____
Other h) ____
Major reasons for participating in ROV (Tick all that apply) √
Enjoying the outdoors a) ____
Hunting b) ____
Fishing c) ____
Camaraderie d) ____
Exploring e) ____
Many individuals and families invest or make capital expenses in vehicles to transport themselves and ROVs to various ROV events or trailheads. As part of the economic impact we are interested in those additional capital and operating expenditures related to transportation to ROV events or trailheads incurred in 2015. For example, if you would otherwise drive a smaller vehicle, but instead drive a half-ton or bigger truck to facilitate ROV activities, what is the difference between the higher purchase price of the truck rather than of the smaller vehicle. Similarly, for mobile homes and trailers used primarily to get to ROV trailheads and events. The second part of this question has to do with any additional operation or maintenance on the above vehicle. For example: If you purchased a $25,000 truck to transport your ROV and without your ROV you would have purchased an $18,000 car, the additional capital expense would be $7,000. If your annual gas and tune-ups on the larger vehicle are $8,000 and on a smaller vehicle would be $4,500, the additional operating expense would be $3,500.

60
Do you normally travel to ROV events or trailheads using transportation other than an ROV:
Yes ___: No ___
If yes, additional capital expense of having these vehicles/trailers/mobile homes (please see explanation above)
$________
If yes, additional operating expense of having these vehicles/trailers/mobile homes (please see explanation above)
$________
Smith Gunther Associates Ltd. for the Canadian Off-Highway Vehicle Distributors
Council
Please mail or email to:
Sally Smith Smith Gunther Associates Ltd
10 Armagh Way Nepean, ON, K2J 4C3 [email protected]
61
Appendix 2: Provincial and Territorial Economic Snapshots

62
British Columbia
In 2015, British Columbians operated an estimated minimum of 48,217 ATVs and 22,926 SxSs.
This estimate is based on an attrition rate of 10% of the current and previous years’ stocks of
ATVs and on SxSs purchased after 2006 when they started being deployed for recreational
purposes. With a rate of attrition of 8.6%, more vehicles remain operational - ATVs (53,399)
and SxSs (32,051). The Smith Gunther survey results suggest the case based on the 8.6%, but
the 10% case is more in line with attrition rates in studies of personal watercraft and
snowmobiles.
Participants in ATV and SxS recreational activities made investments in new and replacement
ATVs and SxSs annually, as well as enhanced on-highway vehicles for transporting ATVs and
SxSs and accommodations for themselves, such as trailers, larger vehicles and mobile homes
(RVs)19. During 2015, annual investments, in the economic meaning of new purchases of
equipment, in ATVs, SxSs and related enhanced vehicles reached $94 million to $100 million
shown in Table BC-1, before depreciation. Since this data reflects purchases of new ATVs and
SxSs, the numbers are not affected by rates of attrition. Investments in enhanced on-highway
vehicles are affected in that fewer or more vehicles are required to transport the newly
purchased stock as well as the stock still in operation. In the 10% case, fewer ATVs and SxSs are
still in operation therefore fewer enhanced vehicles are required and less is spent on replacing
them. The opposite is true in the 8.6% case.
Table BC-1: British Columbia 2015 Investments in ATVs and SxSs ($1,000s)
Items\Cases Low (10%)
High (8.6%)
ATVs 50,708 50,708
SxSs 37,584 37,584
Enhanced on-highway vehicles 6,100 11,300
Total 94,392 99,592 Sources: Smith Gunther Associates Ltd. based on annual sales data of ATVs and survey data for SxSs.
19 Recreational Vehicle (RV) is used narrowly herein to include only mobile homes

63
Table BC-2 summarizes 2015 expenditures by ATV and SxS recreationalists for both cases.
Annual British Columbia direct operating expenditures amounted to an additional $305 million
to $403 million.
Because the number of ATVs and SxSs in operation differs in the 10% and high cases and affects
each type of direct operating expenditure, the gap between both cases’ direct operating
expenditures widens relative to direct investment where only the enhancement of on-highway
vehicles associated with ATV and SxS recreation was impacted.
Table BC-2: 2015 Key British Columbia Operating Expenditures in ATV and SxS Activities
($1,000s)
Operating Expenditures\Cases Low (10%)
High (8.6%)
Repair & maintenance 69,237 88,818
Gasoline for ATVs and SxSs 51,077 66,485
Food and beverages 40,697 51,013
Casualty & liability insurance 37,246 48,614
Accommodation excluding RV expenditures
16,758 24,043
Ground transportation 5,250 6,808
Club & trail fees 6,014 7,119
Entertainment 6,389 7,626
Other 33,220 47,950
Total included in further analysis 265,886 348,476
Licenses 10,329 13,004
Volunteer time* 28,998 41,274
Excluded from further analysis 39,328 54,278
Total 305,213 402,754 Sources: Smith Gunther Associates Ltd. based on annual sales data of ATVs and survey data for SxSs.
Note: *The survey established the amount of volunteer time by province which was extrapolated to cover
all provincial ATV and SxS recreationalists and assessed at 40% of average hourly wages and salary rates in
each province in line with standard practices for benefit-cost analysis.
Combined investment and operating expenditure data (Totals in Tables BC-1 and BC-2) have
annual impacts of $400 million to $502 million of which licenses and volunteer time are outside
of Statistics Canada’s analytical framework, so that the total direct operating and investment
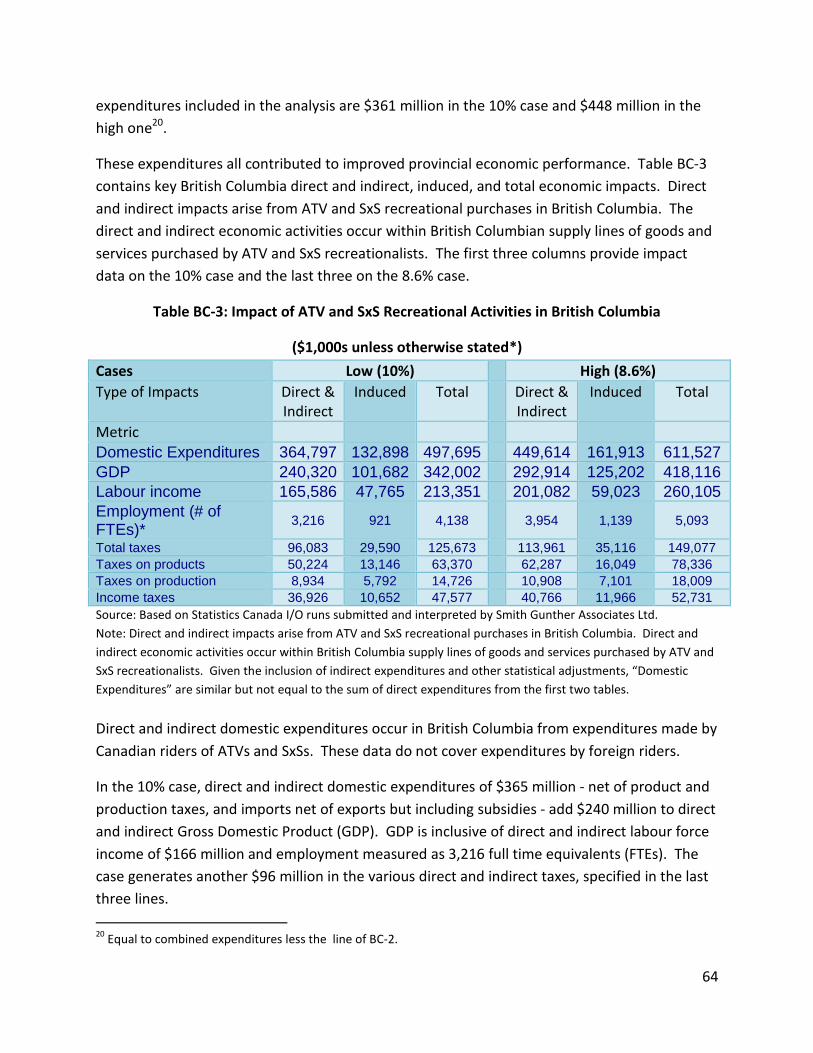
64
expenditures included in the analysis are $361 million in the 10% case and $448 million in the
high one20.
These expenditures all contributed to improved provincial economic performance. Table BC-3
contains key British Columbia direct and indirect, induced, and total economic impacts. Direct
and indirect impacts arise from ATV and SxS recreational purchases in British Columbia. The
direct and indirect economic activities occur within British Columbian supply lines of goods and
services purchased by ATV and SxS recreationalists. The first three columns provide impact
data on the 10% case and the last three on the 8.6% case.
Table BC-3: Impact of ATV and SxS Recreational Activities in British Columbia
($1,000s unless otherwise stated*)
Cases Low (10%) High (8.6%)
Type of Impacts Direct & Indirect
Induced Total Direct & Indirect
Induced Total
Metric
Domestic Expenditures 364,797 132,898 497,695 449,614 161,913 611,527
GDP 240,320 101,682 342,002 292,914 125,202 418,116
Labour income 165,586 47,765 213,351 201,082 59,023 260,105
Employment (# of FTEs)*
3,216 921 4,138 3,954 1,139 5,093
Total taxes 96,083 29,590 125,673 113,961 35,116 149,077
Taxes on products 50,224 13,146 63,370 62,287 16,049 78,336
Taxes on production 8,934 5,792 14,726 10,908 7,101 18,009
Income taxes 36,926 10,652 47,577 40,766 11,966 52,731
Source: Based on Statistics Canada I/O runs submitted and interpreted by Smith Gunther Associates Ltd.
Note: Direct and indirect impacts arise from ATV and SxS recreational purchases in British Columbia. Direct and
indirect economic activities occur within British Columbia supply lines of goods and services purchased by ATV and
SxS recreationalists. Given the inclusion of indirect expenditures and other statistical adjustments, “Domestic
Expenditures” are similar but not equal to the sum of direct expenditures from the first two tables.
Direct and indirect domestic expenditures occur in British Columbia from expenditures made by
Canadian riders of ATVs and SxSs. These data do not cover expenditures by foreign riders.
In the 10% case, direct and indirect domestic expenditures of $365 million - net of product and
production taxes, and imports net of exports but including subsidies - add $240 million to direct
and indirect Gross Domestic Product (GDP). GDP is inclusive of direct and indirect labour force
income of $166 million and employment measured as 3,216 full time equivalents (FTEs). The
case generates another $96 million in the various direct and indirect taxes, specified in the last
three lines.
20
Equal to combined expenditures less the line of BC-2.

65
In the 8.6% case, direct and indirect domestic expenditures of $450 million - net of product and
production taxes, and imports net of exports but including subsidies - add $293 million to direct
and indirect Gross Domestic Product (GDP). GDP is inclusive of direct and indirect labour force
income of $166 million and employment measured as 3,954 full-time equivalents (FTEs). This
case generates another $114 million in the various direct and indirect taxes, specified in the last
three lines.
Net of income taxes and usually minor savings, incremental labour force incomes facilitate
additional consumption which yield induced impacts, documented in the second and fifth
columns. Added to the direct and indirect impacts these result in the total impacts in columns
3 and 6.
Total impacts in the above table size British Columbia ATV and SxS activities in the range of
domestic expenditures of $498 million to $612 million generating GDP of $342 million to $418
million including labour force incomes of $213 million to $260 million. Tax revenues as a result
of ATV and SxS expenditures yield $126 million to $149 million. Further, these activities and
related expenditures generate fuller employment by 4,138 to 5,093 FTEs21.
21
FTEs in British Columbia can be converted to jobs by multiplying its FTEs by 1.169.

66
Alberta
In 2015, Albertans operated an estimated minimum of 114,221 ATVs and 80,516 SxSs. This
estimate is based on an attrition rate of 10% of the current and previous years’ stocks of ATVs
and on SxSs purchased after 2006 when they started being deployed for recreational purposes.
With a rate of attrition of 8.6%, more vehicles remain operational - ATVs (127,406) and SxSs
(104,269). The Smith Gunther survey results suggest the case based on the 8.6%, but the 10%
case is more in line with attrition rates in studies of personal watercraft and snowmobiles.
Participants in ATV and SxS recreational activities made investments in new and replacement
ATVs and SxSs annually, as well as enhanced on-highway vehicles for transporting ATVs and
SxSs and accommodations for themselves, such as trailers, larger vehicles and mobile homes
(RVs)22. During 2015, annual investments, in the economic meaning of new purchases of
equipment, in ATVs, SxSs and related enhanced vehicles reached $232 million to $265 million
shown in Table AB-1, before depreciation. Since this data reflects purchases of new ATVs and
SxSs, the numbers are not affected by rates of attrition. Investments in enhanced on-highway
vehicles are affected in that fewer or more vehicles are required to transport the newly
purchased stock as well as the stock still in operation. In the 10% case, fewer ATVs and SxSs are
still in operation therefore fewer enhanced vehicles are required and less is spent on replacing
them. The opposite is true in the 8.6% case.
Table AB-1: 2015 Alberta Investments in ATVs and SxSs ($1,000s)
Items\Cases Low (10%)
High (8.6%)
ATVs 95,849 95,849
SxSs 100,178 100,178
Enhanced on-highway vehicles 36,200 68,800
Total 232,227 264,827 Sources: Smith Gunther Associates Ltd. based on annual sales data of ATVs and survey data for SxSs.
Table AB-2 summarizes 2015 direct operating expenditures by ATV and SxS recreationalists for
both cases. Annual Alberta direct operating expenditures amounted to an additional $1.1
billion to $1.5 billion.
22 Recreational Vehicle (RV) is used narrowly herein to include only mobile homes

67
Because the number of ATVs and SxSs in operation differs in the 10% and 8.6% cases and
affects each type of direct operating expenditure, the gap between both cases’ direct operating
expenditures widens relative to direct investments where only the enhancement of on-highway
vehicles associated with ATV and SxS recreation was impacted.
Table AB-2: 2015 Key Alberta Operating Expenditures in ATV and SxS Activities ($1,000s)
Operating Expenditures\Cases Low (10%)
High (8.6%)
Repair & maintenance 289,627 360,078
Gasoline for ATVs and SxSs 141,609 172,684
Food and beverages 146,178 175,953
Casualty & liability insurance 114,262 139,140
Accommodation excluding RV expenditures
42,330 71,711
Ground transportation 26,466 31,690
Club & trail fess 28,477 35,403
Entertainment 47,830 57,595
Other 157,727 245,686
Total included in further analysis 994,505 1,289,940
Licenses 22,910 27,436
Volunteer time* 131,131 170,565
Excluded from further analysis 154,042 198,001
Total 1,148,547 1,487,941 Sources: Smith Gunther Associates Ltd. based on annual sales data of ATVs and survey data for SxSs.
Note:*The survey established the amount of volunteer time by province which was extrapolated to cover
all provincial ATV and SxS recreationalists and assessed at 40% of average hourly wages and salary rates in
each province in line with standard practices for benefit-cost analysis.
Combined direct investment and operating expenditure data (Totals in Tables AB-1 and AB-2)
have annual impacts of $1.4 billion to $1.8 billion of which licenses and volunteer time are
outside of Statistics Canada’s analytical framework, so that the total direct operating and
investment expenditures included in the analysis are $1.2 billion in the 10% case and $1.6
billion in the 8.6% one23.
These expenditures all contributed to improved provincial economic performance. Table AB-3
contains key Alberta direct and indirect, induced, and total economic impacts. Direct and
indirect impacts arise from ATV and SxS recreational purchases in Alberta. Direct and indirect
economic activities occur within the province’s supply lines of goods and services purchased by
23
Equal to combined expenditures less the second last line of AB-2.
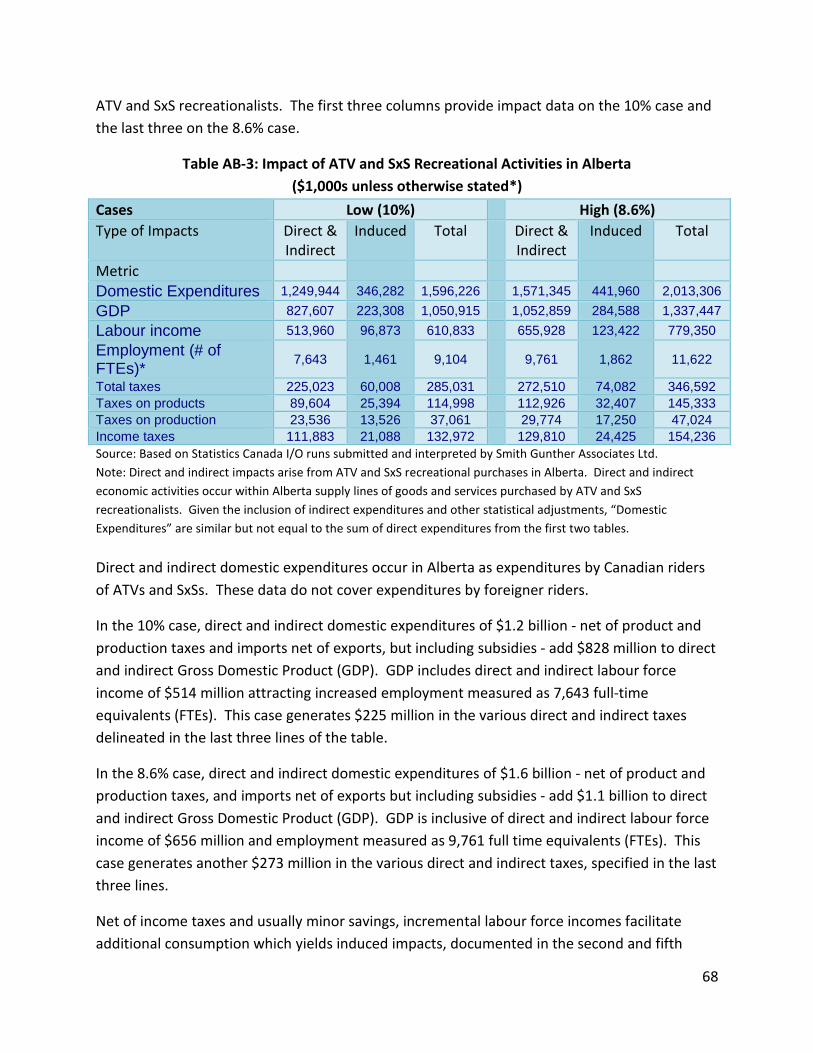
68
ATV and SxS recreationalists. The first three columns provide impact data on the 10% case and
the last three on the 8.6% case.
Table AB-3: Impact of ATV and SxS Recreational Activities in Alberta
($1,000s unless otherwise stated*)
Cases Low (10%) High (8.6%)
Type of Impacts Direct & Indirect
Induced Total Direct & Indirect
Induced Total
Metric
Domestic Expenditures 1,249,944 346,282 1,596,226 1,571,345 441,960 2,013,306
GDP 827,607 223,308 1,050,915 1,052,859 284,588 1,337,447
Labour income 513,960 96,873 610,833 655,928 123,422 779,350
Employment (# of FTEs)*
7,643 1,461 9,104 9,761 1,862 11,622
Total taxes 225,023 60,008 285,031 272,510 74,082 346,592
Taxes on products 89,604 25,394 114,998 112,926 32,407 145,333
Taxes on production 23,536 13,526 37,061 29,774 17,250 47,024
Income taxes 111,883 21,088 132,972 129,810 24,425 154,236
Source: Based on Statistics Canada I/O runs submitted and interpreted by Smith Gunther Associates Ltd.
Note: Direct and indirect impacts arise from ATV and SxS recreational purchases in Alberta. Direct and indirect
economic activities occur within Alberta supply lines of goods and services purchased by ATV and SxS
recreationalists. Given the inclusion of indirect expenditures and other statistical adjustments, “Domestic
Expenditures” are similar but not equal to the sum of direct expenditures from the first two tables.
Direct and indirect domestic expenditures occur in Alberta as expenditures by Canadian riders
of ATVs and SxSs. These data do not cover expenditures by foreigner riders.
In the 10% case, direct and indirect domestic expenditures of $1.2 billion - net of product and
production taxes and imports net of exports, but including subsidies - add $828 million to direct
and indirect Gross Domestic Product (GDP). GDP includes direct and indirect labour force
income of $514 million attracting increased employment measured as 7,643 full-time
equivalents (FTEs). This case generates $225 million in the various direct and indirect taxes
delineated in the last three lines of the table.
In the 8.6% case, direct and indirect domestic expenditures of $1.6 billion - net of product and
production taxes, and imports net of exports but including subsidies - add $1.1 billion to direct
and indirect Gross Domestic Product (GDP). GDP is inclusive of direct and indirect labour force
income of $656 million and employment measured as 9,761 full time equivalents (FTEs). This
case generates another $273 million in the various direct and indirect taxes, specified in the last
three lines.
Net of income taxes and usually minor savings, incremental labour force incomes facilitate
additional consumption which yields induced impacts, documented in the second and fifth
69
columns. Added to the direct and indirect impacts these result in the total impacts in columns
3 and 6.
Total impacts in the above table size Alberta ATV and SxS activities in the range of domestic
expenditures of $1.6 billion to $2.0 billion generating GDP of $1.1 billion to $1.3 billion
including labour force incomes of $611 million to $779 million. Tax revenues as a result of ATV
and SxS expenditures yield $289 million to $347 million. Further, these activities and related
expenditures generate fuller employment by 9,104 to 11,622 FTEs24.
24
FTEs in Alberta can be converted to jobs by multiplying its FTEs by 1.146.

70
Saskatchewan
In 2015, Saskatchewan residents operated an estimated minimum of 37,394 ATVs and 2,027
SxSs. This estimate is based on an attrition rate of 10% of the current and previous years’ stocks
of ATVs and on SxSs purchased after 2006 when they started being deployed for recreational
purposes. With a rate of attrition of 8.6%, more vehicles remain operational – ATVs (41,113)
and SxSs (28,853). The Smith Gunther survey results suggest the case based on the 8.6%, but
the 10% case is more in line with attrition rates in studies of personal watercraft and
snowmobiles.
Participants in ATV and SxS recreational activities made investments in new and replacement
ATVs and SxSs annually, as well as enhanced on-highway vehicles for transporting ATVs and
SxSs and accommodations for themselves, such as trailers, larger vehicles and mobile homes
(RVs)25. During 2015, annual investments, in the economic meaning of new purchases of
equipment, in ATVs, SxSs and related enhanced vehicles reached $80 million to $88 million
shown in Table SK-1, before depreciation. Since this data reflects purchases of new ATVs and
SxSs, the numbers are not affected by rates of attrition. Investments in enhanced on-highway
vehicles are affected in that fewer or more vehicles are required to transport the newly
purchased stock as well as the stock still in operation. In the 10% case, fewer ATVs and SxSs are
still in operation therefore fewer enhanced vehicles are required and less is spent on replacing
them. The opposite is true in the 8.6% case.
Table SK-1: 2015 Saskatchewan Investments in ATVs and SxSs ($1,000s)
Items\Cases Low (10%)
High (8.6%)
ATVs 44,063 44,063
SxSs 30,215 30,215
Enhanced on-highway vehicles 5,500 13,600
Total 79,778 87,878 Sources: Smith Gunther Associates Ltd. based on annual sales data of ATVs and survey data for SxSs.
Table SK-2 summarizes 2015 expenditures by ATV and SxS recreationalists for both cases.
Annual Saskatchewan direct operating expenditures amounted to an additional $263 million to
$375 million.
25 Recreational Vehicle (RV) is used narrowly herein to include only mobile homes

71
Because the number of ATVs and SxSs in operation differs in the 10% and 8.6% cases and
affects each type of direct operating expenditure, the gap between both cases’ direct operating
expenditures widens relative to direct investments where only the enhancement of on-highway
vehicles associated with ATV and SxS recreation was impacted.
Table SK-2: 2015 Key Saskatchewan Direct Operating Expenditures in ATV and SxS Activities
($1,000s)
Operating Expenditures\Cases Low (10%) High (8.6%)
Repair & maintenance 80,360 108367
Gasoline for ATVs and SxSs 57,676 79745
Food and beverages 31,924 42190
Casualty & liability insurance 20,855 26947
Accommodation excluding RV expenditures
17,994 35621
Ground transportation 13,128 14833
Club & trail fess 3,376 4466
Entertainment 5,362 6,787
Other 12,797 27701
Total included in further analysis 243,472 346656
Licenses 5,434 7733
Volunteer time* 13,861 20317
Excluded from further analysis 19,295 28050
Total 262,766.88 374,705.40 Sources: Smith Gunther Associates Ltd. based on annual sales data of ATVs and survey data for SxSs.
Note:*The survey established the amount of volunteer time by province which was extrapolated to cover
all provincial ATV and SxS recreationalists and assessed at 40% of average hourly wages and salary rates in
each province in line with standard practices for benefit-cost analysis.
Combined investment and direct operating expenditure (Tables SK-I and SK-2) have annual
impacts of $343 billion to $463 million of which licenses and volunteer time are outside of
Statistics Canada’s analytical framework, so that the total direct operating and investment
expenditures included in the analysis are $324 million in the 10% case and $435 million in the
8.6% one26.
These expenditures all contributed to improved provincial economic performance. Table SK-3
contains key Saskatchewan direct and indirect, induced, and total economic impacts. Direct
and indirect impacts arise from ATV and SxS recreational purchases in Saskatchewan. Direct
and indirect economic activities occur within the province’s supply lines of goods and services
26
Equal to combined expenditures less the second last line of SK-2.

72
purchased by ATV and SxS recreationalists. The first three columns provide impact data on the
10% case and the last three on the 8.6% case.
Table SK-3: Impact of ATV and SxS Recreational Activities in Saskatchewan
($1,000s unless otherwise stated*)
Cases Low (10%) High (8.6%)
Type of Impacts Direct & Indirect
Induced Total Direct & Indirect
Induced Total
Metric
Domestic Expenditures 327,003 69,684 396,687 425,306 92,457 517,762
GDP 167,937 40,308 208,245 222,213 52,998 275,212
Labour income 100,718 16,149 116,867 134,021 21,218 155,239
Employment (# of FTEs)*
1,915 308 2,222 2,564 404 2,968
Total taxes 64,157 13,518 77,675 81,739 17,445 99,183
Taxes on products 38,764 6,859 45,623 50,712 9,088 59,800
Taxes on production 3,693 3,179 6,873 4,776 4,201 8,977
Income taxes 21,700 3,479 25,179 26,251 4,156 30,407
Source: Based on Statistics Canada I/O runs submitted and interpreted by Smith Gunther Associates Ltd.
Note: Direct and indirect impacts arise from ATV and SxS recreational purchases in Saskatchewan. Direct and
indirect economic activities occur within Saskatchewan supply lines of goods and services purchased by ATV and
SxS recreationalists. Given the inclusion of indirect expenditures and other statistical adjustments, “Domestic
Expenditures” are similar but not equal to the sum of direct expenditures from the first two tables.
Direct and indirect domestic expenditures occur in Saskatchewan as expenditures by riders of
ATVs and SxSs. These numbers do not cover expenditures by foreigners riding in Canada.
In the 10% case, direct and indirect domestic expenditures of $327 million - net of product and
production taxes and imports net of exports, but including subsidies - add $170 million to direct
and indirect Gross Domestic Product (GDP). GDP includes direct and indirect labour force
income of $101 million attracting increased employment measured as 1,915 full-time
equivalents (FTEs). This case also directly and indirectly generates $64 million in the various
direct and indirect taxes delineated in the last three lines of the table.
In the 8.6% case, direct and indirect domestic expenditures of $425 million - net of product and
production taxes, and imports net of exports but including subsidies - add $222 million to direct
and indirect Gross Domestic Product (GDP). GDP is inclusive of direct and indirect labour force
income of $134 million and employment measured as 2,564 full-time equivalents (FTEs). This
case generates another $82 million in the various direct and indirect taxes, specified in the last
three lines.
Net of income taxes and usually minor savings, incremental labour force incomes facilitate
additional consumption which yields induced impacts, documented in the second and fifth

73
columns. Added to the direct and indirect impacts these result in the total impacts in columns
3 and 6.
Total impacts in the above table size Saskatchewan ATV and SxS activities in the range of
domestic expenditures of $397 million to $518 million generating GDP of $208 million to $275
million including labour force incomes of $117 million to $155 million. Tax revenues as a result
of ATV and SxS expenditures yield $78 million to $99 million. Further, these activities and
related expenditures generate fuller employment by 2,222 to 2,968 FTEs27.
27
FTEs in Saskatchewan can be converted to jobs by multiplying its FTEs by 1.159.

74
Manitoba
In 2015, Manitoba residents operated an estimated minimum of 27,681 ATVs and 11,508 SxSs.
This estimate is based on an attrition rate of 10% of the current and previous years’ stocks of
ATVs and on SxSs purchased after 2006 when they started being deployed for recreational
purposes. With a rate of attrition of 8.6%, more vehicles remain operational – ATVs (30,701)
and SxSs (13,347). The Smith Gunther survey results suggest the case based on the 8.6%, but
the 10% case is more in line with attrition rates in studies of personal watercraft and
snowmobiles.
Participants in ATV and SxS recreational activities made investments in new and replacement
ATVs and SxSs annually, as well as enhanced on-highway vehicles for transporting ATVs and
SxSs and accommodating themselves, such as trailers, larger vehicles and mobile homes (RVs)28.
During 2015, annual investments, in the economic meaning of new purchases of equipment, in
ATVs, SxSs and related enhanced vehicles reached $46 million to $47 shown in Table MB-1,
before depreciation. Since this data reflects purchases of new ATVs and SxSs, the numbers are
not affected by rates of attrition. Investments in enhanced on-highway vehicles are affected in
that fewer or more vehicles are required to transport the newly purchased stock as well as the
stock still in operation. In the 10% case, fewer ATVs and SxSs are still in operation therefore
fewer enhanced vehicles are required and less is spent on replacing them. The opposite is true
in the 8.6% case.
Table MB-1: 2015 Manitoba Investments in ATVs and SxSs ($1,000s)
Items\Cases Low (10%)
High (8.6%)
ATVs 30,851 30,851
SxSs 12,340 12,340
Enhanced on-highway vehicles 2,900 4,100
Total 46,091 47,291 Sources: Smith Gunther Associates Ltd. based on annual sales data of ATVs and survey data for SxSs.
Table MB-2 breaks out and summarizes 2015 direct operating expenditures by ATV and SxS
recreationalists for both cases. Annual Manitoba direct operating expenditures amounted to
an additional $196 million to $232 million distributed among sectors as noted.
28 Recreational Vehicle (RV) is used narrowly herein to include only mobile homes

75
Because the number of ATVs and SxSs in operation differs in the 10% and 8.6% cases and
affects each type of direct operating expenditure, the gap between both cases’ direct operating
expenditures widens relative to the investments where only the enhancement of on-highway
vehicles associated with ATV and SxS recreation was impacted.
Table MB-2: 2015 Key Manitoba Direct Operating Expenditures in ATV and SxS Activities
($1,000s)
Operating Expenditures\Cases Low (10%)
High (8.6%)
Repair & maintenance 38,775 43,073
Gasoline for ATVs and SxSs 51,511 58,314
Food and beverages 16,313 17,919
Casualty & liability insurance 35,899 38,916
Accommodation excluding RV expenditures
14,506 28,067
Ground transportation 3,575 3,786
Club & trail fess 1,476 1,536
Entertainment 2,938 3,155
Other 15,892 19,787
Total included in further analysis 180,885 214,553
Licenses 10,148 11,264
Volunteer time* 5,278 6,090
Excluded from further analysis 15,426 17,354
Total 196,311 231,907 Sources: Smith Gunther Associates Ltd. based on annual sales data of ATVs and survey data for SxSs.
Note:*The survey established the amount of volunteer time by province which was extrapolated to cover
all provincial ATV and SxS recreationalists and assessed at 40% of average hourly wages and salary rates in
each province in line with standard practices for benefit-cost analysis.
Combined direct investment and direct operating expenditure (Tables MB-1 and MB-2) have
annual impacts of $242 billion to $279 million of which licenses and volunteer time are outside
of Statistics Canada’s analytical framework, so that the total direct operating and investment
expenditures included in the analysis are $227 million in the 10% case and $262 million in the
8.6% one29.
These expenditures all contributed to improved provincial economic performance. Table MB-3
contains key Manitoba direct and indirect, induced, and total economic impacts. Direct and
indirect impacts arise from ATV and SxS recreational purchases in Manitoba. Direct and indirect
29
Equal to combined expenditures less the second last line of MB-2.
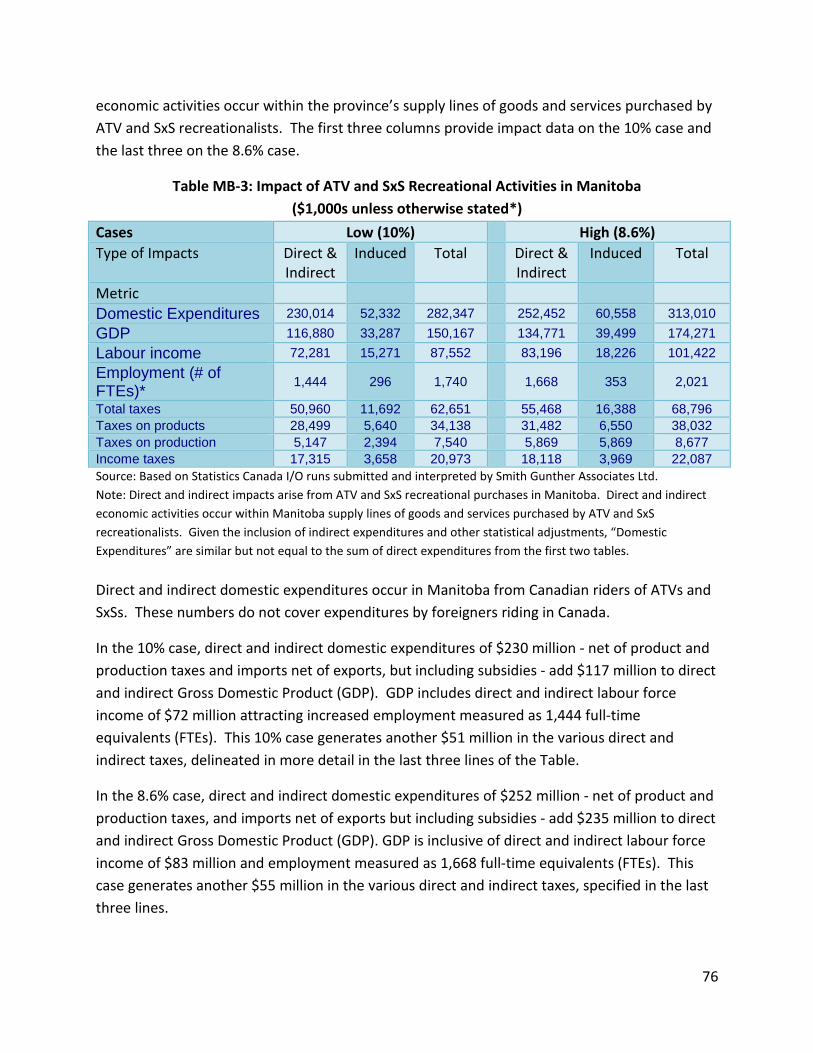
76
economic activities occur within the province’s supply lines of goods and services purchased by
ATV and SxS recreationalists. The first three columns provide impact data on the 10% case and
the last three on the 8.6% case.
Table MB-3: Impact of ATV and SxS Recreational Activities in Manitoba
($1,000s unless otherwise stated*)
Cases Low (10%) High (8.6%)
Type of Impacts Direct & Indirect
Induced Total Direct & Indirect
Induced Total
Metric
Domestic Expenditures 230,014 52,332 282,347 252,452 60,558 313,010
GDP 116,880 33,287 150,167 134,771 39,499 174,271
Labour income 72,281 15,271 87,552 83,196 18,226 101,422
Employment (# of FTEs)*
1,444 296 1,740 1,668 353 2,021
Total taxes 50,960 11,692 62,651 55,468 16,388 68,796
Taxes on products 28,499 5,640 34,138 31,482 6,550 38,032
Taxes on production 5,147 2,394 7,540 5,869 5,869 8,677
Income taxes 17,315 3,658 20,973 18,118 3,969 22,087
Source: Based on Statistics Canada I/O runs submitted and interpreted by Smith Gunther Associates Ltd.
Note: Direct and indirect impacts arise from ATV and SxS recreational purchases in Manitoba. Direct and indirect
economic activities occur within Manitoba supply lines of goods and services purchased by ATV and SxS
recreationalists. Given the inclusion of indirect expenditures and other statistical adjustments, “Domestic
Expenditures” are similar but not equal to the sum of direct expenditures from the first two tables.
Direct and indirect domestic expenditures occur in Manitoba from Canadian riders of ATVs and
SxSs. These numbers do not cover expenditures by foreigners riding in Canada.
In the 10% case, direct and indirect domestic expenditures of $230 million - net of product and
production taxes and imports net of exports, but including subsidies - add $117 million to direct
and indirect Gross Domestic Product (GDP). GDP includes direct and indirect labour force
income of $72 million attracting increased employment measured as 1,444 full-time
equivalents (FTEs). This 10% case generates another $51 million in the various direct and
indirect taxes, delineated in more detail in the last three lines of the Table.
In the 8.6% case, direct and indirect domestic expenditures of $252 million - net of product and
production taxes, and imports net of exports but including subsidies - add $235 million to direct
and indirect Gross Domestic Product (GDP). GDP is inclusive of direct and indirect labour force
income of $83 million and employment measured as 1,668 full-time equivalents (FTEs). This
case generates another $55 million in the various direct and indirect taxes, specified in the last
three lines.

77
Net of income taxes and usually minor savings, incremental labour force incomes facilitate
additional consumption which yields induced impacts, documented in the second and fifth
columns. Added to the direct and indirect impacts these result in the total impacts in columns
3 and 6.
Total impacts in the above table size Manitoba ATV and SxS activities in the range of domestic
expenditures of $285 million to $313 million generating GDP of $150 million to $174 million
including labour force incomes of $88 million to $101 million. Tax revenues as a result of ATV
and SxS expenditures yield $63 million to $69 million. Further, these activities and related
expenditures generate fuller employment by 1,740 to 2,021 FTEs30.
30
FTEs in Manitoba can be converted to jobs by multiplying its FTEs by 1.165.

78
Ontario
In 2015, Ontario residents operated an estimated minimum of 141,135 ATVs and 36,941 SxSs.
This estimate is based on an attrition rate of 10% of the current and previous years’ stocks of
ATVs and on SxSs purchased after 2006 when they started being deployed for recreational
purposes. With a rate of attrition of 8.6%, more vehicles remain operational – ATVs (158,276)
and SxSs (59,108). The Smith Gunther survey results suggest the case based on the 8.6%, but
the 10% case is more in line with attrition rates in studies of personal watercraft and
snowmobiles.
Participants in ATV and SxS recreational activities made investments in new and replacement
ATVs and SxSs annually, as well as enhanced on-highway vehicles for transporting ATVs and
SxSs and accommodations for themselves, such as trailers, larger vehicles and mobile homes
(RVs)31. During 2015, annual investments, in the economic meaning of new purchases of
equipment, in ATVs, SxSs and related enhanced vehicles reached $201 million to $210 million
shown in Table ON-1, before depreciation. Since this data reflects purchases of new ATVs and
SxSs, the numbers are not affected by rates of attrition. Investments in enhanced on-highway
vehicles are affected in that fewer or more vehicles are required to transport the newly
purchased stock as well as the stock still in operation. In the 10% case, fewer ATVs and SxSs are
still in operation therefore fewer enhanced vehicles are required and less is spent on replacing
them. The opposite is true in the 8.6% case.
Table ON-1: 2015 Ontario Investments in ATVs and SxSs ($1,000s)
Items\Cases Low (10%)
High (8.6%)
ATVs 157,371 157,371
SxSs 33,823 33,823
Enhanced on-highway vehicles 9,500 18,900
Total 200,695 210,095 Sources: Smith Gunther Associates Ltd. based on annual sales data of ATVs and survey data for SxSs.
Table ON-2 breaks out and summarizes 2015 direct operating expenditures by ATV and SxS
recreationalists for the 8.6% and the 10% cases. Annual Ontario direct operating expenditures
amounted to an additional $630 million to $862 million.
Because the number of ATVs and SxSs in operation differs in the 10% and 8.6% cases and
affects each type of direct operating expenditure, the gap between both cases’ direct operating
31
Recreational Vehicle (RV) is used narrowly herein to include only mobile homes
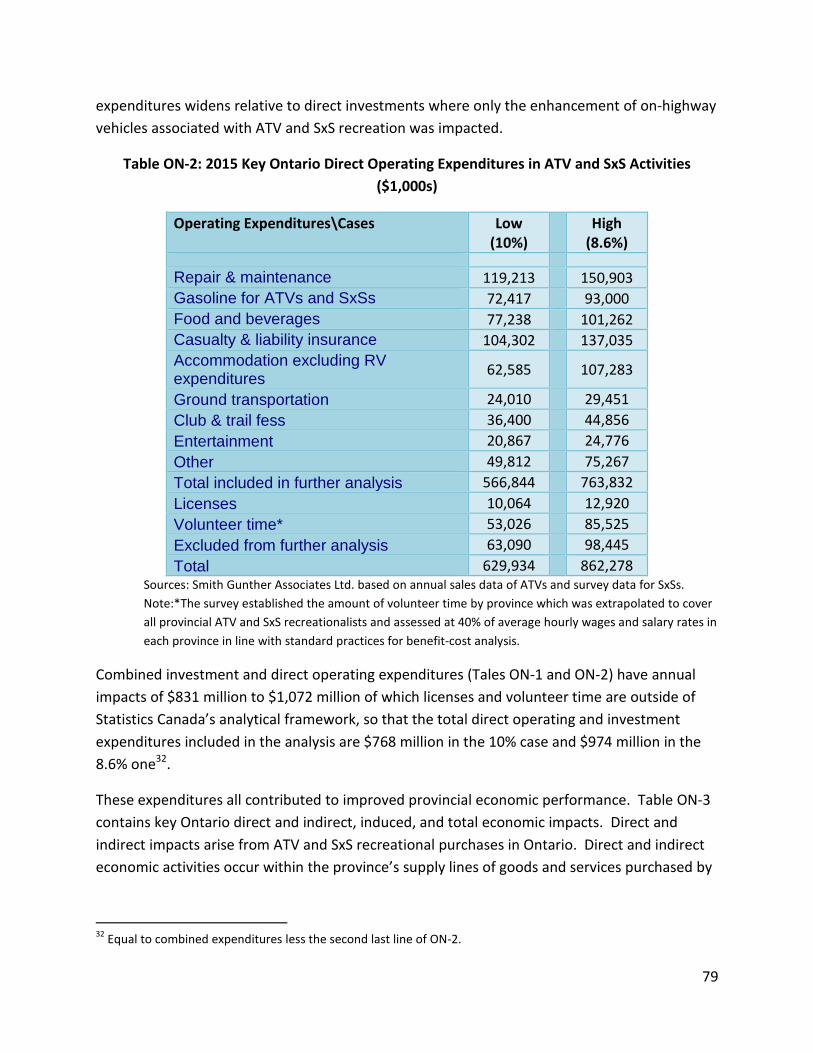
79
expenditures widens relative to direct investments where only the enhancement of on-highway
vehicles associated with ATV and SxS recreation was impacted.
Table ON-2: 2015 Key Ontario Direct Operating Expenditures in ATV and SxS Activities
($1,000s)
Operating Expenditures\Cases Low (10%)
High (8.6%)
Repair & maintenance 119,213 150,903
Gasoline for ATVs and SxSs 72,417 93,000
Food and beverages 77,238 101,262
Casualty & liability insurance 104,302 137,035
Accommodation excluding RV expenditures
62,585 107,283
Ground transportation 24,010 29,451
Club & trail fess 36,400 44,856
Entertainment 20,867 24,776
Other 49,812 75,267
Total included in further analysis 566,844 763,832
Licenses 10,064 12,920
Volunteer time* 53,026 85,525
Excluded from further analysis 63,090 98,445
Total 629,934 862,278 Sources: Smith Gunther Associates Ltd. based on annual sales data of ATVs and survey data for SxSs.
Note:*The survey established the amount of volunteer time by province which was extrapolated to cover
all provincial ATV and SxS recreationalists and assessed at 40% of average hourly wages and salary rates in
each province in line with standard practices for benefit-cost analysis.
Combined investment and direct operating expenditures (Tales ON-1 and ON-2) have annual
impacts of $831 million to $1,072 million of which licenses and volunteer time are outside of
Statistics Canada’s analytical framework, so that the total direct operating and investment
expenditures included in the analysis are $768 million in the 10% case and $974 million in the
8.6% one32.
These expenditures all contributed to improved provincial economic performance. Table ON-3
contains key Ontario direct and indirect, induced, and total economic impacts. Direct and
indirect impacts arise from ATV and SxS recreational purchases in Ontario. Direct and indirect
economic activities occur within the province’s supply lines of goods and services purchased by
32
Equal to combined expenditures less the second last line of ON-2.

80
ATV and SxS recreationalists. The first three columns provide impact data on the 10% case and
the last three on the 8.6% case.
Table ON-3: Impact of ATV and SxS Recreational Activities in Ontario
($1,000s unless otherwise stated*)
Cases Low (10%) High (8.6%)
Type of Impacts Direct & Indirect
Induced Total Direct & Indirect
Induced Total
Metric
Domestic Expenditures 776,547 341,427 1,117,974 940,629 444,668 1,385,297
GDP 745,500 294,242 1,039,742 982,981 379,370 1,362,351
Labour income 470,060 152,310 622,370 614,394 196,036 810,430
Employment (# of FTEs)*
7,510 2,464 9,974 9,858 3,174 13,032
Total taxes 245,068 94,699 339,767 301,479 118,305 419,784
Taxes on products 99,577 35,653 135,229 123,976 46,347 170,322
Taxes on production 33,522 22,766 56,289 44,457 29,506 73,963
Income taxes 111,969 36,280 148,249 133,047 42,452 175,499
Source: Based on Statistics Canada I/O runs submitted and interpreted by Smith Gunther Associates Ltd.
Note: Direct and indirect impacts arise from ATV and SxS recreational purchases in Ontario. Direct and indirect
economic activities occur within Ontario supply lines of goods and services purchased by ATV and SxS
recreationalists. Given the inclusion of indirect expenditures and other statistical adjustments, “Domestic
Expenditures” are similar but not equal to the sum of direct expenditures from the first two tables.
Direct and indirect domestic expenditures occur in Ontario from Canadian riders of ATVs and
SxSs. These numbers do not cover expenditures by foreigners riding in Canada.
In the 10% case, direct and indirect domestic expenditures of $777 million - net of product and
production taxes and imports net of exports, but including subsidies - add $746 million to direct
and indirect Gross Domestic Product (GDP)33. GDP includes direct and indirect labour force
income of $470 million attracting increased employment measured as 7,510 full-time
equivalents (FTEs). This case generates another $245 million in the various direct and indirect
taxes, delineated in more detail in the last three lines of the Table.
In the 8.6% case, direct and indirect domestic expenditures of $941 million - net of product and
production taxes, and imports net of exports but including subsidies - add $983 million to direct
and indirect Gross Domestic Product (GDP). GDP is inclusive of direct and indirect labour force
income of $614 million and employment measured as 9,858 full-time equivalents (FTEs). This
case generates another $301 million in the various direct and indirect taxes, specified in the last
three lines. 33
GDP earned in Ontario also includes the GDP earned on exports to the rest of the country, explaining why the differences between its provincial domestic earnings and GDP are so small when compared to other provinces.

81
Net of income taxes and usually minor savings, incremental labour force incomes facilitate
additional consumption which yields induced impacts, documented in the second and fifth
columns. Added to the direct and indirect impacts these result in the total impacts in columns
3 and 6.
Total impacts in the above table size Ontario ATV and SxS activities in the range of domestic
expenditures of $1.1 billion to $1.4 billion generating GDP of $1.0 billion to $1.4 billion
including labour force incomes of $622 million to $810 million. Tax revenues as a result of ATV
and SxS expenditures yield $340 million to $420 million. Further, these activities and related
expenditures generate fuller employment by 9,974 to 13,032 FTEs34.
34
FTEs in Ontario can be converted to jobs by multiplying its FTEs by 1.144.

82
Quebec
In 2015, Quebec residents operated an estimated minimum of 166,395 ATVs and 79,061 SxSs.
This estimate is based on an attrition rate of 10% of the current and previous years’ stocks of
ATVs and on SxSs purchased after 2006 when they started being deployed for recreational
purposes. With a rate of attrition of 8.6%, more vehicles remain operational – ATVs (188,563)
and SxSs (121,010). The Smith Gunther survey results suggest the case based on the 8.6%, but
the 10% case is more in line with attrition rates in studies of personal watercraft and
snowmobiles.
Participants in ATV and SxS recreational activities made investments in new and replacement
ATVs and SxSs annually, as well as enhanced on-highway vehicles for transporting ATVs and
SxSs and accommodations for themselves, such as trailers, larger vehicles and mobile homes
(RVs)35. During 2015, annual investments, in the economic meaning of new purchases of
equipment, in ATVs, SxSs and related enhanced vehicles reached $248 million to $263 million
shown in Table QC-1, before depreciation. Since this data reflects purchases of new ATVs and
SxSs, the numbers are not affected by rates of attrition. Investments in enhanced on-highway
vehicles are affected in that fewer or more vehicles are required to transport the newly
purchased stock as well as the stock still in operation. In the 10% case, fewer ATVs and SxSs are
still in operation therefore fewer enhanced vehicles are required and less is spent on replacing
them. The opposite is true in the 8.6% case.
Table QC-1: 2015 Quebec Investments in ATVs and SxSs ($1,000s)
Items\Cases Low (10%)
High (8.6%)
ATVs 136,552 136,552
SxSs 93,636 93,636
Enhanced on-highway vehicles 18,300 33,000
Total 248,488 263,188 Sources: Smith Gunther Associates Ltd. based on annual sales data of ATVs and survey data for SxSs.
Table QC-2 breaks out and summarizes 2015 direct operating expenditures by ATV and SxS
recreationalists for both cases. Annual Quebec direct operating expenditures amounted to an
additional $1.8 billion to $2.5 billion.
35 Recreational Vehicle (RV) is used narrowly herein to include only mobile homes

83
Because the number of ATVs and SxSs in operation differs in the 10% and 8.6% cases and
affects each type of direct operating expenditure, the gap between both cases’ direct operating
expenditures widens relative to direct investments where only the enhancement of on-highway
vehicles associated with ATV and SxS recreation was impacted.
Table QC-2: 2015 Key Quebec Direct Operating Expenditures in ATV and SxS Activities
($1,000s)
Operating Expenditures\Cases Low (10%)
High (8.6%)
Repair & maintenance 433,802 620,863
Gasoline for ATVs and SxSs 251,477 351,811
Food and beverages 254,656 341,491
Casualty & liability insurance 163,694 211,395
Accommodation excluding RV expenditures
18,037 18,413
Ground transportation 78,331 102,935
Club & trail fess 103,579 124,663
Entertainment 93,614 102,141
Other 118,775 181,661
Total included in further analysis 1,515,965 2,055,373
Licenses 26,417 33,837
Volunteer time* 253,554 393,183
Excluded from further analysis 279,971 427,020
Total 1,795,937 2,482,393 Sources: Smith Gunther Associates Ltd. based on annual sales data of ATVs and survey data for SxSs.
Note:*The survey established the amount of volunteer time by province which was extrapolated to cover
all provincial ATV and SxS recreationalists and assessed at 40% of average hourly wages and salary rates in
each province in line with standard practices for benefit-cost analysis.
Combined investment and direct operating expenditures (Table QC-1 and QC-2) have annual
impacts of $2.0 billion to $2.7 billion of which licenses and volunteer time are outside of
Statistics Canada’s analytical framework, as discussed later in the report, so that the total direct
operating and investment expenditures included in the analysis are $1.8 billion in the 10% case
and $2.3 billion in the 8.6% one36.
These expenditures all contributed to improved provincial economic performance. Table QC-3
contains key Quebec direct and indirect, induced, and total economic impacts. Direct and
indirect impacts arise from ATV and SxS recreational purchases in Quebec. Direct and indirect
36
Equal to combined expenditures less the second last line of QC-2.

84
economic activities occur within the province’s supply lines of goods and services purchased by
ATV and SxS recreationalists. The first three columns provide impact data on the 10% case and
the last three on the 8.6% case.
Table QC-3: Impact of ATV and SxS Recreational Activities in Quebec
($1,000s unless otherwise stated*)
Cases Low (10%) High (8.6%)
Type of Impacts Direct & Indirect
Induced Total Direct & Indirect
Induced Total
Metric
Domestic Expenditures 1,781,614 444,754 2,226,369 2,357,956 570,372 2,928,328
GDP 1,061,702 274,701 1,336,404 1,354,422 351,666 1,706,088
Labour income 666,826 132,793 799,619 852,610 169,953 1,022,564
Employment (# of FTEs)*
13,251 2,591 15,842 17,224 3,317 20,542
Total taxes 496,033 113,387 609,420 624,206 141,056 765,262
Taxes on products 267,442 48,721 316,163 353,143 62,472 415,615
Taxes on production 46,171 28,339 74,510 59,019 36,316 95,335
Income taxes 182,420 36,327 218,748 212,044 42,267 254,312
Source: Based on Statistics Canada I/O runs submitted and interpreted by Smith Gunther Associates Ltd.
Note: Direct and indirect impacts arise from ATV and SxS recreational purchases in Quebec. Direct and indirect
economic activities occur within Quebec supply lines of goods and services purchased by ATV and SxS
recreationalists. Given the inclusion of indirect expenditures and other statistical adjustments, “Domestic
Expenditures” are similar but not equal to the sum of direct expenditures from the first two tables.
Direct and indirect domestic expenditures occur in Quebec from Canadian riders of ATVs and
SxSs. These data do not cover expenditures by foreigners riding in Canada.
In the 10% case, direct and indirect domestic expenditures of $1.8 billion - net of product and
production taxes and imports net of exports, but including subsidies - add $1.1 billion to direct
and indirect Gross Domestic Product (GDP). GDP includes direct and indirect labour force
income of $667 million and increased employment measured as 13,251 full-time equivalents
(FTEs). This case generates another $496 million in the various direct and indirect taxes,
delineated in more detail in the last three lines of the Table.
In the 8.6% case, direct and indirect domestic expenditures of $2.4 billion - net of product and
production taxes, and imports net of exports but including subsidies - add $1.4 billion to direct
and indirect Gross Domestic Product (GDP). GDP is inclusive of direct and indirect labour force
income of $853 million and employment measured as 17,224 full-time equivalents (FTEs). This
case generates another $624 million in the various direct and indirect taxes, specified in the last
three lines.

85
Net of income taxes and usually minor savings, incremental labour force incomes facilitate
additional consumption which yields induced impacts, documented in the second and fifth
columns. Added to the direct and indirect impacts these result in the total impacts in columns
3 and 6.
Total impacts in the above table size Quebec ATV and SxS activities in the range of domestic
expenditures of $2.2 billion to $2.9 billion generating GDP of $1.3 billion to $1.7 billion
including labour force incomes of $800 million to $1.0 million. Tax revenues as a result of ATV
and SxS expenditures yield $609 million to $765 million. Further, these activities and related
expenditures generate fuller employment by 15,842 to 20,542 FTEs37.
37
FTEs in Quebec can be converted to jobs by multiplying its FTEs by 1.128.

86
New Brunswick
In 2015, New Brunswick residents operated an estimated minimum of 28,064 ATVs and 13,046
SxSs. This estimate is based on an attrition rate of 10% of the current and previous years’
stocks of ATVs and on SxSs purchased after 2006 when they started being deployed for
recreational purposes. With a rate of attrition of 8.6%, more vehicles remain operational –
ATVs (31,697) and SxSs (18,773). The Smith Gunther survey results suggest the case based on
the 8.6%, but the 10% case is more in line with attrition rates in studies of personal watercraft
and snowmobiles.
Participants in ATV and SxS recreational activities made investments in new and replacement
ATVs and SxSs annually, as well as enhanced on-highway vehicles for transporting ATVs and
SxSs and accommodations for themselves, such as trailers, larger vehicles and mobile homes
(RVs)38. During 2015, annual investments, in the economic meaning of new purchases of
equipment, in ATVs, SxSs and related enhanced vehicles reached $53 million to $54 million
shown in Table NB-1, before depreciation. Since this data reflects purchases of new ATVs and
SxSs, the numbers are not affected by rates of attrition. Investments in enhanced on-highway
vehicles are affected in that fewer or more vehicles are required to transport the newly
purchased stock as well as the stock still in operation. In the 10% case, fewer ATVs and SxSs are
still in operation therefore fewer enhanced vehicles are required and less is spent on replacing
them. The opposite is true in the 8.6% case.
Table NB-1: 2015 New Brunswick Investments in ATVs and SxSs ($1,000s)
Items\Cases Low (10%)
High (8.6%)
ATVs 29,812 29,812
SxSs 21,304 21,304
Enhanced on-highway vehicles 1,500 2,500
Total 52,616 53,616 Sources: Smith Gunther Associates Ltd. based on annual sales data of ATVs and survey data for SxSs.
Table NB-2 breaks out and summarizes 2015 direct operating expenditures by ATV and SxS
recreationalists for both cases. Annual New Brunswick direct operating expenditures
amounted to an additional $204 million to $262 million.
38 Recreational Vehicle (RV) is used narrowly herein to include only mobile homes

87
Because the number of ATVs and SxSs in operation differs in the 10% and 8.6% cases and
affects each type of direct operating expenditure, the gap between both cases’ direct operating
expenditures widens relative to the investments where only the enhancement of on-highway
vehicles associated with ATV and SxS recreation was impacted.
Table NB-2: 2015 Key New Brunswick Direct Operating Expenditures in ATV and SxS Activities
($1,000s)
Operating Expenditures\Cases Low (10%)
High (8.6%)
Repair & maintenance 35,075 43,460
Gasoline for ATVs and SxSs 31,717 39,825
Food and beverages 30,203 37,242
Casualty & liability insurance 26,342 32,271
Accommodation excluding RV expenditures
13,233 19,517
Ground transportation 6,148 7,612
Club & trail fess 8,072 9,525
Entertainment 6,878 8,566
Other 14,232 19,541
Total included in further analysis 171,898 217,559
Licenses 3,965 4,850
Volunteer time* 28,686 39,413
Excluded from further analysis 32,650 44,263
Total 204,548 261,822 Sources: Smith Gunther Associates Ltd. based on annual sales data of ATVs and survey data for SxSs.
Note:*The survey established the amount of volunteer time by province which was extrapolated to cover
all provincial ATV and SxS recreationalists and assessed at 40% of average hourly wages and salary rates in
each province in line with standard practices for benefit-cost analysis.
Combined investment and direct operating expenditures (Table NB-1 and NB-2) have annual
impacts of $257 million to $316 million of which licenses and volunteer time are outside of
Statistics Canada’s analytical framework, as discussed later in the report, so that the total direct
operating and investment expenditures included in the analysis are $224 million in the 10%
case and $272 million in the 8.6% one39.
These expenditures all contributed to improved provincial economic performance. Table NB-3
contains key New Brunswick direct and indirect, induced, and total economic impacts. Direct
and indirect impacts arise from ATV and SxS recreational purchases in New Brunswick. Direct
39
Equal to combined expenditures less the second last line of NB-2.

88
and indirect economic activities occur within the province’s supply lines of goods and services
purchased by ATV and SxS recreationalists. The first three columns provide impact data on the
10% case and the last three on the 8.6% case.
Table NB-3: Impact of ATV and SxS Recreational Activities in Quebec
($1,000s unless otherwise stated*)
Cases Low (10%) High (8.6%)
Type of Impacts Direct & Indirect
Induced Total Direct & Indirect
Induced Total
Metric
Domestic Expenditures 226,193 46,310 272,504 268,492 54,625 323,117
GDP 102,195 24,888 127,083 121,181 29,667 150,848
Labour income 64,318 11,149 75,466 75,668 13,335 89,003
Employment (# of FTEs)*
1,408 242 1,650 1,683 289 1,972
Total taxes 48,300 9,753 58,054 55,741 11,288 67,029
Taxes on products 29,143 5,397 34,540 34,723 6,373 41,096
Taxes on production 4,501 1,816 6,317 5,343 2,153 7,496
Income taxes 14,656 2,540 17,196 15,675 2,762 18,437
Source: Based on Statistics Canada I/O runs submitted and interpreted by Smith Gunther Associates Ltd.
Note: Direct and indirect impacts arise from ATV and SxS recreational purchases in New Brunswick. Direct and
indirect economic activities occur within New Brunswick supply lines of goods and services purchased by ATV and
SxS recreationalists. Given the inclusion of indirect expenditures and other statistical adjustments, “Domestic
Expenditures” are similar but not equal to the sum of direct expenditures from the first two tables.
Direct and indirect domestic expenditures occur in New Brunswick from Canadian riders of
ATVs and SxSs. These numbers do not cover expenditures by foreigners riding in Canada.
In the 10% case, direct and indirect domestic expenditures of $226 million - net of product and
production taxes and imports net of exports, but including subsidies - add $122 million to direct
and indirect Gross Domestic Product (GDP). GDP includes direct and indirect labour force
income of $64 million attracting increased employment measured as 1,408 full-time
equivalents (FTEs). This case generates another $29 million in the various direct and indirect
taxes, delineated in more detail in the last three lines of the Table.
In the 8.6% case, direct and indirect domestic expenditures of $268 million - net of product and
production taxes, and imports net of exports but including subsidies - add $121 million to direct
and indirect Gross Domestic Product (GDP). GDP is inclusive of direct and indirect labour force
income of $76 million and employment measured as 1,683 full-time equivalents (FTEs). This
case generates another $56 million in the various direct and indirect taxes, specified in the last
three lines.

89
Net of income taxes and usually minor savings, incremental labour force incomes facilitate
additional consumption which yields induced impacts, documented in the second and fifth
columns. Added to the direct and indirect impacts these result in the total impacts in columns
3 and 6.
Total impacts in the above table size New Brunswick ATV and SxS activities in the range of
domestic expenditures of $273 million to $323 million generating GDP of $127 million to $151
million including labour force incomes of $75 million to $89 million. Tax revenues as a result of
ATV and SxS expenditures yield $58 million to $67 million. Further, these activities and related
expenditures generate fuller employment by 1,650 to 1,972 FTEs40.
40
FTEs in New Brunswick can be converted to jobs by multiplying its FTEs by 1.139.

90
Prince Edward Island
In 2015, Prince Edward Island residents operated an estimated minimum of 2,155 ATVs and 519
SxSs. This estimate is based on an attrition rate of 10% of the current and previous years’
stocks of ATVs and on SxSs purchased after 2006 when they started being deployed for
recreational purposes. With a rate of attrition of 8.6%, more vehicles remain operational –
ATVs (2,384) and SxSs (919). The Smith Gunther survey results suggest the case based on the
8.6%, but the 10% case is more in-line with attrition rates in studies of personal watercraft and
snowmobiles.
Participants in ATV and SxS recreational activities made investments in new and replacement
ATVs and SxSs annually, as well as enhanced on-highway vehicles for transporting ATVs and
SxSs and accommodations for themselves, such as trailers, larger vehicles and mobile homes
(RVs)41. During 2015, annual investments, in the economic meaning of new purchases of
equipment, in ATVs, SxSs and related enhanced vehicles reached $4.9 million to $4.9 million
shown in Table PE-1, before depreciation. Since this data reflects purchases of new ATVs and
SxSs, the numbers are not affected by rates of attrition. Investments in enhanced on-highway
vehicles are affected in that fewer or more vehicles are required to transport the newly
purchased stock as well as the stock still in operation. In the 10% case, fewer ATVs and SxSs are
still in operation therefore fewer enhanced vehicles are required and less is spent on replacing
them. The opposite is true in the 8.6% case.
Table PE-1: 2015 Prince Edward Island Investments in ATVs and SxSs ($1,000s)
Items\Cases Low (10%)
High (8.6%)
ATVs 3,553 3,553
SxSs 1,263 1,263
Enhanced on-highway vehicles 100 105
Total 4,917 4,922 Sources: Smith Gunther Associates Ltd. based on annual sales data of ATVs and survey data for SxSs.
Table PE-2 summarizes 2015 direct operating expenditures by ATV and SxS recreationalists for
both cases. Annual Prince Edward Island direct operating expenditures amounted to an
additional $12.4 million to $15.9 million.
41 Recreational Vehicle (RV) is used narrowly herein to include only mobile homes and excludes ATVs, SxSs,
personal watercraft, snowmobiles, bipeds, scooters, and motorcycles.

91
Because the number of ATVs and SxSs in operation differs in the 10% and 8.6% cases and
affects each type of direct operating expenditure, the gap between both cases’ direct operating
expenditures widens relative to the investments where only the enhancement of on-highway
vehicles associated with ATV and SxS recreation was impacted.
Table PE-2: 2015 Key Prince Edward Island Direct Operating Expenditures in ATV and SxS
Activities ($1,000s)
Operating Expenditures\Cases Low (10%)
High (8.6%)
Repair & maintenance 2,471 3,352
Gasoline for ATVs and SxSs 1,517 1,992
Food and beverages 1,560 1,890
Casualty & liability insurance 2,788 3,068
Accommodation excluding RV expenditures
490 664
Ground transportation 1,855 2,329
Club & trail fess 267 348
Entertainment 311 411
Other 486 659
Total included in further analysis 11,746 14,713
Licenses 163 207
Volunteer time 513 962
Excluded from further analysis 676 1,169
Total 12,422 15,882 Sources: Smith Gunther Associates Ltd. based on annual sales data of ATVs and survey data for SxSs.
Note:*The survey established the amount of volunteer time by province which was extrapolated to cover
all provincial ATV and SxS recreationalists and assessed at 40% of average hourly wages and salary rates in
each province in-line with standard practices for benefit-cost analysis.
Combined investment and direct operating expenditures (Tables PE-1 and PE-2) have annual
impacts of $17.3 million to $20.8 million of which licenses and volunteer time are outside of
Statistics Canada’s analytical framework, as discussed later in the report, so that the total direct
operating and investment expenditures included in the analysis are $16.6 million in the 10%
case and $19.6 million in the 8.6% one42.
These expenditures all contributed to improved provincial economic performance. Table PE-3
contains key Prince Edward Island direct and indirect, induced, and total economic impacts.
Direct and indirect impacts arise from ATV and SxS recreational purchases in Prince Edward
42
Equal to combined expenditures less the second last line of PE-2.

92
Island. Direct and indirect economic activities occur within the province’s supply lines of goods
and services purchased by ATV and SxS recreationalists. The first three columns provide impact
data on the 10% case and the last three on the 8.6% case.
Table PE-3: Impact of ATV and SxS Recreational Activities in Prince Edward Island
($1,000s unless otherwise stated*)
Cases Low (10%) High (8.6%)
Type of Impacts Direct & Indirect
Induced Total Direct & Indirect
Induced Total
Metric
Domestic Expenditures 16,779 4,890 21,670 19,675 5,372 25,047
GDP 10,986 3,049 14,035 11,246 3,480 14,726
Labour income 6,265 1,322 7,587 6,814 1,525 8,340
Employment (# of FTEs)*
147 31 178 165 36 201
Total taxes 3,944 1,685 5,629 4,297 1,836 6,133
Taxes on products 2,109 1,212 3,321 2,445 1,325 3,771
Taxes on production 469 185 654 501 208 709
Income taxes 1,366 288 1,654 1,351 302 1,653
Source: Based on Statistics Canada I/O runs submitted and interpreted by Smith Gunther Associates Ltd.
Note: Direct and indirect impacts arise from ATV and SxS recreational purchases in Prince Edward Island. Direct
and indirect economic activities occur within Prince Edward Island supply lines of goods and services purchased by
ATV and SxS recreationalists. Given the inclusion of indirect expenditures and other statistical adjustments,
“Domestic Expenditures” are similar but not equal to the sum of direct expenditures from the first two tables.
Direct and indirect domestic expenditures occur in Prince Edward Island from Canadian riders
of ATVs and SxSs. These numbers do not cover expenditures by foreigners riding in Canada.
In the 10% case, direct and indirect domestic expenditures of $16.8 million - net of product and
production taxes and imports net of exports, but including subsidies - add $11.0 million to
direct and indirect Gross Domestic Product (GDP). GDP includes direct and indirect labour force
income of $6.3 million attracting increased employment measured as 147 full-time equivalents
(FTEs). This case generates another $2.1 million in the various direct and indirect taxes,
delineated in more detail in the last three lines of the Table.
In the 8.6% case, direct and indirect domestic expenditures of $20 million - net of product and
production taxes, and imports net of exports but including subsidies - add $11 million to direct
and indirect Gross Domestic Product (GDP). GDP is inclusive of direct and indirect labour force
income of $7 million and employment measured as 165 full-time equivalents (FTEs). This case
generates another $4 million in the various direct and indirect taxes, specified in the last three
lines.

93
Net of income taxes and usually minor savings, incremental labour force incomes facilitate
additional consumption which yields induced impacts, documented in the second and fifth
columns. Added to the direct and indirect impacts these result in the total impacts in columns
3 and 6.
Total impacts in the above table size Prince Edward Island ATV and SxS activities in the range of
domestic expenditures of $22 million to $25 million generating GDP of $14.0 million to $14.7
million including labour force incomes of $7.6 million to $8.3 million. Tax revenues as a result
of ATV and SxS expenditures yield $5.6 million to $6.1 million. Further, these activities and
related expenditures generate fuller employment by 178 to 201 FTEs.43.
43
FTEs in Prince Edward Island can be converted to jobs by multiplying its FTEs by 1.178, reflecting the seasonality of its mainstay tourism industry.

94
Nova Scotia
In 2015, Nova Scotians operated an estimated minimum of 24,949 ATVs and 11,110 SxSs. This
estimate is based on an attrition rate of 10% of the current and previous years’ stocks of ATVs
and on SxSs purchased after 2006 when they started being deployed for recreational purposes.
With a rate of attrition of 8.6%, more vehicles remain operational – ATVs (28,440) and SxSs
(16,202). The Smith Gunther survey results suggest the case based on the 8.6%, but the 10%
case is more in line with attrition rates in studies of personal watercraft and snowmobiles.
Participants in ATV and SxS recreational activities made investments in new and replacement
ATVs and SxSs annually, as well as enhanced on-highway vehicles for transporting ATVs and
SxSs and accommodations for themselves, such as trailers, larger vehicles and mobile homes
(RVs)44. During 2015, annual investments, in the economic meaning of new purchases of
equipment, in ATVs, SxSs and related enhanced vehicles reached $53 million to $54 million
shown in Table NS-1, before depreciation. Since this data reflects purchases of new ATVs and
SxSs, the numbers are not affected by rates of attrition. Investments in enhanced on-highway
vehicles are affected in that fewer or more vehicles are required to transport the newly
purchased stock as well as the stock still in operation. In the 10% case, fewer ATVs and SxSs are
still in operation therefore fewer enhanced vehicles are required and less is spent on replacing
them. The opposite is true in the 8.6% case.
Table NS-1: 2015 Nova Scotia Investments in ATVs and SxSs ($1,000s)
Items\Cases Low (10%)
High (8.6%)
ATVs 31,556 31,556
SxSs 19,808 19,808
Enhanced on-highway vehicles 1,500 2,700
Total 52,864 54,064 Sources: Smith Gunther Associates Ltd. based on annual sales data of ATVs and survey data for SxSs.
Table NS-2 breaks out and summarizes 2015 direct operating expenditures by ATV and SxS
recreationalists for both cases. Annual Nova Scotian direct operating expenditures amounted
to an additional $165 million to $126 million.
44 Recreational Vehicle (RV) is used narrowly herein to include only mobile homes and excludes ATVs, SxSs,
personal watercraft, snowmobiles, bipeds, scooters, and motorcycles.

95
Because the number of ATVs and SxSs in operation differs in the 10% and 8.6% cases and
affects each type of direct operating expenditure, the gap between Both cases’ direct operating
expenditures widens relative to the investments where only the enhancement of on-highway
vehicles associated with ATV and SxS recreation was impacted.
Table NS-2: 2015 Key Nova Scotia Direct Operating Expenditures in ATV and SxS Activities
($1,000s)
Operating Expenditures\Cases Low (10%)
High (8.6%)
Repair & maintenance 26,162 33,843
Gasoline for ATVs and SxSs 24,057 31,356
Food and beverages 17,568 22,253
Casualty & liability insurance 25,331 35,024
Accommodation excluding RV expenditures
20,314 31,496
Ground transportation 7,006 8,951
Club & trail fess 2,964 3,755
Entertainment 3,864 4,887
Other 9,994 13,881
Total included in further analysis 137,260 185,446
Licenses 3,612 4,737
Volunteer time* 24,055 35,962
Excluded from further analysis 27,667 40,699
Total 164,927 226,145 Sources: Smith Gunther Associates Ltd. based on annual sales data of ATVs and survey data for SxSs.
Note:*The survey established the amount of volunteer time by province which was extrapolated to cover
all provincial ATV and SxS recreationalists and assessed at 40% of average hourly wages and salary rates in
each province in line with standard practices for benefit-cost analysis.
Combined investment and direct operating expenditures, (Tables NS-1 and NS-2) have annual
impacts of $218 million to $280 million of which licenses and volunteer time are outside of
Statistics Canada’s analytical framework, as discussed later in the report, so that the total direct
operating and investment expenditures included in the analysis are $190 million in the 10%
case and $239 million in the 8.6% one45.
These direct expenditures all contributed to improved provincial economic performance. Table
NS-3 contains key Nova Scotia direct and indirect, induced, and total economic impacts. Direct
and indirect impacts arise from ATV and SxS recreational purchases in Nova Scotia. Direct and
45
Equal to combined expenditures less the second last line of NS-2.

96
indirect economic activities occur within the province’s supply lines of goods and services
purchased by ATV and SxS recreationalists. The first three columns provide impact data on the
10% case and the last three on the 8.6% case.
Table NS-3: Impact of ATV and SxS Recreational Activities in Nova Scotia
($1,000s unless otherwise stated*)
Cases Low (10%) High (8.6%)
Type of Impacts Direct & Indirect
Induced Total Direct & Indirect
Induced Total
Metric
Domestic Expenditures 192,203 43,387 235,590 231,924 51,363 283,287
GDP 90,482 25,360 115,842 107,247 30,306 137,553
Labour income 57,625 11,445 69,070 67,936 13,718 81,653
Employment (# of FTEs)*
1,243 242 1,484 1,490 289 1,779
Total taxes 45,069 9,877 54,946 52,304 11,433 63,737
Taxes on products 26,091 5,234 31,325 31,412 6,202 37,613
Taxes on production 4,290 1,726 6,016 5,151 2,053 7,204
Income taxes 14,688 2,917 17,605 15,742 3,179 18,920
Source: Based on Statistics Canada I/O runs submitted and interpreted by Smith Gunther Associates Ltd.
Note: Direct and indirect impacts arise from ATV and SxS recreational purchases in Nova Scotia. Direct and indirect
economic activities occur within Nova Scotia supply lines of goods and services purchased by ATV and SxS
recreationalists. Given the inclusion of indirect expenditures and other statistical adjustments, “Domestic
Expenditures” are similar but not equal to the sum of direct expenditures from the first two tables.
In the 10% case, direct and indirect domestic expenditures occur in Nova Scotia from Canadian
riders of ATVs and SxSs. These numbers do not cover expenditures by foreigners riding in
Canada. Direct and indirect domestic expenditures of $192 million - net of product and
production taxes and imports net of exports, but including subsidies - add $90.0 million to
direct and indirect Gross Domestic Product (GDP). GDP includes direct and indirect labour force
income of $58 million and increased employment measured as 1,243 full-time equivalents
(FTEs). This case generates another $45 million in the various direct and indirect taxes,
delineated in more detail in the last three lines of the Table.
In the 8.6% case, direct and indirect domestic expenditures of $232 million - net of product and
production taxes, and imports net of exports but including subsidies - add $107 million to direct
and indirect Gross Domestic Product (GDP). GDP is inclusive of direct and indirect labour force
income of $68 million and employment measured as 1,490 full-time equivalents (FTEs). This
case generates another $52 million in the various direct and indirect taxes, specified in the last
three lines.
Net of income taxes and usually minor savings, incremental labour force incomes facilitate
additional consumption which yields induced impacts, documented in the second and fifth

97
columns. Added to the direct and indirect impacts these result in the total impacts in columns
3 and 6.
Total impacts in the above table size Nova Scotia ATV and SxS activities in the range of domestic
expenditures of $236 million to $283 million generating GDP of $116 million to $138 million
including labour force incomes of $69 million to $82 million. Tax revenues as a result of ATV
and SxS expenditures yield $55 million to $64 million. Further, these activities and related
expenditures generate fuller employment by 1,484 to 1,779 FTEs46.
46
FTEs in Nova Scotia can be converted to jobs by multiplying its FTEs by 1.141.

98
Newfoundland
In 2015, Newfoundlanders operated an estimated minimum of 30,869 ATVs and 13,983 SxSs.
This estimate is based on an attrition rate of 10% of the current and previous years’ stocks of
ATVs and on SxSs purchased after 2006 when they started being deployed for recreational
purposes. With a rate of attrition of 8.6%, more vehicles remain operational – ATVs (33,878)
and SxSs (19,713). The Smith Gunther survey results suggest the case based on the 8.6%, but
the 10% case is more in line with attrition rates in studies of personal watercraft and
snowmobiles.
Participants in ATV and SxS recreational activities made investments in new and replacement
ATVs and SxSs annually, as well as enhanced on-highway vehicles for transporting ATVs and
SxSs and accommodations for themselves, such as trailers, larger vehicles and mobile homes
(RVs)47. During 2015, annual investments, in the economic meaning of new purchases of
equipment, in ATVs, SxSs and related enhanced vehicles reached $78 million to $79 million
shown in Table NL-1, before depreciation. Since this data reflects purchases of new ATVs and
SxSs, the numbers are not affected by rates of attrition. Investments in enhanced on-highway
vehicles are affected in that fewer or more vehicles are required to transport the newly
purchased stock as well as the stock still in operation. In the 10% case, fewer ATVs and SxSs are
still in operation therefore fewer enhanced vehicles are required and less is spent on replacing
them. The opposite is true in the 8.6% case.
Table NL-1: 2015 Newfoundland Investments in ATVs and SxSs ($1,000s)
Items\Cases Low (10%)
High (8.6%)
ATVs 52,761 52,761
SxSs 23,557 23,557
Enhanced on-highway vehicles 1,700 2,900
Total 78,018 79,218 Sources: Smith Gunther Associates Ltd. based on annual sales data of ATVs and survey data for SxSs.
Table NL-2 breaks out and summarizes 2015 direct operating expenditures by ATV and SxS
recreationalists for both cases. Annual Newfoundlanders direct operating expenditures
amounted to an additional $221 million to $292 million as noted.
47 Recreational Vehicle (RV) is used narrowly herein to include only mobile homes

99
Because the number of ATVs and SxSs in operation differs in the 10% and 8.6% cases and
affects each type of direct operating expenditure, the gap between both cases’ direct operating
expenditures widens relative to the investments where only the enhancement of on-highway
vehicles associated with ATV and SxS recreation was impacted.
Table NL-2: 2015 Key Newfoundland Direct Operating Expenditures in ATV and SxS Activities
($1,000s)
Operating Expenditures\Cases Low (10%)
High (8.6%)
Repair & maintenance 35,201 44,353
Gasoline for ATVs and SxSs 31,907 40,847
Food and beverages 28,027 35,007
Casualty & liability insurance 29,914 37,934
Accommodation excluding RV expenditures
22,970 34,833
Ground transportation 8,343 10,503
Club & trail fess 6,447 7,807
Entertainment 5,985 7,571
Other 13,536 18,805
Total included in further analysis 182,331 237,660
Licenses 4,210 5,304
Volunteer time* 34,202 49,174
Excluded from further analysis 38,412 54,478
Total 220,743 292,138 Sources: Smith Gunther Associates Ltd. based on annual sales data of ATVs and survey data for SxSs.
Note:*The survey established the amount of volunteer time by province which was extrapolated to cover
all provincial ATV and SxS recreationalists and assessed at 40% of average hourly wages and salary rates in
each province in line with standard practices for benefit-cost analysis.
Combined investment and direct operating expenditures (Tables NL-1 and NL-2) have annual
impacts of $299 million to $371 million of which licenses and volunteer time are outside of
Statistics Canada’s analytical framework, as discussed in the report, so that the total direct
operating and investment expenditures included in the analysis are $261 million in the 10%
case and $317 million in the 8.6% one48.
These expenditures all contributed to improved provincial economic performance. Table NL-3
contains key Newfoundland direct and indirect, induced, and total economic impacts. Direct
and indirect impacts arise from ATV and SxS recreational purchases in Newfoundland. Direct
48
Equal to combined expenditures less the second last line of NL-2.

100
and indirect economic activities occur within the province’s supply lines of goods and services
purchased by ATV and SxS recreationalists. The first three columns provide impact data on the
10% case and the last three on the 8.6% case.
Table NL-3: Impact of ATV and SxS Recreational Activities in Newfoundland
($1,000s unless otherwise stated*)
Cases Low (10%) High (8.6%)
Type of Impacts Direct & Indirect
Induced Total Direct & Indirect
Induced Total
Metric
Domestic Expenditures 262,679 44,884 307,563 309,268 55,717 364,985
GDP 110,324 22,619 132,943 138,918 28,114 167,032
Labour income 64,150 9,476 73,626 79,657 11,771 91,428
Employment (# of FTEs)*
1,151 169 1,320 1,435 210 1,645
Total taxes 55,083 9,370 64,453 64,322 11,350 75,672
Taxes on products 33,778 5,702 39,480 39,826 7,079 46,904
Taxes on production 4,257 1,150 5,407 5,252 1,428 6,680
Income taxes 17,047 2,518 19,566 19,244 2,844 22,088
Source: Based on Statistics Canada I/O runs submitted and interpreted by Smith Gunther Associates Ltd.
Note: Direct and indirect impacts arise from ATV and SxS recreational purchases in Newfoundland. Direct and
indirect economic activities occur within Newfoundland supply lines of goods and services purchased by ATV and
SxS recreationalists. Given the inclusion of indirect expenditures and other statistical adjustments, “Domestic
Expenditures” are similar but not equal to the sum of direct expenditures from the first two tables.
Direct and indirect domestic expenditures occur in Newfoundland from Canadian riders of ATVs
and SxSs. These numbers do not cover expenditures by foreigners riding in Canada.
In the 10% case, direct and indirect domestic expenditures of $263 million - net of product and
production taxes and imports net of exports, but including subsidies - add $110.0 million to
direct and indirect Gross Domestic Product (GDP). GDP includes direct and indirect labour force
income of $64 million attracting increased employment measured as 1,253 full-time
equivalents (FTEs). This case generates another $54 million in the various direct and indirect
taxes, delineated in more detail in the last three lines of the Table.
In the 8.6% case, direct and indirect domestic expenditures of $309 million - net of product and
production taxes, and imports net of exports but including subsidies - add $139 million to direct
and indirect Gross Domestic Product (GDP). GDP is inclusive of direct and indirect labour force
income of $80 million and employment measured as 1,435 full-time equivalents (FTEs). This
case generates another $64 million in the various direct and indirect taxes, specified in the last
three lines.

101
Net of income taxes and usually minor savings, incremental labour force incomes facilitate
additional consumption which yields induced impacts, documented in the second and fifth
columns. Added to the direct and indirect impacts these result in the total impacts in columns
3 and 6.
Total impacts in the above table size Newfoundland ATV and SxS activities in the range of
domestic expenditures of $308 million to $365 million generating GDP of $133 million to $167
million including labour force incomes of $74 million to $91 million. Tax revenues as a result of
ATV and SxS expenditures yield $64 million to $76 million. Further, these activities and related
expenditures generate fuller employment by 1,320 to 1,645 FTEs49.
49
FTEs in Newfoundland can be converted to jobs by multiplying its FTEs by 1.143.

102
Appendix 3: Glossary All-terrain Vehicles (ATVs), a motorized off-highway vehicle designed to travel on four low
pressure tires, having a seat designed to be straddled by the operator and handlebars for
steering control. For a full definition, see Canadian Standard for All-Terrain Vehicles at
www.cohv.ca.
Attrition Rate, the percentage rate at which a commodity goes out of service for various
reasons over a period of time.
Domestic Expenditures, spending made in Canada on ATV and SxS activities, where activities
are broadly defined to include everything from sales of ATVs and SxSs, their transportation and
upkeep as well as spending by ATV and SxS recreationalists in undertaking ATV and SxS
activities including purchases of enhanced vehicles, travelling to and from ATV and SxS events
and shows.
Exports, as used herein, are goods or services sent from one jurisdiction to another.
Full-Time Equivalents (FTE), includes full-time employment and consists of persons who usually
work 30 hours or more per week at their main or only job. Equivalence to full-time
employment occurs when combinations of part-time workers have aggregate hours on the job
that equal or exceed 30 hours. There are more jobs than FTEs because some jobs require less
than 30 hours per week of employment. (Statistics Canada, Table 282-0005 - Labour force
survey estimates (LFS), by full- and part-time students during school months, sex and age group,
unadjusted for seasonality, monthly. (Accessed: August 06, 2016).) In this case if a reader
wishes to convert FTEs to jobs, a multiple of 1.22 is appropriate.
Gross Domestic Product (GDP), represents the total value of production of goods and services in the economy resulting from the initial expenditure. It is GDP at basic prices isused in this report. GDP at basic prices is net of taxes on products but includes any subsidies on products (see Table 8).
Imports, as used herein, are goods or services entering one jurisdiction from another.
Direct and indirect impacts, occur among Canadian suppliers of goods and services purchased
by ATV and SxS recreationalists and of the inputs into them, and inputs into inputs, ad
infinitum.
Industries, are groups of firms in any jurisdiction of sufficient commonality to be treated as a
type of firm in Statistic Canada’s I/O system.
Input Output Tables (I/O), constitute a series of Statistics Canada tables that identify all goods
and services being utilized for both final consumption and for intermediate consumption where

103
intermediate consumption is utilized in producing other goods and services. As part of
identifying inputs to production, the I/O tables also identify employment and capital equipment
needed for producing goods and services.
Jobs, is a measure of employment which does not distinguish between full- and part-time
employments.
Labour force income, income accruing to workers from all sources of labour income including
wages and salaries, supplementary income and income from unincorporated businesses and
individuals, and net income of non-farm unincorporated businesses.
Multipliers, as used herein, are ratios of total impacts relative to their direct expenditure
(within the same metric).
National Income and Expenditure Accounts, a system of national accounts Statistics Canada
has designed to monitor the economic health of jurisdictions, including Canada, its provinces
and territories and smaller regions where applicable.
Net income of non-farm unincorporated businesses, consists of the earnings of working
proprietors from their own businesses. Such businesses are "unincorporated" as distinct from
the corporate form of organization. The estimates represent a mixture of labour and
investment income that cannot be segregated on anything but an arbitrary basis. To the extent
that working proprietors supply their own labour, they earn wages and salaries; to the extent
that they supply their own capital, they earn profits, interest and rents. These elements are
inextricably mixed in the estimates of the net income field. The net rental income of persons is
also included here in order to consolidate all forms of income from non-farm unincorporated
business activity in a single category. (Statistics Canada, National Income and Expenditure
Accounts Volume 3: A Guide to National Income and Expenditure Accounts, 1975, p. 131.)
Primary Industries and energy transmission, includes agriculture, fishing, mining, and
immediately supporting industries as well as electricity production and transmission.
Sectors, are of one or more industries.
Side-by-sides (SxS), motorized off-highway vehicle designed to travel on four or more tires,
intended by the manufacturer for recreational use by one or more persons and having the
following characteristics: a steering wheel for steering control; foot controls for throttle and
service brake; non-straddle seating; maximum speed capability greater than 30 MPH (48 km/h);
Gross Vehicle Weight Rating (GVWR) no greater than 1700 kg (3750 lbs); less than 2030 mm (80
in) in overall width, exclusive of accessories; engine displacement equal to or less than 1,000cc
(61cubic inch) for gasoline fueled engines; and identification by means of a 17 character PIN or
VIN. For a full definition, see Canadian Standard for All-Terrain Vehicles at www.cohv.ca.

104
Statistics Canada, is Canada’s central statistical agency tasked by the Federal government with
producing data suitable to monitor socio-economic activity in Canada aside from health.
Subsidies on either products or production, do not apply to ATVs and SxSs directly but may
apply to one or more products in supply lines to produce ATVs and/or SxSs or any item meeting
induced demands.
Supplementary Labour Income, is composed of other expenditures by employers on labour
account that can be regarded as payment for employees' services. Included here are employers'
contributions to private pension funds, the Canada and Quebec Pension Plans, employee
welfare funds, the Unemployment Insurance Fund, and Workmen's Compensation Funds.
(Statistics Canada, National Income and Expenditure Accounts Volume 3: A Guide to National
Income and Expenditure Accounts, 1975, p. 120.)
Trade, is used to refer to both interprovincial and international movement of goods and
services.
Trade deficits, occur when imports exceed exports from a given jurisdiction.
Trade surpluses, occur when exports exceed imports from a given jurisdiction.
Value shipped, is the total value of goods and service shipped from factory gates in meeting
ATV and SxS demands. As noted in the text it inherently includes multiple counting of early
stage inputs.
Wages and Salaries, including income in kind (i.e., board and lodging), are estimated on a
"gross" basis, that is, they are reckoned before tax deductions and before deduction of
contributions by employees to unemployment insurance, pensions and other social security
schemes. Bonuses, commissions, directors' fees, taxable allowances and retroactive wage
payments are included in the year in which they are paid. (Statistics Canada, National Income
and Expenditure Accounts Volume 3: A Guide to National Income and Expenditure Accounts,
1975, p. 120.)


![THE 2012 PROVINCIAL AND TERRITORIAL - MADD Canada€¦ · The 2012 Provincial and . Territorial Legislative Review [Review] ... some limitations which are discussed in the full report,](https://img.dokumen.tips/doc/110x75/5ff711a65385c801b3161e66/the-2012-provincial-and-territorial-madd-the-2012-provincial-and-territorial.jpg)