Embed Size (px)
Citation preview

CONFIDENTIAL
January 21, 2015
National Pediatric Subspecialty Physician Compensation, Production, and Benefits Survey
2015 Informational Session
Maria Hayduk, Senior ManagerAngie Collins, Manager

CONFIDENTIAL
Audience Reminders
• Submit a question by typing it into the Question and Answer pane at the right of your screen at any time.
• Provide feedback through our electronic survey following the Webinar.
10100.010\324452(pptx)-E2

CONFIDENTIAL
20100.010\324452(pptx)-E2
Angie CollinsManager
Maria HaydukSenior Manager
Our Speakers

CONFIDENTIAL
Agenda
I. IntroductionII. Survey OverviewIII. ECGVault OverviewIV. 2015 Survey Participation
Appendix A — 2014 ECG Survey MembersAppendix B — 2014 Reported SpecialtiesAppendix C — Sample CPT Code Profiler Reports
30100.010\324452(pptx)-E2

CONFIDENTIAL
I. Introduction

CONFIDENTIAL
50100.010\324452(pptx)-E2
ECG offers a broad range of strategic, financial, operational, and technology-related consulting services to healthcare providers. As a leader in the industry, ECG provides specialized expertise to community hospitals, academic medical centers, health systems, and medical groups.
Specific areas of expertise include:
• Strategy and planning.• Physician/hospital economic relations.• Organizational design and development.• Operations and performance improvement.• Academic medical center services.
• Children’s hospitals.• Healthcare IT.• Managed care contracting.• Custom surveys and proprietary
research.
ECG’s strength is built upon more than 150 healthcare professionals practicing in offices located in Boston, Dallas, San Diego, San Francisco, Seattle, St. Louis, and Washington, D.C.
For more than 40 years, we have served as trusted advisers to some of the nation’s leading healthcare providers.
We focus on developing and implementing innovative and customized solutions to meet our healthcare clients’ specific challenges, no matter how complex.
I. IntroductionECG Management Consultants

CONFIDENTIAL
60100.010\324452(pptx)-E2
I. IntroductionECG’s Custom Surveys
ECG’s custom surveys emerged from our experience working with medical groups and academic departments to redesign their compensation plans. Today,
our custom surveys are a core service and encompass a wide range of areas.
Annual Surveys• National Pediatric Subspecialty Physician Compensation,
Production, and Benefits Survey (since 2006).
• National Provider Compensation, Production, and Benefits Survey (since 2000).
• National Large Medical Group Cost Survey (since 2014).
• CPT Code Profiler.
Select Custom Surveys• National Physician Reimbursement Survey (2013, 2011).
• Children’s Hospitals Surgeon-in-Chief Survey (2011).
• Children’s Hospitals Pediatrician-in-Chief Survey (2011).
• Greater Boston Provider Benefit Survey (2012).
• Alliance of Independent Academic Medical Centers (AIAMC)Member Benchmarking Survey (2011).
• California Hospital/Physician Alignment Survey (2010).
• Emergency Department Call Coverage Survey (2010).

CONFIDENTIAL
I. IntroductionECG’s Custom Surveys (continued)
• Compensation plan redesign and market assessments for physicians and advanced practice clinicians (APCs).
• Productivity evaluation and benchmarking at both the individual provider and specialty level.
• Fair market value assessments and opinions. • Provider benefit benchmarking and design. • Market payor contracting strategies.• Recruiting and retention benchmarking.
70100.010\324452(pptx)-E2
Survey members utilize data and benchmarks from our surveys to inform them on key issues and support analyses in their organizations, including:
Our surveys provide members with access to data that is more in-depth than that of, or not available from, other industry sources.

CONFIDENTIAL
I. IntroductionSurvey Growth
With compensation and production data from 6,323 pediatric providers and organization-level data from 40 of the nation’s premier children’s organizations, the pediatric survey is
the most comprehensive source of provider performance data available in the market.
Medical subspecialists comprise over half of the providers in the pediatric data set, and hospital-based subspecialists encompass 28%, while surgical
subspecialists and advanced practice clinicians (APCs) each comprise 9%.
Survey Growth 2006 to 2014
Source: ECG 2014 pediatric survey.
2014 Providers by Specialty Type
555
2,121 1,929 2,851
3,616 3,805 4,523
6,323
-
1,000
2,000
3,000
4,000
5,000
6,000
7,000
8,000
2006 2008 2009 2010 2011 2012 2013 2014
Number of Providers
54%
9%
28%
9%
Medical Surgical Hospital-Based APC
0100.010\324452(pptx)-E2 8

CONFIDENTIAL
I. IntroductionSurvey Demographics
Even as the survey has expanded its reach to 28 states, the typical member remains one that is owned by a health system and has
affiliations with a freestanding children’s hospital and teaching hospital.
Using these demographic filters and others available on ECGVault, members can customize benchmarks across all reported metrics.
Survey Demographic Trends (Percentage of Providers) Providers by Region
Source: ECG 2014 pediatric survey.
78%70%
87%
69%79%
85%
69% 66%75%71%
47%
69%
83%
60%70%
0%
20%
40%
60%
80%
100%
Employed by HealthSystem
Affiliated WithTeaching Hospital
Affiliated WithFreestanding
Children's Hospital
2010 2011 2012 2013 2014
25%
28%15%
32%
East Midwest South West
9 States
6 States7 States
6 States
0100.010\324452(pptx)-E2 9

CONFIDENTIAL
I. IntroductionSurvey Membership
The pediatric survey has a loyal base of members from year to year with a retention rate of approximately 80%.
Pediatric Survey Members by Location
The typical organization has been a member of the pediatric survey for 4 years.
Organization Retention Rate
Red – 2014 ECG Pediatric Survey – Existing MembersBlue – 2014 ECG Pediatric Survey – New Members
Source: ECG 2014 pediatric survey.
60%
46%
74%66%
80% 75%81%
0%10%20%30%40%50%60%70%80%90%
100%
2008 2009 2010 2011 2012 2013 2014
Percentage of Organizations That Renew SurveyMembership
0100.010\324452(pptx)-E2 10
CONFIDENTIAL
1 New members are organizations that participated for the first time in 2014, as well as organizations that renewed survey membership after 1 or more years of nonparticipation.
I. IntroductionNew Members
• Children’s National Medical Center, Washington, D.C.• Children’s Specialty Group, PLLC, Norfolk, Virginia• Children’s Specialty Group/Medical College of
Wisconsin, Milwaukee, Wisconsin• Cincinnati Children’s Hospital Medical Center,
Cincinnati, Ohio• Packard Children’s Health Alliance, Menlo Park,
California• Parkside Pediatrics, Simpsonville, South Carolina• Pediatric Multi-Specialty Medical Group/Children’s
Hospital Oakland, Oakland, California
• Rockford Health Physicians, Rockford, Illinois• Scott and White Memorial Hospital, Temple, Texas• SIU Healthcare, Springfield, Illinois• University of Oklahoma College of Medicine,
Oklahoma City, Oklahoma• University of Rochester, Rochester, New York• University of Vermont Medical Group, Burlington,
Vermont• Vanderbilt University Medical Center, Nashville,
Tennessee• Weill Medical College of Cornell University, New York,
New York
The growth of the pediatric survey is fueled by new members (15 in 2014), as well as existing members that are actively growing their provider networks.
New members contributed over 2,200 providers to the 2014 pediatric survey.
New 2014 Pediatric Survey Members1
0100.010\324452(pptx)-E2 11
Source: ECG 2014 pediatric survey.

CONFIDENTIAL
I. IntroductionNational Survey Membership
In addition to the pediatric survey, ECG conducts the National Provider Compensation, Production, and Benefits Survey. Our 2014 national adult provider survey included performance data submitted by 86 organizations, encompassing 18,571 providers.
Green – 2014 ECG National SurveyRed – 2014 ECG Pediatric Survey – Existing MembersBlue – 2014 ECG Pediatric Survey – New Members
Survey Members by Location
APPENDIX A contains a comprehensive list of 2014 survey members. Source: ECG 2014 surveys.
0100.010\324452(pptx)-E2 12

CONFIDENTIAL
I. IntroductionSpecialty Representation
Benchmarks are available for 52 pediatric specialties, including 30 medical, 11 surgical, and 11 hospital-based specialties, as well as 3 APC provider types.
ECG does not limit the specialties for which data is collected; however, benchmarks are calculated only for those where a minimum of five organizations have submitted data.
Select Specialties Submitted byMembers in 2014
Number of Physicians inSelect Specialties
Source: ECG 2014 pediatric survey.
189153 159
271
437
307
179136
114134
0
50
100
150
200
250
300
350
400
450
500
0100.010\324452(pptx)-E2 13

CONFIDENTIAL
II. Survey Overview

CONFIDENTIAL
II. Survey OverviewECG’s Survey Methodology
15
Our survey methodology emphasizes data consistency and quality.
0100.010\324452(pptx)-E2
DesignMarketing Production Reporting
• CPT code database.• Compensation and production
database.• Recruiting and benefits
database.• Member demographics.
Survey ReportsSurvey Reports
Data Collection/Validation
Data Calculation
DataAnalysis
to Information
Technical AnalysisRecommendations
Policy DirectionFeedback
ECG
Survey Members
• Provide electronic tools.
• Assist with data collection.
• Review data for compliance with survey standards.
• Standardize survey data.
• Calculate standard RVU data.
• Calculate normalized data.
• Final Report.
• Organization Statistics Module.
Phase IIPhase IIPhase IPhase I Phase IVPhase IV
• Hospitals and health systems.
• Independent medical groups.
• Children’s hospitals.
• Schools of medicine.
PediatricSurvey
MembershipECGVaultSurvey
Databases
Phase IIIPhase III
• Develop final data set.
• Produce benchmarks by specialty. • Online data portal
for members.
• Allows for benchmarking and reporting.
Verify Data With
Members
Data “Scrub”

CONFIDENTIAL
Schedules A–E are completed via our secure online proprietary survey tool. Schedule F is completed using Microsoft Excel.
II. Survey OverviewScope of the Survey
160100.010\324452(pptx)-E2
Contact Information — Includes authorized contacts.
ECG’s survey is a comprehensive study of provider performance and captures data in six schedules, which include participant demographics, as well as compensation,
benefits, productivity, recruitment, and other critical operating statistics.
Organization Profile — Includes organization-level demographics, revenue/expense data, contracting and reimbursement data, IT systems overview, etc.
Recruiting and Benefits — Includes data on recruiting packages/benefits, starting salaries, recruiting efforts, and cost/type of provider benefits (e.g., medical, retirement, paid time off [PTO], CME).
Compensation/Incentive Plans — Includes data on physician and APC compensation plan structure, performance indicators (production- and nonproduction-based), quality incentives, and executive compensation.
Operations — Includes data on part-time physicians, hospital-based physicians (hospitalists and emergency medicine), APCs, and patient access.
Provider Data — Includes provider-level data (physicians and APCs), such as FTEs, compensation, gross and net revenue, CPT code counts by CPT code, benefits, clinical weeks worked, scheduled office hours, and malpractice.
Schedule ASchedule A
Schedule BSchedule B
Schedule DSchedule D
Schedule CSchedule C
Schedule ESchedule E
Schedule FSchedule F

CONFIDENTIAL
II. Survey OverviewReported Metrics and Key Statistics
ECGVault provides access to the comprehensive collection of metrics available in the survey, either via the Organization Statistics Module or Dynamic Reports.
• Clinical and total compensation normalized for full-time effort (base/guaranteed, quality, and call coverage compensation are also available).
• Nonproduction compensation per clinical FTE, including quality and patient satisfaction earnings.
• Total gross and gross professional revenue per clinical FTE.• Net collections and net professional collections per clinical
FTE.• Work RVUs and total RVUs per clinical FTE.• Compensation as a percentage of production (gross, gross
professional, net, and net professional revenue).• Compensation per work RVU and total RVU.• Gross professional revenue per total RVU.• Net collections and net professional collections per total RVU
(and work RVU).• Panel size per clinical FTE (primary care).• Benefit cost per provider and as a percentage of total
compensation. • Retirement cost per provider and as a percentage of total
compensation.• Scheduled office-based hours per week.
• Compensation plan structure by provider type (primary care physicians, surgical specialists, APCs, etc.).
• Performance indicators in compensation plans by provider type.• Quality incentives in compensation plans by provider type.• Physician recruiting offerings, including length of service
requirements and value of benefit.• Starting salary offers and signing bonuses by specialty.• Top-recruited specialties and range of difficulty in filling open
positions.• Cost and benefit levels for health insurance, life insurance,
disability insurance, and retirement plans.• PTO benefits and CME allowances.• Malpractice expense by specialty.• Appointment wait times by specialty.• APC utilization and recruitment data.• Contracting and reimbursement data, including information on
ACOs and other payment models.• Key data for part-time physicians, hospitalists, and emergency
medicine physicians.
170100.010\324452(pptx)-E2
Select Compensation, Production, and Benefit Metrics by Specialty
Select Compensation, Production, and Benefit Metrics by Specialty
Select Compensation Plan, Recruitment, andOther Key Information/Statistics
Select Compensation Plan, Recruitment, andOther Key Information/Statistics

CONFIDENTIAL
II. Survey OverviewExclusive Member Benefits
180100.010\324452(pptx)-E2
As a member of ECG’s survey, organizations have exclusive access to:
www.ecgmc.com/custom-surveys-proprietary
• ECGVault — This data portal contains current and historical ECG physician and APC performance benchmarks at the market, organization, and provider level.
• Final Report — This document summarizes key year-over-year market trends for all components of the survey.
• Members-Only Webinar — Hosted in the fall, this Webinar focuses on key compensation, production, recruiting, and benefit trends of the 2015 survey.
• ECG’s Survey Team — Through the survey process, we cultivate a relationship with each of our members. By taking the time to interact with our members, weensure that we understand your organization and data, which translates into the most accurate and reliable benchmarks available in the industry.
ECG’s approach, methodology, and value-added deliverables set us apart from other industry surveys.

CONFIDENTIAL
III. ECGVault Overview

CONFIDENTIAL
200100.010\324452(pptx)-E2
• ECGVault is a business intelligence tool thatsupports a variety of provider performance analyses and assessments in your organization.
– Online and secure.– Members only.– Current and historical data (back to 2000).
• Survey members’ data is already loaded into the database and reports.
• Data includes provider-level compensation and production data, as well as organization-level statistics and information.
• Reporting options allow for significant customization by members.
III. ECGVault OverviewBackground
ECGVault provides survey members with the power to analyze current and historical physician and APC performance benchmarks at the
market, organization, and provider levels.
Survey members receive a confidential login and password specific to their organization.

CONFIDENTIAL
III. ECGVault OverviewYour Business Intelligence Center
• Dynamic Reports — These reports allow for robust, specialty-specific trending and analysis capabilities, as well as standard and custom reporting, downloading of benchmarks, and access to related materials.
• Static Reports — These reports include the benchmark tables for physicians and APCs in Adobe PDF format, as well as the Final Report. The benchmark tables provide averages and quartiles by specialty for each of the compensation and production metrics in ECG’s surveys.
• Organization Statistics Module — In addition to the organization data provided in ECG’s Final Report, comprehensive market data is available via our Organization Statistics Module.
210100.010\324452(pptx)-E2
ECGVault contains three primary types of reporting options:
ECGVault now includes the CPT Code Profiler, an additional product that members can subscribe to.

CONFIDENTIAL
Within Dynamic Reports, there are currently 10 reporting options that allow survey members to access current-year and historical physician and APC performance benchmarks for the organization and the market.
III. ECGVault OverviewDynamic Reports
• Benchmark Tables.• Custom Recruiting Tool.• Metric Scattergram – new.• Tabular Reports.• Trending by Organization.• Trending by Provider.• Benchmarking by Organization.• Benchmarking by Provider.• Comparison Charts by Organization.• Comparison Charts by Provider.
220100.010\324452(pptx)-E2
www.ecgmc.com/custom-surveys-proprietary

CONFIDENTIAL
III. ECGVault OverviewCPT Code Profiler
• Practice Profile Reports — Identify variances in individual physicians’ CPT code profiles compared to providers within the medical group and the market. Key metrics include:
– Work RVU and total RVU productivity.– Distribution of work RVUs among CPT code categories (i.e., E&M, medicine, ancillary, and
surgery) and subcategories.• Top CPT Code Reports — Indicate the top CPT codes by volume and RVUs at the specialty
and provider levels (both individually and as a group), as well as for the market. The CPT code reports include procedure code rankings for market variance comparisons. These reports may be run for the top 25 codes, top 50 codes, or all codes.
• CPT Code Distribution Reports — Include reports for office visits (new patients, established patients, and consultations), inpatient visits (initial hospital care, subsequent care, discharges, and consultations), and emergency department visits.
230100.010\324452(pptx)-E2
Survey members may elect to subscribe to the CPT Code Profiler, which is built from CPT code data collected in our annual provider surveys.
The CPT Code Profiler is available to compensation survey members at a discounted annual subscription fee of $5,000. A stand-alone subscription to the
CPT Code Profiler is $10,000. Sample reports are shown in APPENDIX C.

CONFIDENTIAL
IV. 2015 Survey Participation

CONFIDENTIAL
IV. 2015 Survey ParticipationSurvey Timeline
250100.010\324452(pptx)-E2
ECG’s 2015 survey will launch at the end of January, and access to the data and online reporting capabilities will be available via ECGVault in July.
MarchMarch AprilApril JuneJune OctoberOctober
The Final Report will be distributed and member meetings will be conducted in early October.
FebruaryFebruary SeptemberSeptemberAugustAugustJulyJulyMayMay
Register Participants
and Distribute Survey
Materials
Survey Launch
March 13 –Submission
Deadline
ECG Conducts Data Validation With Each
Organization Throughout April and May
Data Scrubbed for
Outliers in June
Members Gain Access to ECGVault
in July
Final Reports Are Issued and Member Meetings Conducted
in October
JanuaryJanuary
Key Market Trends Are
Summarized in August
2015 Survey Timeline2015 Survey Timeline

CONFIDENTIAL
IV. 2015 Survey ParticipationMembership Fee — Waived for New Members
• The annual membership fee is all-inclusive and covers the cost of performing the survey.
• There is no additional cost to obtain/access the compensation and production survey reports available via ECGVault.
• There is no additional fee to participate in the member meeting.• In our experience with conducting surveys, not distributing/selling the results to
provider organizations that do not participate increases the participation rate.– Allows for more robust sample sizes.– Creates more client investment in the data that is submitted.– Enhances the quality of survey data.
260100.010\324452(pptx)-E2
Membership in ECG’s survey is $5,000 per year. This fee is waived in 2015 for any new organization that chooses to participate.
Data and reports are only available to participating organizations. We do not give, or sell, the survey results to provider organizations that do not participate.

CONFIDENTIAL
IV. 2015 Survey Participation Next Steps
• Register your organization for ECG’s 2015 National Pediatric Subspecialty Physician Compensation, Production, and Benefits Survey.– Online registration is currently open at www.ecgmc.com/2015-survey-
registration. – Additional survey information is available at www.ecgmc.com/custom-surveys-
proprietary. • 2015 survey materials will be distributed at the end of January. Upon registration,
organizations will receive a link via email to access the secure online survey instrument.
• Completed survey materials/data are due by March 13. – Organizations submit data via ECG’s secure online survey instrument. – Other submission methods are permitted after discussion with ECG.
• We work with each organization during the submission process and are available to answer any questions that may arise as you complete the survey.
270100.010\324452(pptx)-E2
If you need further information, please contact Angie at 314-726-2323 or via email at [email protected].
CONFIDENTIAL
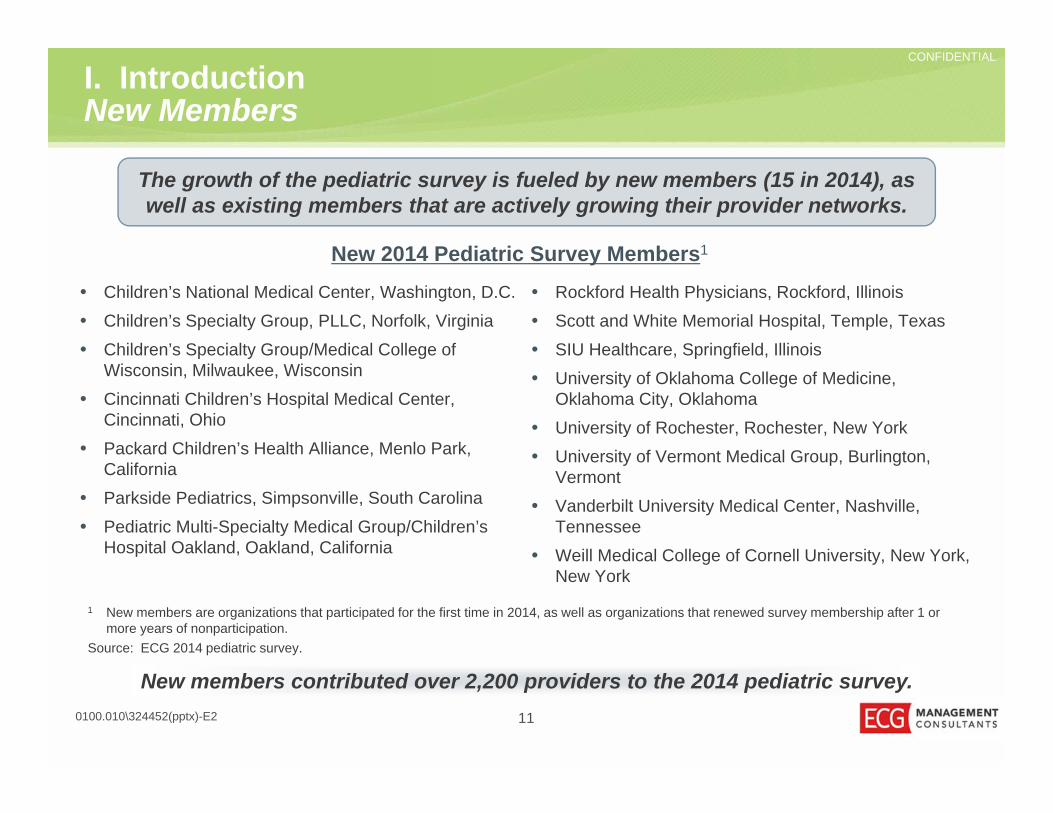
IV. Survey Participation2015 Survey Commitment Form
Name and Location of Organization
Please sign and return this form to ECG to confirm your 2015 membership in the ECG National Pediatric Subspecialty Physician Compensation, Production, and Benefits Survey.
Acknowledged and Accepted By Date
Title Email Address
Phone
Commencement Date: January 2015Data Submission: March 13, 2015Cost of Membership: $5,000
280100.010\324450(pptx)-E2
Please complete this form and email it to [email protected] or fax it to 314-726-2353.
Registration is also available online via www.ECGVault.com.

CONFIDENTIAL
IV. Survey ParticipationCPT Code Profiler Form
Name and Location of Organization
Please sign and return this form to ECG to confirm your membership in the ECG CPT Code Profiler.
Acknowledged and Accepted By Date
Title Email Address
Phone
Please complete this form and email it to [email protected] or fax it to 314-726-2353.
Registration is also available online via www.ECGVault.com.
Commencement Date: ImmediateCost of Membership: $5,000
290100.010\324450(pptx)-E2

CONFIDENTIAL
300100.010\324452(pptx)-E2
To submit a question for Maria or Angie, type it into the Question and Answer pane at the right of your screen at any time.

CONFIDENTIAL
Appendix A2014 ECG Survey Members
CONFIDENTIAL
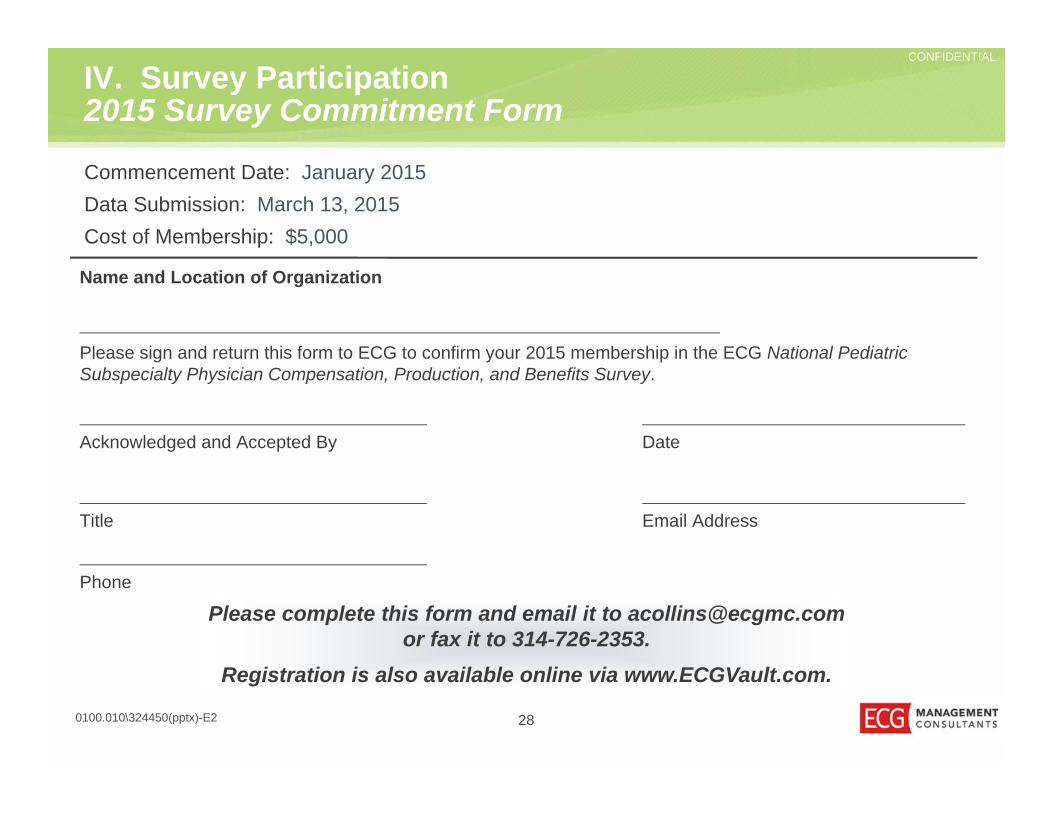
Appendix A2014 Survey Members
320100.010\324452(pptx)-E2
Organization LocationNational Provider Compensation, Production, and Benefits SurveyAdventist Health Medical Group Portland, Oregon
Advocate Medical Group Des Plaines, Illinois
Baptist Health Montgomery, Alabama
Baylor College of Medicine Houston, Texas
Borgess Medical Group Kalamazoo, Michigan
Care New England Health System Providence, Rhode Island
Carilion Clinic Roanoke, Virginia
Carle Foundation Urbana, Illinois
Colorado Permanente Medical Group Denver, Colorado
Dreyer Medical Clinic Inc. Aurora, Illinois
Dupage Medical Group Downers Grove, Illinois
East Jefferson General Hospital Metairie, Louisiana
Edward Hospital & Health Services Naperville, Illinois
Evergreen Health Medical Center Kirkland, Washington
Franciscan Medical Group Tacoma, Washington
Grand Lake Physician Practices St. Marys, Ohio
Group Health Permanente Seattle, Washington
Legacy Health Portland, Oregon
Little Company of Mary Evergreen, Illinois
A-1

CONFIDENTIAL
Appendix A2014 Survey Members (continued)
330100.010\324452(pptx)-E2 A-2
Organization LocationMaine Medical Center/Maine Medical Partners Scarborough, Maine
Medical College of Wisconsin Milwaukee, Wisconsin
MedStar Health Columbia, Maryland
Meritus Health/Meritus Enterprises Hagerstown, Maryland
Ministry Health Care Milwaukee, Wisconsin
MultiCare Health System Tacoma, Washington
Northern Arizona Healthcare/Verde Valley Medical Center Flagstaff, Arizona
Northwest Hospital & Medical Center Seattle, Washington
Northwest Permanente Portland, Oregon
Oncology Hematology Care Cincinnati, Ohio
Overlake Medical Clinics, LLC Bellevue, Washington
Pacific Medical Centers Seattle, Washington
Palo Alto Medical Foundation Mountain View, California
PeaceHealth Medical Group Vancouver, Washington
PIH Health Whittier, California
Proliance Surgeons, Inc. Seattle, Washington
Providence Medical Group — Oregon Portland, Oregon
Providence Medical Group — Spokane Spokane, Washington
Salem Health Salem, Oregon
Scott & White Memorial Hospital Temple, Texas

CONFIDENTIAL
Appendix A2014 Survey Members (continued)
340100.010\324452(pptx)-E2 A-3
Organization LocationScripps Clinic La Jolla, California
Scripps Coastal Medical Group San Diego, California
SIU HealthCare Springfield, Illinois
Spectrum Health Medical Group Grand Rapids, Michigan
Springfield Clinic Springfield, Illinois
St. Luke’s Hospital Chesterfield, Missouri
Straub Clinic & Hospital Honolulu, Hawaii
Sutter Pacific Medical Foundation Santa Rosa, California
SwedishAmerican Medical Group Rockford, Illinois
The Everett Clinic Everett, Washington
The Iowa Clinic West Des Moines, Iowa
University of Oklahoma College of Medicine Oklahoma City, Oklahoma
University of Rochester Rochester, New York
University of Vermont Medical Group Burlington, Vermont
University of Wisconsin Medical Foundation Middleton, Wisconsin
UW Physician Network Seattle, Washington
Valley Medical Center Renton, Washington
Vanderbilt University Medical Center Nashville, Tennessee
Virginia Mason Medical Center Seattle, Washington
Wake Forest Baptist Health Winston-Salem, North Carolina

CONFIDENTIAL
Appendix A2014 Survey Members (continued)
350100.010\324452(pptx)-E2 A-4
Organization LocationWarren Clinic Tulsa, Oklahoma
West Tennessee Healthcare Jackson, Tennessee
National Pediatric Subspecialty Physician Compensation, Production, and Benefits SurveyAkron Children’s Hospital Akron, Ohio
All Children’s Specialty Physicians St. Petersburg, Florida
Children’s Healthcare of Atlanta Atlanta, Georgia
Children’s Hospitals and Clinics of Minnesota Minneapolis, Minnesota
Children’s Hospital Los Angeles Medical Group Los Angeles, California
Children’s Medical Group, Inc., and Children’s Surgical Specialty Group Inc. Norfolk, Virginia
Children’s National Medical Center Washington, D.C.
Children’s Specialty Group/Medical College of Wisconsin Milwaukee, Wisconsin
Children’s Specialty Group, PLLC Norfolk, Virginia
Children’s University Medical Group Seattle, Washington
CHOC Children’s Specialists Orange, California
Cincinnati Children’s Hospital Medical Center Cincinnati, Ohio
Connecticut Children’s Specialty Group, Inc. Hartford, Connecticut
Cook Children’s Medical Center Fort Worth, Texas
Gillette Children’s Specialty Healthcare St. Paul, Minnesota
Helen DeVos Children’s Hospital Grand Rapids, Michigan
Legacy Health Portland, Oregon

CONFIDENTIAL
Appendix A2014 Survey Members (continued)
360100.010\324452(pptx)-E2 A-5
Organization LocationMaimonides Infants and Children’s Hospital of Brooklyn Brooklyn, New York
Maine Medical Partners Scarborough, Maine
MedStar Health Columbia, Maryland
Miami Children’s Hospital Miami, Florida
MultiCare Health System Tacoma, Washington
Packard Children’s Health Alliance Menlo Park, California
Parkside Pediatrics Simpsonville, South Carolina
Pediatric Multispecialty Medical Group/UCSF Benioff Children’s Hospital of Oakland Oakland, California
Peyton Manning Children’s Hospital at St. Vincent Indianapolis, Indiana
Phoenix Children’s Hospital Phoenix, Arizona
Providence Medical Group Spokane, Washington
Rady Children’s Specialists of San Diego — A Medical Foundation San Diego, California
Rockford Health Physicians Rockford, Illinois
Scott & White Memorial Hospital Temple, Texas
SIU HealthCare Springfield, Illinois
Specialty Medical Group Central California Madera, California
University of Oklahoma College of Medicine Oklahoma City, Oklahoma
University of Rochester Rochester, New York
University of Vermont Medical Group Burlington, Vermont
Vanderbilt University Medical Center Nashville, Tennessee

CONFIDENTIAL
Appendix A2014 Survey Members (continued)
370100.010\324452(pptx)-E2 A-6
Organization LocationWake Forest Baptist Health Winston-Salem, North Carolina
Warren Clinic/Saint Francis Health System Tulsa, Oklahoma
Weill Medical College of Cornell University New York, New York
CONFIDENTIAL
Appendix B2014 Reported Specialties

CONFIDENTIAL
NOTE: We require data from at least five organizations in order to report specialty-specific benchmarks.
Appendix B — 2014 Reported SpecialtiesPhysician Specialties
Benchmarks were reported for 80 physician specialties and 10 APC provider types in the 2014 National Provider survey.
0100.010\324452(pptx)-E2 B-1
Allergy/Immunology Hematology/Oncology Perinatology Surgery — NeurologicalAnesthesia — Pain Management Hospice and Palliative Medicine Physical Medicine & Rehabilitation Surgery — OncologyAnesthesiology Infectious Disease Podiatry Surgery — OrthopedicCardiology — Electrophysiology Internal Medicine Podiatry — Surgical Surgery — Orthopedic (Foot & Ankle)Cardiology — Interventional Internal Medicine — Hospitalist Psychiatry Surgery — Orthopedic (Hand)Cardiology — Invasive (Noninterventional)
Internal Medicine — Hospitalist (Nocturnist)
Pulmonary Medicine Surgery — Orthopedic (Joint Replacement)
Cardiology — Noninvasive Neonatology Pulmonary Medicine — Critical Care Surgery — Orthopedic (Spine)Critical Care/Intensivist Nephrology Radiation Oncology Surgery — Orthopedic (Sports Medicine)Dermatology Neurology Radiology — Invasive Surgery — Orthopedic (Trauma)Dermatology — Mohs Surgery Obstetrics/Gynecology Radiology — Noninvasive Surgery — PlasticDermatopathology Occupational Medicine Radiology — Nuclear Medicine Surgery — ThoracicEmergency Medicine Ophthalmology Reproductive Endocrinology Surgery — TransplantEndocrinology/Metabolism Ophthalmology — Cataract &
RefractiveRheumatology Surgery — Trauma
Epileptologist Ophthalmology — Retina Surgery Sleep Medicine Surgery — VascularFamily Practice With OB Orthopedic — Nonsurgical Sports Medicine Urgent CareFamily Practice Without OB Otorhinolaryngology Surgery — Bariatric UroGynecologyGastroenterology Pain Management Surgery — Breast UrologyGenetics Pathology Surgery — CardiothoracicGeriatrics Pathology — Anatomical Only Surgery — CardiovascularGynecology — Oncology Pathology — Clinical Only Surgery — Colon & RectalGynecology Only Pediatrics — General Surgery — General

CONFIDENTIAL
Appendix B — 2014 Reported SpecialtiesAPC Provider Types
0100.010\324452(pptx)-E2 B-2
APC Provider TypesAudiologistCertified Nurse MidwifeCertified Registered Nurse AnesthetistLicensed Clinical Social WorkerNeuropsychologist (Ph.D.)Nurse PractitionerOptometristPhysician Assistant — NonsurgicalPhysician Assistant — SurgicalPsychologist (Ph.D.)

CONFIDENTIAL
Appendix B — 2014 Reported SpecialtiesNational Pediatric Subspecialties
ECG’s 2014 National Pediatric Subspecialty survey reported benchmarks in 52 pediatric physician subspecialties and three pediatric APC provider types.
NOTE: We require data from at least five organizations in order to report specialty-specific benchmarks.
Pediatric Physician SubspecialtiesAdolescent Medicine General Pediatrics Radiology — NeuroradiologyAllergy/Immunology Genetics Radiology — NoninvasiveAnesthesiology Hematology/Oncology Rehabilitation MedicineAnesthesiology — Pain Management Hospitalist RheumatologyBone Marrow Transplant Infectious Disease Sleep MedicineCardiac Critical Care/Intensivist Internal Medicine — Pediatrics Sports MedicineCardiology — Electrophysiology Neonatology Surgery — CardiothoracicCardiology — Interventional Nephrology Surgery — GeneralCardiology — Invasive(Noninterventional) Neurodevelopmental Disabilities Surgery — Neurological
Cardiology — Noninvasive Neurology Surgery — OrthopedicChild Abuse Ophthalmology Surgery — Orthopedic (Hand)Critical Care/Intensivist Otorhinolaryngology Surgery — Orthopedic (Spine)Dermatology Pain and Palliative Care Surgery — Orthopedic (Sports MedicineDevelopmental-Behavioral Medicine Pathology Surgery — PlasticEmergency Medicine Perinatology Urgent CareEndocrinology Psychiatry UrologyEpileptology Pulmonary MedicineGastroenterology Radiology — Invasive
0100.010\324452(pptx)-E2 B-3

CONFIDENTIAL
Appendix CSample CPT Code Profiler Reports

CONFIDENTIAL
Appendix C — Sample CPT Code Profiler ReportsReport Criteria
430100.010\324452(pptx)-E2
CPT reports can be customized using various report criteria to further enhance your analysis.
• Organization Size — Pulls data for providers that practice within groups of various size.• Ownership — Selects only those providers that practice within integrated health systems, independent medical
groups, or all providers.• Region — Limits data to providers that are practicing within a specific region(s).
• Quartile — Pulls the CPT activity of only those providers above the median or above the 75th percentile for WRVUs.
• Experience — Selects data for providers that are new, established, or for all providers.
• Clinical FTE — Selects only those providers within a specific clinical FTE range.
• Inpatient/Outpatient Responsibilities — Isolates the CPT activity of providers working in the inpatient, outpatient, or both environments.
• Medical Home — Selects only those providers that are participating in a medical home.
• State — Limits data to providers that are practicing within a specific state(s).
• Payor — Pulls the CPT data for codes billed to Medicare or non-Medicare payors.
• Procedure Category — Isolates the CPT activity by E&M, ancillary, medicine, and surgery.
• Procedure Subcategory — Isolates the CPT activity for 42 subcategories focused largely on body systems.
• Grouped CPT Codes — Isolates the CPT activity for specified ranges of codes.
• Place of Service — Isolates the CPT activity for one or more places of service (e.g., physician office).
Organization-Level Report CriteriaOrganization-Level Report Criteria
Provider-Level Report CriteriaProvider-Level Report Criteria
C-1

CONFIDENTIAL
Appendix C — Sample CPT Code Profiler ReportsPractice Profile Report
0
500
1,000
1,500
2,000
2,500
Ancillary E&M Medicine Surgery
Aver
age
Ann
ual
Cou
nt o
f Pro
cedu
res
Per P
rovi
der
MarketMy Org
440100.010\324452(pptx)-E2
Key metrics include a summary of procedure counts and RVUs, as well as the distribution of WRVUs among CPT code categories and subcategories.
Average Annual Count of Procedures Per Provider
Bundled Codes Market My Org
N 57 7
Ancillary 35 1
E&M 2,411 2,029
Medicine 1,376 883
Surgery 61 30
Productivity Data
Data Set Market My Org
N 57 7
RVU Work 4,343 4,028
RVU Total 8,797 8,047
Procedure Data
C-2

CONFIDENTIAL
Appendix C — Sample CPT Code Profiler ReportsPractice Profile Report (continued)
450100.010\324452(pptx)-E2
The overall distribution of WRVUs and additional detail for the distribution of CPT codes by procedure subcategory are useful for identifying practice variances of providers to the market.
88.71%
8.55%
0.00%
2.74%
Performed Activity Distribution by WRVU – Market
E&M Medicine Ancillary Surgery
89.89%
8.16%
0.01%
1.94%
Performed Activity Distribution by WRVU – My Org
E&M Medicine Ancillary Surgery
50.67%
46.96% 2.37%
E&M Activity Distribution by WRVU – Market
Hospital Inpatient Physician Office/Outpatient Other
32.01%
67.90%
0.09%
E&M Activity Distribution by WRVU – My Org
Hospital Inpatient Physician Office/Outpatient Other
C-3

CONFIDENTIAL
Appendix C — Sample CPT Code Profiler ReportsTop CPT Code Report
460100.010\324452(pptx)-E2
Top CPT code reports include rankings of codes to facilitate analysis of variances to the market.
Market – N: 57 Providers My Organization N: 7 Providers
RankCPT Code CPT Description
Average Count Per Provider WRVU
Rank (My Org) Rank
CPT Code CPT Description
Average Count Per Provider WRVU
Rank (Market)
Average Count Per Provider
Variance With Market
Average Count Per Provider % Variance With
Market1 99233 Subsequent hospital care 535.5 2.00 14 1 99214 Office/outpatient visit est 639.4 1.50 2 178 39%2 99214 Office/outpatient visit est 461.0 1.50 1 2 94010 Breathing capacity test 583.6 0.17 10 513 726%3 99232 Subsequent hospital care 358.4 1.39 3 3 99232 Subsequent hospital care 337.9 1.39 3 -21 -6%4 95004 Percut allergy skin tests 317.4 0.01 - 4 99215 Office/outpatient visit est 220.3 2.11 5 -11 -5%5 99215 Office/outpatient visit est 231.8 2.11 4 5 99244 Office consultation 156.2 3.02 9 70 80%6 99213 Office/outpatient visit est 226.0 0.97 6 6 99213 Office/outpatient visit est 128.0 0.97 6 -98 -43%7 9401026 Breathing capacity test 145.7 0.17 - 7 99231 Subsequent hospital care 115.1 0.76 17 73 175%8 9406026 Evaluation of wheezing 129.3 0.26 - 8 99245 Office consultation 100.4 3.77 15 56 124%9 99244 Office consultation 86.7 3.02 5 9 94060 Evaluation of wheezing 79.3 0.26 18 40 100%
10 94010 Breathing capacity test 70.6 0.17 2 10 99238 Hospital discharge day 63.0 1.28 26 38 155%11 9581026 Polysomnography 4 or more 70.5 2.50 - 11 95810 Polysomnography 4 or more 58.8 2.50 109 58 5,172%12 94760 Measure blood oxygen level 66.9 0.00 31 12 94726 Pulm funct tst plethysmograp 55.8 0.26 89 54 2,777%13 9437526 Respiratory flow volume loop 52.3 0.31 - 13 99222 Initial hospital care 40.4 2.61 38 23 135%14 99204 Office/outpatient visit new 45.1 2.43 25 14 99233 Subsequent hospital care 29.2 2.00 1 -506 -95%15 99245 Office consultation 44.9 3.77 8 15 99254 Inpatient consultation 29.0 3.29 20 -6 -17%16 94375 Respiratory flow volume loop 44.8 0.31 56 16 99243 Office consultation 28.5 1.88 31 6 29%17 99231 Subsequent hospital care 41.9 0.76 7 17 94620 Pulmonary stress test/simple 27.0 0.64 155 27 5,610%18 94060 Evaluation of wheezing 39.6 0.26 9 18 94770 Exhaled carbon dioxide test 22.2 0.15 48 12 108%19 99255 Inpatient consultation 37.1 4.00 34 19 99253 Inpatient consultation 19.7 2.27 30 -3 -11%20 99254 Inpatient consultation 35.0 3.29 15 20 99219 Initial observation care 18.9 2.60 70 15 440%21 94003 Vent mgmt inpat subq day 33.8 1.37 - 21 99217 Observation care discharge 15.2 1.28 68 12 314%22 94760 59 Measure blood oxygen level 33.4 0.00 - 22 94729 C0 diffuse capacity 15.0 0.17 91 13 783%23 9472626 Pulm funct tst plethysmograp 32.4 0.26 - 23 99223 Initial hospital care 12.4 3.86 24 -19 -61%24 99223 Initial hospital care 31.9 3.86 23 24 31624 Dx bronchoscope/lavage 12.2 2.88 25 -14 -53%25 31624 Dx bronchoscope/lavage 26.0 2.88 24 25 99204 Office/outpatient visit new 11.5 2.43 14 -34 -74%
Average Weighted Work RVU Top 25 1.36 Average Weighted Work RVU Top 25 1.38Average Weighted Work RVU Total 1.30 Average Weighted Work RVU Total 1.39Total Top 25 3,198 Total Top 25 2,819Total All CPT Codes 3,857 Total All CPT Codes 2,943
C-4

CONFIDENTIAL
Survey members who subscribe to the CPT Code Profiler are able to see the distribution reports by provider in addition to the market comparison.
Appendix C — Sample CPT Code Profiler ReportsCPT Code Distribution Report
0%
20%
40%
60%
80%
99211 99212 99213 99214 99215
My Organization Market
470100.010\324452(pptx)-E2
Distribution reports also allow for the isolation of E&M frequency for Medicare and non-Medicare patient activity,
place of service, and provider and organization demographics.
Data Set N 99211 99212 99213 99214 99215Market 57 1% 3% 24% 48% 24%My Organization 7 0% 0% 13% 64% 22%
CPT Code Distribution – Average Per Provider by Percentage
C-5