Embed Size (px)
Citation preview

8/13/2019 National Meteorological Library and Archive Fact sheet 4 — Climate of the British Isles
http://slidepdf.com/reader/full/national-meteorological-library-and-archive-fact-sheet-4-climate-of-the 1/22
National Meteorological Library and Archive
Fact sheet 4 — Climate of the British Isles(version 01)
Climate

8/13/2019 National Meteorological Library and Archive Fact sheet 4 — Climate of the British Isles
http://slidepdf.com/reader/full/national-meteorological-library-and-archive-fact-sheet-4-climate-of-the 2/22
The National Meteorological Library and Archive
Many people have an interest in the weather and the processes that cause it, which is why the NationalMeteorological Library and Archive are open to everyone.
Holding one of the most comprehensive collections on meteorology anywhere in the world, theLibrary and Archive are vital for the maintenance of the public memory of the weather, the storage ofmeteorological records and as aid of learning.
The Library and Archive collections include:
• around 300,000 books, charts, atlases, journals, articles, microfiche and scientific papers onmeteorology and climatology, for a variety of knowledge levels
• audio-visual material including digitised images, slides, photographs, videos and DVDs
• daily weather reports for the UK from 1861 to the present, and from around the world
• marine weather log books
• a number of the earliest weather diaries dating back to the late 18th century
•
artefacts, records and charts of historical interest; for example, a chart detailing the weather conditionsfor the D-Day Landings, the weather records of Scott’s Antarctic expedition from 1911
• rare books, including a 16th century edition of Aristotle’s Meteorologica, held on behalf of theRoyal Meteorological Society
• a display of meteorological equipment and artefacts
For more information about the Library and Archive please see our website at:
www.metoffice.gov.uk/learning/library

8/13/2019 National Meteorological Library and Archive Fact sheet 4 — Climate of the British Isles
http://slidepdf.com/reader/full/national-meteorological-library-and-archive-fact-sheet-4-climate-of-the 3/22
Causes of the weather in the UK
The UK lies in the latitude of predominately westerly winds where depressions and their associated fronts(bands of cloud and rain) move eastwards or north-eastwards across the North Atlantic, bringing withthem unsettled and windy weather — particularly in winter.
Between the depressions there are often small mobile anticyclones that bring a welcome period offair weather. It is the sequence of depressions and anticyclones that is responsible for our notoriously
changeable weather.The airstreams associated with the depressions often originate in very cold or very warm regions, but bythe time the airstreams reach the UK, their extreme temperatures have been modified by the seas overwhich they have travelled.
Consequently, summers in the UK are usually cooler than those on the continent, but the winters aremuch often milder.
Figure 1. Radar imagery showing a vigorous depression situated to the south of the UK.
Sometimes large stationary anticyclones become established near the UK and they ‘block’ the passageof depressions. These anticyclones are most common in spring but can occur in all seasons — sometimesthey can persist for a month or more and completely change the character of the weather.

8/13/2019 National Meteorological Library and Archive Fact sheet 4 — Climate of the British Isles
http://slidepdf.com/reader/full/national-meteorological-library-and-archive-fact-sheet-4-climate-of-the 4/22
In summer, the blocking anticyclones can bring a prolonged spell of warm or hot weather to the UK — theyare responsible for ‘heatwaves’. In winter too, dry weather prevails in anticyclones, but, during cloudlessnights, the temperature falls and does not recover during the following day because there is only weaksunshine or persistent fog.
If a winter anticyclone settles to the north of the UK (Scandinavia is a favoured location), then easterlywinds on its southern side can draw bitterly cold air from the continent into the UK for a long period.
Main characteristics of the UK climateThe western and northern parts of the UK tend to lie close to the normal path of the Atlantic depressions.Consequently, in those parts of the UK winters tend to be mild and stormy, while the summers — whenthe depression track is further north and the depressions less deep — are mostly cool and windy. Themountains in these regions have an effect — they produce a marked increase in rainfall.
The lowlands of England have a climate similar to that on the continent (drier with a wider rangeof temperatures than in the north and west). However, the winters are not as severe as those onthe continent.
Overall, the south of the UK is usually warmer than the north, and the west is wetter than the east. Themore extreme weather tends to occur in mountainous regions where it is often cloudy, wet and windy.
Temperature
Temperatures are lower at night than by day, with the minimum temperature usually occurring shortlyafter dawn and the maximum temperature occurring two or three hours after midday.
In urban areas, the minimum temperatures experienced tend not to be as low as those recorded in ruralareas (also maximum temperatures are often higher). There are two main reasons for the ‘urban heatisland’ effect: the materials used in buildings store heat; and the release of heat as a result of industrialand domestic energy consumption. Some sheltered low-lying areas have a greater incidence of frosts (andmore severe frosts) than the surrounding areas — these are known as ‘frost hollows’.
The temperature varies according to the season because the axis of the Earth is tilted in relation to the
plane in which it revolves around the sun. January is, on average, the coldest month and July the warmest.In January, the coldest areas are parts of the Aberdeenshire and Perth and Kinross regions of Scotland andthe least cold are the extreme southwest of England and the Channel Islands.
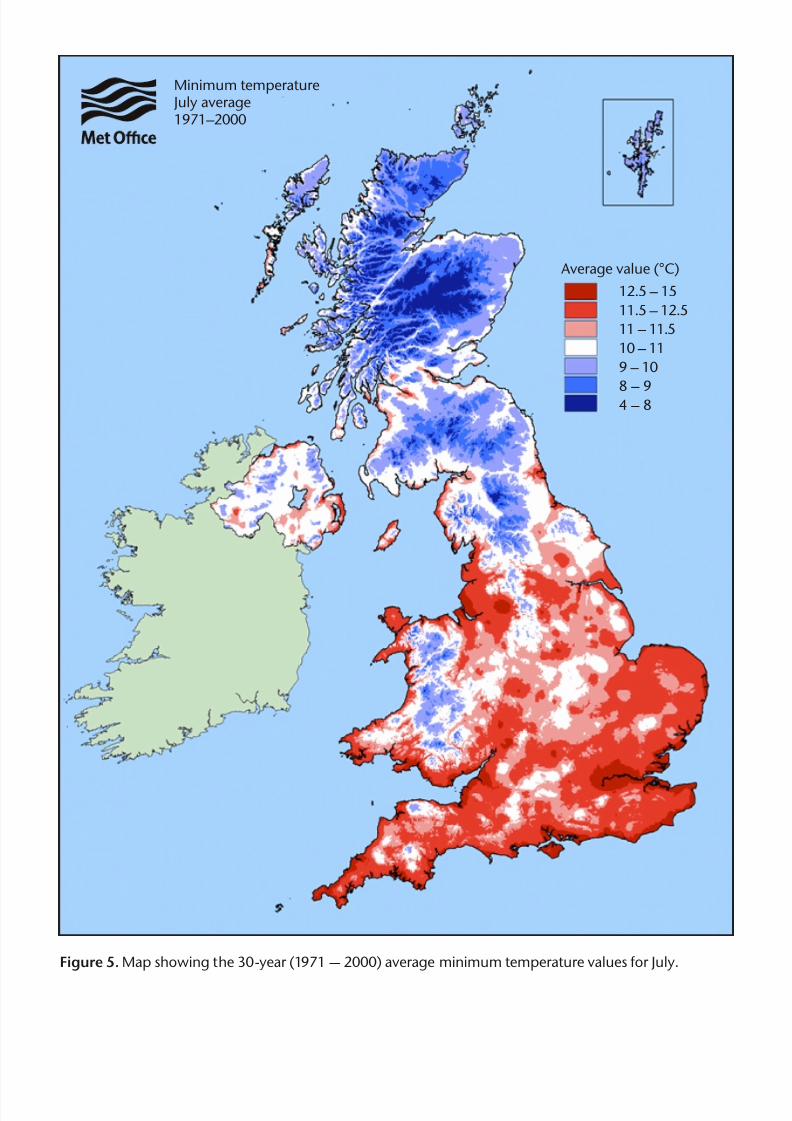
The main factor determining the distribution of temperature is nearness to the coast, particularly the westcoast. Temperatures are lower inland than near the coast. In July, the warmest areas are around London,and the coolest are in parts of Scotland. Areas near the coast are less warm than inland areas — theopposite to what happens in January — and the temperature decreases from south to north.
For both January and July, the modifying influence of the sea on coastal regions (keeping temperatures upin winter but down in summer) is mainly felt in a region up to 15 to 20 miles from the coast.

8/13/2019 National Meteorological Library and Archive Fact sheet 4 — Climate of the British Isles
http://slidepdf.com/reader/full/national-meteorological-library-and-archive-fact-sheet-4-climate-of-the 5/22
Figure 2. Map showing the 30-year (1971 — 2000) average maximum temperature values for January.
Maximum temperatureJanuary average1971–2000
Average value (°C)
7.5 – 10.5
7 – 7.5
6 – 7
5 – 6
4 – 5
2.5 – 4-2 – 2.5

8/13/2019 National Meteorological Library and Archive Fact sheet 4 — Climate of the British Isles
http://slidepdf.com/reader/full/national-meteorological-library-and-archive-fact-sheet-4-climate-of-the 6/22
Figure 3. Map showing the 30-year (1971 — 2000) average maximum temperature values for July.
Maximum temperatureJuly average1971–2000
Average value (°C)
21 – 24
20 – 21
19 – 20
18 – 19
16 – 18
15 – 168 – 15

8/13/2019 National Meteorological Library and Archive Fact sheet 4 — Climate of the British Isles
http://slidepdf.com/reader/full/national-meteorological-library-and-archive-fact-sheet-4-climate-of-the 7/22
Figure 4. Map showing the 30-year (1971 — 2000) average minimum temperature values for January.
Minimum temperatureJanuary average1971–2000
Average values (°C)
3 – 7
2 – 3
1 – 2
0.5 – 1
-0.5 – 0.5
-2 – -0.5-5 – -2
8/13/2019 National Meteorological Library and Archive Fact sheet 4 — Climate of the British Isles
http://slidepdf.com/reader/full/national-meteorological-library-and-archive-fact-sheet-4-climate-of-the 8/22
Figure 5. Map showing the 30-year (1971 — 2000) average minimum temperature values for July.
Minimum temperatureJuly average1971–2000
Average value (°C)
12.5 – 15
11.5 – 12.5
11 – 11.5
10 – 11
9 – 10
8 – 94 – 8

8/13/2019 National Meteorological Library and Archive Fact sheet 4 — Climate of the British Isles
http://slidepdf.com/reader/full/national-meteorological-library-and-archive-fact-sheet-4-climate-of-the 9/22
Figure 6. Map showing the 30-year (1971 — 2000) average mean temperature values for January.
Mean temperatureJanuary average1971–2000
Average value (°C)
5 – 9
4.5 – 5
3.5 – 4.5
3 – 3.5
2 – 3
0.5 – 2-4 – 0.5

8/13/2019 National Meteorological Library and Archive Fact sheet 4 — Climate of the British Isles
http://slidepdf.com/reader/full/national-meteorological-library-and-archive-fact-sheet-4-climate-of-the 10/22
Figure 7. Map showing the 30-year (1971 — 2000) average mean temperature values for July.
Mean temperatureJuly average1971–2000
Average value (°C)
16.5 – 19
15.5 – 16.5
14.5 – 15.5
13.5 – 14.5
12.5 – 13.5
11.5 – 12.56 – 11.5

8/13/2019 National Meteorological Library and Archive Fact sheet 4 — Climate of the British Isles
http://slidepdf.com/reader/full/national-meteorological-library-and-archive-fact-sheet-4-climate-of-the 11/22
Figure 8. Map showing the 30-year (1971 — 2000) average number of days of air frosts per year.
Days of air frost Annual average1971–2000
Average value (days)
110 – 180
90 – 110
70 – 90
60 – 70
40 – 60
30 – 400 – 30

8/13/2019 National Meteorological Library and Archive Fact sheet 4 — Climate of the British Isles
http://slidepdf.com/reader/full/national-meteorological-library-and-archive-fact-sheet-4-climate-of-the 12/22
Sunshine
Because of the variation in length of day from winter to summer, the duration of sunshine shows a markedseasonal variation. As a consequence, December is, on average, the month with least sunshine and Juneis the sunniest. In general, sunshine durations decrease with altitude and increasing latitude. Aspect alsoplays an important part — for example, south-facing slopes receive more sunshine than those facing north.
Figure 9. Map showing the 30-year (1971 — 2000) average annual sunshine duration.
Over the year as a whole, the sunniest places are flat areas near the coast. Some sites along the southcoast, from the Isle of Wight eastwards, and the Channel Islands record more than 40% of the maximumamount of sunshine possible in a year (1,800 hours out of 4,000). The Shetland Islands, on the other hand,only achieve about 24% of the maximum possible.
Sunshine durationAnnual average1971–2000
Average value (hours)
1600 – 1900
1450 – 16001350 – 14501250 – 13501150 – 12501050 – 1150700 – 1050

8/13/2019 National Meteorological Library and Archive Fact sheet 4 — Climate of the British Isles
http://slidepdf.com/reader/full/national-meteorological-library-and-archive-fact-sheet-4-climate-of-the 13/22
KinlocheweSouthend
350
300
250
200
150
100
50
0
Jan Feb Mar Apr May Jun
Month
M o n t h
Jul Aug Sept Oct Nov Dec
Rainfall
The average annual rainfall varies enormously over the UK from about 5,000 mm (200 inches) in parts ofthe western highlands of Scotland, to about 500 mm (20 inches) in parts of East Anglia and the ThamesEstuary. Overall, the wettest areas are in the western half of the country.
There are two reasons for this:
• They are nearest to the normal track of rain-bearing depressions.
• The most mountainous parts of the UK are in the west and, when the moist westerlywinds are forced to rise over the mountains, rain is produced.
Figure 10. Graph showing the monthly rainfall averages for Kinlochewe in northwest Scotland andSouthend in southeast England.
The south-eastern parts of the country have low rainfall because they are further away from the normaltrack of the depressions. However, much of the Midlands, north-east England and eastern Scotlandalso have low rainfall because the westerly winds have already dropped much of their water over themountains in the west. These regions are in a ‘rain shadow’.
Although the wettest parts of the UK have, on average, ten times as much rain as the driest parts, there ismuch less difference in the number of rain days. Rain days are defined as days when 0.2 mm (0.01 inches)or more of rain falls. On average, the drier areas have 150 and 200 such days a year, while the wettestareas have slightly more than 200. In most areas, December is the month with the most rain days.
In western areas, the winter half of the year (October to March) tends to receive over half the annualaverage rainfall. However, in eastern areas there is not such a marked variation, although they generallyhave more rain in the autumn and less in the spring than in the other two seasons.
The nature of the rainfall varies during the year. In summer, rainfall is often showery and is normally moreintense than winter rainfall, which tends to be associated with fronts and depressions. The heaviest fallsof rain are usually associated with summer thunderstorms. Sometimes more than 100 mm (4 inches) perhour for just a few hours.

8/13/2019 National Meteorological Library and Archive Fact sheet 4 — Climate of the British Isles
http://slidepdf.com/reader/full/national-meteorological-library-and-archive-fact-sheet-4-climate-of-the 14/22
Figure 11. Map showing the 30-year (1971 — 2000) average annual rainfall amounts across the UK.
Average value (mm)
2800 – 4700
2200 – 2800
1700 – 2200
1300 – 1700
1000 – 1300
800 – 1000400 – 800
Rainfall amount Annual average1971–2000

8/13/2019 National Meteorological Library and Archive Fact sheet 4 — Climate of the British Isles
http://slidepdf.com/reader/full/national-meteorological-library-and-archive-fact-sheet-4-climate-of-the 15/22
Snow
The average number of days in a year on which snow is observed to fall increases with latitude and heightabove mean sea level. Falls of sleet and snow over low-lying areas are normally confined to October toApril. Although falls of sleet or snow do occasionally occur in May and there have been isolated falls inJune. There are, however, large variations from one year to another in the frequency of snowfalls.
Figure 12. Map showing the 30-year (1971 — 2000) average number of days of snow/sleet falling per year
across the UK.
Average value (days)
75 – 130
60 – 7545 – 6035 – 4525 – 3515 – 250 – 15
Days of sleet/snow fallingAnnual average1971–2000

8/13/2019 National Meteorological Library and Archive Fact sheet 4 — Climate of the British Isles
http://slidepdf.com/reader/full/national-meteorological-library-and-archive-fact-sheet-4-climate-of-the 16/22

8/13/2019 National Meteorological Library and Archive Fact sheet 4 — Climate of the British Isles
http://slidepdf.com/reader/full/national-meteorological-library-and-archive-fact-sheet-4-climate-of-the 17/22
Wind
The strongest winds are associated with the passage of depressions across or close to the UK. As thefrequency of depressions is greatest during the winter months, this is when the strongest winds usuallyoccur. The majority of depressions approach the UK from the Atlantic, so the windiest areas are thewestern coasts and hills. Wind speeds decrease away from the coasts due to increased friction over theland, but increase over hills and mountains.
An interesting aspect of wind over the UK is the frequency of gales (average wind speeds of 34 knots(39 mph) or more). Most inland locations have gales a few times a year. Western coasts have the highestfrequency of gales, especially the western isles of Scotland. On other coasts, gales are still more frequentthan inland.
Figure 14. 30-year (1961 — 1990) average number of days of gales for selected stations.
4
6
8
14
3.5
5
7
12
3
3
6
1
2.5
4
5
0.8
2
2
4
0.6
1.5 3
0.4
1
1
2
0.2
0.5 1
0
0
0
0
J a n u a r y
J a n u a r y
J a n u a r y
J a n u a r y
F e b r u a r y
F e b r u a r y
F e b r u a r y
F e b r u a r y
M a r c h
M a r c h
M a r c h
M a r c h
A p r i l
A p r i l
A p r i l
A p r i l
M a y
M a y
M a y
M a y
J u n e
J u n e
J u n e
J u n e
J u l y
J u l y
J u l y
J u l y
A u g u s t
A u g u s t
A u g u s t
A u g u s t
S e p t e m b e r
S e p t e m b e r
S e p t e m b e r
S e p t e m b e r
O c t o b e r
O c t o b e r
O c t o b e r
O c t o b e r
N o v e m b e r
N o v e m b e r
N o v e m b e r
N o v e m b e r
D e c e m b e r
D e c e m b e r
D e c e m b e r
D e c e m b e r
LondonPlymouthBirminghamManchester
AngleseyRhooseAberporth
LerwickAberdeenGlasgow
AldergroveCarrigans

8/13/2019 National Meteorological Library and Archive Fact sheet 4 — Climate of the British Isles
http://slidepdf.com/reader/full/national-meteorological-library-and-archive-fact-sheet-4-climate-of-the 18/22
Thunder
Thunder can occur in any part of the UK at any time of the year, but in most places there is a maximumfrequency of occurrence in the summer months. The areas with the greatest frequency over the year areEast Anglia, east Midlands and south-east England.
Figure 15. Map showing the 30-year (1971 — 2000) average number of days of thunder per yearacross the UK.
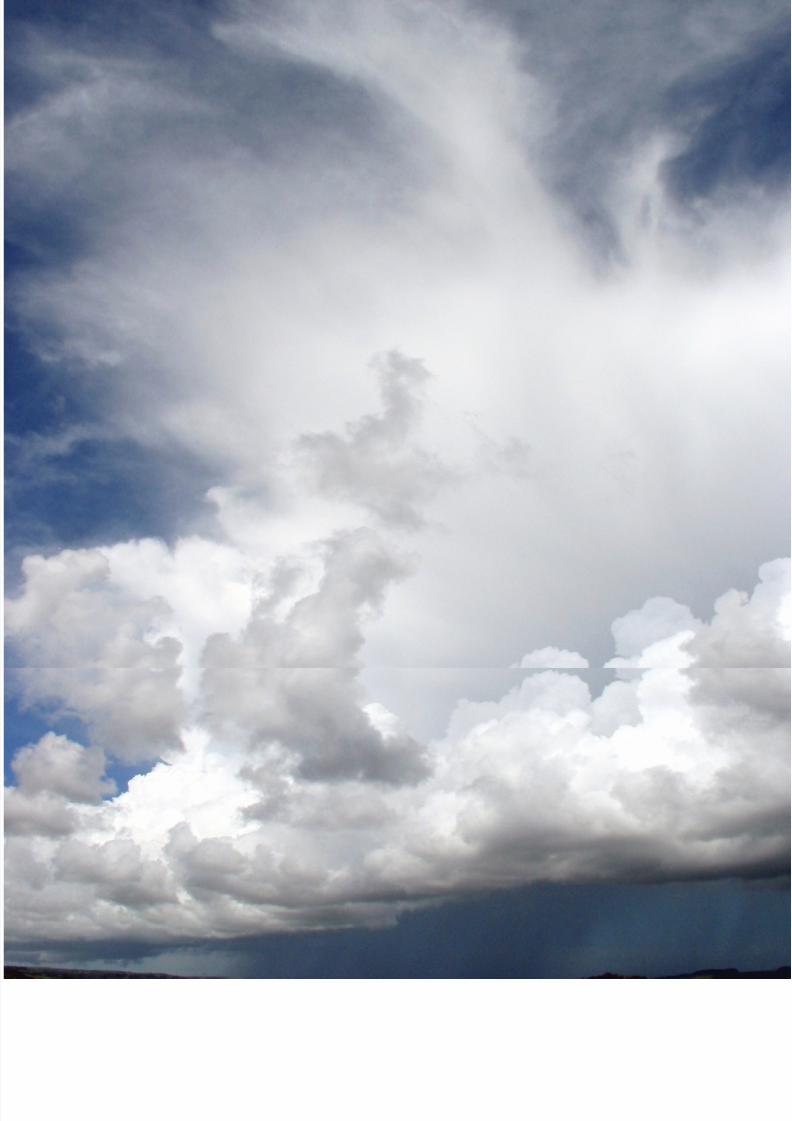
Picture (following page) Thunderstorm off Falmouth, Cornwall © SD Burt.
Average value (days)
15 – 1912 – 15
10 – 128 – 106 – 84 – 62 – 4
Days of thunder Annual average1971–2000
8/13/2019 National Meteorological Library and Archive Fact sheet 4 — Climate of the British Isles
http://slidepdf.com/reader/full/national-meteorological-library-and-archive-fact-sheet-4-climate-of-the 19/22

8/13/2019 National Meteorological Library and Archive Fact sheet 4 — Climate of the British Isles
http://slidepdf.com/reader/full/national-meteorological-library-and-archive-fact-sheet-4-climate-of-the 20/22
For more information about the Met Office, please contact the Customer Centre on:
Tel: 0870 900 0100Fax: 0870 900 5050Email: [email protected]
If you are outside the UK:
Tel: +44 (0)1392 885680
Fax: +44 (0)1392 885681
All of the images used in this fact sheet along with many others covering all aspects of meteorology can beobtained from the National Meteorological Library.
For more information about what images are available, please contact the Library Information Officer at:
Tel: 01392 884845Email: [email protected]

8/13/2019 National Meteorological Library and Archive Fact sheet 4 — Climate of the British Isles
http://slidepdf.com/reader/full/national-meteorological-library-and-archive-fact-sheet-4-climate-of-the 21/22
Other titles in this series still available are:
• Number 1 Clouds
• Number 2 Thunderstorms
• Number 3 Water in the atmosphere
• Number 5 White Christmases
• Number 6 The Beaufort Scale
• Number 7 Climate of South West England
• Number 8 The Shipping Forecast
• Number 9 Weather extremes
• Number 10 Air Masses and Weather Fronts
• Number 11 Interpreting weather charts
• Number 12 National Meteorological Archive
• Number 13 Upper air observation and the tephigram
• Number 14 Microclimates
• Number 15 Weather radar
• Number 16 World climates
• Number 17 Weather observations

8/13/2019 National Meteorological Library and Archive Fact sheet 4 — Climate of the British Isles
http://slidepdf.com/reader/full/national-meteorological-library-and-archive-fact-sheet-4-climate-of-the 22/22
Met Office
FitzRoy Road, Exeter
Devon, EX1 3PB
Tel: 0870 900 0100
Fax: 0 0 900 5050
Produced by the Met Office.
© Crown copyright 2013
Met Office and the Met Office logo
Our unique collection of weather images is now available via the National Meteorological Libraryand Archive’s online catalogue.
The collection illustrates all aspects of meteorology, from clouds and weather phenomena,to instruments and the work of the Met Office. Our online catalogue can be found at:
www.metoffice.gov.uk
All of the fact sheets in this series are available to download from our website
The full list can be found at:
www.metoffice.gov.uk/learning/library/publications/factsheets