Embed Size (px)
Citation preview
National Maternal Death Surveillance and Response (MDSR) System Annual
Report, 2010 EFY
Ethiopian Public Health Institute Public Health Emergency Management Center
(PHEM)
January, 2011 E.C
II | P a g e
National Maternal Death Surveillance and Response (MDSR) System Annual
Report, 2010 EFY
Ethiopian Public Health Institute
Public Health Emergency Management Center
(PHEM)
January, 2011 E.C
III | P a g e
Acronyms and Abbreviations
ANC Antenatal Care
BP Blood Pressure
E.C Ethiopian Calendar
EDHS Ethiopian Demographic Health Survey
EFY Ethiopian Fiscal Year
EmONC Emergency Obstetric and Neonatal Care
EPHI Ethiopian Public Health Institute
FBAF Facility Based Abstraction Form
FMOH Federal Ministry of Health
HDP Hypertensive Diseases of Pregnancy
HSTP Health Sector Transformation Plan
MBB Mini Blood Bank
MD Maternal Death
MDRF Maternal Death Report Format
MDSR Maternal Death Surveillance and Response
MMR Maternal Mortality Ratio
MNCH Maternal Neonatal and Child Health
NASG Non-pneumatic Anti-shock Garment
NICU Neonatal Intensive Care Unit
PFSA Pharmaceutical Fund and Supply Agency
PHEM Public Health Emergency Management
PNC Post Natal Care
PPH Post-Partum Hemorrhage
QI Quality Improvement
RHB Regional Health Bureau
RRT Rapid Response Team
SNNP Southern Nations Nationality and Peoples
TWG Technical Working Group
WHO World Health Organization

IV | P a g e
Acknowledgements
This 2010 EFY Maternal Death Surveillance and Response System annual report is prepared by Ethiopian
Public Health Institute with the participation from the national Maternal and Perinatal Death Surveillance
and Response (MPDSR) Technical Working Group (TWG) members from different stakeholders at various
levels of the health system. The Ethiopian Public Health Institute - Public Health Emergency Management
center would like to express its appreciation and gratitude to all those who were involved in the
preparation of this annual report.

V | P a g e
Contributors
Authors:
Mr Abduilhafiz Hassen (EPHI-PHEM)
Mr. Ftalew Dagnaw (EPHI-WHO/ E4A)
Co – Authors:
Mr. Zenebe Akale, (FMOH-MCH)
Dr. Kurabachew Abera (Save the Children)
Dr. Sintayehu Abebe (AMREF)
Dr. Meselech (Addis Ababa University)
Dr. Hassen Hussein (ESOG)
Dr. Zelalem Demeke (CHAI)
Dr. Azmach Hadush (WHO-E4A)
Dr. Fitsume Kibret (WHO-E4A)
Joanna Busza (WHO-E4A)
Dr. Ruth Lawley (WHO-E4A)
Reviewers:
Dr Beyene Moges (D/Director General – Ethiopian Public Health Institute)
Dr Feyesa Regassa (A/PHEM Directorate Director- Ethiopian Public Health Institute)
Zewdu Assefa (Lead, Early Warning, Risk Communication and Data ManagementTeam -
Ethiopian Public Health Institute)
VI | P a g e
Table of Contents Acronyms and Abbreviations............................................................................................................................................................. III
Acknowledgements ................................................................................................................................................................................ IV
Contributors ................................................................................................................................................................................................. V
Table of Contents ................................................................................................................................................................................... VI
Forward ..................................................................................................................................................................................................... VIII
Executive Summary ................................................................................................................................................................................ IX
I. Maternal Death Surveillance and Response System Performance .............................................................................. 1
Surveillance and Case Based Reporting ................................................................................................................................... 1
Maternal Death Reporting Trend ................................................................................................................................................. 7
Geographical Coverage of MDSR System ..............................................................................................................................10
Timeliness and Completeness .....................................................................................................................................................12
II. Background Characteristics of Deceased Women............................................................................................................13
Socio-Demographic Profile ............................................................................................................................................................13
Place of Death .....................................................................................................................................................................................14
III. Causes of Maternal Death ..........................................................................................................................................................15
Contributing factors to Maternal Death ..................................................................................................................................17
IV. Specific Causes of Death .............................................................................................................................................................21
Obstetric Hemorrhage .....................................................................................................................................................................21
Hypertensive Disorder of Pregnancy (Preeclampsia/ Eclampsia) ..............................................................................23
Obstructed labor/Uterine rupture ..............................................................................................................................................24
Sepsis .......................................................................................................................................................................................................24
Anemia ....................................................................................................................................................................................................24
V. Response ...............................................................................................................................................................................................26
National Level Response ................................................................................................................................................................26
Woreda, Facility and Community Response .........................................................................................................................27
Quality Improvement Case Studies ..........................................................................................................................................28
VI. Recommendations ..........................................................................................................................................................................37
National & Regional Level ..............................................................................................................................................................37
Health Facility Level ..........................................................................................................................................................................37

VII | P a g e
List of Tables and Figures
List of Tables
Table 1: - Reported maternal deaths versus estimated maternal deaths and Weekly Vs MDRF reports based on EDHS 2016 estimate, 2010 EFY ................................................................................................................................... 4
Table 2: - Twenty high maternal death reporting zonal/ town structures, 2010 EFY. .......................................... 5
Table 3: - Twenty high maternal death reporting Woreda structures, 2010 EFY .................................................... 6
Table 4: - Reporting regions mean time of reporting for maternal death case-based reporting, by data sources 2010 EFY ...................................................................................................................................................................................12
Table 5: - Direct and indirect Causes of maternal deaths from MDSR system, 2010 EFY ................................16
Table 6: - Contributing factors to maternal death, 2010 EFY ..........................................................................................18
List of Figures
Figure 1: Proportion of reported maternal deaths against the estimated number of deaths by region based on EDHS 2016 MMR of 412 per 100,000 LBs, July 1, 2008 to June 30, 2009 E.C .................................... 2
Figure 2: - Weekly and Case based reports (MDRF) trend per reporting months, 2010 EFY ......................... 7
Figure 3: - Weekly and Case based reports (MDRF) trend per reporting months 2006 – 2010 EFY .......... 7
Figure 4: - Oromia region Weekly and Case based MD reports (MDRF) trend 2006 – 2010 EFY ................. 8
Figure 5: - SNNP region Weekly and Case based MD reports (MDRF) trend 2006 – 2010 EFY .................... 9
Figure 6: - Amhara region Weekly and Case based MD reports (MDRF) trend 2006 – 2010 EFY ................ 9
Figure 7: - Tigray region Weekly and Case based MD reports (MDRF) trend 2006 – 2010 EFY .................10
Figure 8: - Maternal death weekly reporting status in zones and sub-cities in 2010 EFY, Ethiopia ..........11
Figure 9: - Maternal death MDRF reporting status in zones and sub-cities in 2010 EFY, Ethiopia ............11
Figure 10: - Age groups for all reported of maternal deaths, N=1010 ....................................................................13
Figure 11: - Parity status and Timing for all reported of maternal deaths, N=1010 ........................................13
Figure 12: - Places of death for all reported of maternal deaths, N=1010 ............................................................14
Figure 13: - Causes of maternal death from MDSR, 2010 EFY (N= 1010) ............................................................15
Figure 14: - Trend of the major causes of maternal death from MDSR system 2006-2010 EFY ................17
Figure 15: - Trend of delay factors contributing to maternal death 2006-2010 EFY ........................................19
Figure 16: -Delay factors from verbal autopsies 2006 - 2010 EFY .............................................................................19
Figure 17: - Delay factors from facility-based abstractions 2006-2010 EFY ..........................................................20 .........................................................................................................................................................................................................................21
Figure 18: - Reported maternal death due to hemorrhage by place death from 2006 - 2010EFY ............21
Figure 19: - Maternal death due to hemorrhage by timing of death in relation to pregnancy 2006 - 2010 EFY .....................................................................................................................................................................................................22
Figure 20: -Reported maternal deaths due to HDP by parity 2006 – 2010 EFY ..................................................23
Figure 21: - Reported maternal deaths due to anemia by place of death, 2010 EFY ......................................25
Figure 22: - Proportion of obstetric cases referred after basic emergency care given at health centers .........................................................................................................................................................................................................................30
Figure 23: - Proportion of Appropriate Referral among Referred obstetric cases. .............................................30
Figure 24: - Proportion of pregnant women who received quality ANC ..................................................................32
Figure 25: - Proportion of HDP cases provided with full dose of MgSO4 ................................................................33
Figure 26: - Proportion of HDP cases with Vital sign and UA followed as per the physician order. ..........34
Figure 27: - Proportion of pregnant women who required and received blood transfusion ........................35

VIII | P a g e
Forward This 2010 EFY Ethiopian Maternal Death Surveillance and Response (MDSR) System report marks the fifth
year of the national system’s implementation, which was initiated in Ginbot 2006 E.C. During these five
years, over 3000 maternal deaths have been identified, notified, reviewed, reported, and entered into the
national database. The system has transitioned from being a standalone reporting structure, to becoming
integrated within Public Health Emergency Management (PHEM). Every year, the number of reported
deaths has increased, and for 2010 this report presents analysis of 1010 case-based reports from
community and facility review processes. This is a tremendous achievement, particularly considering that
MDSR systems can take 10-20 years to fully mature. There is, of course, more work to be done to improve
the coverage, completeness, and quality of the data. Improving data collection across the system is
critical, as analysis and action will depend on the accuracy and validity of information received into the
system.
In this report, findings regarding the causes and determinants of maternal deaths are compared across
the last 5 years to provide an indication of prevailing trends over time. Trends need to be interpreted with
caution, as the MDSR system is still young and earlier years experienced significant under-reporting (for
example, there were fewer than 100 maternal deaths reported in 2006 E.C). In line with this, we have
observed that postpartum hemorrhage remains the leading cause of maternal deaths. Changes are seen
in other areas, such as the increment of facility reporting, which suggests that a growing number of
women deliver at or seek attention for complications from health facilities. Furthermore, it is a positive
development that facility-based reports increasingly cite “delay 3” factors (which correspond to delay in
receiving care once arriving in a facility) as contributing to maternal deaths. This might indicate that the
culture of fear might be abating which could in turn imply providers’ willingness to consider weaknesses
within facilities and identify these for quality improvement measures.
As always, the response to maternal mortality is the most important step of MDSR. This report offers both
good practice examples and recommendations for how the health system can learn from MDSR data at
different levels and use the evidence to avert future deaths. In particular, this report links MDSR to the
Quality Improvement (QI) cycle, demonstrating how the review process can help identify practical
measures to improve quality of obstetric care, which can then be prospectively evaluated.
Beyene Moges (MD, PhD)
Deputy Director General
Ethiopian Public Health Institute

IX | P a g e
Executive Summary
The national Maternal Death Surveillance and Response (MDSR) system has been implemented for the
last five years nationwide. This is the first annual report to present trends in data since the 2006 EFY
introduction of the system.
During the current 2010 EFY, the system captured 1302 maternal deaths with weekly notifications and
1010 maternal death case-based reports. Among case-based reports, 423 were reported via verbal
autopsy and 454 via facility-based abstraction, and for 133 the data source was not known. This
represents 10 % of maternal deaths captured by weekly notification and 8% captured by case-based
reports, based on EDHS 2016 GC estimates of maternal deaths throughout the country. Slightly fewer
case-based reports were reviewed in 2010 EFY compared to 2009 EFY, possibly as a result of political
events during the year, and therefore some late reports may still be submitted in future.
Facility-based reporting continues to rise, now accounting for over half of all case-based reports for which
source of data was recorded. Ethiopia’s MDSR system is one of the few in the world that captures
community-based deaths, and thus it is critical for the level of verbal autopsies conducted to increase
over time. Each notified maternal death should be investigated by verbal autopsy and reviewed at
community level, even if it is also reviewed within a facility. In a fully functioning system, only MDRFs
from verbal autopsies will be used to analyze data and estimate total number of maternal deaths, to avoid
duplication.
There remain significant variations in regional levels of reporting, ranging from 52% of expected deaths
captured by the system in Dire-Dawa to under 1% in Somali Region. Attention needs to be paid to high-
reporting zones and woredas, which should receive support for appropriate responses to address their
maternal deaths, while low-reporting areas require more intensive technical assistance to bring their
reporting levels in line with the rest of the country.
It is also worth highlighting that although perinatal death surveillance was added to the system in 2009,
roll out of training and data collection tools have only recently been completed and the number of perinatal
deaths reported is too low to analyze for this report.
The leading causes of maternal death identified by the MDSR system were haemorrhage in 417 cases
(41.3%), hypertensive disorders of in pregnancy (HDP) in 188 (18.6%), Anemia in 177 (17.5%),
obstructed/ ruptured uterus in 98 (9.7%) and sepsis in 94 (9.3%). This pattern is broadly the same as in
previous years, although there is a notable slight decline in haemorrhage cases. Most maternal deaths
continue to occur in the post-partum period, with high parity women at highest risk.

X | P a g e
In the last three years (2008-2010 EFY) hypertensive disorders in pregnancy (HDP) has also persisted as
the second leading cause of maternal death accounting for more than 18% of the deaths. Anemia is the
third leading cause of death contributing to 18% to 20% of maternal deaths.
The MDSR review process identifies factors that contributed to the death, classified into the 3-delay model
where Delay One refers to delay in deciding to seek assistance, Delay Two relates to delay in reaching a
facility, and Delay Three captures delays in receiving appropriate care after arrival at a facility. In 2010
EFY, delay one was cited in 675 (66.8%), delay two in 381 (37.7%) and delay three in 491 (48.6%) of
reviewed maternal deaths. These proportions do not add up to 100% as more than one delay can be
recorded for any maternal death report. The increase in Delay 3 factors from previous years’ highlight
that more women are delivering in facilities or seeking care when complications arise, and also that
facilities are willing to identify internal problems and address these.
Responses to MDSR data take place at all levels of the health system including the community, all health
facilities, and all administrative levels i.e. Woreda, zonal, regional and national. During 2009-2010, the
Ethiopian Health system committed to a National Quality Improvement (QI) programme across the entire
health system. This annual MDSR report features good examples of how MDSR and QI teams can work
together to produce demonstrable impact. Four case studies from MDSR/QI projects undertaken in 2010
are detailed on the following topics
1. Basic emergency care for obstetric cases prior to arrival at hospital
2. Quality of ANC care of a health center
3. Access to blood transfusion at a primary hospital
4. Anticonvulsant treatment and monitoring of severe HDP at a Referral Hospital
Finally, the report concludes with key recommendation based on the data and targeted at different levels
of the health system. These focus on (1) improving levels of reporting and review by strengthening
leadership and committing adequate resources within EPHI and the Technical Working Group; (2) making
antenatal care a national FMOH priority with intensive supervision to standardize services offered to
pregnant women at community-level; (3) Ensuring facility managers take responsibility for the availability
and use of critical job aids and supplies in labour wards such as the Safe Childbirth Checklist, Partograph,
misoprostol, NASGs; and (4) increasing heath system capacity including functional facility-to-facility
referral systems, establishment of mini blood banks and training staff in efficient use of blood products
(e.g. frozen plasma instead of whole blood where appropriate), and (5) introducing routine audit and
quality improvement procedures, including QI staff representation on MDSR/ RRT review committees.

1 | P a g e
I. Maternal Death Surveillance and Response System Performance
Surveillance and Case Based Reporting
Reducing maternal mortality and improving maternal health is a top priority of the Ethiopian Federal
Ministry of Health (FMOH) as reflected in Health Sector Transformation Plan and Reproductive Health
Strategy for 2016 – 2020. The national Maternal Death Surveillance and Response (MDSR) system has
been implemented for the last five years nationwide. The system operates as part of the national Public
Health Emergency Management (PHEM) system at health facility and community level to identify and
capture maternal deaths happening in both facilities and the community. In partnership with the FMOH,
reviewed and reported data are analyzed to identify priority responses.
Although MDSR system has been implemented in its current form since 2007 throughout the country,
gaps remain in reaching the all geographical areas. Reporting of maternal deaths through weekly
surveillance lags behind the other reportable conditions within the surveillance system. Sensitivity of
maternal mortality and the relative complexity of this specific surveillance may be responsible for relatively
lower MDSR surveillance performance compared to the estimated maternal death. However, Ethiopia’s
MDSR system shows significant improvement in its capacity to capture maternal deaths occurring in
communities as well as in health facilities compared with previous years.
During the current 2010 Ethiopian fiscal year (EFY), the system captured 1302 maternal deaths with
weekly notifications and 1010 maternal death case-based reports. Among case-based reports, 423 were
reported via verbal autopsy and 454 via facility-based abstraction, and for 133 the data source was not
known. This represents 10 % of maternal deaths captured by weekly notification and 8% captured by
case-based reports, based on EDHS 2016 estimates of maternal deaths throughout the country.
Summary Findings:
• Compared to previous years, capacity of the MDSR system has improved both in terms of
consistency of reporting and geographic coverage
• Weekly and case-based reporting of maternal deaths have significantly increased each
year, although the system still captures only about 10% and 8% of estimated maternal
deaths through weekly surveillance and case-based reports, respectively
• There are variations across regions in MDSR performance, and low reporting and
silent areas remain
2 | P a g e
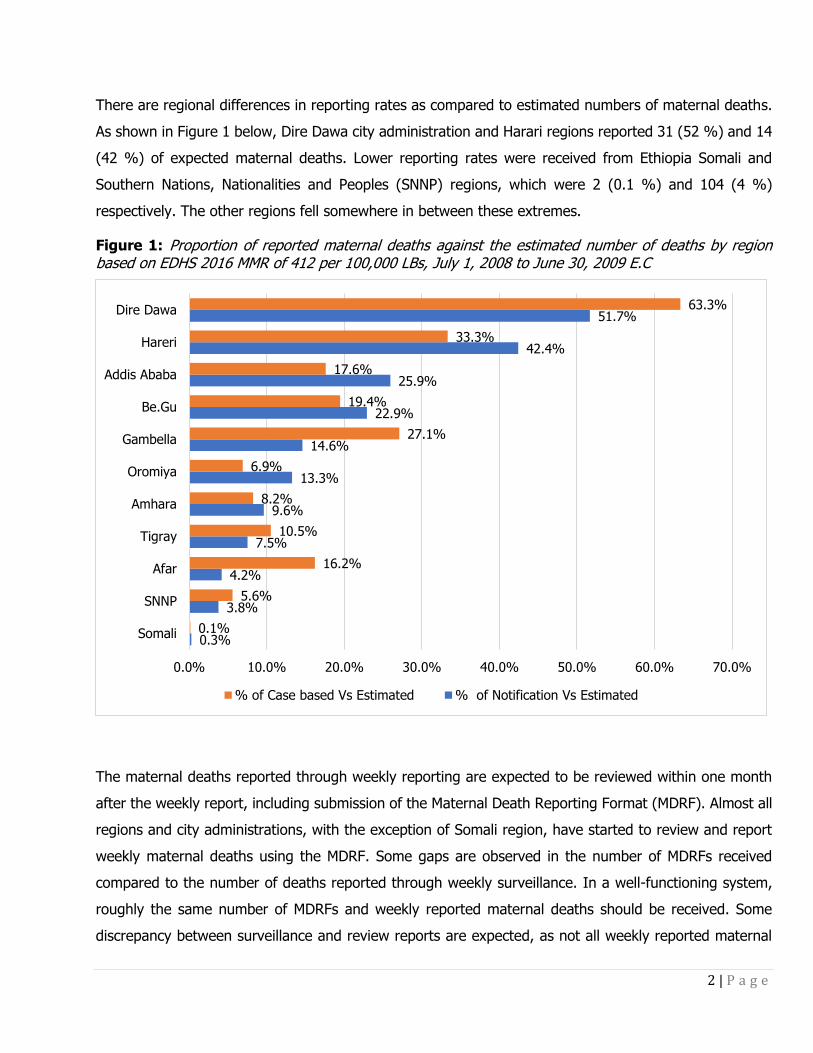
There are regional differences in reporting rates as compared to estimated numbers of maternal deaths.
As shown in Figure 1 below, Dire Dawa city administration and Harari regions reported 31 (52 %) and 14
(42 %) of expected maternal deaths. Lower reporting rates were received from Ethiopia Somali and
Southern Nations, Nationalities and Peoples (SNNP) regions, which were 2 (0.1 %) and 104 (4 %)
respectively. The other regions fell somewhere in between these extremes.
Figure 1: Proportion of reported maternal deaths against the estimated number of deaths by region based on EDHS 2016 MMR of 412 per 100,000 LBs, July 1, 2008 to June 30, 2009 E.C
The maternal deaths reported through weekly reporting are expected to be reviewed within one month
after the weekly report, including submission of the Maternal Death Reporting Format (MDRF). Almost all
regions and city administrations, with the exception of Somali region, have started to review and report
weekly maternal deaths using the MDRF. Some gaps are observed in the number of MDRFs received
compared to the number of deaths reported through weekly surveillance. In a well-functioning system,
roughly the same number of MDRFs and weekly reported maternal deaths should be received. Some
discrepancy between surveillance and review reports are expected, as not all weekly reported maternal
0.3%
3.8%
4.2%
7.5%
9.6%
13.3%
14.6%
22.9%
25.9%
42.4%
51.7%
0.1%
5.6%
16.2%
10.5%
8.2%
6.9%
27.1%
19.4%
17.6%
33.3%
63.3%
0.0% 10.0% 20.0% 30.0% 40.0% 50.0% 60.0% 70.0%
Somali
SNNP
Afar
Tigray
Amhara
Oromiya
Gambella
Be.Gu
Addis Ababa
Hareri
Dire Dawa
% of Case based Vs Estimated % of Notification Vs Estimated

3 | P a g e
deaths will be eligible for investigation, reviewing and report by final case-based reporting formats.
Furthermore, investigation for some deaths may not be carried out due to some families being difficult to
locate following a death, refuse to participate in a verbal autopsy or suspected maternal deaths reported
weekly may be turned to be accidental or incidental deaths during verification. Thus, the number of MDRFs
is likely to be smaller than the total number of MDs reported through weekly surveillance.
As shown in table 1 below, among 1302 weekly notified maternal deaths 77.6 % overall (ranging from 50
% to 388.9 %) were reviewed and reported using the MDRF. Where this proportion is over 100% it
suggests that while maternal deaths are being notified and reviewed, weekly surveillance is not capturing
these. In Dire Dawa, Tigray, Gambella, SNNP and Afar there was a greater number of MDRFs compared
with weekly notifications, respectively 122.6 %, 140 %, 185.7 % and 388.9 %.
Among all maternal case-based reports, 454 (45.0%) were extracted from verbal autopsies, which are
meant to be used for all maternal deaths regardless of where they occur. The remaining 423 (41.9%)
case-based reports were extracted from facility-based abstraction formats, which are used specifically to
investigate maternal deaths occurring at health facilities, and include significantly more clinical detail.

4 | P a g e
Table 1: - Reported maternal deaths versus estimated maternal deaths and Weekly Vs MDRF reports based on EDHS 2016 estimate, 2010 EFY
Region Estimated Reported notification
Reported Case based
% of notification reporting Vs Reported
% of notification reporting Vs Estimated
% of case-based reporting Vs Estimated
Case based extracted from VA
Case based extracted from FBAF
Addis Ababa 324 84 57 67.9 25.9 17.6 39 (68.4%) 18 (31.6%)
Afar 216 9 35 388.9 4.2 16.2 17 (48.6%) 18 (51.4%)
Amhara 2964 285 244 85.6 9.6 8.2 71 (29.1%) 63 (25.8%)
Benishangul Gumuz 144 33 28 84.8 22.9 19.4 12 (42.9%) 16 (57.1%)
Dire Dawa 60 31 38 122.6 51.7 63.3 28 (73.7%) 6 (15.8%)
Gambella 48 7 13 185.7 14.6 27.1 6 (46.2%) 6 (46.2%)
Harari 33 14 11 78.6 42.4 33.3 10 (90.9%) 0
Oromiya 5112 678 352 51.9 13.3 6.9 163 (46.3%) 184 (52.3%)
SNNP 2760 104 154 148.1 3.8 5.6 91 (59.1%) 51 (33.1%)
Somali 756 2 1 50.0 0.3 0.1 1 (100.0%) 0
Tigray 732 55 77 140.0 7.5 10.5 16(20.8%) 61 (79.2%)
Total 13149 1302 1010 77.6 9.9 7.7 454 (45.0%) 423 (41.9%)
Note: - 133 Case based (MDRF) reports received have no information on whether extracted from VA or FBA Top maternal death reporting zonal/town and woredas
5 | P a g e
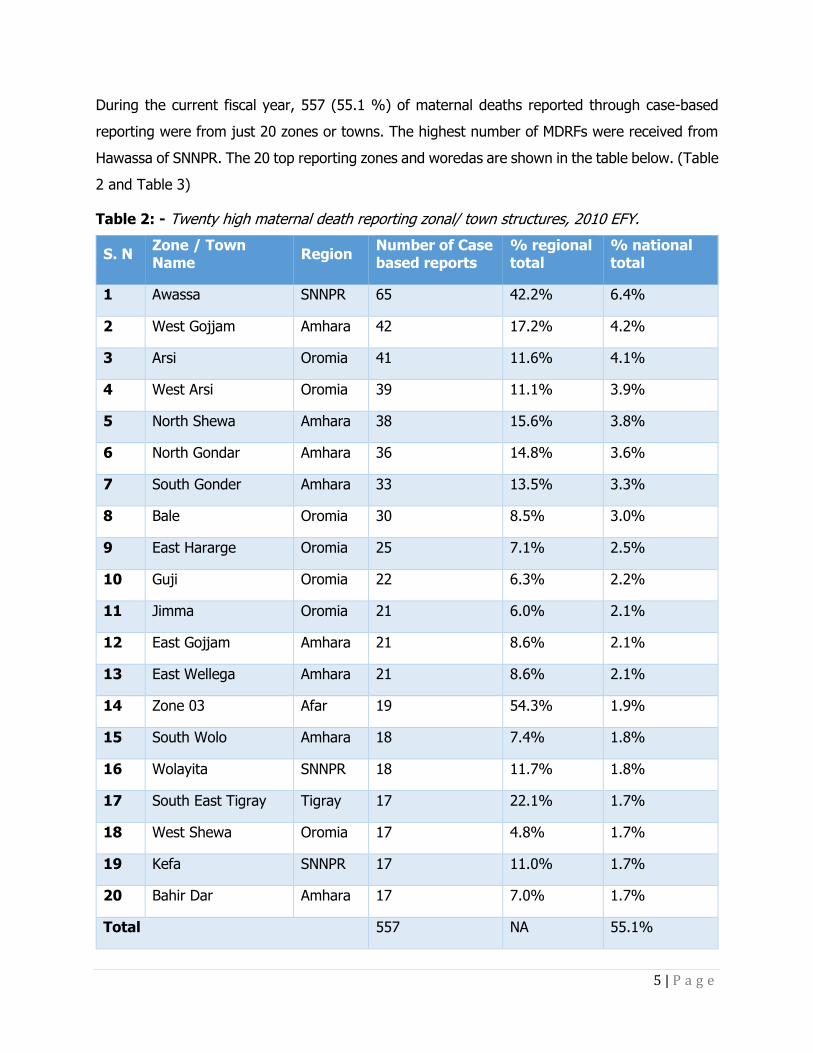
During the current fiscal year, 557 (55.1 %) of maternal deaths reported through case-based
reporting were from just 20 zones or towns. The highest number of MDRFs were received from
Hawassa of SNNPR. The 20 top reporting zones and woredas are shown in the table below. (Table
2 and Table 3)
Table 2: - Twenty high maternal death reporting zonal/ town structures, 2010 EFY.
S. N Zone / Town Name
Region Number of Case based reports
% regional total
% national total
1 Awassa SNNPR 65 42.2% 6.4%
2 West Gojjam Amhara 42 17.2% 4.2%
3 Arsi Oromia 41 11.6% 4.1%
4 West Arsi Oromia 39 11.1% 3.9%
5 North Shewa Amhara 38 15.6% 3.8%
6 North Gondar Amhara 36 14.8% 3.6%
7 South Gonder Amhara 33 13.5% 3.3%
8 Bale Oromia 30 8.5% 3.0%
9 East Hararge Oromia 25 7.1% 2.5%
10 Guji Oromia 22 6.3% 2.2%
11 Jimma Oromia 21 6.0% 2.1%
12 East Gojjam Amhara 21 8.6% 2.1%
13 East Wellega Amhara 21 8.6% 2.1%
14 Zone 03 Afar 19 54.3% 1.9%
15 South Wolo Amhara 18 7.4% 1.8%
16 Wolayita SNNPR 18 11.7% 1.8%
17 South East Tigray Tigray 17 22.1% 1.7%
18 West Shewa Oromia 17 4.8% 1.7%
19 Kefa SNNPR 17 11.0% 1.7%
20 Bahir Dar Amhara 17 7.0% 1.7%
Total 557 NA 55.1%

6 | P a g e
Table 3: - Twenty high maternal death reporting Woreda structures, 2010 EFY
S. N Zone / Town Name Region Number of Case
based reports % regional total
1 Hawassa Town SNNPR 41 26.6%
2 Bahir Dar Liyu Amhara 17 7.0%
3 Gondar town Amhara 16 6.6%
4 Shashemene Town Oromia 13 3.7%
5 AdolaTown Oromia 13 3.7%
6 Libokemkem Amhara 10 4.1%
7 Dubti Afar 10 28.6%
8 Amibara Afar 9 25.7%
9 Weliso Town Oromia 9 2.6%
10 Tsegede Tigray 9 11.7%
11 Dagua Temben Tigray 9 11.7%
12 GINIR Oromia 9 2.6%
13 Gomma Oromia 8 2.3%
14 South Achefer Amhara 8 3.3%
15 Habro Amhara 8 3.3%
16 Robe Town Oromia 7 2.0%
17 Mecha Amhara 7 2.9%
18 Chelia Oromia 7 2.0%
19 Jile Timuga Amhara 7 2.9%
20 Gambela Town Gambella 6 46.2%

7 | P a g e
Maternal Death Reporting Trend
Both weekly and case based maternal death reporting trend for current fiscal year shows
decreasing trend throughout the year relative to the first month of reporting. In regard to
maternal death case based (MDRF) reporting, it shows constantly declining starting from
November (Figure 2). But compared to previous years, quarterly and annual maternal death
reporting for both weekly and case-based reporting shows significant increase (Figure 3).
Figure 2: - Weekly and Case based reports (MDRF) trend per reporting months, 2010 EFY
Figure 3: - Weekly and Case based reports (MDRF) trend per reporting months 2006 – 2010 EFY
0
20
40
60
80
100
120
140
160
Mia
zia
Gin
bot
Senie
Ham
lie
Nehasi
e
Mesk
ere
m
Tik
em
t
Hid
ar
Tahis
as
Tir
Yekatit
Megabit
Notification Case based

8 | P a g e
There are variations between regions in weekly notification and MDRF reports. Reporting
inconsistency may be due to weak integration of MDSR system and PHEM structure and / or
availability and functionality of Rapid Response Teams (RRT)/MDSR committees responsible for
reviewing and reporting maternal death reports. In a relatively strong system, weekly reports
would be expected to be equivalent or greater than case-based reporting of MDRFs. For
illustration purposes, the last 5 years reporting trends are presented for the 4 agrarian regions
which started implementing MDSR in 2006, comparing weekly and MDRF reporting.
Figure 4: - Oromia region Weekly and Case based MD reports (MDRF) trend 2006 – 2010 EFY
0
155
463
766
1302
0
200
400
600
800
1000
1200
1400
2006 EFY 2007 EFY 2008 EFY 2009 EFY 2010 EFY
Nu
mb
er
of
rep
ort
s
Reporting year
MDRF Notifications
-
100
200
300
400
500
600
700
800
2006 EFY 2007 EFY 2008 EFY 2009 EFY 2010 EFY
Oromia region
Notification Case based

9 | P a g e
Figure 5: - SNNP region Weekly and Case based MD reports (MDRF) trend 2006 – 2010 EFY
Figure 6: - Amhara region Weekly and Case based MD reports (MDRF) trend 2006 – 2010 EFY
-
20
40
60
80
100
120
140
160
180
200
2006 EFY 2007 EFY 2008 EFY 2009 EFY 2010 EFY
SNNP region
Notification Case based
-
50
100
150
200
250
300
350
2006 EFY 2007 EFY 2008 EFY 2009 EFY 2010 EFY
Amhara region
Notification Case based

10 | P a g e
Figure 7: - Tigray region Weekly and Case based MD reports (MDRF) trend 2006 – 2010 EFY
Geographical Coverage of MDSR System
Geographical coverage of MDSR has markedly improved compared with previous years. Before
the system was started to be implemented throughout the country at the end of 2007 E.C, the
system started in 37 selected zones and sub-cities, within five regions and two city
administrations, representing around 32.4% of zones in the country. The system has now been
introduced nationally.
Nonetheless, even in 2010 there remain “silent areas”. Silent areas are defined as zones or
woredas that did not report any maternal deaths during the reporting fiscal year. As it is unlikely
that no maternal deaths occurred, silent areas serve as a warning sign of poor compliance with
the MDSR system. As shown in figures 8 and 9, in 2010 there were 23 zones (20%) that were
“silent” for weekly maternal death reporting. The highest numbers of silent areas were from
Somali Region. Regarding MDRF reporting, 28 (25 %) of zones and sub-cities were “silent”. The
highest number of silent areas for case-based reporting were also from Somali Region. The maps
below illustrate rates of reporting for both weekly surveillance and MDRFs.
-
20
40
60
80
100
120
140
2006 EFY 2007 EFY 2008 EFY 2009 EFY 2010 EFY
Tigray region
Notification Case based

11 | P a g e
Figure 8: - Maternal death weekly reporting status in zones and
sub-cities in 2010 EFY, Ethiopia
Figure 9: - Maternal death MDRF reporting status in zones and
sub-cities in 2010 EFY, Ethiopia
12 | P a g e
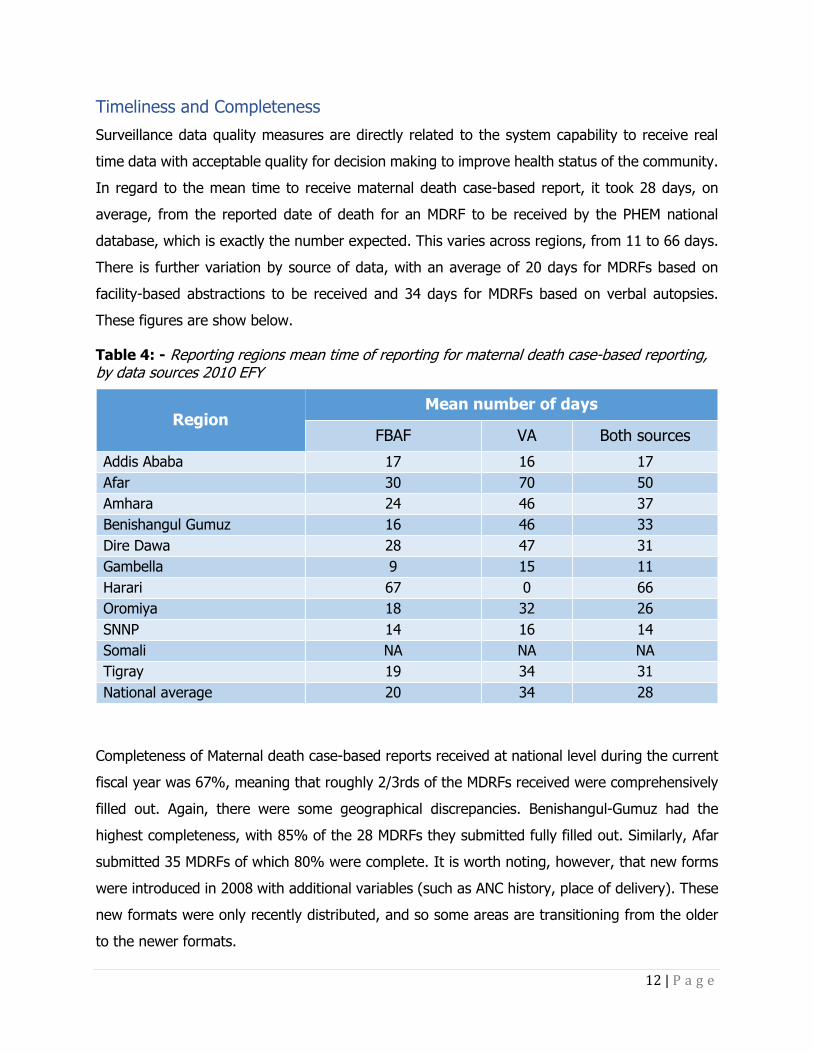
Timeliness and Completeness
Surveillance data quality measures are directly related to the system capability to receive real
time data with acceptable quality for decision making to improve health status of the community.
In regard to the mean time to receive maternal death case-based report, it took 28 days, on
average, from the reported date of death for an MDRF to be received by the PHEM national
database, which is exactly the number expected. This varies across regions, from 11 to 66 days.
There is further variation by source of data, with an average of 20 days for MDRFs based on
facility-based abstractions to be received and 34 days for MDRFs based on verbal autopsies.
These figures are show below.
Table 4: - Reporting regions mean time of reporting for maternal death case-based reporting, by data sources 2010 EFY
Region Mean number of days
FBAF VA Both sources
Addis Ababa 17 16 17
Afar 30 70 50
Amhara 24 46 37
Benishangul Gumuz 16 46 33
Dire Dawa 28 47 31
Gambella 9 15 11
Harari 67 0 66
Oromiya 18 32 26
SNNP 14 16 14
Somali NA NA NA
Tigray 19 34 31
National average 20 34 28
Completeness of Maternal death case-based reports received at national level during the current
fiscal year was 67%, meaning that roughly 2/3rds of the MDRFs received were comprehensively
filled out. Again, there were some geographical discrepancies. Benishangul-Gumuz had the
highest completeness, with 85% of the 28 MDRFs they submitted fully filled out. Similarly, Afar
submitted 35 MDRFs of which 80% were complete. It is worth noting, however, that new forms
were introduced in 2008 with additional variables (such as ANC history, place of delivery). These
new formats were only recently distributed, and so some areas are transitioning from the older
to the newer formats.
13 | P a g e
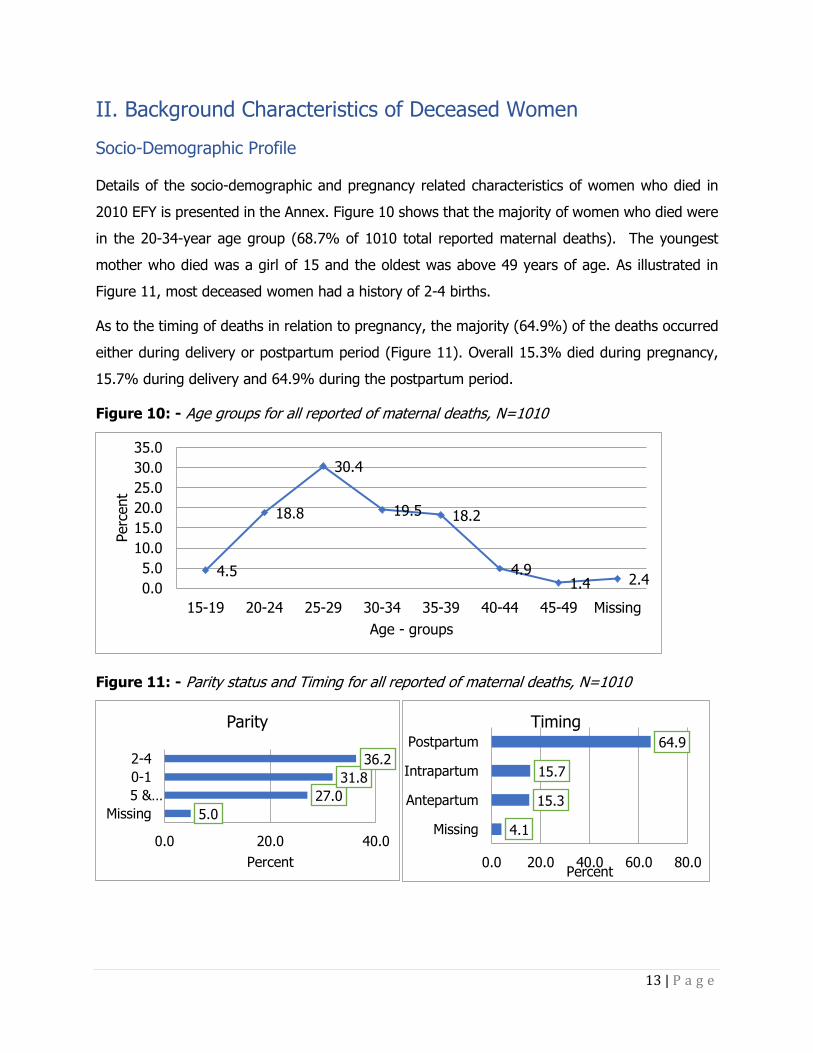
II. Background Characteristics of Deceased Women
Socio-Demographic Profile
Details of the socio-demographic and pregnancy related characteristics of women who died in
2010 EFY is presented in the Annex. Figure 10 shows that the majority of women who died were
in the 20-34-year age group (68.7% of 1010 total reported maternal deaths). The youngest
mother who died was a girl of 15 and the oldest was above 49 years of age. As illustrated in
Figure 11, most deceased women had a history of 2-4 births.
As to the timing of deaths in relation to pregnancy, the majority (64.9%) of the deaths occurred
either during delivery or postpartum period (Figure 11). Overall 15.3% died during pregnancy,
15.7% during delivery and 64.9% during the postpartum period.
Figure 10: - Age groups for all reported of maternal deaths, N=1010
Figure 11: - Parity status and Timing for all reported of maternal deaths, N=1010
4.5
18.8
30.4
19.5 18.2
4.91.4 2.4
0.0
5.0
10.0
15.0
20.0
25.0
30.0
35.0
15-19 20-24 25-29 30-34 35-39 40-44 45-49 Missing
Perc
ent
Age - groups
5.0
27.0
31.8
36.2
0.0 20.0 40.0
Missing
5 &…
0-1
2-4
Percent
Parity
4.1
15.3
15.7
64.9
0.0 20.0 40.0 60.0 80.0
Missing
Antepartum
Intrapartum
Postpartum
Percent
Timing

14 | P a g e
Place of Death
As is shown in Figure 12, of 1010 reported maternal deaths, the majority (71.7 %) died in health
facilities: about 65.1% died at hospital and 6.6% in health centers; while about 11 % died on
the way to health facilities and 13.4 % at home.
Figure 12: - Places of death for all reported of maternal deaths, N=1010
Health Center,
67
Home,
135
Hospital, 658
On transit form
home, 111
On transit
from HF to
HF, 23
other, 4 Missing, 12

15 | P a g e
III. Causes of Maternal Death
In 2010 EFY there were 1010 maternal death review summary reports captured by the national
MDSR system. Analysis of the review report for causes of maternal death showed that 841 (83%)
were due to direct (obstetric) causes and 130 (13%) were due to indirect causes (Figure 13).
Figure 13: - Causes of maternal death from MDSR, 2010 EFY (N= 1010)
Direct Obst.
causes
83%
Indirect Obst.
causes
13%
Unkown
4%
Causes of death ,2010 EFY
Summary Findings:
• Direct causes of maternal death account for 85% of maternal deaths.
• The leading causes of maternal death were haemorrhage (41.3%), HDP
(18.6%), anemia (17.5%), obstructed/ ruptured uterus (9.7%) and
sepsis (9.3%) in 2010EFY.
• Obstetric haemorrhage persisted as the top cause of death for five years
(2006 to 2010 E.C.).
• There appears to be a slight downwards trend in hemorrhage deaths over
time.
• Delay one was cited as a contributing factor in 66.8% reports, delay two
in 37.7% and delay three in 48.6% in 2010 EFY.
• Generally, delay one factors persisted as the top contributing factors to
maternal death in five years (2006-2010 E.C.)

16 | P a g e
The leading causes of maternal death identified by the MDSR system were haemorrhage in 417
cases (41.3%), hypertensive disorders of in pregnancy (HDP) in 188 (18.6%), anemia in 177
(17.5%), obstructed/ ruptured uterus in 98 (9.7%) and sepsis in 94 (9.3%) (Table 5).
Table 5: - Direct and indirect Causes of maternal deaths from MDSR system, 2010 EFY
Causes of death Frequency Percent
Direct Obstetric causes
Hemorrhage 417 41.3
HDP 188 18.6
Prolonged/Obstructed labour
and ruptured uterus 98 9.7
Sepsis 94 9.3
Other direct causes 74 7.3
Abortion 32 3.2
Embolisim 15 1.5
Anesthesia complication 13 1.3
Indirect obstetric causes
Anemia 177 17.5
Other indirect causes 81 8.0
Malaria 20 2.0
Cardiac 17 1.7
HIV 13 1.3
TB 8 0.8
Looking at the trend in major causes of death in the last five years of MDSR implementation
(2006-2010 EFY), obstetric haemorrhage has persisted as the top cause of maternal death
accounting for 41% to 51% of maternal death review reports. In the last three years (2008-2010
EFY) hypertensive disorders in pregnancy (HDP) has also persisted as the second leading cause
of maternal death accounting for more than 18% of the deaths. Furthermore, sepsis and
obstructed labour were among the major causes of maternal death in the last five years while
anemia has continued as the third leading cause of death contributing to 18% to 20% of maternal
deaths.

17 | P a g e
Figure 14: - Trend of the major causes of maternal death from MDSR system 2006-2010 EFY
Contributing factors to Maternal Death
Contributing factors to maternal death were analysed from maternal death review summary
reports using the three-delay model of Thaddeus and Maine. Out of 1010 maternal death review
reports delay one was cited in 675 (66.8%), delay two in 381 (37.7%) and delay three in 491
(48.6%). The proportion of each of the delay factors were computed out of the total reports,
since more than one delay can contribute to the death of a mother.
Out of the maternal death review reports the main specific reasons for delay one contributing to
maternal death were lack of decision to go to health facility in 359 (35.5%), delayed referral from
home to a health facility in 318 (31.5%), failure to recognise the problem in 272 (26.9%) and
traditional practices in 153 (15.1%). Similarly, the main specific reasons for delay two were
delayed arrival to referred facility in 242 (24%) and lack of money for transport in 147 (14.6%)
of the maternal death review reports. Additionally, the predominantly reported specific delay three
factors were delayed arrival to next facility from another facility during referral in 278 (27.5%),
lack of supplies and equipment in 137 (13.6%) and delayed management after admission in 116
(11.5%) (Table 6).
51%49%
42%46%
41%
3%
7%9%
7%10%8%
13%
18% 18% 19%16%
10%8% 9% 9%
20%17%
15% 17% 18%
0%
10%
20%
30%
40%
50%
60%
2006 EFY 2007 EFY 2008 EFY 2009 EFY 2010 EFY
Hemorhage Obsttracted labour HDP Sepsis Anemia

18 | P a g e
Table 6: - Contributing factors to maternal death, 2010 EFY
Characteristics Frequency Percent
Contributing
factors
Delay One 675 66.8
Delay Two 381 37.7
Delay Three 491 48.6
Delay one
factors
Traditional Practices 153 15.1
Family poverty 66 6.5
Failure of recognition of the problem 272 26.9
Lack of decision to go to health facility 359 35.5
Delayed referral from home 318 31.5
Delay two
factors
Lack of roads 74 7.3
Delayed arrival to referred facility 242 24.0
Lack of money for transport 31 3.1
Lack of transportation 147 14.6
No facility within reasonable distance 51 5.0
Delay three
factors
Delayed arrival to next facility from another
facility on referral 278 27.5
Delayed or lacking supplies and equipment’s 137 13.6
Delayed management after admission 116 11.5
Human error or mismanagement 65 6.4
Considering trend in reported delays contributing to maternal deaths over the last five years
shows delay one to have been the top contributing factors, with 64% to 77% of maternal death
review reports documenting delay one factors. Since 2008, delay three factors have become the
second leading contributed factor (documented in 37%-49% of maternal death review reports)
to maternal death as more case reports come from facilities and willingness to report delay three
factors increases. Furthermore, more than a third of maternal death review reports have
documented delay two factors across the entire five years of MDSR implementation (Figure 15).

19 | P a g e
Figure 15: - Trend of delay factors contributing to maternal death 2006-2010 EFY
Data from verbal autopsies reflect the general trend in reported delays pictured (Figure 16).
However, those maternal death review reports generated from facility-based abstractions show
an increasing trend in delay three since 2008 EFY (documented in 47%-61% of reports) and it
became the leading delay factor in 2010 EFY (Figure 17). This signifies that health facilities were
scrutinising their own practices more carefully and using more evidence from MDSR to improve
the quality of services in their own facilities.
Figure 16: -Delay factors from verbal autopsies 2006 - 2010 EFY
74% 77%
66% 64% 67%
49%
42%
34%39% 38%35%
39% 37%43%
49%
2006 EFY 2007 EFY 2008 EFY 2009 EFY 2010 EFY
Delay One Delay two Delay three
83% 86%
70% 72% 73%
46%38%
29%
42% 39%32%
40%32% 31%
38%
2006 EFY 2007 EFY 2008 EFY 2009 EFY 2010 EFY
Delay One Delay two Delay three

20 | P a g e
Figure 17: - Delay factors from facility-based abstractions 2006-2010 EFY
82%
65%59% 57% 59%
64%
53%
43%39% 36%
64%
56%
47%
56%61%
2006 EFY 2007 EFY 2008 EFY 2009 EFY 2010 EFY
Delay One Delay two

21 | P a g e
IV. Specific Causes of Death
Obstetric Hemorrhage
Obstetric hemorrhage was the leading causes of death and it was identified as a cause of maternal
death in 417 maternal death review reports, accounting for 41.3 % of the total maternal death
review reports. The review reports revealed that majority (88.3%) of the deaths were due to
obstetric hemorrhage occurred either during child birth or within 42 days after delivery. More
than half (51.6 %) of these deaths were between 25 to 34 years of age and 55% of them occurred
in hospitals. Among the reported maternal death review a quarter of them were in their first
pregnancy and more than one third (35%) of them died from grand multipara group (who
delivered 5 or more).
Regarding place of the death due to obstetric hemorrhage in the past five years, there has been
an increasing trend for deaths to occur in hospitals, with a decline or reported deaths at home.
This is probably due to increased facility delivery and increased reporting from facilities (figure
18).
Figure 18: - Reported maternal death due to hemorrhage by place death from 2006 - 2010EFY
Summary Findings:
• Obstetric Hemorrhage was the leading cause of reported maternal deaths,
accounting for 41.3 % of all reviews, 76% of these deaths were from PPH.
• HDP was the second leading cause of reported maternal deaths, accounting for
17.6%
• 40% of deaths from HDP were in the antenatal period suggesting delay in
delivery. Delivery of the fetus is the most important component of the management
of severe HDP

22 | P a g e
The timing of death in relation to pregnancy from reviewed maternal death report due to obstetric
hemorrhage in the past five years from 2006 – 2010 EFY is not changing. Most reported maternal
deaths due to obstetric hemorrhage occurred in the postpartum period (Figure 19).
Figure 19: - Maternal death due to hemorrhage by timing of death in relation to pregnancy
2006 - 2010 EFY
0%
10%
20%
30%
40%
50%
60%
2006 2007 2008 2009 2010
Place of Death
Health Center Health Post Home
Hospital On transit On transit from HF to HF
0%
20%
40%
60%
80%
100%
2006 2007 2008 2009 2010
Timing of Death
Antepartum Intrapartum Postpartum

23 | P a g e
Hypertensive Disorder of Pregnancy (Preeclampsia/ Eclampsia)
From the reviewed maternal death reports 188 (18.6%) of them were due to pre-eclampsia and
eclampsia, which makes it the second leading cause of death. More than half (53.2%) of the
reported deceased women due to HDP were between ages 20 to 29 years. Close to half (45.7%)
of the deaths reported were in association with their first pregnancy and most of them reported
from hospital (81.4%) and during postpartum period (60.6%). However, 40% of women who
died of HDP did so prior to delivery. In cases of HDP, delivery of the fetus and placenta is a key
factor in treatment. The data therefore suggest that delivery should be expedited where possible
during severe HDP.
Among the reviewed maternal deaths due hypertensive disorder of pregnancy, most occurred
post-partum. This cause of death has increased as a proportion of all reviewed reports from 4%
in 2006 EFY to 11% in 2010 EFY.
Deaths due to hypertensive disorder of pregnancy also vary by parity. The trend over the past
five years shows that the majority of deaths occurred in primigravida’s (figure 20); a first
pregnancy is one of the risk factors for HDP.
Figure 20: -Reported maternal deaths due to HDP by parity 2006 – 2010 EFY
0%
10%
20%
30%
40%
50%
60%
2006 2007 2008 2009 2010
Pe
rce
nt
Year
Timing in relation to pregnancy
0-1 2-4 5 & above

24 | P a g e
Obstructed labor/Uterine rupture
In 2010 EFY obstructed labor/uterine rupture accounted for about 10% (98) of all reported
maternal deaths. Nearly half (46 %) were among the age group of 20-29-year. Forty three
percent of deceased mother had of 2-4 pregnancies followed by 27% multiparous and 23.0%
were their first pregnancy. Half (50%) of the deaths from obstructed labor occurred during labor
and delivery. One third (36.7%) occurred in the postpartum period. Most of the reported deaths
were from the hospital (62.2%), consistent with data from the previous years.
Sepsis
There were 94 maternal death review reports due to sepsis in 2010 EFY. The majority (57.5%)
of them occurred among 20 - 29-year-old women. Nearly one third (31%) of the reports were
associated with the first pregnancy and most (80%) of them were in the postpartum period.
Three fourth (74.5%) of the reports were coming from the hospital as it was in the past years’
trend
Anemia
As in previous years, anemia was the third most frequent cause of all maternal deaths. There
were 177 reviewed maternal death reports from anemia, primarily (63.7%) among women with
multiparous (two or more children), age group of 20-29yrs (55.4%) and during post-partum
period (66.1%). Among maternal death reports citing anemia as the cause of death, the majority
occurred in the post-partum period, showing an increasing trend from 9% in 2006 to 12% in
2010 EC.
As shown in Figure 21, the majority of the deaths were reported as occurring within hospitals
(66.7%), again reflecting both increased facility-based delivery and health seeking, and a greater
number of case-based reports coming from facilities.

25 | P a g e
Figure 21: - Reported maternal deaths due to anemia by place of death, 2010 EFY
0%
10%
20%
30%
40%
50%
60%
70%
2006 2007 2008 2009 2010
Pe
rce
nt
Reporting Fisical Year
Place of Death
Health Center Health Post Home Hospital On transit
26 | P a g e
V. Response
Responses to MDSR data should take place at all levels of the health system including the
community, all health facilities, and all administrative levels i.e. Woreda, zonal, regional and
national.
In this chapter, the national level response to MDSR in 2009-2010 will be described first, followed
by good practice examples of responses at woreda, facility and community levels. These examples
demonstrate how MDSR data are used at facility and woreda levels in conjunction with the quality
improvement programme.
National Level Response Longer term strategic plans are expected at this level to focus on key priorities.
At national level there have been the following responses to MDSR data:
1. Coordination of National MDSR Committee which met in Bishoftu in June 2010 to review
maternal death data.
2. The above meeting resulted in development of the following policy briefs, which are being
distributed to Regions and partners:
A. Strengthening data collection and quality
B. Informing MNH research Priority areas
C. Linking MDSR and QI
3. The MDSR data for 2009 were presented to Regional representatives and partners at the
Annual RMNCHA meeting in Addis Ababa in August 2009.
4. The MPDSR Technical Working Group meets regularly and involves members from EPHI,
MCH directorate, National Blood Bank Agency, PMLU/PFSA, and implementing partners.
Summary Findings:
• Taking action in response to maternal death is the primary function of the
MDSR system.
• Responses have been taken at national, regional, woreda, community and facility
levels throughout the health system.
• MDSR data can usefully contribute to the Quality Improvement process, by
identifying key problems for further investigation.

27 | P a g e
5. FMOH also established a TWG for inter-regional collaboration, with the aim of
strengthening referral systems and response to MDSR. Initially this involved Oromia and
Addis Ababa but will extend to SNNPR & Oromia and Oromia and Dire Dawa/Hareri.
6. The FMOH/MCH directorate response to Hemorrhage is being implemented as a five-year
plan and actions are being taken:
• Establishing Mini-Blood-Bank at all hospitals without MBB (procurement of
essential equipment process continuing)
• Initiation of catchment based clinical RMNCH mentorship focusing on creating
sustainable linkage between primary/general hospitals and health centers.
• National RMNCH mentorship guideline developed, training of mentors and initiation
of the program in 100 hospitals in Ethiopia for the first phase was done following
the finalization of the guideline.
• Procurement of 1500 NASG has been finalized, and the FMOH is planning to
procure more. Training package of NASG was integrated to BEMONC training
manual.
• Plan to procure 3000 ambulances, 300 now delivered and 750 ready for delivery.
• FMOH financially and technically supported advocacy workshop on MDSR program
at woreda and zonal level in all region except Addis Ababa and Amhara.
Woreda, Facility and Community Response
There are increasing examples of facilities, communities and woredas responding to MDSR data.
These are too numerous to detail in this report.
During 2009-2010, the Ethiopian Health system committed to a National Quality Improvement
(QI) programme across the entire health system. A prime focus is on maternal health care, with
the key aim of reducing the maternal mortality rate. In this year’s annual MDSR report, it was
decided to feature good examples of how MDSR and QI teams can work together to produce
demonstrable impact.
MDSR data is an excellent source of contemporaneous data, which shines a spotlight on poor
quality care. QI process ensures that responses/interventions are assessed and if successful that
the response is impactful. It must be remembered, however, that many responses to maternal
death can be successfully implemented without inclusion in QI projects. There will not be enough
capacity to subject all responses to the QI approach.
28 | P a g e
Prioritization of responses that are appropriate to the QI process is required. This is the
responsibility of the MDSR Committee. The MDSR committee must use local knowledge to identify
which interventions/ responses are most relevant to the QI process in their own context.
QI projects should not delay implementation of essential improvements e.g. availability of
emergency drugs and provision of essential equipment. If the problem recurs, however, it may
be wise to undertake a QI project to ascertain the root cause for the recurrence of the problem.
Membership of the MDSR committee should include a focal person from the QI team.
Quality Improvement Case Studies
The following examples of MDSR/QI projects were undertaken in 2010. It is noted that other
facilities have also undertaken similar interventions, and these examples were chosen because
they were of the highest quality available to the authors at the time of report writing.
The four case studies demonstrate how a problem is identified by the MDSR committee. The
problem is then examined in more detail to confirm that the issue is recurring. Interventions are
identified and implemented, and prospective data subsequently collected to assess the impact of
the interventions.
The four topics included here are
1. 1.Basic emergency care for obstetric cases prior to arrival at hospital
2. Quality of ANC care of a health centre
3. Access to blood transfusion at a primary hospital
4. Anticonvulsant treatment and monitoring of severe HDP at a Referral Hospital
Case Study 1
Improving the Basic Emergency Management for referred obstetric cases at catchment Health
Centers, Deder General Hospital, Oromia Region.
Problem: A women who had delivered her 4th baby was referred from a health center because
of PPH. On arrival at the hospital she was unconscious with unrecordable blood pressure. She
had no intravenous (IV) access and was not escorted. Resuscitation at the hospital was
unsuccessful and she died within 30 minutes of arrival.

29 | P a g e
The Hospital MDSR committee reviewed the case and identified a lack of basic emergency care
before and during referral by the referring facility. To further understand the problem, the team
reviewed records of 85 referred women from the previous five months. They found that from all
obstetric referrals, only 22 % were provided with basic care before and during referral. Basic care
comprises: documentations of vital signs, IV access, and drug treatment as indicated e.g. oxytocin
for hemorrhage, antibiotic for sepsis. The team therefore aimed to increase basic care before
referral for obstetric cases from catchment health centers to 60 % by the end of 2017.
Interventions:
1. Training provided to 16 referring health centers, including identification of early signs of
complications, revision of first-line emergency obstetric care, and emphasis on necessity
of phone communication from the health center to the hospital at the time of referral.
The training was for 1 day and was provided by the IESO from the hospital.
2. Orientation of hospital maternity staff to improve the obstetric referral system, particularly
in relation to receiving referral phone calls and giving prompt feedback to the referring
facility. This feedback was both verbal and written.
3. The feedback form was adapted to include the referring facility’s diagnosis, final diagnosis,
whether phone communication was made or not, and whether basic obstetric care given
or not before arrival.
4. The engagement and support of district health offices was obtained by leaders of the
hospital presenting the interventions at the District cabinet meeting.
Result: A total of 211 obstetric referrals were prospectively monitored. The proportion of
obstetric cases given basic care at health centers before referral increased from 25% to 74 %,
and appropriateness of cases referred to the hospital (according to national criteria for referral)
increased from 47% to 65%. (Figure 22).
In addition to the main outcome measures
• Telephone communication before referral increased from 0 to 69 %,
• Proportion of referrals with a completed referral note increased from 39% to 60 %
• Proportion of provision of timely feedback provision had increased from 22% to 78%

30 | P a g e
Figure 22: - Proportion of obstetric cases referred after basic emergency care given at health
centers
Figure 23: - Proportion of Appropriate Referral among Referred obstetric cases.
Lessons learnt and Limitations:
The interventions had significant impact on improving the referral system in this catchment area.
Training on basic emergency care and objective and timely feedback to the health center
improved health worker performance on emergency obstetric case management before and
during referrals. Unnecessary referrals also decreased, reducing the burden on the hospital.
The limitation in this quality improvement project was that while there appeared to be increased
acknowledgment of improvements across the staff, variation in the hospital midwives’ technical
capacity to give feedback remains. Written feedback was often not timely in reaching the health
center.

31 | P a g e
Case Study 2
Improving the quality of ANC service in Semen Health Center, Addis Ababa
Problem: A 22-year-old women in her first pregnancy presented to the referral Hospital
emergency room with abnormal body movements and raised blood pressure. She was treated
appropriately with Magnesium Sulphate and Nifedipine and transferred to ICU, but she died 24
hours after admission. She had had ANC at the local health center and had been seen at the
health center two days before admission with a complaint of headache. She had been given
analgesia and reassured.
The Hospital MDSR/QI team reviewed this case and noted that this mother could have been saved
if her BP was measured 3 days earlier when she visited the health center. The team identified
that the ANC follow-up in that facility was sub-optimal and provided written feedback. The
MDSR/QI team at the health center reviewed the feedback and agreed that quality ANC service
was a problem. With this in mind, the health center QI team retrospectively assessed 45 ANC
cases over a 7-week period using a random sampling technique, and assessed the quality of ANC
using the following criteria;
• Provision of oral iron tablets,
• Measurement of blood pressure,
• Counselling on danger signs
• Laboratory tests (HIV, UA, Hgb, VDRL, and RH)
The assessment found the quality of ANC service to be 73%. The MDSR QI team aimed to improve
this rate to 95% within 2 months.
Interventions:
1. One day on-site revision of focused antenatal care was given. This was based on the
national guideline and included orientation on all its relevant contents
2. National ANC job aids and protocols were posted in the ANC clinic.
3. An additional midwife was assigned to the ANC clinic
Result: After the interventions a total of 83 ANC cases were randomly selected from the ANC
clinic at weekly intervals. The results showed that there is improvement in the quality of ANC
service indicated by more than six consecutive points above the baseline median.

32 | P a g e
Figure 24: - Proportion of pregnant women who received quality ANC
Lessons Learnt and Limitations:
The QI team learned that simple and low-cost interventions as described above can lead to a
significant improvement in the quality of ANC service.
Selected components of antenatal care were chosen in this quality improvement initiative. All
components of ANC were not included (E.g. Ultrasound).
Case study 3
Improving the Management of Hypertensive Disease of pregnancy (HDP) cases in Assosa
Hospital, Benishangul gumuz Region.
Problem: A 35-year-old woman came with a referral from a refugee clinic for her neonate 7 days
after delivery, with an indication to admit to NICU. She was admitted to the maternity ward.
After two days she developed abnormal body movement with high blood pressure. She was
diagnosed with Eclampsia. She later became unconscious and developed aspiration pneumonia.
She was given a loading dose of magnesium sulphate but died following a prolonged seizure.
The hospital MDSR/QI review committee identified that there was delayed management of HDP.
The hospital QI team assessed six months’ data from 39 cases with HDP diagnoses, looking
0%
20%
40%
60%
80%
100%
120%
week 1 2 3 4 5 6 7 8 9
10
11
12
13
week 1
4
Proportion ofpregnantwomen who getQuality ANCservice
BaselineMedian
PostInterventionMedian
intervention time

33 | P a g e
particularly at administration of the correct magnesium sulphate dosage and monitoring of BP
and proteinuria. They found that only 68% of these cases were properly managed and followed
the HDP management national guideline. The QI team developed a project aiming to increase
correct follow-up and management of HDP from 68% to 100%.
Interventions:
1. Functional BP apparatus provided to maternity ward
2. All maternity ward staff oriented on HDP case management and monitoring according to
the national guideline.
3. The national HDP management protocol was posted in the ward.
4. A dedicated midwife was assigned to the ward for management and follow-up of severe
HDP cases.
5. Emergency anticonvulsant and antihypertensive medications were made available as stock
at ward level.
Result: After the interventions prospective data were collected from 90 cases diagnosed as HDP.
The outcome measures were: 1. provision of full dose of MgSo4. 2. measurement of both BP
and proteinuria. The mean provision of full dose of MgSo4 increased from 71 % to 96 %. As the
run chart below shows (Figure 25) more than six consecutive data points above the median
baseline demonstrated improvement.
Figure 25: - Proportion of HDP cases provided with full dose of MgSO4

34 | P a g e
Similarly, an improvement from a mean of 44% to 70 % in BP measurements and proteinuria
monitoring was noted although the change was not sustained, as indicated in the run chart
(Figure 26).
Figure 26: - Proportion of HDP cases with Vital sign and UA followed as per the physician
order.
Lessons Learnt and Limitations: The QI team learned that vital sign monitoring is an essential
component of good quality of care and a very cost-effective way of improving quality of care.
A limitation of this project was that the frequency and duration for urine protein and vital sign
monitoring were limited to the first 48 hours after diagnosis. This is suboptimal as HDP may take
several weeks to resolve.
Case study 4
Improving access to blood transfusion at Malka Oda General Hospital Oromia Region
Problem: A woman was referred from a health center at term in her tenth pregnancy with
antepartum bleeding. She had no ante natal care. She looked acutely sick, with a BP 100/60 and
pale conjunctiva. On vaginal examination she was fully dilated and on abdominal examination
fetal parts were palpable, but fetal heart was absent. Uterine rupture was diagnosed and it was
decided to undertake an urgent laparotomy. Three units of blood were requested. However, there
was no blood available and the Senior Obstetrician referred the patient to Hawassa Referral
Hospital (located 30 km from Shashamene). The woman died a few days after referral.
35 | P a g e
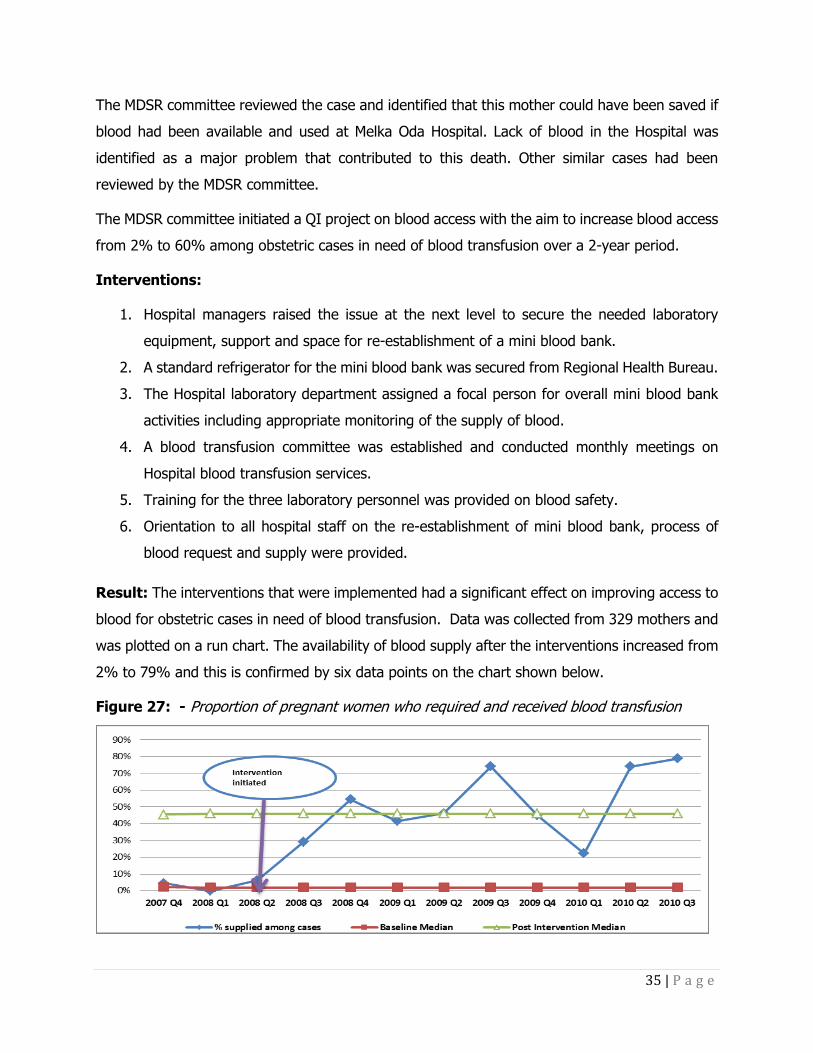
The MDSR committee reviewed the case and identified that this mother could have been saved if
blood had been available and used at Melka Oda Hospital. Lack of blood in the Hospital was
identified as a major problem that contributed to this death. Other similar cases had been
reviewed by the MDSR committee.
The MDSR committee initiated a QI project on blood access with the aim to increase blood access
from 2% to 60% among obstetric cases in need of blood transfusion over a 2-year period.
Interventions:
1. Hospital managers raised the issue at the next level to secure the needed laboratory
equipment, support and space for re-establishment of a mini blood bank.
2. A standard refrigerator for the mini blood bank was secured from Regional Health Bureau.
3. The Hospital laboratory department assigned a focal person for overall mini blood bank
activities including appropriate monitoring of the supply of blood.
4. A blood transfusion committee was established and conducted monthly meetings on
Hospital blood transfusion services.
5. Training for the three laboratory personnel was provided on blood safety.
6. Orientation to all hospital staff on the re-establishment of mini blood bank, process of
blood request and supply were provided.
Result: The interventions that were implemented had a significant effect on improving access to
blood for obstetric cases in need of blood transfusion. Data was collected from 329 mothers and
was plotted on a run chart. The availability of blood supply after the interventions increased from
2% to 79% and this is confirmed by six data points on the chart shown below.
Figure 27: - Proportion of pregnant women who required and received blood transfusion

36 | P a g e
Lessons Learnt: The MDSR review committee used the review process to identify and prioritize
problems to improve the quality of maternal health services. In this particular case, a well-
functioning mini blood bank has made a significant contribution to improving access to blood.
This directly contributes to improved maternal health outcome and decreased referrals to the
referral hospital. The role of hospital leadership is critical in establishing and maintaining properly
functioning health care services.

37 | P a g e
VI. Recommendations National & Regional Level
1. Strengthen the integrated implementation of MDSR in the National and regional PHEM
system
• Increase human resources in national and regional PHEM directorate to establish RH
surveillance case team that can regularly support, monitor and provide feedback to
all regions and zones/woredas respectively.
• Engage more stakeholders working on MCH and public health emergency in the
implementation of MDSR program
• Explore all opportunities for capacity building: such as preservice education, in-
service trainings, supportive supervision and review meetings of public health
emergencies and MCH.
• Give special emphasis to
o SNNP and Tigray to fully integrate the ongoing MDSR implementation with the
PHEM system.
o All emerging regions and silent areas of the other regions to start proper MDSR
program implementation.
2. The national MDSR taskforce should provide a focused and enhanced support in
responding to maternal deaths by targeting areas mapped as better maternal death
reporting sites in the MDSR system.
3. Make quality ANC service the theme for annual Safe Motherhood Month to emphasize
the importance of providing good information to pregnant women, particularly about
danger signs.
4. RHB should fully inform Woreda Health Offices of MDSR/QI projects and provide support
as required
Health Facility Level
5. Support all hospitals to conduct quality audit or self-assessment on the clinical
management of obstetric hemorrhage and hypertensive disorders of pregnancy (HDP)
and implement quality improvement projects on the identified gaps.
6. Strengthen and establish functional mini blood banks with a proper supply and stock
management system in all hospitals

38 | P a g e
7. Build the capacity of skilled birth attendants to request and use blood and blood product
appropriately
8. Introduce audits mechanism between hospital and their catchment health facilities to
improve emergency obstetric referrals in all zones
9. Improve postpartum care provision by implement the nationally adapted WHO’s safe child
birth checklist in all health facilities.
10. Avail and use non-pneumatic anti-shock garment (NASG) in all hospitals and health
centers in the country
11. Introduce audit mechanisms to improve the quality of ANC service at primary health care
units (health centers and health posts) in all places
12. Support better maternal death reporting sites in the MDSR system to implement the
national standards for maternity waiting homes
13. Ensure misoprostol is available at facilities for the prevention and treatment of postpartum
hemorrhage by health extension workers
14. All facilities should include a focal person from Quality Improvement programme in the
core membership of the MDSR Committee. This will ensure good communication between
those working on MDSR and Quality Improvement.