Embed Size (px)
Citation preview

National Immunization Survey
A User’s Guide for the 2015 Public-Use Data File
Centers for Disease Control and Prevention
National Center for Immunization and Respiratory Diseases
Presented by:
NORC at the University of Chicago
September 2016

Data User’s Guide for the 2015 NIS Public-Use Data File Page i
Acknowledgments
The development and production of the NIS public-use data files is a team effort that has included
contributions from many individuals (listed in alphabetical order) in the three organizations:
National Center for Immunization and Respiratory Diseases, CDC – Laurie Elam-Evans, Holly Hill,
James Singleton, Phil Smith, and Larry Wilkinson.
NORC at the University of Chicago – Ken Copeland, Nicholas Davis, Can Geng, Vicki Pineau, Benjamin
Skalland, Xian Tao, Bess Welch, Kirk Wolter, and Michael Zeddies.

Data User’s Guide for the 2015 NIS Public-Use Data File Page ii
Table of Contents
1. Introduction ........................................................................................................................................ 1
2. Sample Design .................................................................................................................................... 7 2.1. The NIS RDD Telephone Survey ............................................................................................... 7 2.2. The NIS Provider Record Check ................................................................................................ 9 2.3. Summary of Data Collection .................................................................................................... 10 2.4. Informed Consent, Security, and Confidentiality of Information ............................................. 14
3. Content of NIS Questionnaires ....................................................................................................... 15 3.1. Content of the Household Questionnaire .................................................................................. 15 3.2. Content of the Immunization History Questionnaire (IHQ) ..................................................... 18
4. Data Preparation and Processing Procedures ............................................................................... 19 4.1. Data Preparation ....................................................................................................................... 19
4.1.1. Editing in the CATI System ........................................................................................ 20 4.1.2. Post-CATI Edits .......................................................................................................... 20 4.1.3. Editing of Provider Data .............................................................................................. 21
4.2. Limitations of Data Editing Procedures.................................................................................... 22 4.3. Variable-Naming Conventions ................................................................................................. 23 4.4. Missing Value Codes ................................................................................................................ 23 4.5. Imputation for Item Non-Response .......................................................................................... 23 4.6. Vaccine-Specific Recoding of Verbatim Responses ................................................................ 25 4.7. Composite Variables ................................................................................................................. 25 4.8. Sub-Sets of the NIS Data .......................................................................................................... 28 4.9. Confidentiality and Disclosure Avoidance ............................................................................... 28
5. Quality Control and Quality Assurance Procedures .................................................................... 28
6. Sampling Weights ............................................................................................................................ 30 6.1. Base Sampling Weight ............................................................................................................. 31 6.2. Adjustments for Non-Resolution of Telephone Numbers, Screener Non-Response, and
Interview Non-Response .......................................................................................................... 32 6.3. Adjustment for Multiple Telephone Lines and Deriving Annual Weights ............................... 33 6.4. Calibration ................................................................................................................................ 34 6.5. Adjustment for Provider Non-Response ................................................................................... 36 6.6. Sampling Weights for Territories ............................................................................................. 39
7. Contents of the Public-Use Data File ............................................................................................. 41 7.1. Section 1: ID, Weight, and Flag Variables ............................................................................... 44 7.2. Section 2: Household-Reported Vaccination and Chickenpox Information ............................. 45

Data User’s Guide for the 2015 NIS Public-Use Data File Page iii
7.3. Section 3: Demographic, Socio-Economic, and Other Household/Child Information ............. 45 7.4. Section 4: Geographic Variables .............................................................................................. 47 7.5. Section 5: Number of Providers Identified and Consent Variables .......................................... 47 7.6. Section 6: Number of Responding Providers Variables ........................................................... 47 7.7. Section 7: Characteristics of Providers Variables ..................................................................... 47 7.8. Section 8: Provider-Reported Up-To-Date Vaccination Variables .......................................... 49
7.8.1. Hib Up-To-Date Variables .......................................................................................... 51 7.8.2. Rotavirus Up-To-Date Variables ................................................................................. 55
7.9. Section 9: Provider-Reported Age-At-Vaccination Variables .................................................. 56 7.10. Section 10: Health Insurance Module Variables ...................................................................... 57
8. Analytic and Reporting Guidelines ................................................................................................ 60 8.1. Use of NIS Sampling Weights .................................................................................................. 60 8.2. Estimation and Analysis ........................................................................................................... 62
8.2.1. Estimating Vaccination Coverage Rates ..................................................................... 62 8.2.2. Estimating Standard Errors of Vaccination Coverage Rates ....................................... 63
8.3. Combining Multiple Years of NIS Data ................................................................................... 63 8.3.1. Estimation of Multi-Year Means ................................................................................. 63 8.3.2. Estimation of Multi-Year Contrasts ............................................................................. 67
9. Summary Tables .............................................................................................................................. 72
10. Assessment of Total Survey Error.................................................................................................. 73
11. Limitations ........................................................................................................................................ 76
12. Citations for NIS Data ..................................................................................................................... 77
13. References ......................................................................................................................................... 82

Data User’s Guide for the 2015 NIS Public-Use Data File Page iv
Appendices Appendix A: Glossary of Abbreviations and Terms ................................................................................... 85
Appendix B: Summary Statistics for Sampling Weights by Estimation Area ............................................ 88
Appendix C: Flags for Inconsistent Values in the Breastfeeding Data ....................................................... 92
Appendix D: Programs for Estimation: Examples of the Use of SUDAAN, SAS, and R to Estimate Vaccination Coverage Rates and Their Standard Errors, and an Example of the Production of a Cross-Tabulation and Chart ................................................................................................................................... 93
Appendix E: Alphabetical Listing of Variables that are in the 2004-2015 Public-Use Data Files ........... 126
Appendix F: Summary Tables .................................................................................................................. 164
Appendix G: Trends in NIS Response Rates and Vaccination Coverage Rates, 1995-2015 .................... 173
Appendix H: Vaccine Type Codes ............................................................................................................ 180
Appendix I: Key NIS Response Rates by Area ........................................................................................ 181

Data User’s Guide for the 2015 NIS Public-Use Data File Page v
List of Tables and Figures
Table 1: Selected Operational Results of Q1/2015-Q4/2015 NIS Data Collection (Excluding territories) ............................................................................................................................... 13
Table 2: Content of the Household Interview, National Immunization Survey, 2015 ......................... 16 Table 3: Distribution of Age (in Days) at the Birth Dose of Hepatitis B Vaccine, National
Immunization Survey, 2015 ................................................................................................... 25 Table 4: Weighted Distribution of Children by Race/Ethnicity and Corresponding Combined Vaccine
Series 4:3:1:3*:3:1:4, Pneumococcal, and Varicella Vaccination Coverage Estimates, National Immunization Survey, 2015 .................................................................................... 27
Table 5: NIS Variables Commonly Used in Analyses or for Published Estimates .............................. 42 Table 6: Vaccine Categories and Vaccine Types, National Immunization Survey, 2015 .................... 52 Table 7: Up-To-Date Variables for Hib, National Immunization Survey, 2009-2015 ......................... 54 Table 8: Up-To-Date Variables for Vaccine Series Including Hib, National Immunization Survey,
2009-2015 .............................................................................................................................. 55 Figure 1: Question Flow for the Eight Health Insurance Questions Used to Create the Health Insurance
Variables Included in the PUF ............................................................................................... 59 Table 9: Summary of Weights and Stratum Variables, National Immunization Survey, 2015 ............ 61 Table 10: Cross-Walk Between ITRUEIAP, ESTIAP, ESTIAP06-ESTIAP15, and Common
Denominator Estimation Area (CDIAP), National Immunization Survey, 2015 ................... 68 Figure 2: Comparison of Estimated Mean Total Error for 4:3:1:3:3:1 Series, ≥1 MMR, and ≥4 DTaP
by Survey Year, National Immunization Survey, 2009-2012 ................................................ 74 Figure 3: Comparison of Estimated Mean Total Error for 4:3:1:3:3:1 Series, ≥1 MMR, and ≥4 DTaP,
Excluding and Including the Under-Reporting Error Component, National Immunization Survey, 2012 .......................................................................................................................... 75
Table B.1: Distribution of Dual-Frame Sampling Weights for Children with Completed Household Interviews, National Immunization Survey, 2015 ................................................................. 88
Table B.2: Distribution of Dual-Frame Sampling Weights for Children with Adequate Provider Data, National Immunization Survey, 2015 .................................................................................... 90
Table E.1 Alphabetical Listing of Variables that are in the 2004-2015 Public-Use Data Files ........... 126 Table F.1: Estimated Population Totals and Sample Sizes of Children 19-35 Months of Age by State
and Estimation Area, National Immunization Survey, 2015 ............................................... 164 Table F.2: Estimated Population Totals and Sample Sizes for Age Group by Maternal Education,
National Immunization Survey, 2015 .................................................................................. 166 Table F.3: Estimated Population Totals and Sample Sizes for Age Group by Poverty Status, National
Immunization Survey, 2015 ................................................................................................. 167 Table F.4: Estimated Population Totals and Sample Sizes for Race/Ethnicity by Poverty Status,
National Immunization Survey, 2015 .................................................................................. 168 Table F.5: Estimated Population Totals and Sample Sizes for Age Group by Race/Ethnicity, National
Immunization Survey, 2015 ................................................................................................. 169 Table F.6: Estimated Population Totals and Sample Sizes for Age Group by Gender, National
Immunization Survey, 2015 ................................................................................................. 170 Table F.7: Estimated Vaccination Coverage with Individual Vaccines and Selected Vaccination Series
Among Children 19-35 Months of Age by State and Estimation Area, National Immunization Survey Q1/2015-Q4/2015 ............................................................................. 171

Data User’s Guide for the 2015 NIS Public-Use Data File Page vi
Table G.1: Key Indicators from Landline Sample Household and Provider Data Collection by Survey Year, National Immunization Survey, 1995-2015 ............................................................... 173
Figure G.1: Trends in Landline Sample Key Indicators from Household and Provider Data Collection by Survey Year, National Immunization Survey, 1995-2015 ................................................... 174
Table G.2: Key Indicators from Cell-Phone Sample Household and Provider Data Collection by Survey Year, National Immunization Survey, 2011-2015 ............................................................... 175
Figure G.2: Trends in Cell-Phone Sample Key Indicators from Household and Provider Data Collection by Survey Year, National Immunization Survey, 2011-2015 .............................................. 175
Table G.3: CASRO Response Rate for the Combined Landline and Cell-Phone Samples by Survey Year, National Immunization Survey, 2011-2015 ............................................................... 177
Figure G.3: Trend in CASRO Response Rate for the Combined Landline and Cell-Phone Samples by Survey Year, National Immunization Survey, 2011-2015 ................................................... 177
Table G.4: Vaccine-Specific Coverage Levels Among Children Age 19-35 Months in the United States by Survey Year, National Immunization Survey, 1995-2015 .............................................. 178
Figure G.4: Trends in Vaccine-Specific Coverage Levels among Children 19-35 Months of Age in the United States by Survey Year, National Immunization Survey, 1995-2015 ........................ 179
Table H.1: 2015 NIS Vaccine Type Codes ............................................................................................ 180 Table I.1: Key Indicators for the Landline Sample by Estimation Area, National Immunization Survey,
2015 ...................................................................................................................................... 181 Table I.2: Key Indicators for the Cell-Phone Sample by Estimation Area, National Immunization
Survey, 2015 ........................................................................................................................ 183 Table I.3: CASRO Response Rate for the Combined Landline and Cell-Phone Samples by Estimation
Area, National Immunization Survey, 2015 ........................................................................ 185

Data User’s Guide for the 2015 NIS Public-Use Data File Page vii
Convention for Bolding Text
The Data User’s Guide uses bold font to highlight substantive changes in the methodology or study design from last year’s Guide.

Data User’s Guide for the 2015 NIS Public-Use Data File Page viii
This page intentionally blank.
Data User’s Guide for the 2015 NIS Public-Use Data File Page 1
1. Introduction
In 1992, the Childhood Immunization Initiative (CII) (CDC 1994) was established to 1) improve the
delivery of vaccines to children; 2) reduce the cost of vaccines for parents; 3) enhance awareness,
partnerships, and community participation; 4) improve vaccinations and their use; and 5) monitor
vaccination coverage and occurrences of disease. Subsequently, the Healthy People 2020 objectives
established the targets of having at least 90% of 2-year-old children fully vaccinated with most
recommended vaccines (targets are 85% for HepA and the birth dose of HepB, and 80% for rotavirus) and
80% of 2-year-old children vaccinated with the basic immunization series. To fulfill the CII mandate of
monitoring vaccination coverage and marking progress toward achieving those objectives, the National
Immunization Survey (NIS) has been implemented by the National Center for Immunization and
Respiratory Diseases (NCIRD) and the National Center for Health Statistics (NCHS) of the Centers for
Disease Control and Prevention (CDC) since 1994.
The target population for the NIS is children aged 19 through 35 months living in households in the
United States at the time of the interview. The official coverage estimates reported from the NIS are rates
of being up-to-date with respect to the requisite numbers of doses of all recommended vaccines
(Robinson 2016). These vaccines and their recommended numbers of doses are:
● diphtheria and tetanus toxoids and acellular pertussis vaccine, diphtheria and tetanus toxoids and
pertussis vaccine, or diphtheria and tetanus toxoids vaccine (DTaP/DTP/DT) – 4 doses;
● poliovirus vaccine (polio) – 3 doses;
● measles, mumps, and rubella vaccine (MMR) – 1 dose;
● Haemophilus influenzae type b vaccine (Hib) – 3 or 4 doses depending on product type;
● hepatitis B vaccine (Hep B) – 3 doses;
● varicella zoster (chicken pox) vaccine (varicella) – 1 dose;

Data User’s Guide for the 2015 NIS Public-Use Data File Page 2
● pneumococcal conjugate vaccine (PCV) – 4 or 5 doses depending on vaccine type; (Infants and
children who have received ≥1 dose of PCV7 should complete the immunization series with
PCV13. A single supplemental dose of PCV13 is recommended for all children aged 14-59
months who have received 4 doses of PCV7 or another age-appropriate, complete PCV7
schedule.)
● hepatitis A vaccine (Hep A) – 2 doses;
● influenza vaccine; (For the recommended number of doses of influenza vaccine and other
vaccines, see http://www.cdc.gov/vaccines/hcp/acip-recs/vacc-specific/index.html.)
● rotavirus vaccine (RV) – 2 or 3 doses depending on product type.
In addition to these vaccines, interest focuses on the combined vaccine series 4:3:1:3*:3:1:4 (4+
DTaP/DTP/DT; 3+ polio; 1+ measles-containing vaccine (MCV); full series Hib, i.e., 3 or 4 doses
depending on type of vaccine received; 3+ Hep B; 1+ varicella at or after 12 months of age; and 4+ PCV).
The NIS collects data on each of these vaccines. Varicella vaccine was added in Quarter 3, 1996,
pneumococcal conjugate vaccine in Quarter 4, 2000, influenza vaccine and hepatitis A vaccine in Quarter
1, 2003, and rotavirus vaccine in Quarter 3, 2007. The remainder of the vaccines have been included in
the NIS from its start in 1994. In October 2000, the Advisory Committee on Immunization Practices
recommended that all children aged 2 to 23 months receive 4 doses of pneumococcal conjugate vaccine
(CDC 2000). Influenza vaccine was recommended for children aged 6 to 23 months starting with the
2004-05 season (CDC 2003) and for all children ≥ 6 months starting in 2010.
The NIS uses random digit dialing (RDD) telephone survey methodology to identify households
containing children in the target age range, and interviews are conducted with the adult who is most
knowledgeable about the child’s vaccinations. With consent of the child’s parent or guardian, the NIS
also contacts (by mail) the child’s health care provider(s) to request information on vaccinations from the

Data User’s Guide for the 2015 NIS Public-Use Data File Page 3
child’s medical records. Since 2005, NIS sampling, data collection, and weighting operations have been
conducted by NORC at the University of Chicago.
Samples of telephone numbers are drawn independently, for each calendar quarter, within selected
geographical areas, or strata. In 2015, there are 61 geographic strata for which vaccination coverage
levels can be estimated (see Table F.1), including 7 local areas; the remaining 54 estimation areas
are either an entire state, the District of Columbia, a territory (the U.S. Virgin Islands, Guam, and
Puerto Rico), or a “rest of state” area. For states with “rest of state” or local estimation areas, we
can also produce estimates for the whole-state area. This design makes it possible to produce
annual estimates of vaccination coverage levels for each state or territory, each “rest of state” area,
the District of Columbia, and for each of the 7 local estimation areas with a specified degree of
precision (a coefficient of variation of approximately 7.5%). Further, by using the same data collection
methodology and survey instruments in all estimation areas, the NIS produces comparable vaccination
coverage levels among estimation areas and over time.
Data for the U.S. Virgin Islands and Guam are not included in the 2015 public-use data file to
protect respondent confidentiality, as the sampling fractions were large in these small-population
areas. Interested researchers can access data for the U.S. Virgin Islands and Guam by submitting a
proposal and working through the NCHS Research Data Center. The link and guidelines for
developing a proposal are located at the following URL: www.cdc.gov/rdc.
When the NIS was established in 1994, 78 areas were chosen for sampling strata, including the 50 states,
6 urban areas that receive federal Section 317 immunization grants (Bexar County, TX; Chicago, IL;
District of Columbia; Houston, TX; New York City; Philadelphia County, PA), and 22 other urban areas.
These areas were called “Immunization Action Plan” (IAP) areas in reference to plans developed to
improve vaccination coverage following the resurgence of measles during 1989-1991. In 2005 and 2006,
selected non-grantee IAP areas were “rotated off” (i.e., sample design no longer ensured adequate sample

Data User’s Guide for the 2015 NIS Public-Use Data File Page 4
size to produce estimates for the area), and replaced by new areas “rotated on” (i.e., sample design
ensured adequate sample size to produce estimates for the area). Starting in 2007, the base NIS
geographic strata included 56 areas (6 grantee urban areas and 50 state or “rest of state” areas). In
addition, starting in 2007, state immunization programs could choose city/county areas of interest to have
sample design that ensured adequate sample size to produce estimates for the area, using their grant funds.
In 2015, two additional area were chosen: El Paso County, TX, and Hidalgo County, TX. NIS data
were also collected in the U.S. Virgin Islands, Guam, and Puerto Rico in 2015; as noted throughout
this report, several of the sampling, data collection, and estimation procedures differed for these
territories when compared to the rest of the United States, including the creation of separate survey
weight variables for analysis that is to include territories.
The 61 = 56 + 2 + 3 (territories) areas are called estimation areas. Table 10 in Section 8 shows a cross-
walk of estimation areas between years.
To maintain consistency with past NIS public-use data files, or PUFs, variable names and descriptions
continue to use the term “IAP” to designate areas included as strata, which was the term used prior to
2008. The changing geographic strata over time will not cause a problem with bias in estimation of state
and national coverage levels since the geographic strata are nested within state.
In 2015, the NIS utilized a dual-frame sampling design with independent samples drawn from landline
and cell-phone sampling frames. The cell-phone component was added to the survey in 2011 in order to
address the rapid rise of cell-phone-only households. Preliminary results from the July-December
2015 National Health Interview Survey (NHIS) indicate that the number of households with only
cell phones continues to increase. Approximately 57.7% of all children under 18 years of age—over
42 million children—live in households with access to only wireless telephones (Blumberg and Luke
2016). Several of the sampling, data collection, and estimation procedures differ for the cell-phone
sample as compared to the landline sample, as noted throughout this report.

Data User’s Guide for the 2015 NIS Public-Use Data File Page 5
For the 2015 NIS landline sample, the household interviews began on January 26, 2015 and ended
on February 14, 2016. For the 2015 NIS cell phone sample, the household interviews began on
January 26, 2015 and ended on February 15, 2016. Provider data collection extended from
February 2015 to April 2016 for both sample sources. A total sample (including sample from
territories) of approximately 14.5 million telephone numbers (6.3 million landline and 8.2 million
cell-phone) yielded household interviews for 28,639 children (4,873 landline and 23,766 cell-phone),
16,000 of whom (2,898 landline and 13,102 cell-phone) had adequate provider data (provider-
reported vaccination data adequate to determine whether the child was up-to-date with respect to
the recommended immunization schedule). The 2015 NIS public-use data file (which does not
include data for the U.S. Virgin Islands and Guam) contains data for the 27,592 children with
completed household interviews, and more extensive data (e.g. provider-reported vaccinations and
facility data) for the 15,391 children with adequate provider data (including 180 unvaccinated
children).
In 2012, to reduce the length of the household interview, decrease respondent burden, and potentially
improve response rates, the NIS household questionnaire was modified. Official NIS vaccination rate
estimates are based on the provider-reported vaccination histories for each child. Among children with
data received from vaccination providers identified in the household interview, it must be determined
which children have “adequate provider data,” that is, which children have provider data adequate to
determine whether the child is up to date with respect to the recommended immunization schedule.
Beginning in 2012, questions that were previously used to define adequate provider data were no longer
available. With this questionnaire change, it was no longer possible to use the same definition of adequate
provider data as was used prior to 2012, and so beginning in 2012 all children with any provider-reported
vaccination data are considered to have adequate provider data. See the user’s guide for the 2014 NIS
public-use data file (NCHS 2015) for more detail about this change and its impact.

Data User’s Guide for the 2015 NIS Public-Use Data File Page 6
The weights included in this public-use data file afford the data analyst the capability of conducting
several different types of analyses, depending on interests and aims. One can choose to analyze all
children with completed household interviews or only the subset of children for whom the provider-
reported data are adequate. Also, one can choose to include or exclude children who reside in territories in
the analysis. Previous NIS public-use data files have also provided analysts with these capabilities.
The 2015 NIS public-use data file includes only dual-frame weights. Dual-frame estimates are the best
estimates for the NIS in terms of minimizing any bias due to the incompleteness of the landline sampling
frame. Section 6 of this user’s guide provides information about the creation of the weight variables
included in the 2015 NIS public-use data file, and Section 8 provides guidance for their use.
Published tables of vaccination coverage estimates for 2015 will be available on the National Center for
Immunization and Respiratory Diseases website, http://www.cdc.gov/vaccines/imz-
managers/coverage/nis/child/index.html. An article summarizing key findings from the NIS data, as
published in the Morbidity and Mortality Weekly Report (MMWR), will also be available on this website.
The accompanying codebook (NCIRD 2016) documents the contents of the 2015 NIS public-use data file.
For reference, Appendix E (Alphabetical Listing of Variables in the 2004-2015 Public-Use Data Files)
provides a full list of variables in the 2015 and previous NIS public-use data files.
Additional information on the NIS is available at: http://www.cdc.gov/vaccines/imz-
managers/nis/about.html.
For additional information on the NIS public-use data file, please contact the NCIRD Information
Dissemination Staff:
Information Dissemination Staff, NCIRD
1600 Clifton Road
Atlanta, GA 30333
E-mail: [email protected]
Internet: http://www.cdc.gov/vaccines/nis

Data User’s Guide for the 2015 NIS Public-Use Data File Page 7
2. Sample Design
The NIS uses two phases of data collection to obtain vaccination information for a large national
probability sample of young children: an RDD telephone survey designed to identify households with
children 19 through 35 months of age, followed by the Provider Record Check, a mailed survey to
children’s vaccination providers. This section summarizes these two phases of data collection. Other
descriptions of the sample design are given by Ezzati-Rice et al. (1995), Zell et al. (2000), and Smith et al.
(2001a, 2005).
2.1. The NIS RDD Telephone Survey The NIS RDD telephone survey phase uses independent, quarterly samples of telephone numbers.
Sampling frames were provided by Marketing Systems Group (MSG). Landline telephone and cell-phone
numbers were sampled within estimation areas in each quarter of 2015. Table F.1 (in Appendix F) lists
the 61 estimation areas for the 2015 NIS by state and shows the estimated number of children living
in each state and estimation area in 2015.
The NIS uses the list-assisted method of RDD (Lepkowski 1988) to sample landline telephone numbers.
This method selects a random sample of telephone numbers from “banks” of 100 consecutive telephone
numbers (e.g., 773-256-0000 to 773-256-0099) that contain at least one directory-listed residential
telephone number. Because directory listings are not available for cell phones, the NIS cell-phone sample
did not use the list-assisted method of RDD, but rather used RDD without list-assistance. That is, the cell-
phone sample was selected from all banks of cell-phone numbers, not just those containing at least one
directory-listed residential telephone number. Directory listings were also unavailable for landline
sample in the U.S. Virgin Islands, Guam, and Puerto Rico, so the landline and cell-phone samples
for these areas were selected without list-assistance using simple random sampling.
The target sample size of completed telephone interviews in each estimation area is designed to achieve
an approximately equal coefficient of variation of 7.5% for an estimator of vaccination coverage derived

Data User’s Guide for the 2015 NIS Public-Use Data File Page 8
from provider-reported vaccination histories, given a true coverage parameter of 50%. Landline telephone
and cell-phone sample sizes were chosen such that the two samples combined meet the target coefficient
of variation of 7.5%.
In 2015, including the U.S. territory samples, 55.9% of children (59.5% of landline sample children
and 55.1% of cell-phone sample children) with a completed household interview were determined
to have adequate provider data. Excluding territories, this proportion was 56.2% (59.7% for the
landline sample and 55.5% for the cell-phone sample). The percentage of children with adequate
provider data varies among the non-territory estimation areas (from 48.8% in New Jersey to 68.9%
in Hidalgo County, TX). Among the U.S. territories, the percentages were 56.4% in the U.S. Virgin
Islands, 60.4% in Guam, and 36.3% in Puerto Rico. The phrase “adequate provider data” means that
sufficient vaccination history information was obtained from the provider(s) to determine whether the
child is up-to-date with respect to the recommended vaccination schedule. Starting with the 2002 NIS
public-use data file, the definition of children with adequate provider data was expanded to include
unvaccinated children. These are children for whom either (1) the respondent reported during the
household interview that the child had received no vaccinations and has no providers, or (2) the
respondent reported during the household interview that the child had received no vaccinations but has
one or more providers, and those providers all reported administering no vaccinations. An NCHS Series 2
Report on the statistical methodology of the NIS (Smith et al. 2005) includes details of how unvaccinated
children are included in the estimates of vaccine coverage. This report can be viewed at
http://www.cdc.gov/nchs/data/series/sr_02/sr02_138.pdf. This modification to the NIS produces only
small changes in vaccination coverage for estimation areas and states, because the number of
unvaccinated children in the sample is very small (only 186 in 2015). As described in the introduction, the
definition of adequate provider was modified in 2012 to include all children with provider-reported
vaccination data, plus unvaccinated children.

Data User’s Guide for the 2015 NIS Public-Use Data File Page 9
The design and implementation of the NIS landline sample involves four procedures. First, statistical
models predict the number of sample telephone numbers needed in each estimation area to meet the target
precision requirements. Second, the sample for an estimation area is divided into random sub-samples
called replicates. By releasing replicates as needed, it is possible to spread the interviews for each
sampling area evenly across the entire calendar quarter. Third, an automated procedure eliminates a
portion of the non-working and non-residential telephone numbers, plus numbers on the NIS do-not-call
list, from the sample before the interviewers dial them. Fourth, the sample telephone numbers are
matched against a national database of residential telephone numbers in order to obtain usable mailing
addresses for as many sample households as possible. To promote participation in the NIS, an advance
letter is sent to these addresses approximately two weeks prior to calling to conduct the household
interview.
The design and implementation of the cell-phone sample differs from that of the landline sample in two
ways:
● Prior to 2014, there was no process to remove non-working and non-residential cell-phone
numbers before dialing them. Beginning in 2014 and continuing in 2015, an automated process
was implemented to remove cell-phone numbers flagged as having no recent activity and that
were therefore very likely to be non-working cell phones.
● Cell-phone numbers were not matched to an external database to obtain mailing addresses. Cell-
phone sample cases were not sent advance letters.
2.2. The NIS Provider Record Check At the end of the household interview, consent to contact the child’s vaccination provider(s) is requested
from the parent/guardian. When oral consent is obtained, each provider is mailed an immunization history
questionnaire. This mail survey portion of the NIS is the Provider Record Check (PRC). The Provider
Record Check is conducted in the same manner for both landline and cell-phone sample cases.

Data User’s Guide for the 2015 NIS Public-Use Data File Page 10
The instructions ask vaccination providers to mail or fax the immunization history questionnaire back
upon completion. Two weeks after the initial mailing, a telephone call is made to providers who have still
not responded, to remind and encourage them to complete the form and either mail or fax the information
back. In some instances, provider-reported vaccination histories are completed over the telephone. The
data from the questionnaires are edited, entered, cleaned, and merged with the household information
from the RDD survey to produce a child level record.
2.3. Summary of Data Collection Table 1 presents selected operational results of NIS data collection for calendar year 2015. To facilitate
comparisons with prior years, the numbers in Table 1 are presented separately for the landline and cell-
phone samples, and exclude the U.S. territory samples. Children aged 19 through 35 months during
2015 data collection were born between January 2012 and May 2014.
The landline RDD sample (in replicates that were released for use) consisted of 5,990,464 telephone
numbers. Of those, 3,483,747 were eliminated before release to the telephone centers by the
automated procedure as non-working numbers, non-residential numbers, or numbers on the NIS
do-not-call list. The remaining 2,506,717 numbers were sent to the telephone centers to be dialed,
and 458,086 households were identified, as shown in Rows C and F. Among the identified
households, 412,023 (89.9%) were successfully screened. Of these, 5,462 (1.3%) contained one or
more age-eligible children. Among these households, 4,387 (80.3%) completed the household
interview.
The cell-phone sample (in replicates that were released for use) consisted of 7,867,079 telephone
numbers. Of those, 1,994,640 were eliminated before release to the telephone centers by the
automated procedure as inactive cell phones or numbers on the NIS do-not-call list. The remaining
5,872,439 numbers were sent to the telephone centers to be dialed, and 1,143,468 active personal
cell-phone numbers (APCNs) were identified, as shown in Row F. Among the identified APCNs,

Data User’s Guide for the 2015 NIS Public-Use Data File Page 11
906,520 (79.3%) were successfully screened. Of these, 30,246 (3.3%) were deemed eligible for the
NIS interview. Among the identified eligible respondents, 21,838 (72.2%) completed the interview.
A standard approach for measuring response rates in telephone surveys has been defined by the Council
of American Survey Research Organizations (CASRO 1982). The CASRO response rate is equivalent to
“RR3” of AAPOR Standard Definitions (AAPOR 2015). In 2015, the CASRO response rate (Row J,
Table 1) for the landline sample was 59.1%. The CASRO response rate equals the product of the
resolution rate (81.9%, Row E), the screening completion rate (89.9%, Row G), and the interview
completion rate among eligible households (80.3%, Row I). The resolution rate is the percentage of the
total telephone numbers selected that are classifiable as non-working, non-residential, or residential. The
screening completion rate is the percentage of known households that are successfully screened for the
presence of age-eligible children. The interview completion rate is the percentage of households with one
or more age-eligible children who complete the household interview.
The CASRO response rate (Row J) for the cell-phone sample in 2015 was 32.2%. As with the
landline sample, it equals the product of the resolution rate (56.3%, Row E), the screening
completion rate (79.3%, Row G), and the interview completion rate among eligible households
(72.2%, Row I).
The CASRO response rate (Row J) for the combined landline and cell-phone sample was 34.9% in
2015. See footnote 6 of Table 1 for a description of the calculation of the combined CASRO
response rate.
Row K of Table 1 shows that household interviews were completed on behalf of 4,522 age-eligible
children in the landline sample and 22,453 children in the cell-phone sample. Rows L through O
give results for the Provider Record Check phase. Specifically, Row L gives the rate of obtaining
oral consent from household respondents to contact their children’s vaccination providers – 67.0%
for landline sample cases and 63.4% for cell-phone sample cases in 2015.

Data User’s Guide for the 2015 NIS Public-Use Data File Page 12
The number of immunization history questionnaires mailed to vaccination providers exceeds the number
of completed interviews for children with consent because some children have more than one vaccination
provider. Of the questionnaires mailed to providers of children from the landline sample, 3,489
(94.7%, Row N) were returned. Among the children with completed household interviews, 2,700
(59.7%, Row O) had adequate vaccination histories based on provider reporting (2,671) or were
determined to be unvaccinated (29). The other 40.3% of children lacked adequate provider data for
a variety of reasons, such as the parent did not give consent to contact the child’s provider(s), the
provider(s) did not have records for the child, or the provider(s) did not report the vaccination
history.
Of the questionnaires mailed to providers of children from the cell-phone sample, 16,653 (94.4%,
Row N) were returned. Among the cell-phone sample children with completed household
interviews, 12,467 (55.5%, Row O) had adequate vaccination histories based on provider reporting
(12,318) or had no vaccinations based on household reporting (149). The other 44.5% of children
lacked adequate provider data for a variety of reasons, such as the parent did not give consent to
contact the child’s provider(s), or the provider(s) did not have medical records for the child.
In 2015, data from the Health Insurance Module (HIM) were collected. Among the 4,522 children
in the landline sample with completed household interviews, 3,149 (69.6%, Row P) completed the
HIM. Among the 22,453 children in the cell-phone sample with completed household interviews,
14,620 (65.1%, Row P) completed the HIM.
For each estimation area and each state, Table F.1 (see Appendix F) shows the number of children with
completed household interviews and the number of children with adequate provider data.

Data User’s Guide for the 2015 NIS Public-Use Data File Page 13
Table 1: Selected Operational Results of Q1/2015-Q4/2015 NIS Data Collection (Excluding territories)
Row Key Indicator Landline Sample Cell-Phone Sample Combined Samples Formula
Number Percent Number Percent Number Percent
Household Phase
A Total Selected Telephone Numbers in Released Replicates
5,990,464 -- 7,867,079 -- 13,857,543 --
B Phone Numbers Resolved before Computer-Assisted Telephone Interviewing
3,483,747 58.2% 1,994,640 25.4% 5,478,387 39.5% B/A
C Total Phone Numbers Released to Telephone Centers
2,506,717 -- 5,872,439 -- 8,379,156 A-B
D Advance Letters Mailed 986,263 39.3% 0 0.0% 986,263 11.8% D/C
E Resolved Phone Numbers1 – Resolution Rate 4,904,614 81.9% 4,430,414 56.3% 9,335,028 67.4% E/A
F Households Identified – WRN/APCN Rate2 458,086 9.3% 1,143,468 25.8% 1,601,554 17.2% F/E
G Households Successfully Screened3 – Screener Completion Rate
412,023 89.9% 906,520 79.3% 1,318,543 82.3% G/F
H Eligible Households – Eligibility Rate4 5,462 1.3% 30,246 3.3% 35,708 2.7% H/G
I Households with Completed Household Interviews – Interview Completion Rate
4,387 80.3% 21,838 72.2% 26,225 73.4% I/H
J CASRO Response Rate5 -- 59.1% -- 32.2% 34.9% E*G*I6
K Age-Eligible Children with Completed Household Interviews7
4,522 -- 22,453 -- 26,975 --
Provider Phase
L Children with Consent to Contact Vaccination Providers
3,028 67.0% 14,243 63.4% 17,271 64.0% L/K
M Immunization History Questionnaires Mailed to Providers
3,685 -- 17,636 -- 21,321 --
N Immunization History Questionnaires Returned from Providers
3,489 94.7% 16,653 94.4% 20,142 94.5% N/M
O Children with Adequate Provider Data
2,700 (includes 29
unvaccinated children)
59.7%
12,467 (includes
149 unvaccinated
children)
55.5%
15,167 (includes
178 unvaccinated
children)
56.2% O/K
Modules
P
Age-Eligible Children with Completed Household Interview and Completed Health Insurance Module
3,149 69.6% 14,620 65.1% 17,769 65.9% P/K
1 Includes phone numbers resolved before CATI (Row 2).
Data User’s Guide for the 2015 NIS Public-Use Data File Page 14
2 For the landline sample, this is the working residential number (WRN) rate; for the cell-phone sample, it is the active personal cell-phone number (APCN) rate. 3 For the landline sample, this is the age-eligibility screener; for the cell-phone sample, it is a combination of the screener for non-minor-only cell phone status and the age-eligibility screener. 4 For the landline sample, this is the age-eligibility rate; for the cell-phone sample, it reflects a combination of the non-minor-only cell-phone rate and the age-eligibility rate. 5 CASRO, Council of American Survey Research Organizations. 6 The response rate is the number of households with a completed household interview divided by the estimated number of eligible households in the sample. Within each sample type (landline or cell phone), the number of eligible households was estimated using the CASRO assumptions; these assumptions are that the rate of households among the unresolved telephone numbers is the same as the observed rate of households among the resolved telephone numbers, and the rate of eligible households among unscreened households is the same as the observed rate of eligible households among screened households. Under these assumptions, within each sample type the CASRO response rate is equal to the product of the resolution rate, the screener completion rate, and the interview completion rate. For the combined samples, we have defined the CASRO response rate as the total number of households with a completed interview divided by the estimated total number of eligible households across both sample types, where the estimated total number of eligible households is equal to the sum of the estimated number of eligible households in the landline sample (using CASRO assumptions) and the estimated number of eligible households in the cell-phone sample (using CASRO assumptions). 7 Rows K-P reflect the removal of children with an ineligible best date of birth.
2.4. Informed Consent, Security, and Confidentiality of Information The advance letter, introduction to the telephone survey, and oral consent assure the respondent of the
confidentiality of his/her responses and the voluntary nature of the survey. Informed consent is obtained
from the person in the household most knowledgeable about the eligible child’s vaccination history
(generally the parent or guardian of the child). Informed consent to contact the child’s vaccination
provider(s) is obtained at the end of the interview.
Information in the NIS is collected and processed under high security. To ensure privacy of the
respondents and confidentiality of sensitive information, NCHS and NCIRD have established standards
for release of data from this survey. All CDC staff and contractor staff involved with the NIS sign the
NCHS and NCIRD confidentiality agreement and follow instructions to prevent disclosure.
All information in the NIS is collected under strict confidentiality and can be used only for research
[Section 308(d) of the Public Health Service Act, 42 U.S. Code 242m(d) and the Privacy Act of 1974 (5
U.S. Code 552a)]. Prior to public release, the contents of the public-use data file go through extensive
review by the NCHS Disclosure Review Board to protect participant privacy as well as data
confidentiality.

Data User’s Guide for the 2015 NIS Public-Use Data File Page 15
3. Content of NIS Questionnaires
This section describes the questionnaires used in the 2015 NIS telephone interview of households and in
the NIS Provider Record Check.
3.1. Content of the Household Questionnaire The computer-assisted telephone interview (CATI) questionnaire used in the RDD phase of NIS data
collection consists of two parts: a screener to identify households with children aged 19 through 35
months and an interview portion. The questionnaire is modeled on the Immunization Supplement to the
National Health Interview Survey (NHIS) (NCHS 1999). The NIS CATI questionnaire has been
translated into Spanish, and Language Line Services (formerly part of AT&T) is used for real-time
translation into many other languages (Wall et al. 1995). Table 2 summarizes the content of each section
of the NIS household interview. The CATI questionnaire is available at
http://www.cdc.gov/vaccines/imz-managers/nis/datasets.html.
In the screener, the purpose of the survey is explained to the respondent, and the household is screened to
determine whether it contains any children aged 19 through 35 months (any child who was or would be
aged 19 through 35 months during the calendar quarter is eligible). If the household has an eligible child,
the respondent is asked whether he/she is the most knowledgeable person for the child’s vaccination
history. If the respondent indicates that another person in the household is more knowledgeable, the
interviewer asks to speak to him/her at that time. If that person is unavailable to be interviewed, the
interview proceeds to Section MR, the name of the most knowledgeable person is recorded, and a
“callback” is scheduled for a later date. For the cell-phone sample, prior to screening for age-eligibility,
the household is screened to ensure that the cell-phone is used by an adult (i.e., to ensure it is not a minor-
only cell phone). If the household has more than one age-eligible child, data are collected for each eligible
child.

Data User’s Guide for the 2015 NIS Public-Use Data File Page 16
Table 2: Content of the Household Interview, National Immunization Survey, 2015
Questionnaire Section Content of Section
Section S Screening questions to determine eligibility, roster of eligible children, availability of shot records
Section MR Most-knowledgeable-respondent callback questions
Section A (Guam only)
Vaccination history (asked if shot records are available)
Section B Ever vaccinated and flu vaccination questions
Section C Demographic and socioeconomic questions
Section D Provider information and request for consent to contact the eligible child’s vaccination provider(s)
Section E Health Insurance Module (HIM)
Prior to Q1/2012, the person being interviewed was asked during the screener section whether he/she had
a written record (shot card) of the child’s vaccination history, and whether it was easily accessible. If a
shot card was available, the respondent was asked to provide information directly from it in Section A.
However, beginning in Q1/2012, Section A and most of Section B were eliminated from the regular
questionnaire, and therefore all interviews proceeded directly to a reduced form of Section B, which asks
the respondent to recall information about the child’s influenza vaccinations. In 2015, Section A was
reinstated for Guam respondents. As described above in the Introduction, Guam and U.S. Virgin
Islands data are not included in the 2015 public-use data file.
Section C obtains information that includes relationship of respondent to the child, race and Hispanic
origin of the child, household income, educational attainment of the mother, and other information on the
socioeconomic characteristics of the household and its eligible children. This section is asked of all
respondents upon completion of Section A or Section B.
In Section D of the NIS household interview, identifying information (such as name, address, and
telephone number) for the child’s vaccination provider(s) is requested, as well as the full names of the

Data User’s Guide for the 2015 NIS Public-Use Data File Page 17
child(ren) and the respondent, so that NIS personnel can contact the provider(s) and identify the child(ren)
whose immunization information the NIS is requesting. After this information is obtained, consent to
contact the child’s vaccination provider(s) is requested. When oral consent and sufficient identifying
information are obtained, the immunization history questionnaire is mailed to the child’s vaccination
provider(s).
Beginning in 2006, a Health Insurance Module (HIM) was administered upon completion of Section D to
collect data regarding the types of medical insurance coverage the child has had since birth. If a
respondent provided consent to contact medical providers and completed Section D, he/she flowed
directly into the HIM. If, however, consent or any other critical provider question was refused, the call
was terminated; only upon callback on which consent was granted or a second refusal given within
Section D was the respondent asked the HIM. See Section 7.10 of this user’s guide for information on the
HIM variables included on the public-use data file.
Some changes were made to the NIS questionnaire during 2015. These are listed below.
Year references for income questions were updated to refer to the previous year, 2014. That is, the
question text at CFAMINC, C13_DON’T_KNOW, and C13_REFUSED was updated to ask about
2014 income rather than 2013.
Changes and additions were made throughout the year to the questions about flu vaccinations in
Section B; the flu question responses are not included on the PUF, and so the PUF contents are not
affected.
“Living with partner” was added as a response option to question C7 beginning in Q1/2015.
Data were collected in the U.S. Virgin Islands, Guam, and Puerto Rico in 2015 (landline and cell-
phone sample). Section A was added and administered to Guam sample respondents that had shot

Data User’s Guide for the 2015 NIS Public-Use Data File Page 18
records available. A few minor changes were made to the instrument for the Puerto Rico sample,
such as adding a reference to municipio of residence.
3.2. Content of the Immunization History Questionnaire (IHQ) The immunization history questionnaire mailed to the vaccination providers is designed to be simple and
brief, to minimize provider burden and encourage survey participation. The structure and content of this
form were initially derived from the National Immunization Provider Record Check Study
(NHIS/NIPRCS), which collected and reconciled vaccination data from the providers of respondents to
the Immunization Supplement to the National Health Interview Survey. The immunization history
questionnaire consists of two double-sided pages. Page 1 includes space for a label that gives the child’s
name, date of birth, and gender. The remainder of page 1 contains questions about the facility and
vaccination provider. Page 2 gives instructions for filling out the shot grid, which appears on page 3. Page
4 thanks the vaccination provider for providing the information, and lists websites and telephone numbers
that can be used to obtain more information about the NIS and the National Center for Immunization and
Respiratory Diseases. The Immunization History Questionnaire is available at
http://www.cdc.gov/vaccines/imz-managers/nis/datasets.html.
No changes were made to the English version of the NIS IHQ during 2015. For Puerto Rico, a
Spanish-translated version of the NIS IHQ was used and this version differed slightly from the IHQ
used in 2015 for other estimation areas in a few ways. Question 5b, which asks if the practice has
been deputized to administer Vaccines for Children vaccines to underinsured children, was
removed from the Puerto Rico IHQ, and the response options for Indian Health Service and
Pharmacy at Question 5c were removed. These changes were made to the Puerto Rico IHQ because
the material was not relevant to Puerto Rico.

Data User’s Guide for the 2015 NIS Public-Use Data File Page 19
4. Data Preparation and Processing Procedures
The household and provider data collection in the NIS incorporate extensive data preparation and
processing procedures. During the household interview, the CATI system supports reconciliation of
critical errors as interviewers enter the data. After completion of interviewing for a quarter, post-CATI
editing and data cleaning produce a final interview data file. The editing of the provider data begins with
a manual review of returned immunization history questionnaires, data entry of the questionnaires, and
cleaning of the provider data file. After the provider data are merged with the household interview data
and responses from multiple providers for a child are consolidated into a child-level data record, the
editing continues. A quality assurance check is performed, from all sources of the date-of-birth
information, to ensure that the provider completed the questionnaire for the correct child and to confirm
age-eligibility. Editing of the provider-reported vaccination dates then attempts to resolve specific types
of discrepancies in the provider data. The end product is an analytic file containing household and
provider data for use in estimating vaccination coverage.
4.1. Data Preparation The editing and cleaning of NIS data involve several steps. First, the CATI system enables interviewers to
reconcile potential errors while the respondent is on the telephone. Further cleaning and editing take place
in a post-CATI clean-up stage, involving an extensive review of data values, cross tabulations, and the
recoding of verbatim responses for race and ethnicity. The next step involves the creation of numerous
composite variables. Provider data are cleaned in a separate step. After these steps have been completed,
imputations are performed for item non-response on selected variables, and weights are calculated. The
procedures and rules of the National Health Interview Survey serve as the standard in all stages of data
editing and cleaning (http://www.cdc.gov/nchs/nhis.htm).

Data User’s Guide for the 2015 NIS Public-Use Data File Page 20
4.1.1. Editing in the CATI System The CATI software checks consistency across data elements and does not allow interviewers to enter
invalid values. Catching potential errors early increases the efficiency of post-survey data cleaning and
processing.
To prevent an overly complicated CATI system, out-of-range and inconsistent responses produce a
warning screen, allowing the interviewer to correct real time errors. This allows the interviewer to
reconcile errors while respondent is on the telephone. CATI warning screens focus on items critical to the
survey, such as those that determine a child’s eligibility (e.g., date of birth).
A CATI system cannot simultaneously incorporate every possible type of error check and maximize
system performance. To reconcile this trade-off, post-CATI edits are used to resolve problems that do not
require access to the respondent, as well as unanticipated logic problems that appear in the data.
4.1.2. Post-CATI Edits The post-CATI editing process produces final, cleaned data files for each quarter. The steps in this
process, implemented after all data collection activities for a quarter are completed, are described below.
Initial Post-CATI Edits and File Creation
After completion of interviewing each quarter, the raw data are extracted from the CATI data system and
used to create two files: the sample file and the interview data file. The sample file contains one record for
each sample telephone number and summary information for telephone numbers and households. The
interview data file contains one record for each eligible sample child and all data reported for the child
during the household survey.
Following creation of these two files, a preliminary analysis of each file identifies out-of-range values and
extraneous codes. The first check verifies the eligibility status of children. Once the required corrections
are verified, invalid values are replaced with either an appropriate data value or a missing value code.

Data User’s Guide for the 2015 NIS Public-Use Data File Page 21
Frequency Review
After the pre-programmed edits are run, frequency distributions of all variables in each file are produced
and reviewed. Each variable’s range of values is examined for any invalid values or unusual distributions.
If blank values exist for a variable, they are checked to see whether they are allowable and whether they
occur in excessive numbers. Any problems are investigated and corrected as appropriate.
File Crosschecks
Crosscheck programs ensure that cases exist across files in a consistent manner. Specifically, checks
ensure that each case in the interview data file is also present in the sample file and that each case in the
sample file was released to the telephone center. Checks also ensure that no duplicate households exist in
the sample file and no duplicate children exist in the interview data file.
When all checks have been performed, the final quarterly interview data file is created. Programmers and
statisticians then create composite variables constructed from basic variables for each child. Sampling
weights (described in Section 6 of this Guide) are added to each record.
4.1.3. Editing of Provider Data Six to eight weeks after the close of household data collection for a quarter, the majority of the
immunization history questionnaires have been collected from providers. The data from the hard-copy
questionnaires are entered and independently re-entered to provide 100% verification. The provider data
file is cleaned, in a similar fashion to the household data file, for out-of-range values and consistency. A
computer program back-codes “other shot” verbatim responses into the proper vaccine category (e.g.,
Engerix B counts as Hep B, and Tetramune counts as DTP and Hib). These translations come from a file
that contains all such verbatim responses ever encountered in the NIS. Also, the provider data file is
checked for duplicate records, and exact duplicates are removed. If the provider data contain a date of
birth, gender, or name for the child that differs from the household interview for that child, the
questionnaire is re-examined to see whether it may have been filled out for the incorrect child. Provider
data that appear to have been filled out for the wrong child are removed from the provider database.

Data User’s Guide for the 2015 NIS Public-Use Data File Page 22
When a child has data from multiple providers, decision rules are applied to produce the most complete
picture of the child’s vaccination history.
Once these data have been cleaned, they are combined with the household data file. Information from up
to five providers can be added to a child’s record. If more than one provider reported vaccination data for
the child, the data from the multiple provider reports are combined into a single history for the child,
called the “synthesized provider-reported vaccination history.” The determination of whether the child is
up-to-date for recommended vaccines and vaccine series is based on the child’s synthesized provider-
reported vaccination history.
Many variables in the household data file are checked against or verified with the provider data file. For
example, a child’s date of birth as recorded by the provider is checked against the date of birth as given
by the household, to verify that the provider was reporting for that specific child and to form a “best” date
of birth for the child. All children with at least one provider-reported vaccination are considered to have
adequate provider data.
4.2. Limitations of Data Editing Procedures Although data editing procedures were used for the NIS, the data user should be aware that some
inconsistent data might remain in the public-use data file. The variables that indicate whether a child is
up-to-date on each vaccine or series (on which the estimates of vaccination coverage are based) are
derived from provider-reported data, and the NIS does not re-contact households or providers to attempt
to reconcile potential discrepancies in provider-reported vaccination dates or to resolve date-of-birth
reporting errors. However, beginning with the 1999 NIS, the provider-reported data are manually
reviewed and edited to correct specific reporting errors. The National Immunization Survey: Guide to
Quality Control Procedures (CDC 2002) discusses the change in editing procedures in more detail. Some
children with adequate provider data may have incomplete vaccination histories. These incomplete
histories arise from three primary sources: 1) the household does not identify all vaccination providers, 2)

Data User’s Guide for the 2015 NIS Public-Use Data File Page 23
some but not all providers respond with vaccination data, and 3) all identified providers respond with
vaccination data but fail to list all the vaccinations in the child’s medical record. Even with these
limitations, the NIS overall is a rich source of data for assessment of up-to-date status and age-appropriate
vaccination. Also, NIS is the only source to provide comparable provider-reported vaccination data across
states and local areas in the United States.
4.3. Variable-Naming Conventions The names of variables follow a systematic pattern as much as possible. The codebook for the public-use
data file groups the variables into ten broad categories according to the source of the data (household or
provider) and the content of the variable (NCIRD 2016). See Section 7 of this report for detailed
information on the contents of the public-use data file.
4.4. Missing Value Codes Missing value codes for each variable can be found in the codebook (NCIRD 2016). For household
variables, the missing value codes usually are 77 for DON’T KNOW and 99 for REFUSED. Some
household variables may also contain blanks, if the question was not asked. The variables developed from
the immunization history questionnaire generally do not have specific missing value codes.
4.5. Imputation for Item Non-Response The NIS uses imputation primarily to replace missing values in the socioeconomic and demographic
variables used in weighting. Missing values of these variables are imputed for all children with a
completed household interview – i.e., all children appearing on the public-use data file. A sequential hot-
deck method is used to assign imputed values (Ford 1983). Class variables are used to separate
respondents into cells. Donors and recipients must agree on the categories of the class variables, which
include the estimation area. Within the categories of the class variables, respondents are sorted by
variables related to the variable to be imputed. The last case with an observed value is used as the donor
for up to four recipients. The “Notes” line for each variable in the codebook (NCIRD 2016) identifies

Data User’s Guide for the 2015 NIS Public-Use Data File Page 24
variables that contain imputed values. These variables include the gender, Hispanic origin, race, and first-
born status of the child, and the education level, age group, marital status, and mobility status of the
mother.
The count of vaccinations for a specific vaccine is based on the number of unique vaccination dates
reported by the child’s provider(s). In filling out the immunization history questionnaire a provider may
not know the date of the first dose of hepatitis B, which is typically given at birth. The provider does,
however, have the option of checking the “Given at Birth” box for the first dose of hepatitis B. If it was
checked “yes” and the date of the birth dose of hepatitis B was not reported, a program assigns the date of
the birth dose for this vaccine. A value is imputed from the distribution of provider-reported dates for the
birth dose of hepatitis B. The birth dose for this imputation is defined as being given in the first 7 days of
life--between the date of birth (i.e., 0 days) and the date of birth plus 6 days. This imputation procedure
was first implemented for Quarter 1, 2000 – Quarter 4, 2000. For 2015 (excluding territories), a total of
36 children had the date of the birth dose of hepatitis B assigned using the above procedure (see
HEP_FLAG).
Table 3 shows the distribution of age in days at the birth dose of hepatitis B for children in 2015 with a
provider-reported birth dose. A similar table is included in the 2000-2014 data user’s guides. For 1997,
1998, and 1999, Section 5 of the data user’s guide provides information on the distribution of age in days
for the birth dose of hepatitis B vaccine and gives guidance on imputing age in days at birth dose for
children with a missing date, but for whom the provider checked the box indicating that a dose was
administered at birth (see HEP_BRTH).

Data User’s Guide for the 2015 NIS Public-Use Data File Page 25
Table 3: Distribution of Age (in Days) at the Birth Dose of Hepatitis B Vaccine, National Immunization Survey, 2015
Age in Days at Birth Dose
Unweighted Percentage Of Birth Doses*
0 58.3
1 26.9
2 9.0
3 2.4
4 1.5
5 0.9
6+ 1.0
* Excludes territories.
4.6. Vaccine-Specific Recoding of Verbatim Responses On the IHQ, providers can list vaccinations in the “other” section of the IHQ shot grid. After data
collection, they are reclassified into the listed categories, if possible, using a vaccination recoding table.
This table is reviewed by National Center for Immunization and Respiratory Diseases personnel to ensure
the shots are recoded into the appropriate category or categories (for combination shots).
4.7. Composite Variables A number of composite variables (constructed from basic variables) are created and included in the NIS
public-use data file. Composite variables assist users and data analysts by eliminating duplication of effort
and making NIS data easier to use.
Since the initial years of NIS data collection, the household composite variables have included up-to-date
status on individual vaccinations, race of child, household income, and up-to-date status on several
vaccination series. Many of these household composite variables are included in the NIS public-use data
file. See Section 7 of this report for information on the key variables that are included.

Data User’s Guide for the 2015 NIS Public-Use Data File Page 26
In Quarter 3, 1999, the NIS race questions (see questions C3, C9 and C10 in the household questionnaire)
were expanded to include Alaska Native, Native Hawaiian, and Pacific Islander, implementing the revised
Office of Management and Budget (OMB) standards for classification of race and ethnicity
(http://www.whitehouse.gov/omb/fedreg_1997standards). The composite race variables in the 2002
through present NIS public-use data files, however, contain only three categories: white alone; black
alone; and all other races alone/multiple races. (The variable RACE_K classifies each child into one of
these three categories, while the variable RACEETHK includes a separate “Hispanic” category.) The “all
other races alone” category includes Asian, American Indian or Alaska Native, Native Hawaiian or
Pacific Islander, and other races. If more than one race was selected during administration of the child
race questions, the child is classified as multi-racial. Because of small sample sizes and risk of disclosure
within estimation areas, the 2002 through present NIS public-use data files do not contain any variables
with separate multiple-race categories. Rather, the multi-racial children are included in the “all other
races” category. Table 4 shows some characteristics of the current race/ethnicity categories.

Data User’s Guide for the 2015 NIS Public-Use Data File Page 27
Table 4: Weighted Distribution of Children by Race/Ethnicity and Corresponding Combined Vaccine Series 4:3:1:3*:3:1:4*, Pneumococcal, and Varicella Vaccination Coverage Estimates, National Immunization Survey, 2015
Race/Ethnicity Classification
Weighted Distribution of Children aged 19-35
Months in U.S. Estimate (%)
Weighted Percentage 4:3:1:3*:3:1:4 UTD
Estimate (%) (Standard Error (%))
Weighted Percentage 4+ Pneumococcal Estimate (%)
(Standard Error (%))
Weighted Percentage 1+ Varicella at 12+ Months
Estimate (%) (Standard Error (%))
Hispanic 26.67 71.69 (1.64) 84.01 (1.27) 92.67 (0.91) Non-Hispanic white only 48.36 72.68 (0.90) 85.01 (0.74) 91.16 (0.55) Non-Hispanic black only 12.56 69.06 (1.84) 81.43 (1.49) 91.77 (1.05) Non-Hispanic American Indian or Alaska Native only 1.00 68.17 (4.59) 77.13 (4.05) 87.75 (3.05)
Non-Hispanic Asian only 5.16 77.90 (2.52) 84.96 (2.12) 93.44 (1.50) Non-Hispanic Native Hawaiian or Pacific Islander only
0.25 71.75 (7.48) 76.77 (6.75) 91.82 (3.47)
Multiracial 6.01 73.73 (2.34) 83.66 (1.86) 92.09 (1.26) Non-Hispanic white/black 2.76 68.43 (3.66) 80.20 (3.23) 91.53 (2.11) Non-Hispanic white/ American Indian or Alaska Native
0.87 73.25 (4.87) 82.22 (4.35) 93.49 (2.59)
Non-Hispanic white/Asian 1.33 79.64 (3.58) 87.72 (2.96) 90.45 (2.80) Non-Hispanic other combination 1.05 80.54 (7.22) 88.80 (3.78) 94.46 (1.82)
Note: UTD = up-to-date. Weighted by PROVWT_D. Children with an unknown Hispanic origin and/or race were imputed by a hot-deck method. This table includes both landline and cell-phone interviews, but excludes territories. * 4+ DTaP/DTP/DT; 3+ polio; 1+ MCV; full series Hib, i.e., 3 or 4 doses depending on type of vaccine received; 3+ Hep B; 1+ varicella at or after 12 months of age; and 4+ PCV

Data User’s Guide for the 2015 NIS Public-Use Data File Page 28
4.8. Sub-Sets of the NIS Data The NIS public-use data file contains data for all eligible children who have a completed household
interview. An interview is considered complete if the respondent completed Section C of the
questionnaire. As explained in Section 6 of this guide, each child with a completed household interview is
assigned a weight (RDDWT_D for the United States, excluding territories; RDDWT_D_TERR for
the United States, including territories) for use in estimation.
The NIS uses the synthesized provider-reported vaccination histories to form the estimates of vaccination
coverage because the provider data are considered more accurate than household-reported data. Thus, the
most important sub-set of the data consists of children with adequate provider data. For these children,
one or more providers returned an immunization history questionnaire that included vaccination data.
Unvaccinated children are also considered to have adequate provider data. As discussed in Section 7
below, the PDAT variable identifies the children with adequate provider data (PDAT=1). These children
have a separate weight (PROVWT_D for the United States, excluding territories;
PROVWT_D_TERR for the United States, including territories), which should be used to form
estimates of vaccination coverage (see Section 6).
4.9. Confidentiality and Disclosure Avoidance To prevent identification of participants in the NIS and the resulting disclosure of information, certain
items from the questionnaires are not included in the public-use data file. In addition, some of the released
variables either are top- or bottom-coded, or have their categories collapsed. Variable labels indicate
which variables have been re-coded in these ways.
5. Quality Control and Quality Assurance Procedures
A major contributor to NIS data quality is its sample management system, which in 2015 managed over
480 sample frame by estimation area by quarter samples and used a number of performance measures to

Data User’s Guide for the 2015 NIS Public-Use Data File Page 29
track their progress toward completion. Important aspects of the quality assurance program for the RDD
component of the NIS included on-line interviewer monitoring; on-line provider look-ups in a database
system integrated with the CATI system, including names, addresses, and telephone numbers of
vaccination providers; and automated range-edits and consistency checks. These and other quality
assurance procedures contributed to a reduction in total data collection cost by minimizing interviewer
labor and overall burden to respondents. Khare et al. (2000), Khare et al. (2001), and the National
Immunization Survey: Guide to Quality Control Procedures (CDC 2002) describe quality assurance
procedures.
The Provider Record Check component used quality control measures at four junctions: prior to mailing
packets to providers; during the telephone prompting effort; during the editing of returned questionnaires;
and during and after their data entry. The final quality assurance activities are implemented during post-
processing of the returned questionnaires or vaccination records. All returned questionnaires were
examined to identify and correct any obvious errors prior to data entry and then key-entered with 100%
verification. The keying error rate is estimated, by way of a second verification process, to be less than
1%.

Data User’s Guide for the 2015 NIS Public-Use Data File Page 30
6. Sampling Weights
Each of the two phases of data collection results in a separate sampling weight for each child that has data
at that phase. The RDD-phase sampling weights permit analyses of data for children with completed
household interviews. Each child with adequate provider data (the sub-set on which official estimates of
vaccination coverage are based) has a provider-phase sampling weight. The dual-frame RDD-phase
sampling weight variable for producing estimates for children with completed household interviews
in the United States excluding territories is called RDDWT_D; and the dual-frame RDD-phase
weight variable for producing estimates for the United States including territories is called
RDDWT_D_TERR. The dual-frame provider-phase sampling weight variable for producing
estimates for children with adequate provider data in the United States excluding territories is
called PROVWT_D; and the dual-frame provider-phase weight variable for producing estimates
for the United States including territories is called PROVWT_D_TERR. See Section 8 of this user’s
guide for more information about the weights included in the data file and the proper way to use them.
As discussed below, revisions in weighting methodology were made on various occasions and the names
of the weight variables were also changed to keep track of the revisions. The RDD-phase sampling
weights were called HY_WGT in 1995-2001, RDD_WT in 2002, WGT_RDD in 2003 and 2004,
RDDWT in 2005-2008, RDDWT/RDDWTVI from 2009-2010,
RDDWT_LL/RDDWTVI_LL/RDDWT_D in 2011, RDDWT_D/RDDWTVI_D in 2012,
RDDWT_D/RDDWTVIGU_D in 2013, and RDDWT_D/RDDWT_D_TERR in 2014-2015. The
provider-phase sampling weights were called W0 in 1995-2001, WT in 2002, WGT in 2003 and 2004,
PROVWT in 2005-2008, PROVWT/PROVWTVI from 2009-2010,
PROVWT_LL/PROVWTVI_LL/PROVWT_D in 2011, PROVWT_D/PROVWTVI_D in 2012,
PROVWT_D/PROVWTVIGU_D in 2013, and PROVWT_D/PROVWT_D_TERR in 2014-2015.

Data User’s Guide for the 2015 NIS Public-Use Data File Page 31
A sampling weight may be interpreted as the approximate number of children in the target population that
a child in the sample represents. Thus, for example, the sum of the sampling weights of children who are
up-to-date (on a particular vaccine or series of vaccines) yields an estimate of the total number of children
in the target population who are up-to-date. Dividing this sum by the total of the sampling weights for all
children gives an estimate of the corresponding vaccination coverage rate.
This section describes how these weights are developed and adjusted so as to achieve an accurate
representation of the target population. The base weights reflect each telephone number’s probability of
being selected into the sample; the adjustments take into account non-resolution of residential/non-
residential/non-working status of a telephone number, non-response to the screener and household
interviews, number of telephone lines in the household, combination of landline and cell-phone sample
sources, raking for differential coverage rates and non-coverage of households that do not have
telephones, non-response by providers, and a final raking adjustment. Note that when deriving dual-frame
weights, initial adjustments described below are performed separately for the landline and cell-phones
samples, and then both samples are combined and further adjustments are performed on the combined
samples.
6.1. Base Sampling Weight In each quarterly NIS sample, each child with a completed household interview receives a base sampling
weight. For all four quarters of the landline and cell-phone samples, the base sampling weight is equal to
the total of telephone numbers in the sampling frame for the estimation area divided by the total of
telephone numbers that were randomly sampled from that sampling frame and released for interview
during that quarter.
Data User’s Guide for the 2015 NIS Public-Use Data File Page 32
6.2. Adjustments for Non-Resolution of Telephone Numbers, Screener Non-Response, and Interview Non-Response
Non-response occurs in population-based surveys when potential respondents refuse to participate, are not
available at the time of the interview, or could not be reached during the survey period. Thus, the sum of
the base sampling weights of children with completed household interviews will underestimate the size of
the target population in the estimation area, because not all sampled households respond to all stages of
data collection up to the household interview. As a result, the base sampling weights must be adjusted so
they accurately reflect the number of children in the target population that each sampled child with a
completed household interview represents.
Some sampled households with age-eligible children fail to complete the household interview because of
unit non-response: for some telephone numbers, it is never determined whether or not the number is a
working residential number despite multiple call attempts; for some households it is never determined
whether or not the household contains age-eligible children; and some households with age-eligible
children do not complete the household interview. To compensate for these three types of unit non-
response, the sampling weights of children with a completed household interview are adjusted to account
for the estimated number of age-eligible children in households whose telephone numbers are never
resolved, the estimated number of age-eligible children in households that fail to complete the screening
interview, and the number of identified age-eligible children for whom the household interview is not
completed. For the landline sample, each of these adjustments is carried out within each estimation area
by forming weighting cells based on the residential directory-listed status of the sample telephone
number, percent of the population that is white in the telephone exchange, and MSA status of the
telephone exchange (i.e., weighting cells were formed from directory-listed versus non-directory-listed
telephone number; telephone exchanges with 75% or higher white population versus telephone exchanges
with less than 75% white population; and MSA/non-MSA status). For the cell-phone sample, each of
these adjustments is carried out within estimation area by forming weighting cells based on MSA/non-
MSA status of the wire center associated with the cell-phone number. Each cell in each stage of

Data User’s Guide for the 2015 NIS Public-Use Data File Page 33
adjustment must have sufficient resolved/responding cases (usually 20, but 15 for interview non-
response) at that stage of adjustment; cells with a deficient number of responding cases are collapsed with
neighboring cells. The order of the variables in cell collapsing for the landline sample is MSA status,
percent of population that is white, and directory listed status of the telephone number, and for the cell-
phone sample, both MSA categories are collapsed if either of the cells have a deficient number of
responding cases. Once the adjustment cells are formed, the weights of the unresolved/non-responding
records from the previous adjustment step are distributed to the weights of the resolved/responding
records within each cell.
6.3. Adjustment for Multiple Telephone Lines and Deriving Annual Weights
Once the non-response-adjusted interview weights for households are computed, these weights are
adjusted for additional telephone lines in the household. Because households with multiple telephone
lines have a greater chance of being sampled, for the landline sample each child’s household interview
weight is adjusted by dividing it by the total number of residential landlines reported in the household (up
to a maximum of 3), and for the cell-phone sample each child’s household interview weight is adjusted by
dividing it by the total number of cell-phones used by parents or guardians (up to a maximum of 3). Prior
to 2005, the adjustment for multiple telephone lines was made by adjusting the base sampling weights
before making any other adjustments. Beginning in 2005, the adjustment for multiple telephone lines has
been shifted after the interview non-response adjustment, because the information on the number of
telephone lines in a household is available only for households with completed household interviews.
This shifts the adjustment for multiple telephone lines to the point where the information about the
number of telephone lines is actually collected.
Up to the previous step, the sampling weights are adjusted separately for each quarter and sample type
(landline, cell-phone), and the weights in each quarter pertain to the target population. However, annual
vaccination coverage estimates are obtained from data for four consecutive quarters, so the weights in

Data User’s Guide for the 2015 NIS Public-Use Data File Page 34
each quarterly file are adjusted when the data from the four quarters of the landline and cell-phone
samples are combined. The adjustment factor is proportional to the number of households with completed
household interviews in each quarter within sample type (landline, cell-phone) and estimation area.
6.4. Calibration Next, survey weights are calibrated to population control totals as described below. The control totals
used for the NIS are derived from current natality data from the National Center for Health Statistics
(NCHS 2012, 2013). Because the Vital Statistics data give the counts of all live births in the United
States, regardless of whether the household has telephone service, the control totals include all eligible
children. The control total for each raking dimension is derived from the NCHS natality files from 2012
and 2013 (children born between July 1, 2012 and November 30, 2013 would have been 19 through 35
months on June 30, 2015). Use of the natality data to form the required population control totals for the
NIS has three limitations: 1) the natality file provides a universe of live births and therefore does not
reflect infant mortality; 2) the natality file does not include children born outside the United States who
immigrate to this country before reaching ages 19 through 35 months; and 3) the natality file records
residence at time of birth, and some children may move from one estimation area to another by the time
they reach 19 through 35 months of age. Adjustments are made to the natality data to account for these
three factors. For 2015, the methodology is similar to that for 2014 except instead of using three-year
American Community Survey Public-Use Microdata Sample (PUMS) data, the combined 2012,
2013, and 2014 one-year American Community Survey PUMS data files were used to make the
immigration and migration adjustments.
The proportions of 19 through 35 month old children by detailed telephone status (cell-phone-only,
landline and cell-phone dual user, landline-only, phoneless) within each estimation area were derived
using a similar small area modeling approach as described in Blumberg et al. 2011. These modeled
telephone status estimates are applied to the population control total for the estimation area to estimate the
control totals by detailed telephone status within the estimation area.

Data User’s Guide for the 2015 NIS Public-Use Data File Page 35
Survey weights for the landline and cell-phone samples must be integrated to provide dual-frame weights
for the full target population of age-eligible children. The landline and cell-phone sampling frames
overlap in coverage of children in landline and cell-phone dual use households and exclude children in
phoneless households. The critical issues associated with combining the landline and cell-phone samples
are: a) adjustment for overlap of the landline and cell-phone samples; and b) adjustment for noncoverage
of children in phoneless households.
Prior to combining the landline and cell-phone samples, survey weights are adjusted to agree with
independent estimates of the population total by telephone status. Adjustments to population totals by
telephone status are made separately for the landline sample and the cell-phone sample (with the overlap
adjusted for in the next step, as explained below). Since the proportion of children living in landline-only
households is continuously decreasing (and thus, the number of landline-only sample cases is small),
children in dual landline and cell-phone households from the landline sample are combined with children
in landline-only households and then adjusted to the combined population estimate of children living in
dual user and landline-only households within each estimation area. In the cell-phone sample, in each
estimation area children in dual landline and cell-phone households are weighted to represent children
living in dual landline and cell-phone households in the estimation area, and children in cell-phone-only
households are weighted to represent children in cell-phone-only households in the estimation area.
Next, since the landline and cell-phone sampling frames overlap in coverage of children in landline and
cell-phone dual-use households, children in dual-user households from both samples are combined based
on the effective number of children with a completed household interview within each sample type
(landline, cell-phone), and are weighted to represent children in dual-use households within each
estimation area. Finally, children in phoneless households, which are excluded from the dual-frame
sample, are accounted for in the raking step described below.

Data User’s Guide for the 2015 NIS Public-Use Data File Page 36
To reduce sampling variability and improve the precision of estimation, extreme weights are trimmed and
then recalibrated to control totals. RDD sampling weight values exceeding the median weight plus three
times the interquartile range of the weights within an estimation area are truncated and then recalibrated
to control totals. This is done by up to five iterations. This weight trimming prevents children with
unusually large weights from having an unusually large impact on immunization coverage estimates.
The final step in adjusting the RDD sampling weights is a raking adjustment (Deming 1943) of the
trimmed, telephone status adjusted weights. The raking procedure uses estimation area-level control totals
for maternal education categories, maternal race/ethnicity, age group of the child, gender of the child, and
telephone status. Briefly, raking takes each variable in turn and applies a proportional adjustment to the
current weights of the children who belong to the same category of the variable. After a number of
iterations over all the variables, the raked weights have totals that match all the desired control totals.
Raking makes it possible to incorporate additional variables into the weighting and to use more detailed
categories for those variables. Smith et al. (2005) gives the details of various aspects of the NIS
estimation procedures.
The sampling weights after all the foregoing adjustments constitute the “RDD sampling weights”
(RDDWT_D for the United States excluding territories; RDDWT_D_TERR for the United States
including territories).
6.5. Adjustment for Provider Non-Response Among the 26,975 children with a completed household interview from the landline and cell-phone
samples (excluding territories), 15,167 (56.2%) had adequate provider data. Starting with the 2002 NIS
public-use data file, the definition of children with adequate provider data includes unvaccinated children.
These are children for whom the respondent reported during the household interview that the child had
received no vaccination and has no providers, or for whom one or more providers were reported but those
providers reported administering no vaccinations. Among the 15,167 children with adequate provider

Data User’s Guide for the 2015 NIS Public-Use Data File Page 37
data, 178 were unvaccinated children. Failure to obtain adequate provider data for the remaining 43.8%
was attributable to:
● parent or guardian not identifying any providers or not giving consent to contact the child’s
vaccination provider(s) (35.7%);
● consent to contact vaccination providers obtained but no providers returned the immunization
history questionnaire (4.7%); and
● one or more providers returned the immunization history questionnaire, but no providers reported
any vaccination data (3.4%).
The 11,808 children for whom a household interview was completed but adequate provider data were not
obtained are classified as “partial non-responders” because they have only a partial response to the NIS as
a whole.
Empirical results suggest that children with adequate provider data have characteristics believed to be
associated with a greater likelihood of being up-to-date, compared with children who had missing
provider data. Specifically, children with adequate provider data are more likely to live in households that
have higher total family income, have a white mother, and live outside a central city of a Metropolitan
Statistical Area. Also, a child with missing provider data is less likely to live in the state where the mother
lived when the child was born. These factors indicate a potential lack of continuity of health care, and are
associated with lower vaccination rates (Coronado et al. 2000). If no adjustment is made to the RDD
sampling weights to account for these differences, estimated vaccination coverage rates may be biased.
To reduce potential bias in estimators of vaccination coverage attributable to partial non-response, a
weighting-class adjustment is used in each estimation area (Brick and Kalton 1996). This adjustment
involves three steps. In the first step, sampled children are classified according to the quintile of their
estimated probabilities of having adequate provider data. In the statistical literature these probabilities are
Data User’s Guide for the 2015 NIS Public-Use Data File Page 38
called response propensities (Rosenbaum and Rubin 1983, 1984; Rosenbaum 1987). Children who have
similar response propensities will also be similar with respect to variables that are strongly associated
with the probability of having adequate provider data. In this important respect, children in each class are
comparable. Because of this comparability, any sub-sample of children in a class may represent all
children in the class. Therefore, the weighting-class adjustment uses the children with adequate provider
data to represent all children in the class. An NCHS Series 2 Report on the statistical methodology of the
NIS (Smith et al. 2005) includes details of the methodology for forming weighting classes based on
propensity scores. This report can be viewed at http://www.cdc.gov/nchs/data/series/sr_02/sr02_138.pdf.
In the second step of this weighting-class adjustment, within each class an adjustment factor redistributes
the RDD sample weights of the children with missing provider data to the weights of the children who
have adequate provider data. These adjusted sampling weights of children with adequate provider data are
initial non-response-adjusted provider-phase weights. The model for children with adequate provider data
includes significant main effects, and also significant two-way interactions between sample type
(landline, cell-phone) and all other variables.
Within an estimation area, the sums of non-response adjusted weights of children with adequate provider
data for the various levels of important socio-demographic variables (such as race/ethnicity) may not be
equal to corresponding population totals. To reduce bias attributable to these differences, raking was used
in the third step to adjust the non-response adjusted weights to match estimation area control totals.
Control totals for these variables were estimated using the weighted totals from the sample of children
with completed household interviews. Smith et al. (2001b, 2005) describe the development of this
approach in more detail. Similar to the RDD weighting, the extreme weights exceeding the median weight
plus three times the interquartile range of the weights within an estimation area are truncated and then
recalibrated to control totals. These raked weights of children with adequate provider data are called
“final provider-phase weights” (PROVWT_D for the United States excluding territories;
PROVWT_D_TERR for the United States including territories). Because of the comparability of

Data User’s Guide for the 2015 NIS Public-Use Data File Page 39
children within each weighting class, any estimate that uses data only from the children with adequate
provider data along with their provider-phase sampling weights, will have less bias attributable to
differences between children with adequate provider data and children with missing provider data.
Appendix B summarizes the distribution of the sampling weights (RDDWT_D, PROVWT_D,
RDDWT_D_TERR, and PROVWT_D_TERR) in each estimation area.
NIS public-use data files for 1995 to 2001 do not include sampling weights that account for the effect of
unvaccinated children. An assessment of the effect of accounting for unvaccinated children for the period
1995 to 2003 was made. Weights were calculated for each year with and without unvaccinated children
and the vaccination coverage estimates compared. Details of this assessment and the results are available
in the user’s guide for the 2004 NIS public-use data file. At the national level, accounting for
unvaccinated children had very little effect on the estimates of 4:3:1:3 vaccination coverage. Within
estimation areas also, the two coverage estimates differed little. The largest difference (in either direction)
was most often around 2 percentage points. Differences of that magnitude are small relative to the
standard errors of the estimates. Although accounting for unvaccinated children has a small effect on
estimates of vaccination coverage, data users who use the public-use data files to examine estimation
area-level trends over time are advised to interpret the results with appropriate caution.
6.6. Sampling Weights for Territories The NIS weighting process was followed as closely as possible for territories. Due to differences in the
availability of external data sources for territories, slight changes were necessary to accurately estimate
vaccination rates for this area. These differences are stated below.
In step 6.2, each of the non-response adjustments for territories was done at the estimation area level. That
is, no weighting cells were formed for territories.

Data User’s Guide for the 2015 NIS Public-Use Data File Page 40
For the U.S. Virgin Islands, 2013 natality data were not available, so 2011 and 2012 data (NCHS
2011, 2012) were used instead of 2012 and 2013 data to create the control totals for the U.S. Virgin
Islands. Similar to the dual-frame weights for the United States excluding territories, the final step
in adjusting the RDD sampling weights for territories is a raking adjustment. For Guam and
Puerto Rico, a different set of race/ethnicity categories were used for post-stratification and raking
adjustments than were used in other areas. The three Guam race/ethnicity categories were:
Chamorro/Guamanian, Other Asian/Pacific Islander, and All Other. The two Puerto Rico
race/ethnicity categories were: White and All Other.
After sampling weights were calculated for all children in all estimation areas, including territories, they
were stored in the variables RDDWT_D_TERR and PROVWT_D_TERR. These weight variables permit
one to conduct analysis of all estimation areas, including territories. The weight variables RDDWT_D and
PROVWT_D are equal to RDDWT_D_TERR and PROVWT_D_TERR for all children except those in
territories, for whom the value of these weight variables is blank or missing. RDDWT_D and
PROVWT_D permit one to conduct analysis of all estimation areas, excluding territories.

Data User’s Guide for the 2015 NIS Public-Use Data File Page 41
7. Contents of the Public-Use Data File
The NIS public-use data file contains a record for each eligible child for whom Section C of the
household interview was completed, along with household-reported information about the child and the
child’s mother. For children with Immunization History Questionnaires (IHQs) returned by one or more
providers, the file also contains provider characteristic variables, as well as variables based on the child’s
synthesized provider-reported vaccination history: the age of the child at each vaccination, the number of
each type of vaccination received, and indicators of whether the child is up-to-date with respect to various
recommended vaccines and vaccine series.
The public-use data file consists of ten sections, the contents of which are described below in detail. For
additional information, users are encouraged to consult the codebook (NCIRD 2016). The codebook is
divided into the ten sections described below and contains variable names, labels, and response
frequencies (for categorical variables). For select variables, the codebook also gives additional
information about the variable in the “Notes” field.
Table 5 lists key NIS variables commonly used in analyses. A full list of variables appearing on the 2004-
2015 NIS public-use data files appears in Appendix E, along with the reason for the addition, subtraction,
or modification of the variables in 2005-2015. Information on changes made between 1995-2004 can be
found in the Alphabetical Listing of Variables that are Not Available in All Public-Use Data Files,
National Immunization Survey, 1995-2004. www.cdc.gov/nchs/data/nis/pufvariables1995to2004.pdf

Data User’s Guide for the 2015 NIS Public-Use Data File Page 42
Table 5: NIS Variables Commonly Used in Analyses or for Published Estimates Variables Categories ID Variables SEQNUMC – unique child ID variable SEQNUMHH – unique household ID variable Geographic Variables ESTIAP15 – estimation area number
(introduced in 2008; ITRUEIAP used through 2004; ESTIAP in 2005; ESTIAP06 in 2006; ESTIAP07 in 2007; ESTIAP08 in 2008; ESTIAP09 in 2009; ESTIAP10 in 2010; ESTIAP11 in 2011; ESTIAP12 in 2012; ESTIAP13 in 2013; ESTIAP14 in 2014; ESTIAP15 in 2015)
STATE – state FIPS code
CEN_REG – census region
Northeast Midwest South West
Child Demographic Variables
AGEGRP – age category of child 19-23 months 24-29 months 30-35 months
RACEETHK – race/ethnicity of child (introduced in 2002; RACEKIDR used in 1995-2001)
Hispanic White alone, non-Hispanic Black alone, non-Hispanic All other races alone and multi-racial, non-Hispanic
SEX – gender of child Male Female
FRSTBRN – firstborn status of the child No Yes
Mother Demographic Variables
EDUC1 – education of the mother
<12 years 12 years >12 years, not a college graduate College graduate
MARITAL2 – marital status of mother (Living with partner response option added to questionnaire in 2015)
Currently married Never married, widowed, divorced, separated, or deceased, living with partner
M_AGEGRP – age group of mother <=19 years 20-29 years 30 years or older
Poverty Variables
INCPOV1 – poverty status (introduced in 2005; INCPOV1R used through 2004)
At or above poverty level, income > $75,000 At or above poverty level, income <= $75,000 Below poverty level Not determined
INCPORAR – income-to-poverty ratio (introduced in 2005; INCPORAT used through 2004)
WIC Variables

Data User’s Guide for the 2015 NIS Public-Use Data File Page 43
Variables Categories
CWIC_01 – child ever participated in WIC program
Yes No Never heard of WIC Don’t know Refused Missing
CWIC_02 – child currently participating in WIC program
Yes No Don’t know Refused Missing
Breastfeeding Variables
CBF_01 – child ever fed breast milk
Yes No Don’t know Missing
BF_ENDR06 – length of time in days child was fed breast milk
BF_EXCLR06 – length of time in days child was exclusively fed breast milk or formula (introduced in 2006)
BF_FORMR08 – age in days when child was first fed formula (introduced in 2008; BF_FORMR06 used in 2006 and 2007)
Chicken Pox Variables
HAD_CPOX – did child ever have chicken pox (introduced in 2005; I_HADCPX used through 2004)
Yes No Don’t know Refused Missing
AGECPOXR – age in months when child had chicken pox (introduced in 2005; IAGECPXR used through 2004)
0-6 months 7-12 months 13-18 months 19-24 months 25-30 months 31 months or older Missing
Presence of Provider Data Variables
PDAT – adequate provider data indicator Yes No
Number of Provider-Reported Doses of Vaccine Variables
P_NUMDTP – total number of DTP/DTaP doses P_NUMPOL – total number of polio doses P_NUMMMR – total number of MCV doses P_NUMHIB – total number of Hib doses P_NUMHEP – total number of hepatitis B doses P_NUMVRC – total number of varicella doses P_NUMPCV – total number of pneumococcal doses P_NUMFLU – total number of seasonal influenza doses P_NUMHEA – total number of hepatitis A doses P_NUMROT – total number of rotavirus doses Provider Characteristic Variables

Data User’s Guide for the 2015 NIS Public-Use Data File Page 44
Variables Categories
PROV_FAC – provider facility type
All public facilities All hospital facilities All private facilities All military/other facilities Mixed types Unknown
VFC_ORDER – do child’s providers order vaccines for children from state/local health department? (introduced in 2006)
All providers Some but not all providers No providers Unknown
REGISTRY – provider(s) reported child’s vaccination(s) to state or community immunization registry
All providers Some but not all providers No providers Unknown
Before describing the sections of the public-use data file below, we first summarize the differences
between the 2014 and 2015 NIS public-use data files:
● Because the 2015 estimation areas differ from those used in prior years, a new 2015
estimation area variable has been added (ESTIAP15) and the 2014 estimation area variable
(ESTIAP14) has been dropped.
● A new response option was added for mother’s marital status, “Living with partner”. A
value of “2” on the recoded marital status variable MARITAL2 now represents “never
married; widowed; divorced; separated; deceased; living with partner”.
7.1. Section 1: ID, Weight, and Flag Variables SEQNUMHH and SEQNUMC are the unique household and child identifiers, respectively. PDAT
indicates which children are considered to have adequate provider data. As described in Section 6 of this
report, RDDWT_D/RDDWT_D_TERR and PROVWT_D/PROVWT_D_TERR are the final
household- and provider-phase weights, respectively. PROVWT_D/PROVWT_D_TERR should be
used when analyzing the provider-reported data, i.e., the variables in Sections 7, 8, and 9 of the NIS
public-use data file.

Data User’s Guide for the 2015 NIS Public-Use Data File Page 45
7.2. Section 2: Household-Reported Vaccination and Chickenpox Information
Section 2 of the public-use data file contains variables derived from the information collected in Section
B of the household questionnaire. In particular, it contains variables indicating whether the respondent
reported that the child has had chicken pox disease (HAD_CPOX) and the child’s age in months at
chicken pox disease (AGECPOXR).
7.3. Section 3: Demographic, Socio-Economic, and Other Household/Child Information
Section 3 of the NIS public-use data file consists of information collected during the household screening
interview and Section C of the household main interview. To protect confidentiality, many of these
variables have been collapsed, top-coded, or bottom-coded from the original, fully-detailed versions; the
variable labels (see the public-use date file codebook) indicate which variables have been collapsed or
recoded.
AGEGRP is the age of the child in months in three categories (19-23 months, 24-29 months, 30-35
months), based on the child’s best date of birth and the eligibility date. SEX gives the gender of the child,
and FRSTBRN indicates whether the child is the first born, with missing values of these variables
imputed. The language in which the interview was conducted is stored in variable LANGUAGE, and
C5R gives the relationship of the respondent to the child.
The breastfeeding variables include whether the child was ever fed breast milk (CBF_01), length of time
in days the child was fed breast milk (BF_ENDR06), the age in days when the child was first fed formula
(BF_FORMR08), and the length of time in days the child was exclusively fed breast milk or formula
(BF_EXCLR06). Two types of inconsistencies arise in the breastfeeding data: 1) duration of any
breastfeeding can exceed age of the child, and 2) age when the child was first fed formula can exceed the
age of the child. BFENDFL06 is set equal to 1 when BF_ENDR06 exceeds the age of the child (with a
buffer), and BFFORMFL06 is set equal to 1 when BF_FORMR08 exceeds the age of the child (with a

Data User’s Guide for the 2015 NIS Public-Use Data File Page 46
buffer). Appendix C provides details on how the flags were created. Data users are cautioned to review
Appendix C before analyzing any of the breastfeeding variables.
The WIC variables include whether the child ever participated in the WIC program (CWIC_01) and
whether the child is currently participating (CWIC_02).
C1R and CHILDNM give the number of people and children, respectively, in the household. The child’s
Hispanic origin indicator, race with three categories, and race/ethnicity with four categories are presented
in variables I_HISP_K, RACE_K, and RACEETHK, respectively; for each of these variables, missing
values have been imputed. The age, education level, and marital status of the mother of the child are
stored in variables M_AGEGRP, EDUC1, and MARITAL2 (married vs. not married), with missing
values imputed.
The categorized total combined income for the child’s family is given by INCQ298A. INCPOV1 gives
the family’s poverty status (at or above poverty, income > $75,000; at or above poverty, income <=
$75,000; below poverty; unknown), and INCPORAR gives the ratio of the family’s income to the
poverty level. Household tenure is given by RENT_OWN.
The number of landline telephone numbers in the household, the number of working cell phones
household members have available for personal use, and the number of these cell phones that are usually
used by parents or guardians are given by NUM_PHONE, NUM_CELLS_HH, and
NUM_CELLS_PARENTS, respectively.
Variable CEN_REG gives the census region of the respondent’s current residence, and MOBIL_I
indicates whether the mother’s current state of residence is the same as her state of residence at the time
of the child’s birth.

Data User’s Guide for the 2015 NIS Public-Use Data File Page 47
7.4. Section 4: Geographic Variables Variables ESTIAP15 and STATE give the 2015 estimation area and state of residence, respectively, for
each child. EST_GRANT indicates which of the 50 states, District of Columbia, and 5 local areas that
receive federal Section 317 immunization grants (Bexar County, TX; City of Chicago, IL; City of
Houston, TX; New York City; Philadelphia County, PA) the child resides in.
7.5. Section 5: Number of Providers Identified and Consent Variables Variable D7 indicates whether the respondent gave consent to contact the child’s providers. If D7=1, then
consent was granted; if D7=2 then consent was explicitly denied; and if D7 is missing, consent was not
granted because the respondent broke off the interview before being explicitly asked for consent.
Variable D6R gives the number of providers identified by the respondent. Note that sometimes
respondents report erroneous provider counts and sometimes report the same provider more than one
time, and D6R does not reflect cleaning or de-duplication of the initially-reported provider count.
7.6. Section 6: Number of Responding Providers Variables Variable N_PRVR indicates the number of providers returning IHQs with vaccination information for the
child. That is, N_PRVR is the number of IHQs that were returned for the child that contain information
on the IHQ shot grid.
7.7. Section 7: Characteristics of Providers Variables The variables in this section of the public-use data file summarize the information collected in IHQ
questions 5c, 6, and 7 across the child’s providers who returned IHQs containing vaccination (i.e., shot
grid) data.
PROV_FAC indicates the facility type of the child’s vaccination providers based on responses to IHQ
question 5c. If all of the child’s providers that returned IHQs containing shot grid data (see Section 6
variable N_PRVR) reported the facility type to be:

Data User’s Guide for the 2015 NIS Public-Use Data File Page 48
● a public health department-operated clinic, community health center, or rural health clinic, then
PROV_FAC=1 (all public facilities);
● a hospital-based clinic, then PROV_FAC=2 (all hospital facilities);
● a private practice, then PROV_FAC=3 (all private facilities);
● a military health care facility, WIC clinic, school-based health center, pharmacy, or other type of
facility, then PROV_FAC=4 (all military/WIC/school/pharmacy or other facilities).
If the responses of providers that returned IHQs containing shot grid data fell into more than one of the
above bulleted categories, PROV_FAC=5 (mixed); otherwise, if at least one of the child’s providers
returned an IHQ containing shot grid data, PROV_FAC=6 (unknown). If none of the child’s providers
returned an IHQ containing shot grid data, PROV_FAC is set to missing.
The Vaccines For Children (VFC) program is a federally-funded program that provides vaccines at no
cost to children who might not otherwise be vaccinated because of inability to pay
(http://www.cdc.gov/vaccines/programs/vfc/index.html). CDC buys vaccines at a discount and distributes
them to awardees—i.e., state health departments and certain local and territorial public health agencies—
which in turn distribute them at no charge to those private physicians’ offices and public health clinics
registered as VFC providers. VFC_ORDER, based on responses to IHQ question 6, indicates whether the
child’s vaccination providers order vaccines from a state or local health department to administer to
children. If all of the child’s providers that returned IHQs containing shot grid data (see Section 6 variable
N_PRVR) reported that they order vaccines from a state or local health department to administer to
children, then VFC_ORDER=1 (all providers); if at least one of the child’s providers that returned an
IHQ containing shot grid data reported that the practice orders vaccines from a state or local health
department to administer to children and the child’s other providers that returned IHQs containing shot
grid data reported either that they did not order such vaccines or that they did not know whether or not
they did, then VFC_ORDER=2 (some but possibly or definitely not all providers); if all of the child’s

Data User’s Guide for the 2015 NIS Public-Use Data File Page 49
providers that returned IHQs containing shot grid data reported that they do not order vaccines from a
state or local health department to administer to children, then VFC_ORDER=3 (no providers); if none of
the conditions for VFC_ORDER=1, 2, or 3 was met but at least one of the child’s providers returned an
IHQ containing shot grid data, VFC_ORDER=4 (unknown). If none of the child’s providers returned an
IHQ containing shot grid data, VFC_ORDER is set to missing. Note that having a provider that orders
VFC vaccine does not imply that the child is VFC-entitled; providers enrolled in the VFC program could
also vaccinate children who are not VFC-entitled.
REGISTRY is based on responses to IHQ question 7 and indicates whether the child’s vaccination
providers reported the child’s vaccinations to a community or state immunization registry (also known as
Immunization Information Systems, or IIS). If all of the child’s providers that returned IHQs containing
shot grid data (see Section 6 variable N_PRVR) indicated that they reported to a registry, then
REGISTRY=1 (all providers); if at least one of the child’s providers that returned an IHQ containing shot
grid data indicated that the practice reported to a registry and the child’s other providers that returned
IHQs containing shot grid data indicated that they did not report to a registry, that they did not know
whether or not they reported to a registry, or that the question is not applicable, then REGISTRY=2 (some
but possibly or definitely not all providers); if all of the child’s providers that returned IHQs containing
shot grid data indicated that they did not report to a registry or that the question is not applicable, then
REGISTRY=3 (no providers); if none of the conditions for REGISTRY=1, 2, or 3 was met but at least
one of the child’s providers returned an IHQ containing shot grid data, REGISTRY=4 (unknown). If none
of the child’s providers returned an IHQ containing shot grid data, REGISTRY is set to missing.
7.8. Section 8: Provider-Reported Up-To-Date Vaccination Variables This section contains vaccination count and up-to-date variables based on the child’s synthesized
provider-reported vaccination history. To facilitate data processing and to accommodate the large and
continually growing number of vaccination types covered by the NIS, the provider-reported vaccination
data are organized around the concept of vaccine categories and vaccine types within vaccine category.

Data User’s Guide for the 2015 NIS Public-Use Data File Page 50
The vaccine categories correspond to the sections of the IHQ shot grid, and the vaccine types correspond
to the type boxes on the IHQ shot grid. (For each vaccine category, an “unknown” vaccine type is created
for vaccinations that are reported without a type box being checked. Also, a few vaccine types, such as
Measles-Mumps, arise through the backcoding of shots initially reported in the “other” section of the IHQ
shot grid.) Table 6 shows the vaccine categories and types for the 2015 NIS. Note that a single
vaccination can fall into more than one vaccine category; for example, an MMR-Varicella vaccination is
part of both the Measles-containing and Varicella-containing vaccine categories. (The full list of vaccine
type codes can also be found in Appendix H.)
For each vaccine category, Section 8 of the public-use data file contains a variable typically named
P_NUMYYY – where “YYY” is the vaccine category abbreviation given in Table 6 – that stores the
number of vaccinations in that vaccine category in the child’s synthesized provider-reported vaccination
history. For each vaccine type in Table 6, Section 8 also contains a variable that stores the number of
vaccinations of that vaccine type in the child’s synthesized provider-reported vaccination history. For
example, P_NUMDHI is the number of DTaP/HepB/IPV shots in the child’s history.
This section of the public-use data file also contains up-to-date indicators for a variety of recommended
vaccines and vaccine series. These variables’ names typically begin with “P_UTD”. Additional variables
indicate whether the child is up-to-date for various vaccine series. For example, P_UTD431 indicates
whether the child has received 4 or more DTaP/DTP shots, 3 or more polio shots, and one or more
measles-containing shots. The variable labels indicate what is needed to be considered up-to-date for each
variable, and the “Notes” field in the codebook shows the vaccine type codes (see Table 6) being included
when determining whether the child is up-to-date.
Note that it is possible that the administration of the NIS interview itself prompts some respondents to
vaccinate their children following the interview; to ensure that the vaccination rate estimates aren’t
artificially boosted because of this, the synthesized vaccination history count and up-to-date variables in

Data User’s Guide for the 2015 NIS Public-Use Data File Page 51
this section of the public-use data file count only vaccinations received before the date the household
interview was completed.
7.8.1. Hib Up-To-Date Variables A Hib vaccine shortage and interim recommendation to suspend the booster dose for healthy children
occurred December 2007 to September 2009 (CDC 2010). Furthermore, the NIS has historically
considered children to be up-to-date for Hib if the child had 3 or more doses of any Hib-containing
vaccine, but for some Hib vaccine product types, 4 doses are required. Because the NIS has historically
not distinguished between product types for Hib vaccine, children who received 3 doses of a vaccine
product that required 4 doses were misclassified as up-to-date for Hib (CDC 2010).
Because of the Hib vaccine shortage and because of the dependence of the Hib recommendation on
product type, in 2009 the IHQ was modified to capture the manufacturer of the Hib vaccinations the child
has received. Beginning with the 2009 NIS public-use data file, new up-to-date variables were added to
indicate up-to-date status based on Hib recommendation (i.e., the primary series recommended during the
shortage vs. the full series) and on the Hib manufacturer.

Data User’s Guide for the 2015 NIS Public-Use Data File Page 52
Table 6: Vaccine Categories and Vaccine Types, National Immunization Survey, 2015 Vaccine Category
Abbreviation Vaccination
Category Description Vaccine
Type Code Vaccine Type Description
DTP DTaP/DTP-containing vaccine 03 DTaP/DTP-containing, unknown type
04 DTaP 07 DTaP-Hib 08 DTaP-HepB-IPV D3 DTaP-IPV-Hib
POL or POLIO Polio-containing vaccine 08 DTaP-HepB-IPV
20 OPV 21 IPV 22 Polio-containing, unknown type D3 DTaP-IPV-Hib
MCV or MMR Measles-containing vaccine 30 MMR
31 Measles only 32 Measles-mumps 33 Measles-rubella MM Measles-containing, unknown type VM MMR-Varicella
HIB Hib-containing vaccine 07 DTaP-Hib
43 HepB-Hib 44 Hib-only, unknown type D3 DTaP-IPV-Hib HG Hib-only (GSK) HI Hib-containing, unknown type HM Hib-only (Merck) HS Hib-only (Sanofi) HY Hib-MenCY
HEPB or HEP Hepatitis B-containing vaccine 08 DTaP-HepB-IPV
43 HepB-Hib 60 HepB-only HB HepB-containing, unknown type
VRC Varicella-containing vaccine VA Varicella-containing, unknown type
VM MMR-Varicella VO Varicella-only
PCV Pneumococcal-containing vaccine 70 Conjugate-unknown
71 Polysaccharide 72 Pneumococcal-containing, unknown
type 73 Conjugate-7 74 Conjugate-13

Data User’s Guide for the 2015 NIS Public-Use Data File Page 53
Vaccine Category Abbreviation
Vaccination Category Description
Vaccine Type Code Vaccine Type Description
HEPA or HEA Hepatitis A-containing vaccine HA Hepatitis A
FLU Seasonal influenza vaccine FL Seasonal flu, unknown type
FM Seasonal flu spray FN Injected seasonal flu MP Mumps-only vaccine MP Mumps-only
MPRB or MPR Mumps-Rubella-only vaccine MB Mumps-Rubella-only
RB Rubella-only vaccine RB Rubella-only
ROT Rotavirus-containing vaccine RG Rotarix® (GSK)
RM RotaTeq® (Merck) RO Rotavirus, unknown type
Table 7 shows the Hib up-to-date variables appearing on the public-use-date file beginning in 2009: in
addition to the existing up-to-date indicator based on 3+ Hib of any type (P_UTDHIB), an indicator based
on the “shortage” (i.e., primary series) recommendations accounting for manufacturer (3+ Hib of any type
or 2+ Hib of Merck types) and an indicator based on the “routine” (i.e., full series) recommendations
accounting for manufacturer (4+ Hib of any type or 2 Hib of Merck types followed by 1 Hib of any type)
were added. Table 8 shows the up-to-date series variables that include Hib appearing on the public-use-
date file beginning in 2009: in addition to the existing vaccine series up-to-date variables based on 3+ Hib
of any type (PUTD4313, PUT43133, PU431331, PU4313313, PU4313314), variables based on the
“routine” (i.e., full series) Hib recommendations accounting for manufacturer (4+ Hib of any type or 2
Hib of Merck types followed by 1 Hib of any type) were added (P_UTD431H_ROUT_S,
P_UTD431H3_ROUT_S, P_UTD431H31_ROUT_S, P_UTD431H313_ROUT_S,
P_UTD431H314_ROUT_S).
Note that for these Hib up-to-date variables that account for the manufacturer, if the manufacturer is
unknown because the provider failed to check a type box on the IHQ, it has been assumed that the
manufacturer of the Hib vaccine is not Merck; that is, these variables are based on a “strict” treatment of
Hib vaccinations of unknown type, erring on the side of classifying the child as not up-to-date.

Data User’s Guide for the 2015 NIS Public-Use Data File Page 54
Beginning with the 2010 NIS public-use data file, two new vaccination series up-to-date indicators were
added that ignore the Hib component altogether. These are PU431_31 (indicates up-to-date status as
measured by PU431331, but excluding the Hib component) and PU431_314 (indicates up-to-date status
as measured by PU4313314, but excluding the Hib component).
Table 7: Up-To-Date Variables for Hib, National Immunization Survey, 2009-2015
Name Description Up-To-Date Criteria
P_UTDHIB Historical UTD flag for Hib. 3+ of any type (07,43,44,D3,HG,HI,HM,HS,HY)
P_UTDHIB_SHORT_S
UTD flag for Hib-shortage (i.e., primary series) recommendation, accounting for manufacturer. New starting 2009.
3+ of any type (07,43,44,D3,HG,HI,HM,HS,HY) OR 2+ Merck types (HM,43)
P_UTDHIB_ROUT_S UTD flag for routine (i.e., full series) Hib recommendation, accounting for manufacturer. New starting 2009.
4+ of any type (07,43,44,D3,HG,HI,HM,HS,HY) OR 2 Merck types (HM,43) followed by 1 of any type (07,43,44,D3,HG,HI,HM,HS,HY)

Data User’s Guide for the 2015 NIS Public-Use Data File Page 55
Table 8: Up-To-Date Variables for Vaccine Series Including Hib, National Immunization Survey, 2009-2015
Name Description
PUTD4313 UTD flag for the 4:3:1:3 series using the 3+ any type UTD definition for HIB
P_UTD431H_ROUT_S UTD flag for the 4:3:1:3 series using the routine (i.e., full series) UTD definition for HIB
PUT43133 UTD flag for the 4:3:1:3:3 series using the 3+ any type UTD definition for HIB
P_UTD431H3_ROUT_S UTD flag for the 4:3:1:3:3 series using the routine (i.e., full series) UTD definition for HIB
PU431331 UTD flag for the 4:3:1:3:3:1 series using the 3+ any type UTD definition for HIB
P_UTD431H31_ROUT_S UTD flag for the 4:3:1:3:3:1 series using the routine (i.e., full series) UTD definition for HIB
PU4313313 UTD flag for the 4:3:1:3:3:1:3 series using the 3+ any type UTD definition for HIB
P_UTD431H313_ROUT_S UTD flag for the 4:3:1:3:3:1:3 series using the routine (i.e., full series) UTD definition for HIB
PU4313314 UTD flag for the 4:3:1:3:3:1:4 series using the 3+ any type UTD definition for HIB
P_UTD431H314_ROUT_S UTD flag for the 4:3:1:3:3:1:4 series using the routine (i.e., full series) UTD definition for HIB
7.8.2. Rotavirus Up-To-Date Variables The up-to-date status for Rotavirus vaccine depends on the manufacturer of the vaccines received; the
requirement is two or more doses of Rotarix® (GSK) or three or more doses of Rotavirus vaccine of any
type. Beginning with the 2009 NIS public-use data file, an up-to-date variable for Rotavirus vaccine
(P_UTDROT_S) was added to indicate up-to-date status, accounting for the manufacturer (3+ Rotavirus
doses of any type or 2+ Rotarix® doses).
Note that for this Rotavirus up-to-date variable, if the manufacturer is unknown because the provider
failed to check a type box on the IHQ, it has been assumed that the Rotavirus vaccine dose is not
Rotarix®; that is, this variable is based on a “strict” treatment of Rotavirus vaccinations of unknown type,
erring on the side of classifying the child as not up-to-date.

Data User’s Guide for the 2015 NIS Public-Use Data File Page 56
7.9. Section 9: Provider-Reported Age-At-Vaccination Variables This section contains variables storing the child’s age in days and months at each vaccination in the
synthesized provider-reported vaccination history, along with the vaccine types of those vaccinations.
For each vaccine category, variables named DYYY1 - DYYY9 and YYY_AGE1 - YYY_AGE9 store the
age in days and months, respectively, of the child when the vaccination was administered for up to nine
vaccinations in the child’s synthesized provider-reported vaccination history, where “YYY” is the vaccine
category abbreviation given in Table 6. For vaccine categories that contain multiple vaccine types,
variables XYYYTY1 - XYYYTY9 give the corresponding vaccine type code (see Table 6).
Unlike the vaccination count and up-to-date variables in Section 8 of the public-use data file, the variables
in Section 9 include vaccinations given both before and after the household interview was completed. If
desired, users can limit the Section 9 variables to only those before the household interview date by
examining the corresponding Section 8 “P_NUM” variable and limiting the analysis of the Section 9
variables to only the first n variables, where n is equal to the number of vaccinations in the vaccine
category before the household interview date as indicated by the corresponding “P_NUM” variable.
Users of the public-use data file should be aware that the age-at-vaccination variables included in Section
9 may contain a small number of vaccination ages that are implausible according to the recommended
immunization schedules (http://www.cdc.gov/vaccines/schedules/hcp/child-adolescent.html). Such ages
may arise if a medical provider inadvertently records an erroneous vaccination date or if a vaccination
date is incorrectly transcribed onto an IHQ. The quality control procedures of the NIS address implausible
ages to every extent possible. Suspicious dates are manually reviewed and corrected if there is evidence
either from the household interview or from another provider that the date is incorrect. In rare cases,
however, when there is no further information with which to correct the reported vaccination date, the
vaccination is treated as having actually occurred and the implausible age at vaccination persists on the
data file. The data user should consider these issues in deciding how to analyze the NIS data.

Data User’s Guide for the 2015 NIS Public-Use Data File Page 57
7.10. Section 10: Health Insurance Module Variables The Health Insurance Module (HIM) (Section E) was introduced in 2006 to gather information on the
health insurance coverage of the child. HIM data were included in the NIS public-use data file for the first
time in 2007. The NIS public-use data file contains seven variables as follows:
● INS_1 – “Is child covered by health insurance provided through employer or union?”;
● INS_2 – “Is child covered by any MEDICAID plan?”;
● INS_3 – “Is child covered by S-CHIP?”;
● INS_3A – “Is child covered by any MEDICAID plan or S-CHIP?”;
● INS_4_5 – “Is the child covered by Indian Health Service, Military Health Care, TRICARE,
CHAMPUS, or CHAMP-VA?”;
● INS_6 – “Is child covered by any other health insurance or health care plan?”; and
● INS_11 - “Anytime when child was not covered by health insurance?”
Note that INS_4_5 combines the responses at questions INS_4 and INS_5. Each variable has “Yes”,
“No”, “Don’t Know”, and “Refused” as response options. Also, users will encounter blanks or missing
values in each variable. There are several reasons for the missing values. First, in order to reach the HIM
section, the respondent must first finish Section D. Since the NIS public-use data file contains records for
all respondents completing Section C, and because some of these Section C respondents did not complete
Section D, some records are for respondents who did not reach the HIM. Second, there is a possibility that
the respondent began the HIM but broke off the interview before finishing. Finally, there are skip patterns
in the module. That is, depending on the respondent’s answers to previous questions, certain questions
may be skipped. Figure 1 illustrates the flow of the eight questions used to create the seven HIM variables
included in the NIS public-use data file.

Data User’s Guide for the 2015 NIS Public-Use Data File Page 58
The first question (INS_1) was asked of all respondents who reached the HIM. If the name of the
Medicaid and S-CHIP programs were the same in the child’s state, the respondent skipped to INS_3A; if
the names of the Medicaid and S-CHIP programs were different in the child’s state, the respondent was
instead asked questions INS_2 and INS_3. Puerto Rico respondents were asked INS_2, but then
skipped to INS_5; U.S. Virgin Islands and Guam respondents skipped from INS_1 to INS_5. Thus,
question INS_4 was asked of all HIM respondents outside the territories, whereas INS_5 and INS_6
were asked of all HIM respondents. Based on the respondent’s answers to previous HIM questions
(some of which are not included in the public-use data file), if it was determined that the child currently
had health insurance or if the child’s insurance status was unknown, the respondent was asked if the child
was ever uninsured at question INS_11.
Prior to 2012, the variable VFC_I indicated VFC-eligibility. The variable VFC_I was dropped from the
PUF beginning 2012 due to changes to Page 1 of the NIS IHQ. Entitlement to the Vaccines for Children
(VFC) program is determined by a number of factors. A child is entitled if 1) the child is covered by
Medicaid, 2) the child is uninsured, 3) the child is of American Indian or Alaska Native race, or 4) the
child is underinsured and has received vaccinations from a Federally Qualified Health Center (FQHC).
The first three criteria were unaffected by the change to Page 1 of the IHQ. For the fourth criterion, the
approach for ascertaining if a provider was a FQHC was changed on the IHQ in 2012. While CDC
evaluates the accuracy of the provider-reported FQHC status, the VFC_I variable remains dropped from
the PUF. Medicaid and uninsured components of VFC entitlement can be analyzed using other health
insurance module variables.

Data User’s Guide for the 2015 NIS Public-Use Data File Page 59
Figure 1: Question Flow for the Eight Health Insurance Questions Used to Create the Health Insurance Variables Included in the PUF

Data User’s Guide for the 2015 NIS Public-Use Data File Page 60
8. Analytic and Reporting Guidelines
Data from the NIS public-use data file can be used to produce national, state, and estimation area
estimates of vaccination coverage using the PROVWT_D weight (PROVWT_D_TERR if territories are
to be included).
Information in the data file can also be used to calculate standard errors of the vaccination coverage
estimates that reflect the complex sample design of the NIS. The sample is stratified by the two sample
frames and the 61 estimation areas. The stratum identifier (STRATUM) and the coded household
identifier (SEQNUMHH) are key variables for obtaining standard errors for estimation area, state, and
national estimates of vaccination coverage rates. The estimation area variable ESTIAP15 defines
mutually exclusive and exhaustive geographic areas, while STRATUM is a combination of the estimation
area variable for that year and the sampling frame (landline or cell-phone).
Demographic and socioeconomic variables in the file can be used to obtain national vaccination coverage
estimates for sub-groups of the population. Data users should, however, be aware that estimates for such
sub-groups at the state or estimation area level will generally have large standard errors because of small
sample sizes. The CDC standard for precision of sub-group estimates is that the ratio of the standard error
to the estimate should be less than or equal to 0.3, and each analytic cell should contain at least 30
respondents.
8.1. Use of NIS Sampling Weights The 2015 NIS public-use data file contains two sets of child level weights. The RDDWT_D variable
gives the household-phase weight for all children 19 through 35 months in the United States
excluding territories (RDDWT_D_TERR if territories are to be included). These weights should be
used to form estimates from children with completed household interviews. The weights reflect the
stratified sample design and also have been adjusted for unit non-response, for the number of telephone

Data User’s Guide for the 2015 NIS Public-Use Data File Page 61
lines in the household, for combining the landline and cell-phone samples, for post-stratification to
population control totals, and for the exclusion of households without telephones.
The weight variables that apply to children with adequate provider data are
PROVWT_D/PROVWT_D_TERR with stratum variable STRATUM. These weights should be used
to form estimates of vaccination coverage. Each child with adequate provider data (PDAT = 1) has a
positive value for PROVWT_D/PROVWT_D_TERR. Starting with the 2002 file, the definition of
children with adequate provider data was expanded to include unvaccinated children (as discussed in
Section 2). Table 9 presents a summary of the appropriate weights and stratum variables to use for various
types of analyses.
Table 9: Summary of Weights and Stratum Variables, National Immunization Survey, 2015
Weight Variable Population* Sample Frame Strata Stratum
Variable
RDDWT_D_TERR United States including territories Dual Frame Sample Type by
Estimation Area STRATUM
RDDWT_D United States excluding territories Dual Frame Sample Type by
Estimation Area STRATUM
PROVWT_D_TERR United States including territories, children with adequate provider data
Dual Frame Sample Type by Estimation Area STRATUM
PROVWT_D United States excluding territories, children with adequate provider data
Dual Frame Sample Type by Estimation Area STRATUM
* Each weight will contain a missing value for all records that are not included in the population covered by the weight.
The 2015 NIS public-use data file does not contain any provider-level weights. The NIS does not sample
providers directly; rather, they are included in the survey through the children they vaccinate. A user of
the file should not attempt provider-level analyses (e.g., estimate the percentage of providers in the U.S.
that are private providers), because the NIS sample was not designed for that purpose.

Data User’s Guide for the 2015 NIS Public-Use Data File Page 62
8.2. Estimation and Analysis
8.2.1. Estimating Vaccination Coverage Rates Vaccination coverage rates are ratio estimators, as described in the statistical literature on methods for
complex sample surveys. Because of the adjustment to the sampling weights for provider-phase non-
response, statistical analyses require only data from children with adequate provider data (PDAT = 1),
along with their final provider sampling weights (PROVWT_D/PROVWT_D_TERR). To summarize the
statistical methodology by which vaccination coverage rates and their standard errors are obtained from
these data, let Yhij be an indicator, for the jth child with adequate provider data in the ith sampled
household in the hth stratum of the NIS sampling design, equal to 1 if the child is up-to-date according to
the provider data and 0 otherwise. Also, let Whij denote the value of PROVWT_D/PROVWT_D_TERR
for this child. Then, letting and , the national estimator of the
vaccination coverage rate may be expressed as
where L denotes the number of strata, nh denotes the number of sampled households containing children
with adequate provider data in the hth stratum, and mhi denotes the number of age-eligible children with
adequate provider data in the ith household in the hth stratum.
Letting L instead denote the number of strata in a state, the above formula can also be used to calculate
vaccination coverage rates for states (regardless of whether the state contains only one or more than one
stratum).

Data User’s Guide for the 2015 NIS Public-Use Data File Page 63
8.2.2. Estimating Standard Errors of Vaccination Coverage Rates The Taylor-series method can be used to estimate the sampling variance of vaccination coverage rates for
the U.S., the states, and estimation areas. Letting , , and
yields an estimator of the variance of the estimated vaccination coverage rate, , equal to
(Wolter, 2007) The standard error is the square root of the variance. The estimation of standard errors for
estimates of vaccination coverage rates in the NIS can be implemented in specialized statistical software
such as SUDAAN (Research Triangle Institute 2008), SAS (SAS Institute Inc. 2003), R (Lumley, 2010),
and Stata (Stata Corporation 2009). Appendix D gives several examples of the use of SAS, R, and
SUDAAN to estimate vaccination coverage rates and their standard errors for estimation areas and states.
For all procedures, the option of with-replacement sampling of primary sampling units within stratum is
used, because the sampling fractions for households within an estimation area are all quite small. For all
estimates, the variable STRATUM is used as the stratum variable and the household identifier
(SEQNUMHH) is used as the primary sampling unit identifier. The data file should be sorted first on
STRATUM and then on SEQNUMHH before running the programs for SUDAAN and SAS.
8.3. Combining Multiple Years of NIS Data
8.3.1. Estimation of Multi-Year Means With release of the 2015 NIS public-use data file, twenty years of public-use NIS data are now available.
The precision of estimates of vaccination coverage for sub-domains (e.g., by race/ethnicity of child)
within estimation areas or states can be improved by combining two or more years of NIS data. Data
users should, however, be aware that estimates from combined years of NIS data represent an average
over two or more years. Although combining several years of NIS data will yield a larger sample size for

Data User’s Guide for the 2015 NIS Public-Use Data File Page 64
estimation areas and states, the composition of the population in a geographic area may change over time,
making interpretation of the results difficult. Furthermore, if vaccination administration schedules or
vaccination coverage changes over time, the estimate of vaccination coverage for the combined time
period applies to a hypothetical population that existed at the middle of the time period, making
interpretation of the results even more difficult. Given the use of independent RDD samples in the NIS, it
is also possible that a child could appear in more than one public-use data file.
To estimate a multi-year mean for a given NIS variable, the weights in each participating file (RDD-phase
weights HY_WGT in 1995-2001, RDD_WT in 2002, WGT_RDD in 2003-2004, RDDWT in 2005-2010,
RDDWT_D/RDDWT_LL in 2011, RDDWT_D/RDDWTVI_D in 2012, RDDWT_D/RDDWTVIGU_D
in 2013, and RDDWT_D/RDDWT_D_TERR in 2014-2015; and provider-phase weights W0 in 1995-
2001, WT in 2002, WGT in 2003-2004, PROVWT in 2005-2010, PROVWT_D/PROVWT_LL in 2011,
PROVWT_D/PROVWTVI_D in 2012, PROVWT_D/PROVWTVIGU_D in 2013, and
PROVWT_D/PROVWT_D_TERR in 2014-2015, should be divided by the number of years being
combined. For example, if data for 2013, 2014, and 2015 for children in the United States (excluding
territories) with adequate provider data are to be combined, then the weights that exclude the territories in
the three files – called PROVWT_D in each of 2013-2015 – should be divided by 3 to obtain revised
weights, which should be saved as a new variable, say NEWWT. It is necessary to use NEWWT in the
analysis to obtain correct weighted estimates for children aged 19 through 35 months. Furthermore, the
child and household ID numbers (SEQNUMC and SEQNUMHH) in the files are unique only within a
year, not across years. It is important for the user to create revised, unique ID numbers when combining
data from multiple years.
The following SAS code can be used:
YRSEQC = 1 * (YEAR || SEQNUMC);
YRSEQHH = 1 * (YEAR || SEQNUMHH);

Data User’s Guide for the 2015 NIS Public-Use Data File Page 65
YEAR is the 4-digit year variable for the NIS data year (e.g., 2015).
To produce valid estimates of sampling variability and valid confidence intervals for multi-year coverage
rates and other multi-year means, it is necessary to use specialized software such as SAS or SUDAAN.
The years 2005 to 2015 bring an important new complication for variance estimation not encountered in
previous NIS years, because some traditional estimation areas were removed and other new areas were
defined and introduced to the survey (see Section 2 above for more information about rotating estimation
areas). The variance strata for 2004 and all prior years are defined by the variable ITRUEIAP, while the
variance strata for 2005-2015 are defined by the variables ESTIAP for 2005, ESTIAP06 for 2006,
ESTIAP07 for 2007, ESTIAP08 for 2008, ESTIAP09 for 2009, ESTIAP10 for 2010,
STRATUM_D/ESTIAP11 for 2011, and STRATUM for 2012-2015, with STRATUM_D and
STRATUM being a combination of the estimation area variable for that year and the sampling frame
(landline or cell-phone). The estimation area variables ITRUEIAP, ESTIAP, and ESTIAP06-ESTIAP15
define mutually exclusive and exhaustive geographic areas. However, they are not exactly the same areas.
For example, Boston and Rest of Massachusetts are each estimation areas in 2006, 2004, and all prior
years, while statewide Massachusetts is an estimation area in 2005 and 2007-2015. Other areas, such as
New York City and Rest of New York, are estimation areas in all years, including 2005-2015.
To make inferences concerning multi-year means, the user must take two actions. First, he/she must
define and save a new stratum variable with a common name for all years included in the analysis.
Second, he/she must define a common set of estimation domains that can be supported by each of the files
included in the multi-year analysis. To take these actions, the user should follow the following seven-step
procedure (or its equivalent):
i. Compute and save the new, common variance-stratum variable for each year participating in the
analysis. The variable should be defined by the equation
STRATUMV = ITRUEIAP, for children in the 2004 or prior years’ public-use data files

Data User’s Guide for the 2015 NIS Public-Use Data File Page 66
= ESTIAP, for children in the 2005 public-use data file
= ESTIAP06, for children in the 2006 public-use data file
= ESTIAP07, for children in the 2007 public-use data file
= ESTIAP08, for children in the 2008 public-use data file
= ESTIAP09, for children in the 2009 public-use data file
= ESTIAP10, for children in the 2010 public-use data file
= STRATUM_D if using PROVWT_D or
ESTIAP11 if using PROVWT_LL, for children in the 2011 public-use data file
= STRATUM, for children in the 2012, 2013, 2014, and 2015 public-use data
files
ii. Compute and save the new, common weight variable, NEWWT, as instructed above for each year
participating in the analysis.
iii. Compute and save the new, unique child and household identification numbers, YRSEQC and
YRSEQHH, as instructed above for each year participating in the analysis.
iv. Compute and save a variable defining the common estimation domains to be studied for each year
participating in the analysis. For example, one could use the CDIAP (Common Denominator
Estimation Area) variable set forth in Table 10 or states as geographic domains.
v. Merge the multiple files into one consolidated file in a format compatible with the specialized
software to be used.
vi. Sort the consolidated file by YEAR, STRATUMV, and YRSEQHH.
vii. Run the specialized software on the consolidated file, computing estimates, variance estimates,
and confidence intervals. For SUDAAN users, sampling levels or stages may be specified by the
statement
NEST YEAR STRATUMV YRSEQHH / PSULEV = 3;
the specification of weights by
WEIGHT NEWWT;

Data User’s Guide for the 2015 NIS Public-Use Data File Page 67
and the specification of estimation domains, for example, by the two statements
CLASS YEAR CDIAP STATE; TABLES CDIAP; or CLASS YEAR CDIAP STATE; TABLES STATE;
8.3.2. Estimation of Multi-Year Contrasts Considerations similar to those for multi-year means arise in the estimation of contrasts between NIS
years. For example, a typical contrast of interest would be the difference between the immunization
coverage parameters in 2014 and in 2015.
To make inferences concerning a multi-year contrast, the user will need to work with the original weights
reported on the files and store them in a common variable. One must not divide the original weights by
the number of years included in the contrast. For example, one may define the new, common weight
variable as
NEWWT2 = PROVWT_D/PROVWT_LL , if the child is in the 2011 PUF.
= PROVWT_D , if the child is in the 2012, 2013, 2014, or 2015
PUF.
The user should follow the seven-step procedure set forth in the section on multi-year means, using
NEWWT2 in lieu of NEWWT. In SUDAAN, the user should also specify the contrast of interest through
use of a CONTRAST statement or an appropriate regression model. For example, to compare the
4:3:1:3:3:1 up-to-date estimate from 2014 to the 2015 estimate, SUDAAN users can use the following
WEIGHT, VAR, and CONTRAST statements:
WEIGHT NEWWT2; VAR PU431331; CONTRAST YEAR = (-1 1);

Data User’s Guide for the 2015 NIS Public-Use Data File Page 68
Table 10: Cross-Walk Between ITRUEIAP, ESTIAP, ESTIAP06-ESTIAP15, and Common Denominator Estimation Area (CDIAP), National Immunization Survey, 2015
CDIAP Area Name ITRUEIAP (1995-2004)
ESTIAP (2005)
ESTIAP06 (2006)
ESTIAP07 (2007)
ESTIAP08 (2008)
ESTIAP09 (2009)
ESTIAP10 (2010)
ESTIAP11 (2011)
ESTIAP12 (2012)
ESTIAP13 (2013)
ESTIAP14 (2014)
ESTIAP15 (2015)
Alabama 20 AL-Jefferson County 21 21 20 20 20 20 20 20 20 20 20 20 20 AL-Rest of State 20 20 20 20 20 20 20 20 20 20 20 20 74 Alaska 74 74 74 74 74 74 74 74 74 74 74 74 Arizona
66 AZ-Maricopa County 67 67 67 66 66 66 66 66 66 66 66 66 66 AZ-Rest of State 66 66 66 66 66 66 66 66 66 66 66 66 46 Arkansas 46 46 46 46 46 46 46 46 46 46 46 46 California
68 CA-Fresno County 68 68 84 68 68 68 68 68 68 68 68 68
68 CA-Los Angeles County 69 69 69 69 69 69 69 68 68 68 68 68
68 CA-Northern CA 68 68 85 68 85 68 68 68 68 68 68 68
68 CA-San Diego County 71 68 71 68 68 68 68 68 68 68 68 68
68 CA-Santa Clara County 70 68 70 68 70 68 68 68 68 68 68 68
68 CA-San Bernardino County 68 80 68 80 68 68 68 68 68 68 68 68
68 CA-Alameda County 68 79 68 79 68 68 68 68 68 68 68 68 68 CA-Rest of State 68 68 68 68 68 68 68 68 68 68 68 68 Colorado
60 CO-Denver 60 81 60 60 60 60 60 60 60 60 60 60 60 CO-Rest of State 60 60 60 60 60 60 60 60 60 60 60 60 1 Connecticut 1 1 1 1 1 1 1 1 1 1 1 1
13 Delaware 13 13 13 13 13 13 13 13 13 13 13 13 12 District of Columbia 12 12 12 12 12 12 12 12 12 12 12 12 Florida
22 FL-Miami-Dade County 24 22 24 24 24 22 22 22 22 22 22 22
22 FL-Duval County 23 23 23 22 22 22 22 22 22 22 22 22 22 FL-Orange County 22 22 22 22 91 22 22 22 22 22 22 22 22 FL-Rest of State 22 22 22 22 22 22 22 22 22 22 22 22 Georgia

Data User’s Guide for the 2015 NIS Public-Use Data File Page 69
CDIAP Area Name ITRUEIAP (1995-2004)
ESTIAP (2005)
ESTIAP06 (2006)
ESTIAP07 (2007)
ESTIAP08 (2008)
ESTIAP09 (2009)
ESTIAP10 (2010)
ESTIAP11 (2011)
ESTIAP12 (2012)
ESTIAP13 (2013)
ESTIAP14 (2014)
ESTIAP15 (2015)
25 GA-Fulton/DeKalb Counties 26 26 26 25 25 25 25 25 25 25 25 25
25 GA-Rest of State 25 25 25 25 25 25 25 25 25 25 25 25 72 Hawaii 72 72 72 72 72 72 72 72 72 72 72 72 75 Idaho 75 75 75 75 75 75 75 75 75 75 75 75 Illinois
35 IL-City of Chicago 35 35 35 35 35 35 35 35 35 35 35 35
34 IL-Madison and St. Clair Counties 34 34 34 34 92 34 34 34 34 34 34 34
34 IL-Rest of State 34 34 34 34 34 34 34 34 34 34 34 34 Indiana
36 IN-Lake County 36 36 36 36 36 96 36 36 36 36 36 36 36 IN-Marion County 37 36 37 37 36 37 36 36 36 36 36 36 36 IN-Rest of State 36 36 36 36 36 36 36 36 36 36 36 36 56 Iowa 56 56 56 56 56 56 56 56 56 56 56 56 Kansas
57 KS-Eastern KS 57 57 86 57 57 57 57 57 57 57 57 57 57 KS-Rest of State 57 57 57 57 57 57 57 57 57 57 57 57 27 Kentucky 27 27 27 27 27 27 27 27 27 27 27 27 Louisiana
47 LA-Orleans Parish 48 47 47 47 47 47 47 47 47 47 47 47 47 LA-Rest of State 47 47 47 47 47 47 47 47 47 47 47 47 4 Maine 4 4 4 4 4 4 4 4 4 4 4 4 Maryland
14 MD-City of Baltimore 15 15 15 14 15 15 14 14 14 14 14 14
14 MD-Prince George’s County 14 14 14 14 14 14 14 103 14 14 14 14
14 MD-Rest of State 14 14 14 14 14 14 14 14 14 14 14 14 Massachusetts 2 MA-City of Boston 3 2 3 2 2 2 2 2 2 2 2 2 2 MA-Rest of State 2 2 2 2 2 2 2 2 2 2 2 2 Michigan
38 MI-City of Detroit 39 39 39 38 38 38 38 38 38 38 38 38 38 MI-Rest of State 38 38 38 38 38 38 38 38 38 38 38 38 Minnesota
40 MN-Twin Cities 40 40 40 40 93 40 40 40 40 40 40 40

Data User’s Guide for the 2015 NIS Public-Use Data File Page 70
CDIAP Area Name ITRUEIAP (1995-2004)
ESTIAP (2005)
ESTIAP06 (2006)
ESTIAP07 (2007)
ESTIAP08 (2008)
ESTIAP09 (2009)
ESTIAP10 (2010)
ESTIAP11 (2011)
ESTIAP12 (2012)
ESTIAP13 (2013)
ESTIAP14 (2014)
ESTIAP15 (2015)
40 MN-Rest of State 40 40 40 40 40 40 40 40 40 40 40 40 28 Mississippi 28 28 28 28 28 28 28 28 28 28 28 28 Missouri
58 MO-St. Louis County/City 58 82 58 58 58 58 58 58 58 58 58 58
58 MO-Rest of State 58 58 58 58 58 58 58 58 58 58 58 58 61 Montana 61 61 61 61 61 61 61 61 61 61 61 61 59 Nebraska 59 59 59 59 59 59 59 59 59 59 59 59 Nevada
73 NV-Clark County 73 83 73 73 73 73 73 73 73 73 73 73 73 NV-Rest of State 73 73 73 73 73 73 73 73 73 73 73 73 5 New Hampshire 5 5 5 5 5 5 5 5 5 5 5 5 New Jersey 8 NJ-City of Newark 9 9 9 8 8 8 8 8 8 8 8 8 8 NJ-Rest of State 8 8 8 8 8 8 8 8 8 8 8 8 New Mexico
49 NM-Southern NM 49 49 88 49 49 49 49 49 49 49 49 49 49 NM-Rest of State 49 49 49 49 49 49 49 49 49 49 49 49 New York
11 NY-City of New York 11 11 11 11 11 11 11 11 11 11 11 11
10 NY-Rest of State 10 10 10 10 10 10 10 10 10 10 10 10 29 North Carolina 29 29 29 29 29 29 29 29 29 29 29 29 62 North Dakota 62 62 62 62 62 62 62 62 62 62 62 62 Ohio
41 OH-Cuyahoga County 42 42 42 41 41 41 41 41 41 41 41 41
41 OH-Franklin County 43 43 41 41 41 41 41 41 41 41 41 41 41 OH-Rest of State 41 41 41 41 41 41 41 41 41 41 41 41 50 Oklahoma 50 50 50 50 50 50 50 50 50 50 50 50 76 Oregon 76 76 76 76 76 76 76 76 76 76 76 76 Pennsylvania
16 PA-Allegheny County 16 16 87 16 16 16 16 16 16 16 16 16
17 PA-Philadelphia County 17 17 17 17 17 17 17 17 17 17 17 17
16 PA-Rest of State 16 16 16 16 16 16 16 16 16 16 16 16

Data User’s Guide for the 2015 NIS Public-Use Data File Page 71
CDIAP Area Name ITRUEIAP (1995-2004)
ESTIAP (2005)
ESTIAP06 (2006)
ESTIAP07 (2007)
ESTIAP08 (2008)
ESTIAP09 (2009)
ESTIAP10 (2010)
ESTIAP11 (2011)
ESTIAP12 (2012)
ESTIAP13 (2013)
ESTIAP14 (2014)
ESTIAP15 (2015)
6 Rhode Island 6 6 6 6 6 6 6 6 6 6 6 6 30 South Carolina 30 30 30 30 30 30 30 30 30 30 30 30 63 South Dakota 63 63 63 63 63 63 63 63 63 63 63 63 Tennessee
31 TN-Davidson County 33 33 31 31 31 31 31 31 31 31 31 31 31 TN-Shelby County 32 32 32 31 31 31 31 31 31 31 31 31 31 TN-Rest of State 31 31 31 31 31 31 31 31 31 31 31 31 Texas
55 TX-Bexar County 55 55 55 55 55 55 55 55 55 55 55 55 54 TX-City of Houston 54 54 54 54 54 54 54 54 54 54 54 54 51 TX-Dallas County 52 52 52 52 52 52 52 52 52 51 51 51 53 TX-El Paso County 53 53 53 53 53 53 53 53 53 53 53 53 51 TX-Hidalgo County 51 51 51 51 51 51 51 51 51 51 51 107 51 TX-Rest of State 51 51 51 51 51 51 51 51 51 51 51 51 64 Utah 64 64 64 64 64 64 64 64 64 64 64 64 7 Vermont 7 7 7 7 7 7 7 7 7 7 7 7
18 Virginia 18 18 18 18 18 18 18 18 18 18 18 18 Washington*
77 WA-Eastern WA 77 77 771 77 774 774 97 77 77 77 77 77 77 WA-Western WA 77 77 77 773 774 774 102 77 77 77 77 77 77 WA-King County 78 78 78 77 77 77 102 77 77 77 77 77 77 WA-Rest of State 77 77 772 77 77 77 - 77 77 77 77 77 19 West Virginia 19 19 19 19 19 19 19 19 19 19 19 19 Wisconsin
44 WI-Milwaukee County 45 45 45 44 44 44 44 44 44 44 44 44
44 WI-Rest of State 44 44 44 44 44 44 44 44 44 44 44 44 65 Wyoming 65 65 65 65 65 65 65 65 65 65 65 65 - Puerto Rico - - - - - - - - - - 106 106
* The estimation area WA-Eastern WA was introduced in 2006, and while this estimation area also existed in 2010, the county definition of the area changed, making cross-year comparisons inadvisable. The estimation area WA-Western WA, introduced in 2007, presents the same issue. The counties included in the area changed (e.g., in 2010 it included King County). Analysis of Washington state data across years should use the entire state as the “Common Denominator”.

Data User’s Guide for the 2015 NIS Public-Use Data File Page 72
9. Summary Tables
Appendix F contains seven tables. Appendix Table F.1 lists the 61 estimation areas for the 2015 NIS by
state. At the national level and for each state and estimation area, it provides the estimated population
total of children aged 19 through 35 months of age in 2015, and (from 2015 NIS data collection) the
number of children with completed household interviews and number of children with adequate provider
data.
Appendix Tables F.2 through F.6 summarize pairs of variables: age group of child by maternal education
(Appendix Table F.2), age group by family poverty status (Appendix Table F.3), race/ethnicity by family
poverty status (Appendix Table F.4), age group by race/ethnicity (Appendix Table F.5), and age group by
gender (Appendix Table F.6). Each of these tables gives the unweighted and weighted counts of children
who have completed household interviews and the unweighted and weighted counts of children with
adequate provider data.
Appendix Table F.7 presents estimates of vaccination coverage and symmetric 95% confidence intervals
obtained from SUDAAN. The data user should obtain the same estimates from the 2015 NIS public-use
data file.
Appendix G contains four tables and time-series charts. Table G.1 and Figure G.1 show key components
of the NIS response rates and the CASRO response rates for the landline sample by year of the survey.
Table G.2 and Figure G.2 show key components of the NIS response rates and the CASRO response rates
for the cell-phone sample by year of the survey. Table G.3 and Figure G.3 show the CASRO response
rates for the combined landline and cell-phone samples. Table G.4 and Figure G.4 show vaccination
coverage estimates since 1995.
Appendix H shows the vaccine type codes used in the 2015 NIS public-use data file.

Data User’s Guide for the 2015 NIS Public-Use Data File Page 73
Appendix I presents key response rate components and the overall CASRO response rate by estimation
area in the 2015 NIS landline and cell-phone samples.
10. Assessment of Total Survey Error
Assessing the validity of the NIS estimates of vaccination coverage is a critical and ongoing aspect of the
NIS surveillance program. CDC frequently conducts evaluation studies and controlled experiments to
understand the causes and impacts of sampling and nonsampling errors on the estimates and enable
formulation of methodological refinements that have the demonstrated capacity to improve data quality.
As landline phone use decreased and cell phone use increased dramatically over the past 10 years, and the
NIS transitioned from a single-frame landline RDD sampling design to a dual-frame landline and cell
phone RDD design, CDC has monitored the NIS estimates utilizing a Total Survey Error (TSE) approach.
TSE is the sum of the errors that arise at every step of a survey, including both sampling error and
nonsampling errors such as coverage, nonresponse, and measurement errors (Mulry and Spencer, 1991).
Pooling information from multiple evaluations of their precision and accuracy, we have conducted TSE
analyses for the 2009-2012 NIS and NIS-Teen data (Molinari et al. 2011, Pineau et al. 2012; Pineau et al.
2013; Wolter et al. 2017 expected), including compoents for coverage error and nonresponse error. Figure
2 charts the estimated mean total error for NIS vaccination coverage rate estimators using the base/design
weights (i.e., unadjusted for nonresponse and not calibrated to population totals) and using the final
weights. For the 4:3:1:3:3:1 vaccine series, ≥1 MMR, and ≥4 DTaP, total error is smaller in 2010-2012
than in 2009. Final weights appear to reduce bias for 4:3:1:3:3:1 series vaccination coverage rate
estimator but not for 1+ MMR or 4+ DTaP.
For 2012, the TSE model was extended to include a form of measurement error called “provider under-
reporting” error, in addition to the coverage and nonresponse error components previously included in the
model (Wolter et al. 2017 expected). Sometimes also called “underascertainment,” provider under-
reporting error arises when a child with adequate provider data is truly vaccinated but is reported as

Data User’s Guide for the 2015 NIS Public-Use Data File Page 74
unvaccinated in the child’s provider-reported vaccination history. Under-reporting error can occur if the
household respondent fails to nominate all of the child’s vaccination providers, if one or more of the
child’s nominated vaccination providers fails to report a vaccination history for the child, or if one or
more of the child’s nominated providers reports a vaccination history but fails to report all of the
vaccinations the child has received. Figure 3 presents the estimated mean total error for 2012 NIS
vaccination coverage rate estimators first excluding and then including the under-reporting error
component in the TSE model. The addition of under-reporting error into the TSE model results in
negative estimates of TSE for the two vaccines and the vaccine series; that is, the results suggest that the
NIS vaccination coverage rate estimates may be lower than the true vaccination coverage rates for these
vaccines and this series, and that the total error is largely due to under-reporting error.
Figure 2: Comparison of Estimated Mean Total Error for 4:3:1:3:3:1 Series, ≥1 MMR, and ≥4 DTaP by Survey Year, National Immunization Survey, 2009-2012

Data User’s Guide for the 2015 NIS Public-Use Data File Page 75
Figure 3: Comparison of Estimated Mean Total Error for 4:3:1:3:3:1 Series, ≥1 MMR, and ≥4 DTaP, Excluding and Including the Under-Reporting Error Component, National Immunization Survey, 2012

Data User’s Guide for the 2015 NIS Public-Use Data File Page 76
11. Limitations
The findings in this report are subject to at least four limitations. First, because NIS is a telephone survey,
results are weighted to be representative of all children aged 19 through 35 months. Although statistical
adjustments were made to account for non-response and households without telephones, some bias might
remain. Second, underestimates of vaccination coverage might have resulted from the exclusive use of
provider-reported vaccination histories because completeness of these records is unknown. Third,
although national estimates of vaccination coverage are precise, estimates for state and local areas should
be interpreted with caution because their sample sizes are smaller and their confidence intervals generally
are wider than those for national estimates. Finally, analysis of trends across data years that span from
2010 and earlier to 2011-2015 are subject to potential bias that may remain after weighting adjustments
because of the switch from landline to dual landline and cell-phone frames in 2011. In addition, analysis
of trends across data years that span from 2011 to 2015 are subject to potential bias that may remain after
weighting adjustments because of the expansions and reductions of the share of the total sample that came
from the cell-phone frame across these years.

Data User’s Guide for the 2015 NIS Public-Use Data File Page 77
12. Citations for NIS Data
In publications, please acknowledge the original data source. The citation for the 2015 NIS public-use
data file is:
U.S. Department of Health and Human Services (DHHS). National Center for Health Statistics. The 2015
National Immunization Survey, Hyattsville, MD: Centers for Disease Control and Prevention, 2016.
Information about the NIS is located at http://www.cdc.gov/vaccines/imz-managers/nis/about.html.
The NIS public-use data files are located at http://www.cdc.gov/vaccines/imz-managers/nis/datasets.html.
Please place the acronym “NIS” in the titles, keywords, or abstracts of journal articles and other
publications in order to facilitate retrieval of such materials in bibliographic searches.
The following publications use NIS data, published from 2010 or later:
2016 Cardemil CV, Cullen KA, Harris L, Greby SM, Santibanez TA. Factors associated with provider reporting of child and adolescent vaccination history to Immunization Information Systems: Results from the National Immunization Survey, 2006-2012. J Public Health Management Practice 2016;22(3):245-254. Chen W, Elam-Evans LD, Hill HA, Yankey D. Employment and socioeconomic factors associated with children’s up-to-date vaccination status. Clinical Pediatrics 2016. (in press) Curran D, Terlinden A, Poirrier J-E, Masseria C, Krishnarajah G. Vaccine timeliness: A cost analysis of the potential implications of delayed pertussis vaccination in the US. Pediatr Infect Dis J 2016;35(5):542-547. Hu T, Decker SL, Chou S-Y. Medicaid pay for performance programs and childhood immunization status. Am J Prev Med 2016;50(5S1):S51-S57. Kurosky SK, Davis KL, Krishnarajah G. Completion and compliance of childhood vaccinations in the United States. Vaccine 2016 Jan 12;34(3):387-394. Murphy TV, Denniston MM, Hill HA, McDonald M, Klevens M, Elam-Evans LD, Nelson NP, Iskander J, Ward JD. Progress toward eliminating hepatitis A disease in the United States. MMWR Suppl 2016;65(1):29-41.

Data User’s Guide for the 2015 NIS Public-Use Data File Page 78
Santibanez TA, Grohskopf LA, Zhai Y, Kahn KE. Complete influenza vaccination trends for children six to twenty-three months. Pediatrics 2016;137(3):e20153280. Varan AK, Rodriguez-Lainz A, Hill HA, Elam-Evans LD, Yankey D, Li Q. Vaccination coverage disparities between foreign-born and U.S.-born children aged 19-35 months, United States, 2010-2012. J Immigrant Minority Health 2016 (in press). Walsh B, Doherty E, O’Neill C. Since the start of the Vaccines for Children program, uptake has increased, and most disparities have decreased. Health Affairs 2016;35(2):356-364. Zhao Z, Smith PJ, Hill HA. Evaluation of potentially achievable vaccination coverage with simultaneous administration of vaccines among children in the United States. Vaccine 2016;34:3030-3036.
2015
Crouch E, Dickes LA. A prediction model of childhood immunization rates. Appl Health Econ Health Policy 2015 Apr;13(2):243-251.
Dunn, AC, Black CL, Arnold J, Brodine S, Waalen J, Binkin N. Childhood vaccination coverage rates among military dependents in the United States. Pediatrics 2015 May;135(5):e1148-56.
Hill HA, Elam-Evans LD, Yankey D, Singleton JA, Kolasa M. National, state, and selected local area vaccination coverage among children aged 19-35 months – United States, 2014. MMWR 2015;64(33):889-896.
Joyce T, Reeder J. Changes in Breastfeeding among WIC participants following implementation of the new food package. Matern Child Health J 2015 Apr;19(4):868-76.
Smith PJ, Marcuse EK, Seward JF, Zhao Z, Orenstein WA. Children and adolescents unvaccinated against measles: geographic clustering, parents’ beliefs, and missed opportunities. Public Health Rep 2015 Sep-Oct;130(5):485-504.
Srivastav A, Zhai Y, Santibanez TA, Kahn KE, Smith PJ, Singleton JA. Influenza vaccination coverage of Vaccine for Children (VFC)-entitled versus privately insured children, United States, 2011-2013. Vaccine 2015. To appear.
Wolter KM, Tao X, Montgomery R, Smith PJ. Optimum allocation for a dual-frame telephone survey. Survey Methodology 2015 Dec;41(2):389-401.
2014
Elam-Evans LD, Yankey D, Singleton JA, Kolasa M. National, state, and selected local area vaccination coverage among children aged 19-35 months - United States, 2013. MMWR 2014;63(34):741-8.
Johnson NB, Hayes LD, Brown K, Hoo EC, Ethier KA. CDC National Health Report: leading causes of morbidity and mortality and associated behavioral risk and protective factors--United States, 2005-2013 MMWR 2014;63(Suppl-4):1-27.
Santibanez TA, Lu PJ, O’Halloran A, Meghani A, Grabowsky M, Singleton JA. Trends in childhood influenza vaccination coverage—U.S., 2004-2012. Public Health Rep 2014;129(5):417-27.

Data User’s Guide for the 2015 NIS Public-Use Data File Page 79
Thomas TN, Kolasa MS, Zhang F, Shefer AM. Assessing immunization interventions in the Women, Infants, and Children (WIC) Program. Am J Prev Med 2014 Sep 10. [Epub ahead of print: DOI: 10.1016/j.amepre.2014.06.017]
Walker AT, Smith PJ, Kolasa M. Reduction of racial/ethnic disparities in vaccination coverage, 1995-2011. MMWR Surveill Summ 2014 Apr 18;63 Suppl 1:7-12.
Whitney CG, Zhou F, Singleton J, Schuchat A. Benefits from immunization during the vaccines for children program era - United States, 1994-2013. MMWR 2014 Apr 25;63(16):352-5.
Yang YT, Debold V. A longitudinal analysis of the effect of nonmedical exemption law and vaccine uptake on vaccine-targeted disease rates. Am J Public Health 2014;104:371-377.
Zhao Z, Smith PJ, Yankey D, Copeland KR. Calculating adjusted survival functions for complex sample survey data and application to vaccination coverage studies with National Immunization Survey. British Journal of Mathematics & Computer Science 2014;4(18):2686-2698.
2013
Allen JA, Li R, Scanlon KS, Perrine CG, Chen J, Odom E, Black C. Progress in increasing breastfeeding and reducing racial/ethnic differences — United States, 2000–2008 births. MMWR 2013 Feb 8;62(5):77-80.
Black CL, Yankey D, Kolasa M. National, state, and local area vaccination coverage among children aged 19–35 months — United States, 2012. MMWR 2013 Sept 13;62(36):733-740.
Schuller KA, Probst JC. Factors associated with influenza vaccination among US children in 2008. J Infect Public Health 2013;6(2):80-88.
Zhao Z, Murphy TV. Which newborns missed the hepatitis B birth dose vaccination among U.S. children? Preventive Medicine. 2013, 57, 613-7.
Zhao Z, Smith P. Trends in vaccination coverage disparities among children, United States, 2001-2010. Vaccine. 2013, 31(19), 2324-2327
2012
Black CL, Yankey D, Kolasa M. National, state, and local area vaccination coverage among children aged 19-35 months – United States, 2011. MMWR 2012 Sept 7;61(35):689-696.
Bundy DG, Solomon BS, Kim JM, Miller MR. Accuracy and usefulness of the HEDIS childhood immunization measures. Pediatrics 2012;129(4):648-656.
Groom AV, Santibanez TA, Bryan RT. Vaccination coverage among American Indian and Alaska Native Children, 2006 – 2010. Pediatrics 2012;130(6):e1592-e1599.
Jensen E. Participation in the Supplemental Nutrition Program for Women, Infants, and Children (WIC) and breastfeeding: national, regional, and state level analyses. Matern Child Health J 2012;16:624-631.
Data User’s Guide for the 2015 NIS Public-Use Data File Page 80
Ransom J, Schaff K, Kan L. Is there an association between local health department organizational and administrative factors and childhood immunization coverage rates? J Health Hum Serv Adm 2012 Spring;34(4):418-455.
Santibanez TA, Shefer A, Briere EC, Cohn AC, Groom AV. Effects of a nationwide Hib vaccine shortage on vaccination coverage. Vaccine 2012;30:941-947.
Thompson KM, Wallace GS, Tebbens RJD, Smith PJ, Barskey AE, Pallansch MA, Gallagher KM, Alexander JP, Armstrong GL, Cochi SL, Wassilak SGF. Trends in the risk of U.S. polio outbreaks and poliovirus vaccine availability for response. Public Health Rep 2012;127:23-37.
Zhao Z, Murphy TV. The association of hepatitis B vaccine supply policy with timing of receipt of the first dose of hepatitis B vaccination. Open Journal of Statistics 2012;2:429-434.
2011
Black CL, Wooten KG, Yankey D, Kolasa M. National and state vaccination coverage among children aged 19-35 months – United States, 2010. MMWR 2011 Sept 2;60(34):1157-1163.
Byrd KK, Santibanez TA, Chaves SS. Predictors of hepatitis A vaccination among young children in the United States. Vaccine 2011;29:3254-3259.
Dozier AM, McKee KS. State breastfeeding worksite statutes… breastfeeding rates … and….. Breastfeed Med 2011;6(5):319-324.
Flaherman VJ, Chien AT, McCulloch CE, Dudley RA. Breastfeeding rates differ significantly by method used: a cause for concern for public health measurement. Breastfeed Med 2011;6(1):31-35.
Molinari NM, Wolter KM, Skalland B, Montgomery R, Khare M, Smith PJ, Barron ML, Copeland K, Santos K, Singleton JA. Quantifying bias in a health survey: modeling total survey error in the National Immunization Survey. Stat Med 2011;30:505-514.
Smith PJ, Humiston SG, Marcuse EK, Zhao Z, Dorell CG, Howes C, Hibbs B. Parental delay or refusal of vaccine doses, childhood vaccination coverage at 24 months of age, and the health belief model. Public Health Rep. 2011 Jul-Aug;126 Suppl 2:135-46.
Smith PJ, Lindley MC, Rodewald LE. Vaccination coverage among U.S. Children aged 19-35 months entitled by the Vaccines for Children Program, 2009. Public Health Rep 2011 Jul-Aug;126 Suppl 2:109-23.
Smith PJ, Singleton JA. County-level trends in vaccination coverage among children aged 19-35 months – United States, 1995 – 2008. MMWR Surveill Summ 2011 Apr 29;60(4):1-86.
Smith PJ, Singleton JA. County-level trends in vaccination coverage for selected counties in the U.S., children aged 19-35 months, United States, 1995-2008: attainment of the healthy people 2010 objectives and association with county-level indices of access to care, economic conditions, and demographic composition. Morbidity and Mortality Weekly Report. Surveillance Summaries. 2011;60(4):1-86. Smith PJ, Wood D, Darden PM. Highlights of historical events leading to national surveillance of vaccination coverage in the United States. Public Health Reports. 2011;(Suppl 2):3-12.

Data User’s Guide for the 2015 NIS Public-Use Data File Page 81
Zhao Z. Power of tests for comparing trend curves with application to National Immunization Survey (NIS). Stat Med 2011;30:531-540.
Zhao Z, Murphy TV, Jacques-Carroll L. Progress in newborn hepatitis B vaccination by birth year cohorts – 1998-2007, USA. Vaccine 2011;30:14-20.
2010
Cohen SA, Ahmed S, Klassen AC, Agree EM, Louis TA, Naumova EN. Childhood Hib vaccination and pneumonia and influenza burden in US seniors. Vaccine 2010;28:4462-4469.
Committee on Practice and Ambulatory Medicine and Council on Community Pediatrics. Increasing immunization coverage. Pediatrics 2010;125:1295-1304.
Groom H, Kennedy A, Evans V, Fasano N. Qualitative analysis of immunization programs with most improved childhood vaccination coverage from 2001 to 2004. J Public Health Management Practice 2010;16(1):E1-E8.
Kennedy A, Groom H, Evans V, Fasano N. A qualitative analysis of immunization programs with sustained high coverage, 200-2005. J Public Health Management Practice 2010;16(1):E9-E17.
McElligott JT, Darden PM. Are patient-held vaccination records associated with improved vaccination coverage rates? Pediatrics 2010;125(3):e467-e472.
Mennito SH, Darden PM. Impact of practice policies on pediatric immunization rates. J Pediatr 2010;156:618-622.
Santibanez TA, Singleton JA, Shefer A, Cohn A. Changes in measurement of Haemophilus influenzae serotype b (Hib) vaccination coverage – National Immunization Survey, United States, 2009. MMWR 2010 Aug 27;59(33):1069-1072.
Scanlon KS, Grummer-Strawn L, Li R, Chen J. Racial and ethnic differences in breastfeeding initiation and duration, by state – National Immunization Survey, United States, 2004-2008. MMWR 2010 Mar 26;59(11):327-334.
Smith PJ, Humiston SG, Parnell T, Vannice KS, Salmon DA. The association between intentional delay of vaccine administration and timely childhood vaccination coverage. Public Health Rep 2010;125:534-541.
Wooten KG, Kolasa M, Singleton JA, Shefer A. National, state, and local area vaccination coverage among children aged 19-35 months – United States, 2009. MMWR 2010 Sep 17;59(36):1171-1177.
Zhao Z, Luman ET. Progress Toward eliminating disparities in vaccination coverage among U.S. children, 2000–2008. Am J Prev Med 2010;38(2):127–137.

Data User’s Guide for the 2015 NIS Public-Use Data File Page 82
13. References
The American Association for Public Opinion Research (2015). Standard Definitions: Final Dispositions of Case Codes and Outcome Rates for Surveys.
Blumberg, S.J. and Luke, J.V. (2016). Wireless substitution: Early release of estimates from the National Health Interview Survey, July-December 2015. National Center for Health Statistics. http://www.cdc.gov/nchs/data/nhis/earlyrelease/wireless201605.pdf
Blumberg, S.J., Luke, J.V., Ganesh, N., Davern, M.E., Boudreaux, M.H. and Soderberg, K. (2011). Wireless substitution: State-level estimates from the National Health Interview Survey, January 2007–June 2010. National Center for Health Statistics. http://www.cdc.gov/nchs/data/nhsr/nhsr039.pdf
Brick, J.M. and Kalton, G. (1996). Handling missing data in survey research. Statistical Methods in Medical Research, 5:215–238.
Council of American Survey Research Organizations (1982). On the Definition of Response Rates: A Special Report of the CASRO Task Force on Completion Rates. Council of American Survey Research Organizations: http://www.casro.org.
Centers for Disease Control and Prevention (1994). Reported vaccine-preventable diseases - United States, 1993, and the Childhood Immunization Initiative. MMWR, 43:57-60.
Centers for Disease Control and Prevention (2000). Prevention of pneumococcal disease among infants and young children using a pneumococcal conjugate vaccine. Recommendations of the Advisory Committee on Immunization Practices (ACIP). MMWR, 49(RR-9):1-35.
Centers for Disease Control and Prevention (2002). National Immunization Survey: Guide to Quality Control Procedures. http://www.cdc.gov/nchs/data/nis/qcman.pdf.
Centers for Disease Control and Prevention (2003). Prevention and control of influenza: recommendations of the Advisory Committee on Immunization Practices (ACIP). MMWR, 52(RR-8):1-34.
Centers for Disease Control and Prevention (2010). Changes in measurement of Haemophilus influenzae serotype b (Hib) vaccination coverage—National Immunization Survey, United States, 2009. MMWR 2010;59:1069--72. http://www.cdc.gov/mmwr/preview/mmwrhtml/mm5933a3.htm.
Coronado, V.G., Maes, E.F., Rodewald, L.E., Chu, S., Battaglia, M.P., Hoaglin, D.C., Merced, N.L., Yusuf, H., Cordero, J.F., and Orenstein, W.A. (2000). Risk factors for underimmunization among 19-35 month-old children in the United States: National Immunization Survey, July 1996-June 1998. Unpublished manuscript, Centers for Disease Control and Prevention, Atlanta.
Deming, W.E. (1943). Statistical Adjustment of Data. New York: Wiley.
Ezzati-Rice, T.M., Zell, E.R., Battaglia, M.P., Ching, P.L.Y.H., and Wright, R.A. (1995). The design of the National Immunization Survey. 1995 Proceedings of the Section on Survey Research Methods, Alexandria, VA: American Statistical Association, pp. 668-672.

Data User’s Guide for the 2015 NIS Public-Use Data File Page 83
Ford, B.L. (1983). An overview of hot-deck procedures, in: Incomplete data in sample surveys, Madow W. G., Olkin I., Rubin D. B. (Eds.), Academic Press, New York, pp. 185-207.
Khare, M., Battaglia, M.P., Huggins, V.J., Stokley, S., Hoaglin, D.C., Wright, R.A., and Rodén, A.-S. (2000). Accuracy of vaccination dates reported by immunization providers in the National Immunization Survey. 2000 Proceedings of the Section on Survey Research Methods. Alexandria, VA: American Statistical Association, pp. 665-670.
Khare, M., Battaglia, M.P., Stokley, S., Wright, R.A., and Huggins, V.J. (2001). Quality of immunization histories reported in the National Immunization Survey. Proceedings of the International Conference on Quality in Official Statistics (CD-ROM). Stockholm: Statistics Sweden.
Lepkowski, J.M. (1988). Telephone sampling methods in the United States. Telephone Survey Methodology. Edited by Groves, R.M., Biemer, P.P., Lyberg, L.E., Massey, J.T., Nicholls, W.L., and Waksberg, J. New York: John Wiley & Sons, pp. 73-98.
Lumley, T. (2010). Survey Analysis in R. http://faculty.washington.edu/tlumley/survey/
Molinari, N., Wolter, K., Skalland, B., Montgomery, R., Khare, M., Smith, P., and Singleton, J. (2011). Quanitfying Bias in a Health Surey: Modeling Total Surey Error in the National Immunization Survey. Statistics in Medicine, 505-515.
Mulry, M. H. and Spencer, B. C. (1991). Total Error in PES Estimates of Population. Journal of the American Statistical Association, 839-863.
National Center for Health Statistics (1999). National Health Interview Survey: Research for the 1995-2004 Redesign. Vital and Health Statistics, Series 2, No. 126 (DHHS publication no. (PHS) 99-1326). Hyattsville, MD: National Center for Health Statistics.
National Center for Health Statistics. (2011). Natality Data, Public-Use Data Files. http://www.cdc.gov/nchs/data_access/vitalstatsonline.htm.
National Center for Health Statistics. (2012). Natality Data, Public-Use Data Files. http://www.cdc.gov/nchs/data_access/vitalstatsonline.htm.
National Center for Health Statistics. (2013). Natality Data, Public-Use Data Files. http://www.cdc.gov/nchs/data_access/vitalstatsonline.htm.
National Center for Health Statistics. (2015). National Immunization Survey 2014 Public-Use Data File: Documentation, Codebook and Frequencies. Hyattsville, MD.
National Center for Immunization and Respiratory Diseases. (2016). National Immunization Survey 2015 Public-Use Data File: Documentation, Codebook and Frequencies. Hyattsville, MD.
Pineau, V., Wolter, K., Skalland, B., Zeng, W., Zhao, Z. and Khare, M. (2012). Modeling Total Survey error in the 2010 National Immunization survey (NIS): Pre-School Children and Teens. Presented at the 2012 American Statistical Association (ASA) Joint Statistical Meetings, San Diego, CA.
Pineau, V., Wolter, K., Skalland, B., Zeng, W., Black, C., Dorell, C., Khare, M., and Yankey, D. (2013). Modeling Total Surey Error in the 2011 national Immunization Survey (NIS): Pre-School Children and

Data User’s Guide for the 2015 NIS Public-Use Data File Page 84
Teens. Presented at the 2013 American Statistical Association (ASA) Joint Statistical Meetings, Montreal, Canada.
Research Triangle Institute (2008). SUDAAN Language Manual, Release 9.0. Research Triangle Park, NC: Research Triangle Institute.
Robinson, C.L. (2016). Advisory committee on immunization practices recommended immunization schedules for persons aged 0 through 18 years--United States, 2016. MMWR 65(4): 86-87.
Rosenbaum, P.R. (1987). Model-based direct adjustment. Journal of the American Statistical Association, 82:387-394.
Rosenbaum, P.R. and Rubin, D.B. (1983). The central role of the propensity score in observational studies for causal effects. Biometrika, 70:41-55.
Rosenbaum, P.R. and Rubin, D.B. (1984). Reducing bias in observational studies using subclassification on the propensity score. Journal of the American Statistical Association, 79:516-534.
SAS Institute Inc. (2003). SAS/STAT User’s Guide, Version 8. Cary, NC: SAS Institute Inc.
Smith, P.J., Battaglia, M.P., Huggins, V.J., Hoaglin, D.C., Rodén, A.-S., Khare, M., Ezzati-Rice, T.M., and Wright, R.A. (2001a). Overview of the sampling design and statistical methods used in the National Immunization Survey. American Journal of Preventive Medicine, 20(4S):17-24.
Smith, P.J., Rao, J.N.K., Battaglia, M.P., Ezzati-Rice, T.M., Daniels, D., and Khare, M. (2001b). Compensating for Provider Non-response Using Response Propensities to Form Adjustment Cells: The National Immunization Survey. Vital and Health Statistics, Series 2, No. 133 (DHHS publication no. (PHS) 2001-1333). Hyattsville, MD: National Center for Health Statistics.
Smith, P.J., Hoaglin, D.C., Battaglia, M.P., Khare, M., and Barker, L.E. (2005), Statistical Methodology of the National Immunization Survey: 1994-2002. National Center for Health Statistics. Vital Health Stat 2(138).
StataCorp (2005). Stata Statistical Software: Release 9. College Station, TX: StataCorp LP.
Wall, T.P., Kochanek, K.M., Fitti, J.E., and Zell, E.R. (1995). The use of real time translation services in RDD telephone surveys. Presented at the 1995 Conference of the American Association for Public Opinion Research, Fort Lauderdale, FL.
Wolter, K. M. (2007). Introduction to Variance Estimation. New York, NY: Springer-Verlag.
Wolter, K., Pineau, V., Skalland, B., Zeng, W., Singleton, J., Khare, M., Zhao, Z., Yankey, D., and Smith, P. (2017 expected). Total survey error assessment for socio-demographic subgroups in the 2012 U.S. National Immunization Survey. In Biemer, P., De Leeuw, E., Edwards, B., Kreuter, F., Lyberg, L., Tucker, C., and West, B. (Eds.) Total Survey Error in Practice, John Wiley & Sons, Inc., Hoboken, NJ, USA..
Zell, E.R., Ezzati-Rice, T.M., Battaglia, M.P., and Wright, R.A. (2000). National Immunization Survey: The methodology of a vaccination surveillance system. Public Health Reports, 115(1):65-77.

Data User’s Guide for the 2015 NIS Public-Use Data File Appendix A Page 85
Appendix A: Glossary of Abbreviations and Terms
3:3:1 The series of 3 or more DTaP vaccinations, 3 or more polio vaccinations, and 1 or more MCV vaccinations
4:3:1 The series of 4 or more DTaP vaccinations, 3 or more polio vaccinations, and 1 or
more MCV vaccinations
4:3:1:3 The series of 4 or more DTaP vaccinations, 3 or more polio vaccinations, 1 or more MCV vaccinations, and 3 or more Hib vaccinations of any type
4:3:1:3* (routine Hib)
The series of 4 or more DTaP vaccinations, 3 or more polio vaccinations, 1 or more MCV vaccinations, and 3 or 4 Hib vaccinations depending on manufacturer (routine recommendation)
4:3:1:3:3 The series of 4 or more DTaP vaccinations, 3 or more polio vaccinations, 1 or more
MCV vaccinations, 3 or more Hib vaccinations of any type, and 3 or more hepatitis B vaccinations
4:3:1:3*:3 (routine Hib)
The series of 4 or more DTaP vaccinations, 3 or more polio vaccinations, 1 or more MCV vaccinations, 3 or 4 Hib vaccinations depending on manufacturer (routine recommendation), and 3 or more hepatitis B vaccinations
4:3:1:3:3:1 The series of 4 or more DTaP vaccinations, 3 or more polio vaccinations, 1 or more
MCV vaccinations, 3 or more Hib vaccinations of any type, 3 or more hepatitis B vaccinations, and 1 or more varicella vaccinations given at age 12 months or older
4:3:1:3*:3:1 (routine Hib)
The series of 4 or more DTaP vaccinations, 3 or more polio vaccinations, 1 or more MCV vaccinations, 3 or 4 Hib vaccinations depending on manufacturer (routine recommendation), 3 or more hepatitis B vaccinations, and 1 or more varicella vaccinations given at age 12 months or older
4:3:1:3:3:1:3 The series of 4 or more DTaP vaccinations, 3 or more polio vaccinations, 1 or more
MCV vaccinations, 3 or more Hib vaccinations of any type, 3 or more hepatitis B vaccinations, 1 or more varicella vaccinations given at age 12 months or older, and 3 or more pneumococcal vaccinations
4:3:1:3*:3:1:3 (routine Hib)
The series of 4 or more DTaP vaccinations, 3 or more polio vaccinations, 1 or more MCV vaccinations, 3 or 4 Hib vaccinations depending on manufacturer (routine recommendation), 3 or more hepatitis B vaccinations, 1 or more varicella vaccinations given at age 12 months or older, and 3 or more pneumococcal vaccinations
4:3:1:3:3:1:4 The series of 4 or more DTaP vaccinations, 3 or more polio vaccinations, 1 or more
MCV vaccinations, 3 or more Hib vaccinations of any type, 3 or more hepatitis B vaccinations, 1 or more varicella vaccinations given at age 12 months or older, and 4 or more pneumococcal vaccinations

Data User’s Guide for the 2015 NIS Public-Use Data File Appendix A Page 86
4:3:1:3*:3:1:4 (routine Hib)
The series of 4 or more DTaP vaccinations, 3 or more polio vaccinations, 1 or more MCV vaccinations, 3 or 4 Hib vaccinations depending on manufacturer (routine recommendation), 3 or more hepatitis B vaccinations, 1 or more varicella vaccinations given at age 12 months or older, and 4 or more pneumococcal vaccinations
CATI Computer-assisted telephone interviewing CDC Centers for Disease Control and Prevention CII Childhood Immunization Initiative DOB Date of birth DTaP Diphtheria and tetanus toxoids and acellular pertussis DTP Diphtheria and tetanus toxoids and pertussis DT Diphtheria and tetanus toxoids FLU Seasonal influenza H1N Monovalent 2009 H1N1 influenza Hep A Hepatitis A Hep B Hepatitis B
Haemophilus influenzae type b Hib Hib routine recommendation
Four or more doses of Hib vaccine of any type, or two or more doses of Hib vaccine of Merck types followed by one dose of Hib vaccine of any type
Hib shortage recommendation
Three or more doses of Hib vaccine of any type or two or more doses of Hib accine of Merck types v
IAP Immunization Action Plan IHQ Immunization history questionnaire IPV Inactivated poliovirus vaccine MCV Measles-containing vaccine MMR Measles, mumps, and rubella NCHS National Center for Health Statistics NCIRD National Center for Immunization and Respiratory Diseases NIS National Immunization Survey

Data User’s Guide for the 2015 NIS Public-Use Data File Appendix A Page 87
NHIS National Health Interview Survey NIP National Immunization Program OPV Oral poliovirus vaccine PCV Pneumococcal conjugate vaccine PRC Provider Record Check PUF Public-use (Data) File RDD Random digit dialing ROT Rotavirus SC Shot card UTD Up-to-date VFC Vaccines for Children VRC Varicella

Data User’s Guide for the 2015 NIS Public-Use Data File APPENDIX B
88
Appendix B: Summary Statistics for Sampling Weights by Estimation Area
Table B.1: Distribution of Dual-Frame Sampling Weights* for Children with Completed Household Interviews, National Immunization Survey, 2015
State/Estimation Area n Sum Minimum Maximum Mean Coefficient
of Variation U.S. National† 26,975 5701539.58 2.49 5856.42 211.36 152.40 Alabama 494 84042.20 18.12 534.23 170.13 69.71 Alaska 498 15311.61 9.33 71.47 30.75 44.26 Arizona 479 125138.52 20.05 785.29 261.25 73.59 Arkansas 419 54196.27 15.97 408.59 129.35 78.00 California 646 724479.75 2.72 5856.42 1121.49 116.29 Colorado 440 95511.01 6.16 608.81 217.07 63.54 Connecticut 469 54155.77 24.99 313.84 115.47 62.84 Delaware 410 15716.58 10.98 97.89 38.33 51.43 District of Columbia 576 12398.05 5.04 57.95 21.52 58.59 Florida 546 315013.51 4.08 2155.42 576.95 81.42 Georgia 540 186272.22 5.73 1131.67 344.95 75.82 Hawaii 469 25965.60 10.63 158.15 55.36 46.95 Idaho 985 222541.86 7.67 647.00 225.93 60.61 Illinois 320 56511.16 9.06 486.16 176.60 54.92 IL-City of Chicago 665 166030.70 7.67 647.00 249.67 58.77 IL-Rest of State 342 30722.98 11.20 199.78 89.83 35.78 Indiana 426 121057.24 9.40 779.35 284.17 56.75 Iowa 444 55272.78 15.93 339.31 124.49 52.43 Kansas 367 58367.35 21.06 383.41 159.04 47.62 Kentucky 437 78299.08 16.10 446.13 179.17 53.08 Louisiana 427 88668.64 12.01 569.50 207.65 56.60 Maine 386 18614.44 9.50 118.10 48.22 64.51 Maryland 658 105465.39 17.19 640.48 160.28 97.02 Massachusetts 521 102929.55 7.45 635.30 197.56 69.43 Michigan 427 162006.92 7.12 1117.42 379.41 61.91 Minnesota 521 100888.34 8.01 508.60 193.64 55.95 Mississippi 464 54235.40 14.16 327.67 116.89 64.91 Missouri 401 106676.79 6.80 771.46 266.03 62.75 Montana 390 17100.50 7.50 129.34 43.85 63.47 Nebraska 1,119 334940.01 7.43 840.98 299.32 54.57 Nevada 564 167964.60 7.83 768.38 297.81 50.26 New Hampshire 555 166975.41 7.43 840.98 300.86 58.58 New Jersey 374 37665.32 9.25 269.45 100.71 51.69 New Mexico 377 51393.29 15.03 387.23 136.32 54.59 New York 372 19116.11 14.11 118.93 51.39 44.47 NY-City of New York 557 153666.94 6.28 784.93 275.88 68.83 NY-Rest of State 400 39050.01 9.05 309.14 97.63 69.32 North Carolina 483 173794.97 5.61 1088.16 359.82 68.51 North Dakota 398 15261.69 12.76 99.81 38.35 48.98 Ohio 418 198461.09 52.54 1299.35 474.79 56.85 Oklahoma 376 75919.74 13.69 557.45 201.91 57.74 Oregon 341 67036.19 19.96 488.97 196.59 50.53 Pennsylvania 1,039 204791.65 4.12 1172.48 197.10 128.81

Data User’s Guide for the 2015 NIS Public-Use Data File APPENDIX B
89
State/Estimation Area n Sum Minimum Maximum Mean Coefficient
of Variation PA-Philadelphia County 487 33050.31 8.02 171.48 67.87 52.06 PA-Rest of State 552 171741.34 4.12 1172.48 311.13 97.77 Rhode Island 463 16313.23 7.31 89.78 35.23 56.77 South Carolina 487 82138.06 8.07 496.30 168.66 66.60 South Dakota 399 17989.42 10.41 135.79 45.09 58.72 Tennessee 2,586 568417.14 6.68 1332.10 219.81 123.81 Texas 428 39136.32 20.67 232.89 91.44 59.10 TX-Bexar County 360 71255.42 6.68 558.53 197.93 59.88 TX-City of Houston 348 20393.13 9.42 160.04 58.60 53.75 TX-El Paso County 370 23985.20 13.14 194.24 64.82 48.42 TX-Hidalgo County 1,080 413647.08 12.43 1332.10 383.01 90.81 TX-Rest of State 372 117279.88 7.90 856.16 315.27 56.87 Utah 379 73265.59 6.44 594.20 193.31 63.54 Vermont 409 8540.46 6.88 53.12 20.88 45.37 Virginia 655 149555.84 2.49 1134.16 228.33 138.71 Washington 526 127236.49 5.51 757.19 241.89 70.36 West Virginia 453 29917.36 15.15 179.29 66.04 56.79 Wisconsin 389 98535.31 11.40 648.83 253.30 55.71 Wyoming 421 10205.41 6.09 59.66 24.24 51.41 U.S. Virgin Islands 580 1956.18 1.00 9.75 3.37 60.70 Guam 467 5058.12 2.89 29.73 10.83 51.56 Puerto Rico 617 50147.68 7.58 241.03 81.28 64.64
* Distribution of RDDWT_D_TERR. † Excludes territories.

Data User’s Guide for the 2015 NIS Public-Use Data File APPENDIX B
90
Table B.2: Distribution of Dual-Frame Sampling Weights* for Children with Adequate Provider Data, National Immunization Survey, 2015
State/Estimation Area n Sum Minimum Maximum Mean Coefficient
of Variation U.S. National† 15,167 5701539.58 2.88 10146.43 375.92 157.96 Alabama 272 84042.20 34.01 1037.67 308.98 81.00 Alaska 295 15311.61 10.94 139.53 51.90 55.93 Arizona 266 125138.52 32.25 1471.44 470.45 71.58 Arkansas 229 54196.27 24.97 760.01 236.66 69.68 California 345 724479.75 5.81 10146.43 2099.94 115.04 Colorado 246 95511.01 13.05 1155.94 388.26 65.45 Connecticut 250 54155.77 31.47 662.34 216.62 70.73 Delaware 232 15716.58 18.36 187.50 67.74 52.49 District of Columbia 321 12398.05 8.66 112.74 38.62 67.91 Florida 273 315013.51 12.46 4150.20 1153.90 79.82 Georgia 286 186272.22 7.83 2270.88 651.30 83.68 Hawaii 261 25965.60 14.71 278.73 99.49 57.61 Idaho 559 222541.86 15.89 1372.45 398.11 64.58 Illinois 188 56511.16 15.89 824.42 300.59 54.61 IL-City of Chicago 371 166030.70 19.86 1372.45 447.52 62.72 IL-Rest of State 209 30722.98 26.86 371.18 147.00 43.79 Indiana 231 121057.24 13.71 1517.24 524.06 65.42 Iowa 279 55272.78 26.35 553.23 198.11 53.60 Kansas 228 58367.35 27.98 677.68 256.00 50.64 Kentucky 241 78299.08 45.55 946.74 324.89 59.03 Louisiana 223 88668.64 22.24 1199.60 397.62 72.67 Maine 221 18614.44 14.04 286.16 84.23 73.13 Maryland 361 105465.39 36.14 1095.56 292.15 95.10 Massachusetts 307 102929.55 14.98 1112.50 335.28 71.32 Michigan 254 162006.92 19.74 2044.04 637.82 63.45 Minnesota 289 100888.34 14.66 1058.13 349.09 60.95 Mississippi 233 54235.40 14.79 780.21 232.77 78.42 Missouri 226 106676.79 10.41 1408.63 472.02 65.73 Montana 251 17100.50 12.72 201.39 68.13 63.96 Nebraska 566 334940.01 13.11 1845.71 591.77 62.49 Nevada 291 167964.60 13.11 1845.71 577.20 62.04 New Hampshire 275 166975.41 15.26 1822.61 607.18 62.89 New Jersey 231 37665.32 15.37 451.28 163.05 56.41 New Mexico 214 51393.29 43.71 706.19 240.16 56.18 New York 195 19116.11 29.15 234.33 98.03 46.21 NY-City of New York 272 153666.94 15.01 1839.92 564.95 77.49 NY-Rest of State 244 39050.01 12.60 543.39 160.04 72.52 North Carolina 261 173794.97 14.03 2334.24 665.88 69.71 North Dakota 234 15261.69 16.76 174.98 65.22 51.48 Ohio 219 198461.09 102.16 2922.31 906.22 68.63 Oklahoma 220 75919.74 18.92 1049.34 345.09 63.84 Oregon 192 67036.19 35.96 1023.25 349.15 55.53 Pennsylvania 575 204791.65 13.58 1934.41 356.16 123.75 PA-Philadelphia County 272 33050.31 18.32 347.32 121.51 59.47 PA-Rest of State 303 171741.34 13.58 1934.41 566.80 91.75 Rhode Island 272 16313.23 9.54 176.80 59.98 60.77 South Carolina 259 82138.06 18.63 980.28 317.14 65.37 South Dakota 219 17989.42 16.67 249.80 82.14 61.54

Data User’s Guide for the 2015 NIS Public-Use Data File APPENDIX B
91
State/Estimation Area n Sum Minimum Maximum Mean Coefficient
of Variation Tennessee 1,500 568417.14 9.58 2419.46 378.94 129.72 Texas 224 39136.32 41.28 441.39 174.72 52.37 TX-Bexar County 214 71255.42 12.66 987.02 332.97 56.63 TX-City of Houston 211 20393.13 9.58 261.50 96.65 53.31 TX-El Paso County 255 23985.20 22.72 257.47 94.06 49.24 TX-Hidalgo County 596 413647.08 18.63 2419.46 694.04 92.49 TX-Rest of State 210 117279.88 11.54 1640.26 558.48 67.42 Utah 247 73265.59 10.57 914.27 296.62 68.25 Vermont 262 8540.46 10.59 83.87 32.60 44.56 Virginia 373 149555.84 2.88 1687.22 400.95 132.25 Washington 309 127236.49 11.62 1374.37 411.77 74.67 West Virginia 241 29917.36 18.71 369.77 124.14 72.90 Wisconsin 245 98535.31 16.35 1159.22 402.18 60.42 Wyoming 219 10205.41 6.09 138.25 46.60 61.74 U.S. Virgin Islands 327 1956.18 1.01 19.31 5.98 70.38 Guam 282 5058.12 4.10 49.96 17.94 52.87 Puerto Rico 224 50147.68 25.12 726.38 223.87 72.90
* Distribution of PROVWT_D_TERR. † Excludes territories.

Data User’s Guide for the 2015 NIS Public-Use Data File APPENDIX C 92
Appendix C: Flags for Inconsistent Values in the Breastfeeding Data
Two different types of inconsistency can arise in breastfeeding data. The first is that the duration of any breastfeeding can exceed the age of the child, and the second is that the age of the child when first fed formula can exceed the age of child. BF_ENDR06 stores the duration of any breastfeeding, and BF_ENDFL06 flags the inconsistency; BF_FORMR08 stores the age of the child when first fed formula, and BF_FORMFL06 flags the inconsistency.
1. Both BF_ENDR06 and BF_FORMR08 are formulated using the following conversion factors:
if unit=1(days) then BF_ENDR06 = number x 1 if unit=2(weeks) then BF_ENDR06 = number x 7 if unit=3(months) then BF_ENDR06 = number x 30.4375 if unit=4(years) then BF_ENDR06 = number x 365.25 if unit=1(days) then BF_FORMR08 = number x 1 if unit=2(weeks) then BF_FORMR08 = number x 7 if unit=3(months) then BF_FORMR08 = number x 30.4375 if unit=4(years) then BF_FORMR08 = number x 365.25
2. Flagging BF_ENDR06 when the duration of any breastfeeding exceeds the age in days with a
buffer for different units:
if unit=1(days) flag when BF_ENDR06 > age + 1 if unit=2(weeks) flag when BF_ENDR06 > age + 3 if unit=3(months) flag when BF_ENDR06 > age + 15 if unit=4(years) flag when BF_ENDR06 > age + 182
The different buffers allow for the impact of rounding durations upward in the specified units (for example, 50 days might be reported as 2 months).
3. Flagging BF_FORMR08 when the age when first fed formula exceeds the age in days with a buffer for different units:
if unit=1(days) flag when BF_FORMR08 > age + 1 if unit=2(weeks) flag when BF_FORMR08 > age + 3 if unit=3(months) flag when BF_FORMR08 > age + 15 if unit=4(years) flag when BF_FORMR08 > age + 182
The different buffers allow for the impact of rounding durations upward in the specified units (for example, 50 days might be reported as 2 months).

Data User’s Guide for the 2015 NIS Public-Use Data File APPENDIX D 93
Appendix D: Programs for Estimation: Examples of the Use of SUDAAN, SAS, and R to Estimate Vaccination Coverage Rates and Their Standard Errors, and an Example of the Production of a Cross-Tabulation and Chart
I. SUDAAN (RTI, 2008) Page 94 II. SAS (SAS, 2003) Page 107 III. ‘R’ (Lumley, 2009) Page 118

Data User’s Guide for the 2015 NIS Public-Use Data File APPENDIX D 94
A. SUDAAN **********************; title1 'SUD_IAP.SAS'; ********************************************************************** THIS PROGRAM WILL PRODUCE ESTIMATION AREA ESTIMATES AND STANDARD ERRORS FOR P_UTD431H314_ROUT_S USING SAS CALLABLE SUDAAN. SUDAAN NOTES: 1. ALL VARIABLES USED MUST BE NUMERIC. 2. VARIABLES IN THE SUBGROUP STATEMENT MUST HAVE VALUES 1,2,..K WHERE K IS THE NUMBER OF LEVELS FOR EACH VARIABLE. 3. DATA MUST BE SORTED ACCORDING TO THE SAMPLE DESIGN VARIABLES (STRATUM AND PRIMARY SAMPLING UNIT), SPECIFIED IN THE NEST STATEMENT. **********************************************************************; options ps=78 ls=90 obs= max; libname dd 'c:\nispuf15'; *--- SPECIFY PATH TO SAS DATASET ---*; libname library 'c:\nispuf15'; *--- IF DATASET WAS CREATED WITH FORMATS STORED ---*; *--- PERMANENTLY SPECIFY PATH TO LIBRARY ---*; *--- OTHERWISE COMMENT THIS STATEMENT OUT ---*; %let in_file=dd.nispuf15; *--- NAME OF SAS DATASET ---*; %let estiap=estiap15; * --- ESTIMATION AREA VARIABLE TO USE ---*; %let wt=provwt_d; * --- WEIGHT TO USE (PROVWT_D is the dual-frame weight excluding territories. Use PROVWT_D_TERR to include territories) ---*; %let strat=stratum; * --- STRATUM VARIABLE TO USE FOR VARIANCE ESTIMATION; Proc format; /* THE FOLLOWING FORMAT WILL BE USED FOR P_UTD431H314_ROUT_S. ORIGINAL VALUES OF P_UTD431H314_ROUT_S ARE 1,0. MUST BE CONVERTED TO 1,2 IN SUDAAN. */ value putd431h314f 1='4:3:1:H:3:1:4 Up-to-Date' 2='Not 4:3:1:H:3:1:4 Up-to-Date'; value estiapf . = "Missing" 0 = "US Total" 1 = "CT" 2 = "MA" 4 = "ME" 5 = "NH" 6 = "RI" 7 = "VT" 8 = "NJ" 10 = "NY-Rest of State" 11 = "NY-City of New York"

Data User’s Guide for the 2015 NIS Public-Use Data File APPENDIX D 95
12 = "DC" 13 = "DE" 14 = "MD" 16 = "PA-Rest of State" 17 = "PA-Philadelphia County" 18 = "VA" 19 = "WV" 20 = "AL" 22 = "FL" 25 = "GA" 27 = "KY" 28 = "MS" 29 = "NC" 30 = "SC" 31 = "TN" 34 = "IL-Rest of State" 35 = "IL-City of Chicago" 36 = "IN" 38 = "MI" 40 = "MN" 41 = "OH" 44 = "WI" 46 = "AR" 47 = "LA" 49 = "NM" 50 = "OK" 51 = "TX-Rest of State" 53 = "TX-El Paso County" 54 = "TX-City of Houston" 55 = "TX-Bexar County" 56 = "IA" 57 = "KS" 58 = "MO" 59 = "NE" 60 = "CO" 61 = "MT" 62 = "ND" 63 = "SD" 64 = "UT" 65 = "WY" 66 = "AZ" 68 = "CA" 72 = "HI" 73 = "NV" 74 = "AK" 75 = "ID" 76 = "OR" 77 = "WA" 106 = "Puerto Rico" 107 = "TX-Hidalgo County" ; run;

Data User’s Guide for the 2015 NIS Public-Use Data File APPENDIX D 96
data sud_file; set &in_file(keep= seqnumhh seqnumc P_UTD431H314_ROUT_S &estiap &wt &strat); if P_UTD431H314_ROUT_S=0 then P_UTD431H314_ROUT_S=2; *--- CONVERT P_UTD431H314_ROUT_S=0 TO P_UTD431H314_ROUT_S=2 ---*; nseqnumh=1*seqnumhh; *---CONVERT HOUSEHOLD ID SEQNUMHH FROM CHARACTER TO NUMERIC ---*; run; *=== SORT BY NEST VARIABLES: STRATUM (STRATUM) NSEQNUMH (PRIMARY SAMPLING UNIT) ===*; proc sort; by &strat nseqnumh; run; proc crosstab data=sud_file filetype=sas design=wr; weight &wt; nest &strat nseqnumh; subgroup &estiap P_UTD431H314_ROUT_S ; levels 107 2 ; tables &estiap * P_UTD431H314_ROUT_S ; print nsum wsum rowper serow/style=nchs ; rtitle "4:3:1:H:3:1:4 ESTIMATES BY Estimation Area"; rformat &estiap estiapf.; rformat P_UTD431H314_ROUT_S putd431h314f.; output rowper serow/filename=sud_est filetype=sas replace; run; proc print data=sud_est(where=(P_UTD431H314_ROUT_S=1 and rowper ne .)) noobs label; format &estiap estiapf.; var &estiap rowper serow ; label rowper='Percent 4:3:1:H:3:1:4 Up-to-Date' serow='Standard Error' ; title "4:3:1:H:3:1:4 ESTIMATES BY Estimation Area"; run; **********************; title1 'SUDSTATE.SAS'; ************************************************************************* THIS PROGRAM WILL PRODUCE STATE ESTIMATES AND STANDARD ERRORS FOR P_UTD431H314_ROUT_S USING SAS CALLABLE SUDAAN. NOTE : THE STATE VARIABLE IS BASED ON FIPSTATE CODES ,THERE ARE NO STATES WITH FIPS CODES 3,7,14,43,52,57-71,73-78. SUDAAN NOTES: 1. ALL VARIABLES USED MUST BE NUMERIC. 2. VARIABLES IN THE SUBGROUP STATEMENT MUST HAVE VALUES 1,2,..K WHERE K IS THE NUMBER OF LEVELS FOR EACH VARIABLE. 3. DATA MUST BE SORTED ACCORDING TO THE SAMPLE DESIGN VARIABLES (STRATUM AND PRIMARY SAMPLING UNIT), SPECIFIED IN THE NEST STATEMENT. *************************************************************************; options ps=78 ls=90 obs= max; libname dd 'c:\nispuf15'; *--- SPECIFY PATH TO SAS DATASET ---*; libname library 'c:\nispuf15'; *--- IF DATASET WAS CREATED WITH FORMATS STORED ---*;

Data User’s Guide for the 2015 NIS Public-Use Data File APPENDIX D 97
*--- PERMANENTLY SPECIFY PATH TO LIBRARY ---*; *--- OTHERWISE COMMENT THIS STATEMENT OUT ---*; %let in_file=dd.nispuf15; *--- NAME OF SAS DATASET ---*; %let wt=provwt_d; *--- WEIGHT TO USE (PROVWT_D is the dual-frame weight excluding territories. Use PROVWT_D_TERR to include territories) ---*; %let strat=stratum; * --- STRATUM VARIABLE TO USE FOR VARIANCE ESTIMATION; PROC FORMAT; /* THE FOLLOWING FORMAT WILL BE USED FOR P_UTD431H314_ROUT_S. ORIGINAL VALUES OF P_UTD431H314_ROUT_S ARE 1,0. MUST BE CONVERTED TO 1,2 IN SUDAAN. */ value putd431h314f 1='4:3:1:H:3:1:4 Up-to-Date' 2='Not 4:3:1:H:3:1:4 Up-to-Date' ; value statef 0 ='U.S. Total' 1 ='Alabama ' 2 ='Alaska ' 4 ='Arizona ' 5 ='Arkansas ' 6 ='California ' 8 ='Colorado ' 9 ='Connecticut ' 10 ='Delaware ' 11 ='District of Columbia' 12 ='Florida ' 13 ='Georgia ' 15 ='Hawaii ' 16 ='Idaho ' 17 ='Illinois ' 18 ='Indiana ' 19 ='Iowa ' 20 ='Kansas ' 21 ='Kentucky ' 22 ='Louisiana ' 23 ='Maine ' 24 ='Maryland ' 25 ='Massachusetts ' 26 ='Michigan ' 27 ='Minnesota ' 28 ='Mississippi ' 29 ='Missouri ' 30 ='Montana ' 31 ='Nebraska ' 32 ='Nevada ' 33 ='New Hampshire ' 34 ='New Jersey ' 35 ='New Mexico '

Data User’s Guide for the 2015 NIS Public-Use Data File APPENDIX D 98
36 ='New York ' 37 ='North Carolina ' 38 ='North Dakota ' 39 ='Ohio ' 40 ='Oklahoma ' 41 ='Oregon ' 42 ='Pennsylvania ' 44 ='Rhode Island ' 45 ='South Carolina ' 46 ='South Dakota ' 47 ='Tennessee ' 48 ='Texas ' 49 ='Utah ' 50 ='Vermont ' 51 ='Virginia ' 53 ='Washington ' 54 ='West Virginia ' 55 ='Wisconsin ' 56 ='Wyoming ' 72 ='Puerto Rico ' ; run; data sud_file; set &in_file(keep= seqnumhh seqnumc P_UTD431H314_ROUT_S state &wt &strat); if P_UTD431H314_ROUT_S=0 then P_UTD431H314_ROUT_S=2; *** CONVERT P_UTD431H314_ROUT_S=0 TO P_UTD431H314_ROUT_S=2 ***; nseqnumh=1*seqnumhh; *** CONVERT HOUSEHOLD ID SEQNUMH FROM CHARACTER TO NUMERIC ***; run; *=== SORT BY NEST VARIABLES: STRATUM (STRATUM) NSEQNUMH (PRIMARY SAMPLING UNIT) ===*; proc sort; by &strat nseqnumh; run; proc crosstab data=sud_file filetype=sas design=wr; weight &wt; nest &strat nseqnumh; subgroup state P_UTD431H314_ROUT_S ; levels 56 2 ; tables state * P_UTD431H314_ROUT_S ; print nsum wsum rowper serow/style=nchs ; rtitle "4:3:1:H:3:1:4 ESTIMATES BY STATE"; rformat state statef.; rformat P_UTD431H314_ROUT_S putd431h314f.; output rowper serow / filename=sud_est2 filetype=sas replace; run; *** EXCLUDE 3,7,14,43,52,57-71,73-78 THERE ARE NO STATES WITH THESE FIPS CODES *** ; option spool; proc print data=sud_est2(where=(P_UTD431H314_ROUT_S=1 & state notin (3,7,14,43,52) & not(57<=state<=71) & not(73<=state<=78))) label noobs; format state statef.; var state rowper serow ; label rowper='Percent 4:3:1:H:3:1:4 Up-to-Date'

Data User’s Guide for the 2015 NIS Public-Use Data File APPENDIX D 99
serow='Standard Error' ; title "4:3:1:H:3:1:4 ESTIMATES BY STATE"; run; option nospool; **********************; title1 'PROG_3.SAS'; ************************************************************************* THIS PROGRAM WILL PRODUCE A TABLE OF HAD_CPOX BY STATE FOR ALL RDD COMPLETES USING RDDWT_D. THE PROGRAM USES SAS CALLABLE SUDAAN. SUDAAN NOTES: 1. ALL VARIABLES USED MUST BE NUMERIC. 2. VARIABLES IN THE SUBGROUP STATEMENT MUST HAVE VALUES 1,2,..K WHERE K IS THE NUMBER OF LEVELS FOR EACH VARIABLE. 3. DATA MUST BE SORTED ACCORDING TO THE SAMPLE DESIGN VARIABLES (STRATUM AND PRIMARY SAMPLING UNIT), SPECIFIED IN THE NEST STATEMENT. *************************************************************************; options ps=78 ls=90 obs= max; options ps=78 ls=90 obs= max; libname dd 'c:\nispuf15'; *--- SPECIFY PATH TO SAS DATASET ---*; libname library 'c:\nispuf15'; *--- IF DATASET WAS CREATED WITH FORMATS STORED ---*; *--- PERMANENTLY SPECIFY PATH TO LIBRARY ---*; *--- OTHERWISE COMMENT THIS STATEMENT OUT ---*; %let in_file=dd.nispuf15; *--- NAME OF SAS DATASET ---*; %let wt=rddwt_d; * --- WEIGHT TO USE (RDDWT_D is the dual-frame weight excluding territories. Use RDDWT_D_TERR to include territories) ---*; %let strat=stratum; * --- STRATUM VARIABLE TO USE FOR VARIANCE ESTIMATION; PROC FORMAT; /* THE FOLLOWING FORMAT WILL BE USED FOR HAD_CPOX. */ value hadcpoxf 1='Yes' 2='No' ; value statef 0 ='U.S. Total ' 1 ='Alabama ' 2 ='Alaska ' 4 ='Arizona ' 5 ='Arkansas ' 6 ='California ' 8 ='Colorado ' 9 ='Connecticut ' 10 ='Delaware '

Data User’s Guide for the 2015 NIS Public-Use Data File APPENDIX D 100
11 ='District of Columbia' 12 ='Florida ' 13 ='Georgia ' 15 ='Hawaii ' 16 ='Idaho ' 17 ='Illinois ' 18 ='Indiana ' 19 ='Iowa ' 20 ='Kansas ' 21 ='Kentucky ' 22 ='Louisiana ' 23 ='Maine ' 24 ='Maryland ' 25 ='Massachusetts ' 26 ='Michigan ' 27 ='Minnesota ' 28 ='Mississippi ' 29 ='Missouri ' 30 ='Montana ' 31 ='Nebraska ' 32 ='Nevada ' 33 ='New Hampshire ' 34 ='New Jersey ' 35 ='New Mexico ' 36 ='New York ' 37 ='North Carolina ' 38 ='North Dakota ' 39 ='Ohio ' 40 ='Oklahoma ' 41 ='Oregon ' 42 ='Pennsylvania ' 44 ='Rhode Island ' 45 ='South Carolina ' 46 ='South Dakota ' 47 ='Tennessee ' 48 ='Texas ' 49 ='Utah ' 50 ='Vermont ' 51 ='Virginia ' 53 ='Washington ' 54 ='West Virginia ' 55 ='Wisconsin ' 56 ='Wyoming ' 72 ='Puerto Rico ' ; run; data sud_file; set &in_file(keep= seqnumhh seqnumc state had_cpox &wt &strat); nseqnumh=1*seqnumhh; *** CONVERT HOUSEHOLD ID SEQNUMH FROM CHARACTER TO NUMERIC ***; run; *=== SORT BY NEST VARIABLES: STRATUM (STRATUM) NSEQNUMH (PRIMARY SAMPLING UNIT) ===*; proc sort;

Data User’s Guide for the 2015 NIS Public-Use Data File APPENDIX D 101
by &strat nseqnumh; run; proc crosstab data=sud_file filetype=sas design=wr; weight &wt; nest &strat nseqnumh; subgroup state had_cpox ; levels 56 2 ; tables state * had_cpox ; print nsum wsum rowper serow/style=nchs ; rtitle "HAD_CPOX ESTIMATES BY STATE"; rtitle "WEIGHT = &WT"; rformat state statef.; rformat had_cpox hadcpoxf.; output rowper serow / filename=sud_est3 filetype=sas replace; run; *** EXCLUDE 3,7,14,43,52,57-71,73-78 THERE ARE NO STATES WITH THESE FIPS CODES *** ; option spool; proc print data=sud_est3(where=(had_cpox=1 & state notin (3,7,14,43,52) & not(57<=state<=71) & not(73<=state<=78))) label noobs; format state statef.; var state rowper serow ; label rowper='Percent HAD_CPOX = Yes' serow='Standard Error' ; title "CHILD HAD CHICKEN POX BY STATE"; run; option nospool; **********************; title1 'PROG_4.SAS'; ************************************************************************* TABLE OF P_UTD431H314_ROUT_S BY INCPOV1 BY RACE_K. SAVE % UTD ESTIMATES (NOT S.E.'S) FOR USE IN THE PROGRAM CHART_4. THIS PROGRAM WILL PRODUCE ESTIMATES USING SAS CALLABLE SUDAAN. SUDAAN NOTES: 1. ALL VARIABLES USED MUST BE NUMERIC. 2. VARIABLES IN THE SUBGROUP STATEMENT MUST HAVE VALUES 1,2,..K WHERE K IS THE NUMBER OF LEVELS FOR EACH VARIABLE. 3. DATA MUST BE SORTED ACCORDING TO THE SAMPLE DESIGN VARIABLES (STRATUM AND PRIMARY SAMPLING UNIT), SPECIFIED IN THE NEST STATEMENT. *************************************************************************; options ps=78 ls=90 obs= max; libname dd 'c:\nispuf15'; *--- SPECIFY PATH TO SAS DATASET ---*; libname library 'c:\nispuf15'; *--- IF DATASET WAS CREATED WITH FORMATS STORED ---*; *--- PERMANENTLY SPECIFY PATH TO LIBRARY ---*; *--- OTHERWISE COMMENT THIS STATEMENT OUT ---*;

Data User’s Guide for the 2015 NIS Public-Use Data File APPENDIX D 102
libname out 'c:\nispuf15'; *--- SPECIFY THE PATH FOR WHERE YOU WANT THE CHART OUTPUT TO GO ---*; %let in_file=dd.nispuf15; *--- NAME OF SAS DATASET ---*; %let wt=provwt_d; *--- WEIGHT TO USE (PROVWT_D is the dual-frame weight excluding territories. Use PROVWT_D_TERR to include territories) ---*; %let strat=stratum; * --- STRATUM VARIABLE TO USE FOR VARIANCE ESTIMATION; %let qtr_lab=Q1/2015 - Q4/2015; *NIS 4 QUARTER PERIOD*; PROC FORMAT; /* THE FOLLOWING FORMAT WILL BE USED FOR P_UTD431H314_ROUT_S. ORIGINAL VALUES OF P_UTD431H314_ROUT_S ARE 1,0. MUST BE CONVERTED TO 1,2 IN SUDAAN. */ value putd431h314f 1='4:3:1:H:3:1:4 Up-to-date' 2='Not 4:3:1:H:3:1:4 Up-to-date' ; VALUE RACE_KF 1 = "WHITE ONLY" 2 = "BLACK ONLY" 3 = "OTHER AND MULTIPLE RACE" ; VALUE INCPVR2F 1 = "ABOVE, > $75,000" 2 = "ABOVE, <= $75,000" 3 = "BELOW" 4 = "UNKNOWN" ; value statef 0 ='U.S. Total ' 1 ='Alabama ' 2 ='Alaska ' 4 ='Arizona ' 5 ='Arkansas ' 6 ='California ' 8 ='Colorado ' 9 ='Connecticut ' 10 ='Delaware ' 11 ='District of Columbia' 12 ='Florida ' 13 ='Georgia ' 15 ='Hawaii ' 16 ='Idaho ' 17 ='Illinois ' 18 ='Indiana ' 19 ='Iowa ' 20 ='Kansas ' 21 ='Kentucky ' 22 ='Louisiana ' 23 ='Maine '

Data User’s Guide for the 2015 NIS Public-Use Data File APPENDIX D 103
24 ='Maryland ' 25 ='Massachusetts ' 26 ='Michigan ' 27 ='Minnesota ' 28 ='Mississippi ' 29 ='Missouri ' 30 ='Montana ' 31 ='Nebraska ' 32 ='Nevada ' 33 ='New Hampshire ' 34 ='New Jersey ' 35 ='New Mexico ' 36 ='New York ' 37 ='North Carolina ' 38 ='North Dakota ' 39 ='Ohio ' 40 ='Oklahoma ' 41 ='Oregon ' 42 ='Pennsylvania ' 44 ='Rhode Island ' 45 ='South Carolina ' 46 ='South Dakota ' 47 ='Tennessee ' 48 ='Texas ' 49 ='Utah ' 50 ='Vermont ' 51 ='Virginia ' 53 ='Washington ' 54 ='West Virginia ' 55 ='Wisconsin ' 56 ='Wyoming ' 72 ='Puerto Rico ' ; run; data sud_file; set &in_file(keep= seqnumhh seqnumc P_UTD431H314_ROUT_S race_k incpov1 &wt &strat); nseqnumh=1*seqnumhh; *** CONVERT HOUSEHOLD ID SEQNUMH FROM CHARACTER TO NUMERIC ***; if P_UTD431H314_ROUT_S=0 then P_UTD431H314_ROUT_S=2; *** CONVERT P_UTD431H314_ROUT_S=0 TO P_UTD431H314_ROUT_S=2 ***; run; *=== SORT BY NEST VARIABLES: STRATUM (STRATUM) NSEQNUMH (PRIMARY SAMPLING UNIT) ===*; proc sort; by &strat nseqnumh; run; proc freq; tables P_UTD431H314_ROUT_S incpov1 race_k; run; title3 "Table 4A. &qtr_lab: Unweighted Frequencies"; proc crosstab data=sud_file filetype=sas design=wr; weight &wt; nest &strat nseqnumh; subgroup incpov1 race_k P_UTD431H314_ROUT_S ;

Data User’s Guide for the 2015 NIS Public-Use Data File APPENDIX D 104
levels 4 3 2 ; tables (incpov1 * race_k * P_UTD431H314_ROUT_S) ; print nsum wsum rowper="4:3:1:H:3:1:4 Up-to-Date (ROWPER)" serow="Standard Error (SEROW)" /style=nchs ; rtitle "Table 4B. &qtr_lab, Percent 4:3:1:H:3:1:4 Up-to-Date and Estimated Standard Errors"; rtitle "WEIGHT = &WT"; rformat P_UTD431H314_ROUT_S putd431h314f.; rformat incpov1 incpvr2f.; rformat race_k race_kf.; output rowper serow / filename=sud_est4 filetype=sas replace; run; data out.sud_est4; set sud_est4(where=(P_UTD431H314_ROUT_S=1 & incpov1 > 0 & race_k > 0)); keep incpov1 race_k rowper serow; label rowper='4:3:1:H:3:1:4 Up-to-Date'; format rowper 5.2; format serow 5.2; run; proc print data=out.sud_est4 label; format race_k race_kf.; format incpov1 incpvr2f.; title "&qtr_lab: 4:3:1:H:3:1:4 ESTIMATES AND STANDARD ERRORS BY INCPOV1 BY RACE_K"; run; **********************; title1 'SAS_GRAPH_4.SAS'; ************************************************************************* THIS PROGRAM BUILDS OFF OF THE PROGRAM SAS_PROG_4. IT PRODUCES A CHART OF P_UTD431H314_ROUT_S BY INCPOV1 BY RACE_K. IT CREATES A BAR CHART IN SAS GRAPH FOR THE 4X3 = 12 CELLS. THE OUTPUT OF THE FOLLOWING EXAMPLE IS ATTACHED AT THE END. *************************************************************************; options ps=78 ls=90 obs= max; libname dd 'c:\nispuf15'; *--- SPECIFY PATH TO SAS DATASET ---*; %let out='c:\nispuf15'; *--- SPECIFY THE PATH FOR WHERE YOU WANT THE CHART OUTPUT TO GO ---*; %let in_file=dd.sud_est4; *--- NAME OF SAS DATASET OUTPUT FROM PROG_4 ---*; %let qtr_lab=Q1/2015 - Q4/2015; *NIS 4 QUARTER PERIOD*; PROC FORMAT; VALUE INCPVR2F 1 = "ABOVE, > $75,000" 2 = "ABOVE, <= $75,000" 3 = "BELOW" 4 = "UNKNOWN" ; VALUE RACE_KF 1 = "WHITE ONLY" 2 = "BLACK ONLY" 3 = "OTHER/MULT RACE"

Data User’s Guide for the 2015 NIS Public-Use Data File APPENDIX D 105
; run; data sud_est4; set &in_file; format rowper 3. race_k race_kf. incpov1 incpvr2f. ; label race_k = 'Race of Child' incpov1 = 'Poverty Status' ; filename odsout &out; ods listing close; /* SET THE GRAPHICS ENVIRONMENT */ goptions reset=global gunit=pct border ftext=swissb htitle=4 htext=1.5 device=gif ; ods html body='graph_4_sud.html' path=odsout; TITLE1 HEIGHT=3 "Percentage of Children Up-to-date with Vaccine Series 4:3:1:H:3:1:4 "; TITLE2 HEIGHT=3 "by Race and Poverty Status, National Immunization Survey, 2015"; footnote j=r 'graph_4sud'; pattern1 value = solid color = blue; pattern2 value = x3 color = green; pattern3 value = l3 color = red; pattern4 value = empty color = lib; axis width = 3; run; proc gchart data=sud_est4; vbar race_k /frame discrete sumvar=rowper group=incpov1 gspace = 5 gaxis = axis raxis = axis name = 'graph_4_sud' patternid = midpoint ; run; quit; ods html close; ods listing; ods html close; ods listing;

Data User’s Guide for the 2015 NIS Public-Use Data File APPENDIX D 106

Data User’s Guide for the 2015 NIS Public-Use Data File APPENDIX D 107
B. SAS **********************; title1 'SAS_IAP.SAS'; ********************************************************************** THIS PROGRAM WILL PRODUCE ESTIMATION AREA ESTIMATES AND STANDARD ERRORS FOR P_UTD431H314_ROUT_S USING SAS. **********************************************************************; options ps=78 ls=90 obs= max; libname dd 'c:\nispuf15'; *--- SPECIFY PATH TO SAS DATASET ---*; libname library 'c:\nispuf15'; *--- IF DATASET WAS CREATED WITH FORMATS STORED ---*; *--- PERMANENTLY SPECIFY PATH TO LIBRARY ---*; *--- OTHERWISE COMMENT THIS STATEMENT OUT ---*; %let in_file=dd.nispuf15; *--- NAME OF SAS DATASET ---*; %let estiap=estiap15; * --- ESTIMATION AREA VARIABLE TO USE ---*; %let wt=provwt_d; * --- WEIGHT TO USE (PROVWT_D is the dual-frame weight excluding territories. Use PROVWT_D_TERR to include territories) ---*; %let strat=stratum; * --- STRATUM VARIABLE TO USE FOR VARIANCE ESTIMATION; proc format; value putd431h314f 0='Not 4:3:1:H:3:1:4 Up-To-Date' 1='4:3:1:H:3:1:4 Up-To-Date'; value estiapf . = "Missing" 0 = "US Total" 1 = "CT" 2 = "MA" 4 = "ME" 5 = "NH" 6 = "RI" 7 = "VT" 8 = "NJ" 10 = "NY-Rest of State" 11 = "NY-City of New York" 12 = "DC" 13 = "DE" 14 = "MD" 16 = "PA-Rest of State" 17 = "PA-Philadelphia County" 18 = "VA" 19 = "WV" 20 = "AL" 22 = "FL" 25 = "GA" 27 = "KY" 28 = "MS" 29 = "NC" 30 = "SC"

Data User’s Guide for the 2015 NIS Public-Use Data File APPENDIX D 108
31 = "TN" 34 = "IL-Rest of State" 35 = "IL-City of Chicago" 36 = "IN " 38 = "MI" 40 = "MN" 41 = "OH" 44 = "WI" 46 = "AR" 47 = "LA" 49 = "NM" 50 = "OK" 51 = "TX-Rest of State" 53 = "TX-El Paso County" 54 = "TX-City of Houston" 55 = "TX-Bexar County" 56 = "IA" 57 = "KS" 58 = "MO" 59 = "NE" 60 = "CO" 61 = "MT" 62 = "ND" 63 = "SD" 64 = "UT" 65 = "WY" 66 = "AZ" 68 = "CA" 72 = "HI" 73 = "NV" 74 = "AK" 75 = "ID" 76 = "OR" 77 = "WA" 106 = "Puerto Rico" 107 = "TX-Hidalgo County" ; run; data sas_file; set &in_file(keep= seqnumhh seqnumc P_UTD431H314_ROUT_S &estiap &wt &strat); run; proc sort data = sas_file; by &estiap; run; title1 '4:3:1:H:3:1:4 ESTIMATES BY Estimation Area'; ods output Statistics=sas_est; proc surveymeans data = sas_file nobs sum mean stderr; stratum &strat; cluster seqnumhh; weight &wt; class P_UTD431H314_ROUT_S; var P_UTD431H314_ROUT_S;

Data User’s Guide for the 2015 NIS Public-Use Data File APPENDIX D 109
by &estiap; format P_UTD431H314_ROUT_S putd431h314f.; format &estiap estiapf.; run; data sas_est; set sas_est; mean = mean*100; *CONVERT TO PERCENT ESTIMATES; stderr = stderr*100; run; proc print data=sas_est(where=(varlevel='4:3:1:H:3:1:4 Up-To-Date')) noobs label; format &estiap estiapf.; format mean stderr 5.2; var &estiap mean stderr; label mean='Percent 4:3:1:H:3:1:4 Up-to-Date' stderr='Standard Error'; title "4:3:1:H:3:1:4 Estimates by Estimation Area"; run; **********************; title1 'SASSTATE.SAS'; ********************************************************************** THIS PROGRAM WILL PRODUCE STATE ESTIMATES AND STANDARD ERRORS FOR P_UTD431H314_ROUT_S USING SAS. NOTE : THE STATE VARIABLE IS BASED ON FIPSTATE CODES ,THERE ARE NO STATES WITH FIPS CODES 3,7,14,43,52,57-71,73-77. **********************************************************************; options ps=78 ls=90 obs= max; libname dd 'c:\nispuf15'; *--- SPECIFY PATH TO SAS DATASET ---*; libname library 'c:\nispuf15'; *--- IF DATASET WAS CREATED WITH FORMATS STORED ---*; *--- PERMANENTLY SPECIFY PATH TO LIBRARY ---*; *--- OTHERWISE COMMENT THIS STATEMENT OUT ---*; %let in_file=dd.nispuf15; *--- NAME OF SAS DATASET ---*; %let wt=provwt_d; * --- WEIGHT TO USE (PROVWT_D is the dual-frame weight excluding territories. Use PROVWT_D_TERR to include territories) ---*; %let strat=stratum; * --- STRATUM VARIABLE TO USE FOR VARIANCE ESTIMATION; proc format; value putd431h314f 0='Not 4:3:1:H:3:1:4 Up-To-Date' 1='4:3:1:H:3:1:4 Up-To-Date'; value statef . ="Missing" 0 ='U.S. Total ' 1 ='Alabama ' 2 ='Alaska ' 4 ='Arizona ' 5 ='Arkansas ' 6 ='California '

Data User’s Guide for the 2015 NIS Public-Use Data File APPENDIX D 110
8 ='Colorado ' 9 ='Connecticut ' 10 ='Delaware ' 11 ='District of Columbia' 12 ='Florida ' 13 ='Georgia ' 15 ='Hawaii ' 16 ='Idaho ' 17 ='Illinois ' 18 ='Indiana ' 19 ='Iowa ' 20 ='Kansas ' 21 ='Kentucky ' 22 ='Louisiana ' 23 ='Maine ' 24 ='Maryland ' 25 ='Massachusetts ' 26 ='Michigan ' 27 ='Minnesota ' 28 ='Mississippi ' 29 ='Missouri ' 30 ='Montana ' 31 ='Nebraska ' 32 ='Nevada ' 33 ='New Hampshire ' 34 ='New Jersey ' 35 ='New Mexico ' 36 ='New York ' 37 ='North Carolina ' 38 ='North Dakota ' 39 ='Ohio ' 40 ='Oklahoma ' 41 ='Oregon ' 42 ='Pennsylvania ' 44 ='Rhode Island ' 45 ='South Carolina ' 46 ='South Dakota ' 47 ='Tennessee ' 48 ='Texas ' 49 ='Utah ' 50 ='Vermont ' 51 ='Virginia ' 53 ='Washington ' 54 ='West Virginia ' 55 ='Wisconsin ' 56 ='Wyoming ' 72 ='Puerto Rico ' ; run; data sas_file; set &in_file(keep= seqnumhh seqnumc P_UTD431H314_ROUT_S state &wt &strat); run;

Data User’s Guide for the 2015 NIS Public-Use Data File APPENDIX D 111
proc sort data = sas_file; by state; title1 '4:3:1:H:3:1:4 ESTIMATES BY STATE'; ods output Statistics=sas_est2; run; proc surveymeans data = sas_file nobs sum mean stderr; stratum &strat; cluster seqnumhh; weight &wt; class P_UTD431H314_ROUT_S; var P_UTD431H314_ROUT_S; by state; format P_UTD431H314_ROUT_S putd431h314f.; format state statef.; run; data sas_est2; set sas_est2; mean = mean*100; *CONVERT TO PERCENT ESTIMATES; stderr = stderr*100; run; proc print data=sas_est2(where=(varlevel='4:3:1:H:3:1:4 Up-To-Date')) noobs label; format state statef.; format mean stderr 5.2; var state mean stderr; label mean='Percent 4:3:1:H:3:1:4 Up-to-Date' stderr='Standard Error'; title "4:3:1:H:3:1:4 ESTIMATES BY STATE"; run; **********************; title1 'SAS_PROG_3.SAS'; ************************************************************************* THIS PROGRAM WILL PRODUCE A TABLE OF HAD_CPOX BY STATE FOR ALL RDD COMPLETES USING RDDWT. THE PROGRAM USES SAS. *************************************************************************; options ps=78 ls=90 obs= max; libname dd 'c:\nispuf15'; *--- SPECIFY PATH TO SAS DATASET ---*; libname library 'c:\nispuf15'; *--- IF DATASET WAS CREATED WITH FORMATS STORED ---*; *--- PERMANENTLY SPECIFY PATH TO LIBRARY ---*; *--- OTHERWISE COMMENT THIS STATEMENT OUT ---*; %let in_file=dd.nispuf15; *--- NAME OF SAS DATASET ---*; %let wt=rddwt_d; *--- WEIGHT TO USE (RDDWT_D is the dual-frame weight excluding territories. Use RDDWT_D_TERR to include territories) ---*; %let strat=stratum; * --- STRATUM VARIABLE TO USE FOR VARIANCE ESTIMATION; PROC FORMAT; value hadcpoxf 1='Yes'

Data User’s Guide for the 2015 NIS Public-Use Data File APPENDIX D 112
2='No' ; value statef 0 ='U.S. Total ' 1 ='Alabama ' 2 ='Alaska ' 4 ='Arizona ' 5 ='Arkansas ' 6 ='California ' 8 ='Colorado ' 9 ='Connecticut ' 10 ='Delaware ' 11 ='District of Columbia' 12 ='Florida ' 13 ='Georgia ' 15 ='Hawaii ' 16 ='Idaho ' 17 ='Illinois ' 18 ='Indiana ' 19 ='Iowa ' 20 ='Kansas ' 21 ='Kentucky ' 22 ='Louisiana ' 23 ='Maine ' 24 ='Maryland ' 25 ='Massachusetts ' 26 ='Michigan ' 27 ='Minnesota ' 28 ='Mississippi ' 29 ='Missouri ' 30 ='Montana ' 31 ='Nebraska ' 32 ='Nevada ' 33 ='New Hampshire ' 34 ='New Jersey ' 35 ='New Mexico ' 36 ='New York ' 37 ='North Carolina ' 38 ='North Dakota ' 39 ='Ohio ' 40 ='Oklahoma ' 41 ='Oregon ' 42 ='Pennsylvania ' 44 ='Rhode Island ' 45 ='South Carolina ' 46 ='South Dakota ' 47 ='Tennessee ' 48 ='Texas ' 49 ='Utah ' 50 ='Vermont ' 51 ='Virginia ' 53 ='Washington '

Data User’s Guide for the 2015 NIS Public-Use Data File APPENDIX D 113
54 ='West Virginia ' 55 ='Wisconsin ' 56 ='Wyoming ' 72 ='Puerto Rico ' ; run; data sas_file; set &in_file(keep= seqnumhh seqnumc state had_cpox &wt &strat); run; proc sort data = sas_file; by state; title1 'HAD_CPOX ESTIMATES BY STATE'; ods output Statistics=sas_est3; run; proc surveymeans data = sas_file nobs sum mean stderr; stratum &strat; cluster seqnumhh; weight &wt; class had_cpox; var had_cpox; by state; format had_cpox hadcpoxf.; format state statef.; run; data sas_est3; set sas_est3; mean = mean*100; *CONVERT TO PERCENT ESTIMATES; stderr = stderr*100; run; proc print data=sas_est3(where=(varlevel='Yes')) noobs label; format state statef.; format mean stderr 5.2; var state mean stderr; label mean='Percent HAD_CPOX = Yes' stderr='Standard Error'; title "CHILD HAD CHICKEN POX BY ESTIMATION AREA"; run; **********************; title1 'SAS_PROG_4.SAS'; ************************************************************************* TABLE OF P_UTD431H314_ROUT_S BY INCPOV1 BY RACE_K. SAVE % UTD ESTIMATES (NOT S.E.'S) FOR USE IN THE PROGRAM SAS_GRAPH_4. THIS PROGRAM WILL PRODUCE ESTIMATES USING SAS. *************************************************************************; options ps=78 ls=90 obs= max; libname dd 'c:\nispuf15'; *--- SPECIFY PATH TO SAS DATASET ---*; libname library 'c:\nispuf15'; *--- IF DATASET WAS CREATED WITH FORMATS STORED ---*;

Data User’s Guide for the 2015 NIS Public-Use Data File APPENDIX D 114
*--- PERMANENTLY SPECIFY PATH TO LIBRARY ---*; *--- OTHERWISE COMMENT THIS STATEMENT OUT ---*; libname out 'c:\nispuf15'; *--- SPECIFY THE PATH FOR WHERE YOU WANT THE CHART OUTPUT TO GO ---*; %let in_file=dd.nispuf15; *--- NAME OF SAS DATASET ---*; %let wt=provwt_d; *--- WEIGHT TO USE (PROVWT_D is the dual-frame weight excluding territories. use PROVWT_D_TERR to include territories) ---*; %let strat=stratum; * --- STRATUM VARIABLE TO USE FOR VARIANCE ESTIMATION; %let qtr_lab=Q1/2015 - Q4/2015; *NIS 4 QUARTER PERIOD*; PROC FORMAT; value putd431h314f 0='Not 4:3:1:H:3:1:4 Up-To-Date' 1='4:3:1:H:3:1:4 Up-To-Date' ; VALUE RACE_KF 1 = "WHITE ONLY" 2 = "BLACK ONLY" 3 = "OTHER AND MULTIPLE RACE" ; VALUE INCPVR2F 1 = "ABOVE, > $75,000" 2 = "ABOVE, <= $75,000" 3 = "BELOW" 4 = "UNKNOWN" ; run; data sas_file; set &in_file(keep= seqnumhh seqnumc P_UTD431H314_ROUT_S race_k incpov1 &wt &strat); run; proc sort data = sas_file; by incpov1 race_k; run; proc freq; tables P_UTD431H314_ROUT_S incpov1 race_k; title1 "Table 4A. &qtr_lab: Unweighted Frequencies"; run; data sas_file; set sas_file; if P_UTD431H314_ROUT_S < 0 | incpov1 < 0 | race_k < 0 | &wt. < 0 then delete; run; proc surveymeans data = sas_file nobs sum mean stderr; ods output Domain=sas_est4; stratum &strat; cluster seqnumhh; weight &wt; class P_UTD431H314_ROUT_S; var P_UTD431H314_ROUT_S; domain incpov1*race_k; format P_UTD431H314_ROUT_S putd431h314f.; format incpov1 incpvr2f.;

Data User’s Guide for the 2015 NIS Public-Use Data File APPENDIX D 115
format race_k race_kf.; run; data sas_est4; set sas_est4; mean = mean*100; *CONVERT TO PERCENT ESTIMATES; stderr = stderr*100; run; proc print data=sas_est4(where=(varlevel='4:3:1:H:3:1:4 Up-To-Date')) noobs label; format incpov1 incpvr2f.; format race_k race_kf.; format mean stderr 5.2; var incpov1 race_k mean stderr; label mean='4:3:1:H:3:1:4 Up-To-Date' stderr='Standard Error'; title1 "Table 4B. &qtr_lab, Percent 4:3:1:H:3:1:4 Up-to-Date and Estimated Standard Errors"; run; data out.sas_est4; set sas_est4(where=(varlevel='4:3:1:H:3:1:4 Up-To-Date')); keep incpov1 race_k mean; label mean='4:3:1:H:3:1:4 Up-to-Date'; format mean 5.2; run; **********************; title1 'SAS_GRAPH_4.SAS'; ************************************************************************* THIS PROGRAM BUILDS OFF OF THE PROGRAM SAS_PROG_4. IT PRODUCES A CHART OF P_UTD431H314_ROUT_S BY INCPOV1 BY RACE_K. IT CREATES A BAR CHART IN SAS GRAPH FOR THE 4X3 = 12 CELLS. THE OUTPUT OF THE FOLLOWING EXAMPLE IS ATTACHED AT THE END. *************************************************************************; options ps=78 ls=90 obs= max; libname dd 'c:\nispuf15'; *--- SPECIFY PATH TO SAS DATASET ---*; %let out='c:\nispuf15'; *--- SPECIFY THE PATH FOR WHERE YOU WANT THE CHART OUTPUT TO GO ---*; %let in_file=dd.sas_est4; *--- NAME OF SAS DATASET OUTPUT FROM PROG_4 --- *; %let qtr_lab=Q1/2015 - Q4/2015; *NIS 4 QUARTER PERIOD*; PROC FORMAT; VALUE INCPVR2F 1 = "ABOVE, > $75,000" 2 = "ABOVE, <= $75,000" 3 = "BELOW" 4 = "UNKNOWN" ; VALUE RACE_KF

Data User’s Guide for the 2015 NIS Public-Use Data File APPENDIX D 116
1 = "WHITE ONLY" 2 = "BLACK ONLY" 3 = "OTHER/MULT RACE" ; run; data sas_est4; set &in_file; format mean 3. race_k race_kf. incpov1 incpvr2f. ; label race_k = 'Race of Child' incpov1 = 'Poverty Status' ; filename odsout &out; ods listing close; /* SET THE GRAPHICS ENVIRONMENT */ goptions reset=global gunit=pct border ftext=swissb htitle=4 htext=1.5 device=gif ; ods html body='graph_4.html' path=odsout; TITLE1 HEIGHT=3 "Percentage of Children Up-to-date with Vaccine Series 4:3:1:H:3:1:4 "; TITLE2 HEIGHT=3 "by Race and Poverty Status, National Immunization Survey, 2015"; footnote j=r 'graph_4'; pattern1 value = solid color = blue; pattern2 value = x3 color = green; pattern3 value = l3 color = red; pattern4 value = empty color = lib; axis width = 3; run; proc gchart data=sas_est4; vbar race_k /frame discrete sumvar=mean group=incpov1 gspace = 5 gaxis = axis raxis = axis name = 'graph_4' patternid = midpoint ; run; quit; ods html close; ods listing;
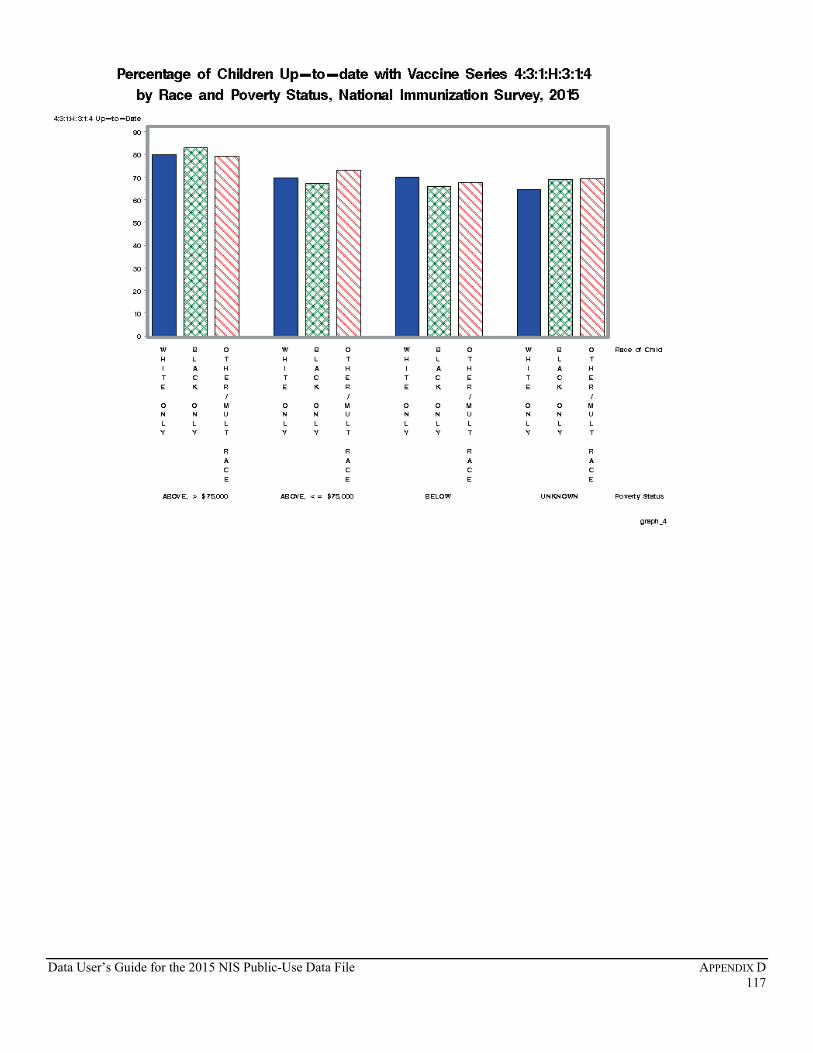
Data User’s Guide for the 2015 NIS Public-Use Data File APPENDIX D 117

Data User’s Guide for the 2015 NIS Public-Use Data File APPENDIX D 118
C. ‘R’ ###################### title <- "R_IAP.R" ###################################################################### #THIS PROGRAM WILL PRODUCE ESTIMATION AREA ESTIMATES AND STANDARD ERRORS #FOR P_UTD431H314_ROUT_S USING R. # #R NOTES: #1. R IS CASE SENSITIVE. #2. A FILE PATH IS SEPERATED BY SLASH(/) ###################################################################### library(survey) #TO USE svydesign(), svymean(), and svyby() library(Hmisc) #TO USE prn() dd <- "c:/nispuf15" #"path-to-dataset" #--- NAME OF R DATASET ---# in.file <- paste(dd,"/NISPUF15.RData",sep="") #---READ R DATASET---# load(in.file) #---FORMAT---# UTD431H314levels=c(0,1) UTD431H314labels=c("NOT 4:3:1:H:3:1:4 UTD", "4:3:1:H:3:1:4 UTD") ESTIAPlevels=c(0, 1, 2, 4, 5, 6, 7, 8, 10, 11, 12, 13, 14, 16, 17, 18, 19, 20, 22, 25, 27, 28, 29, 30, 31, 34, 35, 36, 38, 40, 41, 44, 46, 47, 49, 50, 51, 52, 53, 54, 55, 56, 57, 58, 59, 60, 61, 63, 64, 65, 66, 68, 72, 73, 74, 75, 76, 77, 106, 107) ESTIAPlabels=c("US Total", "CT", "MA", "ME", "NH", "RI", "VT", "NJ", "NY-Rest of State", "NY-City of New York", "DC", "DE", "MD", "PA-Rest of State", "PA-Philadelphia County", "VA", "WV", "AL", "FL", "GA", "KY", "MS", "NC", "SC", "TN", "IL-Rest of State", "IL-City of Chicago", "IN", "MI", "MN", "OH", "WI", "AR", "LA", "NM", "OK", "TX-Rest of State", "TX-El Paso County", "TX-City of Houston", "TX-Bexar County", "IA", "KS", "MO", "NE", "CO", "MT", "ND", "SD", "UT", "WY", "AZ", "CA", "HI", "NV", "AK", "ID", "OR", "WA", "Puerto Rico", "TX-Hidalgo County") #---PROVWT_D WILL BE USED AS A WEIGHT (PROVWT_D IS THE DUAL-FRAME WEIGHT EXCLUDING TERRITORIES. USE PROVWT_D_TERR TO INCLUDE TERRITORIES)---# #---STRATUM WILL BE USED AS A STRATUM VARIABLE FOR VARIANCE ESTIMATION ---# R_FILE <- subset(NISPUF15, select=c(SEQNUMHH, SEQNUMC, P_UTD431H314_ROUT_S, ESTIAP15, PROVWT_D, STRATUM)) names(R_FILE) <- c("SEQNUMHH", "SEQNUMC", "P_UTD431H314_ROUT_S", "ESTIAP", "WT", "STRATUM") R_FILE <- na.omit(R_FILE) #---ASSIGN LABELS---# R_FILE$P_UTD431H314_ROUT_S <- factor(R_FILE$P_UTD431H314_ROUT_S, levels=UTD431H314levels, labels=UTD431H314labels) R_FILE$ESTIAP <- factor(R_FILE$ESTIAP, levels=ESTIAPlevels, labels=ESTIAPlabels) #---SPECIFY A SAMPLING DESIGN AND FORCE WT AS NUMERIC---# svydsg <- svydesign(id=~SEQNUMHH, strata=~STRATUM, weights=~(as.numeric(WT)), data=R_FILE) #---U.S. TOTAL ESTIMATES AND STANDARD ERRORS---# r_nation <- svymean(~P_UTD431H314_ROUT_S, svydsg) PERCENT_UTD <- round(r_nation*100,2) #CONVERT INTO PERCENT ESTIMATES(MEAN) SE_UTD <- round(SE(r_nation)*100,2) #CONVERT INTO PERCENT ESTIMATES(SE) r_nation_est <- cbind(PERCENT_UTD, SE_UTD) title <- "PERCENT 4:3:1:H:3:1:4 ESTIMATES AT A NATIONAL LEVEL" prn(r_nation_est, title) #---ESTIMATION AREA ESTIMATES AND STANDARD ERRORS---# r_est <- svyby(~P_UTD431H314_ROUT_S, ~ESTIAP, svydsg, svymean) r_est[,-c(1)] <- round(r_est[,-c(1)]*100,2) #CONVERT INTO PERCENT ESTIMATES

Data User’s Guide for the 2015 NIS Public-Use Data File APPENDIX D 119
r_est <- subset(r_est, select=c(1,3,5)) #SELECT ESTIMATES FOR UP-TO-DATE CASES names(r_est) <- c("ESTIMATION AREA", "PERCENT 4:3:1:H:3:1:4 UTD", "STANDARD ERROR UTD") title <- "PERCENT 4:3:1:H:3:1:4 ESTIMATES BY ESTIMATION AREA" prn(r_est, title) ###################### title <- "R_STATE.R" ###################################################################### #THIS PROGRAM WILL PRODUCE STATE ESTIMATES AND STANDARD ERRORS #FOR P_UTD431H314_ROUT_S USING R. # #NOTE : THE STATE VARIABLE IS BASED ON FIPSTATE CODES ,THERE ARE #NO STATES WITH FIPS CODES 3,7,14,43,52,57-71,73-78. # #R NOTES: #1. R IS CASE SENSITIVE. #2. A FILE PATH IS SEPERATED BY SLASH(/) ###################################################################### library(survey) #TO USE svydesign(), svymean(), and svyby() library(Hmisc) #TO USE prn() dd <- "c:/nispuf15" #"path-to-data" #--- NAME OF R DATASET ---# in.file <- paste(dd,"/NISPUF15.RData",sep="") #---READ R DATASET---# load(in.file) #---FORMAT---# UTD431H314levels=c(0,1) UTD431H314labels=c("NOT 4:3:1:H:3:1:4 UTD", "4:3:1:H:3:1:4 UTD") STATElevels=c(1, 2, 4, 5, 6, 8, 9, 10, 11, 12, 13, 15, 16, 17, 18, 19, 20, 21, 22, 23, 24, 25, 26, 27, 28, 29, 30, 31, 32, 33, 34, 35, 36, 37, 38, 39, 40, 41, 42, 44, 45, 46, 47, 48, 49, 50, 51, 53, 54, 55, 56, 72) STATElabels=c( "ALABAMA", "ALASKA", "ARIZONA", "ARKANSAS", "CALIFORNIA", "COLORADO", "CONNECTICUT", "DELAWARE", "DISTRICT OF COLUMBIA", "FLORIDA", "GEORGIA", "HAWAII", "IDAHO", "ILLINOIS", "INDIANA", "IOWA", "KANSAS", "KENTUCKY", "LOUISIANA", "MAINE", "MARYLAND", "MASSACHUSETTS", "MICHIGAN",
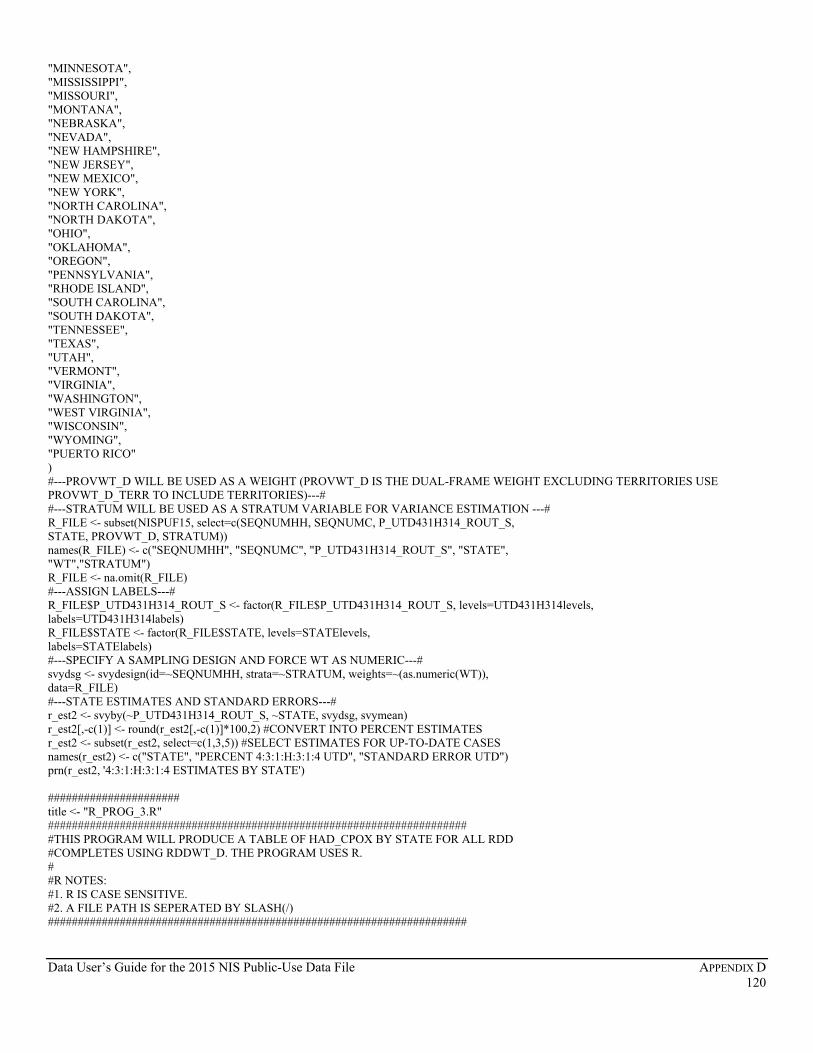
Data User’s Guide for the 2015 NIS Public-Use Data File APPENDIX D 120
"MINNESOTA", "MISSISSIPPI", "MISSOURI", "MONTANA", "NEBRASKA", "NEVADA", "NEW HAMPSHIRE", "NEW JERSEY", "NEW MEXICO", "NEW YORK", "NORTH CAROLINA", "NORTH DAKOTA", "OHIO", "OKLAHOMA", "OREGON", "PENNSYLVANIA", "RHODE ISLAND", "SOUTH CAROLINA", "SOUTH DAKOTA", "TENNESSEE", "TEXAS", "UTAH", "VERMONT", "VIRGINIA", "WASHINGTON", "WEST VIRGINIA", "WISCONSIN", "WYOMING", "PUERTO RICO" ) #---PROVWT_D WILL BE USED AS A WEIGHT (PROVWT_D IS THE DUAL-FRAME WEIGHT EXCLUDING TERRITORIES USE PROVWT_D_TERR TO INCLUDE TERRITORIES)---# #---STRATUM WILL BE USED AS A STRATUM VARIABLE FOR VARIANCE ESTIMATION ---# R_FILE <- subset(NISPUF15, select=c(SEQNUMHH, SEQNUMC, P_UTD431H314_ROUT_S, STATE, PROVWT_D, STRATUM)) names(R_FILE) <- c("SEQNUMHH", "SEQNUMC", "P_UTD431H314_ROUT_S", "STATE", "WT","STRATUM") R_FILE <- na.omit(R_FILE) #---ASSIGN LABELS---# R_FILE$P_UTD431H314_ROUT_S <- factor(R_FILE$P_UTD431H314_ROUT_S, levels=UTD431H314levels, labels=UTD431H314labels) R_FILE$STATE <- factor(R_FILE$STATE, levels=STATElevels, labels=STATElabels) #---SPECIFY A SAMPLING DESIGN AND FORCE WT AS NUMERIC---# svydsg <- svydesign(id=~SEQNUMHH, strata=~STRATUM, weights=~(as.numeric(WT)), data=R_FILE) #---STATE ESTIMATES AND STANDARD ERRORS---# r_est2 <- svyby(~P_UTD431H314_ROUT_S, ~STATE, svydsg, svymean) r_est2[,-c(1)] <- round(r_est2[,-c(1)]*100,2) #CONVERT INTO PERCENT ESTIMATES r_est2 <- subset(r_est2, select=c(1,3,5)) #SELECT ESTIMATES FOR UP-TO-DATE CASES names(r_est2) <- c("STATE", "PERCENT 4:3:1:H:3:1:4 UTD", "STANDARD ERROR UTD") prn(r_est2, '4:3:1:H:3:1:4 ESTIMATES BY STATE') ###################### title <- "R_PROG_3.R" ###################################################################### #THIS PROGRAM WILL PRODUCE A TABLE OF HAD_CPOX BY STATE FOR ALL RDD #COMPLETES USING RDDWT_D. THE PROGRAM USES R. # #R NOTES: #1. R IS CASE SENSITIVE. #2. A FILE PATH IS SEPERATED BY SLASH(/) ######################################################################

Data User’s Guide for the 2015 NIS Public-Use Data File APPENDIX D 121
library(survey) #TO USE svydesign(), svymean(), and svyby() library(Hmisc) #TO USE prn() library(prettyR) #TO USE freq()
dd <- "c:/nispuf15" #"path-to-dataset"
#--- NAME OF R DATASET ---# in.file <- paste(dd,"/NISPUF15.RData",sep="") #---READ R DATASET---# load(in.file) #---FORMAT---# HAD_CPOXlevels=c(1,2,77,99) HAD_CPOXlabels=c("YES", "NO", "DON'T KNOW", "REFUSED") STATElevels=c(1, 2, 4, 5, 6, 8, 9, 10, 11, 12, 13, 15, 16, 17, 18, 19, 20, 21, 22, 23, 24, 25, 26, 27, 28, 29, 30, 31, 32, 33, 34, 35, 36, 37, 38, 39, 40, 41, 42, 44, 45, 46, 47, 48, 49, 50, 51, 53, 54, 55, 56, 72) STATElabels=c( "ALABAMA", "ALASKA", "ARIZONA", "ARKANSAS", "CALIFORNIA", "COLORADO", "CONNECTICUT", "DELAWARE", "DISTRICT OF COLUMBIA", "FLORIDA", "GEORGIA", "HAWAII", "IDAHO", "ILLINOIS", "INDIANA", "IOWA", "KANSAS", "KENTUCKY", "LOUISIANA", "MAINE", "MARYLAND", "MASSACHUSETTS", "MICHIGAN", "MINNESOTA", "MISSISSIPPI", "MISSOURI", "MONTANA", "NEBRASKA", "NEVADA", "NEW HAMPSHIRE", "NEW JERSEY", "NEW MEXICO", "NEW YORK", "NORTH CAROLINA", "NORTH DAKOTA", "OHIO", "OKLAHOMA", "OREGON", "PENNSYLVANIA", "RHODE ISLAND", "SOUTH CAROLINA", "SOUTH DAKOTA", "TENNESSEE", "TEXAS",

Data User’s Guide for the 2015 NIS Public-Use Data File APPENDIX D 122
"UTAH", "VERMONT", "VIRGINIA", "WASHINGTON", "WEST VIRGINIA", "WISCONSIN", "WYOMING", "PUERTO RICO" ) #---RDDWT_D WILL BE USED AS A WEIGHT (RDDWT_D IS THE DUAL-FRAME WEIGHT EXCLUDING TERRITORIES. USE RDDWT_D_TERR TO INCLUDE TERRITORIES)---# #---STRATUM WILL BE USED AS A STRATUM VARIABLE FOR VARIANCE ESTIMATION ---# R_FILE <- subset(NISPUF15, select=c(SEQNUMHH, SEQNUMC, STATE, HAD_CPOX, RDDWT_D, STRATUM)) names(R_FILE) <- c("SEQNUMHH", "SEQNUMC", "STATE", "HAD_CPOX", "WT", "STRATUM") #---ASSIGN LABELS---# R_FILE$HAD_CPOX <- factor(R_FILE$HAD_CPOX, levels=HAD_CPOXlevels, labels=HAD_CPOXlabels) R_FILE$STATE <- factor(R_FILE$STATE, levels=STATElevels, labels=STATElabels) R_FILE <- na.omit(R_FILE) summary(R_FILE$HAD_CPOX) #---SPECIFY A SAMPLING DESIGN AND FORCE WT AS NUMERIC---# svydsg <- svydesign(id=~SEQNUMHH, strata=~STRATUM, weights=~(as.numeric(WT)), data=R_FILE) #---U.S. TOTAL ESTIMATES AND STANDARD ERRORS---# r_nation <- svymean(~HAD_CPOX, svydsg) PERCENT_UTD <- round(r_nation*100,2) #CONVERT INTO PERCENT ESTIMATES(MEAN) SE_UTD <- round(SE(r_nation)*100,2) #CONVERT INTO PERCENT ESTIMATES(SE) r_nation_est3 <- cbind(PERCENT_UTD, SE_UTD) prn(r_nation_est3, "PERCENT HAD_CPOX = YES ESTIMATES AT A NATIONAL LEVEL\n") #---HAD_CPOX = YES ESTIMATES BY STATE---# r_est3 <- svyby(~HAD_CPOX, ~STATE, svydsg, svymean) r_est3[,-c(1)] <- round(r_est3[,-c(1)]*100,2) #CONVERT INTO PERCENT ESTIMATES r_est3 <- subset(r_est3, select=c(1,2,6)) #SELECT ESTIMATES FOR HAD_CPOX=YES names(r_est3) <- c("STATE", "PERCENT HAD_CPOX=YES", "STANDARD ERROR HAD_CPOX=Y") prn(r_est3, 'PERCENT HAD_CPOX ESTIMATES BY STATE') ###################### title <- "PROG_4.R" ######################################################################### #TABLE OF P_UTD431H314_ROUT_S BY INCPOV1 BY RACE_K. SAVE % UTD #ESTIMATES (NOT S.E.'S) FOR USE IN THE PROGRAM GRAPH_4. # #THIS PROGRAM WILL PRODUCE ESTIMATES USING R. # #R NOTES: #1. R IS CASE SENSITIVE. #2. A FILE PATH IS SEPERATED BY SLASH(/) ######################################################################### library(survey) #TO USE svydesign(), svymean(), and svyby() library(Hmisc) #TO USE prn() dd <- "c:/nispuf15" #"path-to-dataset"

Data User’s Guide for the 2015 NIS Public-Use Data File APPENDIX D 123
out <-"c:/nispuf15" #"path-to-output" #--- NAME OF R DATASET ---# in.file <- paste(dd,"/NISPUF15.RData",sep="") #---READ R DATASET---# load(in.file) #---FORMAT---# UTD431H314levels=c(0,1) UTD431H314labels=c("NOT 4:3:1:H:3:1:4 UTD", "4:3:1:H:3:1:4 UTD") RACE_PUFlevels=c(1,2,3) RACE_PUFlabels=c("WHITE ONLY", "BLACK ONLY", "OTHER + MULTIPLE RACE") INCPOVlevels=c(1,2,3,4) INCPOVlabels=c("ABOVE POVERTY, > $75K", "ABOVE POVERTY, <= $75K", "BELOW POVERTY", "UNKNOWN") #---PROVWT_D WILL BE USED AS A WEIGHT (PROVWT_D IS THE DUAL-FRAME WEIGHT EXCLUDING TERRITORIES. USE PROVWT_D_TERR TO INCLUDE TERRITORIES)---# #---STRATUM WILL BE USED AS A STRATUM VARIABLE FOR VARIANCE ESTIMATION ---# R_FILE <- subset(NISPUF15, select=c(SEQNUMHH, SEQNUMC, P_UTD431H314_ROUT_S, RACE_K, INCPOV1, PROVWT_D, STRATUM)) names(R_FILE) <- c("SEQNUMHH", "SEQNUMC", "P_UTD431H314_ROUT_S", "RACE_K", "INCPOV1", "WT", "STRATUM") #---ASSIGN LABELS---# R_FILE$P_UTD431H314_ROUT_S <- factor(R_FILE$P_UTD431H314_ROUT_S, levels=UTD431H314levels, labels=UTD431H314labels, exclude=NULL) R_FILE$RACE_K <- factor(R_FILE$RACE_K, levels=RACE_PUFlevels, labels=RACE_PUFlabels, exclude=NULL) R_FILE$INCPOV1 <- factor(R_FILE$INCPOV1, levels=INCPOVlevels,labels=INCPOVlabels, exclude=NULL) #---UNWEIGHTED FREQUENCIES---# unwt_freq <- function(UNWT.VAR){#FUNCTION TO PRINT UNWEIGHTED FREQUENCIES unwt.tab <- wtd.table(UNWT.VAR, weights= NULL, type='table') unwtd.freq <- data.frame(cbind( unwt.tab, round(unwt.tab/sum(unwt.tab)*100,2), cumsum(unwt.tab), cumsum(round(unwt.tab/sum(unwt.tab)*100,2)))) names(unwtd.freq) <- c("Frequency", "Percent", "Cumulative Frequency", "Cumulative Percent") unwtd.title <- paste('Table 4A. Q1/2015 - Q4/2015', 'UNWEIGHTED FREQUENCIES', label(UNWT.VAR), sep="\n") label(unwtd.freq) <- unwtd.title print(unwtd.freq) } unwt_freq(R_FILE$P_UTD431H314_ROUT_S) unwt_freq(R_FILE$INCPOV1) unwt_freq(R_FILE$RACE_K) R_FILE <- na.omit(R_FILE) #---SPECIFY A SAMPLING DESIGN AND FORCE WT AS NUMERIC---# svydsg <- svydesign(id=~SEQNUMHH, strata=~STRATUM, weights=~(as.numeric(WT)), data=R_FILE) #---PERCENT 4:3:1:H:3:1:4 UP-TO-DATE AND ESTIMATED STANDARD ERRORS---# r_est4 <- svyby(~P_UTD431H314_ROUT_S, ~RACE_K+INCPOV1, svydsg, svymean) r_est4[,-c(1,2)] <- round(r_est4[,-c(1,2)]*100,2) #CONVERT INTO PERCENT ESTIMATES r_est4 <- subset(r_est4, select=c(1,2,4,6)) #SELECT ESTIMATES FOR UP-TODATE CASES names(r_est4) <- c("RACE", "INCOME", "PERCENT_UTD", "STANDARD_ERROR_UTD") title <- "Table 4B. Q1/2015 - Q4/2015, Percent 4:3:1:H:3:1:4 UTD and Estimated Standard Errors" prn(r_est4, title) #---SAVE PERCENT UP-TO-DATE ESTIMATES FOR USE IN THE PROGRAM GRAPH_4---# r_est4 <- subset(r_est4, select=c(RACE, INCOME, PERCENT_UTD)) save(r_est4, file=paste(out, "/r_est4", sep="")) ###################### title <- "GRAPH_4.R" ######################################################################### #THIS PROGRAM BUILDS OFF OF THE PROGRAM PROG_4. IT PRODUCES A CHART OF #P_UTD431H314_ROUT_S BY INCPOV1 BY RACE_K. IT CREATES A BAR CHART IN R GRAPH FOR #THE 4X3 = 12 CELLS.

Data User’s Guide for the 2015 NIS Public-Use Data File APPENDIX D 124
#R NOTES: #1. R IS CASE SENSITIVE. #2. A FILE PATH IS SEPERATED BY SLASH(/) ######################################################################### library(survey) #TO USE svydesign(), svymean(), and svyby() library(Hmisc) #TO USE prn() dd <- "c:/nispuf15" #---SPECIFY PATH TO R DATASET THAT WAS THE OUTPUT OF R_PROG_4---# out <- "c:/nispuf15" #---SPECIFY THE PATH FOR WHERE YOU WANT THE CHART OUTPUT TO GO---# #---NAME OF R DATASET OUTPUT FROM R_PROG_4---# in.file <- paste(dd,"/r_est4",sep="") #---READ R DATASET---# load(in.file) #---BARCHART---# #NOTE:R DOES NOT SUPPORT CREATING A HTML FILE CONTAINING A BARCHART# #CREATE A DATA MATRIX FOR DRAWING A BARCHART# utd431H314 <- matrix(r_est4$PERCENT_UTD, nrow=3, ncol=4, byrow=F, dimnames=list(levels(r_est4$RACE), levels(r_est4$INCOME))) #CREATE GRAPH_4.GIF# barplot(utd431H314, beside=TRUE, space=c(0.2,1), col = c("wheat", "lightpink2", "forestgreen"), axis.lty = 1, sub="(Graph 4 using 'R')", cex.sub=1, ylim=c(0,120), xlab="Poverty Status", ylab="4:3:1:H:3:1:4 Up-To-Date (%)", cex=1, cex.names=1, border=NA) legend("top", rownames(utd431H314), col=c("wheat", "lightpink2", "forestgreen"), title="Race of Child", pch=15, cex=1) title1 <- "Percentage of Children Up-to-date with Vaccine Series 4:3:1:H:3:1:4 \n" title2 <- "by Race and Poverty Status, National Immunization Survey, 2015\n" mtext(paste(title1,title2), cex=1.3)

Data User’s Guide for the 2015 NIS Public-Use Data File APPENDIX D 125

Data User’s Guide for the 2015 NIS Public-Use Data File APPENDIX E 126
Appendix E: Alphabetical Listing of Variables that are in the 2004-2015 Public-Use Data Files
Table E.1 Alphabetical Listing of Variables that are in the 2004-2015 Public-Use Data Files* Year of Data Collection
Variable Name Variable Label† 2004 2005 2006 2007 2008 2009 2010 2011 2012 2013 2014 2015 Notes§
AGECPOXR AGE IN MONTHS AT CHICKEN POX DISEASE (RECODE) Y Y Y Y Y Y Y Y Y Y Y Replaces IAGECPXR starting
2005. This version is not imputed.
AGEGRP AGE CATEGORY OF CHILD (19-23, 24-29, 30-35 MO) (RECODE) Y Y Y Y Y Y Y Y Y Y Y Y
ALL4SHOT HH REPORT OF 4:3:1:3 UP-TO-DATE Y Y Dropped starting in 2006 because no longer possible to derive due to shortened Section B.
BF_ENDR DURATION OF BREAST FEEDING IN DAYS (TOPCODE) Y Y
Dropped starting in 2006 because of question wording change. Replaced by BF_ENDR06.
BF_ENDR06 DURATION OF BREAST FEEDING IN DAYS (RECODE) Y Y Y Y Y Y Y Y Y Y Replaces BF_ENDR starting 2006.
BF_EXCLR DURATION OF EXCLUSIVE BREAST FEEDING IN DAYS (TOPCODE) Y Y
Dropped starting in 2006 because of question wording change. Replaced by BF_EXCLR06.
BF_EXCLR06 DURATION OF EXCLUSIVE BREAST/FORMULA FEEDING IN DAYS (RECODE)
Y Y Y Y Y Y Y Y Y Y Replaces BF_EXCLR starting 2006.
BF_FORMR06 AGE IN DAYS WHEN CHILD FIRST FED FORMULA (TOPCODE) Y Y
Question CBF_03_X added starting 2006. Replaced by BF_FORMR06 starting 2008.
BF_FORMR08 AGE IN DAYS WHEN CHILD FIRST FED FORMULA (RECODE) Y Y Y Y Y Y Y Y Replaces BF_FORMR06 to add a
"never fed formula" code.
BFENDFL DURATION OF BREAST FEEDING EXCEEDS CHILD AGE IN DAYS, WITH BUFFER Y Y
Dropped starting in 2006 because of question wording change. Replaced by BFENDFL06.
BFENDFL06 DURATION OF BREAST FEEDING EXCEEDS CHILD AGE IN DAYS, WITH BUFFER Y Y Y Y Y Y Y Y Y Y Replaces BFENDFL starting 2006.
BFEXCLFL DURATION OF EXCLUSIVE BREAST FEEDING EXCEEDS TOTAL BREASTFEEDING, WITH BUFFER
Y Y Dropped starting in 2006 because question wording change does not allow it to be derived.
BFFORMFL06 AGE IN DAYS WHEN CHILD FIRST FED FORMULA EXCEEDS CHILD AGE IN DAYS, WITH BUFFER
Y Y Y Y Y Y Y Y Y Y Question CBF_03_X added starting 2006.

Data User’s Guide for the 2015 NIS Public-Use Data File APPENDIX E 127
Variable Name Variable Label† 2004 2005 2006 2007 2008 2009 2010 2011 2012 2013 2014 2015 Notes§
C_431 HH REPORT OF 4:3:1 UP-TO-DATE BY SHOT CARD USE Y Y
Dropped starting in 2006 because no longer possible to derive due to shortened Section B.
C_4313 HH REPORT OF 4:3:1:3 UP-TO-DATE BY SHOT CARD USE Y Y
Dropped starting in 2006 because no longer possible to derive due to shortened Section B.
C_DTP HH REPORT OF 4+ DT-CONTAINING UP-TO-DATE BY SHOT CARD USE Y Y
Dropped starting in 2006 because no longer possible to derive due to shortened Section B.
C_HEP HH REPORT OF 3+ HEPATITIS B-CONTAINING UP-TO-DATE BY SHOT CARD USE Y Y
Dropped starting in 2006 because no longer possible to derive due to shortened Section B.
C_HIB HH REPORT OF 3+ HIB-CONTAINING UP-TO-DATE BY SHOT CARD USE Y Y
Dropped starting in 2006 because no longer possible to derive due to shortened Section B.
C_MMR HH REPORT OF 1+ MEASLES-CONTAINING UP-TO-DATE BY SHOT CARD USE Y Y
Dropped starting in 2006 because no longer possible to derive due to shortened Section B.
C_POL HH REPORT OF 3+ POLIO-CONTAINING UP-TO-DATE BY SHOT CARD USE Y Y
Dropped starting in 2006 because no longer possible to derive due to shortened Section B.
C_VRC HH REPORT OF 1+ VARICELLA-CONTAINING UP-TO-DATE BY SHOT CARD USE Y Y
Dropped starting in 2006 because no longer possible to derive due to shortened Section B.
C1R NUMBER OF PEOPLE IN HOUSEHOLD (RECODE) Y Y Y Y Y Y Y Y Y Y Y Y
C5R RELATIONSHIP OF RESPONDENT TO CHILD (RECODE) Y Y Y Y Y Y Y Y Y Y Y Y
CBF_01 WAS CHILD EVER BREAST FED OR FED BREAST MILK? Y Y Y Y Y Y Y Y Y Y Y Y
CEN_REG CENSUS REGION BASED ON TRUE STATE OF RESIDENCE Y Y Y Y Y Y Y Y Y Y Y Y
CHILDNM NUMBER OF CHILDREN LESS THAN 18 YEARS IN HH (RECODE) Y Y Y Y Y Y Y Y Y Y Y Y
CWIC_01 CHILD EVER RECEIVED WIC BENEFITS? Y Y Y Y Y Y Y Y Y Y Y Y
CWIC_02 CHILD CURRENTLY RECEIVING WIC BENEFITS? Y Y Y Y Y Y Y Y Y Y Y Y
D6R NUMBER OF VACCINATION PROVIDERS IDENTIFIED BY RESPONDENT (RECODE) Y Y Y Y Y Y Y Y Y Y Y Y
D7 CONSENT TO OBTAIN CHILD'S IMMUNIZATION RECORDS FROM PROVIDERS Y Y Y Y Y Y Y Y Y Y Y Y
DDTP1 AGE IN DAYS OF PROV-REPTD DT-CONTAINING SHOT #1 Y Y Y Y Y Y Y Y Y Y Y Y

Data User’s Guide for the 2015 NIS Public-Use Data File APPENDIX E 128
Variable Name Variable Label† 2004 2005 2006 2007 2008 2009 2010 2011 2012 2013 2014 2015 Notes§
DDTP2 AGE IN DAYS OF PROV-REPTD DT-CONTAINING SHOT #2 Y Y Y Y Y Y Y Y Y Y Y Y
DDTP3 AGE IN DAYS OF PROV-REPTD DT-CONTAINING SHOT #3 Y Y Y Y Y Y Y Y Y Y Y Y
DDTP4 AGE IN DAYS OF PROV-REPTD DT-CONTAINING SHOT #4 Y Y Y Y Y Y Y Y Y Y Y Y
DDTP5 AGE IN DAYS OF PROV-REPTD DT-CONTAINING SHOT #5 Y Y Y Y Y Y Y Y Y Y Y Y
DDTP6 AGE IN DAYS OF PROV-REPTD DT-CONTAINING SHOT #6 Y Y Y Y Y Y Y Y Y Y Y Y
DDTP7 AGE IN DAYS OF PROV-REPTD DT-CONTAINING SHOT #7 Y Y Y Y Y Y Y Y Y Y Y Y
DDTP8 AGE IN DAYS OF PROV-REPTD DT-CONTAINING SHOT #8 Y Y Y Y Y Y Y Y Y Y Y Y
DDTP9 AGE IN DAYS OF PROV-REPTD DT-CONTAINING SHOT #9 Y Y Y Y Y Y Y Y Y Y Y
Starting in 2005, nine shot variables are included for each vaccine category.
DFLU1 AGE IN DAYS OF PROV-REPTD SEASONAL FLU-CONTAINING VACCINATION #1 Y Y Y Y Y Y Y Y Y Y Y Y
DFLU2 AGE IN DAYS OF PROV-REPTD SEASONAL FLU-CONTAINING VACCINATION #2 Y Y Y Y Y Y Y Y Y Y Y Y
DFLU3 AGE IN DAYS OF PROV-REPTD SEASONAL FLU-CONTAINING VACCINATION #3 Y Y Y Y Y Y Y Y Y Y Y Y
DFLU4 AGE IN DAYS OF PROV-REPTD SEASONAL FLU-CONTAINING VACCINATION #4 Y Y Y Y Y Y Y Y Y Y Y Y
DFLU5 AGE IN DAYS OF PROV-REPTD SEASONAL FLU-CONTAINING VACCINATION #5 Y Y Y Y Y Y Y Y Y Y Y Y
DFLU6 AGE IN DAYS OF PROV-REPTD SEASONAL FLU-CONTAINING VACCINATION #6 Y Y Y Y Y Y Y Y Y Y Y Y
DFLU7 AGE IN DAYS OF PROV-REPTD SEASONAL FLU-CONTAINING VACCINATION #7 Y Y Y Y Y Y Y Y Y Y Y Y
DFLU8 AGE IN DAYS OF PROV-REPTD SEASONAL FLU-CONTAINING VACCINATION #8 Y Y Y Y Y Y Y Y Y Y Y Y
DFLU9 AGE IN DAYS OF PROV-REPTD SEASONAL FLU-CONTAINING VACCINATION #9 Y Y Y Y Y Y Y Y Y Y Y
Starting in 2005, nine shot variables are included for each vaccine category.
DH1N1 AGE IN DAYS OF PROV-REPTD MONOVALENT 2009 H1N1 FLU VACCINATION #1 Y Y Y Introduced in 2010. Removed
2013.
DH1N2 AGE IN DAYS OF PROV-REPTD MONOVALENT 2009 H1N1 FLU VACCINATION #2 Y Y Y Introduced in 2010. Removed
2013.
DH1N3 AGE IN DAYS OF PROV-REPTD MONOVALENT 2009 H1N1 FLU VACCINATION #3 Y Y Y Introduced in 2010. Removed
2013.
DH1N4 AGE IN DAYS OF PROV-REPTD MONOVALENT 2009 H1N1 FLU VACCINATION #4 Y Y Y Introduced in 2010. Removed
2013.
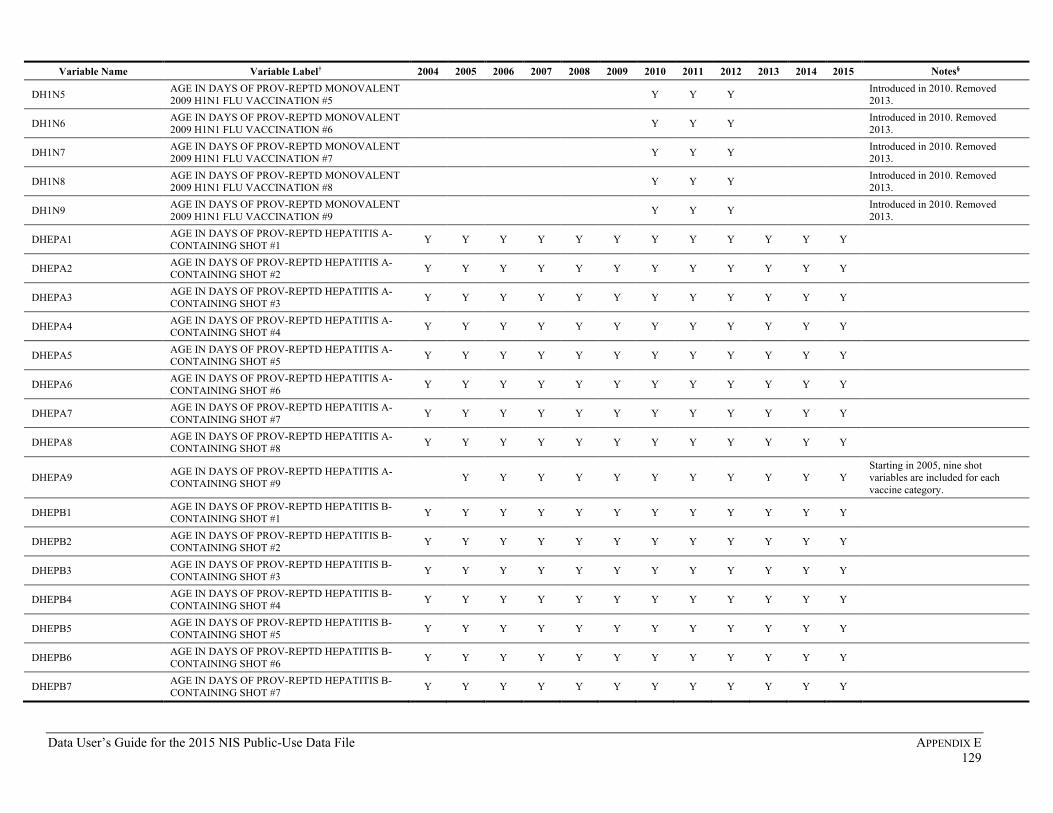
Data User’s Guide for the 2015 NIS Public-Use Data File APPENDIX E 129
Variable Name Variable Label† 2004 2005 2006 2007 2008 2009 2010 2011 2012 2013 2014 2015 Notes§
DH1N5 AGE IN DAYS OF PROV-REPTD MONOVALENT 2009 H1N1 FLU VACCINATION #5 Y Y Y Introduced in 2010. Removed
2013.
DH1N6 AGE IN DAYS OF PROV-REPTD MONOVALENT 2009 H1N1 FLU VACCINATION #6 Y Y Y Introduced in 2010. Removed
2013.
DH1N7 AGE IN DAYS OF PROV-REPTD MONOVALENT 2009 H1N1 FLU VACCINATION #7 Y Y Y Introduced in 2010. Removed
2013.
DH1N8 AGE IN DAYS OF PROV-REPTD MONOVALENT 2009 H1N1 FLU VACCINATION #8 Y Y Y Introduced in 2010. Removed
2013.
DH1N9 AGE IN DAYS OF PROV-REPTD MONOVALENT 2009 H1N1 FLU VACCINATION #9 Y Y Y Introduced in 2010. Removed
2013.
DHEPA1 AGE IN DAYS OF PROV-REPTD HEPATITIS A-CONTAINING SHOT #1 Y Y Y Y Y Y Y Y Y Y Y Y
DHEPA2 AGE IN DAYS OF PROV-REPTD HEPATITIS A-CONTAINING SHOT #2 Y Y Y Y Y Y Y Y Y Y Y Y
DHEPA3 AGE IN DAYS OF PROV-REPTD HEPATITIS A-CONTAINING SHOT #3 Y Y Y Y Y Y Y Y Y Y Y Y
DHEPA4 AGE IN DAYS OF PROV-REPTD HEPATITIS A-CONTAINING SHOT #4 Y Y Y Y Y Y Y Y Y Y Y Y
DHEPA5 AGE IN DAYS OF PROV-REPTD HEPATITIS A-CONTAINING SHOT #5 Y Y Y Y Y Y Y Y Y Y Y Y
DHEPA6 AGE IN DAYS OF PROV-REPTD HEPATITIS A-CONTAINING SHOT #6 Y Y Y Y Y Y Y Y Y Y Y Y
DHEPA7 AGE IN DAYS OF PROV-REPTD HEPATITIS A-CONTAINING SHOT #7 Y Y Y Y Y Y Y Y Y Y Y Y
DHEPA8 AGE IN DAYS OF PROV-REPTD HEPATITIS A-CONTAINING SHOT #8 Y Y Y Y Y Y Y Y Y Y Y Y
DHEPA9 AGE IN DAYS OF PROV-REPTD HEPATITIS A-CONTAINING SHOT #9 Y Y Y Y Y Y Y Y Y Y Y
Starting in 2005, nine shot variables are included for each vaccine category.
DHEPB1 AGE IN DAYS OF PROV-REPTD HEPATITIS B-CONTAINING SHOT #1 Y Y Y Y Y Y Y Y Y Y Y Y
DHEPB2 AGE IN DAYS OF PROV-REPTD HEPATITIS B-CONTAINING SHOT #2 Y Y Y Y Y Y Y Y Y Y Y Y
DHEPB3 AGE IN DAYS OF PROV-REPTD HEPATITIS B-CONTAINING SHOT #3 Y Y Y Y Y Y Y Y Y Y Y Y
DHEPB4 AGE IN DAYS OF PROV-REPTD HEPATITIS B-CONTAINING SHOT #4 Y Y Y Y Y Y Y Y Y Y Y Y
DHEPB5 AGE IN DAYS OF PROV-REPTD HEPATITIS B-CONTAINING SHOT #5 Y Y Y Y Y Y Y Y Y Y Y Y
DHEPB6 AGE IN DAYS OF PROV-REPTD HEPATITIS B-CONTAINING SHOT #6 Y Y Y Y Y Y Y Y Y Y Y Y
DHEPB7 AGE IN DAYS OF PROV-REPTD HEPATITIS B-CONTAINING SHOT #7 Y Y Y Y Y Y Y Y Y Y Y Y

Data User’s Guide for the 2015 NIS Public-Use Data File APPENDIX E 130
Variable Name Variable Label† 2004 2005 2006 2007 2008 2009 2010 2011 2012 2013 2014 2015 Notes§
DHEPB8 AGE IN DAYS OF PROV-REPTD HEPATITIS B-CONTAINING SHOT #8 Y Y Y Y Y Y Y Y Y Y Y Y
DHEPB9 AGE IN DAYS OF PROV-REPTD HEPATITIS B-CONTAINING SHOT #9 Y Y Y Y Y Y Y Y Y Y Y
Starting in 2005, nine shot variables are included for each vaccine category.
DHIB1 AGE IN DAYS OF PROV-REPTD HIB-CONTAINING SHOT #1 Y Y Y Y Y Y Y Y Y Y Y Y
DHIB2 AGE IN DAYS OF PROV-REPTD HIB-CONTAINING SHOT #2 Y Y Y Y Y Y Y Y Y Y Y Y
DHIB3 AGE IN DAYS OF PROV-REPTD HIB-CONTAINING SHOT #3 Y Y Y Y Y Y Y Y Y Y Y Y
DHIB4 AGE IN DAYS OF PROV-REPTD HIB-CONTAINING SHOT #4 Y Y Y Y Y Y Y Y Y Y Y Y
DHIB5 AGE IN DAYS OF PROV-REPTD HIB-CONTAINING SHOT #5 Y Y Y Y Y Y Y Y Y Y Y Y
DHIB6 AGE IN DAYS OF PROV-REPTD HIB-CONTAINING SHOT #6 Y Y Y Y Y Y Y Y Y Y Y Y
DHIB7 AGE IN DAYS OF PROV-REPTD HIB-CONTAINING SHOT #7 Y Y Y Y Y Y Y Y Y Y Y Y
DHIB8 AGE IN DAYS OF PROV-REPTD HIB-CONTAINING SHOT #8 Y Y Y Y Y Y Y Y Y Y Y Y
DHIB9 AGE IN DAYS OF PROV-REPTD HIB-CONTAINING SHOT #9 Y Y Y Y Y Y Y Y Y Y Y
Starting in 2005, nine shot variables are included for each vaccine category.
DISPCODE NIS PROVIDER RECORD-CHECK DISPOSITION CODE Y Y Y Y Y Y Y Y Dropped starting in 2012.
DMMR1 AGE IN DAYS OF PROV-REPTD MEASLES-CONTAINING SHOT #1 Y Y Y Y Y Y Y Y Y Y Y Y
DMMR2 AGE IN DAYS OF PROV-REPTD MEASLES-CONTAINING SHOT #2 Y Y Y Y Y Y Y Y Y Y Y Y
DMMR3 AGE IN DAYS OF PROV-REPTD MEASLES-CONTAINING SHOT #3 Y Y Y Y Y Y Y Y Y Y Y Y
DMMR4 AGE IN DAYS OF PROV-REPTD MEASLES-CONTAINING SHOT #4 Y Y Y Y Y Y Y Y Y Y Y Y
DMMR5 AGE IN DAYS OF PROV-REPTD MEASLES-CONTAINING SHOT #5 Y Y Y Y Y Y Y Y Y Y Y
Starting in 2005, nine shot variables are included for each vaccine category.
DMMR6 AGE IN DAYS OF PROV-REPTD MEASLES-CONTAINING SHOT #6 Y Y Y Y Y Y Y Y Y Y Y
Starting in 2005, nine shot variables are included for each vaccine category.
DMMR7 AGE IN DAYS OF PROV-REPTD MEASLES-CONTAINING SHOT #7 Y Y Y Y Y Y Y Y Y Y Y
Starting in 2005, nine shot variables are included for each vaccine category.

Data User’s Guide for the 2015 NIS Public-Use Data File APPENDIX E 131
Variable Name Variable Label† 2004 2005 2006 2007 2008 2009 2010 2011 2012 2013 2014 2015 Notes§
DMMR8 AGE IN DAYS OF PROV-REPTD MEASLES-CONTAINING SHOT #8 Y Y Y Y Y Y Y Y Y Y Y
Starting in 2005, nine shot variables are included for each vaccine category.
DMMR9 AGE IN DAYS OF PROV-REPTD MEASLES-CONTAINING SHOT #9 Y Y Y Y Y Y Y Y Y Y Y
Starting in 2005, nine shot variables are included for each vaccine category.
DMP1 AGE IN DAYS OF PROV-REPTD MUMPS-ONLY SHOT #1 Y Y Y Y Y Y Y Y Y Y Y Y
DMP2 AGE IN DAYS OF PROV-REPTD MUMPS-ONLY SHOT #2 Y Y Y Y Y Y Y Y Y Y Y Y
DMP3 AGE IN DAYS OF PROV-REPTD MUMPS-ONLY SHOT #3 Y Y Y Y Y Y Y Y Y Y Y Y
DMP4 AGE IN DAYS OF PROV-REPTD MUMPS-ONLY SHOT #4 Y Y Y Y Y Y Y Y Y Y Y Y
DMP5 AGE IN DAYS OF PROV-REPTD MUMPS-ONLY SHOT #5 Y Y Y Y Y Y Y Y Y Y Y
Starting in 2005, nine shot variables are included for each vaccine category.
DMP6 AGE IN DAYS OF PROV-REPTD MUMPS-ONLY SHOT #6 Y Y Y Y Y Y Y Y Y Y Y
Starting in 2005, nine shot variables are included for each vaccine category.
DMP7 AGE IN DAYS OF PROV-REPTD MUMPS-ONLY SHOT #7 Y Y Y Y Y Y Y Y Y Y Y
Starting in 2005, nine shot variables are included for each vaccine category.
DMP8 AGE IN DAYS OF PROV-REPTD MUMPS-ONLY SHOT #8 Y Y Y Y Y Y Y Y Y Y Y
Starting in 2005, nine shot variables are included for each vaccine category.
DMP9 AGE IN DAYS OF PROV-REPTD MUMPS-ONLY SHOT #9 Y Y Y Y Y Y Y Y Y Y Y
Starting in 2005, nine shot variables are included for each vaccine category.
DMPRB1 AGE IN DAYS OF PROV-REPTD (MUMPS/RUBELLA)-ONLY SHOT #1 Y Y Y Y Y Y Y Y Y Y Y Y
DMPRB2 AGE IN DAYS OF PROV-REPTD (MUMPS/RUBELLA)-ONLY SHOT #2 Y Y Y Y Y Y Y Y Y Y Y Y
DMPRB3 AGE IN DAYS OF PROV-REPTD (MUMPS/RUBELLA)-ONLY SHOT #3 Y Y Y Y Y Y Y Y Y Y Y Y
DMPRB4 AGE IN DAYS OF PROV-REPTD (MUMPS/RUBELLA)-ONLY SHOT #4 Y Y Y Y Y Y Y Y Y Y Y Y
DMPRB5 AGE IN DAYS OF PROV-REPTD (MUMPS/RUBELLA)-ONLY SHOT #5 Y Y Y Y Y Y Y Y Y Y Y
Starting in 2005, nine shot variables are included for each vaccine category.
DMPRB6 AGE IN DAYS OF PROV-REPTD (MUMPS/RUBELLA)-ONLY SHOT #6 Y Y Y Y Y Y Y Y Y Y Y
Starting in 2005, nine shot variables are included for each vaccine category.

Data User’s Guide for the 2015 NIS Public-Use Data File APPENDIX E 132
Variable Name Variable Label† 2004 2005 2006 2007 2008 2009 2010 2011 2012 2013 2014 2015 Notes§
DMPRB7 AGE IN DAYS OF PROV-REPTD (MUMPS/RUBELLA)-ONLY SHOT #7 Y Y Y Y Y Y Y Y Y Y Y
Starting in 2005, nine shot variables are included for each vaccine category.
DMPRB8 AGE IN DAYS OF PROV-REPTD (MUMPS/RUBELLA)-ONLY SHOT #8 Y Y Y Y Y Y Y Y Y Y Y
Starting in 2005, nine shot variables are included for each vaccine category.
DMPRB9 AGE IN DAYS OF PROV-REPTD (MUMPS/RUBELLA)-ONLY SHOT #9 Y Y Y Y Y Y Y Y Y Y Y
Starting in 2005, nine shot variables are included for each vaccine category.
DPCV1 AGE IN DAYS OF PROV-REPTD PNEUMOCOCCAL-CONTAINING SHOT #1 Y Y Y Y Y Y Y Y Y Y Y Y
DPCV2 AGE IN DAYS OF PROV-REPTD PNEUMOCOCCAL-CONTAINING SHOT #2 Y Y Y Y Y Y Y Y Y Y Y Y
DPCV3 AGE IN DAYS OF PROV-REPTD PNEUMOCOCCAL-CONTAINING SHOT #3 Y Y Y Y Y Y Y Y Y Y Y Y
DPCV4 AGE IN DAYS OF PROV-REPTD PNEUMOCOCCAL-CONTAINING SHOT #4 Y Y Y Y Y Y Y Y Y Y Y Y
DPCV5 AGE IN DAYS OF PROV-REPTD PNEUMOCOCCAL-CONTAINING SHOT #5 Y Y Y Y Y Y Y Y Y Y Y Y
DPCV6 AGE IN DAYS OF PROV-REPTD PNEUMOCOCCAL-CONTAINING SHOT #6 Y Y Y Y Y Y Y Y Y Y Y Y
DPCV7 AGE IN DAYS OF PROV-REPTD PNEUMOCOCCAL-CONTAINING SHOT #7 Y Y Y Y Y Y Y Y Y Y Y Y
DPCV8 AGE IN DAYS OF PROV-REPTD PNEUMOCOCCAL-CONTAINING SHOT #8 Y Y Y Y Y Y Y Y Y Y Y Y
DPCV9 AGE IN DAYS OF PROV-REPTD PNEUMOCOCCAL-CONTAINING SHOT #9 Y Y Y Y Y Y Y Y Y Y Y
Starting in 2005, nine shot variables are included for each vaccine category.
DPOLIO1 AGE IN DAYS OF PROV-REPTD POLIO-CONTAINING SHOT #1 Y Y Y Y Y Y Y Y Y Y Y Y
DPOLIO2 AGE IN DAYS OF PROV-REPTD POLIO-CONTAINING SHOT #2 Y Y Y Y Y Y Y Y Y Y Y Y
DPOLIO3 AGE IN DAYS OF PROV-REPTD POLIO-CONTAINING SHOT #3 Y Y Y Y Y Y Y Y Y Y Y Y
DPOLIO4 AGE IN DAYS OF PROV-REPTD POLIO-CONTAINING SHOT #4 Y Y Y Y Y Y Y Y Y Y Y Y
DPOLIO5 AGE IN DAYS OF PROV-REPTD POLIO-CONTAINING SHOT #5 Y Y Y Y Y Y Y Y Y Y Y Y
DPOLIO6 AGE IN DAYS OF PROV-REPTD POLIO-CONTAINING SHOT #6 Y Y Y Y Y Y Y Y Y Y Y Y
DPOLIO7 AGE IN DAYS OF PROV-REPTD POLIO-CONTAINING SHOT #7 Y Y Y Y Y Y Y Y Y Y Y Y
DPOLIO8 AGE IN DAYS OF PROV-REPTD POLIO-CONTAINING SHOT #8 Y Y Y Y Y Y Y Y Y Y Y Y

Data User’s Guide for the 2015 NIS Public-Use Data File APPENDIX E 133
Variable Name Variable Label† 2004 2005 2006 2007 2008 2009 2010 2011 2012 2013 2014 2015 Notes§
DPOLIO9 AGE IN DAYS OF PROV-REPTD POLIO-CONTAINING SHOT #9 Y Y Y Y Y Y Y Y Y Y Y
Starting in 2005, nine shot variables are included for each vaccine category.
DRB1 AGE IN DAYS OF PROV-REPTD RUBELLA-ONLY SHOT #1 Y Y Y Y Y Y Y Y Y Y Y Y
DRB2 AGE IN DAYS OF PROV-REPTD RUBELLA-ONLY SHOT #2 Y Y Y Y Y Y Y Y Y Y Y Y
DRB3 AGE IN DAYS OF PROV-REPTD RUBELLA-ONLY SHOT #3 Y Y Y Y Y Y Y Y Y Y Y Y
DRB4 AGE IN DAYS OF PROV-REPTD RUBELLA-ONLY SHOT #4 Y Y Y Y Y Y Y Y Y Y Y Y
DRB5 AGE IN DAYS OF PROV-REPTD RUBELLA-ONLY SHOT #5 Y Y Y Y Y Y Y Y Y Y Y Y
DRB6 AGE IN DAYS OF PROV-REPTD RUBELLA-ONLY SHOT #6 Y Y Y Y Y Y Y Y Y Y Y Y
DRB7 AGE IN DAYS OF PROV-REPTD RUBELLA-ONLY SHOT #7 Y Y Y Y Y Y Y Y Y Y Y Y
DRB8 AGE IN DAYS OF PROV-REPTD RUBELLA-ONLY SHOT #8 Y Y Y Y Y Y Y Y Y Y Y Y
DRB9 AGE IN DAYS OF PROV-REPTD RUBELLA-ONLY SHOT #9 Y Y Y Y Y Y Y Y Y Y Y
Starting in 2005, nine shot variables are included for each vaccine category.
DROT1 AGE IN DAYS OF PROV-REPTD ROTAVIRUS-CONTAINING SHOT #1 Y Y Y Y Y Y Y Y Y Y Y Y
DROT2 AGE IN DAYS OF PROV-REPTD ROTAVIRUS-CONTAINING SHOT #2 Y Y Y Y Y Y Y Y Y Y Y Y
DROT3 AGE IN DAYS OF PROV-REPTD ROTAVIRUS-CONTAINING SHOT #3 Y Y Y Y Y Y Y Y Y Y Y Y
DROT4 AGE IN DAYS OF PROV-REPTD ROTAVIRUS-CONTAINING SHOT #4 Y Y Y Y Y Y Y Y Y Y Y Y
DROT5 AGE IN DAYS OF PROV-REPTD ROTAVIRUS-CONTAINING SHOT #5 Y Y Y Y Y Y Y Y Y Y Y Y
DROT6 AGE IN DAYS OF PROV-REPTD ROTAVIRUS-CONTAINING SHOT #6 Y Y Y Y Y Y Y Y Y Y Y Y
DROT7 AGE IN DAYS OF PROV-REPTD ROTAVIRUS-CONTAINING SHOT #7 Y Y Y Y Y Y Y Y Y Y Y Y
DROT8 AGE IN DAYS OF PROV-REPTD ROTAVIRUS-CONTAINING SHOT #8 Y Y Y Y Y Y Y Y Y Y Y Y
DROT9 AGE IN DAYS OF PROV-REPTD ROTAVIRUS-CONTAINING SHOT #9 Y Y Y Y Y Y Y Y Y Y Y
Starting in 2005, nine shot variables are included for each vaccine category.
DTP_SOUR SHOT CARD USED FOR DTP REPORTING Y Dropped starting in 2005 because this variable is redundant with variable SHOTCARD.

Data User’s Guide for the 2015 NIS Public-Use Data File APPENDIX E 134
Variable Name Variable Label† 2004 2005 2006 2007 2008 2009 2010 2011 2012 2013 2014 2015 Notes§
DTP1_AGE AGE IN MONTHS OF PROV-REPTD DT-CONTAINING SHOT #1 Y Y Y Y Y Y Y Y Y Y Y Y
DTP2_AGE AGE IN MONTHS OF PROV-REPTD DT-CONTAINING SHOT #2 Y Y Y Y Y Y Y Y Y Y Y Y
DTP3_AGE AGE IN MONTHS OF PROV-REPTD DT-CONTAINING SHOT #3 Y Y Y Y Y Y Y Y Y Y Y Y
DTP4_AGE AGE IN MONTHS OF PROV-REPTD DT-CONTAINING SHOT #4 Y Y Y Y Y Y Y Y Y Y Y Y
DTP5_AGE AGE IN MONTHS OF PROV-REPTD DT-CONTAINING SHOT #5 Y Y Y Y Y Y Y Y Y Y Y Y
DTP6_AGE AGE IN MONTHS OF PROV-REPTD DT-CONTAINING SHOT #6 Y Y Y Y Y Y Y Y Y Y Y Y
DTP7_AGE AGE IN MONTHS OF PROV-REPTD DT-CONTAINING SHOT #7 Y Y Y Y Y Y Y Y Y Y Y Y
DTP8_AGE AGE IN MONTHS OF PROV-REPTD DT-CONTAINING SHOT #8 Y Y Y Y Y Y Y Y Y Y Y Y
DTP9_AGE AGE IN MONTHS OF PROV-REPTD DT-CONTAINING SHOT #9 Y Y Y Y Y Y Y Y Y Y Y
Starting in 2005, nine shot variables are included for each vaccine category.
DVRC1 AGE IN DAYS OF PROV-REPTD VARICELLA-CONTAINING SHOT #1 Y Y Y Y Y Y Y Y Y Y Y Y
DVRC2 AGE IN DAYS OF PROV-REPTD VARICELLA-CONTAINING SHOT #2 Y Y Y Y Y Y Y Y Y Y Y Y
DVRC3 AGE IN DAYS OF PROV-REPTD VARICELLA-CONTAINING SHOT #3 Y Y Y Y Y Y Y Y Y Y Y Y
DVRC4 AGE IN DAYS OF PROV-REPTD VARICELLA-CONTAINING SHOT #4 Y Y Y Y Y Y Y Y Y Y Y Y
DVRC5 AGE IN DAYS OF PROV-REPTD VARICELLA-CONTAINING SHOT #5 Y Y Y Y Y Y Y Y Y Y Y
Starting in 2005, nine shot variables are included for each vaccine category.
DVRC6 AGE IN DAYS OF PROV-REPTD VARICELLA-CONTAINING SHOT #6 Y Y Y Y Y Y Y Y Y Y Y
Starting in 2005, nine shot variables are included for each vaccine category.
DVRC7 AGE IN DAYS OF PROV-REPTD VARICELLA-CONTAINING SHOT #7 Y Y Y Y Y Y Y Y Y Y Y
Starting in 2005, nine shot variables are included for each vaccine category.
DVRC8 AGE IN DAYS OF PROV-REPTD VARICELLA-CONTAINING SHOT #8 Y Y Y Y Y Y Y Y Y Y Y
Starting in 2005, nine shot variables are included for each vaccine category.
DVRC9 AGE IN DAYS OF PROV-REPTD VARICELLA-CONTAINING SHOT #9 Y Y Y Y Y Y Y Y Y Y Y
Starting in 2005, nine shot variables are included for each vaccine category.
EDUC1 EDUCATION OF MOTHER CATEGORIES (RECODE) Y Y Y Y Y Y Y Y Y Y Y Y

Data User’s Guide for the 2015 NIS Public-Use Data File APPENDIX E 135
Variable Name Variable Label† 2004 2005 2006 2007 2008 2009 2010 2011 2012 2013 2014 2015 Notes§
ENTRY2 CHILD LIVES IN STATE WITH HEPATITIS B STATE ENTRY LAW FOR DAY CARE/HEAD START (2001-2002 SCHOOL YEAR)
Y Dropped starting in 2005.
ESTIAP ESTIMATION IAP AREA OF RESIDENCE Y New estimation area variable starting in 2005. Replaced ITRUEIAP.
ESTIAP06 ESTIMATION IAP AREA OF RESIDENCE Y New starting 2006 because estimation areas were modified.
ESTIAP07 ESTIMATION AREA OF RESIDENCE Y New starting 2007 because estimation areas were modified.
ESTIAP08 ESTIMATION AREA OF RESIDENCE Y New starting 2008 because estimation areas were modified.
ESTIAP09 ESTIMATION AREA OF RESIDENCE Y New starting 2009 because estimation areas were modified.
ESTIAP10 ESTIMATION AREA OF RESIDENCE Y New starting 2010 because estimation areas were modified.
ESTIAP11 ESTIMATION AREA OF RESIDENCE Y New starting 2011 because estimation areas were modified.
ESTIAP12 ESTIMATION AREA OF RESIDENCE Y New starting 2012 because estimation areas were modified.
ESTIAP13 ESTIMATION AREA OF RESIDENCE Y New starting 2013 because estimation areas were modified.
ESTIAP14 ESTIMATION AREA OF RESIDENCE Y New starting 2014 because estimation areas were modified.
ESTIAP15 ESTIMATION AREA OF RESIDENCE Y New starting 2015 because estimation areas were modified.
EST_GRANT AREA OF RESIDENCE ACCORDING TO THE 56 ORIGINAL CORE GRANTEE AREAS Y Y Y Y New starting 2012.
FLU1_AGE AGE IN MONTHS OF PROV-REPTD SEASONAL FLU-CONTAINING VACCINATION #1 Y Y Y Y Y Y Y Y Y Y Y Y
FLU2_AGE AGE IN MONTHS OF PROV-REPTD SEASONAL FLU-CONTAINING VACCINATION #2 Y Y Y Y Y Y Y Y Y Y Y Y
FLU3_AGE AGE IN MONTHS OF PROV-REPTD SEASONAL FLU-CONTAINING VACCINATION #3 Y Y Y Y Y Y Y Y Y Y Y Y
FLU4_AGE AGE IN MONTHS OF PROV-REPTD SEASONAL FLU-CONTAINING VACCINATION #4 Y Y Y Y Y Y Y Y Y Y Y Y
FLU5_AGE AGE IN MONTHS OF PROV-REPTD SEASONAL FLU-CONTAINING VACCINATION #5 Y Y Y Y Y Y Y Y Y Y Y Y
FLU6_AGE AGE IN MONTHS OF PROV-REPTD SEASONAL FLU-CONTAINING VACCINATION #6 Y Y Y Y Y Y Y Y Y Y Y Y
FLU7_AGE AGE IN MONTHS OF PROV-REPTD SEASONAL FLU-CONTAINING VACCINATION #7 Y Y Y Y Y Y Y Y Y Y Y Y
FLU8_AGE AGE IN MONTHS OF PROV-REPTD SEASONAL FLU-CONTAINING VACCINATION #8 Y Y Y Y Y Y Y Y Y Y Y Y

Data User’s Guide for the 2015 NIS Public-Use Data File APPENDIX E 136
Variable Name Variable Label† 2004 2005 2006 2007 2008 2009 2010 2011 2012 2013 2014 2015 Notes§
FLU9_AGE AGE IN MONTHS OF PROV-REPTD SEASONAL FLU-CONTAINING VACCINATION #9 Y Y Y Y Y Y Y Y Y Y Y
Starting in 2005, nine shot variables are included for each vaccine category.
FRSTBRN FIRST BORN STATUS OF CHILD Y Y Y Y Y Y Y Y Y Y Y Y
FUL2_MMR HOUSEHOLD REPORT OF 1+ MMR AT ANY AGE Y Replaced by FULL_MMR starting
in 2005.
FULL_CPO HH REPORT OF 1+ VARICELLA-CONTAINING SHOT AT ANY AGE Y Y
Starting 2005, a code of 88 added for children with unknown UTD status. Dropped starting in 2006 because no longer possible to derive due to shortened Section B.
FULL_DTP HH REPORT OF 4+ DT-CONTAINING SHOT Y Y
Starting 2005, a code of 88 added for children with unknown UTD status. Dropped starting in 2006 because no longer possible to derive due to shortened Section B.
FULL_HEP HH REPORT OF 3+ HEPATITIS B-CONTAINING SHOTS Y Y
Starting 2005, a code of 88 added for children with unknown UTD status. Dropped starting in 2006 because no longer possible to derive due to shortened Section B.
FULL_HIB HH REPORT OF 3+ HIB-CONTAINING SHOTS Y Y
Starting 2005, a code of 88 added for children with unknown UTD status. Dropped starting in 2006 because no longer possible to derive due to shortened Section B.
FULL_MMR HH REPORT OF 1+ MEASLES-CONTAINING SHOT AT ANY AGE Y
Replaced FUL2_MMR starting in 2005. A code of 88 added for children with unknown UTD status. Dropped starting in 2006 because no longer possible to derive due to shortened Section B.
FULL_POL HH REPORT OF 3+ POLIO-CONTAINING SHOTS Y Y
Starting 2005, a code of 88 added for children with unknown UTD status. Dropped starting in 2006 because no longer possible to derive due to shortened Section B.
H1N1_AGE AGE IN MONTHS OF PROV-REPTD MONOVALENT 2009 H1N1 FLU VACCINATION #1
Y Y Y Introduced in 2010. Removed 2013.
H1N2_AGE AGE IN MONTHS OF PROV-REPTD MONOVALENT 2009 H1N1 FLU VACCINATION #2
Y Y Y Introduced in 2010. Removed 2013.
H1N3_AGE AGE IN MONTHS OF PROV-REPTD MONOVALENT 2009 H1N1 FLU VACCINATION #3
Y Y Y Introduced in 2010. Removed 2013.

Data User’s Guide for the 2015 NIS Public-Use Data File APPENDIX E 137
Variable Name Variable Label† 2004 2005 2006 2007 2008 2009 2010 2011 2012 2013 2014 2015 Notes§
H1N4_AGE AGE IN MONTHS OF PROV-REPTD MONOVALENT 2009 H1N1 FLU VACCINATION #4
Y Y Y Introduced in 2010. Removed 2013.
H1N5_AGE AGE IN MONTHS OF PROV-REPTD MONOVALENT 2009 H1N1 FLU VACCINATION #5
Y Y Y Introduced in 2010. Removed 2013.
H1N6_AGE AGE IN MONTHS OF PROV-REPTD MONOVALENT 2009 H1N1 FLU VACCINATION #6
Y Y Y Introduced in 2010. Removed 2013.
H1N7_AGE AGE IN MONTHS OF PROV-REPTD MONOVALENT 2009 H1N1 FLU VACCINATION #7
Y Y Y Introduced in 2010. Removed 2013.
H1N8_AGE AGE IN MONTHS OF PROV-REPTD MONOVALENT 2009 H1N1 FLU VACCINATION #8
Y Y Y Introduced in 2010. Removed 2013.
H1N9_AGE AGE IN MONTHS OF PROV-REPTD MONOVALENT 2009 H1N1 FLU VACCINATION #9
Y Y Y Introduced in 2010. Removed 2013.
HAD_CPOX CHILD EVER HAD CHICKEN POX DISEASE? Y Y Y Y Y Y Y Y Y Y Y Replaces I_HADCPX starting in 2005. This version is not imputed.
HEA1_AGE AGE IN MONTHS OF PROV-REPTD HEPATITIS A-CONTAINING SHOT #1 Y Y Y Y Y Y Y Y Y Y Y Y
HEA2_AGE AGE IN MONTHS OF PROV-REPTD HEPATITIS A-CONTAINING SHOT #2 Y Y Y Y Y Y Y Y Y Y Y Y
HEA3_AGE AGE IN MONTHS OF PROV-REPTD HEPATITIS A-CONTAINING SHOT #3 Y Y Y Y Y Y Y Y Y Y Y Y
HEA4_AGE AGE IN MONTHS OF PROV-REPTD HEPATITIS A-CONTAINING SHOT #4 Y Y Y Y Y Y Y Y Y Y Y Y
HEA5_AGE AGE IN MONTHS OF PROV-REPTD HEPATITIS A-CONTAINING SHOT #5 Y Y Y Y Y Y Y Y Y Y Y Y
HEA6_AGE AGE IN MONTHS OF PROV-REPTD HEPATITIS A-CONTAINING SHOT #6 Y Y Y Y Y Y Y Y Y Y Y Y
HEA7_AGE AGE IN MONTHS OF PROV-REPTD HEPATITIS A-CONTAINING SHOT #7 Y Y Y Y Y Y Y Y Y Y Y Y
HEA8_AGE AGE IN MONTHS OF PROV-REPTD HEPATITIS A-CONTAINING SHOT #8 Y Y Y Y Y Y Y Y Y Y Y Y
HEA9_AGE AGE IN MONTHS OF PROV-REPTD HEPATITIS A-CONTAINING SHOT #9 Y Y Y Y Y Y Y Y Y Y Y
Starting in 2005, nine shot variables are included for each vaccine category.
HEP_BRTH HEPATITIS B-CONTAINING SHOT GIVEN AT BIRTH FLAG Y Y Y Y Y Y Y Y Y Y Y Y
HEP_FLAG HEPATITIS B BIRTH SHOT DATE IMPUTATION FLAG Y Y Y Y Y Y Y Y Y Y Y Y

Data User’s Guide for the 2015 NIS Public-Use Data File APPENDIX E 138
Variable Name Variable Label† 2004 2005 2006 2007 2008 2009 2010 2011 2012 2013 2014 2015 Notes§
HEP1_AGE AGE IN MONTHS OF PROV-REPTD HEPATITIS B-CONTAINING SHOT #1 Y Y Y Y Y Y Y Y Y Y Y Y
HEP2_AGE AGE IN MONTHS OF PROV-REPTD HEPATITIS B-CONTAINING SHOT #2 Y Y Y Y Y Y Y Y Y Y Y Y
HEP3_AGE AGE IN MONTHS OF PROV-REPTD HEPATITIS B-CONTAINING SHOT #3 Y Y Y Y Y Y Y Y Y Y Y Y
HEP4_AGE AGE IN MONTHS OF PROV-REPTD HEPATITIS B-CONTAINING SHOT #4 Y Y Y Y Y Y Y Y Y Y Y Y
HEP5_AGE AGE IN MONTHS OF PROV-REPTD HEPATITIS B-CONTAINING SHOT #5 Y Y Y Y Y Y Y Y Y Y Y Y
HEP6_AGE AGE IN MONTHS OF PROV-REPTD HEPATITIS B-CONTAINING SHOT #6 Y Y Y Y Y Y Y Y Y Y Y Y
HEP7_AGE AGE IN MONTHS OF PROV-REPTD HEPATITIS B-CONTAINING SHOT #7 Y Y Y Y Y Y Y Y Y Y Y Y
HEP8_AGE AGE IN MONTHS OF PROV-REPTD HEPATITIS B-CONTAINING SHOT #8 Y Y Y Y Y Y Y Y Y Y Y Y
HEP9_AGE AGE IN MONTHS OF PROV-REPTD HEPATITIS B-CONTAINING SHOT #9 Y Y Y Y Y Y Y Y Y Y Y
Starting in 2005, nine shot variables are included for each vaccine category.
HH_DTP HH REPORT OF NUMBER OF DT-CONTAINING SHOTS RECEIVED Y Y Y Y Y Y
Added in 2006 as a partial replacement for the "FULL" and "C_" variables. Dropped in 2012 due to questionnaire changes.
HH_FLU HH REPORT OF NUMBER OF SEASONAL FLU VACCINATIONS RECEIVED IN THE 12 MONTHS PRIOR TO INTERVIEW
Y Y Y
FLU questions added to the HH questionnaire starting in 2007. Dropped in 2009 due to mid-year questionnaire changes. Reinstated in 2010. Dropped again in 2011 due to mid-year questionnaire changes.
HH_H1N HH REPORT OF NUMBER OF MONOVALENT 2009 H1N1 FLU VACCINATIONS RECEIVED IN THE 12 MONTHS PRIOR TO INTERVIEW
Y
H1N1 flu questions added to the HH questionnaire starting in 2009. Introduced in the PUF in 2010. Dropped in 2011 due to mid-year questionnaire changes.
HH_HEPB HH REPORT OF NUMBER OF HEPATITIS B-CONTAINING SHOTS RECEIVED Y Y Y Y Y Y
Added in 2006 as a partial replacement for the "FULL" and "C_" variables. Dropped in 2012 due to questionnaire changes.
HH_HIB HH REPORT OF NUMBER OF HIB-CONTAINING SHOTS RECEIVED Y Y Y Y Y Y
Added in 2006 as a partial replacement for the "FULL" and "C_" variables. Dropped in 2012 due to questionnaire changes.

Data User’s Guide for the 2015 NIS Public-Use Data File APPENDIX E 139
Variable Name Variable Label† 2004 2005 2006 2007 2008 2009 2010 2011 2012 2013 2014 2015 Notes§
HH_MCV HH REPORT OF NUMBER OF MEASLES-CONTAINING SHOTS RECEIVED Y Y Y Y Y Y
Added in 2006 as a partial replacement for the "FULL" and "C_" variables. Dropped in 2012 due to questionnaire changes.
HH_POL HH REPORT OF NUMBER OF POLIO-CONTAINING SHOTS RECEIVED Y Y Y Y Y Y
Added in 2006 as a partial replacement for the "FULL" and "C_" variables. Dropped in 2012 due to questionnaire changes.
HH_VRC HH REPORT OF NUMBER OF VARICELLA-CONTAINING SHOTS RECEIVED Y Y Y Y Y Y
Added in 2006 as a partial replacement for the "FULL" and "C_" variables. Dropped in 2012 due to questionnaire changes.
HIB1_AGE AGE IN MONTHS OF PROV-REPTD HIB-CONTAINING SHOT #1 Y Y Y Y Y Y Y Y Y Y Y Y
HIB2_AGE AGE IN MONTHS OF PROV-REPTD HIB-CONTAINING SHOT #2 Y Y Y Y Y Y Y Y Y Y Y Y
HIB3_AGE AGE IN MONTHS OF PROV-REPTD HIB-CONTAINING SHOT #3 Y Y Y Y Y Y Y Y Y Y Y Y
HIB4_AGE AGE IN MONTHS OF PROV-REPTD HIB-CONTAINING SHOT #4 Y Y Y Y Y Y Y Y Y Y Y Y
HIB5_AGE AGE IN MONTHS OF PROV-REPTD HIB-CONTAINING SHOT #5 Y Y Y Y Y Y Y Y Y Y Y Y
HIB6_AGE AGE IN MONTHS OF PROV-REPTD HIB-CONTAINING SHOT #6 Y Y Y Y Y Y Y Y Y Y Y Y
HIB7_AGE AGE IN MONTHS OF PROV-REPTD HIB-CONTAINING SHOT #7 Y Y Y Y Y Y Y Y Y Y Y Y
HIB8_AGE AGE IN MONTHS OF PROV-REPTD HIB-CONTAINING SHOT #8 Y Y Y Y Y Y Y Y Y Y Y Y
HIB9_AGE AGE IN MONTHS OF PROV-REPTD HIB-CONTAINING SHOT #9 Y Y Y Y Y Y Y Y Y Y Y
Starting in 2005, nine shot variables are included for each vaccine category.
HUTD4313 HOUSEHOLD REPORT OF 4:3:1:3 UTD (UP-TO-DATE) Y
Dropped starting in 2005 because this variable is redundant with variable ALL4SHOT.
I_HADCPX DID CHILD EVER HAVE CHICKEN POX? Y Replaced by HAD_CPOX starting in 2005.
I_HISP_K HISPANIC ORIGIN OF CHILD Y Y Y Y Y Y Y Y Y Y Y Y
IAGECPXR AGE IN MONTHS WHEN CHILD HAD CHICKEN POX (RECODE) Y Replaced by AGECPOXR starting
in 2005.
INCPORAR INCOME TO POVERTY RATIO (RECODE) Y Y Y Y Y Y Y Y Y Y Y
Replaces INCPORAT starting 2005. INCPORAT used categories whereas INCPORAR is continuous. INCPORAR has been top- and bottom-coded.

Data User’s Guide for the 2015 NIS Public-Use Data File APPENDIX E 140
Variable Name Variable Label† 2004 2005 2006 2007 2008 2009 2010 2011 2012 2013 2014 2015 Notes§
INCPORAT INCOME TO POVERTY RATIO Y Replaced by INCPORAR starting in 2005.
INCPOV1 POVERTY STATUS Y Y Y Y Y Y Y Y Y Y Y
Replaces INCPOV1R starting in 2005. INCPOV1R used two categories whereas INCPOV1 uses three.
INCPOV1R POVERTY STATUS (RECODE) Y Replaced by INCPOV1 starting in 2005.
INCQ298A FAMILY INCOME CATEGORIES (RECODE) Y Y Y Y Y Y Y Y Y Y Y
Replaces INCQ298R starting in 2005. INCQ298A uses different categories than were used by INCQ298R.
INCQ298R FAMILY INCOME CATEGORIES (RECODE) Y Replaced by INCQ298A starting in 2005.
INOPHONR LENGTH OF INTERRUPTION IN TELEPHONE SERVICE IN DAYS (RECODE) Y Y Y Y Y Y Removed in 2010 due to
questionnaire change.
INS_1 IS CHILD COVERED BY HEALTH INSURANCE PROVIDED THROUGH EMPLOYER OR UNION? Y Y Y Y Y Y Y Y Y
INS_11 ANY TIME WHEN CHILD WAS NOT COVERED BY ANY HEALTH INSURANCE? Y Y Y Y Y Y Y Y Y
INS_2 IS CHILD COVERED BY ANY MEDICAID PLAN? Y Y Y Y Y Y Y Y Y
INS_3 IS CHILD COVERED BY S-CHIP? Y Y Y Y Y Y Y Y Y
INS_3A IS CHILD COVERED BY ANY MEDICAID PLAN OR S-CHIP? Y Y Y Y Y Y Y Y Y
INS_4 IS CHILD COVERED BY INDIAN HEALTH SERVICE? Y Y Replaced by INS_4_5 starting
2009.
INS_4_5 IS CHILD COVERED BY INDIAN HEALTH SERVICE, MILITARY HEALTH CARE, TRICARE, CHAMPUS, OR CHAMP-VA?
Y Y Y Y Y Y Y Replaces INS_4 and INS_5 starting 2009.
INS_5 IS CHILD COVERED BY MILITARY HEALTH CARE, TRICARE, CHAMPUS, OR CHAMP-VA? Y Y Replaced by INS_4_5 starting
2009.
INS_6 IS CHILD COVERED BY ANY OTHER HEALTH INSURANCE OR HEALTH CARE PLAN? Y Y Y Y Y Y Y Y Y
INTRP PHONE INTERRUPTION OF 7 DAYS OR MORE IN PAST YEAR? Y Y Y Y Y Y Y Y Y Y Y Y
ITRUEIAP IAP AREA OF CURRENT RESIDENCE Y The new estimation area variable starting in 2005 is ESTIAP.
LANGUAGE LANGUAGE IN WHICH INTERVIEW WAS CONDUCTED Y Y Y Y Y Y Y Y Y Y Y Y
M_AGEGRP AGE OF MOTHER CATEGORIES (RECODE) Y Y Y Y Y Y Y Y Y Y Y Y
MARITAL MARITAL STATUS OF MOTHER CATEGORIES (RECODE) Y Y Y Y Y Replaced by MARITAL2 starting
2009. MARITAL2 MARITAL STATUS OF MOTHER (RECODE) Y Y Y Y Y Y Y Replaces MARITAL starting 2009.

Data User’s Guide for the 2015 NIS Public-Use Data File APPENDIX E 141
Variable Name Variable Label† 2004 2005 2006 2007 2008 2009 2010 2011 2012 2013 2014 2015 Notes§
MMR1_AGE AGE IN MONTHS OF PROV-REPTD MEASLES-CONTAINING SHOT #1 Y Y Y Y Y Y Y Y Y Y Y Y
MMR2_AGE AGE IN MONTHS OF PROV-REPTD MEASLES-CONTAINING SHOT #2 Y Y Y Y Y Y Y Y Y Y Y Y
MMR3_AGE AGE IN MONTHS OF PROV-REPTD MEASLES-CONTAINING SHOT #3 Y Y Y Y Y Y Y Y Y Y Y Y
MMR4_AGE AGE IN MONTHS OF PROV-REPTD MEASLES-CONTAINING SHOT #4 Y Y Y Y Y Y Y Y Y Y Y Y
MMR5_AGE AGE IN MONTHS OF PROV-REPTD MEASLES-CONTAINING SHOT #5 Y Y Y Y Y Y Y Y Y Y Y
Starting in 2005, nine shot variables are included for each vaccine category.
MMR6_AGE AGE IN MONTHS OF PROV-REPTD MEASLES-CONTAINING SHOT #6 Y Y Y Y Y Y Y Y Y Y Y
Starting in 2005, nine shot variables are included for each vaccine category.
MMR7_AGE AGE IN MONTHS OF PROV-REPTD MEASLES-CONTAINING SHOT #7 Y Y Y Y Y Y Y Y Y Y Y
Starting in 2005, nine shot variables are included for each vaccine category.
MMR8_AGE AGE IN MONTHS OF PROV-REPTD MEASLES-CONTAINING SHOT #8 Y Y Y Y Y Y Y Y Y Y Y
Starting in 2005, nine shot variables are included for each vaccine category.
MMR9_AGE AGE IN MONTHS OF PROV-REPTD MEASLES-CONTAINING SHOT #9 Y Y Y Y Y Y Y Y Y Y Y
Starting in 2005, nine shot variables are included for each vaccine category.
MOBIL GEOGRAPHIC MOBILITY STATUS: STATE OF RESIDENCE OF CHILD AT BIRTH VERSUS CURRENT STATE
Y Replaced by MOBIL_I starting in 2005.
MOBIL_I GEOGRAPHIC MOBILITY STATUS: STATE OF RESIDENCE OF CHILD AT BIRTH VERSUS CURRENT STATE
Y Y Y Y Y Y Y Y Y Y Y Replaces MOBIL starting in 2005. This version is imputed.
MP1_AGE AGE IN MONTHS OF PROV-REPTD MUMPS-ONLY SHOT #1 Y Y Y Y Y Y Y Y Y Y Y Y
MP2_AGE AGE IN MONTHS OF PROV-REPTD MUMPS-ONLY SHOT #2 Y Y Y Y Y Y Y Y Y Y Y Y
MP3_AGE AGE IN MONTHS OF PROV-REPTD MUMPS-ONLY SHOT #3 Y Y Y Y Y Y Y Y Y Y Y Y
MP4_AGE AGE IN MONTHS OF PROV-REPTD MUMPS-ONLY SHOT #4 Y Y Y Y Y Y Y Y Y Y Y Y
MP5_AGE AGE IN MONTHS OF PROV-REPTD MUMPS-ONLY SHOT #5 Y Y Y Y Y Y Y Y Y Y Y
Starting in 2005, nine shot variables are included for each vaccine category.
MP6_AGE AGE IN MONTHS OF PROV-REPTD MUMPS-ONLY SHOT #6 Y Y Y Y Y Y Y Y Y Y Y
Starting in 2005, nine shot variables are included for each vaccine category.

Data User’s Guide for the 2015 NIS Public-Use Data File APPENDIX E 142
Variable Name Variable Label† 2004 2005 2006 2007 2008 2009 2010 2011 2012 2013 2014 2015 Notes§
MP7_AGE AGE IN MONTHS OF PROV-REPTD MUMPS-ONLY SHOT #7 Y Y Y Y Y Y Y Y Y Y Y
Starting in 2005, nine shot variables are included for each vaccine category.
MP8_AGE AGE IN MONTHS OF PROV-REPTD MUMPS-ONLY SHOT #8 Y Y Y Y Y Y Y Y Y Y Y
Starting in 2005, nine shot variables are included for each vaccine category.
MP9_AGE AGE IN MONTHS OF PROV-REPTD MUMPS-ONLY SHOT #9 Y Y Y Y Y Y Y Y Y Y Y
Starting in 2005, nine shot variables are included for each vaccine category.
MPR1_AGE AGE IN MONTHS OF PROV-REPTD (MUMPS/RUBELLA)-ONLY SHOT #1 Y Y Y Y Y Y Y Y Y Y Y Y
MPR2_AGE AGE IN MONTHS OF PROV-REPTD (MUMPS/RUBELLA)-ONLY SHOT #2 Y Y Y Y Y Y Y Y Y Y Y Y
MPR3_AGE AGE IN MONTHS OF PROV-REPTD (MUMPS/RUBELLA)-ONLY SHOT #3 Y Y Y Y Y Y Y Y Y Y Y Y
MPR4_AGE AGE IN MONTHS OF PROV-REPTD (MUMPS/RUBELLA)-ONLY SHOT #4 Y Y Y Y Y Y Y Y Y Y Y Y
MPR5_AGE AGE IN MONTHS OF PROV-REPTD (MUMPS/RUBELLA)-ONLY SHOT #5 Y Y Y Y Y Y Y Y Y Y Y
Starting in 2005, nine shot variables are included for each vaccine category.
MPR6_AGE AGE IN MONTHS OF PROV-REPTD (MUMPS/RUBELLA)-ONLY SHOT #6 Y Y Y Y Y Y Y Y Y Y Y
Starting in 2005, nine shot variables are included for each vaccine category.
MPR7_AGE AGE IN MONTHS OF PROV-REPTD (MUMPS/RUBELLA)-ONLY SHOT #7 Y Y Y Y Y Y Y Y Y Y Y
Starting in 2005, nine shot variables are included for each vaccine category.
MPR8_AGE AGE IN MONTHS OF PROV-REPTD (MUMPS/RUBELLA)-ONLY SHOT #8 Y Y Y Y Y Y Y Y Y Y Y
Starting in 2005, nine shot variables are included for each vaccine category.
MPR9_AGE AGE IN MONTHS OF PROV-REPTD (MUMPS/RUBELLA)-ONLY SHOT #9 Y Y Y Y Y Y Y Y Y Y Y
Starting in 2005, nine shot variables are included for each vaccine category.
N_PRVR NUMBER OF PROVIDERS RESPONDING WITH VACCINATION DATA FOR CHILD (RECODE) Y Y Y Y Y Y Y Y Y Y Y Y
NUM_CELLS _PARENTS
NUMBER OF WORKING CELL PHONES USUALLY USED BY PARENTS OR GUARDIANS Y Y Y Y Y Y Y
NUM_CELLS_HH NUMBER OF WORKING CELL PHONES HOUSEHOLD MEMBERS HAVE AVAILABLE FOR PERSONAL USE
Y Y Y Y Y Y Y
NUM_PHONE NUMBER OF RESIDENTIAL TELEPHONE NUMBERS IN HOUSEHOLD (EXCLUDING CELL PHONES)
Y Y Y Y Y Y Y

Data User’s Guide for the 2015 NIS Public-Use Data File APPENDIX E 143
Variable Name Variable Label† 2004 2005 2006 2007 2008 2009 2010 2011 2012 2013 2014 2015 Notes§
P_NUHEPX
NUMBER OF HEPATITIS B-ONLY SHOTS BY 36 MONTHS OF AGE DETERMINED FROM PROVIDER INFO, EXCLUDING ANY VACCINATIONS AFTER THE HH INTERVIEW DATE.
Y Y Y Y Y Y Y Y Y Y Y Y
P_NUHIBX
NUMBER OF HIB-ONLY SHOTS BY 36 MONTHS OF AGE DETERMINED FROM PROVIDER INFO, EXCLUDING ANY VACCINATIONS AFTER THE HH INTERVIEW DATE.
Y Y Y Y Y Y Y Y Y Y
P_NUHPHB
NUMBER OF HEPATITIS B/HIB COMBO SHOTS BY 36 MONTHS OF AGE DETERMINED FROM PROVIDER INFO, EXCLUDING ANY VACCINATIONS AFTER THE HH INTERVIEW DATE.
Y Y Y Y Y Y Y Y Y Y Y Y
P_NUM1L
NUMBER OF MONOVALENT 2009 H1N1 FLU VACCINATIONS OF UNKNOWN TYPE BY 36 MONTHS OF AGE DETERMINED FROM PROVIDER INFO, EXCLUDING ANY VACCINATIONS AFTER THE HH INTERVIEW DATE.
Y Y Y Introduced in 2010. Removed 2013.
P_NUM1M
NUMBER OF MONOVALENT 2009 H1N1 FLU SPRAY VACCINATIONS BY 36 MONTHS OF AGE DETERMINED FROM PROVIDER INFO, EXCLUDING ANY VACCINATIONS AFTER THE HH INTERVIEW DATE.
Y Y Y Introduced in 2010. Removed 2013.
P_NUM1N
NUMBER OF INJECTED MONOVALENT 2009 H1N1 FLU VACCINATIONS BY 36 MONTHS OF AGE DETERMINED FROM PROVIDER INFO, EXCLUDING ANY VACCINATIONS AFTER THE HH INTERVIEW DATE.
Y Y Y Introduced in 2010. Removed 2013.
P_NUMDAH
NUMBER OF DTAP/HIB COMBO SHOTS BY 36 MONTHS OF AGE DETERMINED FROM PROVIDER INFO, EXCLUDING ANY VACCINATIONS AFTER THE HH INTERVIEW DATE.
Y Y Y Y Y Y Y Y Y Y Y Y
P_NUMDHB
NUMBER OF DTP/HIB CONTAINING SHOTS DETERMINED FROM PROVIDER INFO, EXCLUDING ANY VACCINATIONS AFTER THE HH INTERVIEW DATE.
Y Y Y Y Y Dropped in 2009 due to change to IHQ shotgrid.
P_NUMDHI
NUMBER OF DTAP/HEPB/IPV COMBO SHOTS BY 36 MONTHS OF AGE DETERMINED FROM PROVIDER INFO, EXCLUDING ANY VACCINATIONS AFTER THE HH INTERVIEW DATE.
Y Y Y Y Y Y Y Y Y Y
P_NUMDHM
NUMBER OF DTP/HIB COMBO SHOTS DETERMINED FROM PROVIDER INFO, EXCLUDING ANY VACCINATIONS AFTER THE HH INTERVIEW DATE.
Y Y Y Y Y Dropped in 2009 due to change to IHQ shotgrid.

Data User’s Guide for the 2015 NIS Public-Use Data File APPENDIX E 144
Variable Name Variable Label† 2004 2005 2006 2007 2008 2009 2010 2011 2012 2013 2014 2015 Notes§
P_NUMDIH
NUMBER OF DTAP/IPV/HIB COMBO SHOTS BY 36 MONTHS OF AGE DETERMINED FROM PROVIDER INFO, EXCLUDING ANY VACCINATIONS AFTER THE HOUSEHOLD INTERVIEW DATE.
Y Y Y Y Y Y Y Added in 2009 due to change to IHQ shotgrid.
P_NUMDTA
NUMBER OF DTAP-ONLY SHOTS BY 36 MONTHS OF AGE DETERMINED FROM PROVIDER INFO, EXCLUDING ANY VACCINATIONS AFTER THE HH INTERVIEW DATE.
Y Y Y Y Y Y Y Y Y Y Y Y
P_NUMDTM
NUMBER OF DT-ONLY SHOTS DETERMINED FROM PROVIDER INFO, EXCLUDING ANY VACCINATIONS AFTER THE HH INTERVIEW DATE.
Y Y Y Y Y Dropped in 2009 due to change to IHQ shotgrid.
P_NUMDTP
NUMBER OF DT-CONTAINING SHOTS BY 36 MONTHS OF AGE DETERMINED FROM PROVIDER INFO, EXCLUDING ANY VACCINATIONS AFTER THE HH INTERVIEW DATE.
Y Y Y Y Y Y Y Y Y Y Y Y
P_NUMFLU
NUMBER OF SEASONAL FLU-CONTAINING VACCINATIONS BY 36 MONTHS OF AGE DETERMINED FROM PROVIDER INFO, EXCLUDING ANY VACCINATIONS AFTER THE HH INTERVIEW DATE.
Y Y Y Y Y Y Y Y Y Y Y Y
P_NUMFLUL
NUMBER OF SEASONAL FLU-CONTAINING VACCINATIONS OF UNKNOWN TYPE BY 36 MONTHS OF AGE DETERMINED FROM PROVIDER INFO, EXCLUDING ANY VACCINATIONS AFTER THE HH INTERVIEW DATE.
Y Y Y Y Y Y Y Y Starting in 2008, influenza type boxes were added to the IHQ shot grid.
P_NUMFLUM
NUMBER OF SEASONAL FLU SPRAY VACCINATIONS BY 36 MONTHS OF AGE DETERMINED FROM PROVIDER INFO, EXCLUDING ANY VACCINATIONS AFTER THE HH INTERVIEW DATE.
Y Y Y Y Y Y Y Y Starting in 2008, influenza type boxes were added to the IHQ shot grid.
P_NUMFLUN
NUMBER OF INJECTED SEASONAL FLU VACCINATIONS BY 36 MONTHS OF AGE DETERMINED FROM PROVIDER INFO, EXCLUDING ANY VACCINATIONS AFTER THE HH INTERVIEW DATE.
Y Y Y Y Y Y Y Y Starting in 2008, influenza type boxes were added to the IHQ shot grid.
P_NUMH1N
NUMBER OF MONOVALENT 2009 H1N1 FLU VACCINATIONS BY 36 MONTHS OF AGE DETERMINED FROM PROVIDER INFO, EXCLUDING ANY VACCINATIONS AFTER THE HH INTERVIEW DATE.
Y Y Y Introduced in 2010. Removed 2013.

Data User’s Guide for the 2015 NIS Public-Use Data File APPENDIX E 145
Variable Name Variable Label† 2004 2005 2006 2007 2008 2009 2010 2011 2012 2013 2014 2015 Notes§
P_NUMH2
NUMBER OF HIB-SANOFI or HIB-GLAXOSMITHKLINE SHOTS BY 36 MONTHS OF AGE DETERMINED FROM PROVIDER INFO, EXCLUDING ANY VACCINATIONS AFTER THE HOUSEHOLD INTERVIEW DATE.
Y Added in 2009 due to change to IHQ shotgrid. Replaced in 2010 by P_NUMHG and P_NUMHS.
P_NUMHEA
NUMBER OF HEPATITIS A-CONTAINING SHOTS BY 36 MONTHS OF AGE DETERMINED FROM PROVIDER INFO, EXCLUDING ANY VACCINATIONS AFTER THE HH INTERVIEW DATE.
Y Y Y Y Y Y Y Y Y Y Y Y
P_NUMHEN
NUMBER OF HEPATITIS B-CONTAINING SHOTS OF UNKNOWN TYPE BY 36 MONTHS OF AGE DETERMINED FROM PROVIDER INFO, EXCLUDING ANY VACCINATIONS AFTER THE HH INTERVIEW DATE.
Y Y Y Y Y Y Y Y Y Y
P_NUMHEP
NUMBER OF HEPATITIS B-CONTAINING SHOTS BY 36 MONTHS OF AGE DETERMINED FROM PROVIDER INFO, EXCLUDING ANY VACCINATIONS AFTER THE HH INTERVIEW DATE.
Y Y Y Y Y Y Y Y Y Y Y Y
P_NUMHG
NUMBER OF HIB-GLAXOSMITHKLINE SHOTS BY 36 MONTHS OF AGE DETERMINED FROM PROVIDER INFO, EXCLUDING ANY VACCINATIONS AFTER THE HOUSEHOLD INTERVIEW DATE.
Y Y Y Y Y Y Introduced in 2010.
P_NUMHHY
NUMBER OF HIB-MENCY SHOTS BY 36 MONTHS OF AGE DETERMINED FROM PROVIDER INFO, EXCLUDING ANY VACCINATIONS AFTER THE HOUSEHOLD INTERVIEW DATE.
Y Y Added in 2014 due to change in IHQ shotgrid.
P_NUMHIB
NUMBER OF HIB-CONTAINING SHOTS BY 36 MONTHS OF AGE DETERMINED FROM PROVIDER INFO, EXCLUDING ANY VACCINATIONS AFTER THE HH INTERVIEW DATE.
Y Y Y Y Y Y Y Y Y Y Y Y
P_NUMHIN
NUMBER OF HIB-CONTAINING SHOTS OF UNKNOWN TYPE BY 36 MONTHS OF AGE DETERMINED FROM PROVIDER INFO, EXCLUDING ANY VACCINATIONS AFTER THE HH INTERVIEW DATE.
Y Y Y Y Y Y Y Y Y Y
P_NUMHION
NUMBER OF HIB-ONLY SHOTS OF UNKNOWN TYPE BY 36 MONTHS OF AGE DETERMINED FROM PROVIDER INFO, EXCLUDING ANY VACCINATIONS AFTER THE HOUSEHOLD INTERVIEW DATE.
Y Y Y Y Y Y Y Added in 2009 due to change to IHQ shotgrid.

Data User’s Guide for the 2015 NIS Public-Use Data File APPENDIX E 146
Variable Name Variable Label† 2004 2005 2006 2007 2008 2009 2010 2011 2012 2013 2014 2015 Notes§
P_NUMHM
NUMBER OF HIB-MERCK SHOTS BY 36 MONTHS OF AGE DETERMINED FROM PROVIDER INFO, EXCLUDING ANY VACCINATIONS AFTER THE HOUSEHOLD INTERVIEW DATE.
Y Y Y Y Y Y Y Added in 2009 due to change to IHQ shotgrid.
P_NUMHS
NUMBER OF HIB-SANOFI SHOTS BY 36 MONTHS OF AGE DETERMINED FROM PROVIDER INFO, EXCLUDING ANY VACCINATIONS AFTER THE HOUSEHOLD INTERVIEW DATE.
Y Y Y Y Y Y Introduced in 2010.
P_NUMIPV
NUMBER OF IPV-ONLY SHOTS BY 36 MONTHS OF AGE DETERMINED FROM PROVIDER INFO, EXCLUDING ANY VACCINATIONS AFTER THE HH INTERVIEW DATE.
Y Y Y Y Y Y Y Y Y Y Y Y
P_NUMMCN
NUMBER OF MEASLES-CONTAINING SHOTS OF UNKNOWN TYPE BY 36 MONTHS OF AGE DETERMINED FROM PROVIDER INFO, EXCLUDING ANY VACCINATIONS AFTER THE HH INTERVIEW DATE.
Y Y Y Y Y Y Y Y Y Y
P_NUMMMR
NUMBER OF MEASLES-CONTAINING SHOTS BY 36 MONTHS OF AGE DETERMINED FROM PROVIDER INFO, EXCLUDING ANY VACCINATIONS AFTER THE HH INTERVIEW DATE.
Y Y Y Y Y Y Y Y Y Y Y Y
P_NUMMMRX
NUMBER OF MMR-ONLY SHOTS BY 36 MONTHS OF AGE DETERMINED FROM PROVIDER INFO, EXCLUDING ANY VACCINATIONS AFTER THE HH INTERVIEW DATE.
Y Y Y Y Y Y Y Y Y Y
P_NUMMMX
NUMBER OF MMR-CONTAINING SHOTS BY 36 MONTHS OF AGE DETERMINED FROM PROVIDER INFO, EXCLUDING ANY VACCINATIONS AFTER THE HH INTERVIEW DATE.
Y Y Y Y Y Y Y Y Y Y Y Y
P_NUMMP
NUMBER OF MUMPS-ONLY SHOTS BY 36 MONTHS OF AGE DETERMINED FROM PROVIDER INFO, EXCLUDING ANY VACCINATIONS AFTER THE HH INTERVIEW DATE.
Y Y Y Y Y Y Y Y Y Y Y Y
P_NUMMPR
NUMBER OF (MUMPS/RUBELLA)-ONLY SHOTS BY 36 MONTHS OF AGE DETERMINED FROM PROVIDER INFO, EXCLUDING ANY VACCINATIONS AFTER THE HH INTERVIEW DATE.
Y Y Y Y Y Y Y Y Y Y Y Y

Data User’s Guide for the 2015 NIS Public-Use Data File APPENDIX E 147
Variable Name Variable Label† 2004 2005 2006 2007 2008 2009 2010 2011 2012 2013 2014 2015 Notes§
P_NUMMRV
NUMBER OF MMR/VARICELLA COMBO SHOTS BY 36 MONTHS OF AGE DETERMINED FROM PROVIDER INFO, EXCLUDING ANY VACCINATIONS AFTER THE HH INTERVIEW DATE.
Y Y Y Y Y Y Y Y Y Y
P_NUMMS
NUMBER OF MEASLES-ONLY SHOTS BY 36 MONTHS OF AGE DETERMINED FROM PROVIDER INFO, EXCLUDING ANY VACCINATIONS AFTER THE HH INTERVIEW DATE.
Y Y Y Y Y Y Y Y Y Y Y Y
P_NUMMSM
NUMBER OF MEASLES/MUMPS COMBO SHOTS BY 36 MONTHS OF AGE DETERMINED FROM PROVIDER INFO, EXCLUDING ANY VACCINATIONS AFTER THE HH INTERVIEW DATE.
Y Y Y Y Y Y Y Y Y Y Y Y
P_NUMMSR
NUMBER OF MEASLES/RUBELLA COMBO SHOTS BY 36 MONTHS OF AGE DETERMINED FROM PROVIDER INFO, EXCLUDING ANY VACCINATIONS AFTER THE HH INTERVIEW DATE.
Y Y Y Y Y Y Y Y Y Y Y Y
P_NUMOLN
NUMBER OF POLIO SHOTS OF UNKNOWN TYPE BY 36 MONTHS OF AGE DETERMINED FROM PROVIDER INFO, EXCLUDING ANY VACCINATIONS AFTER THE HH INTERVIEW DATE.
Y Y Y Y Y Y Y Y Y Y Y Y
P_NUMOPV
NUMBER OF OPV-ONLY SHOTS BY 36 MONTHS OF AGE DETERMINED FROM PROVIDER INFO, EXCLUDING ANY VACCINATIONS AFTER THE HH INTERVIEW DATE.
Y Y Y Y Y Y Y Y Y Y Y Y
P_NUMPCC
NUMBER OF PCV CONJUGATE SHOTS BY 36 MONTHS OF AGE DETERMINED FROM PROVIDER INFO, EXCLUDING ANY VACCINATIONS AFTER THE HH INTERVIEW DATE.
Y Y Y Y Y Y Y Y Y Y Y Y
P_NUMPCC13
NUMBER OF PNEUMOCOCCAL CONJUGATE-13 SHOTS BY 36 MONTHS OF AGE DETERMINED FROM PROVIDER INFO, EXCLUDING ANY VACCINATIONS AFTER THE HOUSEHOLD INTERVIEW DATE.
Y Y Y Y Y Y Introduced in 2010.
P_NUMPCC7
NUMBER OF PNEUMOCOCCAL CONJUGATE-7 SHOTS BY 36 MONTHS OF AGE DETERMINED FROM PROVIDER INFO, EXCLUDING ANY VACCINATIONS AFTER THE HOUSEHOLD INTERVIEW DATE.
Y Y Y Y Y Y Introduced in 2010.

Data User’s Guide for the 2015 NIS Public-Use Data File APPENDIX E 148
Variable Name Variable Label† 2004 2005 2006 2007 2008 2009 2010 2011 2012 2013 2014 2015 Notes§
P_NUMPCCN
NUMBER OF PNEUMOCOCCAL CONJUGATE SHOTS OF UNKNOWN TYPE BY 36 MONTHS OF AGE DETERMINED FROM PROVIDER INFO, EXCLUDING ANY VACCINATIONS AFTER THE HOUSEHOLD INTERVIEW DATE.
Y Y Y Y Y Y Introduced in 2010.
P_NUMPCN
NUMBER OF PCV SHOTS OF UNKNOWN TYPE BY 36 MONTHS OF AGE DETERMINED FROM PROVIDER INFO, EXCLUDING ANY VACCINATIONS AFTER THE HH INTERVIEW DATE.
Y Y Y Y Y Y Y Y Y Y Y Y
P_NUMPCP
NUMBER OF PCV POLYSACCHARIDE SHOTS BY 36 MONTHS OF AGE DETERMINED FROM PROVIDER INFO, EXCLUDING ANY VACCINATIONS AFTER THE HH INTERVIEW DATE.
Y Y Y Y Y Y Y Y Y Y Y Y
P_NUMPCV
NUMBER OF PNEUMOCOCCAL-CONTAINING SHOTS BY 36 MONTHS OF AGE DETERMINED FROM PROVIDER INFO, EXCLUDING ANY VACCINATIONS AFTER THE HH INTERVIEW DATE.
Y Y Y Y Y Y Y Y Y Y Y Y
P_NUMPOL
NUMBER OF POLIO-CONTAINING SHOTS BY 36 MONTHS OF AGE DETERMINED FROM PROVIDER INFO, EXCLUDING ANY VACCINATIONS AFTER THE HH INTERVIEW DATE.
Y Y Y Y Y Y Y Y Y Y Y Y
P_NUMRB
NUMBER OF RUBELLA-ONLY SHOTS BY 36 MONTHS OF AGE DETERMINED FROM PROVIDER INFO, EXCLUDING ANY VACCINATIONS AFTER THE HH INTERVIEW DATE.
Y Y Y Y Y Y Y Y Y Y Y Y
P_NUMRG
NUMBER OF ROTARIX-GSK SHOTS BY 36 MONTHS OF AGE DETERMINED FROM PROVIDER INFO, EXCLUDING ANY VACCINATIONS AFTER THE HOUSEHOLD INTERVIEW DATE.
Y Y Y Y Y Y Y Starting in 2009, rotavirus type boxes were added to the IHQ shot grid.
P_NUMRM
NUMBER OF ROTATEQ-MERCK SHOTS BY 36 MONTHS OF AGE DETERMINED FROM PROVIDER INFO, EXCLUDING ANY VACCINATIONS AFTER THE HOUSEHOLD INTERVIEW DATE.
Y Y Y Y Y Y Y Starting in 2009, rotavirus type boxes were added to the IHQ shot grid.
P_NUMRO
NUMBER OF ROTAVIRUS SHOTS OF UNKNOWN TYPE BY 36 MONTHS OF AGE DETERMINED FROM PROVIDER INFO, EXCLUDING ANY VACCINATIONS AFTER THE HOUSEHOLD INTERVIEW DATE.
Y Y Y Y Y Y Y Starting in 2009, rotavirus type boxes were added to the IHQ shot grid.

Data User’s Guide for the 2015 NIS Public-Use Data File APPENDIX E 149
Variable Name Variable Label† 2004 2005 2006 2007 2008 2009 2010 2011 2012 2013 2014 2015 Notes§
P_NUMROT
NUMBER OF ROTAVIRUS-CONTAINING SHOTS BY 36 MONTHS OF AGE DETERMINED FROM PROVIDER INFO, EXCLUDING ANY VACCINATIONS AFTER THE HH INTERVIEW DATE.
Y Y Y Y Y Y Y Y Y Y Y Y
P_NUMTPM
NUMBER OF DTP-ONLY SHOTS DETERMINED FROM PROVIDER INFO, EXCLUDING ANY VACCINATIONS AFTER THE HH INTERVIEW DATE.
Y Y Y Y Y Dropped in 2009 due to change to IHQ shotgrid.
P_NUMTPN
NUMBER OF DT-CONTAINING SHOTS OF UNKNOWN TYPE BY 36 MONTHS OF AGE DETERMINED FROM PROVIDER INFO, EXCLUDING ANY VACCINATIONS AFTER THE HH INTERVIEW DATE.
Y Y Y Y Y Y Y Y Y Y Y Y
P_NUMVRC
NUMBER OF VARICELLA-CONTAINING SHOTS BY 36 MONTHS OF AGE DETERMINED FROM PROVIDER INFO, EXCLUDING ANY VACCINATIONS AFTER THE HH INTERVIEW DATE.
Y Y Y Y Y Y Y Y Y Y Y Y
P_NUMVRN
NUMBER OF VARICELLA-CONTAINING SHOTS OF UNKNOWN TYPE BY 36 MONTHS OF AGE DETERMINED FROM PROVIDER INFO, EXCLUDING ANY VACCINATIONS AFTER THE HH INTERVIEW DATE.
Y Y Y Y Y Y Y Y Y Y
P_NUMVRX
NUMBER OF VARICELLA-ONLY SHOTS BY 36 MONTHS OF AGE DETERMINED FROM PROVIDER INFO, EXCLUDING ANY VACCINATIONS AFTER THE HH INTERVIEW DATE.
Y Y Y Y Y Y Y Y Y Y
P_U12VRC UTD (UP-TO-DATE) FLAG FOR PROVIDER 1+ VARICELLA-CONTAINING SHOT AT 12+ MONTHS, BY 36 MONTHS OF AGE
Y Y Y Y Y Y Y Y Y Y Y Y
P_UTD331
UTD (UP-TO-DATE) FLAG FOR PROVIDER 3:3:1 BY 36 MONTHS OF AGE, EXCLUDING ANY VACCINATIONS AFTER THE HOUSEHOLD INTERVIEW DATE.
Y Y Y Y Y Y Y Y Y Y Y Y
P_UTD431
UTD (UP-TO-DATE) FLAG FOR PROVIDER 4:3:1 BY 36 MONTHS OF AGE, EXCLUDING ANY VACCINATIONS AFTER THE HOUSEHOLD INTERVIEW DATE.
Y Y Y Y Y Y Y Y Y Y Y Y
P_UTD431H_ROUT_S
UTD (UP-TO-DATE) FLAG FOR PROVIDER 4:3:1:3* BY 36 MONTHS OF AGE, USING THE ROUTINE, STRICT DEFINITION OF HIB UTD, EXCLUDING ANY VACCINATIONS AFTER THE HOUSEHOLD INTERVIEW DATE.
Y Y Y Y Y Y Y Added in 2009 due to new Hib vaccination recommendations.

Data User’s Guide for the 2015 NIS Public-Use Data File APPENDIX E 150
Variable Name Variable Label† 2004 2005 2006 2007 2008 2009 2010 2011 2012 2013 2014 2015 Notes§
P_UTD431H3_ROUT_S
UTD (UP-TO-DATE) FLAG FOR PROVIDER 4:3:1:3*:3 BY 36 MONTHS OF AGE, USING THE ROUTINE, STRICT DEFINITION OF HIB UTD, EXCLUDING ANY VACCINATIONS AFTER THE HOUSEHOLD INTERVIEW DATE.
Y Y Y Y Y Y Y Added in 2009 due to new Hib vaccination recommendations.
P_UTD431H31_ROUT_S
UTD (UP-TO-DATE) FLAG FOR PROVIDER 4:3:1:3*:3:1 BY 36 MONTHS OF AGE (INCLUDES 1+ VARICELLA-CONTAINING AT AGE 12+ MTHS) USING THE ROUTINE, STRICT DEFINITION OF HIB UTD, EXCLUDING ANY VACCINATIONS AFTER THE HOUSEHOLD INTERVIEW DATE.
Y Y Y Y Y Y Y Added in 2009 due to new Hib vaccination recommendations.
P_UTD431H313_ROUT_S
UTD (UP-TO-DATE) FLAG FOR PROVIDER 4:3:1:3*:3:1:3 BY 36 MONTHS OF AGE (INCLUDES 1+ VARICELLA-CONTAINING AT AGE 12+ MTHS) USING THE ROUTINE, STRICT DEFINITION OF HIB UTD, EXCLUDING ANY VACCINATIONS AFTER THE HOUSEHOLD INTERVIEW DATE.
Y Y Y Y Y Y Y Added in 2009 due to new Hib vaccination recommendations.
P_UTD431H314_ROUT_S
UTD (UP-TO-DATE) FLAG FOR PROVIDER 4:3:1:3*:3:1:4 BY 36 MONTHS OF AGE (INCLUDES 1+ VARICELLA-CONTAINING AT AGE 12+ MTHS) USING THE ROUTINE, STRICT DEFINITION OF HIB UTD, EXCLUDING ANY VACCINATIONS AFTER THE HOUSEHOLD INTERVIEW DATE.
Y Y Y Y Y Y Y Added in 2009 due to new Hib vaccination recommendations.
P_UTDFL1
UTD FLAG FOR PROVIDER SEASONAL INFLUENZA VARIABLE 1 BY 36 MONTHS OF AGE, EXCLUDING ANY VACCINATIONS AFTER THE HOUSEHOLD INTERVIEW DATE.
Y Y Y Y Y Y Y Y Y Y Removed 2014.
P_UTDFL2
UTD FLAG FOR PROVIDER SEASONAL INFLUENZA VARIABLE 2 BY 36 MONTHS OF AGE, EXCLUDING ANY VACCINATIONS AFTER THE HOUSEHOLD INTERVIEW DATE.
Y Y Y Y Y Y Y Y Y Y Removed 2014.
P_UTDFL3
UTD FLAG FOR PROVIDER SEASONAL INFLUENZA VARIABLE 3 BY 36 MONTHS OF AGE, EXCLUDING ANY VACCINATIONS AFTER THE HOUSEHOLD INTERVIEW DATE.
Y Y Y Y Y Y Y Removed 2014.
P_UTDH1N_1
UTD (UP-TO-DATE) FLAG FOR PROVIDER 1+ MONOVALENT 2009 H1N1 FLU VACCINATION BY 36 MONTHS OF AGE, EXCLUDING ANY VACCINATIONS AFTER THE HOUSEHOLD INTERVIEW DATE AND EXCLUDING VACCINATIONS GIVEN PRIOR TO 10/5/2009.
Y Y Y Introduced in 2010. Removed 2013.

Data User’s Guide for the 2015 NIS Public-Use Data File APPENDIX E 151
Variable Name Variable Label† 2004 2005 2006 2007 2008 2009 2010 2011 2012 2013 2014 2015 Notes§
P_UTDH1N_2
UTD (UP-TO-DATE) FLAG FOR PROVIDER 2+ MONOVALENT 2009 H1N1 FLU VACCINATIONS BY 36 MONTHS OF AGE, EXCLUDING ANY VACCINATIONS AFTER THE HOUSEHOLD INTERVIEW DATE AND EXCLUDING VACCINATIONS GIVEN PRIOR TO 10/5/2009.
Y Y Y Introduced in 2010. Removed 2013.
P_UTDHEP
UTD (UP-TO-DATE) FLAG FOR PROVIDER 3+ HEPATITIS B-CONTAINING SHOTS BY 36 MONTHS OF AGE, EXCLUDING ANY VACCINATIONS AFTER THE HOUSEHOLD INTERVIEW DATE.
Y Y Y Y Y Y Y Y Y Y Y Y
P_UTDHEPA1
UTD (UP-TO-DATE) FLAG FOR PROVIDER 1+ HEPATITIS A-CONTAINING SHOTS BY 36 MONTHS OF AGE, EXCLUDING ANY VACCINATIONS AFTER THE HOUSEHOLD INTERVIEW DATE.
Y Y Y Y Y Added 2011.
P_UTDHEPA2
UTD (UP-TO-DATE) FLAG FOR PROVIDER 2+ HEPATITIS A-CONTAINING SHOTS BY 36 MONTHS OF AGE, EXCLUDING ANY VACCINATIONS AFTER THE HOUSEHOLD INTERVIEW DATE.
Y Y Y Y Y Y Introduced in 2010.
P_UTDHIB
UTD (UP-TO-DATE) FLAG FOR PROVIDER 3+ HIB-CONTAINING SHOTS BY 36 MONTHS OF AGE, EXCLUDING ANY VACCINATIONS AFTER THE HOUSEHOLD INTERVIEW DATE.
Y Y Y Y Y Y Y Y Y Y Y Y
P_UTDHIB_ROUT_S
UTD (UP-TO-DATE) FLAG FOR PROVIDER 3+ HIB DOSES BY 36 MONTHS OF AGE, BASED ON THE ROUTINE (NON-SHORTAGE) HIB RECOMMENDATIONS AND A STRICT TREATMENT OF HIB SHOTS OF UNKNOWN TYPE, EXCLUDING ANY VACCINATIONS AFTER THE HOUSEHOLD INTERVIEW DATE.
Y Y Y Y Y Y Y Added in 2009 due to new Hib vaccination recommendations.
P_UTDHIB_SHORT_S
UTD (UP-TO-DATE) FLAG FOR PROVIDER 3+ HIB DOSES BY 36 MONTHS OF AGE, BASED ON THE HIB SHORTAGE RECOMMENDATIONS AND A STRICT TREATMENT OF HIB SHOTS OF UNKNOWN TYPE, EXCLUDING ANY VACCINATIONS AFTER THE HOUSEHOLD INTERVIEW DATE.
Y Y Y Y Y Y Y Added in 2009 due to new Hib vaccination recommendations.
P_UTDMCV
UTD (UP-TO-DATE) FLAG FOR PROVIDER 1+ MEASLES-CONTAINING SHOT BY 36 MONTHS OF AGE, EXCLUDING ANY VACCINATIONS AFTER THE HOUSEHOLD INTERVIEW DATE.
Y Y Y Y Y Y Y Y Y Y Y Y
P_UTDMMX
UTD FLAG FOR PROVIDER 1+ MMR COMBO SHOT BY 36 MONTHS OF AGE, EXCLUDING ANY VACCINATIONS AFTER THE HOUSEHOLD INTERVIEW DATE.
Y Y Y Y Y Y Y Y Y Y Y Y

Data User’s Guide for the 2015 NIS Public-Use Data File APPENDIX E 152
Variable Name Variable Label† 2004 2005 2006 2007 2008 2009 2010 2011 2012 2013 2014 2015 Notes§
P_UTDPC3
UTD (UP-TO-DATE) FLAG FOR PROVIDER 3+ PNEUMOCOCCAL-CONTAINING SHOTS BY 36 MONTHS OF AGE, EXCLUDING ANY VACCINATIONS AFTER THE HOUSEHOLD INTERVIEW DATE.
Y Y Y Y Y Y Y Y Y Y Y Y
P_UTDPCV
UTD (UP-TO-DATE) FLAG FOR PROVIDER 4+ PNEUMOCOCCAL-CONTAINING SHOTS BY 36 MONTHS OF AGE, EXCLUDING ANY VACCINATIONS AFTER THE HOUSEHOLD INTERVIEW DATE.
Y Y Y Y Y Y Y Y Y Y Y Y
P_UTDPCVB13
UTD (UP-TO-DATE) INDICATOR FOR PROVIDER 1+ PNEUMOCOCCAL VACCINATIONS OF TYPE CONJUGATE 13, GIVEN 4+ DOSES OF TYPE CONJUGATE 7, BY 36 MONTHS OF AGE, EXCLUDING ANY VACCINATIONS AFTER THE HOUSEHOLD INTERVIEW DATE.
Y Y Y Y Y Y Introduced in 2010.
P_UTDPOL
UTD (UP-TO-DATE) FLAG FOR PROVIDER 3+ POLIO-CONTAINING SHOTS BY 36 MONTHS OF AGE, EXCLUDING ANY VACCINATIONS AFTER THE HOUSEHOLD INTERVIEW DATE.
Y Y Y Y Y Y Y Y Y Y Y Y
P_UTDROT_S
UTD (UP-TO-DATE) FLAG FOR PROVIDER 3+ ROTAVIRUS DOSES BY 36 MONTHS OF AGE, BASED ON A STRICT TREATMENT OF ROTAVIRUS VACCINATIONS OF UNKNOWN TYPE, EXCLUDING ANY VACCINATIONS AFTER THE HOUSEHOLD INTERVIEW DATE.
Y Y Y Y Y Y Y
P_UTDTP3
UTD (UP-TO-DATE) FLAG FOR PROVIDER 3+ DT-CONTAINING SHOTS BY 36 MONTHS OF AGE, EXCLUDING ANY VACCINATIONS AFTER THE HOUSEHOLD INTERVIEW DATE.
Y Y Y Y Y Y Y Y Y Y Y Y
P_UTDTP4
UTD (UP-TO-DATE) FLAG FOR PROVIDER 4+ DT-CONTAINING SHOTS BY 36 MONTHS OF AGE, EXCLUDING ANY VACCINATIONS AFTER THE HOUSEHOLD INTERVIEW DATE.
Y Y Y Y Y Y Y Y Y Y Y Y
PCV1_AGE AGE IN MONTHS OF PROV-REPTD PNEUMOCOCCAL-CONTAINING SHOT #1 Y Y Y Y Y Y Y Y Y Y Y Y
PCV2_AGE AGE IN MONTHS OF PROV-REPTD PNEUMOCOCCAL-CONTAINING SHOT #2 Y Y Y Y Y Y Y Y Y Y Y Y
PCV3_AGE AGE IN MONTHS OF PROV-REPTD PNEUMOCOCCAL-CONTAINING SHOT #3 Y Y Y Y Y Y Y Y Y Y Y Y
PCV4_AGE AGE IN MONTHS OF PROV-REPTD PNEUMOCOCCAL-CONTAINING SHOT #4 Y Y Y Y Y Y Y Y Y Y Y Y
PCV5_AGE AGE IN MONTHS OF PROV-REPTD PNEUMOCOCCAL-CONTAINING SHOT #5 Y Y Y Y Y Y Y Y Y Y Y Y
PCV6_AGE AGE IN MONTHS OF PROV-REPTD PNEUMOCOCCAL-CONTAINING SHOT #6 Y Y Y Y Y Y Y Y Y Y Y Y

Data User’s Guide for the 2015 NIS Public-Use Data File APPENDIX E 153
Variable Name Variable Label† 2004 2005 2006 2007 2008 2009 2010 2011 2012 2013 2014 2015 Notes§
PCV7_AGE AGE IN MONTHS OF PROV-REPTD PNEUMOCOCCAL-CONTAINING SHOT #7 Y Y Y Y Y Y Y Y Y Y Y Y
PCV8_AGE AGE IN MONTHS OF PROV-REPTD PNEUMOCOCCAL-CONTAINING SHOT #8 Y Y Y Y Y Y Y Y Y Y Y Y
PCV9_AGE AGE IN MONTHS OF PROV-REPTD PNEUMOCOCCAL-CONTAINING SHOT #9 Y Y Y Y Y Y Y Y Y Y Y
Starting in 2005, nine shot variables are included for each vaccine category.
PDAT CHILD HAS ADEQUATE PROVIDER DATA Y Y Y Y Y Y Y Y Y Y Y Y
POL1_AGE AGE IN MONTHS OF PROV-REPTD POLIO-CONTAINING SHOT #1 Y Y Y Y Y Y Y Y Y Y Y Y
POL2_AGE AGE IN MONTHS OF PROV-REPTD POLIO-CONTAINING SHOT #2 Y Y Y Y Y Y Y Y Y Y Y Y
POL3_AGE AGE IN MONTHS OF PROV-REPTD POLIO-CONTAINING SHOT #3 Y Y Y Y Y Y Y Y Y Y Y Y
POL4_AGE AGE IN MONTHS OF PROV-REPTD POLIO-CONTAINING SHOT #4 Y Y Y Y Y Y Y Y Y Y Y Y
POL5_AGE AGE IN MONTHS OF PROV-REPTD POLIO-CONTAINING SHOT #5 Y Y Y Y Y Y Y Y Y Y Y Y
POL6_AGE AGE IN MONTHS OF PROV-REPTD POLIO-CONTAINING SHOT #6 Y Y Y Y Y Y Y Y Y Y Y Y
POL7_AGE AGE IN MONTHS OF PROV-REPTD POLIO-CONTAINING SHOT #7 Y Y Y Y Y Y Y Y Y Y Y Y
POL8_AGE AGE IN MONTHS OF PROV-REPTD POLIO-CONTAINING SHOT #8 Y Y Y Y Y Y Y Y Y Y Y Y
POL9_AGE AGE IN MONTHS OF PROV-REPTD POLIO-CONTAINING SHOT #9 Y Y Y Y Y Y Y Y Y Y Y
Starting in 2005, nine shot variables are included for each vaccine category.
PROV_FAC PROVIDER FACILITY TYPES Y Y Y Y Y Y Y Y Y Y Y Y
PROVWT
WEIGHT FOR CHILDREN WITH ADEQUATE PROVIDER DATA AND UNVACCINATED CHILDREN (EXCLUDING U.S. VIRGIN ISLANDS)
Y Y Y Y Y Y Removed in 2011 due to additional of dual-frame weights. Replaced by PROVWT_LL.
PROVWT_D DUAL-FRAME WEIGHT FOR CHILDREN WITH ADEQUATE PROVIDER DATA AND UNVACCINATED CHILDREN
Y Y Y Y Y Added 2011.
PROVWT_LL
LANDLINE-FRAME WEIGHT FOR CHILDREN WITH ADEQUATE PROVIDER DATA AND UNVACCINATED CHILDREN (EXCLUDING U.S. VIRGIN ISLANDS)
Y Removed in 2012.
PROVWTVI
WEIGHT FOR CHILDREN WITH ADEQUATE PROVIDER DATA AND UNVACCINATED CHILDREN (INCLUDING U.S. VIRGIN ISLANDS)
Y Y Removed in 2011 due to additional of dual-frame weights. Replaced by PROVWTVI_LL.

Data User’s Guide for the 2015 NIS Public-Use Data File APPENDIX E 154
Variable Name Variable Label† 2004 2005 2006 2007 2008 2009 2010 2011 2012 2013 2014 2015 Notes§
PROVWTVI_D
COMBINATION OF THE DUAL-FRAME WEIGHT FOR CHILDREN IN THE U.S. PROPER AND LANDLINE WEIGHT FOR CHILDREN IN THE U.S. VIRGIN ISLANDS FOR CHILDREN WITH ADEQUATE PROVIDER DATA AND UNVACCINATED CHILDREN
Y Added 2012. Removed 2013.
PROVWTVIGU_D
THE DUAL-FRAME WEIGHT FOR CHILDREN IN THE U.S. PROPER, THE U.S. VIRGIN ISLANDS AND GUAM FOR CHILDREN WITH ADEQUATE PROVIDER DATA AND UNVACCINATED CHILDREN
Y Added 2013. Removed 2014.
PROVWT_D_TERR
THE DUAL-FRAME WEIGHT FOR CHILDREN IN THE U.S. PROPER AND TERRITORIES FOR CHILDREN WITH ADEQUATE PROVIDER DATA AND UNVACCINATED CHILDREN
Y Y Added 2014.
PROVWTVI_LL
LANDLINE-FRAME WEIGHT FOR CHILDREN WITH ADEQUATE PROVIDER DATA AND UNVACCINATED CHILDREN (INCLUDING U.S. VIRGIN ISLANDS)
Y Added 2011. Removed 2012.
PU431_31
UTD FLAG FOR PROVIDER 4:3:1::3:1 (4:3:1:3:3:1 EXCLUDING HIB; INCLUDES 1+ VARICELLA AT AGE 12+ MTHS) BY 36 MONTHS OF AGE, EXCLUDING ANY VACCINATIONS AFTER THE HOUSEHOLD INTERVIEW DATE.
Y Y Y Y Y Y Introduced in 2010.
PU431_314
UTD FLAG FOR PROVIDER 4:3:1::3:1:4 (4:3:1:3:3:1:4 EXCLUDING HIB; INCLUDES 1+ VARICELLA AT AGE 12+ MTHS) BY 36 MONTHS OF AGE, EXCLUDING ANY VACCINATIONS AFTER THE HOUSEHOLD INTERVIEW DATE.
Y Y Y Y Y Y Introduced in 2010.
PU431331
UTD FLAG FOR PROVIDER 4:3:1:3:3:1 (INCLUDES 1+ VARICELLA AT AGE 12+ MTHS) BY 36 MONTHS OF AGE, EXCLUDING ANY VACCINATIONS AFTER THE HOUSEHOLD INTERVIEW DATE.
Y Y Y Y Y Y Y Y Y Y Y Y
PU4313313
UTD FLAG FOR PROVIDER 4:3:1:3:3:1:3 (INCLUDES 1+ VARICELLA AT AGE 12+ MTHS) BY 36 MONTHS OF AGE, EXCLUDING ANY VACCINATIONS AFTER THE HOUSEHOLD INTERVIEW DATE.
Y Y Y Y Y Y Y Y Y
PU4313314
UTD FLAG FOR PROVIDER 4:3:1:3:3:1:4 (INCLUDES 1+ VARICELLA AT AGE 12+ MTHS) BY 36 MONTHS OF AGE, EXCLUDING ANY VACCINATIONS AFTER THE HOUSEHOLD INTERVIEW DATE.
Y Y Y Y Y Y Y Y Y

Data User’s Guide for the 2015 NIS Public-Use Data File APPENDIX E 155
Variable Name Variable Label† 2004 2005 2006 2007 2008 2009 2010 2011 2012 2013 2014 2015 Notes§
PUT43133
UTD FLAG FOR PROVIDER 4:3:1:3:3 BY 36 MONTHS OF AGE, EXCLUDING ANY VACCINATIONS AFTER THE HOUSEHOLD INTERVIEW DATE.
Y Y Y Y Y Y Y Y Y Y Y Y
PUTD4313
UTD FLAG FOR PROVIDER 4:3:1:3 BY 36 MONTHS OF AGE, EXCLUDING ANY VACCINATIONS AFTER THE HOUSEHOLD INTERVIEW DATE.
Y Y Y Y Y Y Y Y Y Y Y Y
Q5WEB1 INTEREST IN IHQ ON WEBSITE PROVIDER #1 Y Question was not asked starting in 2005.
Q5WEB2 INTEREST IN IHQ ON WEBSITE PROVIDER #2 Y Question was not asked starting in 2005.
Q5WEB3 INTEREST IN IHQ ON WEBSITE PROVIDER #3 Y Question was not asked starting in 2005.
Q5WEB4 INTEREST IN IHQ ON WEBSITE PROVIDER #4 Y Question was not asked starting in 2005.
Q5WEB5 INTEREST IN IHQ ON WEBSITE PROVIDER #5 Y Question was not asked starting in 2005.
RACE_K RACE OF CHILD (RECODE) Y Y Y Y Y Y Y Y Y Y Y Y RACEETHK RACE/ETHNICITY OF CHILD (RECODE) Y Y Y Y Y Y Y Y Y Y Y Y
RACEETHK_VI RACE/ETHNICITY OF CHILD FOR U.S. VIRGIN ISLANDS (RECODE) Y Added in 2015 for U.S. Virgin
Islands.
RB1_AGE AGE IN MONTHS OF PROV-REPTD RUBELLA-ONLY SHOT #1 Y Y Y Y Y Y Y Y Y Y Y Y
RB2_AGE AGE IN MONTHS OF PROV-REPTD RUBELLA-ONLY SHOT #2 Y Y Y Y Y Y Y Y Y Y Y Y
RB3_AGE AGE IN MONTHS OF PROV-REPTD RUBELLA-ONLY SHOT #3 Y Y Y Y Y Y Y Y Y Y Y Y
RB4_AGE AGE IN MONTHS OF PROV-REPTD RUBELLA-ONLY SHOT #4 Y Y Y Y Y Y Y Y Y Y Y Y
RB5_AGE AGE IN MONTHS OF PROV-REPTD RUBELLA-ONLY SHOT #5 Y Y Y Y Y Y Y Y Y Y Y Y
RB6_AGE AGE IN MONTHS OF PROV-REPTD RUBELLA-ONLY SHOT #6 Y Y Y Y Y Y Y Y Y Y Y Y
RB7_AGE AGE IN MONTHS OF PROV-REPTD RUBELLA-ONLY SHOT #7 Y Y Y Y Y Y Y Y Y Y Y Y
RB8_AGE AGE IN MONTHS OF PROV-REPTD RUBELLA-ONLY SHOT #8 Y Y Y Y Y Y Y Y Y Y Y Y
RB9_AGE AGE IN MONTHS OF PROV-REPTD RUBELLA-ONLY SHOT #9 Y Y Y Y Y Y Y Y Y Y Y
Starting in 2005, nine shot variables are included for each vaccine category.
RDDWT HH-PHASE CHILD INTERVIEW WEIGHT (EXCLUDING U.S. VIRGIN ISLANDS) Y Y Y Y Y Y
Removed in 2011 due to additional of dual-frame weights. Replaced by RDDWT_LL.

Data User’s Guide for the 2015 NIS Public-Use Data File APPENDIX E 156
Variable Name Variable Label† 2004 2005 2006 2007 2008 2009 2010 2011 2012 2013 2014 2015 Notes§
RDDWT_D DUAL-FRAME HH-PHASE CHILD INTERIVEW WEIGHT Y Y Y Y Y Added 2011.
RDDWT_LL LANDLINE-FRAME HH-PHASE CHILD INTERIVEW WEIGHT (EXCLUDING U.S. VIRGIN ISLANDS)
Y Added 2011. Removed 2012.
RDDWTVI HH-PHASE CHILD INTERVIEW WEIGHT (INCLUDING U.S. VIRGIN ISLANDS) Y Y
Removed in 2011 due to additional of dual-frame weights. Replaced by RDDWTVI_LL.
RDDWTVI_D
COMBINATION OF THE DUAL-FRAME HH-PHASE WEIGHT FOR HOUSEHOLDS IN THE U.S. PROPER AND LANDLINE HH-PHASE WEIGHT FOR HOUSEHOLDS IN THE U.S. VIRGIN ISLANDS
Y Added 2012. Removed 2013.
RDDWTVIGU_D THE DUAL-FRAME HH-PHASE WEIGHT FOR HOUSEHOLDS IN THE U.S. PROPER, THE U.S. VIRGIN ISLANDS AND GUAM
Y Added 2013. Removed 2014.
RDDWT_D_TERR THE DUAL-FRAME HH-PHASE WEIGHT FOR HOUSEHOLDS IN THE U.S. PROPER AND TERRITORIES
Y Y Added 2014.
RDDWTVI_LL LANDLINE-FRAME HH-PHASE CHILD INTERIVEW WEIGHT (INCLUDING U.S. VIRGIN ISLANDS)
Y Added 2011. Removed 2012.
REGISTRY CHILD'S PROVIDERS REPORTED CHILD'S VACCINATIONS TO IMMUNIZATION REGISTRY
Y Y Y Y Y Y Y Y Y Y Y Y
RENT_OWN IS HOME OWNED/BEING BOUGHT, RENTED, OR OCCUPIED BY SOME OTHER ARRANGEMENT?
Y Y Y Y Y Y Y
ROT1_AGE AGE IN MONTHS OF PROV-REPTD ROTAVIRUS-CONTAINING SHOT #1 Y Y Y Y Y Y Y Y Y Y Y Y
ROT2_AGE AGE IN MONTHS OF PROV-REPTD ROTAVIRUS-CONTAINING SHOT #2 Y Y Y Y Y Y Y Y Y Y Y Y
ROT3_AGE AGE IN MONTHS OF PROV-REPTD ROTAVIRUS-CONTAINING SHOT #3 Y Y Y Y Y Y Y Y Y Y Y Y
ROT4_AGE AGE IN MONTHS OF PROV-REPTD ROTAVIRUS-CONTAINING SHOT #4 Y Y Y Y Y Y Y Y Y Y Y Y
ROT5_AGE AGE IN MONTHS OF PROV-REPTD ROTAVIRUS-CONTAINING SHOT #5 Y Y Y Y Y Y Y Y Y Y Y Y
ROT6_AGE AGE IN MONTHS OF PROV-REPTD ROTAVIRUS-CONTAINING SHOT #6 Y Y Y Y Y Y Y Y Y Y Y Y
ROT7_AGE AGE IN MONTHS OF PROV-REPTD ROTAVIRUS-CONTAINING SHOT #7 Y Y Y Y Y Y Y Y Y Y Y Y
ROT8_AGE AGE IN MONTHS OF PROV-REPTD ROTAVIRUS-CONTAINING SHOT #8 Y Y Y Y Y Y Y Y Y Y Y Y

Data User’s Guide for the 2015 NIS Public-Use Data File APPENDIX E 157
Variable Name Variable Label† 2004 2005 2006 2007 2008 2009 2010 2011 2012 2013 2014 2015 Notes§
ROT9_AGE AGE IN MONTHS OF PROV-REPTD ROTAVIRUS-CONTAINING SHOT #9 Y Y Y Y Y Y Y Y Y Y Y
Starting in 2005, nine shot variables are included for each vaccine category.
SC_431 HH SHOT CARD REPORT OF 4:3:1 UP-TO-DATE Y Y Y Y Y Y
Added in 2006 as a partial replacement for the "FULL" and "C_" variables. Dropped in 2012 due to questionnaire changes.
SC_4313 HH SHOT CARD REPORT OF 4:3:1:3 UP-TO-DATE Y Y Y Y Y Y
Added in 2006 as a partial replacement for the "FULL" and "C_" variables. Dropped in 2012 due to questionnaire changes.
SC_43133 HH SHOT CARD REPORT OF 4:3:1:3:3 UP-TO-DATE Y Y Y Y Y Y
Added in 2006 as a partial replacement for the "FULL" and "C_" variables. Dropped in 2012 due to questionnaire changes.
SC_DTP HH SHOT CARD REPORT OF 4+ DT-CONTAINING UP-TO-DATE Y Y Y Y Y Y
Added in 2006 as a partial replacement for the "FULL" and "C_" variables. Dropped in 2012 due to questionnaire changes.
SC_HEPB HH SHOT CARD REPORT OF 3+ HEPATITIS B-CONTAINING UP-TO-DATE Y Y Y Y Y Y
Added in 2006 as a partial replacement for the "FULL" and "C_" variables. Dropped in 2012 due to questionnaire changes.
SC_HIB HH SHOT CARD REPORT OF 3+ HIB-CONTAINING UP-TO-DATE Y Y Y Y Y Y
Added in 2006 as a partial replacement for the "FULL" and "C_" variables. Dropped in 2012 due to questionnaire changes.
SC_MCV HH SHOT CARD REPORT OF 1+ MEASLES-CONTAINING UP-TO-DATE Y Y Y Y Y Y
Added in 2006 as a partial replacement for the "FULL" and "C_" variables. Dropped in 2012 due to questionnaire changes.
SC_POL HH SHOT CARD REPORT OF 3+ POLIO-CONTAINING UP-TO-DATE Y Y Y Y Y Y
Added in 2006 as a partial replacement for the "FULL" and "C_" variables. Dropped in 2012 due to questionnaire changes.
SC_VRC HH SHOT CARD REPORT OF 1+ VARICELLA-CONTAINING UP-TO-DATE Y Y Y Y Y Y
Added in 2006 as a partial replacement for the "FULL" and "C_" variables. Dropped in 2012 due to questionnaire changes.
SEQNUMC UNIQUE CHILD IDENTIFIER Y Y Y Y Y Y Y Y Y Y Y Y SEQNUMHH UNIQUE HOUSEHOLD IDENTIFIER Y Y Y Y Y Y Y Y Y Y Y Y SEX GENDER OF CHILD Y Y Y Y Y Y Y Y Y Y Y Y
SHORT Q1/2004 SHORT QUESTIONNAIRE STUDY FLAG Y There was no short questionnaire
study in 2005.
STATE TRUE STATE OF RESIDENCE (STATE FIPS CODE) Y Y Y Y Y Y Y Y Y Y Y Y

Data User’s Guide for the 2015 NIS Public-Use Data File APPENDIX E 158
Variable Name Variable Label† 2004 2005 2006 2007 2008 2009 2010 2011 2012 2013 2014 2015 Notes§
STRATUM STRATUM VARIABLE FOR DUAL-FRAME VARIANCE ESTIMATION Y Y Y Y Added 2012. Equal to sample
frame by estimation area.
STRATUM_D STRATUM VARIABLE FOR DUAL-FRAME VARIANCE ESTIMATION Y Added 2011. Equal to sample
frame by estimation area. TEL_SAMPFRAME SAMPLE FRAME INDICATOR Y Added 2011. Removed 2012.
U1D_HEP BIRTH DOSE HEPATITIS B-CONTAINING GIVEN FROM BIRTH TO DAY 1 FLAG Y Y Y Y Y Added 2011.
U2D_HEP BIRTH DOSE HEPATITIS B-CONTAINING GIVEN FROM BIRTH TO DAY 2 FLAG Y Y Y Y Y Added 2011.
U3D_HEP BIRTH DOSE HEPATITIS B-CONTAINING GIVEN FROM BIRTH TO DAY 3 FLAG Y Y Y Y Y Added 2011.
VFC_I DERIVED: IS CHILD VFC ELIGIBLE? Y Y Y Removed in 2012
VFC_ORDER DO CHILD'S PROVIDERS ORDER VACCINES FROM STATE/LOCAL HEALTH DEPT? Y Y Y Y Y Y Y Y Y Y
VFC_PRO PARTICIPATION OF CHILD'S PROVIDERS IN VACCINES FOR CHILDREN PROGRAM Y Y Question was not asked starting in
2006.
VRC1_AGE AGE IN MONTHS OF PROV-REPTD VARICELLA-CONTAINING SHOT #1 Y Y Y Y Y Y Y Y Y Y Y Y
VRC2_AGE AGE IN MONTHS OF PROV-REPTD VARICELLA-CONTAINING SHOT #2 Y Y Y Y Y Y Y Y Y Y Y Y
VRC3_AGE AGE IN MONTHS OF PROV-REPTD VARICELLA-CONTAINING SHOT #3 Y Y Y Y Y Y Y Y Y Y Y Y
VRC4_AGE AGE IN MONTHS OF PROV-REPTD VARICELLA-CONTAINING SHOT #4 Y Y Y Y Y Y Y Y Y Y Y Y
VRC5_AGE AGE IN MONTHS OF PROV-REPTD VARICELLA-CONTAINING SHOT #5 Y Y Y Y Y Y Y Y Y Y Y
Starting in 2005, nine shot variables are included for each vaccine category.
VRC6_AGE AGE IN MONTHS OF PROV-REPTD VARICELLA-CONTAINING SHOT #6 Y Y Y Y Y Y Y Y Y Y Y
Starting in 2005, nine shot variables are included for each vaccine category.
VRC7_AGE AGE IN MONTHS OF PROV-REPTD VARICELLA-CONTAINING SHOT #7 Y Y Y Y Y Y Y Y Y Y Y
Starting in 2005, nine shot variables are included for each vaccine category.
VRC8_AGE AGE IN MONTHS OF PROV-REPTD VARICELLA-CONTAINING SHOT #8 Y Y Y Y Y Y Y Y Y Y Y
Starting in 2005, nine shot variables are included for each vaccine category.
VRC9_AGE AGE IN MONTHS OF PROV-REPTD VARICELLA-CONTAINING SHOT #9 Y Y Y Y Y Y Y Y Y Y Y
Starting in 2005, nine shot variables are included for each vaccine category.
WGT NEW WEIGHT FOR CHILDREN WITH ADEQUATE PROVIDER DATA AND UNVACCINATED CHILDREN
Y Replaced by PROVWT starting in 2005.
WGT_RDD RDD CHILD INTERVIEW WEIGHT Y Replaced by RDDWT starting in 2005.

Data User’s Guide for the 2015 NIS Public-Use Data File APPENDIX E 159
Variable Name Variable Label† 2004 2005 2006 2007 2008 2009 2010 2011 2012 2013 2014 2015 Notes§
XDTPTY1 DT-CONTAINING VACCINATION #1 TYPE CODE Y Y Y Y Y Y Y Y Y Y Y Y
XDTPTY2 DT-CONTAINING VACCINATION #2 TYPE CODE Y Y Y Y Y Y Y Y Y Y Y Y
XDTPTY3 DT-CONTAINING VACCINATION #3 TYPE CODE Y Y Y Y Y Y Y Y Y Y Y Y
XDTPTY4 DT-CONTAINING VACCINATION #4 TYPE CODE Y Y Y Y Y Y Y Y Y Y Y Y
XDTPTY5 DT-CONTAINING VACCINATION #5 TYPE CODE Y Y Y Y Y Y Y Y Y Y Y Y
XDTPTY6 DT-CONTAINING VACCINATION #6 TYPE CODE Y Y Y Y Y Y Y Y Y Y Y Y
XDTPTY7 DT-CONTAINING VACCINATION #7 TYPE CODE Y Y Y Y Y Y Y Y Y Y Y Y
XDTPTY8 DT-CONTAINING VACCINATION #8 TYPE CODE Y Y Y Y Y Y Y Y Y Y Y Y
XDTPTY9 DT-CONTAINING VACCINATION #9 TYPE CODE Y Y Y Y Y Y Y Y Y Y Y
Starting in 2005, nine shot variables are included for each vaccine category.
XFLUTY1 SEASONAL FLU-CONTAINING VACCINATION #1 TYPE CODE Y Y Y Y Y Y Y Y
Starting in 2008, influenza type boxes were added to the IHQ shot grid.
XFLUTY2 SEASONAL FLU-CONTAINING VACCINATION #2 TYPE CODE Y Y Y Y Y Y Y Y
Starting in 2008, influenza type boxes were added to the IHQ shot grid.
XFLUTY3 SEASONAL FLU-CONTAINING VACCINATION #3 TYPE CODE Y Y Y Y Y Y Y Y
Starting in 2008, influenza type boxes were added to the IHQ shot grid.
XFLUTY4 SEASONAL FLU-CONTAINING VACCINATION #4 TYPE CODE Y Y Y Y Y Y Y Y
Starting in 2008, influenza type boxes were added to the IHQ shot grid.
XFLUTY5 SEASONAL FLU-CONTAINING VACCINATION #5 TYPE CODE Y Y Y Y Y Y Y Y
Starting in 2008, influenza type boxes were added to the IHQ shot grid.
XFLUTY6 SEASONAL FLU-CONTAINING VACCINATION #6 TYPE CODE Y Y Y Y Y Y Y Y
Starting in 2008, influenza type boxes were added to the IHQ shot grid.
XFLUTY7 SEASONAL FLU-CONTAINING VACCINATION #7 TYPE CODE Y Y Y Y Y Y Y Y
Starting in 2008, influenza type boxes were added to the IHQ shot grid.
XFLUTY8 SEASONAL FLU-CONTAINING VACCINATION #8 TYPE CODE Y Y Y Y Y Y Y Y
Starting in 2008, influenza type boxes were added to the IHQ shot grid.

Data User’s Guide for the 2015 NIS Public-Use Data File APPENDIX E 160
Variable Name Variable Label† 2004 2005 2006 2007 2008 2009 2010 2011 2012 2013 2014 2015 Notes§
XFLUTY9 SEASONAL FLU-CONTAINING VACCINATION #9 TYPE CODE Y Y Y Y Y Y Y Y
Starting in 2008, influenza type boxes were added to the IHQ shot grid.
XH1NTY1 MONOVALENT 2009 H1N1 FLU VACCINATION #1 TYPE CODE Y Y Y Introduced in 2010. Removed
2013.
XH1NTY2 MONOVALENT 2009 H1N1 FLU VACCINATION #2 TYPE CODE Y Y Y Introduced in 2010. Removed
2013.
XH1NTY3 MONOVALENT 2009 H1N1 FLU VACCINATION #3 TYPE CODE Y Y Y Introduced in 2010. Removed
2013.
XH1NTY4 MONOVALENT 2009 H1N1 FLU VACCINATION #4 TYPE CODE Y Y Y Introduced in 2010. Removed
2013.
XH1NTY5 MONOVALENT 2009 H1N1 FLU VACCINATION #5 TYPE CODE Y Y Y Introduced in 2010. Removed
2013.
XH1NTY6 MONOVALENT 2009 H1N1 FLU VACCINATION #6 TYPE CODE Y Y Y Introduced in 2010. Removed
2013.
XH1NTY7 MONOVALENT 2009 H1N1 FLU VACCINATION #7 TYPE CODE Y Y Y Introduced in 2010. Removed
2013.
XH1NTY8 MONOVALENT 2009 H1N1 FLU VACCINATION #8 TYPE CODE Y Y Y Introduced in 2010. Removed
2013.
XH1NTY9 MONOVALENT 2009 H1N1 FLU VACCINATION #9 TYPE CODE Y Y Y Introduced in 2010. Removed
2013.
XHEPTY1 HEPATITIS B-CONTAINING VACCINATION #1 TYPE CODE Y Y Y Y Y Y Y Y Y Y Y Y
XHEPTY2 HEPATITIS B-CONTAINING VACCINATION #2 TYPE CODE Y Y Y Y Y Y Y Y Y Y Y Y
XHEPTY3 HEPATITIS B-CONTAINING VACCINATION #3 TYPE CODE Y Y Y Y Y Y Y Y Y Y Y Y
XHEPTY4 HEPATITIS B-CONTAINING VACCINATION #4 TYPE CODE Y Y Y Y Y Y Y Y Y Y Y Y
XHEPTY5 HEPATITIS B-CONTAINING VACCINATION #5 TYPE CODE Y Y Y Y Y Y Y Y Y Y Y Y
XHEPTY6 HEPATITIS B-CONTAINING VACCINATION #6 TYPE CODE Y Y Y Y Y Y Y Y Y Y Y Y
XHEPTY7 HEPATITIS B-CONTAINING VACCINATION #7 TYPE CODE Y Y Y Y Y Y Y Y Y Y Y Y
XHEPTY8 HEPATITIS B-CONTAINING VACCINATION #8 TYPE CODE Y Y Y Y Y Y Y Y Y Y Y Y
XHEPTY9 HEPATITIS B-CONTAINING VACCINATION #9 TYPE CODE Y Y Y Y Y Y Y Y Y Y Y
Starting in 2005, nine shot variables are included for each vaccine category.
XHIBTY1 HIB-CONTAINING VACCINATION #1 TYPE CODE Y Y Y Y Y Y Y Y Y Y Y Y
XHIBTY2 HIB-CONTAINING VACCINATION #2 TYPE CODE Y Y Y Y Y Y Y Y Y Y Y Y

Data User’s Guide for the 2015 NIS Public-Use Data File APPENDIX E 161
Variable Name Variable Label† 2004 2005 2006 2007 2008 2009 2010 2011 2012 2013 2014 2015 Notes§
XHIBTY3 HIB-CONTAINING VACCINATION #3 TYPE CODE Y Y Y Y Y Y Y Y Y Y Y Y
XHIBTY4 HIB-CONTAINING VACCINATION #4 TYPE CODE Y Y Y Y Y Y Y Y Y Y Y Y
XHIBTY5 HIB-CONTAINING VACCINATION #5 TYPE CODE Y Y Y Y Y Y Y Y Y Y Y Y
XHIBTY6 HIB-CONTAINING VACCINATION #6 TYPE CODE Y Y Y Y Y Y Y Y Y Y Y Y
XHIBTY7 HIB-CONTAINING VACCINATION #7 TYPE CODE Y Y Y Y Y Y Y Y Y Y Y Y
XHIBTY8 HIB-CONTAINING VACCINATION #8 TYPE CODE Y Y Y Y Y Y Y Y Y Y Y Y
XHIBTY9 HIB-CONTAINING VACCINATION #9 TYPE CODE Y Y Y Y Y Y Y Y Y Y Y
Starting in 2005, nine shot variables are included for each vaccine category.
XMMRTY1 MEASLES-CONTAINING VACCINATION #1 TYPE CODE Y Y Y Y Y Y Y Y Y Y Y Y
XMMRTY2 MEASLES-CONTAINING VACCINATION #2 TYPE CODE Y Y Y Y Y Y Y Y Y Y Y Y
XMMRTY3 MEASLES-CONTAINING VACCINATION #3 TYPE CODE Y Y Y Y Y Y Y Y Y Y Y Y
XMMRTY4 MEASLES-CONTAINING VACCINATION #4 TYPE CODE Y Y Y Y Y Y Y Y Y Y Y Y
XMMRTY5 MEASLES-CONTAINING VACCINATION #5 TYPE CODE Y Y Y Y Y Y Y Y Y Y Y
Starting in 2005, nine shot variables are included for each vaccine category.
XMMRTY6 MEASLES-CONTAINING VACCINATION #6 TYPE CODE Y Y Y Y Y Y Y Y Y Y Y
Starting in 2005, nine shot variables are included for each vaccine category.
XMMRTY7 MEASLES-CONTAINING VACCINATION #7 TYPE CODE Y Y Y Y Y Y Y Y Y Y Y
Starting in 2005, nine shot variables are included for each vaccine category.
XMMRTY8 MEASLES-CONTAINING VACCINATION #8 TYPE CODE Y Y Y Y Y Y Y Y Y Y Y
Starting in 2005, nine shot variables are included for each vaccine category.
XMMRTY9 MEASLES-CONTAINING VACCINATION #9 TYPE CODE Y Y Y Y Y Y Y Y Y Y Y
Starting in 2005, nine shot variables are included for each vaccine category.
XPCVTY1 PNEUMOCOCCAL-CONTAINING VACCINATION #1 TYPE CODE Y Y Y Y Y Y Y Y Y Y Y Y
XPCVTY2 PNEUMOCOCCAL-CONTAINING VACCINATION #2 TYPE CODE Y Y Y Y Y Y Y Y Y Y Y Y
XPCVTY3 PNEUMOCOCCAL-CONTAINING VACCINATION #3 TYPE CODE Y Y Y Y Y Y Y Y Y Y Y Y

Data User’s Guide for the 2015 NIS Public-Use Data File APPENDIX E 162
Variable Name Variable Label† 2004 2005 2006 2007 2008 2009 2010 2011 2012 2013 2014 2015 Notes§
XPCVTY4 PNEUMOCOCCAL-CONTAINING VACCINATION #4 TYPE CODE Y Y Y Y Y Y Y Y Y Y Y Y
XPCVTY5 PNEUMOCOCCAL-CONTAINING VACCINATION #5 TYPE CODE Y Y Y Y Y Y Y Y Y Y Y Y
XPCVTY6 PNEUMOCOCCAL-CONTAINING VACCINATION #6 TYPE CODE Y Y Y Y Y Y Y Y Y Y Y Y
XPCVTY7 PNEUMOCOCCAL-CONTAINING VACCINATION #7 TYPE CODE Y Y Y Y Y Y Y Y Y Y Y Y
XPCVTY8 PNEUMOCOCCAL-CONTAINING VACCINATION #8 TYPE CODE Y Y Y Y Y Y Y Y Y Y Y Y
XPCVTY9 PNEUMOCOCCAL-CONTAINING VACCINATION #9 TYPE CODE Y Y Y Y Y Y Y Y Y Y Y
Starting in 2005, nine shot variables are included for each vaccine category.
XPOLTY1 POLIO-CONTAINING VACCINATION #1 TYPE CODE Y Y Y Y Y Y Y Y Y Y Y Y
XPOLTY2 POLIO-CONTAINING VACCINATION #2 TYPE CODE Y Y Y Y Y Y Y Y Y Y Y Y
XPOLTY3 POLIO-CONTAINING VACCINATION #3 TYPE CODE Y Y Y Y Y Y Y Y Y Y Y Y
XPOLTY4 POLIO-CONTAINING VACCINATION #4 TYPE CODE Y Y Y Y Y Y Y Y Y Y Y Y
XPOLTY5 POLIO-CONTAINING VACCINATION #5 TYPE CODE Y Y Y Y Y Y Y Y Y Y Y Y
XPOLTY6 POLIO-CONTAINING VACCINATION #6 TYPE CODE Y Y Y Y Y Y Y Y Y Y Y Y
XPOLTY7 POLIO-CONTAINING VACCINATION #7 TYPE CODE Y Y Y Y Y Y Y Y Y Y Y Y
XPOLTY8 POLIO-CONTAINING VACCINATION #8 TYPE CODE Y Y Y Y Y Y Y Y Y Y Y Y
XPOLTY9 POLIO-CONTAINING VACCINATION #9 TYPE CODE Y Y Y Y Y Y Y Y Y Y Y
Starting in 2005, nine shot variables are included for each vaccine category.
XROTTY1 ROTAVIRUS-CONTAINING VACCINATION #1 TYPE CODE Y Y Y Y Y Y Y Rotavirus vaccination types were
added to the IHQ starting 2009.
XROTTY2 ROTAVIRUS-CONTAINING VACCINATION #2 TYPE CODE Y Y Y Y Y Y Y Rotavirus vaccination types were
added to the IHQ starting 2009.
XROTTY3 ROTAVIRUS-CONTAINING VACCINATION #3 TYPE CODE Y Y Y Y Y Y Y Rotavirus vaccination types were
added to the IHQ starting 2009.
XROTTY4 ROTAVIRUS-CONTAINING VACCINATION #4 TYPE CODE Y Y Y Y Y Y Y Rotavirus vaccination types were
added to the IHQ starting 2009.
XROTTY5 ROTAVIRUS-CONTAINING VACCINATION #5 TYPE CODE Y Y Y Y Y Y Y Rotavirus vaccination types were
added to the IHQ starting 2009.
XROTTY6 ROTAVIRUS-CONTAINING VACCINATION #6 TYPE CODE Y Y Y Y Y Y Y Rotavirus vaccination types were
added to the IHQ starting 2009.

Data User’s Guide for the 2015 NIS Public-Use Data File APPENDIX E 163
Variable Name Variable Label† 2004 2005 2006 2007 2008 2009 2010 2011 2012 2013 2014 2015 Notes§
XROTTY7 ROTAVIRUS-CONTAINING VACCINATION #7 TYPE CODE Y Y Y Y Y Y Y Rotavirus vaccination types were
added to the IHQ starting 2009.
XROTTY8 ROTAVIRUS-CONTAINING VACCINATION #8 TYPE CODE Y Y Y Y Y Y Y Rotavirus vaccination types were
added to the IHQ starting 2009.
XROTTY9 ROTAVIRUS-CONTAINING VACCINATION #9 TYPE CODE Y Y Y Y Y Y Y Rotavirus vaccination types were
added to the IHQ starting 2009.
XVRCTY1 VARICELLA-CONTAINING VACCINATION #1 TYPE CODE Y Y Y Y Y Y Y Y Y Y Varicella vaccination types were
added to the IHQ starting 2006.
XVRCTY2 VARICELLA-CONTAINING VACCINATION #2 TYPE CODE Y Y Y Y Y Y Y Y Y Y Varicella vaccination types were
added to the IHQ starting 2006.
XVRCTY3 VARICELLA-CONTAINING VACCINATION #3 TYPE CODE Y Y Y Y Y Y Y Y Y Y Varicella vaccination types were
added to the IHQ starting 2006.
XVRCTY4 VARICELLA-CONTAINING VACCINATION #4 TYPE CODE Y Y Y Y Y Y Y Y Y Y Varicella vaccination types were
added to the IHQ starting 2006.
XVRCTY5 VARICELLA-CONTAINING VACCINATION #5 TYPE CODE Y Y Y Y Y Y Y Y Y Y Varicella vaccination types were
added to the IHQ starting 2006.
XVRCTY6 VARICELLA-CONTAINING VACCINATION #6 TYPE CODE Y Y Y Y Y Y Y Y Y Y Varicella vaccination types were
added to the IHQ starting 2006.
XVRCTY7 VARICELLA-CONTAINING VACCINATION #7 TYPE CODE Y Y Y Y Y Y Y Y Y Y Varicella vaccination types were
added to the IHQ starting 2006.
XVRCTY8 VARICELLA-CONTAINING VACCINATION #8 TYPE CODE Y Y Y Y Y Y Y Y Y Y Varicella vaccination types were
added to the IHQ starting 2006.
XVRCTY9 VARICELLA-CONTAINING VACCINATION #9 TYPE CODE Y Y Y Y Y Y Y Y Y Y Varicella vaccination types were
added to the IHQ starting 2006. YEAR YEAR OF INTERVIEW Y Y Y Y Y Y Y Y Y Y Y Y
* For a list of variables that appeared in one or more (but not all) NIS public-use data files from 1995-2004, see "Alphabetical Listing of Variables that are Not Available in All Public-Use Data Files, National Immunization Survey, 1995-2004": www.cdc.gov/nchs/data/nis/pufvariables1995to2004.pdf † If the variable appeared in the 2015 NIS public-use data file, then the 2015 label is given; otherwise the label from the most recent NIS public-use data file in which the variable appeared is given. § Starting in 2005, a code of 77 is used for "Don't Know" responses and a code of 99 is used for "Refused" responses.

Data User’s Guide for the 2015 NIS Public-Use Data File Appendix F
164
Appendix F: Summary Tables
Table F.1: Estimated Population Totals and Sample Sizes of Children 19-35 Months of Age by State and Estimation Area, National Immunization Survey, 2015
State/Estimation Area ESTIAP
Estimated Population Total
of Children
Number of Children
with Complete Household Interviews
Number of Children
with Adequate Provider
Data
Percent of
Children with
Adequate Provider
Data U.S. National* 5,701,540 26,975 15,167 56.2 Alabama 20 84,042 494 272 55.1 Alaska 74 15,312 498 295 59.2 Arizona 66 125,139 479 266 55.5 Arkansas 46 54,196 419 229 54.7 California 68 724,480 646 345 53.4 Colorado 60 95,511 440 246 55.9 Connecticut 1 54,156 469 250 53.3 Delaware 13 15,717 410 232 56.6 District of Columbia 12 12,398 576 321 55.7 Florida 22 315,014 546 273 50.0 Georgia 25 186,272 540 286 53.0 Hawaii 72 25,966 469 261 55.7 Idaho 75 30,723 342 209 61.1 Illinois 222,542 985 559 56.8 IL-City of Chicago 35 56,511 320 188 58.8 IL-Rest of State 34 166,031 665 371 55.8 Indiana 36 121,057 426 231 54.2 Iowa 56 55,273 444 279 62.8 Kansas 57 58,367 367 228 62.1 Kentucky 27 78,299 437 241 55.1 Louisiana 47 88,669 427 223 52.2 Maine 4 18,614 386 221 57.3 Maryland 14 105,465 658 361 54.9 Massachusetts 2 102,930 521 307 58.9 Michigan 38 162,007 427 254 59.5 Minnesota 40 100,888 521 289 55.5 Mississippi 28 54,235 464 233 50.2 Missouri 58 106,677 401 226 56.4 Montana 61 17,101 390 251 64.4 Nebraska 59 37,665 374 231 61.8 Nevada 73 51,393 377 214 56.8 New Hampshire 5 19,116 372 195 52.4 New Jersey 8 153,667 557 272 48.8

Data User’s Guide for the 2015 NIS Public-Use Data File Appendix F
165
State/Estimation Area ESTIAP
Estimated Population Total
of Children
Number of Children
with Complete Household Interviews
Number of Children
with Adequate Provider
Data
Percent of
Children with
Adequate Provider
Data New Mexico 49 39,050 400 244 61.0 New York 334,940 1,119 566 50.6 NY-City of New York 11 167,965 564 291 51.6 NY-Rest of State 10 166,975 555 275 49.5 North Carolina 29 173,795 483 261 54.0 North Dakota 62 15,262 398 234 58.8 Ohio 41 198,461 418 219 52.4 Oklahoma 50 75,920 376 220 58.5 Oregon 76 67,036 341 192 56.3 Pennsylvania 204,792 1,039 575 55.3 PA-Philadelphia County 17 33,050 487 272 55.9 PA-Rest of State 16 171,741 552 303 54.9 Rhode Island 6 16,313 463 272 58.7 South Carolina 30 82,138 487 259 53.2 South Dakota 63 17,989 399 219 54.9 Tennessee 31 117,280 372 210 56.5 Texas 568,417 2,586 1,500 58.0 TX-Bexar County 55 39,136 428 224 52.3 TX-City of Houston 54 71,255 360 214 59.4 TX-El Paso County 53 20,393 348 211 60.6 TX-Hidalgo County 107 23,985 370 255 68.9 TX-Rest of State 51 413,647 1,080 596 55.2 Utah 64 73,266 379 247 65.2 Vermont 7 8,540 409 262 64.1 Virginia 18 149,556 655 373 56.9 Washington 77 127,236 526 309 58.7 West Virginia 19 29,917 453 241 53.2 Wisconsin 44 98,535 389 245 63.0 Wyoming 65 10,205 421 219 52.0 U.S. Virgin Islands 95 1,956 580 327 56.4 Guam 105 5,058 467 282 60.4 Puerto Rico 106 50,148 617 224 36.3
*Excludes territories.

Data User’s Guide for the 2015 NIS Public-Use Data File Appendix F
166
Table F.2: Estimated Population Totals and Sample Sizes for Age Group by Maternal Education, National Immunization Survey, 2015
Age Group in Months Maternal Education
Children with
Completed Household Interviews*
Unweighted Completes
Children with
Completed Household Interviews*
Weighted
Completes†
Children with
Adequate Provider
Data*
Unweighted Completes
Children with
Adequate Provider
Data*
Weighted Completes§
19-23 <12 Years 756 273,432 469 263,247 19-23 12 Years 1,424 448,449 807 457,944
19-23 >12, Non College Graduate 1,947 389,501 1,082 399,633
19-23 College Grad 3,527 607,050 1,980 597,607 24-29 <12 Years 814 298,700 482 303,578 24-29 12 Years 1,505 484,913 833 473,346
24-29 >12, Non College Graduate 2,112 465,164 1,175 477,178
24-29 College Grad 3,688 668,547 2,132 663,221 30-35 <12 Years 1,113 325,879 692 334,888 30-35 12 Years 2,038 552,154 1,129 550,668
30-35 >12, Non College Graduate 2,907 466,162 1,517 441,571
30-35 College Grad 5,144 721,590 2,869 738,657 Total 26,975 5,701,540 15,167 5,701,540
* Excludes territories. † Weighted by RDDWT_D. § Weighted by PROVWT_D.

Data User’s Guide for the 2015 NIS Public-Use Data File Appendix F
167
Table F.3: Estimated Population Totals and Sample Sizes for Age Group by Poverty Status, National Immunization Survey, 2015
Age Group in Months Poverty Status
Children with
Completed Household Interviews*
Unweighted Completes
Children with
Completed Household Interviews*
Weighted
Completes†
Children with
Adequate Provider
Data*
Unweighted Completes
Children with
Adequate Provider
Data*
Weighted Completes§
19-23 Months Above poverty, > $75K 2,795 474,404 1,591 482,155 19-23 Months Above poverty, <= $75K 2,621 551,486 1,470 563,074 19-23 Months Below poverty 1,797 574,338 1,103 550,792 19-23 Months Unknown 441 118,203 174 122,411 24-29 Months Above poverty, > $75K 3,025 573,078 1,737 562,122 24-29 Months Above poverty, <= $75K 2,751 594,221 1,534 599,758 24-29 Months Below poverty 1,954 633,207 1,211 662,296 24-29 Months Unknown 389 116,817 140 93,148 30-35 Months Above poverty, > $75K 4,248 611,297 2,400 620,955 30-35 Months Above poverty, <= $75K 3,754 660,064 2,003 667,292 30-35 Months Below poverty 2,602 668,741 1,589 661,362 30-35 Months Unknown 598 125,682 215 116,176 Total 26,975 5,701,540 15,167 5,701,540 * Excludes territories. † Weighted by RDDWT_D. § Weighted by PROVWT_D.

Data User’s Guide for the 2015 NIS Public-Use Data File Appendix F
168
Table F.4: Estimated Population Totals and Sample Sizes for Race/Ethnicity by Poverty Status, National Immunization Survey, 2015
Race/Ethnicity† Poverty Status
Children with
Completed Household Interviews*
Unweighted Completes
Children with
Completed Household Interviews*
Weighted
Completes§
Children with
Adequate Provider
Data*
Unweighted Completes
Children with
Adequate Provider
Data*
Weighted Completes¶
Hispanic Above poverty, > $75K 1,027 196,447 538 187,381 Hispanic Above poverty, <= $75K 1,723 399,792 951 415,299 Hispanic Below poverty 2,495 803,584 1,639 812,944 Hispanic Unknown 396 118,051 193 105,048 Non-Hispanic White Only Above poverty, > $75K 7,119 1,140,847 4,135 1,160,642 Non-Hispanic White Only Above poverty, <= $75K 5,341 968,219 3,015 989,306 Non-Hispanic White Only Below poverty 1,873 475,946 1,133 491,212 Non-Hispanic White Only Unknown 642 140,748 190 116,712 Non-Hispanic Black Only Above poverty, > $75K 522 95,321 239 84,766 Non-Hispanic Black Only Above poverty, <= $75K 903 224,090 417 206,887 Non-Hispanic Black Only Below poverty 1,128 380,213 616 358,192 Non-Hispanic Black Only Unknown 201 55,529 80 66,075 Non-Hispanic Other & Multi-Racial Above poverty, > $75K 1,400 226,163 816 232,443 Non-Hispanic Other & Multi-Racial Above poverty, <= $75K 1,159 213,670 624 218,630 Non-Hispanic Other & Multi-Racial Below poverty 857 216,544 515 212,101 Non-Hispanic Other & Multi-Racial Unknown 189 46,374 66 43,900 Total 26,975 5,701,540 15,167 5,701,540
* Excludes territories. † Race/Ethnicity is self-reported and mutually exclusive. § Weighted by RDDWT_D. ¶ Weighted by PROVWT_D.
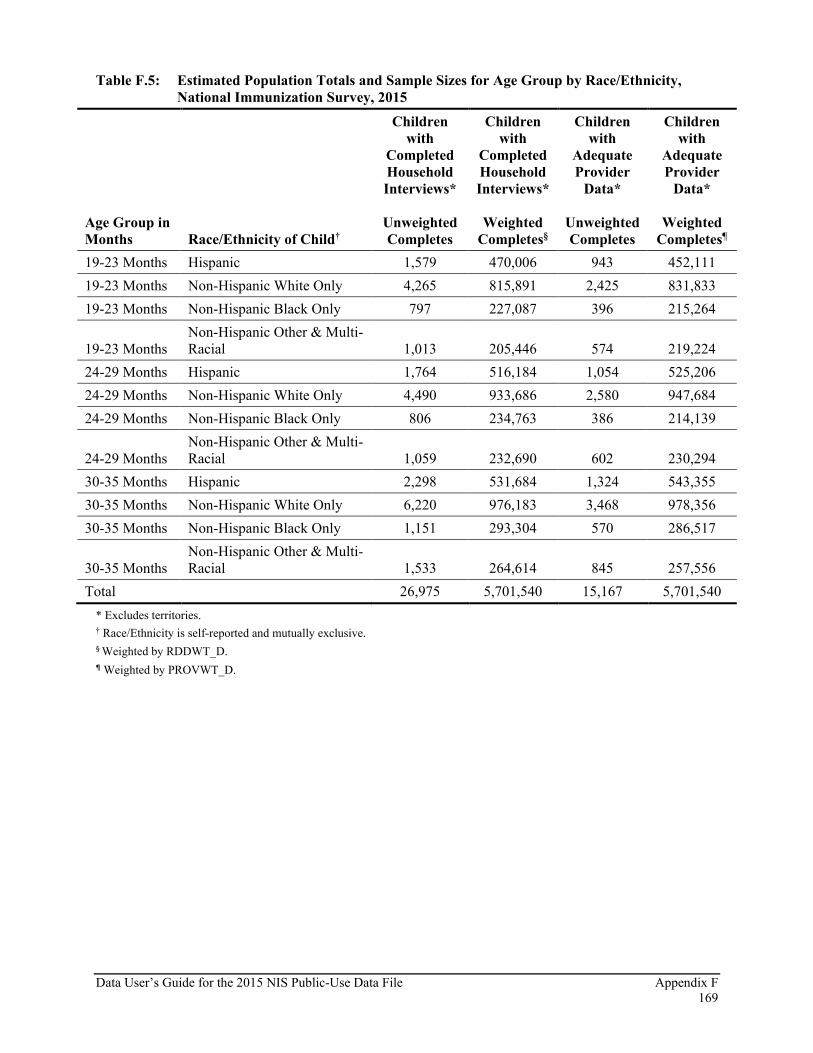
Data User’s Guide for the 2015 NIS Public-Use Data File Appendix F
169
Table F.5: Estimated Population Totals and Sample Sizes for Age Group by Race/Ethnicity, National Immunization Survey, 2015
Age Group in Months Race/Ethnicity of Child†
Children with
Completed Household Interviews*
Unweighted Completes
Children with
Completed Household Interviews*
Weighted
Completes§
Children with
Adequate Provider
Data*
Unweighted Completes
Children with
Adequate Provider
Data*
Weighted Completes¶
19-23 Months Hispanic 1,579 470,006 943 452,111 19-23 Months Non-Hispanic White Only 4,265 815,891 2,425 831,833 19-23 Months Non-Hispanic Black Only 797 227,087 396 215,264
19-23 Months Non-Hispanic Other & Multi-Racial 1,013 205,446 574 219,224
24-29 Months Hispanic 1,764 516,184 1,054 525,206 24-29 Months Non-Hispanic White Only 4,490 933,686 2,580 947,684 24-29 Months Non-Hispanic Black Only 806 234,763 386 214,139
24-29 Months Non-Hispanic Other & Multi-Racial 1,059 232,690 602 230,294
30-35 Months Hispanic 2,298 531,684 1,324 543,355 30-35 Months Non-Hispanic White Only 6,220 976,183 3,468 978,356 30-35 Months Non-Hispanic Black Only 1,151 293,304 570 286,517
30-35 Months Non-Hispanic Other & Multi-Racial 1,533 264,614 845 257,556
Total 26,975 5,701,540 15,167 5,701,540 * Excludes territories. † Race/Ethnicity is self-reported and mutually exclusive. § Weighted by RDDWT_D. ¶ Weighted by PROVWT_D.

Data User’s Guide for the 2015 NIS Public-Use Data File Appendix F
170
Table F.6: Estimated Population Totals and Sample Sizes for Age Group by Gender, National Immunization Survey, 2015
Age Group in Months Gender
Children with
Completed Household Interviews*
Unweighted Completes
Children with
Completed Household Interviews*
Weighted
Completes†
Children with
Adequate Provider
Data*
Unweighted Completes
Children with
Adequate Provider
Data*
Weighted Completes§
19-23 Months Male 4,032 907,683 2,280 896,588 19-23 Months Female 3,622 810,748 2,058 821,844 24-29 Months Male 4,199 960,425 2,411 975,049 24-29 Months Female 3,920 956,899 2,211 942,274 30-35 Months Male 5,696 1,048,592 3,210 1,045,063 30-35 Months Female 5,506 1,017,193 2,997 1,020,722 Total 26,975 5,701,540 15,167 5,701,540
* Excludes territories. † Weighted by RDDWT_D. § Weighted by PROVWT_D.

Data User’s Guide for the 2015 NIS Public-Use Data File Appendix F
171
Table F.7: Estimated Vaccination Coverage* with Individual Vaccines and Selected Vaccination Series Among Children 19-35 Months of Age by State and Estimation Area, National Immunization Survey Q1/2015-Q4/2015†
≥4 DTaP§ ≥3 Polio¶ ≥1 MMR** Hib-FS†† ≥3 HepB¶¶ HepB Birth Dose ≥1 HepA ≥1 Var*** ≥4 PCV††† Rotavirus 4:3:1:3*:3:1:4§§§ U.S. National¶¶¶ 84.6 ± 1.1 93.7 ± 0.6 91.9 ± 0.8 82.7 ± 1.1 92.6 ± 0.7 72.4 ± 1.4 85.8 ± 1.1 91.8 ± 0.8 84.1 ± 1.1 73.2 ± 1.4 72.2 ± 1.4 Alabama 82.2 ± 6.4 95.1 ± 2.9 95.2 ± 3.5 83.3 ± 5.9 92.4 ± 3.9 83.2 ± 5.4 88.9 ± 5.2 92.9 ± 4.2 85.7 ± 5.5 76.2 ± 6.9 70.6 ± 7.1 Alaska 79.7 ± 5.2 91.9 ± 3.4 89.7 ± 4.0 81.6 ± 5.0 90.5 ± 3.7 65.7 ± 6.1 83.5 ± 4.9 81.8 ± 5.3 80.3 ± 5.2 72.0 ± 5.9 66.3 ± 6.2 Arizona 83.7 ± 5.8 92.4 ± 3.9 90.6 ± 4.1 85.5 ± 5.3 90.1 ± 4.2 78.0 ± 6.0 87.2 ± 5.1 92.7 ± 3.7 81.7 ± 5.8 75.1 ± 6.6 72.3 ± 6.7 Arkansas 76.4 ± 6.9 91.9 ± 4.4 90.2 ± 5.0 75.5 ± 6.9 94.4 ± 3.1 80.6 ± 6.2 85.1 ± 5.9 89.1 ± 5.2 76.1 ± 6.8 68.2 ± 7.4 66.6 ± 7.5 California 85.2 ± 5.7 96.3 ± 2.4 92.8 ± 3.9 85.2 ± 5.5 94.3 ± 3.4 69.1 ± 7.4 87.9 ± 5.4 93.4 ± 3.8 86.2 ± 5.4 74.6 ± 7.1 75.0 ± 6.9 Colorado 86.1 ± 5.0 92.7 ± 4.1 93.6 ± 3.6 83.6 ± 5.4 92.1 ± 4.1 73.1 ± 6.4 86.9 ± 5.0 92.5 ± 3.9 87.4 ± 4.9 75.9 ± 6.5 75.4 ± 6.2 Connecticut 90.8 ± 4.5 97.9 ± 1.8 97.5 ± 2.4 89.0 ± 5.0 97.3 ± 2.3 81.8 ± 6.2 97.3 ± 2.2 96.8 ± 2.3 91.5 ± 4.6 77.9 ± 6.7 80.6 ± 6.0 Delaware 89.9 ± 4.5 97.0 ± 2.7 97.2 ± 2.6 85.5 ± 5.5 95.1 ± 3.4 76.0 ± 6.7 96.1 ± 2.8 95.8 ± 3.1 90.8 ± 4.4 81.5 ± 6.1 79.3 ± 6.1 Dist. of Columbia 86.1 ± 5.0 90.9 ± 4.3 92.4 ± 3.8 85.4 ± 5.2 89.4 ± 4.6 72.7 ± 5.8 93.3 ± 3.6 94.4 ± 3.3 89.9 ± 4.7 73.0 ± 6.2 76.3 ± 6.0 Florida 86.0 ± 5.2 93.9 ± 3.4 90.4 ± 5.0 86.0 ± 5.2 90.4 ± 4.4 56.9 ± 7.6 77.7 ± 6.1 93.0 ± 3.4 85.9 ± 5.3 63.8 ± 7.5 66.6 ± 7.2 Georgia 82.3 ± 6.0 91.9 ± 4.3 90.5 ± 4.7 83.5 ± 6.0 94.2 ± 3.7 80.5 ± 5.7 88.2 ± 5.1 89.5 ± 5.0 84.8 ± 5.6 73.8 ± 7.0 75.6 ± 6.7 Hawaii 83.2 ± 5.4 93.7 ± 3.5 94.7 ± 3.3 82.8 ± 5.4 91.8 ± 3.6 75.5 ± 6.3 87.5 ± 4.6 91.6 ± 3.9 80.6 ± 5.8 72.5 ± 6.4 73.8 ± 6.3 Idaho 81.0 ± 5.9 88.9 ± 4.9 91.2 ± 4.0 81.2 ± 5.9 89.8 ± 4.6 69.8 ± 6.9 87.2 ± 4.9 88.5 ± 4.6 84.4 ± 5.5 74.5 ± 6.6 71.6 ± 6.8 Illinois 85.0 ± 3.8 93.3 ± 2.5 91.6 ± 2.8 82.7 ± 3.8 93.2 ± 2.3 71.2 ± 4.6 83.9 ± 3.7 91.7 ± 2.7 83.9 ± 3.9 75.4 ± 4.5 70.8 ± 4.7
IL-City of Chicago 86.2 ± 5.9 92.0 ± 4.3 90.5 ± 4.7 84.1 ± 6.1 87.7 ± 5.1 82.9 ± 5.9 86.4 ± 5.4 92.2 ± 4.4 84.5 ± 5.9 78.3 ± 6.8 72.8 ± 7.3 IL-Rest of State 84.6 ± 4.6 93.7 ± 3.0 91.9 ± 3.4 82.3 ± 4.6 95.1 ± 2.5 67.2 ± 5.8 83.1 ± 4.6 91.6 ± 3.3 83.8 ± 4.8 74.4 ± 5.5 70.1 ± 5.8
Indiana 85.3 ± 5.7 94.9 ± 3.4 92.0 ± 4.4 83.3 ± 5.9 91.7 ± 4.6 80.0 ± 6.3 89.2 ± 5.1 94.1 ± 3.8 83.4 ± 6.0 72.6 ± 7.2 74.7 ± 7.0 Iowa 88.9 ± 4.0 95.9 ± 2.4 95.5 ± 2.4 90.0 ± 3.5 96.3 ± 2.1 78.2 ± 5.3 86.7 ± 4.5 92.1 ± 3.6 88.1 ± 4.3 75.1 ± 5.9 77.9 ± 5.5 Kansas 86.8 ± 4.7 94.9 ± 3.3 92.3 ± 4.1 84.6 ± 5.1 95.7 ± 2.8 83.3 ± 5.4 90.3 ± 4.1 92.8 ± 3.5 86.2 ± 5.0 77.0 ± 6.3 75.2 ± 6.3 Kentucky 87.0 ± 4.8 94.9 ± 2.7 91.6 ± 4.1 83.5 ± 5.2 92.9 ± 3.9 75.3 ± 6.7 74.0 ± 6.5 95.7 ± 2.6 86.1 ± 4.8 65.3 ± 7.1 73.0 ± 6.5 Louisiana 84.4 ± 5.7 94.6 ± 3.0 92.6 ± 4.3 77.2 ± 7.0 94.8 ± 2.9 75.3 ± 7.1 84.8 ± 6.0 93.4 ± 3.9 84.2 ± 5.8 67.7 ± 7.6 70.8 ± 7.6 Maine 92.0 ± 5.0 95.0 ± 4.1 96.0 ± 3.1 84.5 ± 6.6 88.9 ± 5.4 68.7 ± 7.7 81.0 ± 6.8 93.8 ± 3.6 84.9 ± 6.5 71.1 ± 7.7 71.8 ± 7.9 Maryland 87.6 ± 4.5 94.4 ± 3.4 95.4 ± 2.5 87.0 ± 4.8 94.0 ± 3.4 79.0 ± 6.6 93.1 ± 3.2 91.5 ± 3.8 89.5 ± 4.2 76.8 ± 6.4 76.8 ± 5.9 Massachusetts 87.2 ± 5.1 96.9 ± 2.2 91.8 ± 4.0 86.6 ± 5.3 96.0 ± 2.3 78.4 ± 5.8 84.9 ± 5.2 92.0 ± 4.0 87.2 ± 5.0 83.5 ± 5.4 78.5 ± 6.0 Michigan 84.9 ± 5.5 92.9 ± 4.0 90.6 ± 4.5 79.5 ± 6.2 93.5 ± 3.8 80.0 ± 5.9 86.5 ± 5.1 89.5 ± 4.7 80.5 ± 6.3 65.5 ± 7.7 67.6 ± 7.3 Minnesota 85.4 ± 5.0 94.5 ± 3.1 92.6 ± 3.6 83.2 ± 5.3 94.7 ± 2.9 67.8 ± 6.5 90.4 ± 4.2 93.4 ± 3.2 86.6 ± 5.1 82.6 ± 5.4 73.2 ± 6.4 Mississippi 79.6 ± 7.0 92.0 ± 5.3 89.8 ± 5.3 74.3 ± 7.5 92.9 ± 4.7 77.0 ± 7.3 71.6 ± 7.5 89.2 ± 5.7 78.0 ± 7.2 65.9 ± 8.0 70.6 ± 7.5 Missouri 82.6 ± 6.3 90.8 ± 5.0 91.6 ± 4.3 82.7 ± 6.3 91.4 ± 4.6 75.0 ± 7.4 84.1 ± 5.7 92.4 ± 4.1 83.4 ± 6.2 76.1 ± 7.0 71.0 ± 7.4 Montana 78.6 ± 6.5 91.1 ± 3.9 91.7 ± 3.7 81.2 ± 5.7 91.3 ± 4.0 73.8 ± 6.5 76.4 ± 6.6 89.1 ± 4.2 75.6 ± 6.7 67.3 ± 7.0 68.1 ± 7.1 Nebraska 86.9 ± 5.0 97.4 ± 2.0 95.6 ± 3.0 85.5 ± 4.8 93.7 ± 3.2 72.5 ± 6.8 93.4 ± 3.0 94.4 ± 2.9 87.1 ± 4.5 73.0 ± 6.4 73.8 ± 6.3 Nevada 84.7 ± 5.7 92.3 ± 4.1 93.7 ± 3.7 81.7 ± 5.9 91.4 ± 4.5 77.7 ± 6.8 90.2 ± 4.6 92.9 ± 4.0 82.4 ± 6.1 65.5 ± 7.6 71.3 ± 7.0 New Hampshire 88.4 ± 5.4 96.9 ± 2.6 93.4 ± 3.9 88.7 ± 5.2 95.8 ± 3.4 72.0 ± 7.0 85.6 ± 5.7 89.6 ± 5.0 86.8 ± 5.9 80.9 ± 6.2 74.1 ± 7.1 New Jersey 89.8 ± 4.8 93.1 ± 4.0 92.8 ± 4.4 87.6 ± 5.3 93.9 ± 3.7 63.9 ± 7.2 84.2 ± 5.5 93.0 ± 4.2 86.8 ± 4.9 75.2 ± 6.8 76.5 ± 6.5 New Mexico 84.8 ± 6.0 93.7 ± 3.7 89.7 ± 5.3 79.0 ± 6.8 91.9 ± 4.4 67.8 ± 7.5 85.9 ± 6.3 86.4 ± 6.1 82.9 ± 5.9 73.8 ± 6.9 70.1 ± 7.9 New York 87.4 ± 3.3 94.9 ± 2.0 92.5 ± 2.6 81.8 ± 3.9 93.8 ± 2.2 59.0 ± 4.7 80.9 ± 4.0 93.4 ± 2.4 82.7 ± 3.8 73.0 ± 4.5 71.9 ± 4.4
NY-City of New York 85.5 ± 5.0 93.7 ± 3.1 94.1 ± 2.9 80.1 ± 5.7 94.1 ± 2.9 53.4 ± 6.8 81.2 ± 5.6 94.1 ± 2.9 76.6 ± 6.0 71.1 ± 6.4 68.2 ± 6.5 NY-Rest of State 89.2 ± 4.3 96.0 ± 2.6 90.9 ± 4.3 83.5 ± 5.4 93.6 ± 3.3 64.6 ± 6.6 80.5 ± 5.6 92.8 ± 3.7 88.9 ± 4.4 75.0 ± 6.4 75.7 ± 6.1

Data User’s Guide for the 2015 NIS Public-Use Data File Appendix F
172
≥4 DTaP§ ≥3 Polio¶ ≥1 MMR** Hib-FS†† ≥3 HepB¶¶ HepB Birth Dose ≥1 HepA ≥1 Var*** ≥4 PCV††† Rotavirus 4:3:1:3*:3:1:4§§§ North Carolina 83.9 ± 5.8 94.1 ± 3.8 94.3 ± 3.3 83.6 ± 5.6 93.4 ± 4.0 81.3 ± 6.0 83.7 ± 5.8 92.7 ± 3.8 82.2 ± 5.9 75.9 ± 6.7 76.4 ± 6.5 North Dakota 85.7 ± 5.1 96.7 ± 2.2 92.8 ± 3.8 85.6 ± 5.1 96.0 ± 2.5 87.5 ± 4.7 91.9 ± 3.6 95.3 ± 2.7 91.2 ± 4.1 79.8 ± 6.2 80.2 ± 5.7 Ohio 80.9 ± 6.8 91.8 ± 4.5 88.1 ± 5.6 78.6 ± 7.0 92.3 ± 4.3 77.9 ± 6.5 79.9 ± 7.4 86.2 ± 6.0 79.1 ± 6.9 71.8 ± 7.6 68.3 ± 7.9 Oklahoma 85.7 ± 6.3 92.4 ± 5.0 92.6 ± 5.1 83.7 ± 6.4 94.0 ± 4.2 80.4 ± 5.9 93.2 ± 4.9 93.6 ± 4.9 82.7 ± 6.4 67.2 ± 8.3 75.4 ± 7.3 Oregon 85.8 ± 5.7 93.4 ± 3.8 94.1 ± 3.7 79.1 ± 6.9 93.7 ± 3.7 72.5 ± 7.0 91.8 ± 4.0 93.0 ± 3.7 81.8 ± 6.4 72.9 ± 7.3 67.4 ± 7.8 Pennsylvania 88.7 ± 3.8 93.1 ± 3.2 90.9 ± 3.7 84.1 ± 4.7 91.9 ± 3.2 73.2 ± 6.0 86.1 ± 4.7 90.4 ± 4.0 88.6 ± 4.0 74.3 ± 5.9 72.8 ± 5.8
PA-Philadelphia County 87.2 ± 4.5 95.0 ± 2.5 93.2 ± 3.5 84.8 ± 4.8 93.4 ± 3.1 77.3 ± 6.1 93.9 ± 3.0 96.1 ± 2.4 82.3 ± 5.5 71.5 ± 6.4 76.1 ± 6.0 PA-Rest of State 88.9 ± 4.4 92.7 ± 3.8 90.5 ± 4.4 84.0 ± 5.6 91.6 ± 3.7 72.5 ± 7.0 84.6 ± 5.6 89.3 ± 4.7 89.8 ± 4.6 74.9 ± 6.9 72.2 ± 6.8
Rhode Island 90.5 ± 4.1 97.2 ± 2.2 94.5 ± 3.2 85.2 ± 5.4 96.2 ± 2.4 73.2 ± 6.4 93.1 ± 3.7 95.1 ± 3.0 90.4 ± 4.3 87.6 ± 4.9 77.2 ± 6.0 South Carolina 77.5 ± 7.0 91.3 ± 4.8 88.5 ± 5.1 76.1 ± 6.6 90.2 ± 4.9 68.9 ± 7.0 81.8 ± 5.9 91.0 ± 4.6 82.0 ± 6.1 69.8 ± 7.1 68.2 ± 7.3 South Dakota 83.1 ± 6.0 93.6 ± 4.2 91.4 ± 4.8 82.0 ± 6.2 91.8 ± 4.8 71.4 ± 7.3 77.6 ± 6.6 90.3 ± 4.9 84.2 ± 5.9 73.4 ± 7.0 75.6 ± 6.8 Tennessee 81.2 ± 6.5 91.8 ± 4.2 90.2 ± 4.8 81.1 ± 6.5 91.2 ± 4.6 64.7 ± 7.9 89.0 ± 5.2 89.7 ± 4.9 83.0 ± 6.3 70.9 ± 7.6 70.1 ± 7.5 Texas 82.1 ± 3.6 92.5 ± 2.5 92.5 ± 2.4 80.4 ± 3.7 90.7 ± 2.9 76.4 ± 3.9 90.7 ± 2.9 92.3 ± 2.4 83.3 ± 3.3 75.7 ± 3.9 71.2 ± 4.2
TX-Bexar County 80.1 ± 6.1 92.0 ± 4.3 89.2 ± 5.0 78.3 ± 6.3 89.3 ± 4.8 72.5 ± 6.7 90.0 ± 4.6 89.4 ± 4.8 78.9 ± 6.3 70.7 ± 7.0 67.5 ± 7.1 TX-City of Houston 80.5 ± 6.5 93.9 ± 4.0 92.8 ± 3.9 77.7 ± 6.8 89.2 ± 5.2 82.6 ± 5.7 89.6 ± 4.9 91.9 ± 4.3 84.1 ± 5.9 74.8 ± 6.8 70.5 ± 7.3 TX-El Paso County 82.8 ± 6.1 91.2 ± 4.2 90.6 ± 4.5 83.8 ± 5.7 90.5 ± 4.3 76.5 ± 7.0 92.9 ± 3.8 91.9 ± 4.3 84.8 ± 5.8 73.4 ± 7.1 71.6 ± 7.1 TX-Hidalgo County 82.4 ± 5.8 91.9 ± 4.5 86.9 ± 5.2 81.3 ± 5.9 90.5 ± 4.7 89.5 ± 4.8 90.7 ± 4.3 90.6 ± 4.8 85.3 ± 5.5 73.1 ± 6.4 71.6 ± 6.5 TX-Rest of State 82.5 ± 4.8 92.4 ± 3.3 93.3 ± 3.1 80.9 ± 4.8 91.1 ± 3.8 74.9 ± 5.2 90.8 ± 3.8 92.7 ± 3.2 83.4 ± 4.4 76.6 ± 5.1 71.6 ± 5.6
Utah 82.0 ± 5.8 92.2 ± 4.3 89.2 ± 5.2 79.3 ± 6.2 91.7 ± 4.3 79.6 ± 6.0 86.2 ± 5.5 88.8 ± 5.0 78.3 ± 6.6 74.5 ± 6.7 68.1 ± 7.3 Vermont 89.2 ± 4.2 94.6 ± 2.9 95.5 ± 2.7 86.8 ± 4.8 93.6 ± 3.3 49.4 ± 6.7 82.7 ± 5.0 91.5 ± 3.5 89.7 ± 4.3 72.7 ± 6.2 75.6 ± 5.9 Virginia 80.6 ± 7.0 90.2 ± 5.2 83.4 ± 6.7 73.9 ± 7.7 87.8 ± 5.7 67.3 ± 8.1 76.9 ± 7.5 84.2 ± 6.6 75.3 ± 7.6 67.1 ± 8.3 64.4 ± 8.3 Washington 87.3 ± 4.7 92.9 ± 3.5 95.3 ± 2.6 87.2 ± 4.7 91.4 ± 3.5 71.2 ± 6.2 89.2 ± 3.9 92.9 ± 3.1 86.5 ± 4.9 73.6 ± 6.3 77.1 ± 5.7 West Virginia 78.6 ± 6.8 90.9 ± 4.9 86.7 ± 5.7 75.4 ± 7.1 92.6 ± 4.5 68.3 ± 7.4 85.7 ± 6.0 85.9 ± 5.7 82.9 ± 6.2 69.6 ± 7.5 64.9 ± 7.8 Wisconsin 85.2 ± 5.7 93.1 ± 3.9 92.4 ± 4.3 77.3 ± 6.4 90.1 ± 4.6 73.1 ± 6.6 81.4 ± 6.1 90.3 ± 4.5 83.2 ± 5.7 75.3 ± 6.7 68.8 ± 7.1 Wyoming 83.2 ± 6.1 96.2 ± 2.4 93.5 ± 3.5 82.1 ± 6.0 95.9 ± 2.5 67.2 ± 7.3 73.0 ± 6.8 91.2 ± 4.1 83.5 ± 5.8 76.4 ± 6.6 73.3 ± 7.1 U.S. Virgin Islands 65.8 ± 6.3 81.5 ± 5.1 77.2 ± 5.5 62.3 ± 6.5 85.5 ± 4.5 79.4 ± 5.3 73.3 ± 5.6 79.6 ± 5.1 61.6 ± 6.4 43.3 ± 6.9 50.7 ± 6.7 Guam 73.3 ± 6.1 85.5 ± 4.7 91.7 ± 3.6 64.0 ± 6.7 85.8 ± 4.8 82.3 ± 5.0 87.0 ± 4.4 78.7 ± 5.8 66.4 ± 6.9 40.6 ± 6.5 52.9 ± 7.0 Puerto Rico 82.0 ± 5.8 92.6 ± 3.5 91.4 ± 3.9 71.9 ± 7.5 86.6 ± 5.8 72.7 ± 7.6 85.7 ± 5.6 92.1 ± 3.8 73.4 ± 6.7 64.9 ± 7.6 61.0 ± 8.1
* Estimates presented as point estimate (%) ± 95% Confidence Interval. Estimate=NA (Not Available) if the unweighted sample size for the denominator was < 30, or (CI half width)/Estimate > 0.588, or (CI half width) >10. † Children in the Q1/2015-Q4/2015 National Immunization Survey were born from January 2012 through May 2014. § 4 or more doses of DTaP. ¶ 3 or more doses of any poliovirus vaccine. ** 1 or more doses of measles-mumps-rubella vaccine †† 4 or more doses of Haemophilus influenzae type b (Hib) vaccine of any type or 2 doses of Hib of Merck types followed by 1+ dose of Hib of any type. ¶¶ 3 or more doses of hepatitis B vaccine. *** 1 or more doses of varicella at or after child’s first birthday, unadjusted for history of varicella illness. ††† 4 or more doses of PCV. §§§ 4 or more doses of DTaP, 3 or more doses of any poliovirus vaccine, 1 or more doses of measles-containing vaccine, full series Hib vaccine, 3 or more doses of HepB, 1 or more doses of varicella vaccine, and 4 or more doses of PCV. ¶¶¶ U.S. national estimates exclude territories.

Data User’s Guide for the 2015 NIS Public-Use Data File APPENDIX G
173
Appendix G: Trends in NIS Response Rates and Vaccination Coverage Rates, 1995-2015
Table G.1: Key Indicators* from Landline Sample Household and Provider Data Collection by Survey Year, National Immunization Survey, 1995-2015†
Survey Year
Resolution Rate (%)
Screener Completion
Rate (%)
Interview Completion
Rate (%)
CASRO Response Rate
(%)
Children with Adequate
Provider Data (%)
1995 96.5 96.4 93.5 87.1 50.6 1996 94.3 96.8 94.0 85.8 63.4 1997 92.1 97.9 93.8 84.6 69.7 1998 90.4 97.8 93.6 82.7 67.1 1999 88.6 97.0 93.4 80.2 65.4 2000 88.1 96.0 93.1 78.7 67.4 2001 86.8 96.2 91.1 76.1 70.4 2002 84.8 96.6 90.6 74.2 67.6 2003 83.6 94.0 88.7 69.8 68.9 2004 83.8 94.8 92.0 73.1 71.0 2005 83.3 92.8 84.2 65.1 63.6 2006 83.3 90.5 85.6 64.5 70.4 2007 82.9 90.2 86.8 64.9 68.6 2008 82.3 90.3 85.1 63.2 71.0 2009 82.9 92.4 83.2 63.8 68.7 2010 83.3 91.5 83.6 63.8 71.2 2011 83.0 90.7 81.7 61.6 72.3 2012 84.1 90.7 84.6 64.5 67.9 2013 83.2 91.0 82.3 62.3 63.5 2014 82.7 92.2 82.1 62.6 63.3 2015 81.9 89.9 80.3 59.1 59.7
* For the definition of the key indicators see Table 1 of NIS Data User’s Guide for the survey year of interest. † Excludes territories.

Data User’s Guide for the 2015 NIS Public-Use Data File APPENDIX G 174
Figure G.1: Trends in Landline Sample Key Indicators from Household and Provider Data Collection by Survey Year, National Immunization Survey, 1995-2015*
* Excludes territories.
Figure G.1 provides a graphical representation of the data contained in Table G.1. It shows how
selected landline sample key indicators from the household and provider data collection performed
throughout the years, from 1995 to present. We observe that the trend in the data collection rates is
going downward, with the exception of the percentage of children with adequate provider data, which
had been essentially flat since 1997 until a drop in 2013. Note that these data reflect the landline
sample only.
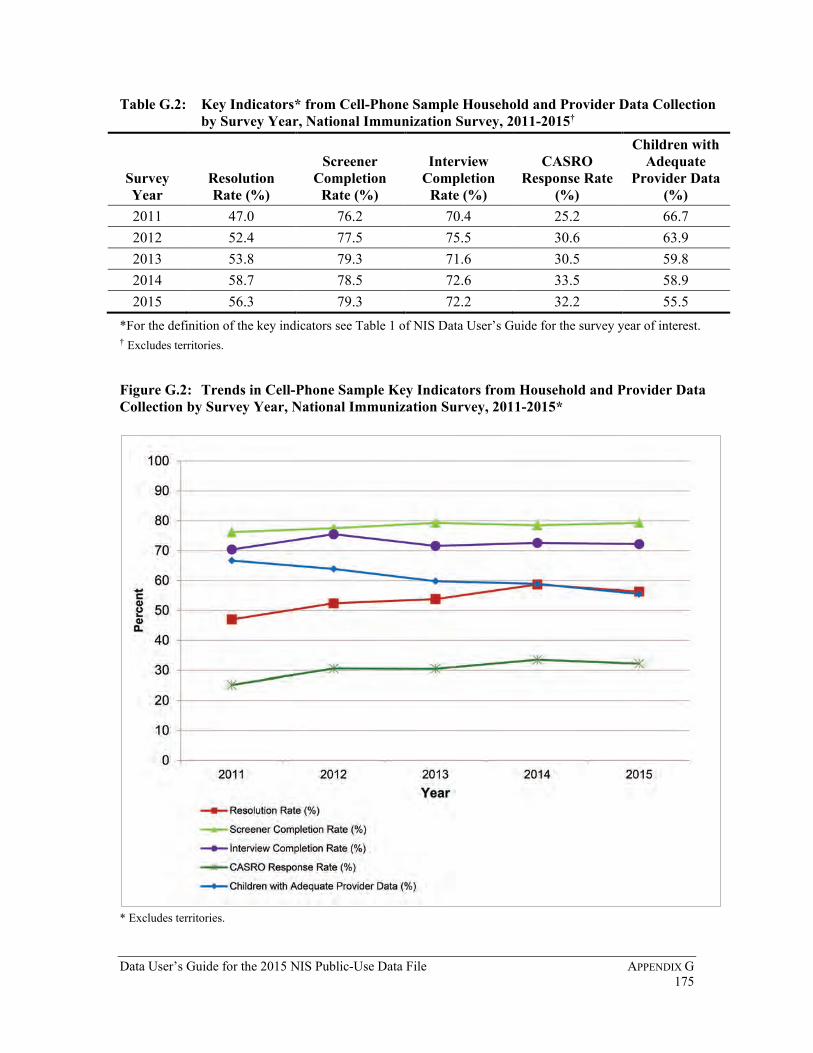
Data User’s Guide for the 2015 NIS Public-Use Data File APPENDIX G 175
Table G.2: Key Indicators* from Cell-Phone Sample Household and Provider Data Collection by Survey Year, National Immunization Survey, 2011-2015†
Survey Year
Resolution Rate (%)
Screener Completion
Rate (%)
Interview Completion
Rate (%)
CASRO Response Rate
(%)
Children with Adequate
Provider Data (%)
2011 47.0 76.2 70.4 25.2 66.7 2012 52.4 77.5 75.5 30.6 63.9 2013 53.8 79.3 71.6 30.5 59.8 2014 58.7 78.5 72.6 33.5 58.9 2015 56.3 79.3 72.2 32.2 55.5
*For the definition of the key indicators see Table 1 of NIS Data User’s Guide for the survey year of interest. † Excludes territories.
Figure G.2: Trends in Cell-Phone Sample Key Indicators from Household and Provider Data Collection by Survey Year, National Immunization Survey, 2011-2015*
* Excludes territories.

Data User’s Guide for the 2015 NIS Public-Use Data File APPENDIX G 176
Figure G.2 provides a graphical representation of the data contained in Table G.2. It shows how
selected cell-phone sample key indicators from the household and provider data collection performed
from 2011 to present. We observe that the rates since the inception of the cell-phone sample have
been essentially flat, aside from a declining percentage of children with adequate provider data and a
moderate increase in the resolution rate in 2014 that is likely due to the process introduced in 2014 of
removing and classifying as non-working cell-phone numbers flagged as having no recent activity.
The response rate is the number of households with a completed household interview divided by the
estimated number of eligible households in the sample. Within each sample type (landline or cell
phone), the number of eligible households was estimated using the CASRO assumptions; these
assumptions are that the rate of households among the unresolved telephone numbers is the same as
the observed rate of households among the resolved telephone numbers, and the rate of eligible
households among unscreened households is the same as the observed rate of eligible households
among screened households. Under these assumptions, within each sample type the CASRO response
rate is equal to the product of the resolution rate, the screener completion rate, and the interview
completion rate. For the combined samples, we have defined the CASRO response rate as the total
number of households with a completed interview divided by the estimated total number of eligible
households across both sample types, where the estimated total number of eligible households is
equal to the sum of the estimated number of eligible households in the landline sample (using
CASRO assumptions) and the estimated number of eligible households in the cell-phone sample
(using CASRO assumptions). Table G.3 presents the CASRO response rate calculated in this way for
the combined landline and cell-phone samples, by survey year, and Figure G.3 presents a graphical
representation. Because the CASRO response rate is lower for the cell-phone sample than for the
landline sample, the CASRO response rate for the combined landline and cell-phone samples was
lower in years with a larger cell-phone sample and higher in years with a smaller cell-phone sample.

Data User’s Guide for the 2015 NIS Public-Use Data File APPENDIX G 177
Table G.3: CASRO Response Rate for the Combined Landline and Cell-Phone Samples by Survey Year, National Immunization Survey, 2011-2015*
Survey Year† CASRO Response Rate
(%) 2011 52.2 2012 41.2 2013 34.4 2014 42.5 2015 34.9
* Excludes territories. † Cell-phone sample was added to the NIS in 2011.
Figure G.3: Trend in CASRO Response Rate for the Combined Landline and Cell-Phone Samples by Survey Year, National Immunization Survey, 2011-2015*
* Excludes territories.

Data User’s Guide for the 2015 NIS Public-Use Data File APPENDIX G 178
Table G.4: Vaccine-Specific Coverage Levels Among Children Age 19-35 Months in the United States by Survey Year, National Immunization Survey, 1995-2015*
Survey Year†
4+ DTaP
3+ Polio
1+ MMR
3+ Hib§
3+ Hep B
1+ Varicella¶
4+ PCV 4:3:1** 4:3:1:3††
1995 78.4 87.8 89.8 91.2 67.9 N.A. N.A. 76.0 73.7 1996 81.1 91.0 90.6 91.4 81.8 12.0 N.A. 78.4 76.4 1997 81.5 90.7 90.4 92.5 83.6 25.8 N.A. 77.9 76.2 1998 83.9 90.8 92.0 93.4 87.0 43.2 N.A. 80.6 79.2 1999 83.3 89.6 91.5 93.5 88.1 57.5 N.A. 79.9 78.4 2000 81.7 89.5 90.5 93.4 90.3 67.8 N.A. 77.6 76.2 2001 82.1 89.4 91.4 93.0 88.9 76.3 N.A. 78.6 77.2 2002 81.6 90.2 91.6 93.1 89.9 80.6 N.A. 78.5 77.5 2003 84.8 91.6 93.0 93.9 92.4 84.8 N.A. 82.2 81.3 2004 85.5 91.6 93.0 93.5 92.4 87.5 N.A. 83.5 82.5 2005 85.7 91.7 91.5 93.9 92.9 87.9 53.7 83.1 82.4 2006 85.2 92.8 92.3 93.4 93.3 89.2 68.4 83.1 82.2 2007 84.5 92.6 93.2 92.6 92.7 90.0 75.3 82.8 80.1 2008 84.6 93.6 92.1 90.9 93.5 90.7 80.1 82.5 79.6 2009 83.9 92.8 90.0 83.6 92.4 89.6 80.4 81.5 73.4 2010 84.4 93.3 91.5 90.4 91.8 90.4 83.3 82.0 78.8 2011 84.6 93.9 91.6 94.0 91.1 90.8 84.4 82.6 81.9
2012§§ 82.5 92.8 90.8 93.0 89.7 90.2 81.9 80.5 80.0 2013 83.1 92.7 91.9 92.8 90.8 91.2 82.0 81.5 81.1 2014 84.2 93.3 91.5 92.6 91.6 91.0 82.9 82.6 82.0 2015 84.6 93.7 91.9 93.2 92.6 91.8 84.1 83.2 82.6
* Excludes territories. † Prior to 2011, estimates are single-frame, landline-sample estimates. From 2011 onward, estimates are dual-frame (landline plus cell-phone) estimates. § Beginning in 2009, the number of doses required to be up-to-date on Hib depends on the manufacturer of the vaccine. However, the figures shown here refer to 3 or more doses of Hib vaccine regardless of manufacturer. ¶ Varicella was added to the NIS in 1996. ** Four or more doses of DTaP, three or more doses of poliovirus vaccine, and one or more doses of MCV. †† Four or more doses of DTaP, three or more does of poliovirus vaccine, one or more doses of MCV, and three or more doses of Hib. §§ Revised definition of adequate provider data (APD) implemented.

Data User’s Guide for the 2015 NIS Public-Use Data File APPENDIX G 179
Figure G.4: Trends in Vaccine-Specific Coverage Levels among Children 19-35 Months of Age in the United States by Survey Year, National Immunization Survey, 1995-2015*†¶
* Excludes territories. † Prior to 2011, estimates are single-frame, landline-sample estimates. From 2011 onward, estimates are dual-frame (landline plus cell-phone) estimates. ¶ Revised definition of adequate provider data (APD) implemented in 2012.
Figure G.4 provides a graphical representation of the data contained in Table G.4. It displays the trend
in vaccine-specific coverage levels among children aged 19 through 35 months from 1995 to present.
We observe that the trend in the vaccination coverage levels is slightly upward for the longer-
established vaccines, while the early trends for new vaccines are strongly upward. Note that these
data reflect the landline sample prior to 2011 and the dual-frame sample thereafter.

Data User’s Guide for the 2015 NIS Public-Use Data File APPENDIX H
180
Appendix H: Vaccine Type Codes
Table H.1: 2015 NIS Vaccine Type Codes Vaccine Code Description
03 DTaP/DTP-containing, unknown type 04 DTaP 07 DTaP-Hib 08 DTaP-HepB-IPV 20 OPV 21 IPV 22 Polio-containing, unknown type 30 Measles-mumps-rubella 31 Measles only 32 Measles-mumps 33 Measles-rubella 43 HepB-Hib 44 Hib-only, unknown type 60 HepB-only 70 Pneumococcal conjugate, unknown type 71 Pneumococcal polysaccharide 72 Pneumococcal-containing, unknown type 73 Pneumococcal conjugate-7 74 Pneumococcal conjugate-13 D3 DTaP-IPV-Hib FL Seasonal influenza, unknown type FM Seasonal influenza spray FN Injected seasonal influenza HB HepB-containing, unknown type HG Hib-only (GSK) HI Hib-containing, unknown type
HM Hib-only (Merck) HS Hib-only (Sanofi) HY Hib-MenCY MM Measles-containing, unknown type RG Rotarix (GSK) RM Rotateq (Merck) RO Rotavirus-containing, unknown type VA Varicella-containing, unknown type VM MMR-varicella VO Varicella-only
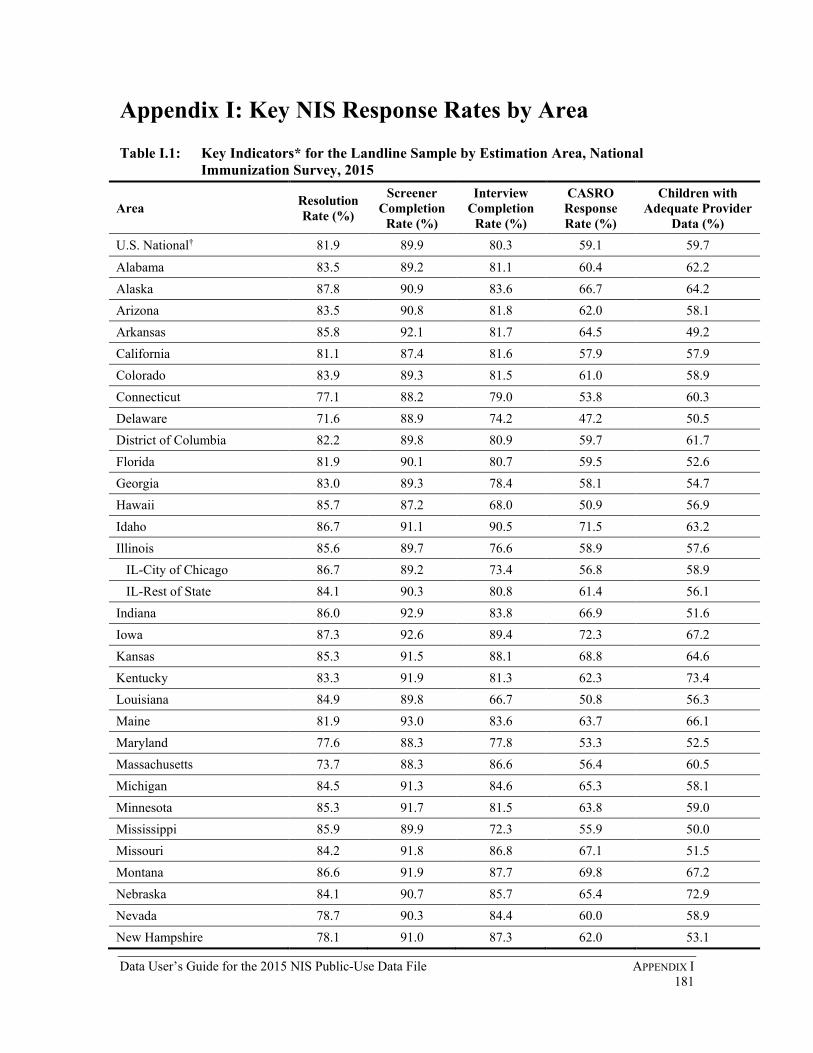
Data User’s Guide for the 2015 NIS Public-Use Data File APPENDIX I 181
Appendix I: Key NIS Response Rates by Area
Table I.1: Key Indicators* for the Landline Sample by Estimation Area, National Immunization Survey, 2015
Area Resolution Rate (%)
Screener Completion
Rate (%)
Interview Completion
Rate (%)
CASRO Response Rate (%)
Children with Adequate Provider
Data (%) U.S. National† 81.9 89.9 80.3 59.1 59.7
Alabama 83.5 89.2 81.1 60.4 62.2 Alaska 87.8 90.9 83.6 66.7 64.2 Arizona 83.5 90.8 81.8 62.0 58.1 Arkansas 85.8 92.1 81.7 64.5 49.2 California 81.1 87.4 81.6 57.9 57.9 Colorado 83.9 89.3 81.5 61.0 58.9 Connecticut 77.1 88.2 79.0 53.8 60.3 Delaware 71.6 88.9 74.2 47.2 50.5 District of Columbia 82.2 89.8 80.9 59.7 61.7 Florida 81.9 90.1 80.7 59.5 52.6 Georgia 83.0 89.3 78.4 58.1 54.7 Hawaii 85.7 87.2 68.0 50.9 56.9 Idaho 86.7 91.1 90.5 71.5 63.2 Illinois 85.6 89.7 76.6 58.9 57.6 IL-City of Chicago 86.7 89.2 73.4 56.8 58.9 IL-Rest of State 84.1 90.3 80.8 61.4 56.1 Indiana 86.0 92.9 83.8 66.9 51.6 Iowa 87.3 92.6 89.4 72.3 67.2 Kansas 85.3 91.5 88.1 68.8 64.6 Kentucky 83.3 91.9 81.3 62.3 73.4 Louisiana 84.9 89.8 66.7 50.8 56.3 Maine 81.9 93.0 83.6 63.7 66.1 Maryland 77.6 88.3 77.8 53.3 52.5 Massachusetts 73.7 88.3 86.6 56.4 60.5 Michigan 84.5 91.3 84.6 65.3 58.1 Minnesota 85.3 91.7 81.5 63.8 59.0 Mississippi 85.9 89.9 72.3 55.9 50.0 Missouri 84.2 91.8 86.8 67.1 51.5 Montana 86.6 91.9 87.7 69.8 67.2 Nebraska 84.1 90.7 85.7 65.4 72.9 Nevada 78.7 90.3 84.4 60.0 58.9 New Hampshire 78.1 91.0 87.3 62.0 53.1

Data User’s Guide for the 2015 NIS Public-Use Data File APPENDIX I
182
Area Resolution Rate (%)
Screener Completion
Rate (%)
Interview Completion
Rate (%)
CASRO Response Rate (%)
Children with Adequate Provider
Data (%) New Jersey 76.2 87.2 80.1 53.3 55.9 New Mexico 86.6 90.9 90.5 71.2 76.4 New York 77.3 87.3 75.4 50.8 52.7 NY-City of New York 76.6 85.5 73.5 48.2 53.5 NY-Rest of State 78.0 88.8 77.2 53.5 51.9 North Carolina 81.2 90.1 83.5 61.1 66.7 North Dakota 87.9 93.1 75.4 61.7 54.9 Ohio 84.0 91.0 75.8 58.0 48.9 Oklahoma 84.4 91.0 90.4 69.4 61.7 Oregon 86.0 92.4 77.8 61.8 64.7 Pennsylvania 74.8 90.3 82.9 56.0 60.2 PA-Philadelphia County 73.9 88.9 81.6 53.6 49.4 PA-Rest of State 76.0 91.5 84.2 58.5 68.8 Rhode Island 69.2 89.2 76.8 47.4 63.6 South Carolina 82.8 90.3 74.1 55.4 45.9 South Dakota 88.7 91.8 80.4 65.5 65.9 Tennessee 84.1 91.2 76.1 58.3 60.7 Texas 84.4 87.7 72.8 53.9 61.4 TX-Bexar County 82.0 88.3 72.0 52.2 57.6 TX-City of Houston 85.9 86.6 70.2 52.2 54.7 TX-El Paso County 84.9 88.8 75.3 56.8 69.1 TX-Hidalgo County 85.0 86.9 77.3 57.1 74.1 TX-Rest of State 83.5 88.4 70.9 52.4 56.0 Utah 86.1 88.6 92.7 70.8 73.2 Vermont 81.6 92.0 90.6 68.0 72.1 Virginia 78.8 90.2 87.3 62.1 65.5 Washington 83.5 91.2 83.7 63.7 58.1 West Virginia 76.6 91.5 79.4 55.7 59.7 Wisconsin 83.0 92.0 76.9 58.7 54.9 Wyoming 85.9 90.3 87.1 67.6 62.1 U.S. Virgin Islands 92.1 93.4 83.8 72.1 60.9 Guam 91.5 88.1 76.6 61.7 62.8 Puerto Rico 90.1 94.2 65.9 56.0 40.9
* For the definition of the key indicators see Table 1 of NIS Data User’s Guide. † Excludes territories.

Data User’s Guide for the 2015 NIS Public-Use Data File APPENDIX I
183
Table I.2: Key Indicators* for the Cell-Phone Sample by Estimation Area, National Immunization Survey, 2015
Area Resolution Rate (%)
Screener Completion
Rate (%)
Interview Completion
Rate (%)
CASRO Response Rate (%)
Children with Adequate Provider
Data (%) U.S. National† 56.3 79.3 72.2 32.2 55.5
Alabama 59.9 79.1 68.2 32.4 53.8 Alaska 77.8 83.0 78.9 50.9 57.7 Arizona 51.3 80.0 72.5 29.8 54.9 Arkansas 64.5 81.4 71.0 37.3 55.6 California 51.4 77.9 69.8 27.9 52.3 Colorado 53.8 78.2 75.4 31.7 55.5 Connecticut 42.0 77.2 69.7 22.6 51.0 Delaware 48.4 78.7 73.0 27.8 58.3 District of Columbia 53.5 79.6 75.2 32.0 53.8 Florida 51.3 78.9 71.2 28.9 49.6 Georgia 55.2 79.8 68.8 30.3 52.7 Hawaii 51.4 76.5 70.8 27.8 55.5 Idaho 52.2 80.6 78.8 33.1 60.9 Illinois 61.4 80.7 72.3 35.8 56.6 IL-City of Chicago 67.3 80.9 71.6 39.0 58.7 IL-Rest of State 58.7 80.6 72.8 34.4 55.8 Indiana 54.5 81.8 73.2 32.6 54.7 Iowa 58.4 83.4 78.7 38.3 62.1 Kansas 69.5 81.1 74.3 41.8 61.8 Kentucky 57.6 79.8 67.6 31.1 52.0 Louisiana 64.6 79.1 67.5 34.5 51.5 Maine 52.1 81.9 77.6 33.1 55.7 Maryland 53.5 77.0 75.5 31.1 55.4 Massachusetts 50.7 77.9 70.7 27.9 58.4 Michigan 58.3 80.5 75.4 35.4 59.8 Minnesota 54.1 80.2 74.8 32.5 54.9 Mississippi 63.3 80.1 65.1 33.0 50.2 Missouri 59.2 80.9 75.1 35.9 57.4 Montana 61.9 83.1 77.4 39.8 63.8 Nebraska 64.0 81.5 76.1 39.6 59.7 Nevada 53.3 78.3 70.7 29.5 56.3 New Hampshire 48.7 79.2 76.5 29.5 52.3 New Jersey 48.6 77.3 69.1 25.9 46.6

Data User’s Guide for the 2015 NIS Public-Use Data File APPENDIX I
184
Area Resolution Rate (%)
Screener Completion
Rate (%)
Interview Completion
Rate (%)
CASRO Response Rate (%)
Children with Adequate Provider
Data (%) New Mexico 59.6 80.4 74.3 35.6 58.6 New York 50.5 78.2 68.4 27.0 49.9 NY-City of New York 53.0 77.6 65.6 27.0 51.0 NY-Rest of State 47.9 79.0 72.2 27.3 48.8 North Carolina 54.0 78.2 72.2 30.5 52.0 North Dakota 66.6 82.6 77.8 42.8 59.4 Ohio 52.2 79.5 74.8 31.0 52.8 Oklahoma 64.0 79.2 75.4 38.2 58.1 Oregon 51.6 82.1 79.7 33.8 54.8 Pennsylvania 51.0 77.5 68.8 27.2 54.2 PA-Philadelphia County 51.4 77.3 69.1 27.5 57.3 PA-Rest of State 47.2 79.6 66.2 24.9 51.5 Rhode Island 46.8 77.3 69.6 25.2 57.2 South Carolina 54.3 79.2 66.1 28.4 54.2 South Dakota 63.0 82.0 76.7 39.6 51.6 Tennessee 54.6 80.5 74.4 32.7 55.7 Texas 58.4 76.1 66.5 29.5 57.5 TX-Bexar County 57.0 77.2 71.1 31.3 51.4 TX-City of Houston 52.9 75.8 67.2 26.9 60.7 TX-El Paso County 56.2 75.7 66.0 28.0 59.0 TX-Hidalgo County 65.3 75.1 62.1 30.5 68.0 TX-Rest of State 57.6 79.4 72.6 33.2 55.1 Utah 58.0 77.9 80.6 36.4 63.8 Vermont 49.3 81.1 77.7 31.0 61.1 Virginia 52.3 80.2 69.2 29.1 55.0 Washington 49.0 80.1 76.8 30.1 58.9 West Virginia 57.5 79.6 72.6 33.2 51.9 Wisconsin 58.7 80.5 75.5 35.6 64.2 Wyoming 78.0 82.8 80.1 51.8 50.1 U.S. Virgin Islands 78.3 84.5 65.3 43.2 55.3 Guam 61.8 78.3 55.2 26.7 59.3 Puerto Rico 68.4 86.5 62.5 37.0 35.5
* For the definition of the key indicators see Table 1 of NIS Data User’s Guide. † Excludes territories.

Data User’s Guide for the 2015 NIS Public-Use Data File APPENDIX I
185
Table I.3: CASRO Response Rate for the Combined Landline and Cell-Phone Samples* by Estimation Area, National Immunization Survey, 2015
Area CASRO Response Rate (%)
U.S. National† 34.9
Alabama 34.7 Alaska 53.8 Arizona 33.4 Arkansas 39.5 California 33.6 Colorado 33.9 Connecticut 26.2 Delaware 30.0 District of Columbia 33.7 Florida 31.8 Georgia 32.6 Hawaii 29.3 Idaho 34.9 Illinois 37.9 IL-City of Chicago 41.3 IL-Rest of State 36.3 Indiana 35.6 Iowa 40.9 Kansas 44.3 Kentucky 33.5 Louisiana 36.1 Maine 35.7 Maryland 40.7 Massachusetts 32.3 Michigan 38.5 Minnesota 35.4 Mississippi 34.3 Missouri 39.3 Montana 42.3 Nebraska 42.2 Nevada 32.5 New Hampshire 32.0 New Jersey 30.1 New Mexico 38.3

Data User’s Guide for the 2015 NIS Public-Use Data File APPENDIX I
186
Area CASRO Response Rate (%)
New York 30.1 NY-City of New York 29.6 NY-Rest of State 31.0 North Carolina 33.3 North Dakota 44.3 Ohio 32.9 Oklahoma 40.7 Oregon 36.2 Pennsylvania 30.0 PA-Philadelphia County 29.0 PA-Rest of State 35.7 Rhode Island 27.6 South Carolina 30.3 South Dakota 43.3 Tennessee 35.2 Texas 31.3 TX-Bexar County 32.7 TX-City of Houston 28.7 TX-El Paso County 30.0 TX-Hidalgo County 31.7 TX-Rest of State 40.9 Utah 39.2 Vermont 35.4 Virginia 37.4 Washington 33.8 West Virginia 35.4 Wisconsin 37.8 Wyoming 53.4 U.S. Virgin Islands 46.8 Guam 32.2 Puerto Rico 38.9
* For the definition of the CASRO response rate for the combined landline and cell-phone samples, see footnote 6 of Table 1. † Excludes territories.