Embed Size (px)
Citation preview
National Farm Business Management Conference
Tools to help Ohio’s dairy farmers manage in challenging economic conditions
Dianne Shoemaker
The Ohio State University Extension
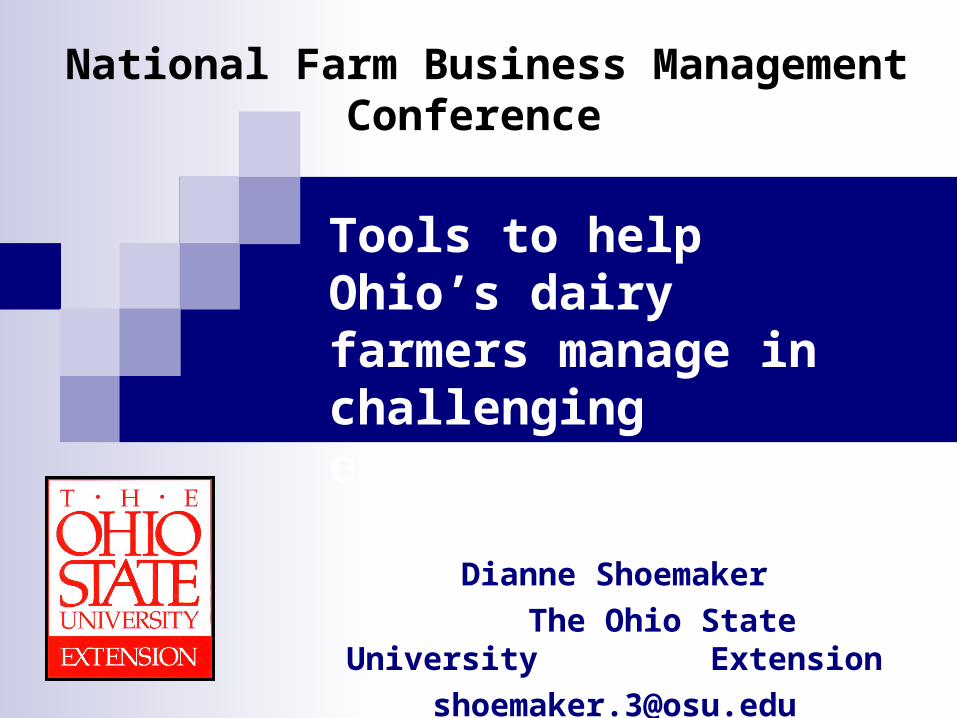
Class III and Support Price
0
5
10
15
20
25
$ p
er c
wt
2003 2004 2005 2006 2007 2008 2009
COP

3
How do I know if I’m profitable?
How do I know if I’m competitive?
How do I survive?

Simple and Useful:Cost of Production Worksheets

-Nutrition and feed costs-Reproduction and health-Calf and heifer management-Business issues-People and stress management
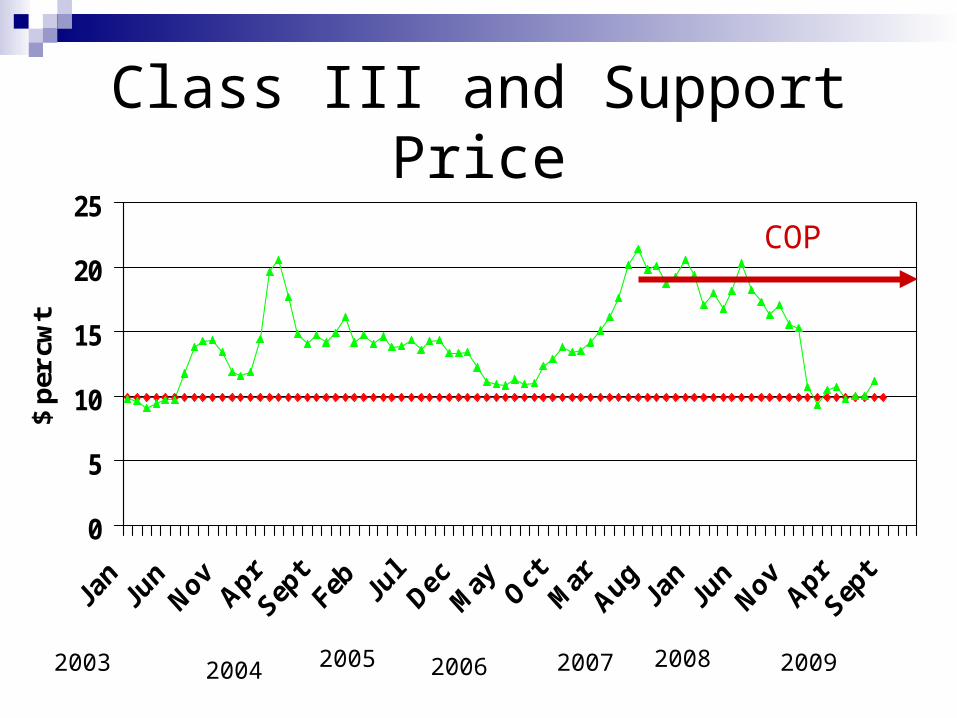
Dairy IssueBriefs
http://dairy.osu.edu

How should I take on additional debt…continued

Download at:http://dairy.osu.edu
Purchase online at:http://estore.osu-extension.org/

Why the 15 Measures?
What are competitive NE & Midwest milk producers doing?
Where does an individual farm stand in relation to competitive dairy farms?

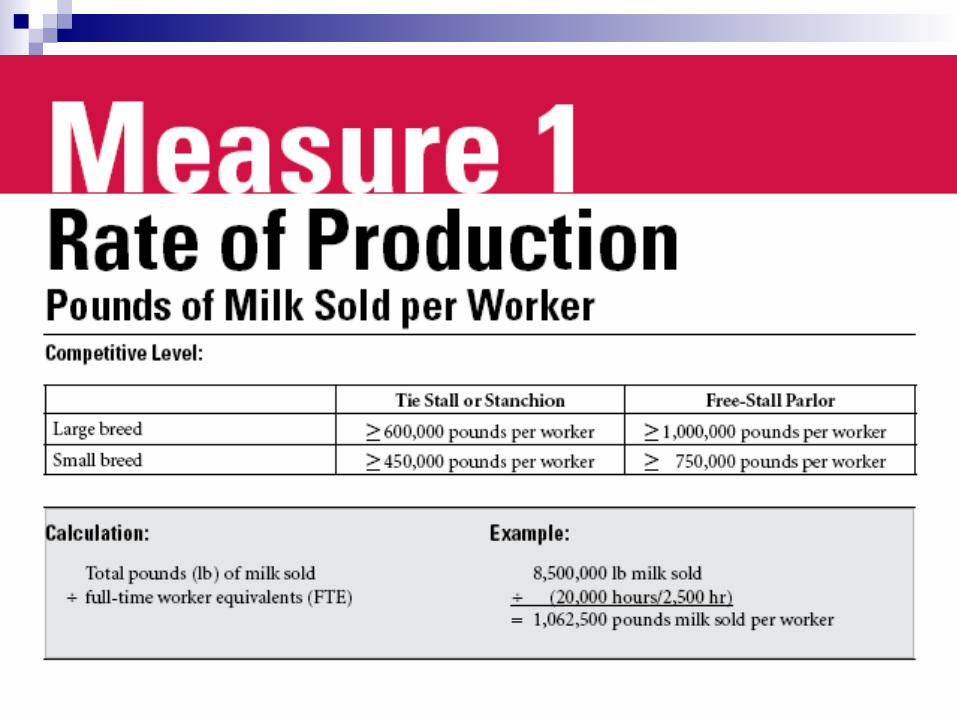
Ten Areas: Rate of production
Pounds of milk sold/worker Cost control
Total feed cost per cwt milk sold Milking herd feed cost/cwt milk sold Operating expense ratio
Capital Efficiency Dairy investment per cow Asset Turnover ratio
Profitability Net farm income Rate of return on farm assets

Ten Areas: Liquidity
Current ratio and working capital Repayment schedule
Scheduled debt payment Solvency
Debt to asset ratioDebt per cow
Mission Maintain standard of living Motivated labor force
The Measures Provide: Number, ratio, percentage, or description
Specific instructions for calculation
An example calculation
Brief description
Specific recommendations for firms that are above or below the competitive level
How the 15 Measures may help: Evaluate an existing business.
Help the farm get a better feel for where the business could go.
Identify priority areas the farm needs to work on to meet business objectives.
Cautions:
Looking at one or two measures does not a complete evaluation make!
Look at the whole business.
Key measures for 2010
Working capital Debt/Asset ratio Debt per cow Debt repayment schedule
And…

Different Farms…
...Different Costs
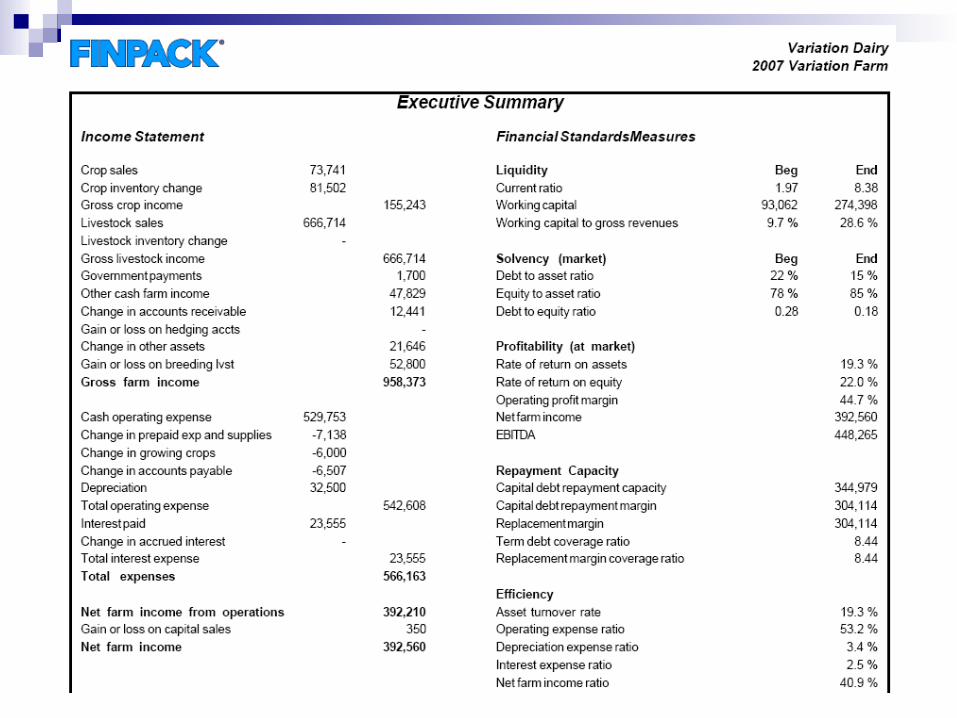

Worksheet 1* Historic and Projected Out-of-Pocket Cost of Production
Records used for a sole proprietorship with most of the income coming from the dairy enterprise: Federal Income Tax Schedule F, Form 4797, year beginning and ending inventories, cwt. of milk sold for the calendar year.
Farm Calculation Using 2000___ Financials (year)
Schedule F Expenses1 853,603
+ Accrued Expenses2 + 5,000
- Prepaid Expenses3 - 45,670
- Schedule F depreciation4 - 70,000
- Non milk income5 - 166,292 +/- inventory growth (-); decline (+)6
+/- -0-
Out-of-Pocket Cost of Production $ 576,641
cwt. Milk sold8 61,720 cwt
Out-of-Pocket Cost of Production per cwt. (historic) $ 9.34 /cwt

Worksheet 2* Historic and Projected Cash Flow Planning Cost
Records used for a sole proprietorship with most of the income coming from the dairy enterprise: Actual and projected out-of-pocket costs of production from Worksheet 1, operator’s personal draw, operator’s retirement investment, principal paid, depreciation, capital investment expenditures and actual or estimated income tax obligations.
Farm Calculation Using 2000 (year)
Financials
Projection for 2001 (year)
Out-of-Pocket Cost of Production (from Worksheet 1) $ 576,641
Projected Out-of-Pocket Cost of Production (from Worksheet 1) $ 588,173
+ Operator’s personal draw9 + 40,566
+ 41,000
+ Operator’s retirement investment10
+ 7,000
+ 7,000
+ Replacement 11 + 81,423
+ 82,000
+ Estimated taxes12 + 13,000
+ 13,000
Historic Cash Flow Needs $ 718,630 ___
Projected Cash Flow Needs $ 731,173
cwt. of milk sold8 61,720 _
61,720 0 Historic Cash Flow Planning Cost per cwt
$ 11.64 /cwt
Projected Cash Flow Planning Cost $ 11.85 /cwt
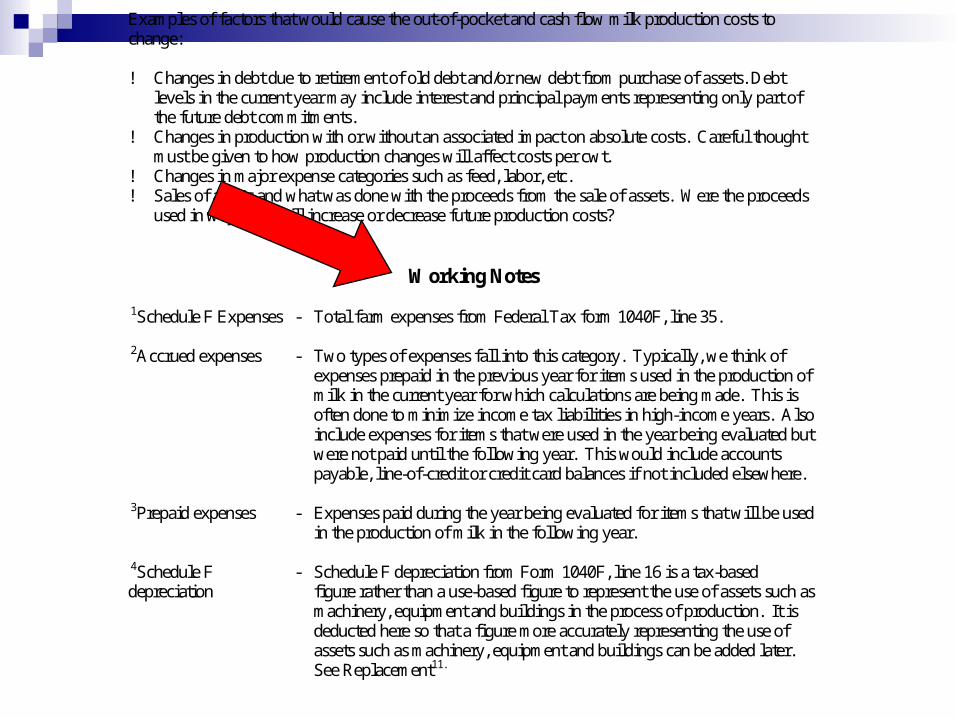
Examples of factors that would cause the out-of-pocket and cash flow milk production costs to change: ! Changes in debt due to retirement of old debt and/or new debt from purchase of assets. Debt
levels in the current year may include interest and principal payments representing only part of the future debt commitments.
! Changes in production with or without an associated impact on absolute costs. Careful thought must be given to how production changes will affect costs per cwt.
! Changes in major expense categories such as feed, labor, etc. ! Sales of assets and what was done with the proceeds from the sale of assets. Were the proceeds
used in ways that will increase or decrease future production costs?
Working Notes 1Schedule F Expenses - Total farm expenses from Federal Tax form 1040F, line 35. 2Accrued expenses - Two types of expenses fall into this category. Typically, we think of
expenses prepaid in the previous year for items used in the production of milk in the current year for which calculations are being made. This is often done to minimize income tax liabilities in high-income years. Also include expenses for items that were used in the year being evaluated but were not paid until the following year. This would include accounts payable, line-of-credit or credit card balances if not included elsewhere.
3Prepaid expenses - Expenses paid during the year being evaluated for items that will be used
in the production of milk in the following year. 4Schedule F - Schedule F depreciation from Form 1040F, line 16 is a tax-based depreciation figure rather than a use-based figure to represent the use of assets such as
machinery, equipment and buildings in the process of production. It is deducted here so that a figure more accurately representing the use of assets such as machinery, equipment and buildings can be added later. See Replacement11.

In Summary…
Our dairy farms are facing unique challenges in 2010…following 2009!
Successful farms must monitor key competitive measures and their costs of production
Tools available at http://dairy.osu.edu