Embed Size (px)
Citation preview

PHE publications gateway number: 2017275
Published: September 2017
The role of care homes in end of life care
Briefing 2 - Place and cause of death for permanent and temporary
residents of care homes
National End of Life Care Intelligence Network (NEoLCIN)
Introduction
This is the second of two briefings produced by
National End of Life Care Intelligence Network to
describe the important role that nursing and
residential care homes play in the care of many
people at the end of life. Collectively they are
referred to as care homes. Each year over 100,000
people die in these settings and approximately
29,000 other people normally resident in a care
home die elsewhere.
Care homes provide accommodation and personal
care for people who may not be able to live
independently either permanently or temporarily.
Temporary admission to a care home may occur
following discharge from hospital during a terminal
illness, when someone needs short term support
recuperating from an illness or for a trial period to
decide whether they want to live permanently in a
care home.
This briefing presents information derived from
death registration data concentrating on place and cause of death.
This is the second of a pair of briefings on the role of care homes in end of life care
provision. Briefing 1 describes care home bed provision and potential end of life care
need in people aged 75 years or over in England. These new briefings are part of a
Key findings: 22% (101,203) of people died in a care home in 2014, up from 16% (76,997) in 2005. A third (34%) of these people are temporary residents. In 2014 a further 28,892 permanent care home residents died elsewhere, down from 36,734 in 2005. The majority of permanent care home residents die in a care home (70% in 2014 up from 58% in 2005). Nearly two thirds (62%) of people who died in care homes have dementia, Alzheimer’s disease or senility as an underlying or contributory cause of death.

Page 2
Briefing 2 - Place and cause of death for permanent and temporary residents of care homes
wider collection of products on the role of care homes in end of life care. These
include:
briefing 1 – Care home bed provision and potential end of life care need in
people aged 75 or older in England
briefing 2 – Place and cause of death for permanent and temporary residents
of care homes
three new indicators for local authorities and clinical commissioning groups
which are included in the End of Life Care Profiles – care home bed rate,
nursing home bed rate, temporary resident care home deaths
a summary infographic on the data presented in these two data briefings
results of a national survey of support to adult care homes in England: A
specialist palliative care provider perspective
care home briefing 1 and 2 slide set
webinar recording and slide set ‘A focus on end of life care in care homes’
For a wide range of other products on EoLC visit the National End of Life Care
Intelligence Network website.
Methodology
Information on deaths in care homes was extracted from the Office of National
Statistics (ONS) Annual Deaths Extract which is itself compiled from death
certification data. Deaths in care homes (both residential and nursing homes) were
identified within this dataset using the method of categorising place of death
described in our publication Classification of place of death. Analysis focused on
deaths of England residents registered in the 10 years 2005 to 2014, excluding
neo-natal deaths.
Temporary residence in a care home was inferred if the postcode of residence of
someone who died in a care home did not match a care home (as listed in the ONS
Communal Establishment database which is used to categorise place of occurrence
for all deaths). A further limitation is that the data available to us (ONS mortality/ from
death certifications) does not allow us to count the number of people who were
temporary residents in a care home at any time during their last year of life (or other
suitable time period) and who subsequently died elsewhere (not in a care home).
The presentation of leading underlying causes of death follows the work of ONS and
the National End of Life Care Intelligence Network.

Page 3
Briefing 2 - Place and cause of death for permanent and temporary residents of care homes
Results
Number of deaths
In 2014 in England, care home was the place of death for 22% of people who died
(101,203), up from 16% (76,997) in 2005. Table 1 summarises the number of people
who died in care homes and together with Figure 1 also shows the rising number of
people dying in care homes who were temporary residents. Over these years the
percentage of people who died in care homes who were temporary residents
remained at 34%.
In addition to care home residents who died in a care home, a further 28,892
permanent care home residents died elsewhere in 2014, down from 36,734 in 2005.
Figure 2 shows that the majority of deaths of permanent care home residents occur
in a care home (70% in 2014 up from 58% in 2005).
Table 1 Number of deaths in care home, deaths of temporary care home residents and
deaths of care home residents occurring elsewhere, England 2005 and 2014
2014 2005
Total people who died 467,095 477,567
Number of people who died in a care
home, (as a percentage of all people who
died)
101,203
(22%)
76,977
(16%)
Number of care home residents who died
somewhere other than a care home, (as a
percentage of all people who died)
28,892
(6%)
36,734
(8%)
Number of temporary residents who died
in care homes (as percentage of all
people who died in a care home)
34,638
(34%)
26,272
(34%)
Number of permanent care home
residents who died in a care home ( as a
percentage of all permanent residents of
a care home who died)
66,565
(70%)
50,705
(58%)

Page 4
Briefing 2 - Place and cause of death for permanent and temporary residents of care homes
Figure 1: Number and percentage of deaths in care homes, England 2005-2014
Figure 2: Number of deaths of permanent care home residents and where they died, England 2005-2014
Underlying cause of death
The distribution of broad underlying causes of death for care home residents are
summarised in Table 2.
The most common underlying causes of death in care homes were dementia and
diseases of the nervous system (35% of deaths in care homes). Circulatory disease
was the most common underlying cause of death group for care home residents who
die elsewhere (27% of these deaths).
0
20
40
60
80
100
0
20,000
40,000
60,000
80,000
100,000
2005 2008 2011 2014
Perc
en
tag
e o
f p
erm
an
en
t care
h
om
e r
esid
en
t d
eath
s
Nu
mb
er
of
de
ath
s
Permanent care home residents who died in care home
Care home residents who died elsewhere
% of permanent care home residents who died in a care home

Page 5
Briefing 2 - Place and cause of death for permanent and temporary residents of care homes
Cancer as an underlying cause of death was disproportionately common for
temporary residents, compared to permanent residents; 61% of deaths from cancer
in a care home were temporary residents.
Table 2: Distribution of broad underlying cause for death for deaths in care homes and of care home residents who died elsewhere; England 2014
Underlying cause of death All deaths
in care homes
Deaths in a care home Care home residents who died elsewhere (ICD-10 chapter)
Permanent residents
Temporary residents
Mental and behavioural or Nervous system (F & G)
35% (35,926)
41% (27,615)
24% (8,311)
22% (6,224)
Circulatory disease (I)
22% (22,368)
22% (14,964)
21% (7,404)
27% (7,945)
Cancer (C) 18%
(18,676) 11%
(7,193) 33%
(11,483) 12%
(3,438)
Respiratory disease (J)
10% (10,325)
11% (7,036)
9% (3,289)
18% (5,195)
Other 14%
(13,908) 15%
(9,757) 12%
(4,151) 21%
(6,090)
All causes 100%
101,203 100%
(66,565) 100%
(34,638) 100%
(28,892)
A more detailed presentation of leading underlying causes of death is shown in Table
3. Permanent and temporary care home residents have broadly similar leading
causes of death, but specific cancers are more common among temporary residents;
emphysema/bronchitis, Parkinson’s disease, heart failure, acute respiratory diseases
and urinary disease are more common among permanent residents.
Care home residents who die elsewhere have similar leading causes of death to
permanent residents who die in a care home. However, care home residents who die
elsewhere show proportionately fewer deaths attributed to dementia and Alzheimer’s
disease, and more to urinary disease and accidental falls compared to permanent
care home residents dying in a care home.

Page 6
Briefing 2 - Place and cause of death for permanent and temporary residents of care homes
Table 3: The leading underlying causes of death in care homes and among all deaths aged 75 or older, England 2014
Rank
1 is
most common
All deaths in a care home,
(101,203 deaths 21.7% of all
deaths)
Permanent care home residents
who died in a care home
(66,565 deaths
14.3% of all deaths)
Temporary care home residents,
who died in a care home
(34,638 deaths
7.4% of all deaths)
Care home residents who died elsewhere
(28,892 deaths
6% of all deaths)
All deaths aged 75 years or
older, any place of
residence any place of death,
(318,385 deaths
68% of all deaths)
1
Dementia and Alzheimer’s
31,585 deaths, 31%
Dementia and Alzheimer’s
24,714 deaths, 37%
Dementia and Alzheimer’s
6,871 deaths, 20%
Dementia and Alzheimer’s
5,195 deaths, 18%
Dementia and Alzheimer’s
46,236 deaths, 15%
2 Cerebrovascular
diseases 8,968 deaths, 9%
Cerebrovascular diseases
6,272 deaths, 9%
Cerebrovascular diseases
2,696 deaths, 8%
Cerebrovascular diseases
3,055 deaths, 11%
Heart disease 38,536 deaths,
12%
3 Heart disease
6,379 deaths, 6% Heart disease
4,085 deaths, 6% Heart disease
2,294 deaths, 7% Heart disease
2,826 deaths, 10%
Cerebrovascular diseases
25,780 deaths, 8%
4 Flu/pneumonia
4,296 deaths, 4% Flu/pneumonia
3,137 deaths, 5% Lung cancer
2,257 deaths, 7% Flu/pneumonia
2,707 deaths, 9% Flu/pneumonia
20,248 deaths, 6%
5 Emphysema/
bronchitis 3,609 deaths, 4%
Emphysema/ bronchitis
2,271 deaths, 3%
Emphysema/ bronchitis
1,338 deaths, 4%
Emphysema/ bronchitis
1,728 deaths, 6%
Emphysema/ bronchitis
18,841 deaths, 6%
6 Lung cancer
3,448 deaths, 3%
Parkinson's disease
1,643 deaths, 2%
Bowel cancer 1,305 deaths, 4%
Urinary disease 829 deaths, 3%
Lung cancer 14,150 deaths, 4%
7 Parkinson's
disease 2,413 deaths, 2%
Heart failure 1,506 deaths, 2%
Prostate cancer 1,161 deaths, 3%
Lung cancer 679 deaths, 2%
Bowel cancer 7,914 deaths, 2%
8 Heart failure
2,258 deaths, 2% Lung cancer
1,191 deaths, 2% Flu/pneumonia
1,159 deaths, 3% Accidental falls 613 deaths, 2%
Prostate cancer 7,073 deaths, 2%
9 Bowel cancer
2,089 deaths, 2%
Acute respiratory diseases
(excluding flu/pneumonia)
1,184 deaths, 2%
Breast cancer 881 deaths, 3%
Cardiac arrhythmias
466 deaths, 2%
Urinary disease 6,807 deaths, 2%
10 Prostate cancer
1,996 deaths, 2% Urinary disease
1,115 deaths, 2%
Parkinson's disease
770 deaths, 2%
Parkinson's disease
396 deaths, 1%
Lymphoid cancer 6,259 deaths, 2%
11 Other
34,162 deaths, 34%
Other 19,447 deaths,
29%
Other 13,906 deaths,
40%
Other 10,398 deaths,
36%
Other 126,541 deaths,
40%
Total 101,203 deaths,
100% 66,565 deaths,
100% 34,638 deaths,
100% 28,892 deaths,
100% 318,385 deaths,
100%

Page 7
Briefing 2 - Place and cause of death for permanent and temporary residents of care homes
Box 1: Alternative methods of estimating dementia prevalence from mortality data; deaths in a care home England 2014
The method used by ONS identifies
31,585 people who died in care homes
having an underlying cause of death of
‘Dementia and Alzheimer’s disease’
(31% of all deaths in a care home)
selecting underlying cause of death
coding (ICD-10) of F01, F03, G30.
PHE in their data briefing ‘Dying with
dementia’ identifies 42,682 people who
died (42% of people who died in a care
home) with dementia or Alzheimer’s
disease by selecting people with
underlying or contributory causes of
death codes including F01, F02, F03,
F04, G30 or G31.
Expanding the previous definition to
include people who died with underlying
or contributory causes of death of senility
(ICD-10 R54) identifies 62,432 people
who died in a care home (62% of all
people who died in a care home).
Estimating the importance of dementia
The count of people who died from dementia
based solely on the underlying cause of death
is a poor estimator of the number of people
who are suffering the effects of dementia at
the end of their life; some people with
dementia die from other causes.
Death certificates record both underlying and
contributory causes of death and by analysing
all this data (Box 1) the number of people who
died in a care home with dementia can be
estimated as high as 62%, approximately
double the number of people who died with an
underlying cause of these diseases (31%).
Figure 3 shows that the majority (57%) of
people who died with dementia, Alzheimer’s
disease or senility significant enough to be
recorded on the death certificate, occurred in
a care home. Figure 4 shows that among end
of life care settings these people constitute the
greatest proportion of people who died for
care homes.
Figure 3: Distribution of place of death where causes of death include any mention of dementia, Alzheimer’s disease or senility, England 2014
Figure 4: Number of deaths by place of death and causes of death including dementia, Alzheimer’s disease or senility. England 2014
0
50,000
100,000
150,000
200,000
250,000
Care home Hospice Home Hospital
Nu
mb
er
of
de
ath
s
No mention of dementia, Alzheimer's or senility
Any mention of dementia, Azheimer's or Senility
Underlying cause of dementia or Alzheimer's disease
Care home57%
Hospice1%
Home12%
Hospital29%
Other Places1%

Page 8
Briefing 2 - Place and cause of death for permanent and temporary residents of care homes
Figure 5: Age distribution of deaths in a care, England 2005-2014
Age at death
Nationally, between 2005 and 2014,
67% of all people who died were 75
years or older.
Figure 5 shows the age distribution of
people who died in a care home and
care home residents who died
elsewhere.
92% of people who died in care homes
were aged 75 years or older.
People aged 75 years or older make up
94% of permanent residents who died in
a care home and 88% of temporary residents who died in a care home.
Although relatively small in number, just over half (52%) of people aged under 75
years who died in a care home are temporary care home residents.
85% of care home residents who died elsewhere are aged 75 years or older.
66% of all permanent care home residents aged 75 years or over died in care
homes, compared to 34% who died elsewhere. In comparison, 41% of permanent
care home residents aged under 75 died in care homes, compared to 59% who died
elsewhere.
0
7,000
14,000
21,000
28,000
35,000
0-49 50-64 65-74 75-84 85-94 95+
Av
era
ge
an
nu
al
de
ath
s
Permanent care home residents who died in a care home
Temporary care home residents who died in a care home
Care home residents who died elsewhere
Page 9
Briefing 2 - Place and cause of death for permanent and temporary residents of care homes
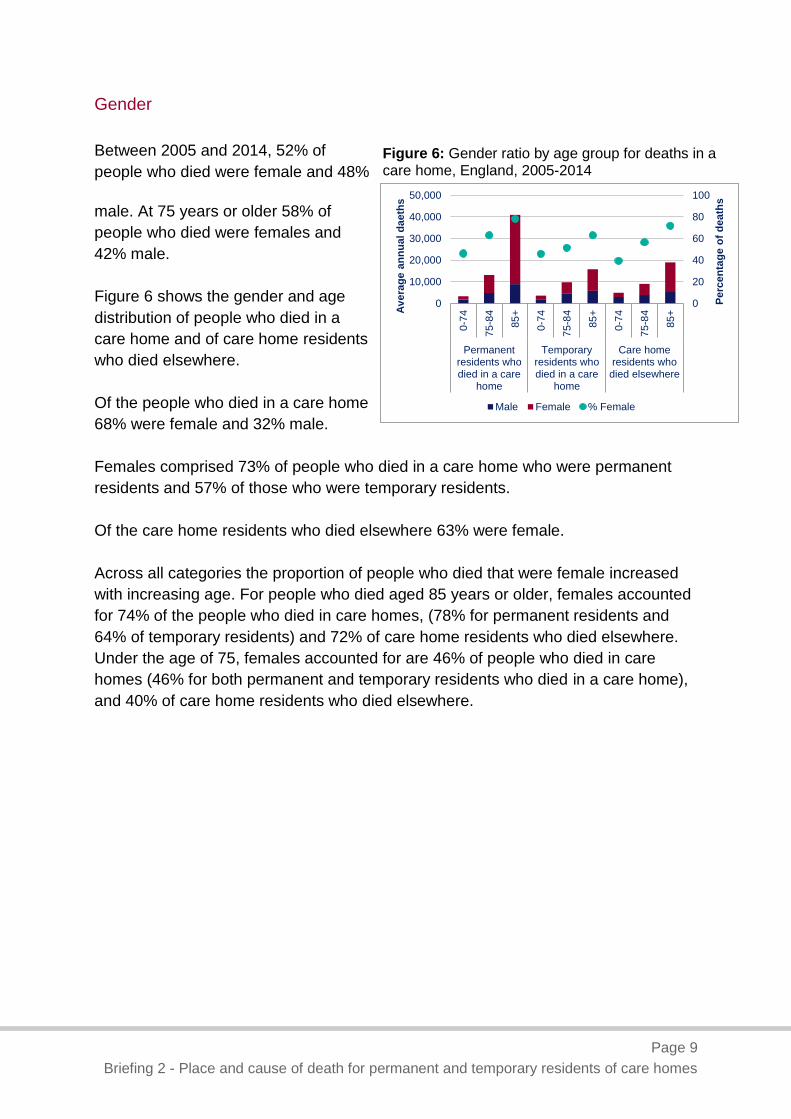
Figure 6: Gender ratio by age group for deaths in a care home, England, 2005-2014
Gender
Between 2005 and 2014, 52% of
people who died were female and 48%
male. At 75 years or older 58% of
people who died were females and
42% male.
Figure 6 shows the gender and age
distribution of people who died in a
care home and of care home residents
who died elsewhere.
Of the people who died in a care home
68% were female and 32% male.
Females comprised 73% of people who died in a care home who were permanent
residents and 57% of those who were temporary residents.
Of the care home residents who died elsewhere 63% were female.
Across all categories the proportion of people who died that were female increased
with increasing age. For people who died aged 85 years or older, females accounted
for 74% of the people who died in care homes, (78% for permanent residents and
64% of temporary residents) and 72% of care home residents who died elsewhere.
Under the age of 75, females accounted for are 46% of people who died in care
homes (46% for both permanent and temporary residents who died in a care home),
and 40% of care home residents who died elsewhere.
0
20
40
60
80
100
0
10,000
20,000
30,000
40,000
50,000
0-7
4
75
-84
85
+
0-7
4
75
-84
85
+
0-7
4
75
-84
85
+
Permanentresidents whodied in a care
home
Temporaryresidents whodied in a care
home
Care homeresidents who
died elsewhere
Perc
en
tag
e o
f d
eath
s
Av
era
ge a
nn
ual
daeth
sMale Female % Female

Page 10
Briefing 2 - Place and cause of death for permanent and temporary residents of care homes
Geographical variation
There is variation at a local level in the various statistics described in this bulletin.
Figures 7, 8 and 9 illustrate this for 324 local authorities grouped together in English
regions (formerly known as government office regions). Within the analysis, City of
London was grouped with Hackney, and Isles of Scilly with Cornwall. Data for the
three years 2012-2014 have been used to average out some of the year to year
variation due to small numbers.
People aged 75 years or older who died in a care home
Nationally 29% of all people who died aged 75 years or older died in a care home.
Figure 7 shows there is considerable variation between regions and between the
local authorities within regions. The lowest proportions are in local authorities in
London (9 of the lowest 10, all 16.3% or lower); while the 10 local authorities with
the highest proportions (all over 40%), are spread between the South West,
South East, Yorkshire and the Humber, West Midlands and East of England. The
greatest range between highest and lowest local authorities is seen in East of
England, although the interquartile range (difference between 75th and 25th
percentiles) is greatest in the South East.
Figure 7: The percentage of deaths aged 75 years or older that occur in a care home,
distribution for local authorities by region, England, 2012-2014
0
5
10
15
20
25
30
35
40
45
50
Perc
en
tag
e o
f d
eath
s i
n a
care
ho
me,
75
years
or
old
er
Median
75th percentile
95th percentile
Maximum
25th percentile
5th percentile
Minimum
Example
Page 11
Briefing 2 - Place and cause of death for permanent and temporary residents of care homes
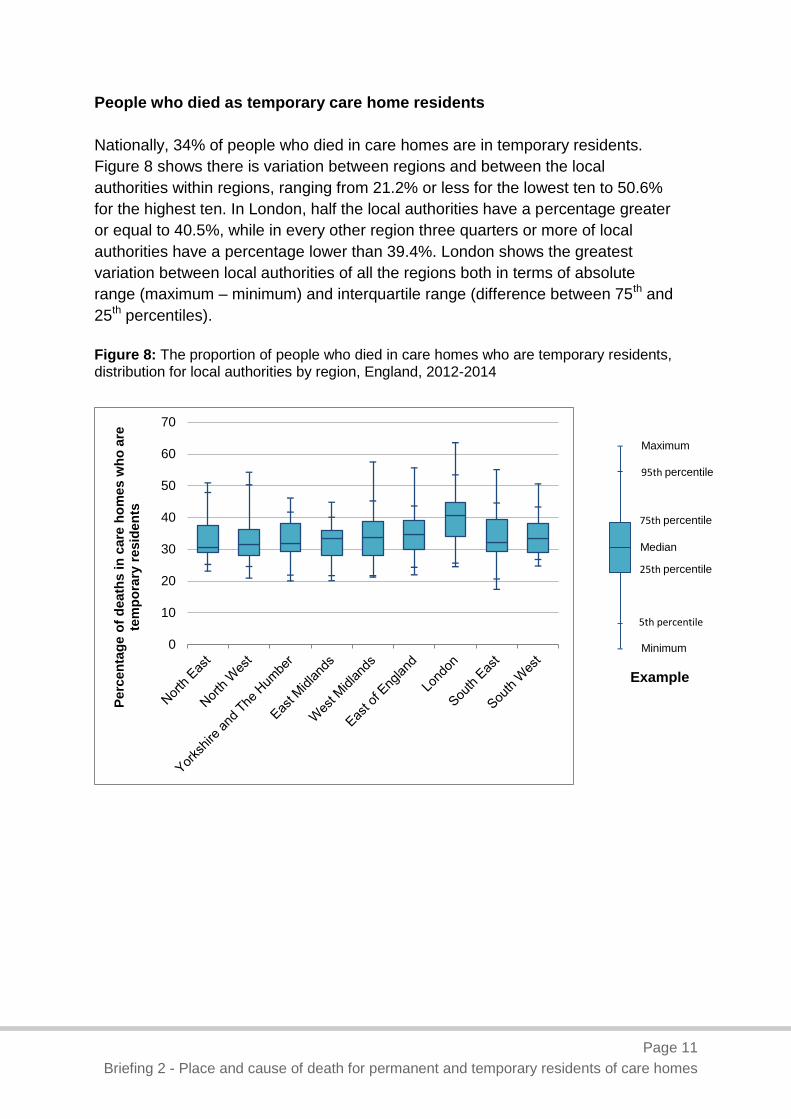
People who died as temporary care home residents
Nationally, 34% of people who died in care homes are in temporary residents.
Figure 8 shows there is variation between regions and between the local
authorities within regions, ranging from 21.2% or less for the lowest ten to 50.6%
for the highest ten. In London, half the local authorities have a percentage greater
or equal to 40.5%, while in every other region three quarters or more of local
authorities have a percentage lower than 39.4%. London shows the greatest
variation between local authorities of all the regions both in terms of absolute
range (maximum – minimum) and interquartile range (difference between 75th and
25th percentiles).
Figure 8: The proportion of people who died in care homes who are temporary residents, distribution for local authorities by region, England, 2012-2014
0
10
20
30
40
50
60
70
Perc
en
tag
e o
f d
eath
s i
n c
are
ho
mes w
ho
are
te
mp
ora
ry r
esid
en
ts
Median
75th percentile
95th percentile
Maximum
25th percentile
5th percentile
Minimum
Example

Page 12
Briefing 2 - Place and cause of death for permanent and temporary residents of care homes
Care home residents who died in a care home
Figure 9 shows the proportion of permanent care home residents who died in a care
home varies between local authorities from a minimum of 40.0% to a maximum of
88.1%. The England average for this period was 69%. Among the lowest 10 local
authorities, 6 are in London. The highest proportions are spread more widely, across
5 regions. The local authorities in London show the greatest variation of any region,
both in terms of absolute range and interquartile range.
Figure 9: The percentage of care home residents who died in a care home, distribution for local authorities by region, England, 2012-2014
Discussion
Over recent years England has seen care home and private homes as the place of
death for an increasing proportion of people who died with a corresponding
decreasing proportion of people dying in hospital1. This has been encouraged by
research indicating that, when asked, many people would prefer not to die in
hospital2, 3, 4, 5, 6.
This increasing role for care homes comes at a time of huge pressure on the social
care market including increasing financial pressure and difficulty recruiting and
retaining staff.7
0
10
20
30
40
50
60
70
80
90
100
Perc
en
tag
e o
f care
ho
me r
esid
en
ts w
ho
die
in
a c
are
ho
me
Median
75th percentile
95th percentile
Maximum
25th percentile
5th percentile
Minimum
Example

Page 13
Briefing 2 - Place and cause of death for permanent and temporary residents of care homes
People in a care home are some of the most vulnerable in society, many living with
multiple co-morbidities. In a nursing home patients needs are likely to be particularly
complex. Dementia, Alzheimer’s disease or senility is significant enough to be
mentioned as an underlying or contributory cause of death for 60% of people who die
in a care home. Multiple health care services will visit to provide care and treatment
to those in care homes and inevitably decision making in care homes involves
managing inherent uncertainties8, 9. Specialist palliative care services from hospices
or hospital are working with care homes in innovative ways both in patient care and
staff training.
If the trend in reducing avoidable hospital admissions and consequently reducing the
number of deaths in hospital is to be maintained in the context of an increasing
number of deaths and an ageing population, there will be an on-going demand for
end of life care services within care homes.
References
1. National End of Life Care Intelligence Network, Number and proportion of deaths
by place of occurrence.
2. Sue Ryder, A time and place. (July 2013)
3. Gomes B, Calanzani, N and Higginson IJ (2011). Local preferences and place of
death in regions within England 2010. Cecily Saunders International, London.
(August 2011)
4. British Social Attitudes Survey. Discussing and planning for end of life. Office of
the Chief Analyst, Department of Health
5. NHS England, Actions for End of Life Care: 2014-16.
6. End of Life Care Strategy: promoting high quality care for adults at the end of
their life. Department of Health (2008)
7. State of care. Care Quality Commission (2016)
8. Goodman C et al (2015) End of life care interventions for people with dementia in
care homes: addressing uncertainty within a framework for service delivery and
evaluation. BMC Palliative Care201514:42
9. Dixon J et al (2015) Equity in the Provision of Palliative Care in the UK: Review of
Evidence Personal Social Services Research Unit , London School of Economics
and Political Science

Page 14
Briefing 2 - Place and cause of death for permanent and temporary residents of care homes
Find out more:
The National End of Life Care Intelligence Network (NEoLCIN) aims to improve the
collection and analysis of information related to the quality, volume and costs of care
provided by the NHS, social services and the third sector to adults approaching the
end of life. This intelligence will help drive improvements in the quality and
productivity of services.
The NEoLCIN website contains more information and resources related to End of
Life Care. www.endoflifecare-intelligence.org.uk
The NEoLCIN is a member of the Health Intelligence Network in Public Health
England.
Contact us at: [email protected]
Published: September 2017
© Crown copyright 2017
Re-use of Crown copyright material (excluding logos) is allowed under the terms of
the Open Government Licence, visit http://www.nationalarchives.gov.uk/doc/open-
government-licence/version/3/ for terms and conditions.
PHE supports the UN Sustainable Development Goals