Embed Size (px)
Citation preview
National Diet and Nutrition Survey Results from Years 5 and 6 (combined) of the Rolling Programme (2012/2013 – 2013/2014)
A survey carried out on behalf of Public Health England and the Food Standards Agency

National Diet and Nutrition Survey. Results from Years 5-6 (combined) of the Rolling Programme
(2012/13 – 2013/14)
About Public Health England
Public Health England exists to protect and improve the nation's health and
wellbeing, and reduce health inequalities. It does this through world-class science,
knowledge and intelligence, advocacy, partnerships and the delivery of specialist
public health services. PHE is an operationally autonomous executive agency of
the Department of Health.
Public Health England
133-155 Waterloo Road
Wellington House
London SE1 8UG
Tel: 020 7654 8000
www.gov.uk/phe
Twitter: @PHE_uk
Facebook: www.facebook.com/PublicHealthEngland
Prepared by: (Editors) Beverley Bates, Lorna Cox, Sonja Nicholson Polly Page,
Ann Prentice, Toni Steer and Gillian Swan
For queries relating to this document, please contact: [email protected]
© Crown copyright 2016
You may re-use this information (excluding logos) free of charge in any format or
medium, under the terms of the Open Government Licence v3.0. To view this
licence, visit OGL or email [email protected]. Where we have
identified any third party copyright information you will need to obtain permission
from the copyright holders concerned.
Published September 2016
PHE publications gateway number: 2016248

National Diet and Nutrition Survey. Results from Years 5-6 (combined) of the Rolling Programme
(2012/13 – 2013/14)
Acknowledgements
We would like to thank all of those who gave up their time to be interviewed and who
welcomed interviewers and nurses into their homes. We would also like to acknowledge
the professionalism and commitment of interviewers and nurses who worked on the
survey and who are so important to the survey’s success.
We would like to thank everyone who contributed to the survey and the production of
this report. In particular, we would like to thank:
colleagues at NatCen Social Research (NatCen): Steve Edwards, Lynne Gold, Coral
Lawson, Natalie Maplethorpe, Caireen Roberts, Keeva Rooney and Katharine
Sadler
team members no longer at NatCen: Olu Alaka, Pauline Burge, Claire Deverill and
Nina Sal
members of the teams at the MRC Human Nutrition Research (HNR):
o reporting: Nida Ziauddeen and David Collins
o programmers and data management: Iain Bayes, Darren Cole, Alison James
and Jonathan Last
o the dietary assessment team: Birdem Amoutzopoulos, Sarah Elsey, Clare
Evans, Anna Harvey, Rachael Mack, Kirsty Trigg and Jenny Winster
o laboratory and analytical personnel: Veronica Bell, Sylvaine Bruggraber,
Karen Chamberlain, Marc Fleming, Kate Guberg, Dagmar Koller, Abhilash
Krishnankutty, Tabasum Makhdoomi, Amanda Mckillion, Priya Singh, Edyta
Telega and Stephen Young
o other colleagues at HNR: Yvette Edwards, Chris Bates, Anjali Mazumder and
David Pell
team members no longer at HNR:
Laura Angell, Steve Austin, Falai Baldeh, Karen Binks, Gemma Bramwell,
Sue Bryant, Carmen Canas, Mark Chatfield, Christine Clewes, Kate
Edgecombe, Emily Fitt, Petros Gousias, Debbie Harman, Lindi Holmes, Katie
Lamb, Kerry Lambert, Alison Lennox, Michelle Lewin, Tsz Ning Mak, Adrian
Mander, Ian Mather, Adam Messenger, Hanneke Mfuni, Natalie Momen,
Melanie Nester, Marilena Papanikolaou, Maria Pinheiro, Gerda Pot, Celia
Prynne, Carl Ruffel, Dorothy Singer, Ivonne Solis-Trapala, Deepti Sood,
Elizabeth Stickley, Oliver Tunnacliffe, Vijay Vaja, Josie Webber, Clare
Whitton, Peter Winship, Rachel Woodward, Antony Wright and Jianhua Wu
colleagues at University College London: Barbara Carter-Szatynska, Jennifer
Mindell, Shaun Scholes and Emmanouil Stamatakis
Stuart Bennett and colleagues at the Northern Ireland Statistics and Research
Agency for organising and carrying out fieldwork in Northern Ireland

National Diet and Nutrition Survey. Results from Years 5-6 (combined) of the Rolling Programme
(2012/13 – 2013/14)
4
colleagues at Addenbrooke’s Hospital for carrying out blood analyses
Professor Elaine Gunter (Specimen Solutions, LLC) for an independent review of the
laboratory procedures and analyses
Soren Brage and colleagues at the MRC Epidemiology Unit for their physical activity
expertise
members of the National Diet and Nutrition Survey (NDNS) Project Board: in
particular Professor Julie Lovegrove and Professor Hilary Powers
staff at Public Health England, in particular: Mark Bush, Sakhi Dodhia, Melanie
Farron-Wilson, Louis Levy, Mark Robinson and Alison Tedstone
staff at the Food Standards Agency: Clifton Gay, Joseph Shavila and Joanne Casey
staff at Food Standards Scotland: Anne Milne, Gillian Purdon and Heather Peace
staff at the Welsh Government: Sarah Rowles and Chris Roberts
National Diet and Nutrition Survey. Results from Years 5-6 (combined) of the Rolling Programme
(2012/13 – 2013/14)
5
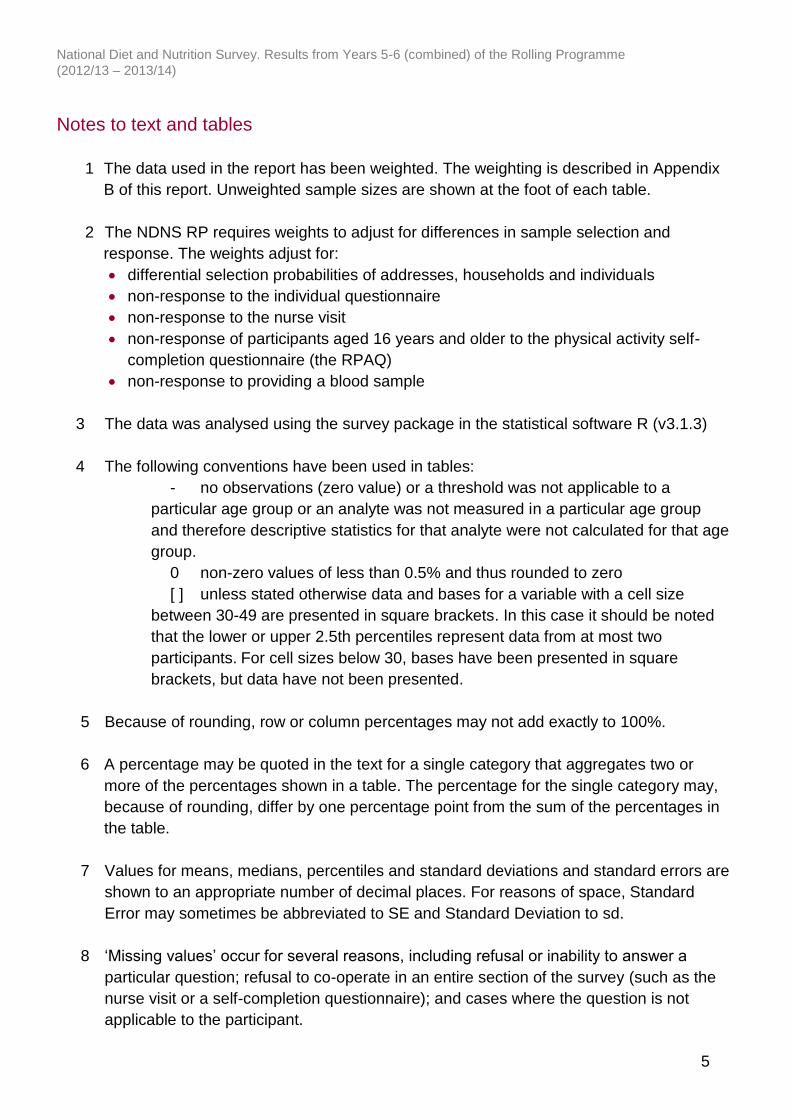
Notes to text and tables
1 The data used in the report has been weighted. The weighting is described in Appendix
B of this report. Unweighted sample sizes are shown at the foot of each table.
2 The NDNS RP requires weights to adjust for differences in sample selection and
response. The weights adjust for:
differential selection probabilities of addresses, households and individuals
non-response to the individual questionnaire
non-response to the nurse visit
non-response of participants aged 16 years and older to the physical activity self-
completion questionnaire (the RPAQ)
non-response to providing a blood sample
3 The data was analysed using the survey package in the statistical software R (v3.1.3)
4 The following conventions have been used in tables:
- no observations (zero value) or a threshold was not applicable to a
particular age group or an analyte was not measured in a particular age group
and therefore descriptive statistics for that analyte were not calculated for that age
group.
0 non-zero values of less than 0.5% and thus rounded to zero
[ ] unless stated otherwise data and bases for a variable with a cell size
between 30-49 are presented in square brackets. In this case it should be noted
that the lower or upper 2.5th percentiles represent data from at most two
participants. For cell sizes below 30, bases have been presented in square
brackets, but data have not been presented.
5 Because of rounding, row or column percentages may not add exactly to 100%.
6 A percentage may be quoted in the text for a single category that aggregates two or
more of the percentages shown in a table. The percentage for the single category may,
because of rounding, differ by one percentage point from the sum of the percentages in
the table.
7 Values for means, medians, percentiles and standard deviations and standard errors are
shown to an appropriate number of decimal places. For reasons of space, Standard
Error may sometimes be abbreviated to SE and Standard Deviation to sd.
8 ‘Missing values’ occur for several reasons, including refusal or inability to answer a
particular question; refusal to co-operate in an entire section of the survey (such as the
nurse visit or a self-completion questionnaire); and cases where the question is not
applicable to the participant.

National Diet and Nutrition Survey. Results from Years 5-6 (combined) of the Rolling Programme
(2012/13 – 2013/14)
6
9 The group to whom each table refers is stated at the upper left corner of the table.
10 The term ‘significant’ refers to statistical significance (at the 95% level) and is not
intended to imply substantive importance.
National Diet and Nutrition Survey. Results from Years 5-6 (combined) of the Rolling Programme
(2012/13 – 2013/14)
7
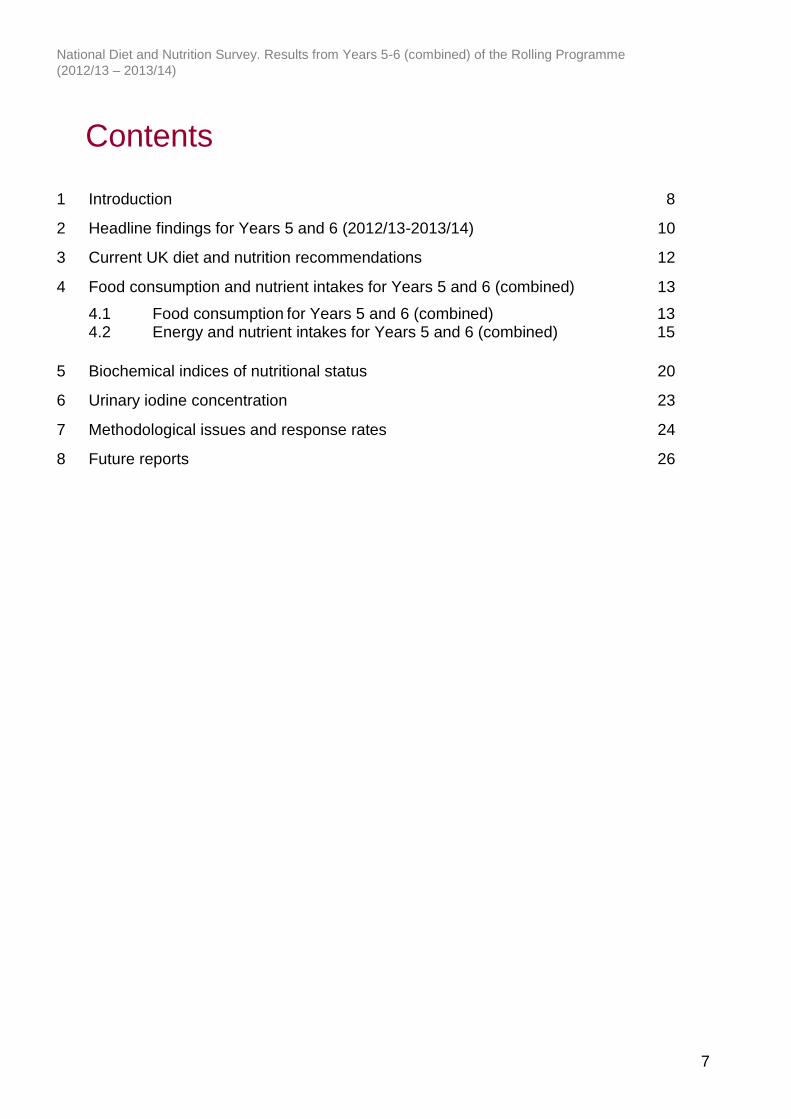
Contents
1 Introduction 8
2 Headline findings for Years 5 and 6 (2012/13-2013/14) 10
3 Current UK diet and nutrition recommendations 12
4 Food consumption and nutrient intakes for Years 5 and 6 (combined) 13
4.1 Food consumption for Years 5 and 6 (combined) 13 4.2 Energy and nutrient intakes for Years 5 and 6 (combined) 15
5 Biochemical indices of nutritional status 20
6 Urinary iodine concentration 23
7 Methodological issues and response rates 24
8 Future reports 26
National Diet and Nutrition Survey. Results from Years 5-6 (combined) of the Rolling Programme
(2012/13 – 2013/14)
8
1 Introduction
The National Diet and Nutrition Survey Rolling Programme (NDNS RP) is a continuous
programme of fieldwork designed to assess the diet, nutrient intake and nutritional
status of the general population aged 1.5 years and over living in private households in
the UK. The core NDNS RP is jointly funded by Public Health England (PHE)1 and the
UK Food Standards Agency (FSA). The NDNS RP is carried out by a consortium
comprising NatCen Social Research (NatCen) and MRC Human Nutrition Research
(HNR)2 with fieldwork in Northern Ireland carried out by Northern Ireland Statistics and
Research Agency (NISRA).
The NDNS provides the only source of high-quality, nationally representative data on
the types and quantities of foods consumed by individuals, from which estimates of
nutrient intake for the population are derived.3 Results are used by government to
develop policy and monitor progress on diet and nutrition objectives of UK health
departments, for example, work to tackle obesity and monitor progress towards a
healthy, balanced diet as defined by the Eatwell Guide.4 The food consumption data is
also used by FSA to assess exposure to chemicals in food, as part of the risk
assessment and communication process in response to a food emergency or to inform
negotiations on setting regulatory limits for contaminants.
The NDNS programme began in 1992 as a series of cross-sectional surveys designed
to be representative of the UK population, each covering a different age group: pre-
school children (aged 1.5 to 4.5 years);5 young people (aged 4 to 18 years);6 adults
(aged 19 to 64 years)7 and older adults (aged 65 years and over).8 Since 2008, the
NDNS has run continuously covering adults and children aged 1.5 years and over.
Methods used in the NDNS are continually reviewed to ensure they remain the best
practical methods available.
This report presents an overview of key findings for food consumption, nutrient intake
and nutritional status for the UK in Years 5 and 6 (combined) (2012/13–2013/14) of the
NDNS RP.9 The sample is drawn from all four UK countries, and is designed to be
nationally representative. Recruitment in both Wales10 and Northern Ireland11 was
boosted to 200 participants per year in order to achieve country-specific, representative
dietary health data.12
The report also provides background information on the survey, including the sample
and methodology (Appendix B). Urinary iodine measurement was introduced in Year 6
of the NDNS RP and is therefore presented for the first time in this report.

National Diet and Nutrition Survey. Results from Years 5-6 (combined) of the Rolling Programme
(2012/13 – 2013/14)
9
The commentary in this report mainly discusses the descriptive statistics for Years 5
and 6 (combined). The report is supported by accompanying Excel tables providing data
for Years 5 and 6 (combined) and the previous paired years (Years 1 and 2 combined;
Years 3 and 4 combined). Statistical comparisons have been performed to analyse
differences over time in respect of the latest data (Years 5 and 6 combined) against the
first two years of the RP (Years 1 and 2 combined) along with comparisons of the
interim paired years against the start of the RP.13,14,15 No comparisons have been
perfomed for Years 5 and 6 (combined) versus Years 3 and 4 (combined); see section 7
of this report and Appendix U for more information on the statistical analysis.
Statistical comparisons were performed for the key foods and nutrients listed below and
a commentary of differences has been provided:
total and food energy intake (MJ/day and kcal/day)
saturated fatty acids intake (g/day, % total energy and % food energy)
non-milk extrinsic sugars (NMES) intake (g/day, % total energy and % food energy)
non-starch polysaccharides (NSP) intake (g/day)
5-A-Day fruit and vegetable portions (portions/day)16 and % achieving 5-A-Day fruit
and vegetable portions16
red and processed meat consumption (g/day)
sugar-sweetened soft drinks consumption (g/day)
National Diet and Nutrition Survey. Results from Years 5-6 (combined) of the Rolling Programme
(2012/13 – 2013/14)
10
2 Headline findings for Years 5 and 6
(2012/13-2013/14)
Fruit and vegetables: Eight per cent of children aged 11 to 18 years met the 5-A-Day
recommendation for fruit and vegetable consumption.16,17 The proportion of adults
meeting the 5-A-Day recommendation16 was 27% of those aged 19 to 64 years and
35% of those aged 65 years and over. There were no significant differences between
Years 5 and 6 (combined) and Years 1 and 2 (combined) for any age/sex group either
in terms of average number of portions consumed or the percentage meeting the
recommendation.
Oily fish: Mean consumption of oily fish in all age groups was well below the
recommended one portion per week. There was no evidence of any change in
consumption over time.
Red and processed meat: Mean consumption of red and processed meat for women
aged 19 to 64 years and 65 years and over met the current maximum recommendation
for adults. However, mean consumption by men aged 19 to 64 years and 65 years and
over exceeded the recommendation. For adults aged 19 to 64 years, mean
consumption of red and processed meat was significantly lower in Years 5 and 6
(combined) and Years 3 and 4 (combined) than in Years 1 and 2 (combined) (65g, 68g
and 74g, respectively).
Sugar-sweetened soft drinks: There is evidence that consumption of sugar-
sweetened soft drinks has reduced in children. Mean consumption was significantly
lower in children aged 4 to 10 years in Years 5 and 6 (combined) compared with Years
1 and 2 (combined) (100g and 130g respectively).
Saturated fatty acids: Mean intakes of saturated fatty acids as a percentage of food
energy in Years 5 and 6 (combined) continued to exceed recommendations in all age
groups. There was no evidence of a fall in intake over time, except in those aged 65
years and over.
Non-milk extrinsic sugars: Children aged 4 to 10 years had a significantly lower
percentage of food energy from non-milk extrinsic sugars (NMES) in Years 5 and 6
(combined) compared with Years 1 and 2 (combined). However, mean intakes of
NMES continued to exceed recommendations18 for all age groups, with the exception
of women aged 65 years and over. There were no statistically significant differences
over time in other age groups.
National Diet and Nutrition Survey. Results from Years 5-6 (combined) of the Rolling Programme
(2012/13 – 2013/14)
11
Non-starch polysaccharides: Mean intakes of non-starch polysaccharides (NSP)
were below the recommendation for adults.19 There was no evidence of any change in
intake over time.
Vitamins and minerals: Evidence continues to indicate low intakes for some vitamins
and minerals (such as vitamin A and iron) in a proportion of participants, particularly in
those aged 11 to 18 years.
Vitamin D: Around a fifth of adults aged 19 to 64 years had low blood levels of
vitamin D.
Iodine: In all age/sex groups, urinary iodine concentrations met the WHO criteria for
assessing adequate intake in a population (ie median urinary iodine concentration
within the range 100-199μg/L and fewer than 20% of samples below 50μg/L).
National Diet and Nutrition Survey. Results from Years 5-6 (combined) of the Rolling Programme
(2012/13 – 2013/14)
12
3 Current UK diet and nutrition
recommendations
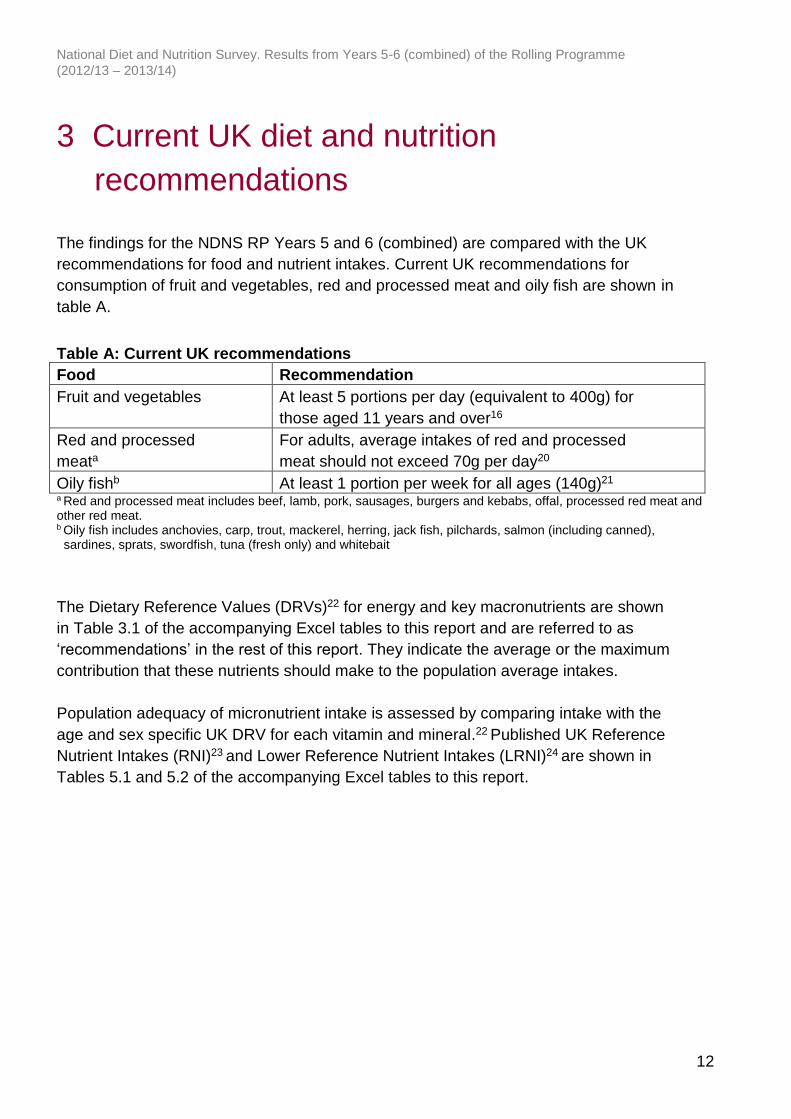
The findings for the NDNS RP Years 5 and 6 (combined) are compared with the UK
recommendations for food and nutrient intakes. Current UK recommendations for
consumption of fruit and vegetables, red and processed meat and oily fish are shown in
table A.
Table A: Current UK recommendations
Food Recommendation
Fruit and vegetables At least 5 portions per day (equivalent to 400g) for
those aged 11 years and over16
Red and processed
meata
For adults, average intakes of red and processed
meat should not exceed 70g per day20
Oily fishb At least 1 portion per week for all ages (140g)21 a Red and processed meat includes beef, lamb, pork, sausages, burgers and kebabs, offal, processed red meat and other red meat. b Oily fish includes anchovies, carp, trout, mackerel, herring, jack fish, pilchards, salmon (including canned), sardines, sprats, swordfish, tuna (fresh only) and whitebait
The Dietary Reference Values (DRVs)22 for energy and key macronutrients are shown
in Table 3.1 of the accompanying Excel tables to this report and are referred to as
‘recommendations’ in the rest of this report. They indicate the average or the maximum
contribution that these nutrients should make to the population average intakes.
Population adequacy of micronutrient intake is assessed by comparing intake with the
age and sex specific UK DRV for each vitamin and mineral.22 Published UK Reference
Nutrient Intakes (RNI)23 and Lower Reference Nutrient Intakes (LRNI)24 are shown in
Tables 5.1 and 5.2 of the accompanying Excel tables to this report.

National Diet and Nutrition Survey. Results from Years 5-6 (combined) of the Rolling Programme
(2012/13 – 2013/14)
13
4 Food consumption25 and nutrient intakes
for Years 5 and 6 (combined)
Statistical comparisons have been performed to analyse differences over time in respect of
the latest data (Years 5 and 6 combined) against the first two years of the RP (Years 1 and
2 combined) along with comparisons of the interim paired years against Years 1 and 2
(combined).13,14,15 No comparisons have been perfomed for Years 5 and 6 (combined)
versus Years 3 and 4 (combined); see section 7 of this report for more information on the
statistical analysis.
4.1 Food consumption25 for Years 5 and 6 (combined)
Table B provides a summary of the consumption of selected foods for adults and
children in Years 5 and 6 (combined).
Fruit and vegetables: Mean consumption of fruit and vegetables for children aged 11
to 18 years was 2.8 portions per day in Years 5 and 6 (combined) and the proportion
meeting the 5-A-Day recommendation16 was 8%. On average adults aged 19 to 64
years consumed 4.0 portions of fruit and vegetables per day and adults aged 65 years
and over consumed 4.2 portions per day. Twenty-five per cent of men aged 19 to 64
years, 28% of women aged 19 to 64 years, 34% of men aged 65 years and over and
35% of women aged 65 years and over met the 5-A-Day recommendation.16 There
were no significant differences in mean consumption of fruit and vegetables or the
proportion meeting the 5-A-Day recommendation16 between Years 5 and 6 (combined)
compared with Years 1 and 2 (combined) for any age/sex group. The consumption
figures for Years 1 and 2 (combined) and Years 3 and 4 (combined) have been revised
to correct an error in the calculation of 5-A-Day portions which caused a slight
overestimate in the consumption figures published in the Years 1–4 (combined)
report.17
(Tables B and 7.3)
Oily fish: Mean consumption of oily fish in all age groups remained well below the
recommended one portion (140g) per week in all paired years.26 Mean consumption
was equivalent to 13–29 grams per week in children and 54–87 grams per week in
adults. There were no statistically significant differences in consumption of oily fish
between Years 5 and 6 (combined) and Years 1 and 2 (combined).
(Tables B and 7.7)
National Diet and Nutrition Survey. Results from Years 5-6 (combined) of the Rolling Programme
(2012/13 – 2013/14)
14
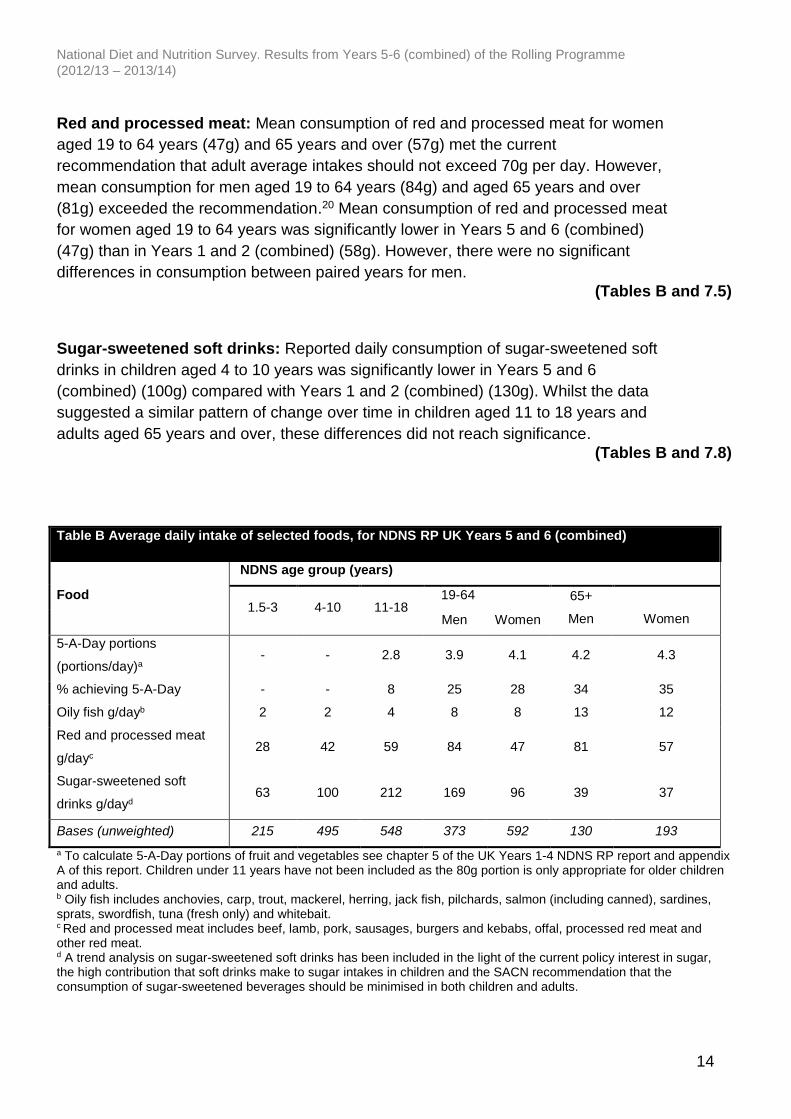
Red and processed meat: Mean consumption of red and processed meat for women
aged 19 to 64 years (47g) and 65 years and over (57g) met the current
recommendation that adult average intakes should not exceed 70g per day. However,
mean consumption for men aged 19 to 64 years (84g) and aged 65 years and over
(81g) exceeded the recommendation.20 Mean consumption of red and processed meat
for women aged 19 to 64 years was significantly lower in Years 5 and 6 (combined)
(47g) than in Years 1 and 2 (combined) (58g). However, there were no significant
differences in consumption between paired years for men.
(Tables B and 7.5)
Sugar-sweetened soft drinks: Reported daily consumption of sugar-sweetened soft
drinks in children aged 4 to 10 years was significantly lower in Years 5 and 6
(combined) (100g) compared with Years 1 and 2 (combined) (130g). Whilst the data
suggested a similar pattern of change over time in children aged 11 to 18 years and
adults aged 65 years and over, these differences did not reach significance.
(Tables B and 7.8)
Table B Average daily intake of selected foods, for NDNS RP UK Years 5 and 6 (combined)
Food
NDNS age group (years)
1.5-3 4-10 11-18 19-64 65+
Men
Women Men Women
5-A-Day portions
(portions/day)a - - 2.8 3.9 4.1 4.2 4.3
% achieving 5-A-Day - - 8 25 28 34 35
Oily fish g/dayb 2 2 4 8 8 13 12
Red and processed meat
g/dayc 28 42 59 84 47 81 57
Sugar-sweetened soft
drinks g/dayd 63 100 212 169 96 39 37
Bases (unweighted) 215 495 548 373 592 130 193
a To calculate 5-A-Day portions of fruit and vegetables see chapter 5 of the UK Years 1-4 NDNS RP report and appendix A of this report. Children under 11 years have not been included as the 80g portion is only appropriate for older children and adults. b Oily fish includes anchovies, carp, trout, mackerel, herring, jack fish, pilchards, salmon (including canned), sardines, sprats, swordfish, tuna (fresh only) and whitebait. c Red and processed meat includes beef, lamb, pork, sausages, burgers and kebabs, offal, processed red meat and other red meat. d A trend analysis on sugar-sweetened soft drinks has been included in the light of the current policy interest in sugar, the high contribution that soft drinks make to sugar intakes in children and the SACN recommendation that the consumption of sugar-sweetened beverages should be minimised in both children and adults.
National Diet and Nutrition Survey. Results from Years 5-6 (combined) of the Rolling Programme
(2012/13 – 2013/14)
15
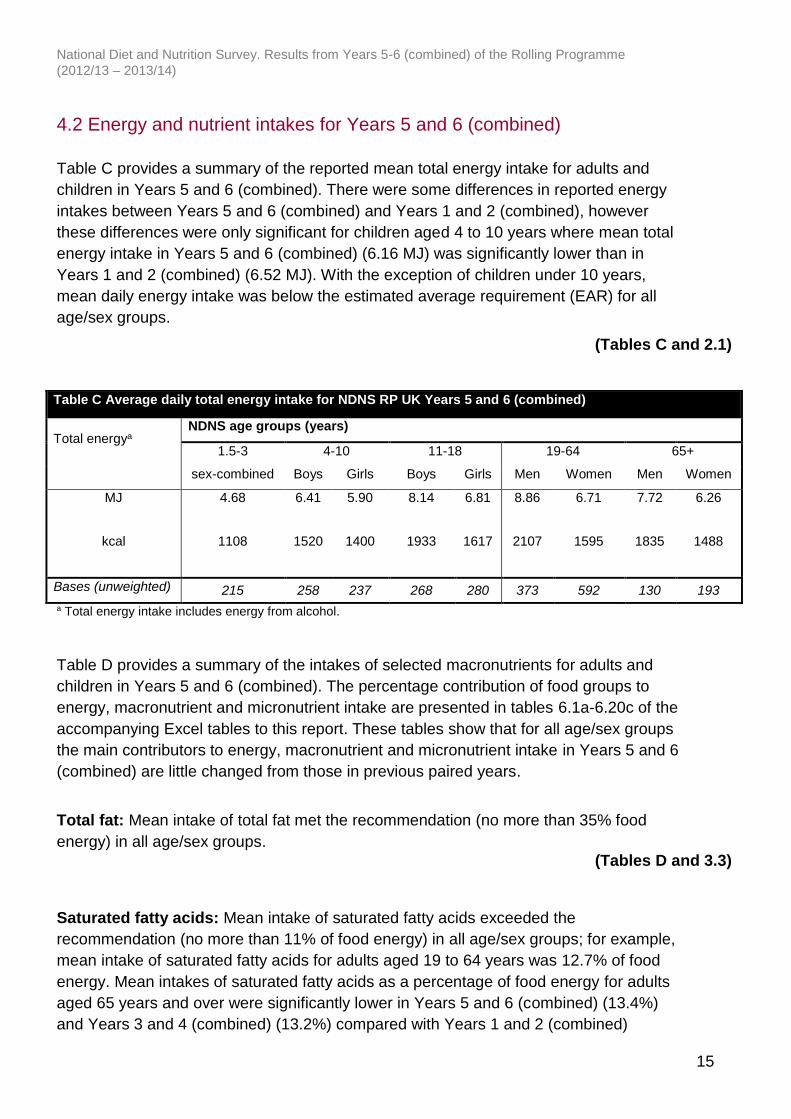
4.2 Energy and nutrient intakes for Years 5 and 6 (combined)
Table C provides a summary of the reported mean total energy intake for adults and
children in Years 5 and 6 (combined). There were some differences in reported energy
intakes between Years 5 and 6 (combined) and Years 1 and 2 (combined), however
these differences were only significant for children aged 4 to 10 years where mean total
energy intake in Years 5 and 6 (combined) (6.16 MJ) was significantly lower than in
Years 1 and 2 (combined) (6.52 MJ). With the exception of children under 10 years,
mean daily energy intake was below the estimated average requirement (EAR) for all
age/sex groups.
(Tables C and 2.1)
Table C Average daily total energy intake for NDNS RP UK Years 5 and 6 (combined)
Total energya
NDNS age groups (years)
1.5-3 4-10 11-18 19-64 65+
sex-combined Boys Girls Boys Girls Men Women Men Women
MJ 4.68 6.41 5.90 8.14 6.81 8.86 6.71 7.72 6.26
kcal 1108 1520 1400 1933 1617 2107 1595 1835 1488
Bases (unweighted) 215 258 237 268 280 373 592 130 193
a Total energy intake includes energy from alcohol.
Table D provides a summary of the intakes of selected macronutrients for adults and
children in Years 5 and 6 (combined). The percentage contribution of food groups to
energy, macronutrient and micronutrient intake are presented in tables 6.1a-6.20c of the
accompanying Excel tables to this report. These tables show that for all age/sex groups
the main contributors to energy, macronutrient and micronutrient intake in Years 5 and 6
(combined) are little changed from those in previous paired years.
Total fat: Mean intake of total fat met the recommendation (no more than 35% food
energy) in all age/sex groups.
(Tables D and 3.3)
Saturated fatty acids: Mean intake of saturated fatty acids exceeded the
recommendation (no more than 11% of food energy) in all age/sex groups; for example,
mean intake of saturated fatty acids for adults aged 19 to 64 years was 12.7% of food
energy. Mean intakes of saturated fatty acids as a percentage of food energy for adults
aged 65 years and over were significantly lower in Years 5 and 6 (combined) (13.4%)
and Years 3 and 4 (combined) (13.2%) compared with Years 1 and 2 (combined)

National Diet and Nutrition Survey. Results from Years 5-6 (combined) of the Rolling Programme
(2012/13 – 2013/14)
16
(14.3%). For all other age/sex groups mean intakes were similar in Years 5 and 6
(combined) to other paired years and there were no significant differences.
(Tables D, 3.4 and 6.4a-c)
Trans fatty acids: Mean intake of trans fatty acids provided 0.5–0.6% of food energy
for all age/sex groups, and thus continued to meet the recommendation (no more than
2% food energy).
(Tables D and 3.5)
Non-milk extrinsic sugars: Mean NMES27 intake exceeded the recommendation (no
more than 11% of food energy) for all age/sex groups except women aged 65 years and
over (10.4%). NMES intake was highest for children aged 4 to 10 years (13.4% of food
energy) and 11 to 18 years (15.2% of food energy). NMES intake as a percentage of
food energy was significantly lower in Years 5 and 6 (combined) than in Years 1 and 2
(combined) for children aged 4 to 10 years (13.4% and 14.4%, respectively). A new
recommendation for sugar intake was set by SACN in 2015. The new recommendation
is that intake of free sugars should provide no more than 5% of total energy intake for
adults and children aged over two years.18 The main sources of NMES in children aged
18 years and under were ‘cereal and cereal products’ (mainly cakes and biscuits), ‘non-
alcoholic beverages’ (soft drinks and fruit juice), ‘sugar, preserves and confectionery’
and (in younger children) ‘milk and milk products’ (sweetened yogurt, fromage frais and
other dairy desserts). The main sources of NMES in adults aged 19 years and over
were ‘sugar, preserves and confectionery’, ‘non-alcoholic beverages’ (soft drinks and
fruit juice) and ‘cereal and cereal products’ (mainly cakes and biscuits) with ‘alcoholic
beverages’ providing a further 7-9% of intake.
The contribution of sugar-sweetened soft drinks to NMES intake indicates a similar
pattern with the contribution being similar or slightly decreasing across the paired years.
(Tables D, 3.7 and 6.7a-c)
Non-starch polysaccharides: Mean intakes of NSP28 remained well below the DRV
set at a population average intake of 18g per day for adults aged 19 years and over (13-
14 g/day). Intakes were similar in Years 5 and 6 (combined) to those in Years 1 and 2
(combined) for adults aged 19 to 64 years and 65 years and over; there were no
statistically significant differences in NSP intake between paired years. A new
recommendation was set by SACN for fibre intake in 2015 based on a different
definition of fibre. 19
(Tables D and 3.8)

National Diet and Nutrition Survey. Results from Years 5-6 (combined) of the Rolling Programme
(2012/13 – 2013/14)
17
Table D Average daily intake of selected macronutrients, for NDNS RP UK Years 5 and 6 (combined)
Macronutrient
NDNS age group (years)
1.5-3 4-10 11-18 19-64 65+
Total fat (% food energy) 33.9 33.4 33.6 34.2 34.7
Saturated fatty acids (% food energy) 14.6 13.3 12.6 12.7 13.4
Trans fatty acids (% food energy) 0.5 0.5 0.5 0.5 0.6
NMES18,27 (% food energy) 12.2 13.4 15.2 12.3 11.1
NSP19,28 (g) 7.8 10.7 12.2 14.0 13.4
Bases (unweighted) 215 495 548 965 323
Fifty-three per cent of adults aged 19 to 64 years and 53% of adults aged 65 years and
over reported consuming alcohol during the four-day recording period. On average,
adults aged 19 to 64 years who consumed alcohol during the four-day recording period
obtained 8.4% of total energy intake from alcohol and adults aged 65 years and over
obtained 7.1%.
(Table 4.1)
Table E provides a summary of the intakes of selected micronutrients for adults and
children in Years 5 and 6 (combined). Mean intake is compared with the RNI23 and
estimates of the proportion with intake below the LRNI are made.24 Published UK RNIs
and LRNIs are shown in tables 5.1 and 5.2 of the accompanying Excel tables to this
report.
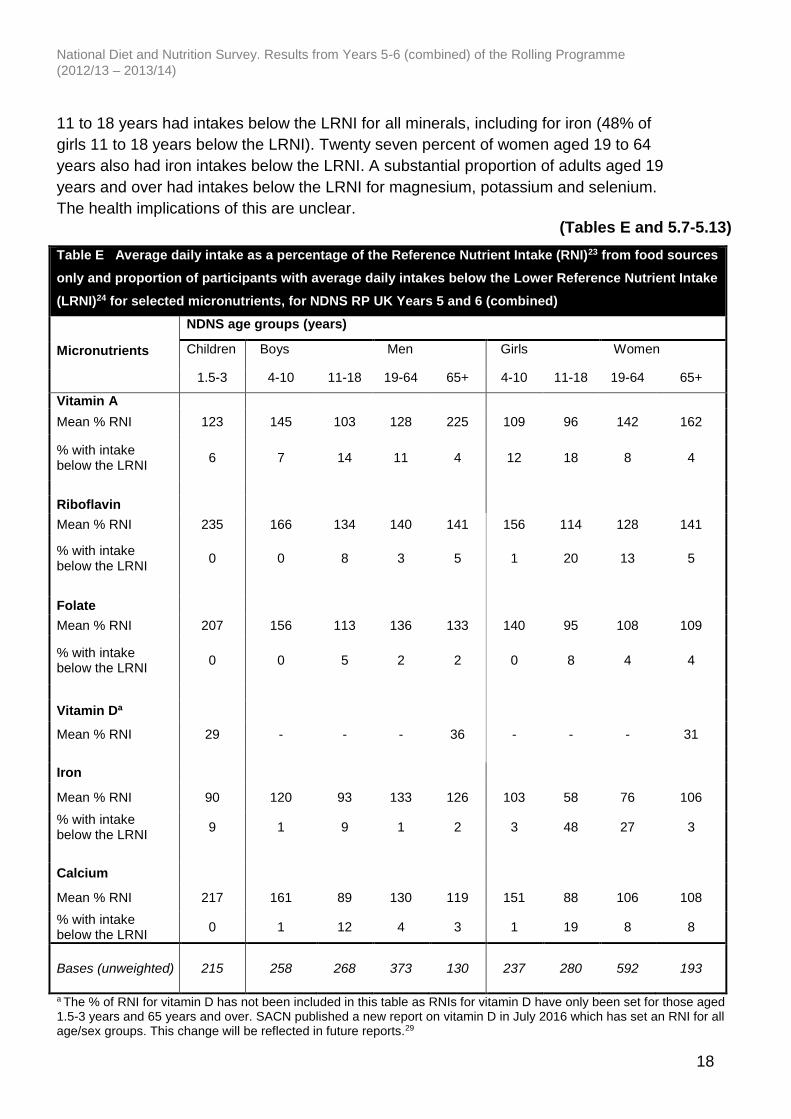
Vitamins: Mean daily intakes of most vitamins from food sources were close to or
above the RNI for the majority of age/sex groups. A substantial proportion (16%) of
children aged 11 to 18 years had intakes below the LRNI for vitamin A. In addition, girls
aged 11 to 18 years and women aged 19 to 64 years had intakes below the LRNI for
riboflavin (20% and 13%, respectively).
(Tables E and 5.3-5.6)
Vitamin D: For vitamin D, RNIs are set only for those aged up to 4 years and those
aged 65 years and over and there are no LRNIs set. Mean intakes from food sources
only were well below the RNI in both these age groups: 29% of the RNI for children
aged 1.5 to 3 years and 33% of the RNI for adults aged 65 years and over.29
(Tables E and 5.6)
Minerals: For children aged 4 to 10 years, mean intakes of all minerals were close to or
above the RNI with the exception of zinc intake in girls (87% of the RNI) and few
children had intakes below the LRNI. However, a substantial proportion of children aged
National Diet and Nutrition Survey. Results from Years 5-6 (combined) of the Rolling Programme
(2012/13 – 2013/14)
18
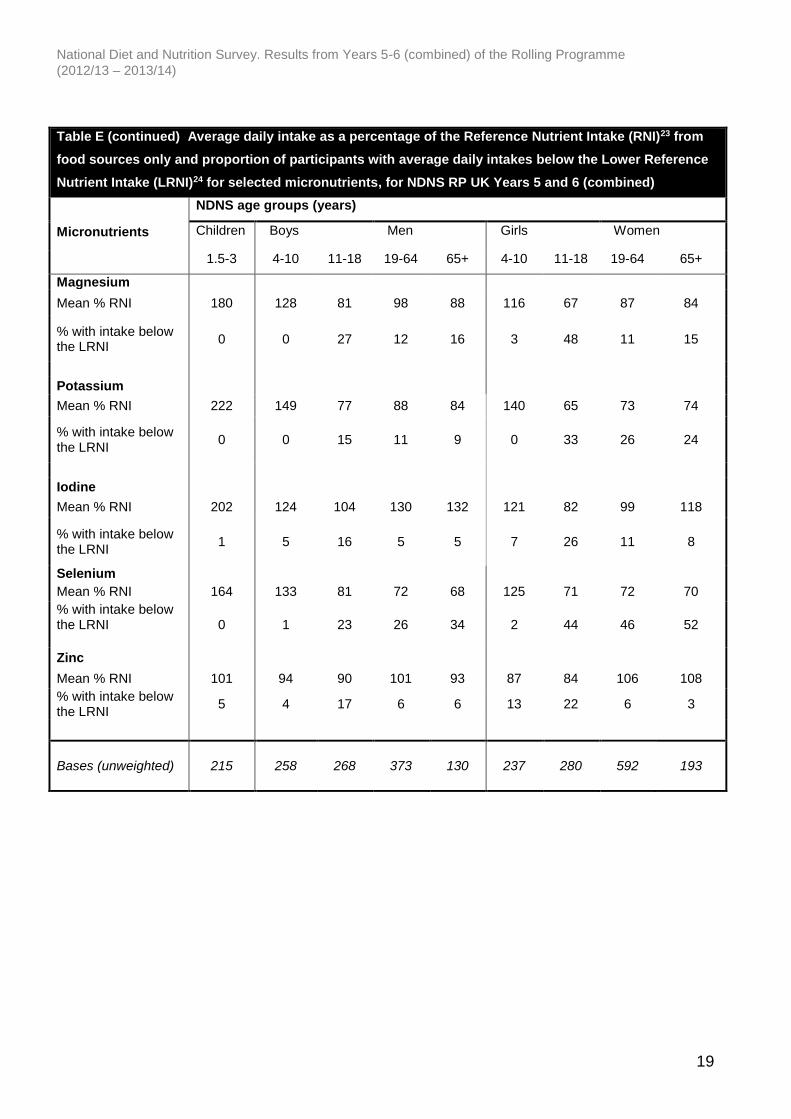
11 to 18 years had intakes below the LRNI for all minerals, including for iron (48% of
girls 11 to 18 years below the LRNI). Twenty seven percent of women aged 19 to 64
years also had iron intakes below the LRNI. A substantial proportion of adults aged 19
years and over had intakes below the LRNI for magnesium, potassium and selenium.
The health implications of this are unclear.
(Tables E and 5.7-5.13)
Table E Average daily intake as a percentage of the Reference Nutrient Intake (RNI)23 from food sources
only and proportion of participants with average daily intakes below the Lower Reference Nutrient Intake
(LRNI)24 for selected micronutrients, for NDNS RP UK Years 5 and 6 (combined)
Micronutrients
NDNS age groups (years)
Children Boys Men Girls Women
1.5-3 4-10 11-18 19-64 65+ 4-10 11-18 19-64 65+
Vitamin A
Mean % RNI 123 145 103 128 225 109 96 142 162
% with intake below the LRNI
6 7 14 11 4 12 18 8 4
Riboflavin
Mean % RNI 235 166 134 140 141 156 114 128 141
% with intake below the LRNI
0 0 8 3 5 1 20 13 5
Folate
Mean % RNI 207 156 113 136 133 140 95 108 109
% with intake below the LRNI
0 0 5 2 2 0 8 4 4
Vitamin Da
Mean % RNI 29 - - - 36 - - - 31
Iron
Mean % RNI 90 120 93 133 126 103 58 76 106
% with intake below the LRNI
9 1 9 1 2 3 48 27 3
Calcium
Mean % RNI 217 161 89 130 119 151 88 106 108
% with intake below the LRNI
0 1 12 4 3 1 19 8 8
Bases (unweighted) 215 258 268 373 130 237 280 592 193
a The % of RNI for vitamin D has not been included in this table as RNIs for vitamin D have only been set for those aged 1.5-3 years and 65 years and over. SACN published a new report on vitamin D in July 2016 which has set an RNI for all age/sex groups. This change will be reflected in future reports.29
National Diet and Nutrition Survey. Results from Years 5-6 (combined) of the Rolling Programme
(2012/13 – 2013/14)
19
Table E (continued) Average daily intake as a percentage of the Reference Nutrient Intake (RNI)23 from
food sources only and proportion of participants with average daily intakes below the Lower Reference
Nutrient Intake (LRNI)24 for selected micronutrients, for NDNS RP UK Years 5 and 6 (combined)
Micronutrients
NDNS age groups (years)
Children Boys Men Girls Women
1.5-3 4-10 11-18 19-64 65+ 4-10 11-18 19-64 65+
Magnesium
Mean % RNI 180 128 81 98 88 116 67 87 84
% with intake below the LRNI
0 0 27 12 16 3 48 11 15
Potassium
Mean % RNI 222 149 77 88 84 140 65 73 74
% with intake below the LRNI
0 0 15 11 9 0 33 26 24
Iodine
Mean % RNI 202 124 104 130 132 121 82 99 118
% with intake below the LRNI
1 5 16 5 5 7 26 11 8
Selenium
Mean % RNI 164 133 81 72 68 125 71 72 70
% with intake below the LRNI
0 1 23 26 34 2 44 46 52
Zinc
Mean % RNI 101 94 90 101 93 87 84 106 108
% with intake below the LRNI
5 4 17 6 6 13 22 6 3
Bases (unweighted) 215 258 268 373 130 237 280 592 193
National Diet and Nutrition Survey. Results from Years 5-6 (combined) of the Rolling Programme
(2012/13 – 2013/14)
20
5 Biochemical indices of nutritional status
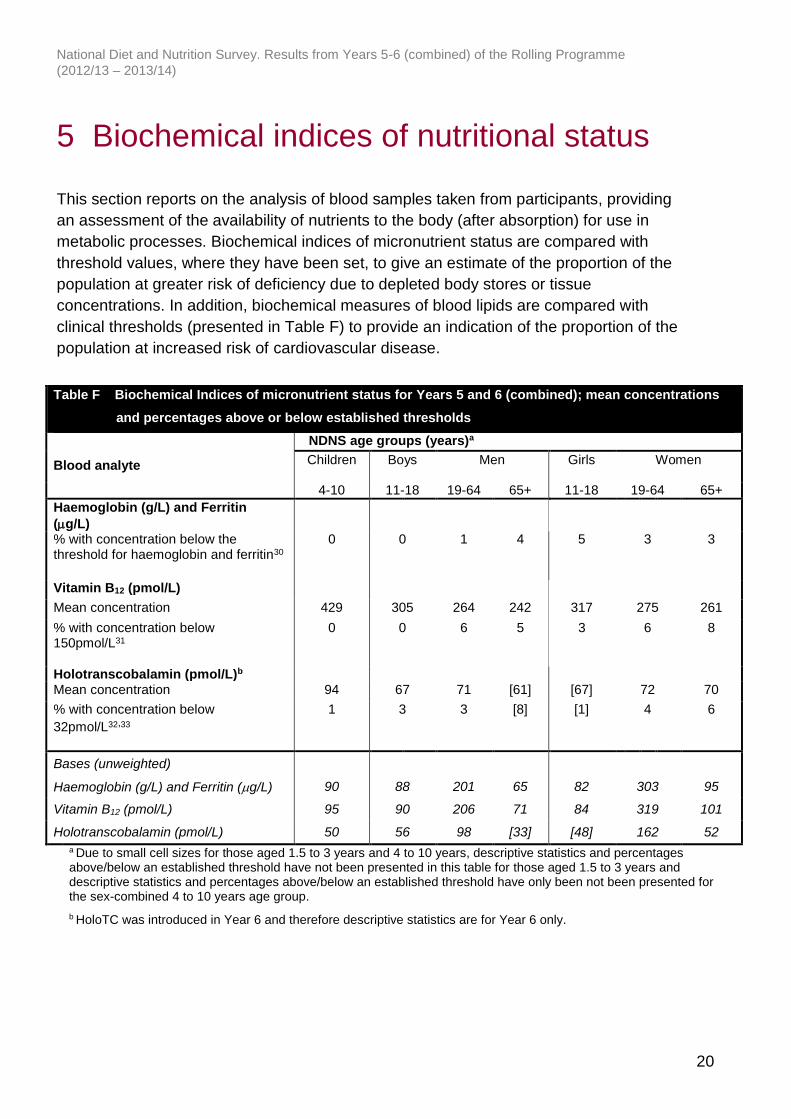
This section reports on the analysis of blood samples taken from participants, providing
an assessment of the availability of nutrients to the body (after absorption) for use in
metabolic processes. Biochemical indices of micronutrient status are compared with
threshold values, where they have been set, to give an estimate of the proportion of the
population at greater risk of deficiency due to depleted body stores or tissue
concentrations. In addition, biochemical measures of blood lipids are compared with
clinical thresholds (presented in Table F) to provide an indication of the proportion of the
population at increased risk of cardiovascular disease.
Table F Biochemical Indices of micronutrient status for Years 5 and 6 (combined); mean concentrations
and percentages above or below established thresholds
Blood analyte
NDNS age groups (years)a
Children Boys Men Girls Women
4-10 11-18 19-64 65+ 11-18 19-64 65+
Haemoglobin (g/L) and Ferritin
(g/L)
% with concentration below the threshold for haemoglobin and ferritin30
0 0 1 4 5 3 3
Vitamin B12 (pmol/L)
Mean concentration 429 305 264 242 317 275 261
% with concentration below 150pmol/L31
0 0 6 5 3 6 8
Holotranscobalamin (pmol/L)b Mean concentration 94 67 71 [61] [67] 72 70
% with concentration below
32pmol/L32,33
1 3 3 [8] [1] 4 6
Bases (unweighted)
Haemoglobin (g/L) and Ferritin (g/L) 90 88 201 65 82 303 95
Vitamin B12 (pmol/L) 95 90 206 71 84 319 101
Holotranscobalamin (pmol/L) 50 56 98 [33] [48] 162 52
a Due to small cell sizes for those aged 1.5 to 3 years and 4 to 10 years, descriptive statistics and percentages above/below an established threshold have not been presented in this table for those aged 1.5 to 3 years and descriptive statistics and percentages above/below an established threshold have only been not been presented for the sex-combined 4 to 10 years age group.
b HoloTC was introduced in Year 6 and therefore descriptive statistics are for Year 6 only.
National Diet and Nutrition Survey. Results from Years 5-6 (combined) of the Rolling Programme
(2012/13 – 2013/14)
21
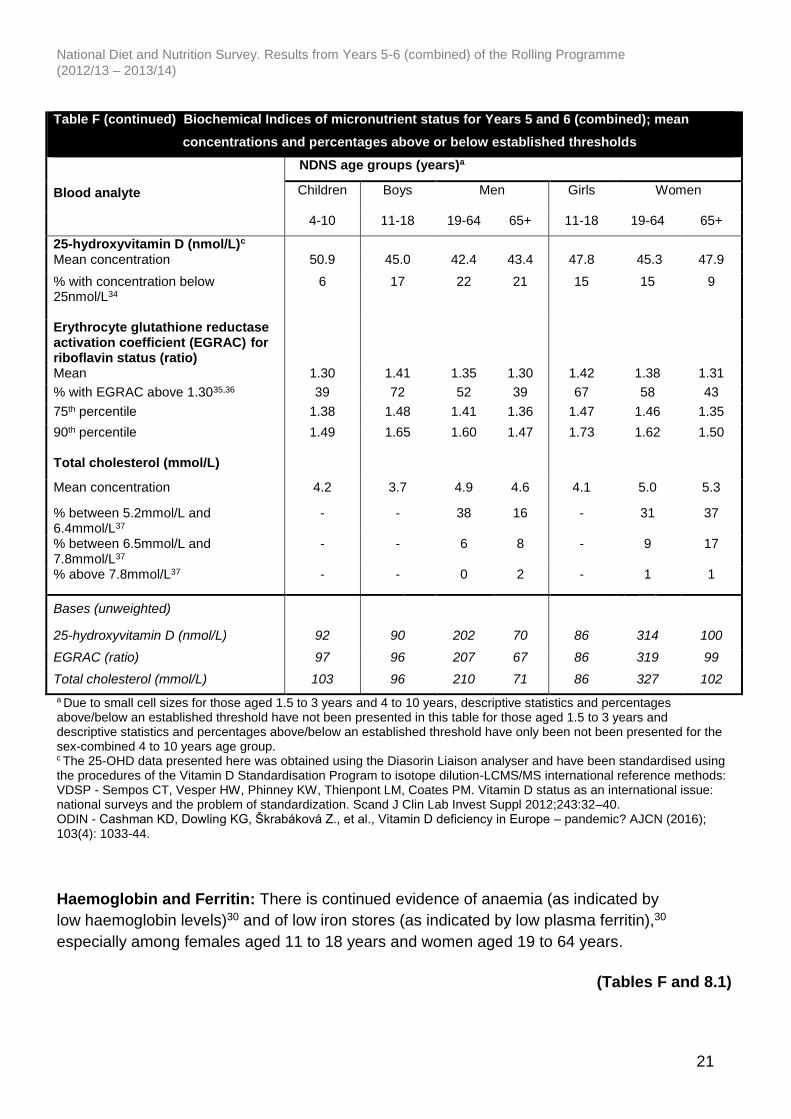
Table F (continued) Biochemical Indices of micronutrient status for Years 5 and 6 (combined); mean
concentrations and percentages above or below established thresholds
Blood analyte
NDNS age groups (years)a
Children Boys Men Girls Women
4-10 11-18 19-64 65+ 11-18 19-64 65+
25-hydroxyvitamin D (nmol/L)c Mean concentration 50.9 45.0 42.4 43.4 47.8 45.3 47.9
% with concentration below 25nmol/L34
6 17 22 21 15 15 9
Erythrocyte glutathione reductase activation coefficient (EGRAC) for riboflavin status (ratio)
Mean 1.30 1.41 1.35 1.30 1.42 1.38 1.31
% with EGRAC above 1.3035,36 39 72 52 39 67 58 43
75th percentile 1.38 1.48 1.41 1.36 1.47 1.46 1.35
90th percentile
1.49 1.65 1.60 1.47 1.73 1.62 1.50
Total cholesterol (mmol/L)
Mean concentration 4.2 3.7 4.9 4.6 4.1 5.0 5.3
% between 5.2mmol/L and 6.4mmol/L37
- - 38 16 - 31 37
% between 6.5mmol/L and 7.8mmol/L37
- - 6 8 - 9 17
% above 7.8mmol/L37 - - 0 2 - 1 1
Bases (unweighted)
25-hydroxyvitamin D (nmol/L) 92 90 202 70 86 314 100
EGRAC (ratio) 97 96 207 67 86 319 99
Total cholesterol (mmol/L) 103 96 210 71 86 327 102
a Due to small cell sizes for those aged 1.5 to 3 years and 4 to 10 years, descriptive statistics and percentages above/below an established threshold have not been presented in this table for those aged 1.5 to 3 years and descriptive statistics and percentages above/below an established threshold have only been not been presented for the sex-combined 4 to 10 years age group. c The 25-OHD data presented here was obtained using the Diasorin Liaison analyser and have been standardised using the procedures of the Vitamin D Standardisation Program to isotope dilution-LCMS/MS international reference methods: VDSP - Sempos CT, Vesper HW, Phinney KW, Thienpont LM, Coates PM. Vitamin D status as an international issue: national surveys and the problem of standardization. Scand J Clin Lab Invest Suppl 2012;243:32–40. ODIN - Cashman KD, Dowling KG, Škrabáková Z., et al., Vitamin D deficiency in Europe – pandemic? AJCN (2016); 103(4): 1033-44.
Haemoglobin and Ferritin: There is continued evidence of anaemia (as indicated by
low haemoglobin levels)30 and of low iron stores (as indicated by low plasma ferritin),30
especially among females aged 11 to 18 years and women aged 19 to 64 years.
(Tables F and 8.1)

National Diet and Nutrition Survey. Results from Years 5-6 (combined) of the Rolling Programme
(2012/13 – 2013/14)
22
Vitamin B12: There is evidence of low vitamin B12 status from serum vitamin B12 in girls
aged 11 to 18 years and in adults aged 19 years and over.31 There is also evidence of
low vitamin B12 status from low holotranscobalamin (HoloTC) concentration in all age
groups.32 Percentages below the threshold are not the same for the two measures.
Holotranscobalamin (the active form of vitamin B12 which is available for uptake into
cells) is a relatively new measure and is believed to be a better indicator of functional
vitamin B12 deficiency, as well as an indicator of the early stages of B12 deficiency
(recent low B12 ingestion), as it changes faster than total B12 with altered dietary intake
of B12. 33
Chronic untreated vitamin B12 deficiency can cause macrocytic anaemia and is
associated with lasting neurological damage.
(Tables F, 8.2 and 8.3)
Vitamin D: There is evidence of low vitamin D status (vitamin D concentration below
the threshold of 25nmol/L)34 in all reported age/sex groups; this has implications for
bone health, increasing the risk of rickets and osteomalacia. Around a fifth of adults
aged 19 to 64 years and a sixth of children aged 11 to 18 years and adults aged 65
years and over had levels below the threshold.
(Tables F and 8.6)
Riboflavin: A substantial proportion of participants in all age/sex groups had raised
erythrocyte glutathione reductase activation coefficient (EGRAC) indicating biochemical
riboflavin depletion.35 However, there is uncertainty about the functional consequences
of a raised EGRAC.
(Tables F and 8.4)
Results are not presented in this report for vitamin C, retinol, vitamin E or thiamin
(ETKAC) where there has previously been little evidence of low status.38
Cholesterol: The proportion of adults who had a serum total cholesterol concentration
between 6.5 to 7.8mmol/L, indicating a moderately elevated cardiovascular risk37 was
6% of men and 9% of women aged 19 to 64 years and 8% of men and 17% of women
aged 65 years and over. Serum total cholesterol concentrations greater than 7.8mmol/L,
indicating severe risk,37 were almost exclusively limited to those aged 65 years and over
(2%).
(Tables F and 8.7)
National Diet and Nutrition Survey. Results from Years 5-6 (combined) of the Rolling Programme
(2012/13 – 2013/14)
23
6 Urinary iodine concentration
Lack of dietary iodine can lead to goitre (enlargement of the thyroid), hypothyroidism
and impairment of mental heath including retardation in infants and children. Indicators
to assess and monitor the iodine status of a population have been defined by the World
Health Organization (WHO).39 A population urinary iodine concentration median above
100μg/L (with less than 20% of the population below 50 μg/L) is recognised as an
indicator of a low prevalence of iodine deficiency within that group.
A spot urine sample was introduced in Year 6 of the NDNS RP for measurement of
urinary iodine concentration. The median and other descriptive statistics for urinary
iodine concentration are presented for children aged 4 to 18 years (sex-combined),
adults aged 19 years and over (sex-combined) and women of childbearing age (16 to
49 years) for Year 6 only in table 9.1 and figure 9.2 of the accompanying Excel tables
and figures to this report.40
In all age/sex groups, results met the WHO criteria for adequate iodine intake (i.e.
median urinary iodine concentration within the range 100-199μg/L and fewer than 20%
of samples below 50μg/L). The population median urinary iodine for women of
childbearing age (16 to 49 years) was 117μg/L. For other age groups the median
urinary iodine concentration was 119μg/L for adults aged 19 years and over and
138μg/L for children aged 4 to 18 years.
(Table 9.1 and figure 9.2)
National Diet and Nutrition Survey. Results from Years 5-6 (combined) of the Rolling Programme
(2012/13 – 2013/14)
24
7 Methodological issues and response
rates
An overview of the purpose, documents, methodologies, procedures for data collection
and quality control are provided in the supporting technical appendices to this report.
Further, Appendix X of the UK Years 1 to 4 (combined) report41 includes a consideration
of the methodological issues and limitations of self-reported measures of food intake
such as time between diet and nutritional status assessment and days of the week
recorded in the food diary, as well as mis-reporting, which is a limitation of all methods
of measuring food intake currently used in dietary surveys. These should be borne in
mind while interpreting these findings.
A random sample of 8,879 addresses from 323 postcode sectors, drawn from the
Postcode Address File, was issued between April 2012 and March 2014.42 Where there
were multiple households at an address, a single household was selected at random.
For each household, either one adult (aged 19 years and over) and one child (aged 1.5
to 18 years), or one child only were randomly selected to take part.43
Selected individuals were asked to complete a diary of food and drink consumption over
four consecutive days (with the start date randomly allocated) and an interview was
conducted to collect background information on dietary habits, socio-demographic
status, lifestyle and physical activity. Participants also had their height and weight
measured and those aged four years and over asked to provide a spot urine sample (in
Year 6 only). Participants who agreed to a nurse visit were asked to provide a blood
sample to assess biochemical indices of nutritional status. Physical measurements
including blood pressure and waist and hip circumferences were also taken by the
nurse.
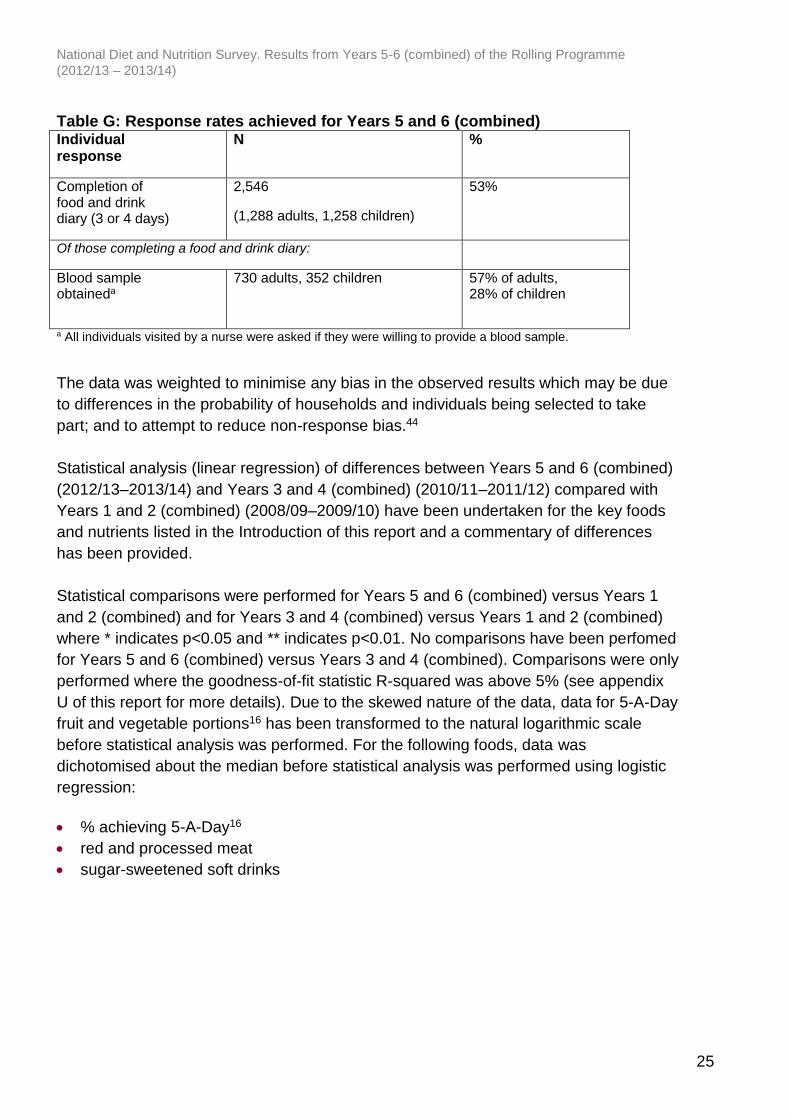
Response rates achieved for key components of the NDNS RP are shown in Table G.
National Diet and Nutrition Survey. Results from Years 5-6 (combined) of the Rolling Programme
(2012/13 – 2013/14)
25
Table G: Response rates achieved for Years 5 and 6 (combined) Individual response
N %
Completion of food and drink diary (3 or 4 days)
2,546
(1,288 adults, 1,258 children)
53%
Of those completing a food and drink diary:
Blood sample obtaineda
730 adults, 352 children
57% of adults, 28% of children
a All individuals visited by a nurse were asked if they were willing to provide a blood sample.
The data was weighted to minimise any bias in the observed results which may be due
to differences in the probability of households and individuals being selected to take
part; and to attempt to reduce non-response bias.44
Statistical analysis (linear regression) of differences between Years 5 and 6 (combined)
(2012/13–2013/14) and Years 3 and 4 (combined) (2010/11–2011/12) compared with
Years 1 and 2 (combined) (2008/09–2009/10) have been undertaken for the key foods
and nutrients listed in the Introduction of this report and a commentary of differences
has been provided.
Statistical comparisons were performed for Years 5 and 6 (combined) versus Years 1
and 2 (combined) and for Years 3 and 4 (combined) versus Years 1 and 2 (combined)
where * indicates p<0.05 and ** indicates p<0.01. No comparisons have been perfomed
for Years 5 and 6 (combined) versus Years 3 and 4 (combined). Comparisons were only
performed where the goodness-of-fit statistic R-squared was above 5% (see appendix
U of this report for more details). Due to the skewed nature of the data, data for 5-A-Day
fruit and vegetable portions16 has been transformed to the natural logarithmic scale
before statistical analysis was performed. For the following foods, data was
dichotomised about the median before statistical analysis was performed using logistic
regression:
% achieving 5-A-Day16
red and processed meat
sugar-sweetened soft drinks

National Diet and Nutrition Survey. Results from Years 5-6 (combined) of the Rolling Programme
(2012/13 – 2013/14)
26
8 Future reports
A set of tables for Year 7 (only) (2014/15) will be published in 2016/17 followed later in
2017 by a summary report for Years 7 and 8 (combined) (2014/15 and 2015/16). In the
Years 7 and 8 (combined) report, descriptive statistics will be provided for free sugars
intake and fibre intake using the AOAC method covering all paired years of the RP
(NMES and NSP will not be reported after Year 7).
A full report covering Years 5 to 9 (combined) (2012/13 to 2016/17) will be published in
2018/19 and will include an analysis of changes in the UK diet and nutrient intake and
nutritional status over time.
1 From 1 April 2013, responsibility for the NDNS contract transferred from the Department of Health in England to the Department of Health’s Executive Agency, Public Health England (PHE). 2 In Years 1 to 5 the consortium also included the University College London Medical School (UCL). 3 Ashwell M, Barlow S, Gibson S, Harris C (2006) National Diet and Nutrition Surveys: the British experience. Public Health Nutrition 9(4) 523-530. 4 https://www.gov.uk/government/publications/the-eatwell-guide (accessed 02/08/16). 5 Gregory JR, Collins DL, Davies PSW, Hughes JM, Clarke PC. National Diet and Nutrition Survey: children aged 1 ½ to 4 ½ years. Volume 1: Report of the diet and nutrition survey London: HMSO, 1995. Hinds K, Gregory JR. National Diet and Nutrition Survey: children aged 1½ to 4½ years. Volume 2: Report of dental survey. London: HMSO, 1995. 6 Gregory JR, Lowe S, Bates CJ, Prentice A, Jackson LV, Smithers G, Wenlock R, Farron M. National Diet and Nutrition Survey: young people aged 4 to 18 years. Volume 1: Report of the diet and nutrition survey. London: TSO, 2000. Walker A, Gregory J, Bradnock G, Nunn J, & White D. National Diet and Nutrition Survey: young people aged 4 to 18 years. Volume 2: Report of the oral health survey. London: TSO, 2000. 7 Henderson L, Gregory J, Swan G. National Diet and Nutrition Survey: adults aged 19 to 64 years. Volume 1: Types and quantities of food consumed. London: TSO, 2002. Henderson L, Gregory J, Irving K, Swan G. National Diet and Nutrition Survey: adults aged 19 to 64 years. Volume 2: Energy, protein, carbohydrate, fat and alcohol intake. London: TSO, 2002. Henderson L, Irving K, Gregory J, Bates CJ, Prentice A, Perks J, Swan G, Farron M. National Diet and Nutrition Survey: adults aged 19 to 64 years. Volume 3: Vitamin and mineral intake and urinary analytes. London: TSO, 2003. Rustin D, Hoare J, Henderson L, Gregory J, Bates CJ, Prentice A, Birch M. National Diet and Nutrition Survey: adults aged 19 to 64 years. Volume 4: Nutritional status (anthropometry and blood analytes), blood pressure and physical activity. London: TSO, 2004. Hoare J, Henderson L, Bates CJ, Prentice A, Birch M, Swan G, Farron M. National Diet and Nutrition Survey: adults aged 19 to 64 years. Volume 5: Summary report. London: TSO, 2004. 8 Finch S, Doyle W, Lowe C, Bates CJ, Prentice A, Smithers G, Clarke PC. National Diet and Nutrition Survey: people aged 65 years and over. Volume 1: Report of the diet and nutrition survey. London: TSO, 1998. Steele JG, Sheiham A, Marcenes W, Walls AWG. National Diet and Nutrition Survey: people aged 65 years and over. Volume 2: Report of the oral health survey. London: TSO, 1998.
National Diet and Nutrition Survey. Results from Years 5-6 (combined) of the Rolling Programme
(2012/13 – 2013/14)
27
9 Additional recruitment was undertaken in Wales (Years 5 to 9) and in Northern Ireland (Years 6 to 9) in order to achieve representative data for each country and to enable comparisons to be made with UK results. 10 The Wales boost was funded by the Food Standards Agency (FSA) in Wales which previously shared policy responsibility for diet and nutrition of the population in Wales. This policy area is now solely the responsibility of the Welsh Government. 11 The Northern Ireland boost has been co-funded by three funding partners: the Department of Health, Social Services and Public Safety (DHSSPS); the Food Safety Promotion Board (safefood) and FSA in NI. FSA in NI has responsibility for monitoring the diet of the population in Northern Ireland. 12 The country boost in Wales covered both Year 5 and Year 6, whereas the country boost in Northern Ireland was for Year 6 only, 13 Commentary regarding Years 1 and 2 (combined) and Years 3 and 4 (combined) descriptive statistics for UK dietary matters is provided in chapter 10 of the UK Years 1-4 (combined) report. 14 Participants with dietary data for at least three days were included in the analyses. The majority of participants completed four days of the food and drink diary. Only 2% (n=46) completed three days. 15 Number of diary days by day of week for UK sample Years 5 and 6 (combined):
UK :Years 5 and 6 (combined)
Day of the week
Number of diary days
% of total days
Monday 1,436 14.2
Tuesday 1,439 14.2
Wednesday 1,425 14.1
Thursday 1,434 14.1
Friday 1,472 14.5
Saturday 1,438 14.2
Sunday 1,494 14.7
Total 10,138 100.0
16 Department of Health 5-A-Day programme http://www.nhs.uk/Livewell/5ADAY/Pages/5ADAYhome.aspx (accessed 02/08/16). 17 In the Years 1 to 4 (combined) report, 5-A-Day portions were calculated including food groups that should have been excluded, as stated in appendix A of the report, ie the fruit component of biscuits, cakes and confectionery items and the fruit juice compoment of soft drinks. These food groups have now been excluded in this Years 5 and 6 (combined) report and therefore the values for Years 1 and 2 (combined) and Years 3 and 4 (combined) will be lower than those presented in the Years 1 to 4 (combined) report. 18 Population average of no more than 11% food energy for all ages. The SACN Carbohydrates and Health report published in 2015 (https://www.gov.uk/government/publications/sacn-carbohydrates-and-health-report; accessed 02/08/16) recommended that the definition for “free sugars” be adopted in the UK and the population average intake of free sugars should not exceed 5% of total dietary energy for those aged 2 years and over. In the Years 7 and 8 (combined) report, descriptive statistics will be provided for free sugars (NMES will no longer be reported). 19 Adult population average of at least 18g per day. The SACN Carbohydrates and Health report published in 2015 (https://www.gov.uk/government/publications/sacn-carbohydrates-and-health-report; accessed 02/08/16) included recommendations for fibre intake for those aged two years and over. The DRV for the average adult population intake of fibre is 30g per day defined using the AOAC method of analysis which equates to 23.1g per day NSP, an increase from the previous 18g per day recommendation. The fibre intake using the AOAC method will be presented in the NDNS RP Years 7 and 8 report (NSP will no longer be reported).

National Diet and Nutrition Survey. Results from Years 5-6 (combined) of the Rolling Programme
(2012/13 – 2013/14)
28
20 The Department of Health has advised that people who eat a lot of red and processed meat a day (more than 90g cooked weight) cut down to 70g. http://www.nhs.uk/Livewell/Goodfood/Pages/meat.aspx (accessed 02/08/16). 21 Scientific Advisory Committee on Nutrition. Advice on fish consumption: benefits and risks. London: TSO, 2004. 22 Report on Health and Social Subjects 41 Dietary Reference Values (DRVs) for Food Energy and Nutrients for the UK, Report of the Panel on DRVs of the Committee on Medical Aspects of Food Policy (COMA) 1991. The Stationery Office. London. 23 The RNI for a vitamin or mineral is the amount of the nutrient that is sufficient for 97.5% of people in the group. If the average intake of the group is at the RNI, then the risk of deficiency in the group is judged to be very small. However, if the average intake is lower than the RNI then it is more likely that some of the group will have an intake below their requirement. 24 The adequacy of vitamin or mineral intake can be expressed as the proportion of individuals with intakes below the LRNI. The LRNI for a vitamin or mineral is set at the level of intake considered likely to be sufficient to meet the needs of only 2.5% of the population. An intake below the LRNI is only considered a problem if sustained over a period of time. As diet is recorded for only four days in the NDNS RP, estimated intake values may not represent intakes over the longer term for micronutrients that are not widely distributed in foods such as vitamin A. It should also be noted that DRVs for some micronutrients such as magnesium, potassium, selenium and zinc are based on very limited data so caution should be used when assessing adequacy of intake using the LRNI. 25 Results for food consumption include vegetables, fruit, meat and fish after disaggregation (i.e. including the contribution from composite dishes, both homemade dishes and manufactured products, containing these ingredients but excluding other components of these dishes). 26 Weekly equivalent oily fish consumption has been calculated using unrounded data rather than the rounded figures in table B and sex-combined averages have been calculated using unrounded sex-combined data in table B. 27 The definition of NMES provided in the 1991 COMA report is “Sugars not contained within the cellular structure of a food except lactose in milk and milk products”. 28 Non-starch polysaccharides are plant cell wall constituents and comprise all other polysaccharides in the diet. They are not digested or absorbed in the small intestine. 29 For vitamin D, RNIs are only set for those aged up to four years and those aged 65 years and over. In July 2016 SACN published a new report on vitamin D and health which set an RNI for vitamin D in all age groups. https://www.gov.uk/government/publications/sacn-vitamin-d-and-health-report (accessed 02/08/16). 30 Scientific Advisory Committee on Nutrition (SACN). Iron and Health [Online]. London: TSO, 2010. www.sacn.gov.uk/pdfs/sacn_iron_and_health_report_web.pdf (accessed 02/08/16). Haemoglobin: 1.5-4y males <110g/L, 1.5-4y females <110g/L, 5-11y males <115g/L, 5-11y females <115g/L, 12-14y males <120g/L, 12-14y females <120g/L, 15y+ males <130g/L, 15y+ females (non-pregnant) <120g/L. Ferritin: 1.5-4y males <12mg/L, 1.5-4y females <12mg/L, 5y+ males <15mg/L, 5y+ females <15mg/L. 31 WHO. Conclusions of a WHO technical consultation on folate and vitamin B12 deficiencies. Food and Nutrition Bulletin. 2008; 29. S238–S244. 32 Holotranscobalamin is a relatively recently established marker and thresholds indicating deficiency are under debate. 32pmol/L is suggested as a marker of biochemical holotranscobalamin deficiency, the concentration below which urinary methylmalonic acid is likely to be raised. Annals of Clinical Biochemistry. 2012. (49) 184-189. 33 Ebba Nexo and Elke Hoffmann-Lücke. (2011). Holotranscobalamin, a marker of vitamin B12 status: analytical aspects and clinical utility. Am J Clin Nutr. 94(1): 359S–365S. 34 Department of Health (1998) Nutrition and Bone Health with Particular Reference to Calcium and Vitamin D. Report on Health and Social Subjects no. 49. London: The Stationery office.

National Diet and Nutrition Survey. Results from Years 5-6 (combined) of the Rolling Programme
(2012/13 – 2013/14)
29
35 Hill MH, Bradley A, Mustaq S, Williams EA, Powers HJ. Effects of methodological variation on assessment of riboflavin status using the erythrocyte glutathione reductase activation coefficient assay. British Journal of Nutrition, 2009; 102 (2): 273-8. 36 The threshold for EGRAC is under review, therefore, in addition to using this threshold, changes in the riboflavin status of the UK population will also be monitored by reviewing the EGRAC values at the 75th and 90th percentiles in future years. 37 The British Cardiac Society, British Hyperlipidaemia Association, British Hypertension Society, endorsed by the British Diabetic Association, have issued guidance published in the article ‘Joint British recommendations on prevention of coronary heart disease in clinical practice’. Heart, 1998; 80: 1–29. 38 Results for these analytes were presented in the Years 1 to 4 report and data for Years 5 and 6 will be included in the dataset on the UK Data Archive. 39 World Health Organization (WHO), Assessment of iodine deficiency disorders and monitoring their elimination: http://whqlibdoc.who.int/publications/2007/9789241595827_eng.pdf (accessed 02/08/16). 40 The population urinary iodine median have been determined from spot urine samples. The proportion of the population with insufficient iodine intake cannot be determined from these data. 41 https://www.gov.uk/government/statistics/national-diet-and-nutrition-survey-results-from-years-1-to-4-combined-of-the-rolling-programme-for-2008-and-2009-to-2011-and-2012 (accessed 02/08/16). 42 This includes additional recruitment in Wales (Years 5 and 6) and Northern Ireland (Year 6 only) to boost to 200 participants per year in order to achieve country-specific, representative dietary health data. In previous years, country-specific boosts were as follows: Wales (Year 2 to 4); Northern Ireland (Years 1 to 4) and Scotland (Years 1 to 4). 43 In some core sample households (where up to one adult and one child could be selected), it was possible to end up with an adult participant only, either because the selected child was not able/did not wish to take part or because there was no resident child eligible for selection. 44 Non-response bias occurs if those who respond to the survey (or elements of the survey) differ from those who do not respond. Data was weighted to reduce such bias.