Embed Size (px)
Citation preview

National Council for Performance Excellence
In partnership with the Michigan Quality Council248-370-4552 phone
[email protected] B Pawley Hall
Rochester, MI 48309-4401
20042004BaldrigeBaldrigeExplorerExplorer
Survey ProcessSurvey Process

Introduction
National Council for Performance Excellence
The Baldrige Criteria help organizations identify strengths and key areas for improvement.
The Baldrige approach has been used for approximately 16 years by tens of thousands of organizations to stay abreast of competition and to increase effectiveness.
55 countries throughout the world have adopted the Baldrige framework to enhance competitiveness.

National Council for Performance Excellence
5 Reasons to Choose Baldrige
The Baldrige Criteria:
Provide a framework for improvement without being prescriptive.
Are inclusive. The Criteria describe an integrated management framework that addresses all the factors that define the organization, its operations, and its results.
Focus on common requirements, rather than procedures, tools, or techniques.
Are adaptable. They can be used by large and small businesses, and organizations with one site or worldwide locations.
Are at the leading edge of validated management practices.

National Council for Performance Excellence
Baldrige Award Winners Outperformed the S&P 500
The U.S. Department of Commerce studies the performance of publicly held Baldrige Award winning companies.
Every year since 1991 they outperformed the Standard and Poor’s index (S&P).
Baldrige winners outperformed the S&P 500 by 4.8 to 1.
1,101% increase in stockperformance was demonstrated,compared to 228% from the S&Pindex companies for thesame period.

National Council for Performance Excellence
Choosing Baldrige
Your business is facing increasing marketplace challenges everyday.
Assess your readiness to respond to those challenges by using the Baldrige Criteria
In the most competitive business sectors, companies with world-class business results are able to achieve a score about 700 (70%) on the Baldrige scale.
Organizations early in their performance improvement journey frequently score around 200 points.
Where would your business score?

National Council for Performance Excellence
Getting Started
The National Council for Performance Excellence administers an organizational assessment survey utilizing the Baldrige Criteria for Performance Excellence
The survey measures performance on a wide range of key organization performance indicators
The survey helps to evaluate key processes, systems and results
The survey will help identify organizational strengths, deployment gaps, and pinpoint vital opportunities for improvement

National Council for Performance Excellence
Baldrige Explorer eSurvey
The organizational assessment survey guides you through the 7 categories, addressing each item of the Malcolm Baldrige Criteria for Performance Excellence
The survey consists of 58 questions and takes approximately 2 hours to complete online
The assessment tool uses a maturity scale to determine the performance level
Behavioral anchors provide a more accurate scoring and reporting process
The Survey tool and Performance Indicator Feedback Report are effective and efficient aides to organizational assessment

National Council for Performance Excellence
Benefits of the eSurvey Approach
Online, web-based, easily accessed from any PC
Accessible 24/7
Cost effective compared to alternative approaches
Technical support provided
Engage employees at all levels
Easy to use maturity scale to determine performance level
Receive internal and external feedback
Obtain high performance diagnostics from the feedback
3-day turnaround of Performance Indicator Feedback Report upon completion of survey

National Council for Performance Excellence
The Performance IndicatorFeedback Report
When all survey data has been collected, an automated Performance Indicator Feedback Report will be generated and sent to you in three business days.
The Performance Indicator Feedback Report consists of: Demographic Charts Overall Scores Category-Level Scores Item-Level Scores Gap Analysis Charts Individual Question Scores Pareto Charts for each Category Priority Improvement Data Charts Approach and Deployment Comments Priority Improvement Comments

National Council for Performance Excellence
The PresentationThe Presentation The following slides guide you through the
eSurvey process
Included with the following eSurvey snapshots are sample reports to show how the data collected is later represented in the Performance Indicator Feedback Report.

National Council for Performance Excellence
Type in your User ID which you received through email (usually your email address) and unique password. Click ‘Login to the Survey’.

National Council for Performance Excellence
Position Location Function Years of Service
Executive/SeniorManager
Individual Contributor
Supervisor
East
Headquarters
West
Manufacturing
R&D/ Knowledge Mgmt/Info Tech
Sales/ Marketing/Customer Support
Support Services
0 yrs. < 1 yr.
1 yrs. < 3 yrs.
3 yrs. < 5 yrs.
5 yrs. < 10 yrs.
10+ yrs.
The Demographic Profile provides valuable comparative attributes within the organization.
Survey participants choose appropriate selections from the Demographic Profile to indicate their position within the organization.
Comparative charts and data are presented in the Performance Indicator Feedback Report according to the selections of the participants.
Customized Demographic ProfileThis is a sample of the table used to customize the Demographic Profile for your organization.
National Council for Performance Excellence
Baldrige Explorer eSurveyDemographic Selection (Sample Participant’s View)
Each different demographic attribute will appear on separate pages. Participants select the demographic value that describes their position within the organization.

Organization Demographics
Vermont Council for Quality
The Demographic Section is designed to provide the organization with an overall response rate relative to the total number of respondents and their percentage weight for each demographic attribute they have chosen.
This chart reflects sample demographic data collected from the eSurvey and reported in the Performance Indicator Feedback Report.
Attribute/Value NumberResponded
Response as% of Total
Position
Executive/ Senior Manager 7 28.0
Individual Contributor 10 40.0
Supervisor 8 32.0
Total 25 100%

National Council for Performance Excellence
eSurvey Status Page (Sample Participant’s View)
Once you have completed the Demographic Profile, click on the Leadership Category to begin the survey.

National Council for Performance Excellence
Category 1, Question 1A of the Survey2 comments per question
View Comments in Report
View Question Scores in the Report
Click the radio button that best describes the level of development in your organization. Mouse over the levels to view the descriptors of each level.
Approach and Deployment comments are requested for each question.
Participants offer suggestions for improvement on the process.
National Council for Performance Excellence
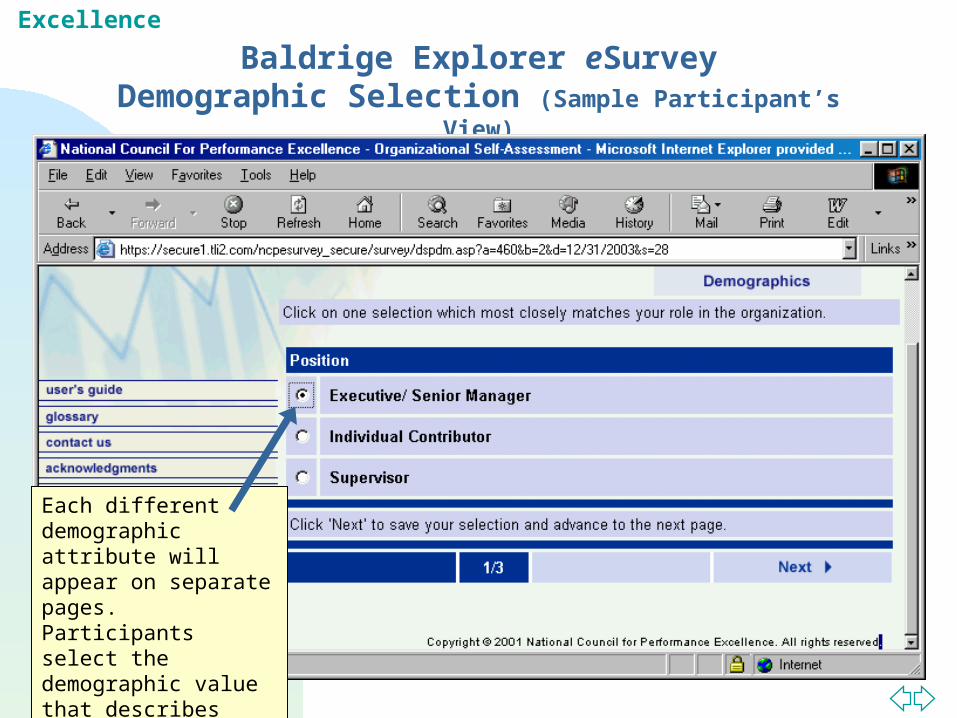
Overall Score by Question and Current-State Descriptors
The Overall Score by Question and Current-State Descriptors show the overall percentage of points for a theme within each category. Refer to the Scoring Guidelines in Appendix B to see the approach/ deployment percentage scoring. The ‘Current’ text describes the behavioral anchor of where the organization is now. The Role Model text describes where the organization could strive to be.
% Row Description
% 1A Communicating Values and Performance Expectations [Baldrige ref: 1.1a(1)]
56 Current Mature - Many leaders effectively communicate values, directions, and performance expectations in many ways. Theiractions usually match their words. They sometimes check to see if their messages are understood.
Role Model Nearly all leaders effectively communicate values, short- and long-term directions, and performance expectations In manyways. They live by these values and their actions nearly always match their words. They promote two-way communicationwith employees and regularly check to see if their messages are understood and consistently improve communications as aresult.
% 1B Leadership Commitment to Providing Maximum Value for Customers [Baldrige ref: 1.1a(1)]
56 Current Mature - Many leaders and managers effectively focus on providing maximum value to many customer groups. Theysometimes check on the effectiveness of activities that focus on customer value.
Role Model Nearly all leaders and managers effectively focus on providing maximum value to all types of customers and stakeholders.They regularly check on the effectiveness of customer value activities. They make ongoing improvements.
% 1C Empowering Employees and Establishing a Climate for Innovation, Learning, Organizational Agility, and EthicalBehavior [Baldrige ref: 1.1a(2)]
38 Current Basically Effective - Some top leaders and managers effectively encourage their employees to make decisions about theirwork and encourage learning and innovation.
Role Model Nearly all top leaders and managers effectively encourage their employees to make decisions about their work andencourage employee learning and innovation. These leaders work to reduce "red tape" and improve organizationalflexibility and agility. They also create an environment that requires legal and ethical behavior. They regularly check to seeif their efforts are effective and they make ongoing improvements as a result.
View Appendix B
Back to Survey

National Council for Performance Excellence
Leadership Row-Level Comments by Position
Comments are provided by the respondents and can be prepared and used by examiners and organization leaders for improvement planning. The comments are sorted by each category and theme statement. Comments are reported out by one attribute, in this case, “Position”. They are then sorted by each value such as “Senior Manager”, “Individual Contributor”, and “Supervisor”.
1A Communicating Values and Performance Expectations [Baldrige ref: 1.1a(1)]
Position/Executive/ Senior ManagerApproach & Deployment: We do a great job communication to all. Through e-mails, town hall meetings, Intranet. Scorecards for the whole organization, sectors and local offices in place. Rules of Operation being implemented and communicated very efficiently.
Approach & Deployment: We use many techniques to communicate including all hands meetings each quarter, weekly notes from the exec office, email, voice mail. Staff randomly check with employees to be sure key points were understood.
Approach & Deployment: Frequent and regular customer satisfaction surveys. Follow up activities with customers and internally.
Position/Individual ContributorApproach & Deployment: The scorecard is resented and the financial result and forecast are sometimes known. Action Steps to Improve: Get more input from contributors for the scorecard. Make the results known.
Approach & Deployment: Some goals are linked to the balanced scorecard but many have not been seen as major objectives. Many goals are very ad hoc and changeable, leaving employees unsure on direction. Many times effort is expended only to see that it has been wasted because of a change in direction or emphasis.
Position/Supervisor
Approach & Deployment: The issue in the local office is that most of the top management has left the organization and is now not fully replaced. There are still some gaps in the organization, which create some lack of communication with the customer. The checking of the effectiveness to focus on customer does not seem to be done often.
Next Survey Page

National Council for Performance Excellence
Priority Improvement Selections(Sample Participant’s View)
View Pareto Description and Charts
The final page for each category in the eSurvey asks participants to identify two areas they believe needs the most improvement. This data is reported as a Pareto chart in the Feedback Report.

National Council for Performance Excellence
Pareto Charts Staff members in your organization will be asked to select one or
more areas in each of the seven categories, which they feel, is in most need of improvement. The concept of a Pareto chart is to show that the areas in need of improvement are usually a vital few, allowing leaders to concentrate their focus on specific improvement efforts.
We will supply you with a Pareto chart for each of the seven categories, which reference each of the seven sections of the Organization Assessment Survey.
Each chart will display the letters that correspond to the themes for each of the seven categories along the x-axis. Along the y-axis both Count and Percentages are charted. The count of staff votes (Hits) for each area they believe is most in need of improvement is represented as bars on the graph. The chart is arranged with the largest hit count on the left of the graph, indicating the area selected by staff which they feel is most in need of improvement. The line charted above the bars represents the cumulative percentages of each bar, from left to right.

National Council for Performance Excellence
Category 1 - LeadershipAreas Most Needing Improvement - Pareto Chart
The letters E, C, and G represent an opportunity to solve 80% of key issues in 30% of the areas (3 of 10) for the category (Leadership). In this example, the letters H, I, and J, did not receive any votes since these areas were not selected by staff as areas most in need of improvement.
Letter Key for Category 1 - Leadership - Areas Most Needing Improvement
A Communicating Values and Performance Expectations [Baldrige ref:1.1a(1)]
F Setting Priorities and Making Improvements Based on ProgressReviews [Baldrige ref: 1.1c(3)]
B Leadership Commitment to Providing Maximum Value for Customers[Baldrige ref: 1.1a(1)]
G Improving Leadership Effectiveness Throughout the Organization[Baldrige ref: 1.1c(4)]
C Empowering Employees and Establishing a Climate for Innovation,Learning, Organizational Agility, and Ethical Behavior [Baldrige ref: 1.1a(2)]
H Following Laws and Regulations and Reducing Public Risks andConcerns [Baldrige ref: 1.2a(1&2)]
D Ensuring Management Accountability for the Protection of StakeholderInterests through Effective Governance [Baldrige ref: 1.1b]
I Ensuring Ethical Behavior [Baldrige ref: 1.2b]
E Assessing Organizational Performance and Progress Relative to Goals[Baldrige ref: 1.1c(1)]
J Providing Community Support [Baldrige ref: 1.2c]
36
58
80
88
9698 100 100 100 100
0
5
10
15
20
25
30
35
40
45
50
F C G B E A D H I J
Hit
Co
un
t
0
10
20
30
40
50
60
70
80
90
100
Hit
Pe
rce
nta
ge
CountCumulative
National Council for Performance Excellence
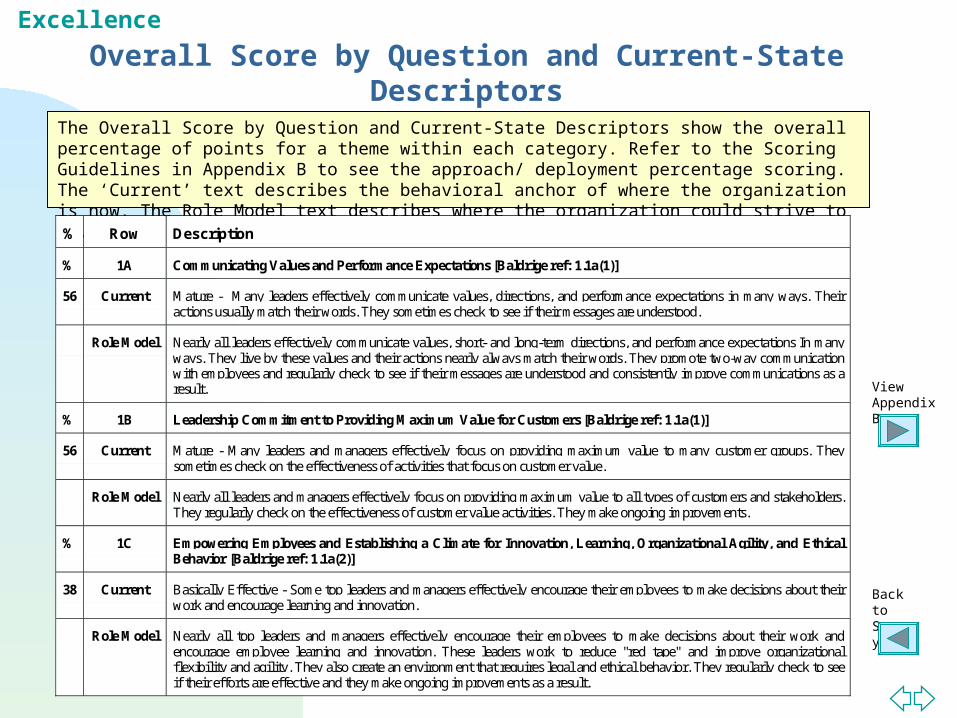
Priority Improvement Counts and Percentages
This chart shows priority improvement selections according to the various Demographic attributes and values. Look at “C” and “G” and you will see that Individual Contributors identified the need to improve these areas by a greater margin than did the Executives/Senior Managers and Supervisors. This tends to indicate a deployment gap and suggests that Executives/Senior Managers and Supervisors are not perceived as effective as they believe themselves to be.
Category 1 - Leadership - Priority Improvement Counts and Percentages - Position
Count Percentage
F C G B E A D H I J Total F C G B E A D H I J
Executive/ Senior Manager 6 1 2 1 2 1 1 0 0 0 14 43 7 14 7 14 7 7 0 0 0
Individual Contributor 4 9 7 0 0 0 0 0 0 0 20 20 45 35 0 0 0 0 0 0 0
Supervisor 8 1 2 3 2 0 0 0 0 0 16 50 6 13 19 13 0 0 0 0 0
Total 18 11 11 4 4 1 1 0 0 0 50 36 22 22 8 8 2 2 0 0 0

National Council for Performance Excellence
Completed Survey Status Page
When you have entered answers to every question for each category, you can submit your survey.

National Council for Performance Excellence
Summary ResultsOverall Category-Level Totals
The Overall Category-Level Totals table explains the amount of points scored for each category, the total possible points to score in a category and the percentage of total points for each category.
Baldrige Criteria TotalPoints
PointsScored
% ofTotalPts.
1. Leadership 120 65 54
2. Strategic Planning 85 34 40
3. Customer and Market Focus 85 34 40
4. Measurement, Analysis, & Knowledge Mgmt 90 25 28
5. Human Resource Focus 85 34 39
6. Process Management 85 30 35
7. Organizational Results 450 205 45
Totals 1000 427 43%
National Council for Performance Excellence
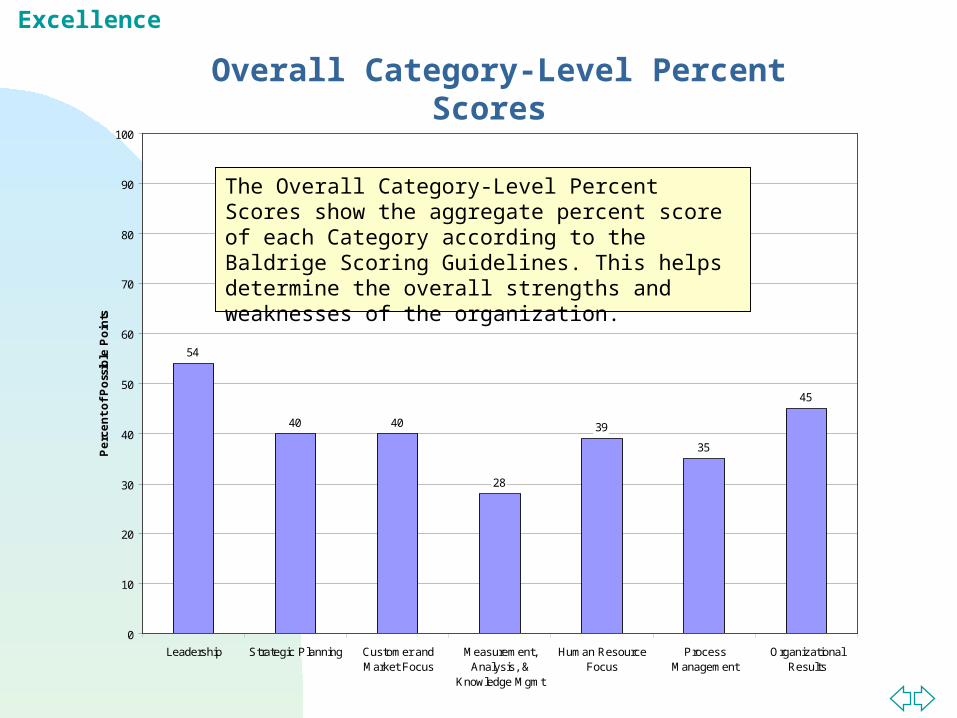
Overall Category-Level Percent Scores
54
40 40
28
39
35
45
0
10
20
30
40
50
60
70
80
90
100
Leadership Strategic Planning Customer andMarket Focus
Measurement,Analysis, &
Knowledge Mgmt
Human ResourceFocus
ProcessManagement
OrganizationalResults
Pe
rce
nt
of
Po
ssib
le P
oin
ts
The Overall Category-Level Percent Scores show the aggregate percent score of each Category according to the Baldrige Scoring Guidelines. This helps determine the overall strengths and weaknesses of the organization.

National Council for Performance Excellence
Overall Item-Level Percent Scores
View Appendix A
50
60
45
36
44
36
2927 27
62
35 3633
5351
53
26
45 45
0
10
20
30
40
50
60
70
80
90
100
Item1.1
Item1.2
Item2.1
Item2.2
Item3.1
Item3.2
Item4.1
Item4.2
Item5.1
Item5.2
Item5.3
Item6.1
Item6.2
Item7.1
Item7.2
Item7.3
Item7.4
Item7.5
Item7.6
Pe
rce
nt
of
Po
ssib
le P
oin
ts
The Overall Item-Level Percent Scores show the percent of points on a 0 to 100 scale, for each Item. This helps users determine, at a glance, the strengths and weaknesses by item for each category. The Items and Point Values are explained in Appendix A.

National Council for Performance Excellence
Overall Category-Level Point Scores
Position Point Scores by Category
0
100
200
300
400
500
600
700
800
900
1000
To
tal
Po
ssib
le P
oin
ts
Leadership 84 53 61
Strategic Planning 55 19 31
Customer and Market Focus 41 30 32
Measurement, Analysis, & Knowledge Mgmt 37 17 28
Human Resource Focus 43 29 34
Process Management 37 26 28
Organizational Results 237 190 181
Executive/ Senior Manager Individual Contributor Supervisor
The Category-Level Point Scores show the cumulation of total points for each demographic view within each category. This is a sample of one demographic view.

National Council for Performance Excellence
This chart shows the ratings by demographic attribute, in this case, Position. On the previous graph, Item 1.1, Leadership System, reflected a rating of 50%. However, according to the breakout above, Executives/Sr. Mgmt. believe the processes are much stronger (69 percent) than Individual Contributors (less than 38 percent) and Supervisors (45 percent). This typically indicates incomplete systems development or poor deployment of existing systems and processes required by the Item.
View Appendix A
Item-Level Percent Scores by PositionPosition Percent Scores by Item
0
10
20
30
40
50
60
70
80
90
100
Item 1.1 Item 1.2 Item 2.1 Item 2.2 Item 3.1 Item 3.2 Item 4.1 Item 4.2 Item 5.1 Item 5.2 Item 5.3 Item 6.1 Item 6.2 Item 7.1 Item 7.2 Item 7.3 Item 7.4 Item 7.5 Item 7.6
Pe
rce
nt
of
Po
ssib
le P
oin
ts
Executive/ Senior Manager
Individual Contributor
Supervisor
Notice the gap between Executives/Senior Management and Individual Contributors and Supervisors in Item 1.1. This suggests an area to examine further.
However, Item 7.4 shows a high degree of agreement indicating a consistent deployment of results information.

National Council for Performance Excellence
Thank you!Thank you!
Michigan Quality [email protected]
248-370-4552In cooperation with
National Council for Performance Excellence

National Council for Performance Excellence
Appendix A: Assessment Themes and Values
The point values of the scoring system are linked directly to the points and scoring system of the Malcolm Baldrige Criteria for Performance Excellence. Each item and the questions included in the items are also derived from the Baldrige Criteria.
2004 Categories, Items, and Point Values1.0 Leadership 120 points1.1 Organizational Leadership 80 points 1A Communicating Values and Performance Expectations [Baldrige ref: 1.1a(1)] 1B Leadership Commitment to Providing Maximum Value for Customers [Baldrige ref: 1.1a(1)] 1C Empowering Employees and Establishing a Climate for Innovation, Learning, Organizational Agility, and Ethical Behavior [Baldrige ref: 1.1a(2)] 1D Ensuring Management Accountability for the Protection of Stakeholder Interests through Effective Governance [Baldrige ref: 1.1b] 1E Assessing Organizational Performance and Progress Relative to Goals [Baldrige ref: 1.1c(1)] 1F Setting Priorities and Making Improvements Based on Progress Reviews [Baldrige ref: 1.1c(3)] 1G Improving Leadership Effectiveness Throughout the Organization [Baldrige ref: 1.1c(4)]
1.2 Social Responsibility 40 points 1H Following Laws and Regulations and Reducing Public Risks and Concerns [Baldrige ref: 1.2a(1&2)] 1I Ensuring Ethical Behavior [Baldrige ref: 1.2b] 1J Providing Community Support [Baldrige ref: 1.2c]
2.0 Strategic Planning 85 points2.1 Strategy Development 40 points 2A Developing Strategic Plans Based on Business Data [Baldrige ref: 2.1a(1&2)] 2B Developing Clear Strategic Objectives and Timetables for Meeting the Objectives [Baldrige ref: 2.1b(1)] 2C Ensuring that Strategic Objectives Address Challenges and Balance the Needs of Key Stakeholders [Baldrige ref: 2.1b(2)]2.2 Strategy Deployment 45 points 2D Developing and Deploying Action Plans Based on Strategic Objectives [Baldrige ref: 2.2a(1)] 2E Developing Human Resource Plans Based on Strategic Objectives and Action Plans [Baldrige ref: 2.2a(3)] 2F Developing Appropriate Goals and Allocating Resources to Achieve Them [Baldrige ref: 2.2a(4) and 2.2b] 2G Aligning Work to Achieve Strategic Goals, Objectives, and Action Plans [Baldrige ref: 2.2a]
Back to Overall Item Scores
Back to Gap Analysis

National Council for Performance Excellence
Appendix B: Scoring Guidelines for Categories 1-6: Approach/Deployment
The overall percentage of points for 1A on the previous slide is 56%, indicating the above Approach and Deployment guideline.
Back to Survey
SCORE PROCESS
0% or 5%
No systematic approach is evident; information is anecdotal. (A) Little or no deployment of an approach is evident. (D) No evidence of an improvement orientation; improvement is achieved through reacting to
problems. (L) No organizational alignment is evident; individual areas or work units operate independently. (I)
10%, 15%,20%, or 25%
The beginning of a systematic approach to the basic requirements of the Item is evident. (A) The approach is in the early stages of deployment in most areas or work units, inhibiting progress in
achieving the basic requirements of the Item. (D) Early stages of a transition from reacting to problems to a general improvement orientation are
evident. (L) The approach is aligned with other areas or work units largely through joint problem solving. (I)
30%, 35%,40%, or 45%
An effective, systematic approach, responsive to the basic requirements of the Item, is evident. (A) The approach is deployed, although some areas or work units are in early stages of deployment. (D) The beginning of a systematic approach to evaluation and improvement of key processes is evident.
(L) The approach is in early stages of alignment with your basic organizational needs identified in
response to the other Criteria Categories. (I)
50%, 55%,60%, or 65%
An effective, systematic approach, responsive to the overall requirements of the Item, is evident.(A)
The approach is well deployed, although deployment may vary in some areas or work units. (D) A fact-based, systematic evaluation and improvement process and some organizational
LEARNING are in place for improving the efficiency and effectiveness of key processes. (L) The approach is ALIGNED with your organizational needs identified in response to the other
Criteria Categories. (I)


![AUTHOR: MARISOL MERCADO SANTIAGO [SCHOOL OF ENGINEERING EDUCATION, PURDUE UNIVERSITY] SECOND AUTHORS: ALICE L. PAWLEY & DONALD W. MITCHELL 12 TH SAKYADHITA](https://img.dokumen.tips/doc/110x75/56649e455503460f94b39256/author-marisol-mercado-santiago-school-of-engineering-education-purdue-university.jpg)