Embed Size (px)
Citation preview
NBER WORKING PAPER SERIES
EFFECTS OF JAPANESE MACROECONOMIC ANNOUNCEMENTS ON THE DOLLAR/YEN EXCHANGE RATE:HIGH-RESOLUTION PICTURE
Yuko HashimotoTakatoshi Ito
Working Paper 15020http://www.nber.org/papers/w15020
NATIONAL BUREAU OF ECONOMIC RESEARCH1050 Massachusetts Avenue
Cambridge, MA 02138May 2009
¸˛The authors are grateful to Robert Feldman, Morgan Stanley, for his suggestions and making availablethe data of macro news announcements and market expectations prior to announcements. The authorsare grateful to EBS for their understanding the value of academic research and providing a proprietarydata set for the academic purpose with few restrictions and a modest fee. We thank Alain Chaboudat the FRB for valuable discussions during the process of this paper and for comments and suggestionsfrom conference and seminar participants at the AEA, APEA2009, the ECB, and the Research Departmentat the IMF. Research support by JSPS Grants-in-aid for Scientific Research, (A) No. 15203008, toUniversity of Tokyo, is gratefully acknowledged. The views expressed herein are those of the author(s)and do not necessarily reflect the views of the National Bureau of Economic Research.
NBER working papers are circulated for discussion and comment purposes. They have not been peer-reviewed or been subject to the review by the NBER Board of Directors that accompanies officialNBER publications.
© 2009 by Yuko Hashimoto and Takatoshi Ito. All rights reserved. Short sections of text, not to exceedtwo paragraphs, may be quoted without explicit permission provided that full credit, including © notice,is given to the source.

Effects of Japanese Macroeconomic Announcements on the Dollar/Yen Exchange Rate: High-Resolution PictureYuko Hashimoto and Takatoshi ItoNBER Working Paper No. 15020May 2009JEL No. E44,F31,F41,G15
ABSTRACT
Market impacts of Japanese macroeconomic announcements within minutes on the dollar/yen foreignexchange are analyzed. High-frequency data collected from the actual trading platform, EBS, areused. First, impacts on returns are analyzed. Macroeconomic statistics releases that consistently hadsignificant effects on exchange rate returns include Tankan survey (a short-term business survey conductedby Bank of Japan), GDP, industrial production (preliminary), PPI, CPI (Tokyo area), the unemploymentrate and Balance of Payment statistics. Macroeconomic statistics releases that did not have impactson returns include Trade Balance, Retail Sales and Housing start indicators. Second, for most of macroeconomicnews items whose surprise components have return impacts also have impacts on deals and volatility.The announcement itself, in addition to the magnitude of surprise, is found to increase the deals andprice volatility in the immediately after the announcement. In addition, some other items have noreturn impacts but deals and volatility impacts. These facts are consistent with a view that marketparticipants have heterogeneous information, so that even without any price change, trades take place. Price discovery process may require some transactions with price fluctuations around new price levelconsistent with statistical announcement
Yuko HashimotoFaculty of EconomicsToyo University5-28-20 Hakusan, Bunkyo-ku, Tokyo [email protected]
Takatoshi ItoGraduate School of EconomicsUniversity of Tokyo7-3-1 Hongo, Bunkyo-ku, Tokyo 113-0033JAPANand [email protected]

2
1. Introduction
The exchange rate is a variable that market participants, economists, and sometimes
policymakers are very much interested in. Its dynamic behavior is hard to explain, not to
mention hard to predict. Exchange rates are influenced by many news and events—not only
economic but political—that become available every minute, if not second. Some news
causes a sudden jump in the exchange rate level. These price changes could be temporary
(noises) or persistent (jump to a new equilibrium). In either case, movements in prices tend
to be, but not always, associated with increased transactions. What triggers the price change
and a surge in transaction activities? The usual suspects of the important variables that would
cause jumps and volatility in prices and increases in transactions are disclosure of changes in
the economic fundamentals. Any unexpected component, that is a “surprise,” of economic
announcements, either unscheduled or regularly scheduled, has been examined in many
papers in the literature of the macro announcement impact on the exchange rate.
Another strand of literature has examined why a particular time of the day tends to be characterized
by a surge (or a drop) in transactions and volatility) compared to other times of the day. One of the
reasons for a surge of transactions is a concentration of new information arrivals that tends to occur at
the beginning of the business hours of major markets. A possible existence of private information
may cause a different trading responses by dealers, some of them informed and some uninformed, at
the arrival of new information. Then the trading may be intensified between these two types of
dealers. Easley and O’Hara (1992) incorporated private information into a model. Another reason is
the arrival of private information, such as large order flows from retail customers, which are modeled
in Lyons’ (1997) hot potato hypothesis. A transmission of orders by large retail customers to a bank
would generate multiplied transactions in the inter-bank market through a price discovery process in
transactions.
A distinct intra-day transactions pattern has been shown in the literature on high frequency data of
foreign exchange markets. Transaction volumes and price volatility depend on the time of the day.
This intra-daily patterns of foreign exchange markets have been investigated and established by Ito
and Hashimoto (2004, 2006) using the EBS data.
Our paper examines the behavior of dollar/yen exchange rates in reaction to releases of major
macroeconomic statistics in Japan. This paper uses high-frequency (one-second-slice) EBS trade-

3
platform data from 2001 to 2005. The EBS represents the majority of interbank market of spot
dollar/yen exchange rate. In particular, this paper examines how the dollar/yen exchange rate market
digests information contained in the various macroeconomic statistics releases—to what extent
transactions and prices react to the macroeconomic statistics news, how long the news effect lasts,
which news has the most/least impact on the exchange rate, and whether there has been a shift in the
types of news statistics that affect the exchange rate. In the analysis, the unexpected component of
macroeconomic announcements, a “surprise,” is defined by the difference between the actual
indicator announcement and the average of predicted indicators by the market.
Two key contributions of our paper can be summarized as follows. First, since the data are from the
actual trading platform, they are quite reliable even during the very volatile period. This advantage of
the EBS data is well-known and exploited by Chaboud et al. (2004), Berger et al. (2005), Ito and
Hashimoto (2006, 2007). The data used in our analysis include both transactable quotes and
transaction (deal) prices at every second. Second, to our best knowledge, this is the first paper that
analyzes effects of the Japanese macroeconomic announcements on the yen/dollar exchange rate with
high frequency trading-platform exchange rate data.
Our findings are as follows. First, surprise components of several Japanese macro statistics
announcements are found to have particularly large impacts, whereas others do not, on the dollar/yen
movements. Large impacts on dollar/yen returns were found in surprise components of Tankan
(Bank of Japan, business survey), production indices (GDP advance, industrial production),
unemployment, PPI, CPI (Tokyo area), and Balance of Payment announcements. On the other hand,
CPI, trade balance, Diffusion (Keiki) indices, Retail Sales, Housing construction, and Money supply
indicators are found to have almost no impact on the exchange rate. Nonfarm Payrolls had mixed
results. Only a few macroeconomic announcements had significant effects—this result is a contrast
to findings in the literature that examines the US news releases effects on exchange rates. However,
this result parallels with Ehrmann and Fratzscher (2004) in that they find the US macroeconomics
statistical releases have relatively greater impacts on exchange rates than the German news
announcements.1
Large impacts from GDP and Tankan announcements are easy to understand from theoretical point of
view and found in the existing studies in different markets. Price variables such as PPI and CPI 1 They infer the results partly due to the news release time; most of the US news announcements are released earlier in a month than the German/Euro Area news announcements.

4
(Tokyo area) are also consistent with international finance theory. In contrast, CPI (national) did not
have impacts. This is likely due to the fact that most of information was extracted by CPI (Tokyo
area), which is disclosed one month earlier than CPI (national). Money supply statistics also did not
affect returns. The reason that money supply news announcement turned out to be almost irrelevant
may come from the particular monetary policy in Japan—zero interest rate policy with quantitative
easing—which was practiced during the sample years. Current accounts (balance of payments) are
found to have significant impact on returns, while trade balance did not, because financial flows are
more related to current accounts that include interest income and received dividend.
The rest of the paper is organized as follows. Section 2 gives a brief literature review. Section 3
describes the Japanese macroeconomic news announcements used in this paper. Section 4 shows the
news surprise impact on returns. Section 5 summarizes estimation results of surprises on volatility.
Section 6 shows the surprise impact on the number of transactions and reveals differences of intraday
patterns of transaction volume between on news-announcement days and on no-news days. Section 7
concludes the paper.
2. Literature review Intraday activities such as the number of deals and transaction volume in foreign exchange markets
are examined by Chaboud et al. (2004), Berger et al. (2005), and Ito and Hashimoto (2005).2 Baillie
and Bollerslev (1990) and Andersen and Bollerslev (1997, 1998), for example, show the patterns of
intraday price volatility using indicative quotes. Admati and Pfeiderer (1988), Brock and Kleidon
(1992), and Hsieh and Kleidon (1996) provided theoretical and empirical background of intraday
patterns of the bid-ask spread and volatility.
An examination of news impacts on exchange rates has traced a history of the development of data
availability. Ito and Roley (1987) were the first to examine an effect of surprise components of
2 Based on a more recent high frequency data, several stylized facts have been established on intradaily patterns of exchange rates. First, the intra-day seasonality is quite obvious in the number of deals, the number of quote revisions, and bid-ask spread. For example, three peaks in a day are consistently observed for the number of deals and quote revisions: Tokyo opening hours, London opening hours, and New York opening hours. Second, order flows—measured by the number of deals initiated by either buyers or sellers—have significant impacts on the exchange rate. More buyer-initiated deals in a fixed time window—say, one minute—tend to push up the currency in the following several minutes at least, and more seller-initiated deals tend to depreciate the currency. See Chaboud et al. (2004) and Ito and Hashimoto (2004, 2006, 2007).

5
Japanese macroeconomic announcements on the intraday movement of the dollar/yen exchange rate.
However, the availability of high-frequency exchange rate data was severely limited at the time, and
intraday observations meant five times per day. Once an electrically-recorded exchange rate database
became available, many studies have exploited the data. Goodhart and Payne (1996) and Goodhart,
Ito and Payne (1996) were among the first to use the Reuter trading platform data (D3000). Ansersen
and Bollerslev (1998) and Andersen, Bollerslev, Diebold, and Vega (2003) examined the effect of
macroeconomic announcements on intradaily exchange markets using the Reuter indicative quote
data. Evans and Lyons (2002) and Love and Payne (2003) considered the daily net order flows in
foreign exchange markets and studied the relationship between exchange rate of returns and order
flows using the Reuters data.
In recent years, the EBS has provided researchers with data which recorded the actual trading
platform. Chaboud et al. (2004) examined US macro announcement impacts on the euro-dollar and
dollar-yen exchange rates. Their findings are consistent with those in recent literature in that the
conditional mean of exchange rates responds very quickly to the unexpected component of news
releases. As for the trading volume, they found that news releases increase the volume of
transactions. However, they also find a surge in trading volume even if the released news indicators
are entirely in line with expectations.
Most of the previous literature that examines news effects on financial markets looked at the US and
European news announcements. To list a few among many, Fleming and Remolona (1999) looked at
the US news announcement effects on the Treasury market; Andersen, Bollerslev, Chaboud et al.
(2004), Diebold and Vega (2003, 2005), and Faust et al. (2003) studied US news release and its
impact on foreign exchange markets; Ehrmann and Fratzscher (2004) examined U.S. and Germany
news releases on the foreign exchange markets. The empirical findings by these studies confirm that
U.S. and European news releases have significant effects on pricing of the financial markets.
Analysis of Japanese news announcements on foreign exchange markets, however, needs to date back
to Ito and Roley (1987) who used five observations in a day, so that each time window to capture the
announcement impacts extended several hours. Since then, several papers have discussed the effects
of Japanese economic announcements on foreign exchange markets. Our paper is in line with the
previous literature in that we analyze the effects of unexpected news components on prices and
trading volume in exchange rate markets; furthermore, we focus on the Japanese macroeconomic
news indicators.

6
3. Japanese macroeconomic announcements
In contrast to U.S. macroeconomic announcements, most of which occur at 8:30am (EST), the release
time of Japanese news announcements varies from news to news. As summarized in Table 1, some of
the macroeconomic announcements are released in the afternoon. Most of the major macroeconomic
statistics come out either 8:30am, 8:50am, 10:30am, 2:00pm, or 2:30pm.
The Japanese macroeconomic announcement time has become almost fixed after 2001. Until 2000, a
lot of news was released 1hour earlier than the current release time. Some news release time was,
however, fixed later or went back and forth even after 2001. For example, it was 2002 when the
current CPI release time was set. Release time of three news announcements (Balance of Payments,
Trade Balance, and Retail sales) changed once in early 2000 and moved back to the original time
about six months later.
The list of macroeconomic announcements, as shown in Table 1, includes many variables that have
been studies in the literature of news effects on foreign exchange markets. For example, Chaboud et
al. (2004) used the following US macro variables: Payroll, GDP advanced, PPI, Retail sales, Trade
Balance, and Fed Funds Rate (Target). Andersen et al. (2003) used GDP (advance, preliminary,
final), Nonfarm Payroll, Retail Sales, Industrial Production, Capacity Utilization, Personal Income,
Consumer Credit, Personal Consumption Expenditure, New Home Sales, Durable Goods Orders,
Construction Spending, Factory Orders, Business Inventories, Government Budget Deficit, Trade
Balance, PPI, CPI, Consumer Confidence Index, NAPM Index, Housing Starts, Index of Leading
Indicators, Target Federal Funds Rate, and Money supply. In the European perspectives, Ehrmann
and Fratzscher (2004) used GDP, Ifo Business Climate Index, Business confidence balance, PPI, CPI,
Retail sales, Trade Balance, M3, Unemployment, Industrial production, and Manufacturing orders as
for Germany news releases.3 Our list mostly covers the same or comparable variables in the Japanese
context.
Table 1
3 The Ifo Business Climate Index is a closely watched indicator of German business conditions, based on a monthly survey of about 7,000 companies. It is widely seen as a barometer for economic conditions of the Eurozone. A parallel in Japan is the Bank of Japan survey of Tankan.

7
Table 1 also shows the sample mean, sample standard deviation, surprise mean, and surprise standard
deviation. All the sample means are near zero and less than respective sample standard deviations,
we can safely conclude that traders’ expectations are unbiased.
4. Impact of surprises on returns
In this section, we examine to what extent the dollar/yen return is impacted by an unexpected
component (surprise) of macroeconomic news announcements. When an announcement of macro
fundamental variable has non-zero unexpected content, the announcement should be followed by a
change in the exchange rate, because investors and market participants should react to the surprise by
rebalancing their portfolio positions, moving the exchange rate to a new equilibrium. If there is no
surprise (expected=actual statistics announcements), it is expected that a surprise has no impact on
returns.
Theory predicts that a release of macroeconomic announcements, if it contains a surprise component,
may likely be followed by a change in the level of the exchange rate. The selected variables are often
suspected to be a determinant of the exchange rate, so that new information may affect the level of the
exchange rate immediately. The expected part has been already discounted in the exchange rate.
Market participants react to this unexpected content by rebalancing their positions; that is, the surprise
component would prompt more sell or buy orders—changes in the net order flow—in the market, and
move the exchange rate.
We estimate the following regression to analyze impacts on returns from a surprise content of macro
economic news:4
(1) ),(),(),( )()(
)(
1)(ututNuts uiui
un
uiεα +=Δ ∑
=
(2) ),(),(),(),(),( )()(
)(
1)(utkutNDkutsutNuts uiui
un
uiεθδα +−+−Δ+=Δ ∑
=,
4 In Chaboud et al. (2004), the estimation model takes the form of r=b*s+e, where r is the return from the one minute before the announcement release to h minutes after the release and s is the unexpected surprise component. The model is estimated only days when there is a news release, not for the whole sample period.

8
where ⊿s(t, u) is the exchange rate return, measured by log-difference, from time u to u+k on day t,
k is the number of minutes, and u is the announcement time of the day for news Ni(u). Ni(u)(t,u) is a
surprise of i-th macroeconomic news statistics in time window of u and measured as the difference
between actual (announced) values and the market-consensus forecast of macroeconomic statistics
releases. That is, Ni(u)(t,u) is defined as “actual” minus “expected” of a macroeconomics statistics
release. In the time window u, there are n(u) variables that are scheduled to be announced.
In the estimation below, we primarily use standardized surprise measures, that is, a difference scaled
by a standard deviation. The scaling is adopted to make the impacts of various economic variables
comparable, and this is a standard practice in the literature. The coefficient of Ni(u)(t,u) , αi(u), is
interpreted as the effect of a one-standard-deviation surprise on the exchange rate return in time
window from u to u+1. ND(t, u-k) is the net order flow, defined as the difference between the
numbers of ask-side deals and bid-side deals in the time window from time u-k to u on day t. This
term is included in order to control for a possible momentum movement of the exchange rate.
Regressions are conducted over 1-, 5-, 15-, and 30-minute windows, that is, k=1, 5, 15, and 30,
separately. The sample period is from January 2001 to December 2005. For the dependent variable
of the percentage change in exchange rates, we consider three types of prices: “deal price on the ask
side”, “deal price on the bid side”, and “the middle price of the bid-and ask-quote prices”.
Regressions use all business days (t=1, 2, 3, …) in the sample. Some days, typically once a month, N
is non-zero. Regressions are run separately for separate time window u and time aggregation k.
Interpretations of coefficients on news surprises are as follows. As for the sign of αi(u), it is expected
to be “negative” for the fundamentals that show the strength of the economy: A surprise of better
fundamentals (N>0) would cause appreciation of the yen (⊿s<0). That is, any better-than-expected
news in production indicators (Tankan, GDPP, GDPF, Industrial production, Diffusion indices),
larger-than-expected surpluses in trade or current account (TB, BOP), and stronger-than-expected
economic data (Retail sales, Payroll, Housing start, etc.) should produce an appreciation of the yen
(negative ⊿s). This is because a positive surprise means the stronger Japanese economy, which may
directly, a sheer optimism, or indirectly, cause capital inflows to Japan through expected monetary
tightening (higher interest rate). Coefficients of unemployment rate announcements should be
positive because higher-than-expected unemployment rate means weakening Japanese economy,
which may prompt monetary easing. On the other hand, the sign of coefficients associated with

9
surprise inflation in price indices (PPI, CPI) could be either positive or negative. An unexpected
inflation could produce depreciation if traders believe that the exchange rate follows purchasing
power parity. However, surprise inflation may prompt a reaction in monetary policy to tighten, that is
to raise the interest rate. Hence, traders react to surprise inflation by appreciating the currency.5 It
will be shown later that estimation results are consistent with the theoretical predictions for all news
indicators whose surprise component has statistically significantly estimates, and for inflation
measure, the monetary tightening expectation is confirmed.
The OLS estimates of iα are summarized in Tables 2.6 The estimates reveal that not all variables
had statistically significant impacts on the exchange rate, but when they do, the impacts had
theoretically predicted signs. Overall, macro variables whose surprises have significant effects on
returns include Tankan (Survey on large manufacture firms), GDPP and GDPF, industrial production
(preliminary), PPI, CPI (Tokyo area), unemployment and BOP. On the other hand, macro variables
whose surprises have almost no impact on returns include Retail, Trade Balance, CPI (national),
Payroll, households’ expenditure, Housing start, Money supply, DIP, and DIF.
Tables 2
The reactions of the exchange rate to surprises are immediate. The fact that the estimated coefficient,
αi, is more or less similar for 1-, 5-, 15-, and 30-minute windows suggests that the most of the return
reaction occurs within a minute and this new level continues for at least 30 minutes. Therefore, this
reaction is a one-time sudden jump to a new equilibrium. This is consistent with what has been
established in the literature on the US macro announcements effect on returns.
The magnitude of impacts is relatively small. Take the variable with largest impact, GDPP that is
announced at 8:50 (Table 2-2). A one-standard deviation positive surprise of GDPP typically causes
0.0127 percent appreciation of the yen. That is, if the level of the yen/dollar rate is 100.00, then the
5 The latter reasoning is still relevant in the period of deflation in Japan. Any sign of surprise inflation may be a welcome sign that the Japanese economy would regain normality, ending the quantitative easing sooner than later, resulting in a hike of the policy interest rate from zero.
6 In this paper, we report estimation results of a surprise normalized by a standard deviation. Results with a surprise of level differences are not reported here in order to save spaces, but they are similar to those with normalized surprises.

10
new rate would be 100.0127 in one minute and 100.0192 in thirty minutes. The impact of Tankan-
Manufacturing is about half of the GDPP impact. Others are smaller than GDPP and Tankan-M.
These findings shed some light on the Japanese news announcement effects on the dollar/yen returns.
First, some macroeconomic statistics announcements are found to be relevant in the dollar/yen
exchange rate returns. Surprise components of announcement of several macroeconomic variables
have statistically significant effects on the dollar/yen exchange rate, as theory predicts. Surprise
components related to production (Tankan, GDPP, GDPF), prices (PPI and CPI (Tokyo are), and the
current account have significant impact on returns. However, we fail to detect any consistently
significant impact from other news releases such as Retail sales, TB, and business cycle indicators
(DIP and DIF). These results mostly agree with findings of the US macro announcements and the
dollar/yen exchange rate by Chaboud et al. (2004). Second, the Japanese news impacts on returns,
when they exist, are long-lived. The significance lasts at least 15 minutes for most of the cases.
These findings are similar to Chaboud et al. (2004) where a movement in returns triggered by the
unexpected component of the US macroeconomic announcements is found to be generally completed
within a few minutes. The long-lived effects confirm Ito and Hashimoto (2007) in that the price
impact on returns remains about 10-15 minutes on average. Third, the magnitude of the impact is
much smaller than the US macro variable announcements that were found in Chaboud et al. (2004).
Our results are similar to Ehrmann and Fratzscher (2004) that found that US macro variables had
larger impacts on the euro than the German macro announcements.
5. Impacts on Volatility and Volume
5.1. Theoretical Predictions
Theory predicts that only surprise components of the news release affect the returns, and news
without a surprise should not significantly change returns. However, with regard to volatility and the
number of deals, impacts from a surprise may be quite different.
If a surprise in some news has significant impacts on the return, it should significantly affect volatility
as well, since volatility is the sum of the accumulated absolute changes. The size of volatility is
determined by how the exchange rate moves to a new level, within one big jump or with many small
changes, and with monotonous changes or with some reverse movements on the way to a new level.

11
Even when the return reaction is not significantly different from zero, volatility and volume of
transactions may rise at the time of news release. The release of news announcement itself, with or
without a surprise, may have significant impacts. Suppose “no surprise”, that is, the actual
announcement of macroeconomics statistics is exactly the same as the average of market expectations.
Theory suggests that there should be no positive or negative returns. However, even if the “average”
expectation is confirmed by the actual announcement, an individual investor with his “subjective”
expectation above the “average” expectation may find it necessary to trade with another individual
investor with her subjective expectation “below” the average expectation. These trades may not
change the price level. Therefore, it is natural to think that deal activities will surge following an
announcement. Similarly, those deal activities—some selling and some buying—may affect the
prices to move up or down following announcements, without resulting in a price change. Price
volatility, which comes from the exchange rate going up and down within a narrow band, may
increase while a total return being zero.
Table 3 summarizes the above discussion. When relevant news is released, which means non-zero
returns, the number of deals could be zero (to be precise, not significantly different from zero) among
investors with homogeneous subjective expectations. And the number of deals could be non-zero
among investors with heterogeneous subjective expectations, and then, volatility has to be positive.
Table 3
When the released news is non relevant, which means zero returns, there are three possibilities. Deals
and volatility may be both zero, if investors’ subjective expectations are homogeneous. If investors’
subjective expectations are heterogeneous, transactions among these people may or may not change
the price level, but volatility becomes larger reflecting these transactions.
5.2. Volatility
We now examine to what extent the news release and its surprises will affect the exchange rate price
volatility. The price volatility here is defined as a sum of squared 1-minute returns over the window
of 1, 5, 15 or 30 minutes: it is called a realized volatility. The impact of news release on volatility is
estimated in a regression with the following specification.

12
),(),(|),(|)1,(),()3( )()(
)(
1)()(
)(
1)(10 ututDUMNutNutVutV uiui
un
iuiui
un
uiεγβαα +++−+= ∑∑
==
,
where the volatility (V) of time window u on day t is explained by one-lagged volatility (V(t, u-1)) ,
the absolute value of surprise components of macroeconomic announcements (|N|), and the dummy
variable of macroeconomic news release (DUMN).7 The lagged volatility is included in order to
capture the volatility clustering and a general condition of the market of the day. The dummy
variable is 1 on the day of news releases, and zero otherwise. The reason that the dummy variable is
included in this specification is to pick up the possible surge in price volatility in the price discovery
process, independent of the size of surprises. Even if the return (level change) after k-minutes may
not be affected when there is no surprise, activities and price volatility during k-minutes may become
higher. The dummy variable captures that news announcement itself has an increasing effect on
volatility.
Table 4 summarizes the news effects on realized volatilities of midprice (surprises are normalized by
standard deviations). The set of news announcements that have significant impacts on volatility is not
the same as that found in the return estimations. In the volatility regressions, news announcements
such as Unemployment, CPI, TankanM (manufacturing), GDPP, GDPF are found to significantly
increase volatility of exchange rates, and Housing Start is also found to have some impacts on
volatility.
Table 4
News surprises of the morning announcements significantly increase volatility as they did for returns
regressions. As for 8:30 news releases, surprises in CPI and unemployment are found to increase 1-
minute volatility. News announcement of unemployment itself (dummy variable) is also found to
have some impact on volatility, but its impact is weak and short-lived. As for 8:50 macroeconomic
statistics announcements, the absolute value of news surprises in TankanM, GDPP, GDPF, PPI(only
1min volatility) and IPP are found to increase volatilities for at least 30 minutes after news releases.
7 Other specification we estimated (results are nor reported here in order to save spaces) includes a squared surprise (N2) in the regression: )()()}({|)(|)1()( 3
22110 ttDUMNtNtNtVtV εβββαα ++++−+= .

13
Each of the news releases of TankanM, GDP, GDPF, Money supply, TB and BOP itself (dummy
variable) is found to have some impact on volatilities.
Some of the news releases after 10:30am are found to have significant impacts on volatility whereas
most of these news releases do not significantly affect returns. For example, a surprise in Nonfarm
Payroll announcement at 10:30am significantly increases volatility about 30 minutes after the news
releases. In the case of Nonfarm payroll announcement, the surprise part, B1, is negative and has a
deceasing impact on volatility, whereas the news announcement itself, B2, is significant positive and
has a larger impact on volatility. News announcements at 14:00, all of which do not affect returns,
also have significant impact on volatility: Housing Start and household expenditures (only for 30min)
of 14:00 announcements are also found to significant increase volatility.
5.3. Number of Deals
As mentioned in the preceding sub-sections, the total amount of deals may increase at the time of
macroeconomic announcement, with or without a surprise and regardless of its size. Even with no
surprise in an announcement, the announcement itself could have a positive impact on deal activities,
because market participants who may have expectations that are different from “the average” may
have to trade in order to square the positions. Unless market participants are homogeneous in
subjective expectations on the news—which is very unlikely—some deals are bound to occur right
after the announcement. When there is a surprise component in the news, additional deal activities
will take place. Here, we examine the news announcement effects on the number of deals in the
following regressions.
(4) ),(),(|),(|),(),( )()(
)(
1)()()(
)(
1)(10 ututDUMNutNkutTDutTD uiui
un
uiuiui
un
ui
εγβαα +++−+= ∑∑==
,
where TD(t, u) is the total number of deals in the time window from announcement time u to u+k
minute, where k=1, 5, 15, and 30 minutes on day t. 8 Ni(u)(t, u) and n(u) are the same as regressions in
8 To be precise, “deal counts” in this paper means the number of seconds that included at least one deal activity within k minutes. For example, if the time window is one-minute, maximum of the deal count (on either side of bid and ask) is 60. This the is limitation of the data set, which we purchased from EBS for this time period. Still, having deals data is a huge advantage over conventional data set, such as Olsen and any others that based on Reuter FXFX screen used by many researchers including Andersen et al. (1997) and Ehrmann and Fratzscher (2004).

14
(1) and (2). DUMNi(u)(t,u) is a dummy variable of new announcement days, taking value 1 if that is
the announcement day and 0 if that is not the announcement day of variable i(u).
Here the TD(t, u-k) is included in order to control for activities due to factors other than
macroeconomic statistical announcements. Some days are busy days, due to various political and
economic factors, and some are not. The one-lagged time window just before the time u is to control
for such exogenous factors, because once deal activities are hiked, it lasts for some periods of time. A
surprise is incorporated into the regression as an absolute value, because both a positive and negative
surprise will stimulate the deal activity. This specification assumes that the effects are symmetric in
the positive and negative direction. The dummy variable DUMN captures the noise trading that is
prompted by the announcement itself, independent of the size of a surprise.
An effect of a surprise on the total number of deals is reflected in the statistical significance of
coefficients. If βi(u) is significantly larger than zero, then a magnitude (as measured by an absolute
value) of a surprise component stimulates transactions. In addition, the bigger the surprise (the gap
between the actual and predicted indicators), the more the number of deals. On the other hand, the
number of deals is not affected by surprise components if βi(u) is not significantly different from zero.
The results are summarized in Table 5.9 News indicators that are found to have significant impacts on
total deals are almost identical to those in Table 4, implying that the price discovery process produces
both price volatility and deals (actual transactions), and market participants do have heterogeneous
subjective expectations (recall Table 3). On the other hand, news indicators are mostly similar but not
identical to that of returns (Table 2). For example, Tankan (both manufacturing and non-
manufacturing), GDPP, IPP, unemployment, PPI, and trade balance are found to have significant
impact on the number of deals, whereas money supply, Payroll, BOP, IPF, DIs, households’
expenditure, housing start, retail sales, CPI and CPI of Tokyo area do not affect the total number of
deals. The results are similar to that of returns with a few exceptions: trade balance announcement
does not significantly change the returns whereas it does increase the number of deals. Similarly,
BOP does move the exchange rate whereas it does not significantly affect the number of deals. Also,
Tankan (non-manufacturing) was not significantly observed in the return estimation, but it is found
out as one of the transaction accelerator.
9 Again, we report estimation results based on a surprise normalized by a standard deviation. Estimation results based on level difference surprises are not reported here to save spaces.

15
Table 5
Coefficients of most of the news announcements whose surprise components are significantly
estimated become larger for longer time-windows. For example, coefficients of γ of TankanM are
23.22 for 1min window (which means that the deal activities increase by 23 transactions out of
possible 120 transactions within a minute10), 108 for 5min, 215 for 15min, and 277 for 30min. This
means that the number of transactions jumps following the Tankan (manufacturing) announcements,
regardless of the size of surprise, and continues to increase up to 30 minutes. Similarly, the impact of
GDPP has a large γ, suggesting that the announcement itself stimulates deal activities. The fact that
both Tankan and GDPP have large impacts on transactions means that interpretations of these
announcements are heterogeneous among investors, so that trades occur among these investors.
In sum, the surprise components of some news announcements have significant impacts on the total
number of deals; there are strong impacts from announcement itself of Tankan and GDPP, and much
lesser extent of IPP. On the other hand, Money supply, housing start, payroll and others did not
produce large impacts on deal activities, suggesting that interpretation of these variables is relatively
homogeneous among traders.
5.4. Graphical check
Finally, in order to check intuitively the effect of unexpected content of macroeconomic news
releases on market activities, the number of deals on news-release days is compared to that on no-
news days in Figure 1 (aggregate). Lines in the figure are period average of 2001-2005 (for CPI,
period average of April 2002- December 2005) at 15-minute window. The top panel of the figure
plots the difference between the number of deals on news-announcement days and non-announcement
days. Two lines in the bottom panel show the number of deals on news-announcement days and non-
announcement days, respectively. That is, the line in the top panels is the difference between two
lines in the bottom panel.
10 Here the total number of deals is counted, so that both bid-side deals and ask-side deals are counted. As explained in an earlier footnote, the number is the number of seconds in which at least one transaction take place. Therefore, the maximum number within a minute is 120 (=60x2). Since even without announcement some transactions take place (that is α0 and α1*TD(t-1)), so that the increment of 23 is very large.

16
Figure 1
As is clear from the Figure 1, transactions on news announcement days tend to become larger at three
peaks in a day.11 The difference of the number of transactions between news-announcement days and
non-announcement days is remarkable between 9 and 10 am (JST). This time period, the first peak of
a transaction pattern in a day, is just after many macro statistics are announced at either 8:30am or
8:50am; therefore, this surge of activities may likely reflect the news releases impact as well as the
overnight pent-up demands from retail customers.12
In order to examine impacts from each of the news announcements, we compare the transaction on
both news-announcement days and non-announcement days for each of the news indicator release.
Figures 2.1-2.11 show the period average of number of deals of news-release days and non-
announcement days for each of the news release (either at 8:30am or at 8:50am). Each figure plots
the period average of 2001-2005 (for CPI, period average of April 2002-2005) at a 15-minute window
from 6am to 12 noon. Figures 2.12-2.17 show the 2001-2005 period averaged number of deals with
news releases at either 10:30am, 2:00pm, or 2:30pm, at a 15-minute window. In each figure, the red
line shows the benchmark that there was no macro announcement, and the black line shows the deal
activities of announcement days (when at least one macro announcement took place.) Again, the top
panel shows the difference of number of deals between news-announcement days and non-
announcement days, and the bottom panel shows the number of deals of both news-release days and
non-announcement days.
A look at each graph reveals that responses of the number of deals to news announcements differ
from news to news. News releases such as Tankan, GDPP, and GDPF result in the huge increase in
the number of deals around the news announcement time. For example, the number of deals jumps
11 Ito and Hashimoto (2006b) show that there are three peaks in a day: about 9-10am (JST), 4-6pm (JST), and 10pm-midnight (JST). They clearly correspond to the Tokyo opening, London opening, and New York opening times, respectively. The last peak corresponds to hours when London and New York business hours overlap. Each of the three troughs, between 2am and 8am (JST), about 12am-1pm (JST), and 8pm (JST), correspond to New York market close, Tokyo lunch time, and London Lunch time, respectively.
12 Figure 1 compares the number of deals on days with at least one announcement release with the number of deals on days without any announcement. Hence, the average of deals on announcement days of, say, 14:00 announcement may contain non-announcement days of, say, 8:30 announcement. Therefore, the contrast between these two days seems not so sharp.

17
more than 3 times when Tankan indicator is released; the number of deals at the time of GDPP
releases is about 2.5 times higher than that of no-news days. On average, the number of deals at 15-
minute windows doubles on announcement days, and this hike continues about 3 hours. On the other
hand, the number of deals on other news releases such as CPI, PPI, Money Supply, TB, and BOP
does not seem to be different from that on days when there is no news release.
Figures 2.1 - 2.11
As for the macroeconomics statistics releases after 10:30am, the impact of news announcements is
not striking compared to that by the early morning (before 9:00am) news releases such as Tankan,
GDPP, and GDPF. In the case of Nonfarm Payroll (10:30am) and Retail Sales (14:30)
announcements, deals were not stimulated by these news releases at all. The total number of deals
did not show a surge at the time of, or after the announcement. As for DIP and DIF (diffusion
indices), the total number of deals became, on average, larger than that on non-announcement day
from two hours before the news release until one hour after the announcements—but the difference
was very small.
Figures 2.12 - 2.17
Figures 3.1-3.3 show effects of Monetary Policy Board Meeting (MPM) on the number of deals. The
line shows averaged difference between the total number of deals on MPM days and non-MPM days.
Because the closing time of board meetings varies from a meeting to next, time “0” is set as the
closing time of each of the MPM meetings and is regarded as the approximate news release time.13
Figure 3.1 shows transactions associated with MPM closing by noon, figure 3.2 shows MPM closing
between 12:00pm and 2:30pm, and figure 3.3 shows MPM closing after 2:30pm. Transactions on
days when MPM finished before noon did not show any hike at the closing time or about one hour
after the meeting. In contrast, as seen in figures 3.2 and 3.3, the total number of deals became
significantly larger on MPM days at the closing time in the afternoon, and it continues about one or
two hours after the meeting. In particular, the magnitude of an increase in transaction on days when
MPM closed after 2:30pm is remarkably large.
13 The MPM closing time is recorded in the “Minutes”.

18
Figures 3.1 - 3.3
In summary, the surge in deals around 9:00am (JST) is partly caused by macroeconomics statistics
announcements of Tankan, GDPP, and GDPF. To our surprise, most of the news releases do not
significantly increase the transaction volumes. This finding is contrast to the US news impact on FX
market where the news releases significantly stimulate the transaction. As for the MPM, the board
meeting closing in the afternoon had some impact on transaction. This may be due to the fact that
London and New York markets as well as Japanese markets have a chance to respond to the result of
board meetings. Alternatively, a longer MPM meeting may tend to include more surprises than a
shorter one.
6. Conclusion
In this paper, reactions of the dollar-yen exchange rate, deal activities, and realized volatility
following the macroeconomic news announcement were examined. Returns, transactions, and
volatility around the statistics announcement time were regressed with daily data with the
announcement time only. In case of returns, the returns were regressed on the surprise component of
the macro announcement. In case of deal activities, the deals are regressed on the absolute value of
news surprise and the announcement dummy (zero-one). In case of volatility, volatility was also
regressed on the absolute value of news surprise and the announcement dummy.
It was found that many variables, including GDP, Tokyo CPI, Tankan-M, were found to have impacts
on returns, although the magnitude of the impacts are rather small—many smaller than the bid-ask
spread. An impact on returns are immediate—mostly in one minute, and persistent. Stronger-than-
expected announcement of these variables typically appreciated the yen. We fail to detect a
significant impact on returns from Trade balance statistics or Diffusion indices.
As for the effects on the amount of transactions, GDPP and GDPF, Tankan, IP, and CPI, are found to
have particularly significant effects on deals and price volatility. Among others, the Tankan-M is the
variable that causes strong return reactions with big surges in volume of transactions (i.e., deal
counts) and volatility. Many other variables have significant volatility and deals effects, suggesting
the existence of heterogeneous subjective expectations and a relatively long price discovery process
with trading activities. Traders disagree in interpretation of macroeconomic news, and they will trade.

19
Reference Admati, Anat R. and Paul Pfleiderer, “A Theory of Intraday Patterns: Volume and Price Variability,” Review of Financial Studies, (1988), vol. 1, no. 1: 3-40.
Andersen, Torben G. and Tim Bollerslev (1997). “Intraday Periodicity and Volatility Persistence in Financial Markets,” Journal of Empirical Finance, vol. 4: 115-158. Andersen, Torben G. and Tim Bollerslev (1998). “Deutsche Mark-Dollar Volatility: Intraday Activity Patterns, Macroeconomic Announcements, and Longer Run Dependencies,” Journal of Finance, Vol. 53, Issue 1, February: 219-265. Andersen, Torben G., Tim Bollerslev, Francis X. Diebold, and Clara Vega (2003). “Micro Effects of Macro Announcements: Real-Time Price Discovery in Foreign Exchange,” American Economic Review, vol. 93: 38-62. Andersen, Torben G., Tim Bollerslev, Francis X. Diebold, Clara Vega, (2005). “Real-Time Price Discovery in Stock, Bond and Foreign Exchange Markets”, NBER Working Paper No. 11312. Baillie, Richard T. and Tim Bollerslev (1990). “Intra-Day and Inter-Market Volatility in Foreign Exchange Rates,” Review of Economic Studies, vol. 58: 565-585. Baillie, Richard T. and Michel M. Dacorogna (1997), eds., High Frequency Data in Finance, a conference volume Journal of Empirical Finance vol. 4, no. 2-3. Berger, David, Alain P. Chaboud, Sergey V. Chernenko, Edward Howorka, Raj S. Knshnasami Iyer, David Liu, and Jonathan H. Wright, (2005). “Order flow and Exchange Rate Dynamics in Electronic Brokerage System Data,” Board of Governors of the Federal Reserve System International Finance Discussion Papers No.830, April. Bollerslev, Tim and I. Domowitz, (1993). “Trading Patterns and Prices in the Interbank Foreign Exchange Market,” Journal of Finance, vol. 48: 1421-1443. Brock, W. A. and A. Kleidon, (1992). “Periodic Market Closure and Trading Volume: A Model of Intraday bids and asks,” Journal of Economic Dynamics and Control, vol. 16: 451-489. Chaboud, Alain P.; Sergey V. Chernenko, Edward Howorka; Raj S. Krishnasami Iyer, David Liu and Jonathan H. Wright, 2004. “The High-Frequency Effects of U.S. Macroeconomic Data Releases on Prices and Trading Activity in the Global Interdealer Foreign Exchange Market,” Board of Governors of the Federal Reserve System, International Finance Discussion Papers, Number 823, November. Covrig, Vicentiu and Michael Melvin, (2005), “Tokyo Insiders and the Informational Efficiency of the Yen/Dollar Exchange Rate,” International Journal of Finance and Economics, vol. 10, 185-193. Dufour, Alfonso and Robert F. Engle, (2000). “Time and the Price Impact of a Trade,” Journal of Finance, Vol.55, Issue 6, 2467-2498.

20
Easley, David and Maureen O’Hara, (1992). “Time and the Process of Security Price Adjustment,” Journal of Finance, vol. XLVII, no.2, June: 577-605. Ehrmann, Michael, and Marcel Fratzscher, 2004, “Exchange Rates and Fundamentals New Evidence from Real-Time Data” ECB Working Paper Series No. 365, May 2004 Engle,Robert F., Takatoshi Ito, Wen-Ling Lin, 1990, “Meteor Showers or Heat Waves? Heteroskedastic Intra-Daily Volatility in the Foreign Exchange Market”, Econometrica, Vol. 58, No. 3, pp. 525-542, (May 1990). Engle, Robert F. and Andrew J. Patton, (2004). “Impacts of Trades in an Error Correction Model of Quote Prices,” Journal of Financial Market, Vol 7, Issue 1, 1-25. Faust, Jon; John H. Rogers, Shing-Yi B. Wang, and Jonathan H. Wright, (2003). “The High Frequency Response of Exchange Rates and Interest Rates to Macroeconomic Announcements,” Board of Governors of the Federal Reserve System, International Finance Discussion Papers, no. 784, October. Foster, F. Douglas, and S. Viswanathan, (1990). “A Theory of the Interday Variations in Volume, Variance, and Trading Costs in Securities Markets,” Review of Financial Studies, vol. 3, no.4: 593-624. Foster, F. Douglas, and S. Viswanathan, (1993). “Variations in Trading Volume, Return Volatility, and Trading Costs: Evidence on Recent Price Formation Models,” Journal of Finance, 48, 187-211. Goodhart, Charles; Takatoshi Ito; and Richard Payne, (1996) “One Day in June 1993: A Study of the Working of the Reuters 2000-2 Electronic Foreign Exchange Trading System,” in J. A. Frankel, G. Galli, and A. Giovannini (eds.) The Microstructure of Foreign Exchange Markets, Chicago: The University of Chicago Press: 107-179. Goodhart, Charles and Richard Payne, (1996) “Microstructural Dynamics in a Foreign Exchange Electronic Broking System” Journal of International Money and Finance, vol. 15, no. 6: 829-852. Goodhart, Charles, A.E. and Maureen O’Hara, (1997). “High Frequency Data in Financial Markets: Issues and Applications” Journal of Empirical Finance, vol. 4: 73-114. Harris, Larry (1986). “A Transaction Data Survey of Weekly and Intraday Patterns in Stock Returns,“ Journal of Financial Economics, Vol.16, 99-117. Hsieh, David, (1988). “The Statistical Properties of Daily Foreign Exchange Rates, 1974-1983,” Journal of International Economics, vol. 24: 129-145. Hsieh, David A. and Allan W. Kleidon, (1996). “Bid-Ask Spreads in Foreign Exchange Markets: Implications for Models of Asymmetric Information” in J. A. Frankel, G. Galli, and A. Giovannini

21
(eds.) The Microstructure of Foreign Exchange Markets, Chicago: The University of Chicago Press: 41-67. Ito, Takatoshi and Yuko Hashimoto, (2004). “Microstructure of the Yen/Dollar Foreign Exchange Market: Patterns of Intra-day Activity in the Electronic Broking System” NBER working paper, no. 10856, October 2004. Ito, Takatoshi and Yuko Hashimoto, (2006). “Intra-day Seasonality in Activities of the Foreign Exchange Markets:Evidence from the Electronic Broking System”, Journal of The Japanese and International Economies, Vol.20, Issue 4, 637-664, Dec 2006. Ito, Takatoshi and Yuko Hashimoto (2007, forthcoming). “Price Impacts of Deals and Predictability of the Exchange Rate Movement,” in T. Ito and A. Rose (eds.), International Financial Issues in the Pacific Rim: Global Imbalances, Financial Liberalization, and Exchange Rate Policy, University of Chicago Press-NBER. Ito, Takatoshi, Richard K. Lyons, and Michael T. Melvin, (1998). “Is There Private Information in the FX Market? The Tokyo Experiment” The Journal of Finance, vol. LIII, no. 3, June: 1111-1130. Ito, Takatoshi and V. Vance Roley, (1987). “News from the U.S. and Japan: Which Moves the Yen/Dollar Exchange Rate?", Journal of Monetary Economics, vol. 19, March: 255-277. Ito, Takatoshi and V. Vance Roley, 1991, “Intraday Yen/Dollar Exchange Rate Movements: News or Noise?”, Journal of International Financial Markets, Institutions and Money, Vol. 1, No. 1, pp. 1-31, (1991). Lyons, Richard (1995). “Tests of Microstructural Hypotheses in the Foreign Exchange Market,” Journal of Financial Economics, vol. 39: 321-351. Lyons, Richard (1996). “Foreign Exchange Volume: Sound and Fury Signifying Nothing?” in J. A. Frankel, G. Galli, and A. Giovannini (eds.) The Microstructure of Foreign Exchange Markets, Chicago: The University of Chicago Press: 183-205. Lyons, Richard (1997). “A simultaneous trade model of the foreign exchange hot potato”. Journal of International Economics 42, 275-2 Lyons, Richard (1998). “Profits and Position Control: A Week of FX dealing” Journal of International Money and Finance, vol. 17: 97-115. Lyons, Richard (2001). The Microstructure Approach to Exchange Rates, Cambridge: MIT Press. Wood, Robert, Thomas McInish, and Keith Ord (1985). “An Investigation of Transaction data on NYSE Stocks,” Journal of Finance, Vol.40, 723-741.
22
Figure 1: Number of deals on Announcement days/Non-announcement days

23
Figure 2: Transaction and News Release
(1) CPI; 8:30am (2) Tokyo CPI; 8:30am (4) Unemployment, 8:30am
(4) Tankan; 8:50am) (5) Money Supply, 8:50 (6) GDP-P (8:50am) (7) GDPF (8:50am)
(8) BOP; 8:50am (9) Trade balance(8:50am) (10) PPI (8:50am) (11) IP, Preliminary (8:50am)

24
(12) Nonfarm Payroll; (10:30am),
(13) Industrial Production Final, 13:30
(14) Housing Start, (14:00) (15) Diffusion Index, prelim (14:00) (16) DI Final (14:00) (17) Retail Sales (14:00)

25
Figure 3.1 Transaction and MPM closing (by noon)
Figure 3.2 Transaction and MPM closing (between 12:00pm and 2:30pm)
Figure 3.3 Transaction and MPM closing (after 2:30pm)

26
Table 1: Japanese Macroeconomic News Releases
Macroeconomic news releases Unit Definition Frequency and announcement date Mean STD Surprise MeSurprise STD
8:30 TokyoCPI % month-to-month change Consumer Price Index in Tokyo region (allitems excluding fresh food, seasonally Monthly, last week of the month 0.000 0.016 -0.000939 0.022
CPI % month-to-month change Consumer Price Index (all items excludingfresh food, nationwide, seasonally adjusted) Monthly, Last week of the following month -0.001 0.017 0.0002347 0.018
Unemployment Rate (%) Monthly, last week of the following month 0.178 0.928 -0.000704 0.029
8:50 Tankan (Large Manufacturing) IndexBOJ short-term business survey ofenterprises, Large Manufacturing Indexlevel
Quarterly, The first week of the monthfollowing the quarter (July for Q2), (exceptmid-December for Q4)
-0.030 2.618 0.014085 0.520
Tankan (Large Non ManufacturingIndexBOJ short-term business survey ofenterprises, Large Non-ManufacturingIndex level
Quarterly, The first week of the monthfollowing the quarter (July for Q2), (exceptmid-December for Q4)
-0.020 1.570 0.0031397 0.231
Money supply (M2+CD) % change from 12 month earlier Money supply, M2+CD (average balance) Monthly, 6th business day of the followingmonth*1 0.114 0.536 -0.000626 0.046
GDP Preliminary % quarter-to-quarter change Real GDP First Preliminary Quarterly, Mid-month, two months after thelast quarter month 0.017 0.242 0.0031299 0.156
GDP Final % quarter-to-quarter change Quarterly, Mid-month, three months afterthe last quarter month 0.025 0.353 -0.001878 0.104
BOP Billions of yen Current Account Surplus, Balance ofPayments
Monthly, Mid-month, two month later(mid-March for January figure) 58.309 269.907 1.89789 41.703
TB Billions of yen Trade balance (customs data) Monthly, mid of the following month 36.834 173.515 -0.5259 32.604
PPI % change from 12 month earlier Producer Price Index (Wholesale PriceIndex until Dec 2002)
Monthly, Mid-month of the followingmonth 0.001 0.022 0.001252 0.027
Industrial Production, Preliminary % month-to-month change Monthly, mid of month, two months later 0.025 0.310 -0.019327 0.18710:30 Nonfarm Payroll % change from 12 month earlier Monthly, 1st wk of the two months later -0.005 0.134 -0.000783 0.19113:30 Industrial Production, Final % month-to-month change Monthly, mid of month, two months later 0.001 0.278 0.0020619 0.055
14:00 Difusion Index, Preliminary Index Index of Business Conditions (Leadingindex), Preliminary Monthly, early of the following month 2.140 11.342 0.033099 0.826
Difusion Index, Final Index Index of Business Conditions (Leadingindex), Final
Monthly,mid-late of the following month 1.984 10.778 0.11793 2.618
Households' expenditure % change from 12 month earlier Households’ consumption expenditure Monthly, early-month, two months later -0.012 0.423 -0.003061 0.221Housing start % change from 12 month earlier Monthly, last week of the month -0.042 0.856 0.061268 1.058
14:30 Retail Sales % month-to-month change Monthly, last week of the following month -0.074 0.580 0.0004695 0.604

27
Table 2 News Surprise Impact on Returns (surprises normalized by STD) 2-1. Announcement at 8:30(JST), Midprice
Equation (1) Equation (2)1min 5min 15min 30min 1min 5min 15min 30min
TokyoCPI -6.10E-06 ** -1.81E-05 ** -7.20E-07 -3.40E-05 * -6.34E-06 ** -1.84E-05 *** -7.68E-07 -3.48E-05 *(0.000) (0.000) (0.000) (0.000) (0.000) (0.000) (0.000) (0.000)
Unemployment 1.50E-05 *** 2.79E-05 *** 2.91E-05 ** 5.07E-05 ** 1.53E-05 *** 2.74E-05 *** 2.91E-05 ** 4.99E-05 **(0.000) (0.000) (0.000) (0.000) (0.000) (0.000) (0.000) (0.000)
CPI -1.97E-06 -4.01E-06 -1.75E-05 -9.89E-06 -1.93E-06 -3.88E-06 -1.75E-05 -1.02E-05(0.000) (0.000) (0.000) (0.000) (0.000) (0.000) (0.000) (0.000)
Return(-1) -1.24E-01 *** -4.43E-02 -8.55E-03 -1.84E-02(0.036) (0.036) (0.042) (0.047)
Orderflow 2.59E-06 2.11E-06 -6.14E-08 -1.98E-06(0.000) (0.000) (0.000) (0.000)
R-squared 1.35E-02 1.19E-02 4.25E-03 4.31E-03 2.26E-02 1.33E-02 4.34E-03 6.41E-03Nob 1278 1278 1278 1278 1278 1278 1278 1278 2-2. Announcement at 8:50(JST), Midprice
Equation (1) Equation (2)1min 5min 15min 30min 1min 5min 15min 30min
TankanM -5.23E-05 *** -9.54E-05 *** -9.64E-05 *** -9.58E-05 *** -5.36E-05 *** -9.46E-05 *** -9.67E-05 *** -9.40E-05 ***(0.000) (0.000) (0.000) (0.000) (0.000) (0.000) (0.000) (0.000)
TankanN 7.41E-07 3.36E-07 8.84E-06 1.49E-07 9.95E-07 2.16E-06 9.00E-06 1.07E-07(0.000) (0.000) (0.000) (0.000) (0.000) (0.000) (0.000) (0.000)
Money 2.34E-06 -5.42E-07 -1.53E-05 -4.50E-05 * 2.08E-06 -3.50E-07 -1.51E-05 -4.54E-05 *(0.000) (0.000) (0.000) (0.000) (0.000) (0.000) (0.000) (0.000)
GDPP -1.27E-04 *** -1.45E-04 *** -2.13E-04 *** -1.92E-04 *** -1.26E-04 *** -1.46E-04 *** -2.14E-04 *** -1.91E-04 ***(0.000) (0.000) (0.000) (0.000) (0.000) (0.000) (0.000) (0.000)
GDPF -8.28E-05 *** -6.60E-05 *** -6.93E-05 *** -5.78E-05 ** -8.31E-05 *** -6.75E-05 *** -7.15E-05 *** -5.86E-05 **(0.000) (0.000) (0.000) (0.000) (0.000) (0.000) (0.000) (0.000)
BOP -9.45E-06 * -2.44E-05 ** -5.75E-05 *** -4.92E-05 ** -8.54E-06 * -2.28E-05 ** -5.79E-05 *** -5.02E-05 **(0.000) (0.000) (0.000) (0.000) (0.000) (0.000) (0.000) (0.000)
TB 3.03E-06 -1.23E-06 2.46E-05 2.20E-05 2.42E-06 -2.41E-06 2.40E-05 2.19E-05(0.000) (0.000) (0.000) (0.000) (0.000) (0.000) (0.000) (0.000)
PPI -4.00E-06 -2.09E-05 ** -3.79E-05 ** -5.11E-05 ** -4.16E-06 -2.10E-05 ** -3.78E-05 ** -4.95E-05 **(0.000) (0.000) (0.000) (0.000) (0.000) (0.000) (0.000) (0.000)
IPP -5.07E-05 *** -4.98E-05 *** -6.08E-05 *** -7.31E-05 *** -5.02E-05 *** -4.87E-05 *** -5.87E-05 *** -7.08E-05 ***(0.000) (0.000) (0.000) (0.000) (0.000) (0.000) (0.000) (0.000)
Return(-1) -0.185 *** -0.168 *** -0.076 * -0.075 *(0.055) (0.052) (0.057) (0.057)
Orderflow 4.69E-06 * 5.79E-06 *** 1.84E-06 -3.43E-09(0.000) (0.000) (0.000) (0.000)
R-squared 0.341 0.181 0.113 0.056 0.347 0.188 0.115 0.059Nob 1274 1274 1274 1274 1274 1274 1274 1274 2-3. Announcement at 10:30(JST), Midprice
Equation (1) Equation (2)1min 5min 15min 30min 1min 5min 15min 30min
Payroll -4.27E-06 -2.44E-05 * -2.44E-05 * -3.04E-05 * -4.15E-06 -6.09E-06 -2.43E-05 * -2.95E-05(0.000) (0.000) (0.000) (0.000) (0.000) (0.000) (0.000) (0.000)
Return(-1) -1.03E-01 ** -1.49E-01 *** 5.03E-03 2.63E-02(0.050) (0.058) (0.046) (0.045)
Orderflow 6.84E-06 *** 3.37E-06 * 1.72E-06 5.31E-07(0.000) (0.000) (0.000) (0.000)
R-squared 0.002 0.001 0.005 0.003 0.015 0.013 0.009 0.005Nob 576 576 576 576 576 576 576 576

28
2-4. Announcement at 13:30 (JST), Midprice
Equation (1) Equation (2)1min 5min 15min 30min 1min 5min 15min 30min
IPF -3.87E-06 -2.25E-07 -9.20E-07 -2.73E-06 -4.17E-06 -1.06E-06 -1.17E-06 -3.18E-06(0.000) (0.000) (0.000) (0.000) (0.000) (0.000) (0.000) (0.000)
Return(-1) 0.161 *** -0.081 *** -0.060 ** -0.034(0.038) (0.027) (0.033) (0.034)
Orderflow -1.24E-06 5.92E-06 *** 1.98E-07 1.53E-06(0.000) (0.000) (0.000) (0.000)
R-squared 0.0007 8.90E-07 1.55E-06 1.80E-05 0.0162 0.0147 0.0036 0.0010Nob 1261 1261 1261 1261 1261 1261 1261 1261 2-5. Announcement at 14:00 (JST), Midprice
Equation (1) Equation (2)1min 5min 15min 30min 1min 5min 15min 30min
DIP -6.14E-07 -2.18E-06 -8.11E-06 -1.96E-05 -3.74E-07 -1.77E-06 -7.53E-06 -2.03E-05(0.000) (0.000) (0.000) (0.000) (0.000) (0.000) (0.000) (0.000)
DIF -8.84E-07 -1.21E-06 -2.16E-05 * -7.16E-06 -1.36E-06 -1.51E-06 -2.15E-05 * -6.50E-06(0.000) (0.000) (0.000) (0.000) (0.000) (0.000) (0.000) (0.000)
Expenditure 5.78E-07 4.78E-06 1.24E-05 3.77E-05 ** 6.67E-07 5.12E-06 1.24E-05 3.79E-05 **(0.000) (0.000) (0.000) (0.000) (0.000) (0.000) (0.000) (0.000)
House 7.48E-06 * -6.87E-06 -1.23E-06 -9.10E-06 7.76E-06 ** -7.89E-06 -4.46E-07 -9.85E-06(0.000) (0.000) (0.000) (0.000) (0.000) (0.000) (0.000) (0.000)
Return(-1) 1.20E-01 *** -1.51E-01 *** -5.24E-02 * 5.57E-02 **(0.044) (0.029) (0.032) (0.033)
Orderflow -6.46E-08 4.94E-06 *** -8.43E-09 -5.97E-07(0.000) (0.000) (0.000) (0.000)
R-squared 0.002 0.001 0.003 0.004 0.011 0.023 0.006 0.006Nob 1273 1273 1273 1273 1273 1273 1273 1273 2-6. Announcement at 14:30(JST), Midprice
Equation (1) Equation (2)1min 5min 15min 30min 1min 5min 15min 30min
Retail Sales -2.02E-06 -2.35E-06 -7.21E-06 -1.07E-06 -1.77E-06 -2.70E-06 -6.26E-06 -2.14E-06(0.000) (0.000) (0.000) (0.000) (0.000) (0.000) (0.000) (0.000)
Return(-1) -8.61E-02 ** -1.35E-01 *** -9.17E-02 *** -1.80E-01 ***(0.038) (0.028) (0.031) (0.033)
Orderflow 3.33E-06 ** 4.70E-06 *** -2.50E-07 3.60E-06 ***(0.000) (0.000) (0.000) (0.000)
R-squared 2.41E-04 6.95E-05 1.64E-04 1.97E-06 0.005 0.023 0.009 0.024Nob 1278 1278 1278 1278 1278 1278 1278 1278

29
Table 3: Theoretical Predictions
Returns Deals VolatilityHomogeneous SubjectiveExpectations
One big price jump non-zero 0 +
Heterogeneous SubjectiveExpectations
Price discoveryprocess immediate;one big jump
non-zero + +
Heterogeneous SubjectiveExpectations
Price discoveryprocess takes time
non-zero + ++
Homogeneous SubjectiveExpectations
No price change 0 0 0
Heterogeneous SubjectiveExpectations
Price discoveryimmediate
0 + 0
Heterogeneous SubjectiveExpectations
Price discoveryprocess takes time
0 + +
Non-relevant news
Relevant news

30
Table 4. News release impacts on Realized Volatility (Midprice, surprises normalized by STD) 4-1. Announcement at 8:30
1min 5min 15min 30minCoefficient s.e. Coefficient s.e. Coefficient s.e. Coefficient s.e.
C 2.41E-08 *** (6.6E-09) 1.66E-07 *** (3.1E-08) 4.47E-07 *** (4.8E-08) 1.06E-06 *** (8.8E-08)Volatility(-1) 6.45E-01 *** (2.9E-02) 1.02E-01 *** (2.2E-02) 2.01E-01 *** (2.4E-02) 2.48E-01 *** (2.7E-02)TotalDeals(-1) -8.64E-10 (1.7E-09) 7.14E-09 *** (1.8E-09) 4.92E-09 *** (1.2E-09) 4.98E-09 *** (1.2E-09)ABSTCPI -3.67E-09 (7.6E-09) 9.32E-09 (3.2E-08) 1.60E-08 (4.5E-08) -6.37E-08 (7.8E-08)ABSUNEMP 1.23E-08 * (7.8E-09) 2.37E-08 (3.2E-08) 2.48E-08 (4.6E-08) -1.29E-07 * (8.0E-08)ABSCPI -1.17E-08 ** (7.0E-09) -1.46E-08 (2.9E-08) -2.80E-10 (4.2E-08) -8.00E-08 (7.2E-08)TCPIDUM 6.88E-08 (7.0E-08) 2.21E-07 (2.9E-07) 4.16E-07 (4.1E-07) 6.45E-07 (7.2E-07)UNEMPDUM -6.98E-08 * (5.3E-08) -1.77E-07 (2.2E-07) -2.85E-07 (3.1E-07) 4.68E-07 (5.4E-07)CPIDUM 5.35E-08 (6.3E-08) -1.11E-07 (2.6E-07) -1.68E-07 (3.7E-07) 3.16E-07 (6.5E-07)R-squarfed 0.304505 0.040612 0.107887 0.128432NOB 1278 1278 1278 1278 4-2. Announcement at 8:50
1min 5min 15min 30minCoefficient s.e. Coefficient s.e. Coefficient s.e. Coefficient s.e.
C 4.82E-08 *** (1.7E-08) 1.87E-07 *** (2.8E-08) 6.81E-07 *** (6.0E-08) 1.32E-06 *** (1.3E-07)Volatility(-1) 0.963905 *** (8.8E-02) 0.285302 *** (3.4E-02) 0.415316 *** (4.1E-02) 0.278654 *** (3.9E-02)TotalDeals(-1) -6.3E-09 ** (3.2E-09) 1.26E-09 (1.2E-09) 7.56E-10 (1.1E-09) 3.2E-09 ** (1.4E-09)ABSTANKANM 8.58E-08 *** (2.3E-08) -8E-08 *** (3.4E-08) -1.1E-07 ** (6.5E-08) -1.5E-07 (1.3E-07)ABSTANKANN 5.2E-09 (2.0E-08) -3.2E-08 (3.0E-08) -6.1E-08 (5.7E-08) -6E-08 (1.2E-07)ABSMONEY 3.81E-09 (1.8E-08) -2.2E-08 (2.6E-08) -6.4E-08 (5.1E-08) -8.1E-08 (1.0E-07)ABSGDPP 1.14E-07 *** (1.8E-08) 2.09E-07 *** (2.7E-08) 2.74E-07 *** (5.2E-08) 2.85E-07 *** (1.1E-07)ABSGDPF 1.91E-07 *** (1.8E-08) 2.54E-07 *** (2.7E-08) 2.47E-07 *** (5.2E-08) 3.19E-07 *** (1.1E-07)ABSBOP 2.3E-08 (2.0E-08) 5.46E-09 (2.9E-08) 9.07E-09 (5.6E-08) 3.28E-08 (1.2E-07)ABSTB -4.9E-09 (2.1E-08) -6.9E-09 (3.2E-08) 4.14E-08 (6.2E-08) 1.03E-07 (1.3E-07)ABSPPI 2.54E-08 * (1.9E-08) 1.41E-08 (2.8E-08) -2.3E-08 (5.4E-08) -4.8E-08 (1.1E-07)ABSIPP 4.42E-08 ** (2.1E-08) 9.62E-08 *** (3.1E-08) 1.16E-07 ** (6.0E-08) 1.2E-07 (1.2E-07)TANKANMDUM 9.68E-07 *** (2.1E-07) 3.81E-06 *** (3.2E-07) 5.65E-06 *** (6.1E-07) 6.26E-06 *** (1.2E-06)MONEYDUM -1.4E-08 (8.3E-08) 2.5E-07 ** (1.2E-07) 2.91E-07 (2.4E-07) 4.48E-07 (4.9E-07)GDPPDUM 2.98E-07 ** (1.5E-07) 4.63E-07 ** (2.3E-07) 6.91E-07 * (4.4E-07) 1.22E-06 * (9.0E-07)GDPFDUM -5.1E-07 *** (1.5E-07) -4.2E-07 ** (2.2E-07) -2.4E-07 (4.2E-07) -1E-06 (8.7E-07)BOPDUM -1.4E-07 * (9.3E-08) 3.45E-08 (1.4E-07) 4.96E-09 (2.7E-07) -1.5E-07 (5.5E-07)TBDUM 6.29E-08 (1.0E-07) 1.94E-07 * (1.5E-07) -7.7E-08 (2.9E-07) -2.1E-07 (6.0E-07)PPIDUM -1E-07 (1.2E-07) -1.4E-07 (1.8E-07) 9.99E-08 (3.5E-07) 9.16E-08 (7.1E-07)IPPDUM 2.01E-08 (1.1E-07) -4.8E-08 (1.6E-07) -1.1E-07 (3.0E-07) -2.1E-07 (6.2E-07)R-squared 0.358573 0.419834 0.308547 0.150188NOB 1274 1274 1274 1274 4-3. Announcement at 10:30
1min 5min 15min 30minCoefficient s.e. Coefficient s.e. Coefficient s.e. Coefficient s.e.
C 1.79E-08 *** (2.8E-09) 5.15E-08 *** (1.7E-08) 2.13E-07 *** (3.3E-08) 3.00E-07 *** (1.0E-07)Volatility(-1) 6.19E-02 ** (3.1E-02) 5.15E-01 *** (6.2E-02) 2.37E-01 *** (2.4E-02) 4.12E-01 *** (4.8E-02)TotalDeals(-1) 2.79E-09 *** (3.6E-10) 1.55E-09 *** (5.4E-10) 2.01E-09 *** (3.1E-10) 1.24E-09 *** (4.9E-10)ABSPAYROLL -2.03E-09 (2.1E-09) -1.09E-08 (1.1E-08) 3.18E-09 (2.0E-08) -7.57E-08 * (5.1E-08)PAYROLLDUM 2.15E-08 * (1.5E-08) 6.96E-08 (7.9E-08) -7.89E-08 (1.4E-07) 9.31E-07 *** (3.6E-07)R-squared 0.178486 0.271338 0.36524 0.244617NOB 576 576 576 576

31
4-4. Announcement at 13:30 1min 5min 15min 30minCoefficient s.e. Coefficient s.e. Coefficient s.e. Coefficient s.e.
C -1.08E-09 (3.0E-09) 2.84E-08 ** (1.3E-08) 1.54E-07 *** (2.9E-08) 3.15E-07 *** (6.5E-08)Volatility-1) 3.73E-01 *** (2.7E-02) 6.13E-01 *** (3.9E-02) 3.95E-01 *** (3.0E-02) 6.20E-01 *** (5.0E-02)TotalDeal(-1) 5.09E-09 *** (5.6E-10) 2.69E-09 *** (6.4E-10) 3.33E-09 *** (5.2E-10) 1.72E-09 *** (6.8E-10)ABSIIPF -6.78E-10 (3.8E-09) -1.77E-08 (1.4E-08) -9.60E-09 (2.8E-08) -2.36E-08 (6.0E-08)IIPFDUM 1.80E-08 (2.1E-08) 4.53E-08 (7.7E-08) 6.67E-08 (1.6E-07) 7.43E-08 (3.3E-07)R-squared 0.346858 0.346086 0.335231 0.265788NOB 1261 1261 1261 1261 4-5. Announcement at14:00
1min 5min 15min 30minCoefficient s.e. Coefficient s.e. Coefficient s.e. Coefficient s.e.
C 1.5002E-08 *** (6.4E-09) 5.3656E-08 *** (1.4E-08) 1.6848E-07 *** (2.5E-08) 3.6102E-07 *** (5.8E-08)Volatility(-1) 0.231179 *** (5.9E-02) 0.147603 *** (1.5E-02) 0.410793 *** (1.8E-02) 0.383734 *** (2.9E-02)TotalDeals(-1) 5.8181E-09 *** (9.8E-10) 4.5849E-09 *** (4.8E-10) 1.7067E-09 *** (3.2E-10) 1.4935E-09 *** (4.3E-10)ABSNEWSDIP 1.2485E-09 (5.2E-09) 2.9623E-09 (1.0E-08) 2.2649E-09 (1.8E-08) -5.912E-08 * (3.7E-08)ABSNEWSDIF 2.6167E-09 (5.9E-09) 2.3421E-09 (1.2E-08) 1.0958E-08 (2.0E-08) 3.8773E-09 (4.1E-08)ABSNEWSEXPEND -1.558E-09 (7.7E-09) -3.042E-09 (1.5E-08) -3.8E-09 (2.6E-08) -1.708E-07 *** (5.4E-08)ABSNEWSHOUSE -7.62E-09 (8.1E-09) -2.168E-08 * (1.6E-08) -5.166E-08 ** (2.7E-08) -6.957E-08 (5.7E-08)DIPDUM -1.778E-08 (2.9E-08) -6.104E-08 (5.8E-08) -7.297E-08 (9.8E-08) 2.9565E-07 * (2.1E-07)DIFDUM -2.58E-08 (3.1E-08) -5.105E-08 (6.1E-08) -6.087E-08 (1.0E-07) -2.068E-07 (2.2E-07)EXPENDDUM 3.446E-10 (4.1E-08) -1.858E-08 (8.0E-08) -3.552E-08 (1.4E-07) 9.6684E-07 *** (2.8E-07)HOUSEDUM 3.5996E-08 (3.9E-08) 2.0847E-07 *** (7.7E-08) 4.2534E-07 *** (1.3E-07) 5.0912E-07 ** (2.7E-07)R-squared 0.081615 0.256044 0.450222 0.279119NOB 1278 1278 1278 1278 4-6. Announcement at 14:30
1min 5min 15min 30minCoefficient s.e. Coefficient s.e. Coefficient s.e. Coefficient s.e.
C 1.30E-08 *** (2.2E-09) 5.90E-08 *** (8.9E-09) 2.14E-07 *** (5.0E-08) 4.84E-07 *** (7.5E-08)Volatility(-1) 2.12E-01 *** (1.2E-02) 9.68E-02 *** (1.1E-02) 1.67E-01 *** (4.1E-02) 4.50E-01 *** (4.3E-02)TotalDeals(-1) 2.50E-09 *** (3.5E-10) 3.44E-09 *** (3.3E-10) 2.84E-09 *** (7.2E-10) 8.85E-10 * (5.9E-10)ABSRETAIL 7.79E-10 (2.7E-09) -4.76E-09 (9.9E-09) -3.69E-08 (5.0E-08) -4.26E-08 (7.1E-08)RETAILDUM -7.72E-09 (1.3E-08) 4.66E-08 (4.9E-08) 1.64E-07 (2.5E-07) 1.36E-07 (3.5E-07)R-squared 0.300373 0.26505 0.063935 0.174903NOB 1278 1278 1278 1278

32
Table 5. News release impact on total deals (surprises normalized by STD) 5-1. Announcement at 8:30
1min 5min 15min 30minCoefficient s.e. Coefficient s.e. Coefficient s.e. Coefficient s.e.
Const 1.32 *** (0.11) 6.21 *** (0.42) 23.43 *** (1.26) 64.83 *** (3.05)TotalDeal(-1) 0.52 *** (0.03) 0.58 *** (0.02) 0.59 *** (0.03) 0.68 *** (0.04)ABSNEWSTCPI -0.08 (0.13) 0.25 (0.43) -0.31 (1.17) -2.57 (2.70)ABSNEWSUNEMP 0.40 *** (0.13) 1.45 *** (0.44) 1.87 * (1.20) -2.08 (2.76)ABSNEWSCPI -0.20 ** (0.12) -0.25 (0.40) 0.49 (1.08) 0.08 (2.49)TCPIDUM 0.39 (1.18) 8.45 ** (3.94) 20.78 ** (10.73) 10.41 (24.69)UNEMPDUM 1.02 (0.89) -3.39 (2.97) -0.57 (8.10) 26.88 * (18.65)CPIDUM -0.20 (1.07) -5.48 * (3.57) -17.18 ** (9.74) -0.92 (22.41)R-squared 0.23 0.34 0.27 0.22NOB 1278 1278 1278 1278 5-2. Announcement at 8:50
1min 5min 15min 30minCoefficient s.e. Coefficient s.e. Coefficient s.e. Coefficient s.e.
Const 2.13 *** (0.20) 9.36 *** (0.79) 42.68 *** (2.05) 111.03 *** (4.30)TotalDeal(-1) 0.54 *** (0.03) 0.61 *** (0.03) 0.68 *** (0.03) 0.76 *** (0.04)ABSNEWSTANKANM 0.32 (0.27) -1.20 * (0.94) -6.29 *** (2.20) -7.53 ** (4.34)ABSNEWSTANKANN -0.63 *** (0.23) -3.94 *** (0.82) -4.09 ** (1.92) -4.28 (3.79)ABSNEWSMONEY 0.13 (0.21) -0.08 (0.73) -0.62 (1.71) 0.60 (3.39)ABSNEWSGDPP 1.73 *** (0.21) 7.91 *** (0.74) 14.56 *** (1.74) 20.68 *** (3.44)ABSNEWSGDPF 1.87 *** (0.21) 5.14 *** (0.74) 9.01 *** (1.74) 13.23 *** (3.43)ABSNEWSBOP 0.11 (0.23) 1.66 ** (0.81) 1.48 (1.90) 1.25 (3.76)ABSNEWSTB 0.13 (0.25) 0.01 (0.89) 0.94 (2.09) 4.37 (4.13)ABSNEWSPPI 0.21 (0.22) 0.70 (0.77) 0.63 (1.82) -0.26 (3.59)ABSNEWSIPP 0.71 *** (0.25) 2.25 *** (0.86) 3.62 ** (2.03) 5.40 * (4.01)TANKANDUM 23.22 *** (2.50) 107.65 *** (8.75) 214.52 *** (20.53) 276.96 *** (40.54)MONEYDUM 0.02 (0.98) 0.80 (3.43) 1.05 (8.05) 1.59 (15.91)GDPPDUM 10.98 *** (1.81) 21.29 *** (6.31) 42.67 *** (14.82) 38.16 * (29.27)GDPFDUM 0.28 (1.74) 5.66 (6.10) -5.08 (14.32) -10.65 (28.28)BOPDUM 0.04 (1.10) -2.09 (3.85) -1.59 (9.04) -14.30 (17.85)TBDUM 1.45 (1.21) 4.57 (4.22) 2.67 (9.90) -3.17 (19.55)PPIDUM -0.93 (1.43) -5.43 (5.00) 6.59 (11.74) 29.41 (23.18)SERVICEDUM -0.36 (0.70) 0.73 (2.46) 0.34 (5.78) -2.97 (11.42)IPPDUM 3.97 *** (1.25) 11.62 *** (4.38) 20.07 ** (10.27) 22.92 (20.29)R-squared 0.50 0.52 0.46 0.35NOB 1274 1274 1274 1274 5-3. Announcement at 10:30
1min 5min 15min 30minCoefficient s.e. Coefficient s.e. Coefficient s.e. Coefficient s.e.
Const 2.43 *** (0.32) 12.00 *** (1.37) 39.67 *** (3.72) 66.39 *** (8.13)TotalDeal(-1) 0.67 *** (0.03) 0.68 *** (0.03) 0.56 *** (0.03) 0.55 *** (0.03)ABSNEWSPAYROLL -0.04 (0.25) -0.85 (0.93) 0.47 (2.24) 0.49 (4.17)PAYROLLDUM 0.90 (1.71) 2.40 (6.44) -11.81 (15.56) -19.39 (28.88)R-squared 0.42 0.44 0.39 0.36NOB 576.00 576.00 576.00 576 5-4. Announcement at 13:30
1min 5min 15min 30minCoefficient s.e. Coefficient s.e. Coefficient s.e. Coefficient s.e.
Const 1.60 *** (0.15) 6.90 *** (0.65) 27.10 *** (1.86) 59.26 *** (4.01)TotalDeal(-1) 0.63 *** (0.02) 0.77 *** (0.02) 0.74 *** (0.03) 0.72 *** (0.03)ABSIIPF -0.20 (0.18) -1.23 ** (0.72) -1.81 (1.89) -3.97 (3.74)IIPFDUM 2.68 *** (1.01) 7.51 ** (3.96) 17.45 ** (10.41) 28.05 * (20.66)R-squared 0.41 0.46 0.41 0.33NOB 1261 12961 1261 1261

33
5-5. Announcement at 14:00
1min 5min 15min 30minCoefficient s.e. Coefficient s.e. Coefficient s.e. Coefficient s.e.
Const 2.15 *** (0.21) 10.18 *** (0.77) 28.89 *** (2.02) 58.89 *** (3.90)TotalDeal(-1) 0.72 *** (0.03) 0.68 *** (0.02) 0.63 *** (0.02) 0.60 *** (0.02)ABSNEWSDIP 0.24 * (0.17) 0.08 (0.58) -0.39 (1.43) -3.53 * (2.53)ABSNEWSDIF 0.35 ** (0.19) 0.03 (0.65) -0.15 (1.60) -0.85 (2.84)ABSNEWSEXPEND -0.10 (0.25) -0.83 (0.86) -3.13 * (2.11) -6.53 ** (3.73)ABSNEWSHOUSE -0.30 (0.26) -0.65 (0.90) -2.98 * (2.21) -2.10 (3.92)DIPDUM -1.27 * (0.95) -2.12 (3.24) 2.31 (7.96) 15.11 (14.11)DIFDUM -1.29 (1.01) -2.46 (3.44) 0.72 (8.48) 0.66 (15.01)EXPENDITUREDUM 0.37 (1.32) 2.34 (4.49) 11.27 (11.05) 25.43 * (19.56)HOUSEDUM 1.87 * (1.27) 5.78 * (4.33) 15.84 * (10.67) 20.54 (18.89)R-squared 0.37 0.42 0.41 0.37NOB 1273 1273 1273 1273 5-6. Announcement at 14:30
1min 5min 15min 30minCoefficient s.e. Coefficient s.e. Coefficient s.e. Coefficient s.e.
Const 1.65 *** (0.15) 8.18 *** (0.61) 25.18 *** (1.93) 73.65 *** (3.99)TotalDeal(-1) 0.68 *** (0.02) 0.68 *** (0.02) 0.68 *** (0.02) 0.60 *** (0.02)ABSNEWSRETAIL 0.32 * (0.20) -0.02 (0.71) -1.69 (1.99) -2.18 (3.89)RETAILDUM -1.48 * (0.96) -2.76 (3.50) -3.31 (9.73) -6.01 (19.06)R-squared 0.41 0.50 0.43 0.36NOB 1278 1278 1278 1278

34
Appendix Table 1. News surprise impact on returns (surprises normalized by STD) A1-1. Announcement at 8:30 (JST) Deal Bid Return
Equation (1) Equation (2)1min 5min 15min 30min 1min 5min 15min 30min
TokyoCPI -4.03E-06 -1.95E-05 ** -2.19E-07 -3.70E-05 * -3.13E-06 -2.01E-05 *** -4.55E-07 -3.73E-05 *(0.000) (0.000) (0.000) (0.000) (0.000) (0.000) (0.000) (0.000)
Unemployment 1.51E-05 *** 2.55E-05 *** 2.84E-05 ** 5.06E-05 ** 1.48E-05 *** 2.33E-05 *** 2.79E-05 ** 5.04E-05 **(0.000) (0.000) (0.000) (0.000) (0.000) (0.000) (0.000) (0.000)
CPI 3.94E-06 -4.33E-06 -1.58E-05 -1.47E-05 4.24E-06 -2.83E-06 -1.55E-05 -1.50E-05(0.000) (0.000) (0.000) (0.000) (0.000) (0.000) (0.000) (0.000)
Return(-1) -6.36E-02 ** -1.53E-01 *** -8.73E-02 ** -8.35E-02(0.032) (0.036) (0.041) (0.067)
Orderflow 8.08E-06 *** 8.68E-06 *** 3.35E-06 ** 5.47E-07(0.000) (0.000) (0.000) (0.000)
R-squared 1.34E-02 9.26E-03 3.58E-03 4.56E-03 2.40E-02 2.58E-02 6.77E-03 6.40E-03Nob 1278 1278 1278 1278 1278 1278 1278 1278
Deal Ask ReturnEquation (1) Equation (2)1min 5min 15min 30min 1min 5min 15min 30min
TokyoCPI -9.15E-06 *** -2.64E-05 *** -6.39E-06 -4.05E-05 ** -7.82E-06 ** -2.67E-05 *** -6.17E-06 -4.10E-05 **(0.000) (0.000) (0.000) (0.000) (0.000) (0.000) (0.000) (0.000)
Unemployment 1.37E-05 *** 2.56E-05 *** 2.81E-05 ** 4.68E-05 ** 1.33E-05 *** 2.50E-05 *** 2.74E-05 ** 4.51E-05 **(0.000) (0.000) (0.000) (0.000) (0.000) (0.000) (0.000) (0.000)
CPI -8.68E-07 -5.66E-06 -1.95E-05 * -8.73E-06 -7.14E-07 -5.24E-06 -1.95E-05 * -8.82E-06(0.000) (0.000) (0.000) (0.000) (0.000) (0.000) (0.000) (0.000)
Return(-1) -6.07E-02 ** -1.04E-01 *** -9.20E-02 ** -3.99E-02(0.031) (0.034) (0.040) (0.045)
Orderflow 1.15E-05 *** 7.24E-06 *** 2.82E-06 * -1.31E-06(0.000) (0.000) (0.000) (0.000)
R-squared 1.33E-02 1.31E-02 3.98E-03 4.35E-03 3.86E-02 2.48E-02 7.97E-03 6.89E-03Nob 1278 1278 1278 1278 1278 1278 1278 1278
Midprice ReturnEquation (1) Equation (2)1min 5min 15min 30min 1min 5min 15min 30min
TokyoCPI -6.10E-06 ** -1.81E-05 ** -7.20E-07 -3.40E-05 * -6.34E-06 ** -1.84E-05 *** -7.68E-07 -3.48E-05 *(0.000) (0.000) (0.000) (0.000) (0.000) (0.000) (0.000) (0.000)
Unemployment 1.50E-05 *** 2.79E-05 *** 2.91E-05 ** 5.07E-05 ** 1.53E-05 *** 2.74E-05 *** 2.91E-05 ** 4.99E-05 **(0.000) (0.000) (0.000) (0.000) (0.000) (0.000) (0.000) (0.000)
CPI -1.97E-06 -4.01E-06 -1.75E-05 -9.89E-06 -1.93E-06 -3.88E-06 -1.75E-05 -1.02E-05(0.000) (0.000) (0.000) (0.000) (0.000) (0.000) (0.000) (0.000)
Return(-1) -1.24E-01 *** -4.43E-02 -8.55E-03 -1.84E-02(0.036) (0.036) (0.042) (0.047)
Orderflow 2.59E-06 2.11E-06 -6.14E-08 -1.98E-06(0.000) (0.000) (0.000) (0.000)
R-squared 1.35E-02 1.19E-02 4.25E-03 4.31E-03 2.26E-02 1.33E-02 4.34E-03 6.41E-03Nob 1278 1278 1278 1278 1278 1278 1278 1278

35
A1-2. Announcement at 8:50 (JST) Deal Bid Return
Equation (1) Equation (2)1min 5min 15min 30min 1min 5min 15min 30min
TankanM -6.13E-05 *** -8.70E-05 *** -9.86E-05 *** -1.01E-04 *** -6.25E-05 *** -8.55E-05 *** -9.97E-05 *** -9.85E-05 ***(0.000) (0.000) (0.000) (0.000) (0.000) (0.000) (0.000) (0.000)
TankanN 1.30E-05 ** 2.47E-06 1.48E-05 1.12E-05 1.24E-05 ** 1.11E-06 1.37E-05 1.12E-05(0.000) (0.000) (0.000) (0.000) (0.000) (0.000) (0.000) (0.000)
Money -3.89E-07 -2.06E-06 -1.48E-05 -4.23E-05 * -1.08E-06 -2.68E-06 -1.58E-05 -4.29E-05 *(0.000) (0.000) (0.000) (0.000) (0.000) (0.000) (0.000) (0.000)
GDPP -1.37E-04 *** -1.43E-04 *** -2.18E-04 *** -1.93E-04 *** -1.35E-04 *** -1.43E-04 *** -2.17E-04 *** -1.93E-04 ***(0.000) (0.000) (0.000) (0.000) (0.000) (0.000) (0.000) (0.000)
GDPF -8.03E-05 *** -6.44E-05 *** -7.17E-05 *** -6.04E-05 ** -8.07E-05 *** -6.78E-05 *** -7.55E-05 *** -6.15E-05 **(0.000) (0.000) (0.000) (0.000) (0.000) (0.000) (0.000) (0.000)
BOP -1.21E-05 ** -2.33E-05 ** -5.57E-05 *** -4.83E-05 *** -1.16E-05 ** -2.18E-05 ** -5.57E-05 *** -4.94E-05 **(0.000) (0.000) (0.000) (0.000) (0.000) (0.000) (0.000) (0.000)
TB -1.28E-08 -3.47E-06 2.17E-05 1.38E-05 -4.08E-07 -3.16E-06 2.12E-05 1.45E-05(0.000) (0.000) (0.000) (0.000) (0.000) (0.000) (0.000) (0.000)
PPI -4.61E-06 -2.40E-05 ** -3.74E-05 ** -5.32E-05 ** -5.49E-06 -2.38E-05 ** -3.63E-05 ** -5.07E-05 **(0.000) (0.000) (0.000) (0.000) (0.000) (0.000) (0.000) (0.000)
IPP -4.89E-05 *** -4.82E-05 *** -6.12E-05 *** -7.28E-05 *** -4.77E-05 *** -4.70E-05 *** -5.65E-05 *** -7.02E-05 ***(0.000) (0.000) (0.000) (0.000) (0.000) (0.000) (0.000) (0.000)
Return(-1) -1.49E-01 *** -2.69E-01 *** -1.53E-01 *** -8.82E-02 *(0.047) (0.050) (0.053) (0.055)
Orderflow 1.14E-05 *** 1.07E-05 *** 4.52E-06 ** 8.33E-07(0.000) (0.000) (0.000) (0.000)
R-squared 3.56E-01 1.56E-01 1.18E-01 5.71E-02 0.364701 0.177322 1.25E-01 5.99E-02Nob 1274 1274 1274 1274 1274 1274 1274 1274
Deal Ask ReturnEquation (1) Equation (2)1min 5min 15min 30min 1min 5min 15min 30min
TankanM -6.91E-05 *** -9.89E-05 *** -1.06E-04 *** -1.04E-04 *** -6.93E-05 *** -9.68E-05 *** -1.06E-04 *** -1.01E-04 ***(0.000) (0.000) (0.000) (0.000) (0.000) (0.000) (0.000) (0.000)
TankanN 1.00E-05 * 7.57E-06 1.46E-05 2.40E-06 9.55E-06 * 6.95E-06 1.38E-05 2.27E-06(0.000) (0.000) (0.000) (0.000) (0.000) (0.000) (0.000) (0.000)
Money -2.45E-06 2.01E-06 -2.09E-05 -4.84E-05 ** -2.48E-06 1.76E-06 -2.05E-05 -4.86E-05 **(0.000) (0.000) (0.000) (0.000) (0.000) (0.000) (0.000) (0.000)
GDPP -1.31E-04 *** -1.51E-04 *** -2.23E-04 *** -2.01E-04 *** -1.28E-04 *** -1.49E-04 *** -2.21E-04 *** -2.00E-04 ***(0.000) (0.000) (0.000) (0.000) (0.000) (0.000) (0.000) (0.000)
GDPF -8.55E-05 *** -6.75E-05 *** -7.19E-05 *** -6.14E-05 ** -8.49E-05 *** -7.13E-05 *** -7.69E-05 *** -6.33E-05 **(0.000) (0.000) (0.000) (0.000) (0.000) (0.000) (0.000) (0.000)
BOP -8.29E-06 -2.16E-05 ** -5.24E-05 *** -4.68E-05 * -7.64E-06 -2.12E-05 ** -5.34E-05 *** -4.89E-05 **(0.000) (0.000) (0.000) (0.000) (0.000) (0.000) (0.000) (0.000)
TB 3.24E-06 -7.58E-06 2.59E-05 1.84E-05 2.44E-06 -8.70E-06 2.57E-05 1.94E-05(0.000) (0.000) (0.000) (0.000) (0.000) (0.000) (0.000) (0.000)
PPI -7.13E-06 -2.27E-05 ** -3.83E-05 ** -5.47E-05 ** -7.46E-06 -2.14E-05 ** -3.70E-05 ** -5.18E-05 **(0.000) (0.000) (0.000) (0.000) (0.000) (0.000) (0.000) (0.000)
IPP -4.85E-05 *** -5.98E-05 *** -6.02E-05 *** -7.89E-05 *** -4.63E-05 *** -5.64E-05 *** -5.42E-05 *** -7.40E-05 ***(0.000) (0.000) (0.000) (0.000) (0.000) (0.000) (0.000) (0.000)
Return(-1) -0.193 *** -0.303 *** -0.185 *** -0.124 **(0.058) (0.047) (0.052) (0.055)
Orderflow 1.11E-05 *** 1.11E-05 *** 5.33E-06 ** 1.08E-06(0.000) (0.000) (0.000) (0.000)
R-squared 0.321 0.176 0.121 0.060 0.329 0.205 0.132 0.066Nob 1274 1274 1274 1274 1274 1274 1274 1274
Midprice ReturnEquation (1) Equation (2)1min 5min 15min 30min 1min 5min 15min 30min
TankanM -5.23E-05 *** -9.54E-05 *** -9.64E-05 *** -9.58E-05 *** -5.36E-05 *** -9.46E-05 *** -9.67E-05 *** -9.40E-05 ***(0.000) (0.000) (0.000) (0.000) (0.000) (0.000) (0.000) (0.000)
TankanN 7.41E-07 3.36E-07 8.84E-06 1.49E-07 9.95E-07 2.16E-06 9.00E-06 1.07E-07(0.000) (0.000) (0.000) (0.000) (0.000) (0.000) (0.000) (0.000)
Money 2.34E-06 -5.42E-07 -1.53E-05 -4.50E-05 * 2.08E-06 -3.50E-07 -1.51E-05 -4.54E-05 *(0.000) (0.000) (0.000) (0.000) (0.000) (0.000) (0.000) (0.000)
GDPP -1.27E-04 *** -1.45E-04 *** -2.13E-04 *** -1.92E-04 *** -1.26E-04 *** -1.46E-04 *** -2.14E-04 *** -1.91E-04 ***(0.000) (0.000) (0.000) (0.000) (0.000) (0.000) (0.000) (0.000)
GDPF -8.28E-05 *** -6.60E-05 *** -6.93E-05 *** -5.78E-05 ** -8.31E-05 *** -6.75E-05 *** -7.15E-05 *** -5.86E-05 **(0.000) (0.000) (0.000) (0.000) (0.000) (0.000) (0.000) (0.000)
BOP -9.45E-06 * -2.44E-05 ** -5.75E-05 *** -4.92E-05 ** -8.54E-06 * -2.28E-05 ** -5.79E-05 *** -5.02E-05 **(0.000) (0.000) (0.000) (0.000) (0.000) (0.000) (0.000) (0.000)
TB 3.03E-06 -1.23E-06 2.46E-05 2.20E-05 2.42E-06 -2.41E-06 2.40E-05 2.19E-05(0.000) (0.000) (0.000) (0.000) (0.000) (0.000) (0.000) (0.000)
PPI -4.00E-06 -2.09E-05 ** -3.79E-05 ** -5.11E-05 ** -4.16E-06 -2.10E-05 ** -3.78E-05 ** -4.95E-05 **(0.000) (0.000) (0.000) (0.000) (0.000) (0.000) (0.000) (0.000)

36
A1-3. Announcement at 10:30 (JST) Deal Bid Return
Equation (1) Equation (2)1min 5min 15min 30min 1min 5min 15min 30min
Payroll -8.49E-06 ** -1.12E-05 -2.73E-05 ** -2.92E-05 -7.29E-06 * -1.06E-05 -2.73E-05 ** -2.83E-05(0.000) (0.000) (0.000) (0.000) (0.000) (0.000) (0.000) (0.000)
Return(-1) -1.95E-01 *** -1.53E-01 *** 1.53E-05 2.27E-02(0.050) (0.054) (0.045) (0.045)
Orderflow 1.53E-05 *** 5.01E-06 ** 2.23E-06 7.75E-07(0.000) (0.000) (0.000) (0.000)
R-squared 0.006 0.002 0.006 0.003 0.065 0.016 0.012 0.004Nob 576 576 576 576 576 576 576 576
Deal Ask ReturnEquation (1) Equation (2)1min 5min 15min 30min 1min 5min 15min 30min
Payroll -6.87E-06 * -1.01E-05 -2.77E-05 ** -2.67E-05 -5.89E-06 * -8.59E-06 -2.80E-05 ** -2.60E-05(0.000) (0.000) (0.000) (0.000) (0.000) (0.000) (0.000) (0.000)
Return(-1) -1.58E-01 *** -1.71E-01 *** -1.16E-02 1.60E-02(0.048) (0.056) (0.045) (0.045)
Orderflow 1.34E-05 *** 4.54E-06 ** 2.09E-06 7.95E-07(0.000) (0.000) (0.000) (0.000)
R-squared 0.004 0.002 0.006 0.002 0.050 0.018 0.011 0.004Nob 576 576 576 576 576 576 576 576
Midprice ReturnEquation (1) Equation (2)1min 5min 15min 30min 1min 5min 15min 30min
Payroll -4.27E-06 -2.44E-05 * -2.44E-05 * -3.04E-05 * -4.15E-06 -6.09E-06 -2.43E-05 * -2.95E-05(0.000) (0.000) (0.000) (0.000) (0.000) (0.000) (0.000) (0.000)
Return(-1) -1.03E-01 ** -1.49E-01 *** 5.03E-03 2.63E-02(0.050) (0.058) (0.046) (0.045)
Orderflow 6.84E-06 *** 3.37E-06 * 1.72E-06 5.31E-07(0.000) (0.000) (0.000) (0.000)
R-squared 0.002 0.001 0.005 0.003 0.015 0.013 0.009 0.005Nob 576 576 576 576 576 576 576 576

37
A1-4. Announcement at 13:30 (JST) Deal Bid Return
Equation (1) Equation (2)1min 5min 15min 30min 1min 5min 15min 30min
IPF -3.23E-05 5.77E-05 8.40E-05 -5.79E-06 -4.19E-05 2.87E-05 6.98E-05 -1.78E-05(0.000) (0.000) (0.000) (0.000) (0.000) (0.000) (0.000) (0.000)
Return(-1) 1.19E-02 -1.04E-01 *** -8.46E-02 *** -4.23E-02(0.040) (0.027) (0.033) (0.033)
Orderflow 6.98E-06 *** 8.58E-06 *** 6.45E-07 1.74E-06(0.000) (0.000) (0.000) (0.000)
R-squared 1.13E-04 1.67E-04 9.41E-05 8.10E-07 0.014661 0.02695 6.48E-03 1.39E-03Nob 1261 1261 1261 1261 1261 1261 1261 1261
Deal Ask ReturnEquation (1) Equation (2)1min 5min 15min 30min 1min 5min 15min 30min
IPF -8.30E-05 -3.42E-05 7.38E-05 -5.10E-05 -9.58E-05 * -5.60E-05 6.64E-05 -5.88E-05(0.000) (0.000) (0.000) (0.000) (0.000) (0.000) (0.000) (0.000)
Return(-1) 0.02548 -0.111515 *** -0.081529 ** -0.03518(0.037) (0.030) (0.033) (0.034)
Orderflow 7.59E-06 *** 6.63E-06 *** 6.75E-07 1.74E-06(0.000) (0.000) (0.000) (0.000)
R-squared 9.61E-04 2.26E-05 7.54E-05 1.99E-05 0.021043 0.016296 6.15E-03 1.03E-03Nob 1261 1261 1261 1261 1261 1261 1261 1261
Midprice ReturnEquation (1) Equation (2)1min 5min 15min 30min 1min 5min 15min 30min
IPF -7.01E-05 -4.08E-06 -1.67E-05 -4.95E-05 -7.57E-05 -1.91E-05 -2.11E-05 -5.76E-05(0.000) (0.000) (0.000) (0.000) (0.000) (0.000) (0.000) (0.000)
Return(-1) 0.160991 *** -0.081064 *** -0.060414 ** -0.0344(0.038) (0.027) (0.033) (0.034)
Orderflow -1.24E-06 5.92E-06 *** 1.98E-07 1.53E-06(0.000) (0.000) (0.000) (0.000)
R-squared 7.03E-04 8.90E-07 1.55E-06 1.80E-05 0.016225 0.014665 3.65E-03 9.77E-04Nob 1261 1261 1261 1261 1261 1261 1261 1261

38
A1-5. Announcement at 14:00 (JST) Deal Bid Return
Equation (1) Equation (2)1min 5min 15min 30min 1min 5min 15min 30min
DIP -2.37E-06 -4.94E-06 -8.11E-06 -1.97E-05 -1.78E-06 -4.74E-06 -7.66E-06 -2.04E-05(0.000) (0.000) (0.000) (0.000) (0.000) (0.000) (0.000) (0.000)
DIF -1.37E-07 -1.44E-06 -2.28E-05 ** -9.12E-06 -2.65E-07 -1.76E-06 -2.26E-05 * -8.77E-06(0.000) (0.000) (0.000) (0.000) (0.000) (0.000) (0.000) (0.000)
Expenditure -1.50E-06 9.43E-06 1.65E-05 3.93E-05 ** -1.57E-06 1.02E-05 1.63E-05 3.95E-05 **(0.000) (0.000) (0.000) (0.000) (0.000) (0.000) (0.000) (0.000)
House 2.19E-06 -9.43E-06 -4.19E-07 -1.50E-05 1.94E-06 -1.07E-05 * 3.80E-07 -1.58E-05(0.000) (0.000) (0.000) (0.000) (0.000) (0.000) (0.000) (0.000)
Return(-1) 1.34E-02 -1.64E-01 *** -3.50E-02 4.44E-02 *(0.050) (0.026) (0.032) (0.034)
Orderflow 8.89E-06 *** 5.95E-06 *** -3.81E-07 -4.87E-07(0.000) (0.000) (0.000) (0.000)
R-squared 2.68E-04 2.22E-03 3.42E-03 3.97E-03 0.013 0.035 0.005 0.005Nob 1273 1273 1273 1273 1273 1273 1273 1273
Deal Ask ReturnEquation (1) Equation (2)1min 5min 15min 30min 1min 5min 15min 30min
DIP -1.41E-06 -1.40E-06 -5.64E-06 -1.96E-05 -1.54E-06 -9.07E-07 -5.00E-06 -1.95E-05(0.000) (0.000) (0.000) (0.000) (0.000) (0.000) (0.000) (0.000)
DIF 1.22E-06 -5.13E-06 -2.22E-05 ** -8.05E-06 2.92E-06 -6.47E-06 -2.21E-05 * -8.36E-06(0.000) (0.000) (0.000) (0.000) (0.000) (0.000) (0.000) (0.000)
Expenditure 2.58E-06 7.55E-06 1.55E-05 3.88E-05 ** 3.40E-06 8.41E-06 1.54E-05 3.95E-05 **(0.000) (0.000) (0.000) (0.000) (0.000) (0.000) (0.000) (0.000)
House 4.75E-06 -6.88E-06 -1.07E-06 -5.97E-06 3.01E-06 -1.03E-05 -3.40E-07 -6.73E-06(0.000) (0.000) (0.000) (0.000) (0.000) (0.000) (0.000) (0.000)
Return(-1) -5.83E-01 *** -3.19E-01 *** -4.93E-02 * -8.33E-03(0.029) (0.028) (0.030) (0.033)
Orderflow 2.46E-05 *** 9.26E-06 *** 2.30E-07 9.51E-07(0.000) (0.000) (0.000) (0.000)
R-squared 6.69E-04 1.16E-03 3.03E-03 3.49E-03 0.249 0.096 0.006 0.004Nob 1273 1273 1273 1273 1273 1273 1273 1273
Midprice ReturnEquation (1) Equation (2)1min 5min 15min 30min 1min 5min 15min 30min
DIP -6.14E-07 -2.18E-06 -8.11E-06 -1.96E-05 -3.74E-07 -1.77E-06 -7.53E-06 -2.03E-05(0.000) (0.000) (0.000) (0.000) (0.000) (0.000) (0.000) (0.000)
DIF -8.84E-07 -1.21E-06 -2.16E-05 * -7.16E-06 -1.36E-06 -1.51E-06 -2.15E-05 * -6.50E-06(0.000) (0.000) (0.000) (0.000) (0.000) (0.000) (0.000) (0.000)
Expenditure 5.78E-07 4.78E-06 1.24E-05 3.77E-05 ** 6.67E-07 5.12E-06 1.24E-05 3.79E-05 **(0.000) (0.000) (0.000) (0.000) (0.000) (0.000) (0.000) (0.000)
House 7.48E-06 * -6.87E-06 -1.23E-06 -9.10E-06 7.76E-06 ** -7.89E-06 -4.46E-07 -9.85E-06(0.000) (0.000) (0.000) (0.000) (0.000) (0.000) (0.000) (0.000)
Return(-1) 1.20E-01 *** -1.51E-01 *** -5.24E-02 * 5.57E-02 **(0.044) (0.029) (0.032) (0.033)
Orderflow -6.46E-08 4.94E-06 *** -8.43E-09 -5.97E-07(0.000) (0.000) (0.000) (0.000)
R-squared 0.002 0.001 0.003 0.004 0.011 0.023 0.006 0.006Nob 1273 1273 1273 1273 1273 1273 1273 1273

39
A1-6. Announcement at 14:30 (JST) Deal Bid Return
Equation (1) Equation (2)1min 5min 15min 30min 1min 5min 15min 30min
Retail Sales -1.44E-07 1.23E-06 -7.44E-06 -1.37E-06 1.22E-07 1.16E-06 -6.56E-06 -2.53E-06(0.000) (0.000) (0.000) (0.000) (0.000) (0.000) (0.000) (0.000)
Return(-1) -7.85E-02 *** -1.59E-01 *** -8.45E-02 *** -2.16E-01 ***(0.022) (0.030) (0.030) (0.032)
Orderflow 7.32E-06 *** 6.35E-06 *** -1.76E-07 4.06E-06 ***(0.000) (0.000) (0.000) (0.000)
R-squared 1.24E-06 1.55E-05 1.83E-04 3.15E-06 0.023 0.030 0.008 0.036Nob 1278 1278 1278 1278 1278 1278 1278 1278
Deal Ask ReturnEquation (1) Equation (2)1min 5min 15min 30min 1min 5min 15min 30min
Retail Sales 2.73E-07 -8.35E-07 -4.86E-06 1.88E-06 6.51E-07 -1.44E-06 -3.80E-06 7.79E-07(0.000) (0.000) (0.000) (0.000) (0.000) (0.000) (0.000) (0.000)
Return(-1) -8.87E-02 ** -1.48E-01 *** -1.57E-01 *** -1.82E-01 ***(0.044) (0.028) (0.030) (0.032)
Orderflow 7.57E-06 *** 5.50E-06 *** 8.42E-07 3.69E-06 ***(0.000) (0.000) (0.000) (0.000)
R-squared 2.18E-06 8.22E-06 7.33E-05 6.27E-06 0.009 0.029 0.023 0.026Nob 1278 1278 1278 1278 1278 1278 1278 1278
Midprice ReturnEquation (1) Equation (2)1min 5min 15min 30min 1min 5min 15min 30min
Retail Sales -2.02E-06 -2.35E-06 -7.21E-06 -1.07E-06 -1.77E-06 -2.70E-06 -6.26E-06 -2.14E-06(0.000) (0.000) (0.000) (0.000) (0.000) (0.000) (0.000) (0.000)
Return(-1) -8.61E-02 ** -1.35E-01 *** -9.17E-02 *** -1.80E-01 ***(0.038) (0.028) (0.031) (0.033)
Orderflow 3.33E-06 ** 4.70E-06 *** -2.50E-07 3.60E-06 ***(0.000) (0.000) (0.000) (0.000)
R-squared 2.41E-04 6.95E-05 1.64E-04 1.97E-06 0.005 0.023 0.009 0.024Nob 1278 1278 1278 1278 1278 1278 1278 1278

40
Appendix Table 2. News surprises on Realized Volatility (surprises normalized by STD) A2-1. Announcement at 8:30 Volatility (Deal Bid)
1min 5min 15min 30minCoefficient s.e. Coefficient s.e. Coefficient s.e. Coefficient s.e.
C 9.29E-09 *** (1.8E-09) 3.84E-08 *** (6.6E-09) 1.28E-07 *** (1.4E-08) 3.79E-07 *** (3.4E-08)Volatility(-1) 1.19E-02 (3.3E-02) 1.81E-01 *** (3.8E-02) 1.64E-01 *** (3.8E-02) 2.34E-01 *** (4.6E-02)TotalDeals(-1) 2.60E-09 *** (4.8E-10) 2.74E-09 *** (4.8E-10) 2.77E-09 *** (4.3E-10) 2.48E-09 *** (5.7E-10)ABSTCPI -4.86E-10 (2.0E-09) 2.06E-09 (6.8E-09) 3.06E-09 (1.3E-08) -1.52E-08 (3.0E-08)ABSUNEMP 5.61E-09 *** (2.1E-09) 1.58E-08 ** (7.0E-09) 6.49E-09 (1.4E-08) -4.43E-08 * (3.1E-08)ABSCPI -3.42E-09 ** (1.9E-09) 2.87E-09 (6.3E-09) 3.82E-09 (1.2E-08) -6.75E-09 (2.8E-08)TCPIDUM 2.30E-08 (1.9E-08) 1.30E-07 ** (6.2E-08) 2.49E-07 ** (1.2E-07) 2.56E-07 (2.7E-07)UNEMPDUM -1.86E-08 * (1.4E-08) -5.92E-08 (4.7E-08) -1.88E-08 (9.2E-08) 2.87E-07 * (2.1E-07)CPIDUM 3.65E-09 (1.7E-08) -9.28E-08 * (5.6E-08) -1.49E-07 * (1.1E-07) -3.98E-09 (2.5E-07)R-squarfed 0.040021 0.118483 0.135512 0.112546NOB 1278 1278 1278 1278
Volatility (Deal Ask)1min 5min 15min 30minCoefficient s.e. Coefficient s.e. Coefficient s.e. Coefficient s.e.
C 7.67E-09 *** (1.5E-09) 3.08E-08 *** (5.3E-09) 1.27E-07 *** (1.3E-08) 4.07E-07 *** (4.9E-08)Volatility(-1) -3.60E-02 * (2.8E-02) 1.67E-01 *** (3.8E-02) 2.85E-01 *** (3.5E-02) 1.55E-01 ** (6.7E-02)TotalDeals(-1) 2.86E-09 *** (4.0E-10) 2.97E-09 *** (3.8E-10) 1.81E-09 *** (3.8E-10) 2.96E-09 *** (8.2E-10)ABSTCPI 6.50E-10 (1.7E-09) 7.28E-09 * (5.4E-09) 9.83E-09 (1.2E-08) 3.62E-09 (4.3E-08)ABSUNEMP 9.04E-09 *** (1.8E-09) 1.46E-08 *** (5.6E-09) 1.67E-08 * (1.2E-08) -3.91E-08 (4.4E-08)ABSCPI -2.61E-09 * (1.6E-09) -6.57E-09 * (5.0E-09) 6.00E-09 (1.1E-08) -4.73E-09 (3.9E-08)TCPIDUM -7.28E-09 (1.6E-08) 1.15E-07 ** (5.0E-08) 1.42E-07 * (1.1E-07) 1.45E-07 (3.9E-07)UNEMPDUM 2.58E-09 (1.2E-08) -5.21E-08 * (3.8E-08) -7.56E-08 (8.2E-08) 2.46E-07 (2.9E-07)CPIDUM 7.52E-09 (1.4E-08) -6.41E-08 * (4.5E-08) -7.79E-08 (9.9E-08) -4.56E-08 (3.5E-07)R-squarfed 0.080881 0.155639 0.180739 0.047986NOB 1278 1278 1278 1278
Volatility (Midprice)1min 5min 15min 30minCoefficient s.e. Coefficient s.e. Coefficient s.e. Coefficient s.e.
C 2.41E-08 *** (6.6E-09) 1.66E-07 *** (3.1E-08) 4.47E-07 *** (4.8E-08) 1.06E-06 *** (8.8E-08)Volatility(-1) 6.45E-01 *** (2.9E-02) 1.02E-01 *** (2.2E-02) 2.01E-01 *** (2.4E-02) 2.48E-01 *** (2.7E-02)TotalDeals(-1) -8.64E-10 (1.7E-09) 7.14E-09 *** (1.8E-09) 4.92E-09 *** (1.2E-09) 4.98E-09 *** (1.2E-09)ABSTCPI -3.67E-09 (7.6E-09) 9.32E-09 (3.2E-08) 1.60E-08 (4.5E-08) -6.37E-08 (7.8E-08)ABSUNEMP 1.23E-08 * (7.8E-09) 2.37E-08 (3.2E-08) 2.48E-08 (4.6E-08) -1.29E-07 * (8.0E-08)ABSCPI -1.17E-08 ** (7.0E-09) -1.46E-08 (2.9E-08) -2.80E-10 (4.2E-08) -8.00E-08 (7.2E-08)TCPIDUM 6.88E-08 (7.0E-08) 2.21E-07 (2.9E-07) 4.16E-07 (4.1E-07) 6.45E-07 (7.2E-07)UNEMPDUM -6.98E-08 * (5.3E-08) -1.77E-07 (2.2E-07) -2.85E-07 (3.1E-07) 4.68E-07 (5.4E-07)CPIDUM 5.35E-08 (6.3E-08) -1.11E-07 (2.6E-07) -1.68E-07 (3.7E-07) 3.16E-07 (6.5E-07)R-squarfed 0.304505 0.040612 0.107887 0.128432NOB 1278 1278 1278 1278

41
A2-2 Announcement at 8:50 Volatility (Deal Bid)
1min 5min 15min 30minCoefficient s.e. Coefficient s.e. Coefficient s.e. Coefficient s.e.
C 2.45E-08 *** (9.3E-09) 6.14E-08 *** (1.4E-08) 2.52E-07 *** (2.8E-08) 6.74E-07 *** (2.0E-07)Volatility(-1) -0.10328 (1.2E-01) 0.212441 *** (8.6E-02) 0.34754 *** (7.3E-02) 0.327647 (2.8E-01)TotalDeals(-1) 2.04E-09 (1.8E-09) 1.57E-09 ** (7.2E-10) 1.27E-09 ** (6.1E-10) 1.4E-09 (2.6E-09)ABSTANKANM 4.44E-08 *** (1.2E-08) 1.75E-08 (1.7E-08) -4.2E-08 * (3.1E-08) -8.1E-08 (2.0E-07)ABSTANKANN -2.5E-08 *** (1.1E-08) -4.3E-08 *** (1.5E-08) -6.1E-08 ** (2.7E-08) -5.4E-08 (1.8E-07)ABSMONEY 1.2E-09 (9.6E-09) -9.7E-09 (1.3E-08) -2.3E-08 (2.4E-08) -2.2E-08 (1.6E-07)ABSGDPP 1.04E-07 *** (9.8E-09) 1.67E-07 *** (1.3E-08) 2.01E-07 *** (2.4E-08) 2.09E-07 * (1.6E-07)ABSGDPF 1.53E-07 *** (9.8E-09) 1.91E-07 *** (1.3E-08) 2.1E-07 *** (2.4E-08) 2.25E-07 * (1.6E-07)ABSBOP 1.03E-08 (1.1E-08) 8.44E-09 (1.4E-08) 6.04E-09 (2.7E-08) -7E-10 (1.7E-07)ABSTB -3.1E-09 (1.2E-08) -6.8E-09 (1.6E-08) -1.4E-08 (2.9E-08) 4.17E-09 (1.9E-07)ABSPPI 2.13E-08 ** (1.0E-08) 2.77E-08 ** (1.4E-08) 2.99E-08 (2.5E-08) 2.7E-08 (1.7E-07)ABSIPP 1.88E-08 ** (1.1E-08) 3.96E-08 *** (1.5E-08) 5.05E-08 ** (2.8E-08) 6.56E-08 (1.9E-07)TANKANMDUM 7.1E-07 *** (1.2E-07) 1.62E-06 *** (1.6E-07) 2.88E-06 *** (2.9E-07) 3.42E-06 ** (1.9E-06)MONEYDUM -1E-08 (4.5E-08) 5.73E-08 (6.1E-08) 6.14E-08 (1.1E-07) -2.9E-09 (7.4E-07)GDPPDUM 7.5E-08 (8.4E-08) 1.04E-07 (1.1E-07) 3.48E-07 ** (2.1E-07) 5.49E-07 (1.4E-06)GDPFDUM -3.2E-07 *** (8.1E-08) -3.2E-07 *** (1.1E-07) -3.2E-07 * (2.0E-07) -4.5E-07 (1.3E-06)BOPDUM -1.1E-07 ** (5.1E-08) -9.8E-08 * (6.9E-08) -1.2E-07 (1.3E-07) -2.8E-07 (8.3E-07)TBDUM 3.24E-08 (5.5E-08) 8.53E-08 (7.4E-08) 9.87E-08 (1.4E-07) -8.7E-08 (9.0E-07)PPIDUM -8.7E-08 * (6.6E-08) -1.5E-07 ** (8.9E-08) -1.6E-07 (1.6E-07) -2.4E-07 (1.1E-06)IPPDUM 6.67E-08 (5.8E-08) 3.82E-08 (7.8E-08) 2.18E-08 (1.4E-07) -1.6E-07 (9.4E-07)R-squared 0.409057 0.475588 0.345437 0.017784NOB 1274 1274 1274 1274 Volatility (Deal Ask)
1min 5min 15min 30minCoefficient s.e. Coefficient s.e. Coefficient s.e. Coefficient s.e.
C 3.62E-08 ** (1.6E-08) 7.39E-08 *** (1.5E-08) 2.58E-07 *** (2.8E-08) 5.4E-07 *** (4.1E-08)Volatility(-1) 0.265666 (2.1E-01) 0.918133 *** (2.7E-02) 0.789577 *** (3.9E-02) 0.683248 *** (4.4E-02)TotalDeals(-1) -2.1E-09 (3.2E-09) -2.4E-09 *** (6.3E-10) -1.2E-09 *** (5.0E-10) -5.8E-10 (4.8E-10)ABSTANKANM 9.3E-08 *** (2.1E-08) 3.13E-08 ** (1.8E-08) -8.3E-10 (3.0E-08) -1.8E-08 (4.2E-08)ABSTANKANN -4.8E-08 *** (1.9E-08) -5.4E-08 *** (1.6E-08) -1E-07 *** (2.6E-08) -9.7E-08 *** (3.7E-08)ABSMONEY 2.79E-10 (1.7E-08) 6.7E-10 (1.4E-08) -1.5E-08 (2.3E-08) -2.6E-08 (3.3E-08)ABSGDPP 9.43E-08 *** (1.7E-08) 1.6E-07 *** (1.4E-08) 1.94E-07 *** (2.4E-08) 1.98E-07 *** (3.3E-08)ABSGDPF 1.21E-07 *** (1.7E-08) 1.89E-07 *** (1.4E-08) 2.05E-07 *** (2.4E-08) 2.17E-07 *** (3.3E-08)ABSBOP 7.46E-09 (1.8E-08) 1.6E-08 (1.6E-08) 1.57E-08 (2.6E-08) 1.66E-08 (3.6E-08)ABSTB -1.4E-09 (2.0E-08) 4.62E-09 (1.7E-08) 6.29E-09 (2.9E-08) 3.44E-08 (4.0E-08)ABSPPI -9.6E-08 *** (1.8E-08) 1.73E-08 (1.5E-08) -2.3E-08 (2.5E-08) -6.3E-08 ** (3.5E-08)ABSIPP 2.75E-08 * (2.0E-08) 4.33E-08 *** (1.7E-08) 5.16E-08 ** (2.8E-08) 4.07E-08 (3.9E-08)TANKANMDUM 6.61E-07 *** (2.0E-07) 1.87E-06 *** (1.7E-07) 3.22E-06 *** (2.8E-07) 3.62E-06 *** (3.9E-07)MONEYDUM 1.33E-08 (7.8E-08) 1.62E-08 (6.6E-08) 5.75E-08 (1.1E-07) 1.53E-07 (1.5E-07)GDPPDUM 1.19E-07 (1.4E-07) 2.22E-07 ** (1.2E-07) 5.5E-07 *** (2.0E-07) 8.66E-07 *** (2.8E-07)GDPFDUM -3.3E-07 *** (1.4E-07) -3.6E-07 *** (1.2E-07) -3.3E-07 ** (2.0E-07) -3.9E-07 * (2.7E-07)BOPDUM -1.9E-07 ** (8.8E-08) -9.1E-08 (7.4E-08) -1.1E-07 (1.2E-07) -2.4E-07 * (1.7E-07)TBDUM 1.89E-08 (9.5E-08) 2.61E-08 (8.0E-08) -2.9E-08 (1.3E-07) -1.1E-07 (1.9E-07)PPIDUM 9.11E-07 *** (1.1E-07) -5.6E-08 (1.0E-07) 2.24E-07 * (1.6E-07) 5.54E-07 *** (2.3E-07)IPPDUM 4.88E-08 (1.0E-07) 4.21E-08 (8.4E-08) 3.71E-08 (1.4E-07) 6.46E-08 (2.0E-07)R-squared 0.236016 0.651287 0.490104 0.397333NOB 1274 1274 1274 1274
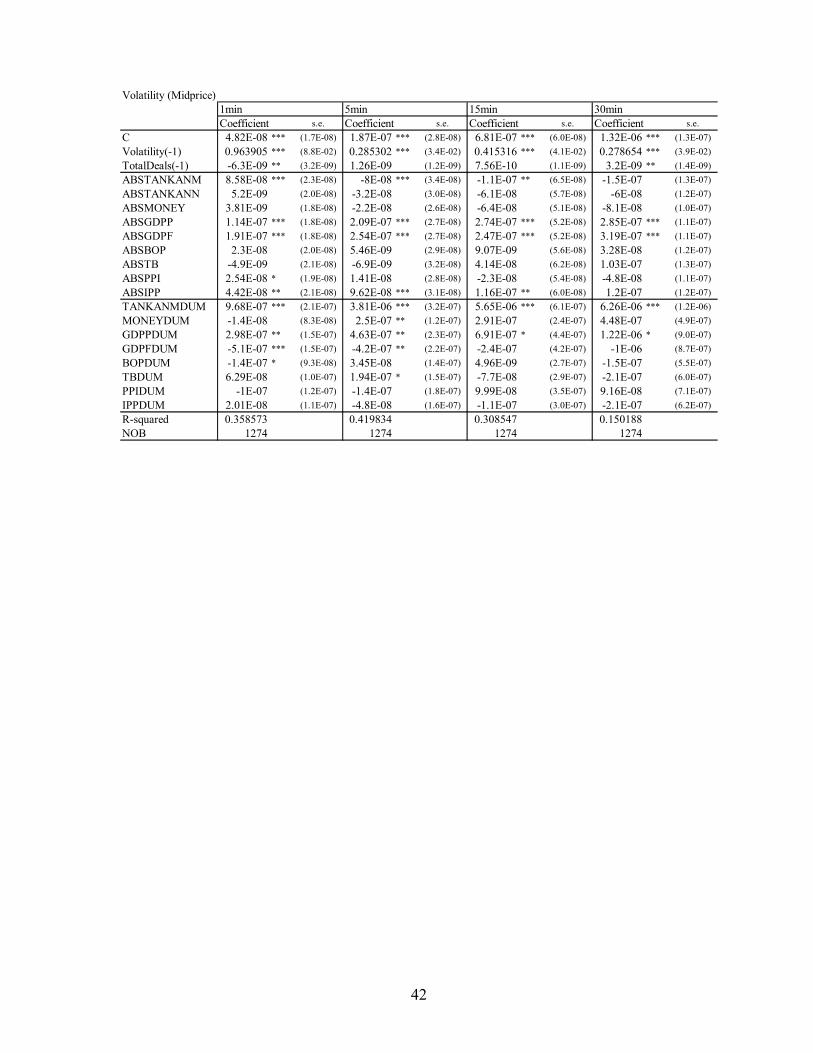
42
Volatility (Midprice)1min 5min 15min 30minCoefficient s.e. Coefficient s.e. Coefficient s.e. Coefficient s.e.
C 4.82E-08 *** (1.7E-08) 1.87E-07 *** (2.8E-08) 6.81E-07 *** (6.0E-08) 1.32E-06 *** (1.3E-07)Volatility(-1) 0.963905 *** (8.8E-02) 0.285302 *** (3.4E-02) 0.415316 *** (4.1E-02) 0.278654 *** (3.9E-02)TotalDeals(-1) -6.3E-09 ** (3.2E-09) 1.26E-09 (1.2E-09) 7.56E-10 (1.1E-09) 3.2E-09 ** (1.4E-09)ABSTANKANM 8.58E-08 *** (2.3E-08) -8E-08 *** (3.4E-08) -1.1E-07 ** (6.5E-08) -1.5E-07 (1.3E-07)ABSTANKANN 5.2E-09 (2.0E-08) -3.2E-08 (3.0E-08) -6.1E-08 (5.7E-08) -6E-08 (1.2E-07)ABSMONEY 3.81E-09 (1.8E-08) -2.2E-08 (2.6E-08) -6.4E-08 (5.1E-08) -8.1E-08 (1.0E-07)ABSGDPP 1.14E-07 *** (1.8E-08) 2.09E-07 *** (2.7E-08) 2.74E-07 *** (5.2E-08) 2.85E-07 *** (1.1E-07)ABSGDPF 1.91E-07 *** (1.8E-08) 2.54E-07 *** (2.7E-08) 2.47E-07 *** (5.2E-08) 3.19E-07 *** (1.1E-07)ABSBOP 2.3E-08 (2.0E-08) 5.46E-09 (2.9E-08) 9.07E-09 (5.6E-08) 3.28E-08 (1.2E-07)ABSTB -4.9E-09 (2.1E-08) -6.9E-09 (3.2E-08) 4.14E-08 (6.2E-08) 1.03E-07 (1.3E-07)ABSPPI 2.54E-08 * (1.9E-08) 1.41E-08 (2.8E-08) -2.3E-08 (5.4E-08) -4.8E-08 (1.1E-07)ABSIPP 4.42E-08 ** (2.1E-08) 9.62E-08 *** (3.1E-08) 1.16E-07 ** (6.0E-08) 1.2E-07 (1.2E-07)TANKANMDUM 9.68E-07 *** (2.1E-07) 3.81E-06 *** (3.2E-07) 5.65E-06 *** (6.1E-07) 6.26E-06 *** (1.2E-06)MONEYDUM -1.4E-08 (8.3E-08) 2.5E-07 ** (1.2E-07) 2.91E-07 (2.4E-07) 4.48E-07 (4.9E-07)GDPPDUM 2.98E-07 ** (1.5E-07) 4.63E-07 ** (2.3E-07) 6.91E-07 * (4.4E-07) 1.22E-06 * (9.0E-07)GDPFDUM -5.1E-07 *** (1.5E-07) -4.2E-07 ** (2.2E-07) -2.4E-07 (4.2E-07) -1E-06 (8.7E-07)BOPDUM -1.4E-07 * (9.3E-08) 3.45E-08 (1.4E-07) 4.96E-09 (2.7E-07) -1.5E-07 (5.5E-07)TBDUM 6.29E-08 (1.0E-07) 1.94E-07 * (1.5E-07) -7.7E-08 (2.9E-07) -2.1E-07 (6.0E-07)PPIDUM -1E-07 (1.2E-07) -1.4E-07 (1.8E-07) 9.99E-08 (3.5E-07) 9.16E-08 (7.1E-07)IPPDUM 2.01E-08 (1.1E-07) -4.8E-08 (1.6E-07) -1.1E-07 (3.0E-07) -2.1E-07 (6.2E-07)R-squared 0.358573 0.419834 0.308547 0.150188NOB 1274 1274 1274 1274

43
A2-3. Announcement at 10:30 Volatility (Deal Bid)
1min 5min 15min 30minCoefficient s.e. Coefficient s.e. Coefficient s.e. Coefficient s.e.
C 8.05E-09 *** (2.1E-09) 2.47E-08 *** (9.3E-09) 5.59E-08 *** (2.3E-08) 1.35E-07 * (8.3E-08)Volatility(-1) 3.85E-02 (4.6E-02) 2.47E-01 *** (5.2E-02) 1.37E-01 *** (3.0E-02) 4.16E-01 *** (7.0E-02)TotalDeals(-1) 1.77E-09 *** (2.7E-10) 1.71E-09 *** (3.0E-10) 1.80E-09 *** (2.4E-10) 5.83E-10 * (4.4E-10)ABSPAYROLL 1.57E-09 (1.6E-09) -5.89E-10 (6.2E-09) 1.04E-08 (1.4E-08) -5.91E-08 * (4.1E-08)PAYROLLDUM 8.17E-09 (1.1E-08) 6.12E-09 (4.3E-08) -6.65E-08 (9.4E-08) 9.14E-07 *** (2.9E-07)R-squared 0.128992 0.246517 0.290204 0.165405NOB 576 576 576 576
Volatility (Deal Ask)1min 5min 15min 30minCoefficient s.e. Coefficient s.e. Coefficient s.e. Coefficient s.e.
C 8.91E-09 *** (1.8E-09) 2.41E-08 *** (8.7E-09) 1.02E-07 *** (2.0E-08) 1.28E-07 * (9.0E-08)Volatility(-1) 2.09E-03 (4.6E-02) 3.46E-01 *** (5.4E-02) 3.67E-01 *** (3.8E-02) 5.14E-01 *** (9.9E-02)TotalDeals(-1) 1.74E-09 *** (2.4E-10) 1.44E-09 *** (2.9E-10) 6.72E-10 *** (2.3E-10) 4.18E-10 (5.2E-10)ABSPAYROLL 6.59E-10 (1.4E-09) -5.64E-09 (5.9E-09) -6.76E-09 (1.2E-08) -8.37E-08 ** (4.5E-08)PAYROLLDUM -1.48E-09 (9.5E-09) 1.65E-08 (4.0E-08) -9.50E-09 (8.2E-08) 1.03E-06 *** (3.1E-07)R-squared 0.134521 0.29044 0.361472 0.142689NOB 576 576 576 576
Volatility (Midprice)1min 5min 15min 30minCoefficient s.e. Coefficient s.e. Coefficient s.e. Coefficient s.e.
C 1.79E-08 *** (2.8E-09) 5.15E-08 *** (1.7E-08) 2.13E-07 *** (3.3E-08) 3.00E-07 *** (1.0E-07)Volatility(-1) 6.19E-02 ** (3.1E-02) 5.15E-01 *** (6.2E-02) 2.37E-01 *** (2.4E-02) 4.12E-01 *** (4.8E-02)TotalDeals(-1) 2.79E-09 *** (3.6E-10) 1.55E-09 *** (5.4E-10) 2.01E-09 *** (3.1E-10) 1.24E-09 *** (4.9E-10)ABSPAYROLL -2.03E-09 (2.1E-09) -1.09E-08 (1.1E-08) 3.18E-09 (2.0E-08) -7.57E-08 * (5.1E-08)PAYROLLDUM 2.15E-08 * (1.5E-08) 6.96E-08 (7.9E-08) -7.89E-08 (1.4E-07) 9.31E-07 *** (3.6E-07)R-squared 0.178486 0.271338 0.36524 0.244617NOB 576 576 576 576

44
A2-4. Announcement at 13:30 Volatility (Deal Bid)
1min 5min 15min 30minCoefficient s.e. Coefficient s.e. Coefficient s.e. Coefficient s.e.
C -8.46E-09 *** (3.5E-09) 1.60E-08 ** (9.5E-09) 8.32E-08 *** (1.9E-08) 1.22E-07 *** (5.2E-08)Volatility-1) 6.33E-01 *** (6.4E-02) 9.82E-01 *** (4.0E-02) 6.27E-01 *** (3.6E-02) 4.10E-01 *** (5.7E-02)TotalDeal(-1) 3.95E-09 *** (6.6E-10) 2.03E-10 (4.4E-10) 7.78E-10 ** (3.5E-10) 2.13E-09 *** (5.1E-10)ABSIIPF -4.59E-09 (4.3E-09) -1.99E-08 ** (1.0E-08) -1.22E-08 (1.8E-08) -1.39E-08 (4.5E-08)IIPFDUM 3.97E-08 ** (2.4E-08) 5.93E-08 (5.5E-08) 7.41E-08 (1.0E-07) 4.64E-08 (2.5E-07)R-squared 0.219591 0.456263 0.376367 0.160099NOB 1261 1261 1261 1261
Volatility (Deal Ask)1min 5min 15min 30minCoefficient s.e. Coefficient s.e. Coefficient s.e. Coefficient s.e.
C 7.78E-09 *** (2.6E-09) 2.85E-08 *** (1.0E-08) 1.25E-07 ** (6.9E-08) 2.03E-07 ** (8.8E-08)Volatility-1) 9.96E-01 *** (2.8E-02) 9.32E-01 *** (3.9E-02) 6.03E-01 *** (1.3E-01) 7.27E-01 *** (1.2E-01)TotalDeal(-1) -2.07E-09 *** (4.7E-10) -3.39E-10 (4.7E-10) 8.29E-10 (1.3E-09) 5.82E-10 (9.2E-10)ABSIIPF 7.92E-10 (3.2E-09) -1.39E-08 (1.1E-08) -1.17E-08 (6.5E-08) -2.19E-08 (7.6E-08)IIPFDUM 5.77E-09 (1.8E-08) 3.83E-08 (6.1E-08) 3.97E-08 (3.6E-07) 4.04E-08 (4.2E-07)R-squared 0.578819 0.431524 0.042431 0.080781NOB 1261 1261 1261 1261
Volatility (Midprice)1min 5min 15min 30minCoefficient s.e. Coefficient s.e. Coefficient s.e. Coefficient s.e.
C -1.08E-09 (3.0E-09) 2.84E-08 ** (1.3E-08) 1.54E-07 *** (2.9E-08) 3.15E-07 *** (6.5E-08)Volatility-1) 3.73E-01 *** (2.7E-02) 6.13E-01 *** (3.9E-02) 3.95E-01 *** (3.0E-02) 6.20E-01 *** (5.0E-02)TotalDeal(-1) 5.09E-09 *** (5.6E-10) 2.69E-09 *** (6.4E-10) 3.33E-09 *** (5.2E-10) 1.72E-09 *** (6.8E-10)ABSIIPF -6.78E-10 (3.8E-09) -1.77E-08 (1.4E-08) -9.60E-09 (2.8E-08) -2.36E-08 (6.0E-08)IIPFDUM 1.80E-08 (2.1E-08) 4.53E-08 (7.7E-08) 6.67E-08 (1.6E-07) 7.43E-08 (3.3E-07)R-squared 0.346858 0.346086 0.335231 0.265788NOB 1261 1261 1261 1261

45
A2-5. Announcement at 14:00 Volatility (Deal Bid)
1min 5min 15min 30minCoefficient s.e. Coefficient s.e. Coefficient s.e. Coefficient s.e.
C 2.8658E-09 (4.1E-09) -8.873E-10 (1.1E-08) 7.4973E-08 *** (1.7E-08) 1.3836E-07 *** (5.3E-08)Volatility(-1) 0.319246 *** (4.6E-02) 0.113255 *** (1.1E-02) 0.393573 *** (1.4E-02) 0.361189 *** (3.5E-02)TotalDeals(-1) 4.0746E-09 *** (6.1E-10) 3.8389E-09 *** (3.6E-10) 1.1685E-09 *** (2.0E-10) 1.1178E-09 *** (3.7E-10)ABSNEWSDIP 3.0393E-10 (3.3E-09) 1.8001E-09 (8.0E-09) 1.3493E-09 (1.2E-08) -7.766E-08 *** (3.3E-08)ABSNEWSDIF -8.614E-11 (3.7E-09) 2.6619E-10 (9.0E-09) -1.826E-09 (1.3E-08) -3.702E-09 (3.7E-08)ABSNEWSEXPEND -1.175E-09 (4.9E-09) -1.92E-09 (1.2E-08) -7.469E-09 (1.7E-08) -2.034E-07 *** (4.9E-08)ABSNEWSHOUSE -8.989E-10 (5.1E-09) -1.105E-08 (1.2E-08) -3.044E-08 ** (1.8E-08) -5.388E-08 (5.1E-08)DIPDUM -4.598E-09 (1.8E-08) -3.338E-08 (4.5E-08) -4.068E-08 (6.5E-08) 4.71E-07 *** (1.9E-07)DIFDUM -1.693E-08 (2.0E-08) -3.199E-08 (4.8E-08) -4.381E-08 (6.9E-08) -1.99E-07 (2.0E-07)EXPENDDUM 7.5559E-10 (2.6E-08) -8.002E-09 (6.2E-08) 7.4606E-09 (9.0E-08) 1.262E-06 *** (2.6E-07)HOUSEDUM -1.8E-09 (2.5E-08) 1.5911E-07 *** (6.0E-08) 3.0525E-07 *** (8.7E-08) 4.8618E-07 ** (2.5E-07)R-squared 0.137924 0.268448 0.515663 0.1983NOB 1278 1278 1278 1278 Volatility (Deal Ask)
1min 5min 15min 30minCoefficient s.e. Coefficient s.e. Coefficient s.e. Coefficient s.e.
C 6.1534E-09 * (3.9E-09) 8.5795E-09 (8.0E-09) 7.8624E-08 *** (1.5E-08) 2.1452E-08 (6.7E-08)Volatility(-1) 0.371739 *** (7.4E-02) 0.143531 *** (8.2E-03) 0.422809 *** (1.3E-02) 0.12927 *** (2.4E-02)TotalDeals(-1) 3.0582E-09 *** (6.5E-10) 3.2399E-09 *** (2.6E-10) 9.9294E-10 *** (1.8E-10) 2.7518E-09 *** (4.1E-10)ABSNEWSDIP -9.313E-10 (3.1E-09) -5.356E-10 (5.8E-09) 1.4663E-09 (1.0E-08) -1.086E-07 *** (4.3E-08)ABSNEWSDIF 2.0846E-09 (3.5E-09) 1.8661E-09 (6.5E-09) -7.208E-10 (1.2E-08) -1.284E-08 (4.8E-08)ABSNEWSEXPEND -8.097E-10 (4.6E-09) 5.2513E-10 (8.5E-09) -1.2E-08 (1.5E-08) -2.871E-07 *** (6.3E-08)ABSNEWSHOUSE -2.836E-09 (4.8E-09) -9.607E-09 (8.9E-09) -3.036E-08 ** (1.6E-08) -4.649E-08 (6.7E-08)DIPDUM 3.1982E-09 (1.7E-08) 1.3015E-08 (3.2E-08) -1.118E-08 (5.8E-08) 7.9793E-07 *** (2.4E-07)DIFDUM -2.219E-08 (1.8E-08) -4.407E-08 * (3.4E-08) -4.319E-08 (6.2E-08) -2.378E-07 (2.5E-07)EXPENDDUM -4.145E-09 (2.4E-08) -2.366E-08 (4.4E-08) 2.5305E-08 (8.1E-08) 1.7522E-06 *** (3.3E-07)HOUSEDUM 1.9008E-08 (2.3E-08) 1.0808E-07 *** (4.3E-08) 2.6942E-07 *** (7.8E-08) 3.8805E-07 (3.2E-07)R-squared 0.103576 0.430143 0.588954 0.128059NOB 1278 1278 1278 1278 Volatility (Midprice)
1min 5min 15min 30minCoefficient s.e. Coefficient s.e. Coefficient s.e. Coefficient s.e.
C 1.5002E-08 *** (6.4E-09) 5.3656E-08 *** (1.4E-08) 1.6848E-07 *** (2.5E-08) 3.6102E-07 *** (5.8E-08)Volatility(-1) 0.231179 *** (5.9E-02) 0.147603 *** (1.5E-02) 0.410793 *** (1.8E-02) 0.383734 *** (2.9E-02)TotalDeals(-1) 5.8181E-09 *** (9.8E-10) 4.5849E-09 *** (4.8E-10) 1.7067E-09 *** (3.2E-10) 1.4935E-09 *** (4.3E-10)ABSNEWSDIP 1.2485E-09 (5.2E-09) 2.9623E-09 (1.0E-08) 2.2649E-09 (1.8E-08) -5.912E-08 * (3.7E-08)ABSNEWSDIF 2.6167E-09 (5.9E-09) 2.3421E-09 (1.2E-08) 1.0958E-08 (2.0E-08) 3.8773E-09 (4.1E-08)ABSNEWSEXPEND -1.558E-09 (7.7E-09) -3.042E-09 (1.5E-08) -3.8E-09 (2.6E-08) -1.708E-07 *** (5.4E-08)ABSNEWSHOUSE -7.62E-09 (8.1E-09) -2.168E-08 * (1.6E-08) -5.166E-08 ** (2.7E-08) -6.957E-08 (5.7E-08)DIPDUM -1.778E-08 (2.9E-08) -6.104E-08 (5.8E-08) -7.297E-08 (9.8E-08) 2.9565E-07 * (2.1E-07)DIFDUM -2.58E-08 (3.1E-08) -5.105E-08 (6.1E-08) -6.087E-08 (1.0E-07) -2.068E-07 (2.2E-07)EXPENDDUM 3.446E-10 (4.1E-08) -1.858E-08 (8.0E-08) -3.552E-08 (1.4E-07) 9.6684E-07 *** (2.8E-07)HOUSEDUM 3.5996E-08 (3.9E-08) 2.0847E-07 *** (7.7E-08) 4.2534E-07 *** (1.3E-07) 5.0912E-07 ** (2.7E-07)R-squared 0.081615 0.256044 0.450222 0.279119NOB 1278 1278 1278 1278

46
A2-6. Announcement at 14:30 Volatility (Deal Bid)
1min 5min 15min 30minCoefficient s.e. Coefficient s.e. Coefficient s.e. Coefficient s.e.
C 4.40E-09 (8.4E-09) 1.51E-08 * (1.0E-08) 7.50E-08 * (4.8E-08) 2.21E-07 *** (6.9E-08)Volatility(-1) 4.28E-02 (6.3E-02) 8.34E-02 *** (1.0E-02) 9.91E-02 *** (3.5E-02) 3.55E-01 *** (4.2E-02)TotalDeals(-1) 3.85E-09 *** (1.3E-09) 2.67E-09 *** (3.7E-10) 2.46E-09 *** (6.2E-10) 1.22E-09 *** (4.9E-10)ABSRETAIL 2.12E-09 (1.0E-08) 1.17E-09 (1.1E-08) -1.12E-08 (4.7E-08) -1.73E-08 (6.4E-08)RETAILDUM -2.15E-08 (5.1E-08) -2.87E-08 (5.6E-08) -1.81E-08 (2.3E-07) -1.60E-08 (3.1E-07)R-squared 0.0099703 0.173255 0.039654 0.125809NOB 1278 1278 1278 1278
Volatility (Deal Ask)1min 5min 15min 30minCoefficient s.e. Coefficient s.e. Coefficient s.e. Coefficient s.e.
C 6.10E-09 *** (1.6E-09) 1.82E-08 *** (6.9E-09) 6.97E-08 * (5.3E-08) 2.33E-07 *** (7.6E-08)Volatility(-1) 7.53E-02 *** (7.3E-03) 3.69E-02 *** (4.8E-03) 3.71E-02 * (2.8E-02) 3.35E-01 *** (3.5E-02)TotalDeals(-1) 1.73E-09 *** (2.5E-10) 2.58E-09 *** (2.4E-10) 2.81E-09 *** (6.7E-10) 1.24E-09 *** (5.0E-10)ABSRETAIL 7.72E-10 (2.0E-09) -3.24E-09 (7.7E-09) -1.93E-08 (5.2E-08) -1.75E-08 (7.0E-08)RETAILDUM -8.32E-09 (9.7E-09) -1.23E-08 (3.8E-08) 2.04E-08 (2.5E-07) -2.85E-08 (3.4E-07)R-squared 0.159742 0.218367 0.026286 0.133005NOB 1278 1278 1278 1278
Volatility (Midprice)1min 5min 15min 30minCoefficient s.e. Coefficient s.e. Coefficient s.e. Coefficient s.e.
C 1.30E-08 *** (2.2E-09) 5.90E-08 *** (8.9E-09) 2.14E-07 *** (5.0E-08) 4.84E-07 *** (7.5E-08)Volatility(-1) 2.12E-01 *** (1.2E-02) 9.68E-02 *** (1.1E-02) 1.67E-01 *** (4.1E-02) 4.50E-01 *** (4.3E-02)TotalDeals(-1) 2.50E-09 *** (3.5E-10) 3.44E-09 *** (3.3E-10) 2.84E-09 *** (7.2E-10) 8.85E-10 * (5.9E-10)ABSRETAIL 7.79E-10 (2.7E-09) -4.76E-09 (9.9E-09) -3.69E-08 (5.0E-08) -4.26E-08 (7.1E-08)RETAILDUM -7.72E-09 (1.3E-08) 4.66E-08 (4.9E-08) 1.64E-07 (2.5E-07) 1.36E-07 (3.5E-07)R-squared 0.300373 0.26505 0.063935 0.174903NOB 1278 1278 1278 1278