Embed Size (px)
Citation preview
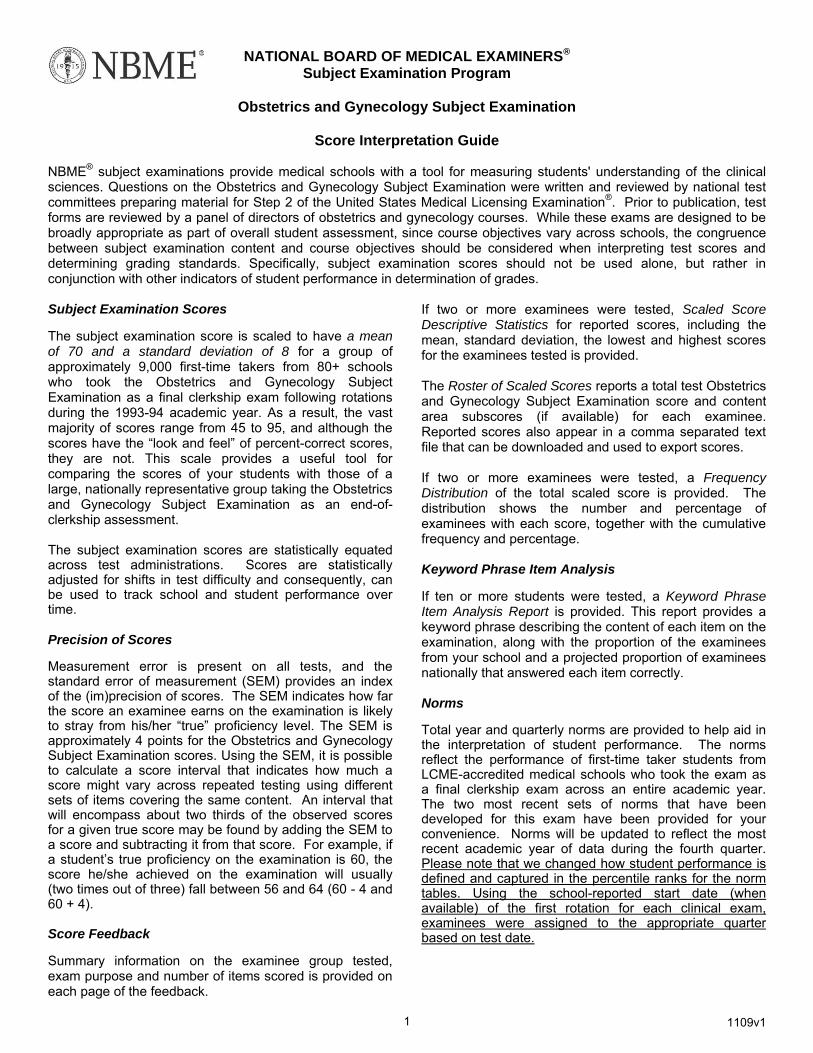
NATIONAL BOARD OF MEDICAL EXAMINERS®
Subject Examination Program
Obstetrics and Gynecology Subject Examination
Score Interpretation Guide
NBME® subject examinations provide medical schools with a tool for measuring students' understanding of the clinical sciences. Questions on the Obstetrics and Gynecology Subject Examination were written and reviewed by national test committees preparing material for Step 2 of the United States Medical Licensing Examination®. Prior to publication, test forms are reviewed by a panel of directors of obstetrics and gynecology courses. While these exams are designed to be broadly appropriate as part of overall student assessment, since course objectives vary across schools, the congruence between subject examination content and course objectives should be considered when interpreting test scores and determining grading standards. Specifically, subject examination scores should not be used alone, but rather in conjunction with other indicators of student performance in determination of grades.
Subject Examination Scores
The subject examination score is scaled to have a mean of 70 and a standard deviation of 8 for a group of approximately 9,000 first-time takers from 80+ schools who took the Obstetrics and Gynecology Subject Examination as a final clerkship exam following rotations during the 1993-94 academic year. As a result, the vast majority of scores range from 45 to 95, and although the scores have the “look and feel” of percent-correct scores, they are not. This scale provides a useful tool for comparing the scores of your students with those of a large, nationally representative group taking the Obstetrics and Gynecology Subject Examination as an end-ofclerkship assessment.
The subject examination scores are statistically equated across test administrations. Scores are statistically adjusted for shifts in test difficulty and consequently, can be used to track school and student performance over time.
Precision of Scores
Measurement error is present on all tests, and the standard error of measurement (SEM) provides an index of the (im)precision of scores. The SEM indicates how far the score an examinee earns on the examination is likely to stray from his/her “true” proficiency level. The SEM is approximately 4 points for the Obstetrics and Gynecology Subject Examination scores. Using the SEM, it is possible to calculate a score interval that indicates how much a score might vary across repeated testing using different sets of items covering the same content. An interval that will encompass about two thirds of the observed scores for a given true score may be found by adding the SEM to a score and subtracting it from that score. For example, if a student’s true proficiency on the examination is 60, the score he/she achieved on the examination will usually (two times out of three) fall between 56 and 64 (60 - 4 and 60 + 4).
Score Feedback
Summary information on the examinee group tested, exam purpose and number of items scored is provided on each page of the feedback.
If two or more examinees were tested, Scaled Score Descriptive Statistics for reported scores, including the mean, standard deviation, the lowest and highest scores for the examinees tested is provided.
The Roster of Scaled Scores reports a total test Obstetrics and Gynecology Subject Examination score and content area subscores (if available) for each examinee. Reported scores also appear in a comma separated text file that can be downloaded and used to export scores.
If two or more examinees were tested, a Frequency Distribution of the total scaled score is provided. The distribution shows the number and percentage of examinees with each score, together with the cumulative frequency and percentage.
Keyword Phrase Item Analysis
If ten or more students were tested, a Keyword Phrase Item Analysis Report is provided. This report provides a keyword phrase describing the content of each item on the examination, along with the proportion of the examinees from your school and a projected proportion of examinees nationally that answered each item correctly.
Norms
Total year and quarterly norms are provided to help aid in the interpretation of student performance. The norms reflect the performance of first-time taker students from LCME-accredited medical schools who took the exam as a final clerkship exam across an entire academic year. The two most recent sets of norms that have been developed for this exam have been provided for your convenience. Norms will be updated to reflect the most recent academic year of data during the fourth quarter. Please note that we changed how student performance is defined and captured in the percentile ranks for the norm tables. Using the school-reported start date (when available) of the first rotation for each clinical exam, examinees were assigned to the appropriate quarter based on test date.
1 1109v1

Obstetrics and Gynecology Subject Exam 2007-2008 Academic Year Norms for Examinee Performance
The table below provides norms to aid in the interpretation of student performance. These norms reflect the performance of 12,876 students from LCME-accredited medical schools who took the Obstetrics and Gynecology Subject Exam as a final clerkship exam for the first time during the 2007-2008 academic year (8/1/2007-7/31/2008). The norms demonstrate the performance of this group across the entire academic year and by quarterly testing periods. These norms allow you to compare your students’ subject exam scores with the performance of the 2007-2008 academic year norm group. The norms are based on examinees from schools that supplied the start date of the first rotation for this subject.
Quarterly norms have been provided because it is common knowledge that scores in some clerkship exams are progressively higher for students of equivalent ability who take the relevant rotation later in the academic year. For example, the percentile rank corresponding to a score of 75 for Quarter 1 is 72; in Quarter 4 the percentile rank for this score is 60. This information may have particular relevance to schools that have used the norm table in the development of grading guidelines.
The percentile ranks for each quarter are defined using the school reported start date of the first rotation for this subject. Using the start date of the first rotation, examinees are assigned to the appropriate quarter based on the assumption that their test date would be at least four weeks later. For example, if a school’s start date for the first rotation is March, then the performance of students from that school who tested in April, May or June would be represented in the first quarter. Similarly, the performance of students from the same school who tested in July, August or September would be represented in the second quarter.
The mean and standard deviation (SD) of the academic year norm group for the Obstetrics and Gynecology Subject Examination scores across the entire academic year and by quarter are as follows:
Mean SD
Total Year: 72.8 7.9
Quarter 1: 71.4 7.8
Quarter 2: 72.6 7.9
Quarter 3: 73.5 7.9
Quarter 4: 73.8 7.9
To use the table, locate a student’s subject examination score in the column labeled “Score” and note the entry in the adjacent column labeled “Percentile Ranks” for the Total Year or Quarterly testing period of interest.
For example, if a student’s score is 63, the corresponding percentile rank entry of 12 for the Total Year indicates that 12% of the academic year norm group students taking the Obstetrics and Gynecology Subject Examination during the 2007-2008 academic year had scores at or below 63.
Similarly, if a student’s score is 63, the corresponding percentile rank entry of 9 for Quarter 4 indicates that 9% of the academic year norm group students taking the Obstetrics and Gynecology Subject Examination during Quarter 4 of the 2007-2008 academic year had scores at or below 63.
Percentile Ranks
Score Total Year Quarter 1 Quarter 2 Quarter 3 Quarter 4
(n= 12,876) (n= 3,521) (n= 3,118) (n= 3,214) (n= 3,023) 93 or above 99 99 99 99 99
92 99 99 99 99 99 91 99 99 98 99 98 90 98 99 98 98 97 89 98 99 98 98 97 88 97 98 97 97 96 87 96 97 95 95 95 86 95 96 95 94 93 85 94 95 94 93 93 84 92 95 93 91 91 83 91 94 92 89 89 82 88 91 89 86 85 81 86 90 87 83 83 80 84 89 85 81 81 79 81 86 81 77 78 78 77 83 78 73 73 77 74 80 75 71 70 76 69 76 70 66 65 75 66 72 67 62 60 74 61 68 62 57 56 73 54 62 56 50 48 72 50 57 52 45 44 71 45 53 47 40 40 70 39 46 40 34 35 69 35 41 36 31 31 68 31 37 31 27 27 67 26 32 26 23 22 66 21 26 22 18 17 65 18 22 17 15 15 64 15 19 14 13 11 63 12 15 11 10 9 62 9 12 9 7 7 61 7 10 7 6 5 60 5 7 5 4 4 59 4 5 3 3 2 58 3 4 2 3 2 57 2 3 2 2 1 56 1 2 1 1 1 55 1 2 1 1 0
54 and below 1 1 1 1 0
2 1109v1
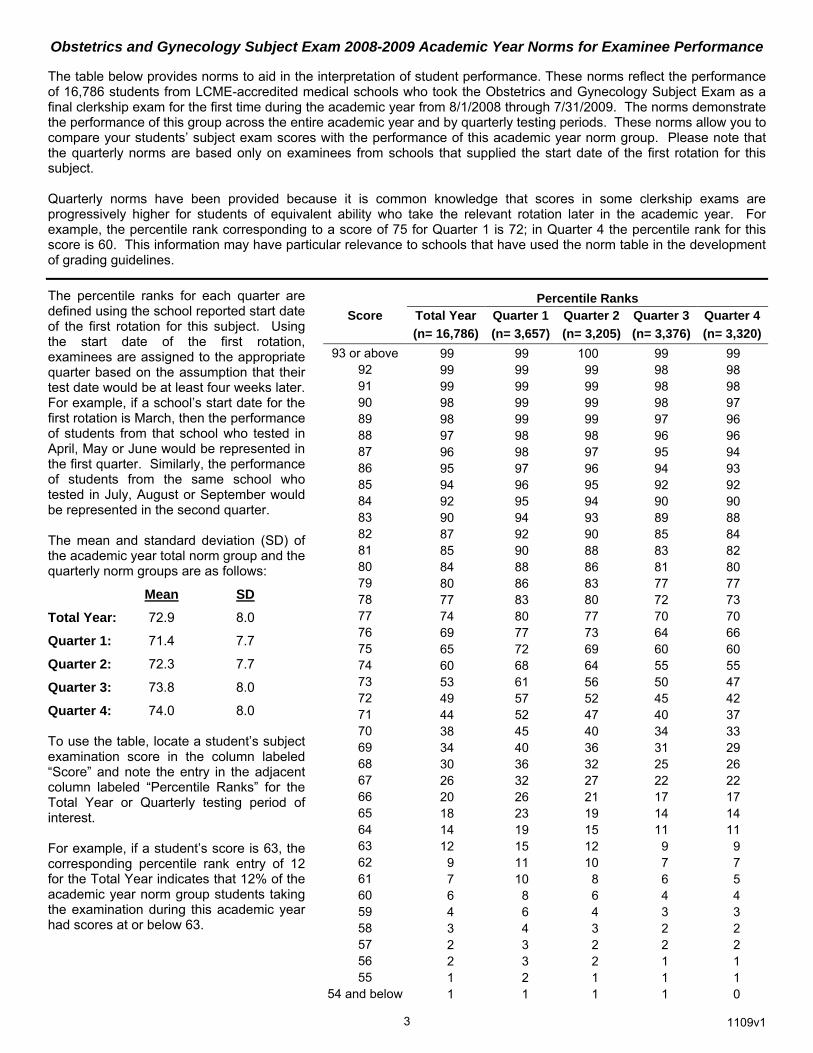
Obstetrics and Gynecology Subject Exam 2008-2009 Academic Year Norms for Examinee Performance
The table below provides norms to aid in the interpretation of student performance. These norms reflect the performance of 16,786 students from LCME-accredited medical schools who took the Obstetrics and Gynecology Subject Exam as a final clerkship exam for the first time during the academic year from 8/1/2008 through 7/31/2009. The norms demonstrate the performance of this group across the entire academic year and by quarterly testing periods. These norms allow you to compare your students’ subject exam scores with the performance of this academic year norm group. Please note that the quarterly norms are based only on examinees from schools that supplied the start date of the first rotation for this subject.
Quarterly norms have been provided because it is common knowledge that scores in some clerkship exams are progressively higher for students of equivalent ability who take the relevant rotation later in the academic year. For example, the percentile rank corresponding to a score of 75 for Quarter 1 is 72; in Quarter 4 the percentile rank for this score is 60. This information may have particular relevance to schools that have used the norm table in the development of grading guidelines.
The percentile ranks for each quarter are defined using the school reported start date of the first rotation for this subject. Using the start date of the first rotation, examinees are assigned to the appropriate quarter based on the assumption that their test date would be at least four weeks later. For example, if a school’s start date for the first rotation is March, then the performance of students from that school who tested in April, May or June would be represented in the first quarter. Similarly, the performance of students from the same school who tested in July, August or September would be represented in the second quarter.
The mean and standard deviation (SD) of the academic year total norm group and the quarterly norm groups are as follows:
Mean SD
Total Year: 72.9 8.0
Quarter 1: 71.4 7.7
Quarter 2: 72.3 7.7
Quarter 3: 73.8 8.0
Quarter 4: 74.0 8.0
To use the table, locate a student’s subject examination score in the column labeled “Score” and note the entry in the adjacent column labeled “Percentile Ranks” for the Total Year or Quarterly testing period of interest.
For example, if a student’s score is 63, the corresponding percentile rank entry of 12 for the Total Year indicates that 12% of the academic year norm group students taking the examination during this academic year had scores at or below 63.
Score Percentile Ranks
Total Year Quarter 1 Quarter 2 Quarter 3 Quarter 4
(n= 16,786) (n= 3,657) (n= 3,205) (n= 3,376) (n= 3,320)
93 or above 99 99 100 99 99 92 99 99 99 98 98 91 99 99 99 98 98 90 98 99 99 98 97 89 98 99 99 97 96 88 97 98 98 96 96 87 96 98 97 95 94 86 95 97 96 94 93 85 94 96 95 92 92 84 92 95 94 90 90 83 90 94 93 89 88 82 87 92 90 85 84 81 85 90 88 83 82 80 84 88 86 81 80 79 80 86 83 77 77 78 77 83 80 72 73 77 74 80 77 70 70 76 69 77 73 64 66 75 65 72 69 60 60 74 60 68 64 55 55 73 53 61 56 50 47 72 49 57 52 45 42 71 44 52 47 40 37 70 38 45 40 34 33 69 34 40 36 31 29 68 30 36 32 25 26 67 26 32 27 22 22 66 20 26 21 17 17 65 18 23 19 14 14 64 14 19 15 11 11 63 12 15 12 9 9 62 9 11 10 7 7 61 7 10 8 6 5 60 6 8 6 4 4 59 4 6 4 3 3 58 3 4 3 2 2 57 2 3 2 2 2 56 2 3 2 1 1 55 1 2 1 1 1
54 and below 1 1 1 1 0
3 1109v1

NATIONAL BOARD OF MEDICAL EXAMINERS®
Subject Examination Program
Grading Guidelines
Analyzing Performance on Subject Examinations
Obstetrics and Gynecology Examination
During the 1990’s, the National Board of Medical Examiners® (NBME®) received numerous requests from medical school faculty for assistance in determining appropriate scores for passing and obtaining honors on subject examinations. In response to these requests, the NBME decided that the most useful approach would be to facilitate a process through which clerkship directors would provide their own judgments concerning scores for passing and honors grades. Through a series of mail surveys, guidelines for establishing fair and valid passing and honors standards for students were developed based on the ratings of clerkship directors who used NBME subject examinations. As a result, the NBME subject examination program began to routinely provide guidelines for assessing student performance on the clinical science subject examinations in the late 1990s.
In accordance with NBME best practices that call for the periodic review and update of performance standards for their exams, the NBME subject examination program determined that it was necessary to update the guidelines that were compiled in the 1990s. In 2004, the NBME began conducting performance guidelines studies for the clinical science subject examinations in order to obtain validity and standard setting information. Primary goals of the study were: 1) to train participants in standard setting approaches through Webcast conference call sessions; and 2) to collect data based on an in-depth item-based review of the examination content from a large representative sample of clerkship directors via the internet.
The purpose of this report is to provide a general review of standard setting and an explanation of the two approaches that were used by course and clerkship directors to set fair and valid passing and honors standards for the NBME subject examinations. A description of the Webcast process used to gather and analyze examinee performance data in the current study is also provided.
Standards: Relative and Absolute
A standard is a value that answers the question "How much is enough?" Standards are set in nearly every industry and profession to protect the general public. Standard setting may be as disparate as determining the minimum amount of protein required in a school lunch, the maximum speed limit on a highway or the minimum passing score on an examination. It is important to recognize that, because judgment is always involved in the standard setting process, in a sense all standards are somewhat arbitrary. On the other hand, it is also important to note that standards should not be capricious.
Standards may be classified as either relative or absolute. A relative standard is based on the performance of the group taking the same exam. Examinees are classified (e.g., Pass/Fail, Honors) depending upon how well they perform relative to other examinees taking the exam. The following are examples of relative standards:
those scoring 1.2 standard deviations or more below the mean will fail
the top 10 percent of the group will achieve Honors.
In contrast, an absolute standard does not compare the performance of one examinee to the performance of others who took the exam. Examinees instead are classified based only upon how well they perform, regardless of the performance of other examinees. In theory, on a test with an absolute standard all examinees could meet the standard or all could not. The following are examples of absolute standards:
those answering less than 60 percent of the questions correctly will fail
those answering at least 85 percent of the questions correctly will achieve Honors
those achieving a standard score of 350 will pass.
For several reasons, use of absolute standards has substantial intuitive appeal. First, it seems more equitable to base pass/fail decisions on the quality of an individual examinee's performance; it does not seem reasonable for classification decisions to be determined by the strengths and weaknesses of other examinees taking the same test. Second, it seems reasonable that all examinees that perform well should pass, rather than predetermining that a specific percentage of
Updated: Nov. 2009 1109v2 4

examinees will fail. Third, it is conceptually appealing to think of a standard as reflecting the minimum level of performance that is required for a specific purpose, such as to practice safely, continue with training, achieve Honors level, etc.
The practical reality, however, is that it is often difficult to agree on the absolute level of performance that should serve as a pass/fail point; especially when the decision is made in advance of test administration. Often, test users have an intuitive sense of the overall quality of an examinee group and strong ideas about the rough proportion that should pass and fail. In effect, relative standards capitalize on test users' knowledge of the examinee group to calibrate the standard that is used. This is not by definition problematic and in many situations the use of relative standards is a reasonable alternative, when used to rank order examinees or to identify examinees for remedial or honors programs.
There are several valid approaches to standard setting that can be applied to determine both relative and absolute standards. Relative standards use a norm-referenced approach, whereas, absolute standards use a content-based or criterion-referenced approach. Whenever possible it is recommended that a content-based procedure be applied that can be used in conjunction with a compromise approach that takes into account both relative and absolute standards.
Content-Based Approach: Modified Angoff Procedure
One of the most widely used and researched of the content-based approaches to standard setting is the Angoff procedure (1971). The Angoff procedure is an item-based procedure that requires participants to conduct an in-depth content review of test items and to provide an estimate of the proportion of minimally proficient “borderline” passing examinees that would answer each item correctly. In the modified Angoff approach, judges are often provided with normative data (usually in the form of item statistics) during a second round of ratings. This data serves as a “reality check” to promote reasonable expectations of examinee performance. During the training period, judges first discuss the characteristics of the minimally proficient examinee (MPE). Judges then review a sample set of test questions and estimate the probability that a MPE will answer each item correctly. The sample ratings are recorded and displayed, and judges with extreme ratings on an item are asked to explain their reasons for choosing a high or low probability. Once judges are comfortable reviewing, rating, and discussing the sample test questions, they proceed with reviewing and rating the remaining test questions. Mean probabilities are computed for each judge across all items; the recommended passing standard is then computed based on the mean probability across all judges.
Compromise Approach: The Hofstee Method
Another approach to standard setting employs compromise models that utilize the advantages of both relative and absolute standard setting procedures. These models can be used to directly derive a recommended passing score or to adjust standards obtained from other standard setting approaches. Compromise models require that the judges think of the examination at the test level and not the item level. One of the most commonly used of these methods is the approach recommended by Hofstee (1983).
In the Hofstee Method, judges review a copy of the exam and then are asked to provide four values: 1) the minimum percent of correct answers required to pass the examination (lowest minimum passing score), 2) the maximum percent of correct answers required to pass (highest minimum passing score), 3) the minimum acceptable percentage of failures (minimum failure rate), and 4) the maximum acceptable percentage of failures (maximum failure rate). The four values define acceptable standards. After test administration, the distribution of observed test scores is obtained and a curve showing the fail rate as a function of a passing score is plotted. The mean or median of the four values for the group of judges is computed and plotted to form a rectangle, which is projected onto the observed test score distribution. This rectangle represents a region of acceptable standards based on the judges' data. A mathematical "consensus" line may be defined within this region by drawing the diagonal that connects the upper left corner with the lower right corner of the rectangle. The percent correct score that corresponds to the point at which the consensus line intersects the test score distribution curve can be proposed as the compromise passing standard. The figure shown on the last page provides an illustration of the results of the compromise method for the most recent study with the percent correct scores converted to the subject examination score scale.
Standard Setting Studies and Grading Guidelines for the Obstetrics and Gynecology Examination
In 1999, the NBME used the Hofstee compromise method to gather standard setting judgments through the mail from eight clerkship directors in obstetrics and gynecology. Judgments were based on a global review of an existing form of the Obstetrics and Gynecology Subject Examination. Participants were asked to provide an opinion regarding the percentage of students who should pass; as well as the minimum and maximum scores that should be required of someone to pass. Each clerkship director was also asked to provide opinions regarding the minimum and maximum scores that should be required for a student to obtain honors. The results were reported along with the roster of scores sent for each test administration to all medical schools that use the Obstetrics and Gynecology Subject Examination.
5Updated: Nov. 2009 1109v2

In 2004, the NBME began conducting webcast standard setting studies with medical school faculty from across the United States. For each study, medical school faculty participated as expert judges in one of three Webcast sessions that utilized the Internet and conference calling to train participants in the standard setting procedure. Judges reviewed the content and rated the difficulty of each item on a current form of the Obstetrics and Gynecology Subject Examination. The study employed both a Modified Angoff content-based procedure and the Hofstee Compromise standard setting method described earlier. These two procedures together provide proposed passing standards that are based on an in-depth item-by-item analysis of the examination content, as well as, a more global analysis of the content. The results were summarized and the proposed standards were expressed as the proportion of the content required for a candidate to pass and to receive honors status. Table 1 provides a summary of the medical school faculty who served as expert judges and their school information for each of the webcast studies conducted by the NBME.
Table 1 – Demographics of Expert Judges and Schools Participating in Webcast Studies
Standard Setting Study
Number of Judges
Years of Experience
% Clerkship Directors
Number of Schools
Traditional School Curriculum
School Clerkship Length
(80% or more)
2004 29 1 – 21 97% 29 52% 6 – 8 weeks
2009 23 1 – 15 91% 23 39% 6 - 8 weeks
The data shown below represent a compilation of the opinions of the medical school faculty who participated in the webcast studies. Although the study results were computed on a percent correct score scale, the results reported below have been converted to the subject exam score scale reported on the Roster of Scaled Scores, with a mean of 70 and a standard deviation of 8 for the scaling group. This scale is used because it is an equated score; scores from one form of the test are comparable to scores on other forms of the test. The study results are provided to assist you in setting fair and valid standards for the Obstetrics and Gynecology Subject Examination. It is, of course, your decision whether or not you want to use these data in determining pass/fail or honors standards in your clerkship.
Table 2 provides a summary of the results for passing scores from the Modified Angoff and Hofstee Compromise procedures. The recommended minimum passing score based on the 2009 Angoff results is a score of 63 which was higher than in 2004. This score fell well within the acceptable range of minimum passing scores (59 to 66) computed from the 2009 Hofstee results, which suggest that any standard selected within this range would be reasonable. The recommended minimum passing score based on the 2009 Hofstee results is a subject exam score of 61, which is slightly higher than the 2004 Hofstee results.
Table 2 – Obstetrics and Gynecology Grading Guidelines for Passing (Mean Scaled Scores)
Standard Setting Study
Number of Judges
Modified Angoff
Recommended Passing Score
Hofstee Compromise
Range of Acceptable Minimum Passing Scores
Recommended Passing Score
2004 29 57 54 to 62 59
2009 23 63 59 to 66 61
Table 3 provides a summary of the Hofstee results for honors. The 2009 study results indicate that the minimum acceptable score for honors should fall between a score of 79 to 88. The range of minimum acceptable Hofstee scores for honors based on the 2009 study results is similar to the 2004 study results. The lowest minimum honors score is in 2009 is the same as in 2004.
Table 3 – Obstetrics and Gynecology Grading Guidelines for Honors (Mean Scaled Scores)
Standard Number of Hofstee Compromise
Setting Study Judges Range of Acceptable Minimum Honors Scores
2004 29 79 to 89
2009 23 79 to 88
Updated: Nov. 2009 1109v2 6
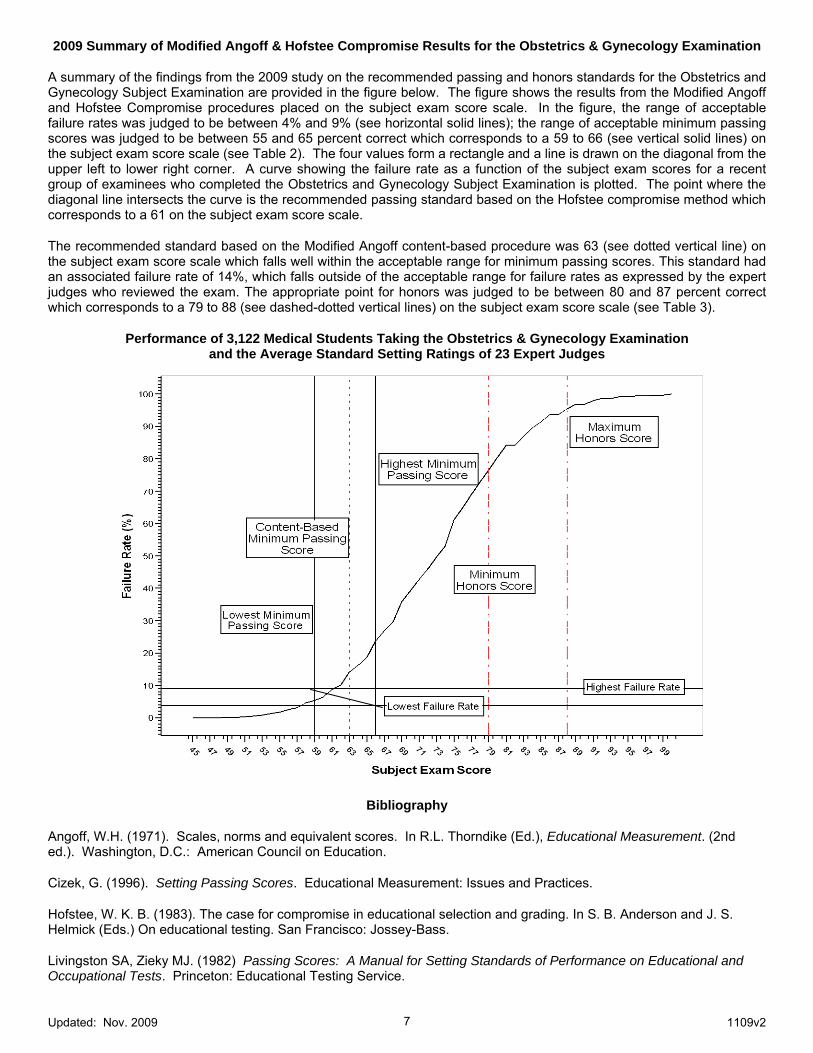
2009 Summary of Modified Angoff & Hofstee Compromise Results for the Obstetrics & Gynecology Examination
A summary of the findings from the 2009 study on the recommended passing and honors standards for the Obstetrics and Gynecology Subject Examination are provided in the figure below. The figure shows the results from the Modified Angoff and Hofstee Compromise procedures placed on the subject exam score scale. In the figure, the range of acceptable failure rates was judged to be between 4% and 9% (see horizontal solid lines); the range of acceptable minimum passing scores was judged to be between 55 and 65 percent correct which corresponds to a 59 to 66 (see vertical solid lines) on the subject exam score scale (see Table 2). The four values form a rectangle and a line is drawn on the diagonal from the upper left to lower right corner. A curve showing the failure rate as a function of the subject exam scores for a recent group of examinees who completed the Obstetrics and Gynecology Subject Examination is plotted. The point where the diagonal line intersects the curve is the recommended passing standard based on the Hofstee compromise method which corresponds to a 61 on the subject exam score scale.
The recommended standard based on the Modified Angoff content-based procedure was 63 (see dotted vertical line) on the subject exam score scale which falls well within the acceptable range for minimum passing scores. This standard had an associated failure rate of 14%, which falls outside of the acceptable range for failure rates as expressed by the expert judges who reviewed the exam. The appropriate point for honors was judged to be between 80 and 87 percent correct which corresponds to a 79 to 88 (see dashed-dotted vertical lines) on the subject exam score scale (see Table 3).
Performance of 3,122 Medical Students Taking the Obstetrics & Gynecology Examination and the Average Standard Setting Ratings of 23 Expert Judges
Bibliography
Angoff, W.H. (1971). Scales, norms and equivalent scores. In R.L. Thorndike (Ed.), Educational Measurement. (2nd ed.). Washington, D.C.: American Council on Education.
Cizek, G. (1996). Setting Passing Scores. Educational Measurement: Issues and Practices.
Hofstee, W. K. B. (1983). The case for compromise in educational selection and grading. In S. B. Anderson and J. S. Helmick (Eds.) On educational testing. San Francisco: Jossey-Bass.
Livingston SA, Zieky MJ. (1982) Passing Scores: A Manual for Setting Standards of Performance on Educational and Occupational Tests. Princeton: Educational Testing Service.
Updated: Nov. 2009 1109v2 7

-------------
National Board of Medical Examiners
Subject Examination Program Scaled Score Descriptive Statistics
Obstetrics and Gynecology
School: 000000 - Generic Medical School Test Date(s): 04/12/2010
Scaled score descriptive statistics (mean, standard deviation, lowest score, and highest score) for the examination administered on the specified test date(s) are listed below. Please refer to the Score Interpretation Guide for information about how to interpret the scores.
Reporting Group Test Purpose # Examinees Order ID Form # Scored Items Medical Students End-Of-Course/ 28 AAAAAA MSS Obstetrics and Gynecology - 2010 Form# 01 100
Clerkship
Score Category Description Mean Score Standard Deviation Low Score High Score Total Total Test 74.1 8.8 59 94
Page 1 of 3 04/20/2010
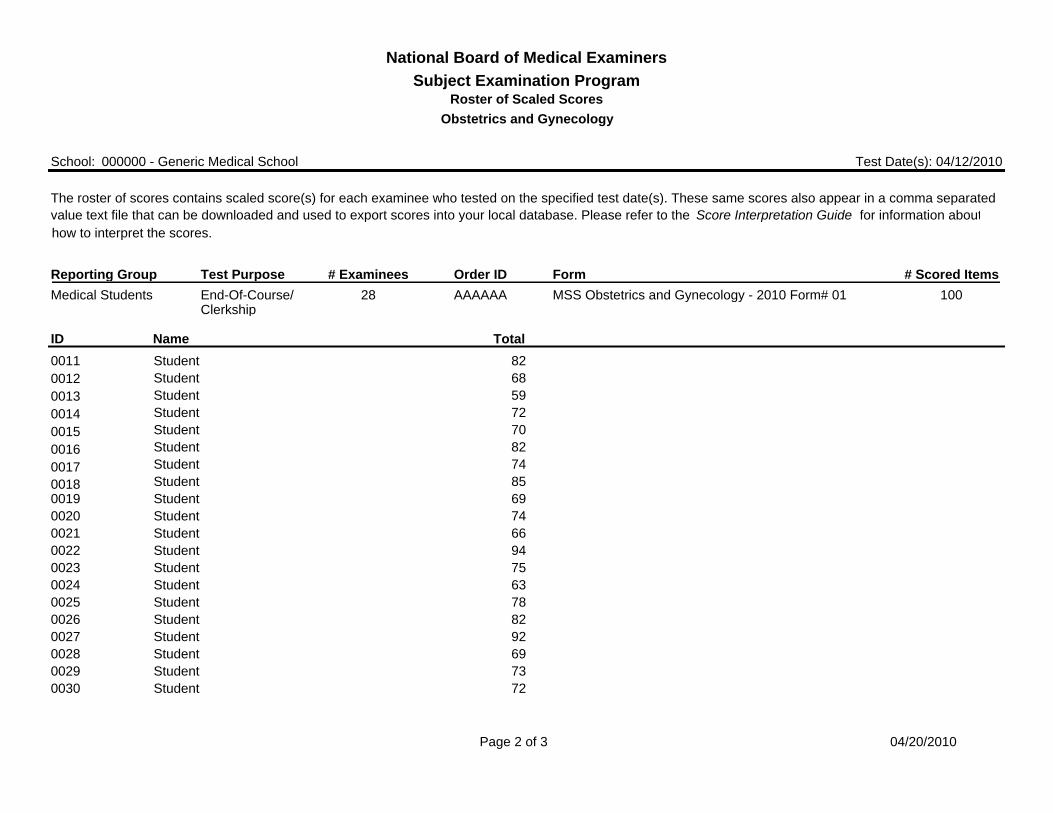
National Board of Medical Examiners
Subject Examination Program Roster of Scaled Scores
Obstetrics and Gynecology
School: 000000 - Generic Medical School Test Date(s): 04/12/2010
The roster of scores contains scaled score(s) for each examinee who tested on the specified test date(s). These same scores also appear in a comma separated value text file that can be downloaded and used to export scores into your local database. Please refer to the Score Interpretation Guide for information about how to interpret the scores.
Reporting Group-------------
Test Purpose # Examinees Order ID Form # Scored Items Medical Students End-Of-Course/
Clerkship 28 AAAAAA MSS Obstetrics and Gynecology - 2010 Form# 01 100
ID Name Total 0011 Student 82 0012 Student 68 0013 Student 59 0014 Student 72 0015 Student 70 0016 Student 82 0017 Student 74 0018 Student 850019 Student 69 0020 Student 74 0021 Student 66 0022 Student 94 0023 Student 75 0024 Student 63 0025 Student 780026 Student 82 0027 Student 92 0028 Student 690029 Student 73 0030 Student 72
Page 2 of 3 04/20/2010
-------------
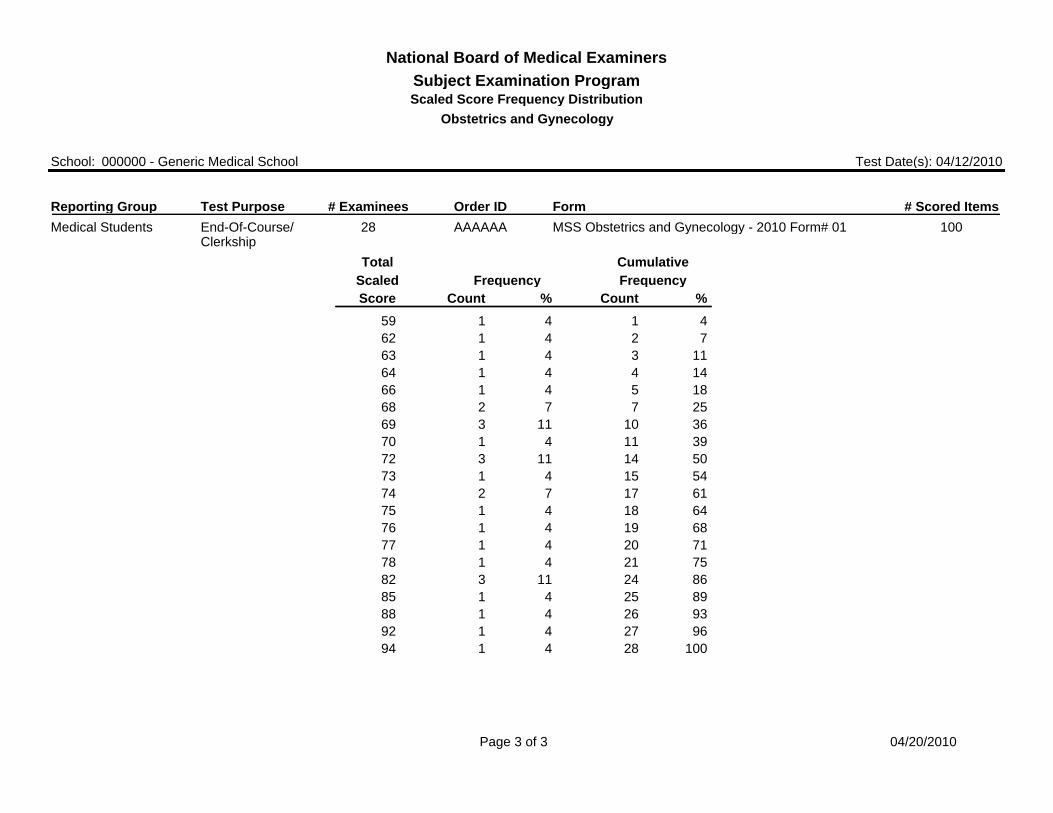
National Board of Medical Examiners Subject Examination Program Scaled Score Frequency Distribution
Obstetrics and Gynecology
School: 000000 - Generic Medical School Test Date(s): 04/12/2010
Reporting Group Test Purpose # Examinees Order ID Form # Scored Items Medical Students End-Of-Course/ 28 AAAAAA MSS Obstetrics and Gynecology - 2010 Form# 01 100
Clerkship
Total Cumulative Scaled Frequency Frequency Score Count % Count %
59 1 4 1 4 62 1 4 2 7 63 1 4 3 11 64 1 4 4 14 66 1 4 5 18 68 2 7 7 25 69 3 11 10 36 70 1 4 11 39 72 3 11 14 50 73 1 4 15 54 74 2 7 17 61 75 1 4 18 64 76 1 4 19 68 77 1 4 20 71 78 1 4 21 75 82 3 11 24 86 85 1 4 25 89 88 1 4 26 93 92 1 4 27 96 94 1 4 28 100
Page 3 of 3 04/20/2010