Embed Size (px)
Citation preview

Pillar III Disclosures
on a Consolidated Basis
30 June 2019
NATIONAL BANK OF GREECE S.A.

National Bank of Greece
Consolidated Pillar III Report
2
Contents
1. INTRODUCTION – GENERAL INFORMATION ................................................................................................................................... 6 1.1. Recent Regulatory Developments ................................................................................................................................................. 6
1.1.1. Banking Union .................................................................................................................................................................................................. 6 1.1.2. NPE Management Regulatory Framework ....................................................................................................................................................... 8 1.1.3. Basel 4 (finalisation of Basel 3) ...................................................................................................................................................................... 11 1.1.4. Pillar 2 (SREP, ICAAP, ILAAP) .......................................................................................................................................................................... 11 1.1.5. Internal Models.............................................................................................................................................................................................. 12 1.1.6. Liquidity Stress Test 2019 (LiST 2019) ............................................................................................................................................................ 13 1.1.7. BCBS 239 ........................................................................................................................................................................................................ 14 1.1.8. Other regulatory developments .................................................................................................................................................................... 14 1.1.9. International Financial Reporting Standards 9 (IFRS 9) .................................................................................................................................. 15
1.2. Pillar III Disclosures policy ........................................................................................................................................................... 17 2. NBG’s TRANSFORMATION PROGRAMME .................................................................................................................................... 18 3. REGULATORY OWN FUNDS AND PRUDENTIAL REQUIREMENTS ................................................................................................... 19
3.1. Structure of own funds ............................................................................................................................................................... 19 3.2. IFRS 9 impact on own funds ........................................................................................................................................................ 20 3.3. DTC Law ....................................................................................................................................................................................... 21 3.4. Transitional own funds disclosure template ............................................................................................................................... 22 3.5. Capital requirements under Pillar I ............................................................................................................................................. 23 3.6. Leverage Ratio ............................................................................................................................................................................. 24
4. CREDIT RISK................................................................................................................................................................................. 25 4.1. Definitions and general information ........................................................................................................................................... 25 4.2. Impairment – Expected Credit Losses ......................................................................................................................................... 25 4.3. Revert to Standardised Approach ............................................................................................................................................... 26 4.4. General information on Credit Risk ............................................................................................................................................. 27 4.5. Provision analysis ........................................................................................................................................................................ 29 4.6. Non-performing and forborne exposures ................................................................................................................................... 29 4.7. Credit Risk Mitigation techniques ............................................................................................................................................... 32 4.8. Portfolios under the Standardised Approach .............................................................................................................................. 33
5. COUNTERPARTY CREDIT RISK ...................................................................................................................................................... 35 6. MARKET RISK .............................................................................................................................................................................. 37
6.1. Stress Testing .............................................................................................................................................................................. 39 6.2. Back testing ................................................................................................................................................................................. 39

National Bank of Greece
Consolidated Pillar III Report
3
Index of tables Table 1: Overview of the quantitative expectations ......................................................................................................................................... 8 Table 2: Rules for Coverage of Expected Losses ............................................................................................................................................... 9 Table 3: Change in Total T1 MRC (as % of overall current) due to Basel III implementation (Source: EBA QIS data – June 2018)................. 11 Table 4: Own Funds Structure ........................................................................................................................................................................ 19 Table 5: Capital Instruments main features ................................................................................................................................................... 19 Table 6: IFRS 9 impact..................................................................................................................................................................................... 21 Table 7: Transitional Own Funds .................................................................................................................................................................... 22 Table 8: EU OV1 - Overview of RWAs ............................................................................................................................................................. 23 Table 9: Leverage ratio ................................................................................................................................................................................... 24 Table 10: EU CR1-A - Credit quality of exposures by exposure class and instrument .................................................................................... 27 Table 11: EU CR1-B - Credit quality of corporate exposures by industry ........................................................................................................ 28 Table 12: EU CR1-C - Credit quality of exposures by geography ..................................................................................................................... 28 Table 13 : EU CR2-A - Changes in the stock of general and specific credit risk adjustments .......................................................................... 29 Table 14 : EU CR2-B - Changes in the stock of defaulted and impaired loans and debt securities ................................................................. 29 Table 15: Credit quality of forborne exposures .............................................................................................................................................. 30 Table 16: Credit quality of performing and non-performing exposures by past due days ............................................................................. 30 Table 17: Performing and non-performing exposures and related provisions .............................................................................................. 31 Table 18 : EU CR3 - CRM techniques – Overview ........................................................................................................................................... 32 Table 19: EU CR4 - Standardised approach - Credit Risk Exposure and CRM effects ...................................................................................... 33 Table 20 : EU CR5 - Standardised approach .................................................................................................................................................... 34 Table 21: EU CCR1 - Analysis of CCR exposure by approach (€ mio) ............................................................................................................. 35 Table 22: EU CCR2 – CVA capital charge (€ mio) ............................................................................................................................................ 35 Table 23: EU CCR8 – Exposures to CCPs (€ mio) ............................................................................................................................................. 36 Table 24: EU CCR3 - Standardised approach - CCR exposures by regulatory portfolio and risk (€ mio) ......................................................... 36 Table 25: EU CCR6 - Credit derivatives exposures (€ mio) .............................................................................................................................. 36 Table 26: EU MR1 – Market risk under the standardized approach (€ mio) ................................................................................................... 38 Table 27: EU MR2-A – Market risk under the IMA (€ mio) ............................................................................................................................. 38 Table 28: EU MR2-B – RWA flow statements of market risk expsoures under the IMA (€ mio) .................................................................... 38 Table 29: EU MR3 – IMA values for trading portfolios (€ mio) ....................................................................................................................... 38 Table 30: Stress test Scenarios ....................................................................................................................................................................... 39 Table 31: Volatility stress test Scenarios ........................................................................................................................................................ 39

National Bank of Greece
Consolidated Pillar III Report
4
List of abbreviations
Abbreviation Definition Abbreviation Definition
ABS Asset-Backed Securities IFRS International Financial Reporting Standards
A-IRB Advanced Internal Ratings Based (Approach) IMA Internal Model Approach
ALCO Asset Liability Committee IRB Internal Ratings Based (approach)
AMC Asset Management Companies IRRBB Interest Rate Risk in the Banking Book
ATHEX Athens Exchange ISDA International Swaps and Derivatives Association
BC Bankruptcy Code IT Information Technology
BCBS Basel Committee on Banking Supervision ITS Implementing Technical Standards
BoG Bank of Greece IVS International Valuation Standards
Bps Basis Point JST Joint Supervisory Team
BRC Board Risk Committee KPI Key Performance Indicator
BRRD Bank Recovery and Resolution Directive LCR Liquidity Coverage Ratio
BU Business Unit LGD Loss Given Default
CCF Credit Conversion Factor LR Leverage Ratio
CCP Code of Civil Procedure M&A Mergers and Acquisitions
CCR Counterparty Credit Risk MDA Maximum Distributable Amount
CCyB Countercyclical Capital Buffer MoB Months on Book
CEBS Committee of European Banking Supervisors MRA Moody's Risk Advisor
CEF Credit Equivalent Factor MRO Main Refinancing Operations
CEO Chief Executive Officer MVU Model Validation Unit
CET1 Common Equity Tier 1 NBG National Bank Of Greece, S.A
CFO Chief Financial Officer NCA National Competent Authority
CMS Collateral Management System NII Net Interest Income
COO Chief Operations Officer NPE Non Performing Exposure
CRD Capital Requirements Directive NPL Non Performing Loan
CRM Corporate Rating Model NPV Net Present Value
CRO Chief Risk Officer NRA National Resolution Authorities
CRR Capital Requirements Regulation NSFR Net Stable Funding Ratio
CSA Credit Support Annex O/N Overnight
CVA Credit Valuation Adjustment OCP Open Currency Position
DGSD Deposit Guarantee Schemes Directive OCR Overall Capital Requirement
Dpd days past due OCW Out-of-Court Workout
DTA Deferred Tax Asset OR Operational Risk
DTC Deferred Tax Credit ORMF Operational Risk Management Framework
EAD Exposure at Default ORR Obligors’ Risk Rating
EBA European Banking Authority O-SII Other Systemically Important Institution
EBITDA Earnings Before Interest, Tax, Depreciation and Amortization
OTC Over-the-counter
EC European Commission P&L Profit and Loss
ECAI External Credit Assessment Institutions P2G Pillar 2 Guidance
ECB European Central Bank P2R Pillar 2 Requirement
ECL Expected Credit Losses PD Probability of Default
EDIS European Deposit Insurance Scheme PE Performing Exposures
EFSF European Financial Stability Facility PMO Project Management Office
EL Expected Loss ppts Percentage points
ELA Emergency Liquidity Assistance PSE Public Sector Entity

National Bank of Greece
Consolidated Pillar III Report
5
Abbreviation Definition Abbreviation Definition
ESM European Stability Mechanism PSI Private Sector Involvement
ETEAN Hellenic Fund for Entrepreneurship and Development
RAF Risk Appetite Framework
EU European Union RCSA Risk and Control Self-Assessment
EVE Economic Value of Equity RTS Regulatory Technical Standards
EVS European Valuation Standards RWA Risk Weighted Assets
EW Early Warning SA Standardized Approach
FBE Forborne Exposures SAU Special Assets Unit
FI Financial Institution SB(L) Small Business (Lending)
F-IRB Foundation internal ratings-based (approach) SEC Securities and Exchange Commission
FRTB Fundamental Review of the Trading Book SL Specialised Lending
FVTOCI Fair Value Through Other Comprehensive Income
SME Small & Medium Enterprises
FVTPL Fair Value Through Profit or Loss SPPI Solely Payments of Principal and Interest
FX Foreign Exchange SPV Special Purpose Vehicle
GAAP Generally Accepted Accounting Principles SRB Single Resolution Board
GGB Greek Government Bond SREP Supervisory Review and Evaluation Process
GHOS Governors and Heads of Supervision SRM Single Resolution Mechanism
GL Guidelines SSM Single Supervisory Mechanism
GFLRM(D) Group Financial & Liquidity Risk Management (Division)
ST Stress Test
GMRA Global Master Repurchase Agreement sVaR Stressed Value at Risk
GORM(D) Group Operational Risk Management (Division) TLAC Total Loss Absorbing Capacity
GRCA(D) Group Risk Control & Architecture (Division) TLTRO Targeted Long-Term Refinancing Operations
G-SII Global Systemically Important Institution TRIM Targeted Review of Internal Models
HFSF Hellenic Financial Stability Fund TSCR Total SREP Capital Requirement
HRRC Human Resources and Remuneration Committee
UBB United Bulgarian Bank
IAS International Accounting Standards VaR Value at Risk
ICAAP / ILAAP Internal Capital / Liquidity Adequacy Assessment Process
VCV Variance-Covariance
ICT Information and Communication Technology

National Bank of Greece
Consolidated Pillar III Report
6
1. INTRODUCTION – GENERAL INFORMATION
National Bank of Greece (the “Bank” or “NBG”) is a financial institution subject to Greek and EU banking legislation. It was founded in 1841 and operated both as a commercial bank and as the official state currency issuer until 1928, when Bank of Greece was established. NBG has been listed on the Athens Stock Exchange since 1880.
The Bank focuses on complying fully with the regulatory requirements and ensures that these requirements are strictly and consistently met in all countries where NBG Group (the “Group”) operates.
NBG Group offers a wide range of financial services, including retail and corporate banking, asset management, real estate management, financial, investment and insurance services. The Group operates in Greece, the United Kingdom, South-eastern Europe (including Cyprus and Malta) and Egypt.
The Bank, as an international organisation operating in a rapidly growing and changing environment, acknowledges its Group’s exposure to banking risks and the need for these risks to be managed effectively. Risk management forms an integral part of the Group’s commitment to pursue sound returns for its shareholders, maintaining the right balance between risks and reward in the Group’s day-to-day operations, in its balance sheet and in the Group’s capital structure management.
1.1. Recent Regulatory Developments
1.1.1. Banking Union
The Main Pillars
Several steps have been made towards the European Banking Union (mandatory for all euro area States). The following are the Banking Union’s constituent elements:
A. The Single Supervisory Mechanism that places the ECB as the central prudential supervisor of financial institutions in the euro area. Since November 2014 NBG Group’s supervision is assigned directly to the ECB, as NBG is classified as one of the significant banking groups of the Eurozone;
B. The Single Resolution Mechanism (“SRM”) that implements the EU-wide Bank Recovery and Resolution Directive (BRRD – see next paragraph) in the euro area. The centralised decision-making is built around the Single Resolution Board (“SRB”) and the relevant National Resolution Authorities;
C. The Single Rulebook, a single set of harmonised prudential rules for institutions throughout the EU. Its three basic legal documents are:
o CRD IV: Directive 2013/36/EU of the European Parliament and Council “on access to the activity of credit institutions and the prudential supervision of credit institutions and investment firms”, transposed into Greek legislation by virtue of Law 4261/2014,
o CRR (Capital Requirements Regulation): Regulation (EU) No. 575/2013 of the European Parliament and Council “on prudential requirements for credit institutions and investment firms”, which is legally binding and directly applicable in all Member States, and
o BRRD: Directive 2014/59/EU of the European Parliament and Council “establishing a framework for the recovery and resolution of credit institutions and investment firms”, transposed into Greek legislation by virtue of article 2 of Law 4335/2015.
These documents are complemented by numerous Implementing Technical Standards (ITS), Regulatory Technical Standards (“RTS”), Guidelines (“GL”) and Recommendations issued by the European Banking Authority, which specify particular aspects of the CRD IV, the CRR and the BRRD and aim at ensuring harmonisation in specific areas. EBA’s Technical Standards have to be endorsed by the European Commission (“EC”) and become EU Regulations in order to be legally binding and directly applicable in all Member States.
The CRD IV and the CRR constitute the “Basel III” regulatory framework in the EU.
D. Deposit Guarantee Schemes: Directive 2014/49/EU of the European Parliament and Council “on deposit guarantee schemes” (“DGSD”), transposed into Greek legislation by virtue of Law 4370/2016. A common European Deposit Insurance Scheme (“EDIS”) is intended to be a pillar of the Banking Union. The EC put forward a relevant proposal in November 2015. However, a common system for deposit protection has not yet been established. Work has started on a roadmap for beginning political negotiations. In December 2018, the European Council stated that it will establish a High-level working group with a mandate to work on next steps. The High-level group should report back by June 2019.

National Bank of Greece
Consolidated Pillar III Report
7
EU package of Risk Reduction Measures: CRR2 / CRD5 / BRRD2
Introduction: On November 23rd, 2016, the EC presented a comprehensive package of reforms aimed at amending CRR, CRD IV, as well as the BRRD and the SRM. The package, known as “CRR2/CRD5”, was submitted to the European Parliament and the Council for their consideration and adoption. The Banking Package includes prudential standards adopted by the Basel Committee on Banking Supervision and by the Financial Stability Board (FSB), while its main objective is to reduce risk in the EU banking system.
The Banking Package comprises two regulations and two directives, relating to:
bank capital requirements (amendments to regulation 575/2013 and directive 2013/36/EU),
the recovery and resolution of banks in difficulty (amendments to directive 2014/59/EU and regulation 806/2014).
The Banking Package strengthens bank capital requirements and reduces incentives for excessive risk taking, by including a binding leverage ratio, a binding net stable funding ratio and setting risk sensitive rules for trading in securities and derivatives. In addition, it contains measures to improve banks' lending capacity and facilitate a greater role for banks in the capital markets, such as:
reducing the administrative burden for smaller and less complex banks, linked in particular to reporting and disclosure requirements,
enhancing the capacity of banks to lend to SMEs and to fund infrastructure projects.
The banking package also contains a framework for the cooperation and information sharing among various authorities involved in the supervision and resolution of cross-border banking groups.
Timeline: On 25th May 2018, the ECOFIN Council agreed its mandate to start negotiations with the European Parliament. A first agreement was achieved on the main elements of the banking package and confirmed by the ECOFIN Council on 4 December 2018. EU ambassadors have now endorsed the deal on all risk reduction measures. In late-February of 2019, both the European Council and European Parliament endorsed the deal on the legislation reached by negotiators while in April the European Parliament approved the final agreement on the package of reforms proposed by EC to strengthen the resilience and resolvability of European banks. In 20th May 2019 the relevant legislation 2019/876 was published, and will enter into force on 27 June 2019. Member States will have until 28 December 2020 to amend their local CRD remuneration rules in order to reflect the new CRD V provisions. The changes to the remuneration disclosure provisions under CRR II will take effect in June 2021.
This marks a milestone in the completion of the Banking Union, in the finalisation of the post-crisis regulatory agenda, and in the implementation of international standards. Building on the existing rules, this set of adopted measures will address the remaining challenges to financial stability, while strengthening the global competitiveness of the EU banking sector. This package had already made subject of an agreement during the inter-institutional negotiations with the Council of the EU.
The approved agreement on the package of reforms implements components of the Basel III framework, including the following key aspects:
Proposal for CRR 2 covers the leverage ratio, the net stable funding ratio, requirements for own funds and eligible liabilities, the Standardised Approach for counterparty credit risk (SA-CCR), market risk and the fundamental review of the trading book (FRTB), exposures to central counterparties, exposures to collective investment undertakings, large exposures, reporting and disclosure requirements, and amends European Market Infrastructure Regulation (EMIR or EU Regulation No 648/2012).
Proposal for CRD 5 is on exempted entities, financial holding companies, mixed financial holding companies, remuneration, supervisory measures and powers, and capital conservation measures.
Proposal for SRMR 2 is about loss-absorbing and recapitalisation capacity for credit institutions and investment firms.
Proposal for BRRD 2 is on loss-absorbing and recapitalisation capacity of credit institutions and investment firms and it amends Directive 98/26/EC, Directive 2002/47/EC, Directive 2012/30/EU, Directive 2011/35/EU, Directive 2005/56/EC, Directive 2004/25/EC, and Directive 2007/36/EC.
However, it excludes the package of Basel reforms that was agreed on 7 December 2017 by the Basel Committee on Banking Supervision (“BCBS”) often referred to as ‘Basel IV’ (see relevant section below).
Recovery and Resolution Developments
Announcement of the second part of SRB's annual policy on MREL: On 16th January, 2019, the Single Resolution Board (“SRB”) published the second part of its policy for 2018 for MREL concerning the second wave of resolution plans, i.e. the plans for more complex banks. As for 2018, SRB required a two-step transitional approach to the MREL definition process, with the first part of its policy referring to reorganization plans for Banks that had no binding targets being released in November 2018. The second part introduces a series of new elements to enhance the capacity for bank resolution within the Banking Union, among which: an improved approach for eligible instruments for MREL consolidated targets, increased mandatory subordinate requirements and, finally, the introduction of binding MREL targets at individual level. SRB is expected to review its policy for setting the MREL in 2019 on the basis of the finalization of the RRM package and its publication in the Official Journal of the European Union.

National Bank of Greece
Consolidated Pillar III Report
8
1.1.2. NPE Management Regulatory Framework
ECB Final Guidance on NPLs
On March 15th, 2018, the ECB published the addendum to the ECB Guidance to banks on NPLs. The addendum supplements the qualitative NPL guidance, published on 20 March 2017, and specifies ECB’s supervisory expectations for prudent levels of provisions for new NPLs. The addendum does not bind banks, serving as a basis for the supervisory dialogue between the SIs and ECB Banking Supervision. It refers to loans classified as NPLs after 1 April 2018, in line with the EBA’s definition.
The background to the addendum is that, in line with the CRD IV, supervisors have to assess and address institution-specific risks which are not already covered, or which are insufficiently covered, by the mandatory prudential requirements in the CRR (“the Pillar 1 rules”). Specifically, the existing prudential framework requires supervisors to assess and decide whether banks’ provisions are sufficient and timely from a prudential perspective, while the addendum lays out what ECB Banking Supervision expects in this regard. As with other supervisory expectations, the addendum is complementary to any binding legislation; this includes the proposal for a Regulation amending the CRR as regards minimum loss coverage for non-performing exposures.
The supervisory expectations outlined in the addendum consider the extent to which NPLs are secured. For fully unsecured exposures and unsecured parts of partially secured exposures, it is expected that 100% coverage is achieved within 2 (two) years of the NPE classification. For fully secured exposures and secured parts of partially secured exposures, it is expected that 100% coverage is achieved within 7 (seven) years of the NPE classification, following a gradual path. The expectations for secured exposures adhere to the prudential principle that credit risk protection must be enforceable in a timely manner. The ECB will assess prudential provisioning levels of new NPEs during the supervisory dialogue, considering the quantitative expectations summarised in the following table.
(%) Unsecured part Secured part
After 2 years of NPE vintage 100% -
After 3 years of NPE vintage - 40%
After 4 years of NPE vintage - 55%
After 5 years of NPE vintage - 70%
After 6 years of NPE vintage - 85%
After 7 years of NPE vintage - 100%
Table 1: Overview of the quantitative expectations
The practical implementation of the addendum is to form part of the supervisory dialogue, in which the Joint Supervisory Teams (“JSTs”) discuss with each bank deviations from the provisioning expectations. Thereon, ECB Banking Supervision will decide, on a case-by-case basis, whether supervisory measures are appropriate and if so, which. Banks are required to inform the ECB of any differences between their practices and the prudential provisioning expectations, and the results of this dialogue will be incorporated in the 2021 Supervisory Review and Examination Process (“SREP”). Banks should review their underwriting policies and criteria to reduce the emergence of new NPEs.
NBG, being a bank with elevated levels of NPLs, received a letter from the ECB, as part of normal supervisory activities, containing qualitative elements, focused on ensuring it is managing and addressing NPLs in line with supervisory expectations.
On July 11th, 2018, the ECB announced additional steps in its supervisory approach to the stock of NPLs. The approach creates a consistent framework for addressing the issue, as part of the supervisory dialogue, through bank-specific supervisory expectations aimed at achieving adequate provisioning of legacy NPLs. This assessment was guided by: i) individual banks’ current NPL ratios, ii) their main financial features, iii) their NPL reduction strategy (if available) and iv) a benchmarking of comparable peers in order to ensure consistent treatment. Most recent data and their capacity to absorb additional provisions was also considered. All SIs have been assessed with the aim of setting bank-specific expectations so as to ensure continued progress in reducing legacy risks and the same coverage of the stock and flow of NPLs over the medium term.
On August 22nd, 2019 the ECB published a communication letter to provide transparency in respect of the ECB’s supervisory expectations regarding banks’ treatment of NPLs, following an assessment of the interaction between its approach to NPEs under Pillar 2 and the new EU regulation that outlines the Pillar 1 treatment of NPEs, where NPLs arising from loans originated after 26 April 2019 in principle are subject solely to Pillar 1 treatment. In order to enhance the consistency and simplicity of the overall approach to NPEs, and, after summarizing related policies and measures, the communication document (i) clarifies aspects relating to the EBA’s publication of NPE-related guidelines; (ii) provides further details regarding the ECB’s supervisory expectations for provisioning of NPE stock; (iii) clarifies the interaction between ECB’s NPE coverage expectations under Pillar 2 and the Pillar 1 prudential rules, and (iv) summarises adjustments to the Pillar 2 approach in respect of supervisory expectations for prudential provisioning for new NPEs under the scope of the above Addendum. More specifically:
1. The scope of the ECB’s supervisory expectations for new NPEs will be limited to NPEs arising from loans originated before 26 April 2019, which are not subject to Pillar 1 NPE treatment. NPEs arising from loans originated from 26 April 2019 onwards will be subject to Pillar 1 treatment, with the ECB paying close attention to the risks arising from them.
2. The relevant prudential provisioning time frames, the progressive path to full implementation and the split of secured exposures, as well as the treatment of NPEs guaranteed or insured by an official export credit agency, have been aligned with the Pillar 1 treatment of NPEs set out in the new EU regulation.

National Bank of Greece
Consolidated Pillar III Report
9
3. All other aspects, including specific circumstances, which may make prudential provisioning expectations inappropriate for a specific portfolio/exposure, remain as described in the Addendum.
4. Supervisory expectations for the stock of NPEs (i.e. loans classified as NPEs on 31 March 2018) remain unchanged, as communicated in the Supervisory Review and Evaluation Process letters sent to banks and in the press release in July 2018.
5. Despite recent progress in NPLs stock decrease, the ECB considers it of the utmost importance that the level of NPLs is further reduced, thereby resolving them in a swift manner while economic conditions are still favourable.
European Commission proposals for NPLs
On March 14th, 2018, the Commission proposed an ambitious and comprehensive package of measures to tackle NPLs in Europe, capitalising on the significant progress already made in reducing risks in the banking sector. This package sets out a comprehensive approach with a mix of complementary policy actions that target the following four key areas:
Ensuring that banks set aside funds to cover the risks associated with loans issued in the future that may become non-performing.
Encouraging the development of secondary markets where banks can sell their NPLs to credit servicers and investors.
Facilitating debt recovery, as a complement to the insolvency and business-restructuring proposal put forward in November 2016.
Assisting Member States in the restructuring of banks, by providing non-binding guidance for establishing Asset Management Companies (“AMCs”) or other measures dealing with NPLs.
With this package, the Commission is delivering on the European Council's Action Plan to address the high stock of NPLs and prevent their possible future accumulation.
On December 14th, 2018, the Council and the European Parliament agreed a new framework for dealing with banks' bad loans. They reached a provisional political agreement on capital requirements applying to banks with NPLs on their balance sheets. The proposal aims at creating a prudential framework for banks to deal with new NPLs and thus to reduce the risk of their accumulation in the future. Specifically, it provides for requirements to set aside sufficient own resources when new loans become non-performing and creates appropriate incentives to address NPLs at an early stage.
On the basis of a common definition of NPLs, the proposed new rules introduce a "prudential backstop", i.e. common minimum loss coverage for the amount of money banks need to set aside to cover losses caused by future loans that turn non-performing. In case a bank does not meet the applicable minimum level, deductions from banks' own funds would apply. Further, the agreed framework introduces a uniform calendar, as shown in the table below, which applies irrespective of the trigger of the non-performance. For unsecured NPLs, a calendar of three years should apply. For secured NPLs, a progressive calendar of seven or nine years would apply, depending on the collateral type. In all cases, full coverage should ultimately be built up.
Period Final Agreement
Unsecured Secured Secured Immovable Other CRR eligible
After 1 year 0% 0% 0%
After 2 years 35% 0% 0%
After 3 years 100% 25% 25%
After 4 years 35% 35%
After 5 years 55% 55%
After 6 years 70% 80%
After 7 years 80% 100%
After 8 years 85% 100%
After 9 years 100% 100%
Table 2: Rules for Coverage of Expected Losses
On January 14th, 2019, the ECOFIN and the European Parliament reached an agreement on the Commission’s proposal for a Regulation concerning minimum loss coverage for (new) NPEs. This Regulation sets out more lenient arrangements compared to the ECB’s Addendum with respect to the:
Perimeter: the Regulation applies to exposures originated after its entry into force (expected in the following months), while the ECB’s Addendum applies to NPEs classified as such after 1 April 2018, and
Timeline for full coverage: the Regulation requires full coverage for the secured part of NPEs within 9 years (part secured by immovable property) or 7 years (part of NPEs secured by other collateral), while ECB Addendum requires full coverage within a 7 year period for the secured part of NPEs. (The provision calendar under the Regulation is as per Table 2 outlined above.)
It should be noted that the Regulation allows supervisory authorities to apply (on a case-by-case basis) stricter requirements compared to those included in the Regulation. Hence, the ECB would probably continue applying the Addendum. In addition, pursuant to the Regulation:
Common criteria for the classification of NPEs and forborne exposures (for the purposes of the prudential backstop) are established,
The prudential backstop should be applied on an exposure-by-exposure level,
If forbearance measures are applied to non-performing exposures, the coverage requirement should remain stable during one additional year.

National Bank of Greece
Consolidated Pillar III Report
10
On April 17th, 2019, the European Parliament following a provisional version of amendments (March 14th, 2019) and its approval by the Council of the European Union adopted the Regulation amending the CRR as regards minimum loss coverage for NPEs, amending as appropriate the respective Articles of the CRR. The new regulation complements existing prudential rules and requires a deduction from own funds when NPEs are not sufficiently covered by provisions or other adjustments.
Greece’s NPL Legislative Update
Electronic Auctions – Law 4512/2018
Since 21.2.2018, all auctions of real estate properties take place electronically, through the special platform of the Notaries Association, www.eauction.gr. By virtue of the Law 4512/2018, the physical auctions were completely abolished. The electronic platform has significantly enhanced the management and the efficiency of the liquidation effort.
Amendments on Law 4307/2014
By means of Law 4599/2019, minor amendments were made to Special Administration Process prescribed in L. 4307/2014. In particular:
The duration of the whole process was prolonged to 18 months, instead of 12, along with a provision for an optional six month extension, upon court approval.
The special administrator is entitled to trade company assets with third party assets of the same value, as estimated by certified assessors listed to the Ministry of Finance Registry.
The company under special liquidation is exempt from the obligation to provide Tax and Social Security clearance certificates, as to transfers of assets, loans, credits, and financing of any kind, as well as any other transaction with the Public Sector, during the special administration period.
Law 4512/2018 Exceptional ranking provisions on Code of Civil Procedure and Bankruptcy Code
Pursuant to art. 176 of the said Law, two “mirror” provisions, art. 977A and 156A are established in Code of Civil Procedure and Bankruptcy Code, respectively.
According to the provisions, a different and separate ranking of creditors takes place upon fulfilment of the following cumulative conditions:
o Secured claims arising (granted) from 18.01.2018 onwards
o Security established on asset to be liquidated from 18.01.2018 onwards, securing the aforementioned claims
o Security established on asset free of burden on 18.01.2018
In this case, a quantitively limited (up to 9.670,32 euros per employee) superseniority labor claim is acknowledged, which supersedes any other claim. Upon satisfaction of the said claim, secured creditors are satisfied in full, followed by preferential and unsecured creditors, consecutively. The former class excludes the latter until exhaustion of auction/liquidation proceeds.
Amendment of provisions of Law 4354/2015 on assignment and transfer of Non-Performing Loan/claims (NPLs)
Pursuant to art. 69 par. 2 Law 4549/2018 (by virtue of which art. 3 par 2 of Law 4354/2012 was amended), the Bank’s obligation to send to the debtors a settlement proposal according to the Code of Conduct prior to the loan transferring was restricted only in cases that the debtor is considered as Consumer (as per art. 1a of Law 2251/1994).
Law 4549/2018: settlement of State guaranteed loans.
Pursuant to art. 103 of the said Law, the Banks are authorized to proceed with the settling of State guaranteed loans with the debtors without being obliged anymore to request the State’s prior consent to the settlement scheme. The exact terms and conditions of such debt settling (so that the State’s guarantee remains valid in favor of the Bank) are provided for by the Ministerial Decision 2/9/2018.
Law 4605/2019: primary residence protection law
During 2019, the Greek Parliament voted a new law as a successor for L.3869/2010. The new Law 4605/2019 (L.4605) protects the primary residence of individuals (with or without the capacity to be declared bankrupt i.e. both merchants and non-merchants) in financial difficulty, while a restructuring schedule will be proposed by the creditors.
The procedure will be implemented electronically, through an online platform, while a pre-screening for eligibility will take place, before the final application shall be submitted.
Briefly, the main eligibility criteria for the new L.4605 are the following:
o The total outstanding debt (including principal and compound interest on the debt) that is eligible to be restructured must not exceed €130k
o The property value must not exceed €250k or €175k if the underlying loan is related to SBL
o There is an annual income criterion that starts at €12,5k for the single-person household and is increased by €8,5k for the spouse and €5k for each protected member up to a maximum of €36k
o Additional immovable property must not exceed €80k, including means of transport
o Cash deposits must not exceed €15k

National Bank of Greece
Consolidated Pillar III Report
11
The terms of restructuring schedule include:
o Haircut to loans with an LTV>120%, so that the new LTV after haircut equals 120%
o Extension up to 25 years
o Interest rate of 2% plus Euribor
o Subsidy from Hellenic Republic, ranging from 30%-50% (based on the borrower’s income capacity) of the loan installment
In light of the widely recognized deficiencies of the L.3869, L.4605 has been designed in order to actually protect financially distressed individuals, without, at the same time, hindering the Banks’ effort to reduce their NPE stock. In fact, the implementation of the L.4605 is expected to contribute to the deleveraging of the stock of NPEs in the banking system.
1.1.3. Basel 4 (finalisation of Basel 3)
Revision of Market Risk minimum capital requirements (Fundamental Review of the Trading Book)
As of January 2016, the first iteration of FRTB appeared, with its core features including: a clearly defined boundary of the trading and the banking book; an internal models approach with separate capital requirements for risk factors that cannot be modelled; and a standardized approach that is risk-sensitive and designed and calibrated as a credible fallback to the internal models approach.
On January 14th, 2019, the Basel Committee's oversight body (“GHOS”), endorsed a set of revisions to the market risk framework. The changes were initially proposed in a March 2018 consultative document, informed by a quantitative impact based on end 2017 data. (On February 25th, 2019, a corrected version was published to address typos.) The revisions to the FRTB framework include the following key changes:
a simplified standardized approach for banks with small or non-complex trading portfolios,
clarifications on the scope of exposures that are subject to market risk capital requirements,
refined standardised approach treatments of foreign exchange risk and index instruments,
revised standardised approach risk weights applicable to general interest rate risk, foreign exchange and certain exposures subject to credit spread risk,
revisions to the assessment process to determine whether a bank's internal risk management models appropriately reflect the risks of individual trading desks, and
revisions to the requirements for identification of risk factors eligible for internal modelling.
The revised market risk framework will take effect as of 1 January 2022, estimated to result in a weighted average increase of about 22% in total market risk capital requirements relative to the Basel 2.5 framework.
Impact of Basel 4 in EU banks
On March 20th, 2019, EBA published a Basel III capital monitoring report which includes a preliminary assessment of the impact of fully implementing the final Basel III reforms on EU Banks. It quantifies the impact on credit risk, operational risk, leverage ratio, introduction of aggregate output floor, market risk (FRTB) and CVA, as per table below:
Bank Group Credit Risk Market
Risk CVA
Op Risk
Output floor
Total Risk-based
Revised LR
Total SA IRB Sec. CCPs
All Banks 2.2 2.0 0.7 0.0 2.3 4.7 5.5 8.0 25.4 -6.2 19.1
Group 1 1.8 1.7 0.8 0.0 2.5 4.9 6.1 8.5 26.3 -6.0 20.3
of which: G-SIIs 2.2 2.1 1.1 0.0 3.3 5.4 7.4 7.3 28.8 -0.3 28.4
Group 2 4.3 3.7 0.1 0.0 0.9 3.6 1.7 5.1 19.4 -7.7 11.8
Table 3: Change in Total T1 MRC (as % of overall current) due to Basel III implementation (Source: EBA QIS data – June 2018)
Overall, the EBA, based on a Basel III monitoring exercise performed with data as of 30 June 2018 estimates that the Basel III reforms would lead to an average increase by 19.1% of EU banks' T1 minimum required capital at full implementation (2027). To comply with Basel 4, banks would need EUR 39 billion of additional total capital, of which EUR 24.2 billion of T1 capital. Nevertheless, the implementation of Basel III finalized reforms in the EU is at the discretion of the EU legislative authorities and will require amendments to current banking regulations, predominantly the CRR (Regulation (EU) No 575/2013).
1.1.4. Pillar 2 (SREP, ICAAP, ILAAP)
ECB Guides on ICAAP/ILAAP
Banks submit ICAAP and ILAAP information packages to the SSM on a yearly basis. The SSM takes those packages into account in its annual assessment as part of the SREP.
On February 20th, 2017, the ECB initiated a multi-year project to develop comprehensive Guides on ICAAP and ILAAP for SIs. On March 2nd, 2018 the ECB launched a public consultation on draft Guides on ICAAP and ILAAP, while on November 9th, 2018, the ECB published the final

National Bank of Greece
Consolidated Pillar III Report
12
guides. The guides, which are not legally binding, are applicable from 1 January 2019 when assessing bank internal capital and liquidity adequacy assessment process. Banks are expected to assess the risks they face, and ensure, in a forward-looking manner, that all material risks are identified, effectively managed and covered by adequate capital and liquidity levels at all times. The ICAAP and ILAAP are, above all, internal processes and remain the responsibility of individual institutions to implement in a proportionate manner (i.e. the ICAAP and ILAAP have to be aligned to the institution’s business model, size, complexity, riskiness, market expectations, etc.).
As mentioned in a newsletter article published by ECB on February 13th, 2019, the ICAAP and ILAAP are expected to play an even greater role in the SREP in the future, which should encourage and incentivise banks to continuously improve these processes. Among others, both the qualitative and quantitative aspects of the ICAAP – the latter focusing on identifying and quantifying risks – could play an enhanced role in the calculation of additional capital requirements on a risk-by-risk basis.
Below are the seven ECB principles, finalized with the guides of ICAAP and ILAAP published in November 2018:
Principle 1: The management body is responsible for the sound governance of the ICAAP/ILAAP.
Principle 2: The ICAAP/ILAAP is an integral part of the overall management framework.
Principle 3: The ICAAP/ILAAP contribute fundamentally to the continuity of the institution by ensuring its capital/liquidity adequacy from different perspectives.
Principle 4: All material risks are identified and taken into account in the ICAAP/ILAAP.
Principle 5: For ICAAP the internal capital is of high quality and clearly defined. For ILAAP the internal liquidity buffers are of high quality and clearly defined: the internal stable sources of funding are clearly defined.
Principle 6: ICAAP/ILAAP risk quantification methodologies are adequate, consistent and independently validated.
Principle 7: Regular stress testing aims at ensuring capital/liquidity adequacy in adverse circumstances.
Institutions are encouraged to address any gaps or weaknesses in their ICAAPs and ILAAPs in close dialogue with their JST and the ECB.
EBA Pillar 2 Guidelines: SREP / IRRBB / Stress Testing
The SREP is the key mechanism by which supervisors review the risks not covered, or not fully covered, under Pillar 1 and decide whether capital and liquidity resources are adequate. Its main constituents are: (i) the business model assessment, (ii) the governance and risk management assessment, (iii) the assessment of risks to capital (including ICAAP) and (iv) the assessment of risks to liquidity and funding (including ILAAP). Supervisors can use the SREP to decide that additional Pillar 2 capital is required, as a new minimum, where Pillar 1 does not capture the risks adequately.
On July 19th, 2018, EBA published its final guidance in order to strengthen the EU’s Pillar 2 framework. These final revised Guidelines are aimed at further enhancing institutions' risk management and supervisory convergence in the SREP. The three Guidelines are the following:
1. Final Report on the Guidelines on the revised common procedures and methodologies for SREP and supervisory stress testing: The changes to the SREP Guidelines do not alter the overall SREP framework and mainly aim to enhance the requirements for supervisory stress testing and explain how stress testing results will be used in setting the Pillar 2 Guidance (P2G). The changes and additions outlined in the Final Report, include: i) a section on P2G, ii) supervisory stress testing requirements, iii) a clarification on the scoring framework and iv) consistency checks with relevant EBA standards and guidelines, in particular in the areas of internal governance and institution-wide controls assessment.
2. Revised final Guidelines on the management of interest rate risk arising from non-trading activities (IRRBB Guidelines): The revised IRRBB Guidelines reflect developments in the BCBS and clarify internal governance and supervisory outlier tests requirements during the first phase of the European implementation of the Basel standards. The revisions are intended to link to future requirements, which will be incorporated in the CRD5/CRR2 framework.
The revised Guidelines replace the existing Guidelines and will be applicable from 30 June 2019 with transitional arrangements for specific provisions until 31 December 2019.
3. Revised final Guidelines on institutions' stress testing: The revised IRRBB Guidelines reflect developments in the Basel Committee on Banking Supervision (BCBS) and clarify internal governance and supervisory outlier tests requirements during the first phase of the European implementation of the Basel standards. The revisions are, therefore, intended to act as a bridge to the future requirements, which will be incorporated in the CRD5/ CRR2 framework.
The revised Guidelines replace the existing Guidelines, being applicable from January 1st, 2019.
1.1.5. Internal Models
ECB guide to internal models
On November 15th, 2018, the ECB published the first chapter of its guide to internal models, following a public consultation that ended on May 28th, 2018. This first chapter refers to general topics and contains principles that are not risk-type-specific, in particular for the IRB approach: overarching principles; roll-out and permanent partial use of the IRB approach; internal governance; internal validation; internal audit; model use; management of changes and third-party involvement. Each topic also includes regulatory references to other published documents (i.e. CRR, CRD IV, RTS etc.).

National Bank of Greece
Consolidated Pillar III Report
13
On September 7th, 2018, ECB launched public consultation in regards to the three risk-type-specific chapters of its guide to internal models, on credit risk, market risk and counterparty credit risk. The chapters provide transparency as to how ECB understands the applicable regulations for using internal models to calculate own fund requirements for credit risk, market risk and counterparty credit risk.
The guide draws on experience gained from on-site TRIM investigations during 2017 and 2018.
Definition of Default
The EBA Guidelines on definition of default will apply from 1 January 2021, but the EBA encourages institutions to implement changes prior to this date, as they will have to adapt their default identification processes and IT systems. This is the case for institutions that use the IRB approach, as they should start building reliable time series before their rating systems can be adjusted.
In the meantime, the ECB launched a process for the implementation of the new definition of default within the SSM for significant institutions using the IRB Approach. In specific, the ECB process aims to take into account the needs of institutions for a manageable and streamlined process that would allow them to finalise the effective implementation of the revised IRB approach framework by the end of 2020, as required by the EBA. The envisaged approach (called the “Two-Step Approach”) proposes the following two sequential steps:
1. The implementation of the new definition of default: Institutions are encouraged to focus on the alignment of processes, procedures and IT systems used for the identification of defaults against the new definition of default, which will enable them to start collecting real default data in a manner that is compliant with the new definition of default as soon as possible. Further, this step encourages institutions to submit the ECB templates required, when requesting a material change to their rating system.
2. The adjustments to risk parameters to take into account the new definition of default and other necessary evolutions: Entails full adjustment of rating systems by institutions considering the necessary changes to the definition of default, other EBA IRB review, as well as follow-up from previous internal model investigations, such as TRIM missions.
It should be noted that the changes expected in reference to the definition of default arise from the implementation of EBA’s two regulatory products, namely: The RTS on materiality threshold for credit obligations past due under Article 178 of the CRR and the EBA Guidelines on the application of the definition of default under Article 178 of Regulation (EU) No 575/20132 (EBA/GL/2016/07).
On November 21th, 2018, ECB published the Regulation on the materiality threshold for credit obligations past due for all SIs within SSM, both for retail and for non-retail exposures. The materiality threshold will comprise an absolute component, expressed as a specific maximum amount for the sum of all amounts past due owed by an obligor, and a relative component, expressed as a percentage of the amount of credit obligation past due in relation to the total amount of all on-balance sheet exposures to that obligor. By setting a single materiality threshold, the ECB Regulation improves the comparability of RWAs and defaulted exposures across SIs.
Loss Given Default (LGD)
On November 16th, 2018, EBA published its final draft RTS specifying the nature, severity and duration of an economic downturn via macroeconomic or credit-related factors that are explanatory variables or indicators for the business cycle of the considered type of exposure. Given the specificities of the types of exposures covered by a rating system, the economic downturn should be identified separately for each rating system. Its severity is specified by the most severe observations on the factors constituting the nature of an economic downturn, based on historical values of these factors over the last 20 years. Its duration is specified as the 12-month period where the most severe values are observed within the identified downturn periods.
Following the specification of a downturn period mentioned in the final draft RTS, on March 6th, 2019, EBA published its final Guidelines specifying how institutions should quantify the estimation of LGD appropriate for conditions of an economic downturn. The final Guidelines set out requirements for the appropriate quantification of the calibration target used for downturn LGD estimates and include:
Type-1 approaches to be applied when banks have sufficient loss data for the identified downturn period,
Type-2 approaches to be applied when banks do not have sufficient loss data for the downturn period, and choose between the so-called haircut or extrapolation approaches,
Type-3 approaches to be applied in rare cases, where banks have to apply a minimum margin of conservatism (MoC) requirement of 15 percentage points on LGD estimates.
These Guidelines will apply as of 1 January 2021, at the latest. In the meantime, on June 1st, 2018, in a joint letter of ECB and EBA concerns were raised in regards to the LGD waivers under the IRB. (As the disposal of NPLs and corresponding capital release is assumed to be hampered by the design of the regulation for internal models, in specific by the requirements for LGD estimation, it has been proposed by some banks that the losses due to NPLs sale would be fully and permanently eliminated from the dataset used for LGD estimation).
Nevertheless, based on Article 500 (titled “Adjustment for massive disposals”), published in February 14th, 2019 by the Council, an LGD waiver is foreseen by the CRR2. Specifically, it is stated that: “an institution may adjust its LGD estimates by partly or fully offsetting the effect of massive disposals of defaulted exposures on realised LGDs up to the difference between the average estimated LGDs for comparable exposures in default that have not been finally liquidated and the average realised LGDs including on the basis of the losses realised due to the massive disposals.”
1.1.6. Liquidity Stress Test 2019 (LiST 2019)
On February 6th, 2019, the ECB launched a sensitivity analysis of liquidity risk (referred as “LiST 2019”) to assess the ability of the banks it directly supervises, to handle idiosyncratic liquidity shocks. The results of this Stress Test will feed into the ECB’s ongoing supervisory assessments of banks’ liquidity risk management frameworks, including the SREP. However, the outcome of the stress test will not affect supervisory capital and liquidity requirements in a mechanical way.

National Bank of Greece
Consolidated Pillar III Report
14
In the exercise, banks have to simulate the impact of idiosyncratic liquidity shocks on their expected cash flows over a six-month stress horizon. These shocks are identical for stronger and weaker banks and disregard any differences related to the economic environment in which they operate. Specifically, banks are asked to simulate the impact of (i) an adverse shock and (ii) an extreme shock, in which they face liquidity outflows of increasing intensity. The exercise will focus on banks’ expected short-term cash flows to calculate the “survival period”, which is the number of days that a bank can continue to operate using available cash and collateral with no access to funding markets. Banks are also requested to submit their benchmark expected cash flows under (iii) a “baseline” case, in which they honour all their contractual commitments with wholesale counterparties and face no liquidity inflows or outflows from traditional lending and deposit-taking activities.
The exercise also assesses other key aspects of liquidity risk management, namely intragroup liquidity flows, liquidity flows by currency and the ability of banks to mobilize collateral from existing assets.
The sensitivity analysis, which is expected to be completed in four months, will focus only on the potential impact of idiosyncratic liquidity shocks on individual banks. It will not assess the potential causes of these shocks or the impact of wider market turbulence. The exercise will be carried out without any reference to monetary policy decisions and the aim is for banks to discuss their individual results as part of the SREP Supervisory dialogue in the second half of 2019.
1.1.7. BCBS 239
In January 2013, the Bank for International Settlements BCBS published the “Principles for effective risk data aggregation and risk reporting”. The overall objective of the guidelines is to strengthen banks' risk data aggregation capabilities and internal risk reporting practices. Implementation of the principles is expected to strengthen risk management at banks – in particular, “globally significant banks” (“G-SIBs”) – thereby enhancing their ability to cope with stress and crisis situations. The guidelines were initially intended to turn into regulation for G-SIBs at the beginning of 2016 and to apply to other domestic systemically important banks three years later.
However, in May 2018, ECB published a report on the thematic review on effective risk data aggregation and risk reporting, which shows that the implementation status of the BCBS 239 principles within a sample of 25 SIs is unsatisfactory. Thus far, none of those SIs – some of which are classified as global systemically important banks – have fully implemented the BCBS 239 principles. Weaknesses stem mainly from a lack of clarity regarding responsibility and accountability for data quality. In specific, it seems difficult to comprehend what the roles and responsibilities of business, control and IT functions are. Hence, further efforts will be needed in the coming years so as to enhance the effectiveness of risk data aggregation and reporting.
Furthermore, in June 2018, the BCBS issued a progress report on banks' implementation of the Principles for effective risk data aggregation and reporting. The assessment covered 30 G-SIBs and notes that in 2017 most G-SIBs made, at best, marginal progress in implementing the Principles. In specific, G-SIBs have found it challenging to comply with the Principles, mainly due to the complexity and interdependence of IT improvement projects.
In view of these results, the BCBS made the following recommendations:
Banks to continue the implementation of the Principles based on the roadmaps agreed with their supervisors and consider how this can benefit other data-related initiatives, and
Supervisors to maintain emphasis on ensuring that banks fully implement the Principles including meeting with banks' BoDs and/or senior management and promoting home-host cooperation in relation to the implementation of the Principles by global banking groups.
NBG has initiated a “Data Governance Program” to tackle with 11 overarching principles for effective risk data aggregationn, governance and reporting. In this context, NBG has conducted a current state assessment to justify its level of compliance against regulatory requirements, and identify critical areas to be adjusted in line with the best practices.
The Bank, despite starting BCBS 239 implementation later than other European peers satisfies, to a large extent, the requirements on comprehensive, clear, useful, frequent and widely-distributed risk management reporting. This is primarily achieved through strategic decisions of the Bank in improving internal governance, IT infrastructure and initiatives in preparing for regulatory demands, such as TRIM, ICAAP/ILAAP, Stress Tests and AQR exercises.
Additionally, NBG has defined and will implement a set of mitigating actions pertaining to governance, automation and documentation to reach a state of material compliance. These actions will run in parallel (and in conjunction) with the Bank’s on-going “Data Governance” initiative and include improvements in automation in data management and reporting processes, the creation of a formal process for measuring and documenting data quality across the reporting process, the setup of Service Level Agreements (SLAs), the establishment of BCBS 239 validation processes and the standardisation of documentation for risk reporting.
1.1.8. Other regulatory developments
New Securitisation framework
On December 12th, 2017, the European Parliament and the Council of the EU issued the Regulation (EU) 2017/2402 in reference to a general framework for securitisation, creating a specific framework for simple, transparent and standardised (“STS”) securitisations, and amending Directives 2009/65/EC, 2009/138/EC and 2011/61/EU and Regulations (EC) No 1060/2009 and (EU) No 648/2012. Securitisation is an important element of well-functioning financial markets, while soundly structured securitisations are an important channel to diversify sources and allocate risk more widely within the Union. The newly established framework for STS securitisations is in effect from January 1st, 2019 and applies only to securitisations taking place after this date, irrespective of the institution’s status as originator or investor.

National Bank of Greece
Consolidated Pillar III Report
15
Further, on December 12th, 2017, the European Parliament and the Council of the EU issued the Regulation (EU) 2017/2401 amending Regulation the CRR on prudential requirements for credit institutions and investment firms.
EBA Guidelines on Outsourcing
On February 25th, 2019, EBA published its revised Guidelines on outsourcing arrangements setting out specific provisions for the governance frameworks of all financial institutions within the scope of its mandate with regard to their outsourcing arrangements. The aim is to establish a more harmonised framework for credit institutions and investment firms subject to the CRD, as well as payment and electronic money institutions.
The Guidelines ensure that institutions can apply a single framework on outsourcing for all their banking, investment and payment activities and services. The revised Guidelines are consistent with the requirements on outsourcing under the Payments Services Directive (PSD2), the Markets in Financial Instruments Directive (MiFID II) and the Commission's Delegated Regulation (EU) 2017/565.
EBA consultation on Guidelines on ICT and security risk management
On December 13th, 2018, EBA launched a consultation on its draft Guidelines on information and communication technology (“ICT”) and security risk management. It includes requirements for credit institutions and investment firms, as well as payment service providers (PSPs) on the mitigation and management of all their ICT risks, including security related risks, and aim to ensure a consistent and robust approach across all financial institutions. The consultation process runs until 13 March 2019.
1.1.9. International Financial Reporting Standards 9 (IFRS 9)
On 1 January 2018, the Group adopted IFRS 9, Financial Instruments, which replaces IAS 39 Financial Instruments: Recognition and Measurement and changes the requirements for classification and measurement of financial assets and financial liabilities, impairment of financial assets and hedge accounting.
The key requirements of IFRS 9 are the following:
1. All recognised financial assets that are within the scope of IAS 39 are required to be subsequently measured at amortised cost or fair value.
2. Specifically, debt instruments that are held within a business model whose objective is to collect the contractual cash flows (rather than to sell the instrument prior to its contractual maturity to realise its fair value changes) and that have contractual cash flows that are solely payments of principal and interest on the principal outstanding (SPPI) are generally measured at amortised cost at the end of subsequent accounting periods.
3. Debt instruments that are held within a business model whose objective is achieved both by collecting contractual cash flows and selling financial assets, and that have contractual terms that give rise on specified dates to cash flows that are SPPI, are measured at FVTOCI, unless the asset is designated at “fair value through profit or loss” (FVTPL) under the fair value option.
4. All other debt instruments and equity investments are measured at their fair value at the end of subsequent accounting periods. In addition, under IFRS 9, entities may make an irrevocable election to present subsequent changes in the fair value of an equity investment (that is not held for trading) in other comprehensive income, with only dividend income generally recognised in profit or loss.
With regard to the measurement of financial liabilities designated as at FVTPL, IFRS 9 requires that the amount of change in the fair value of the financial liability, that is attributable to changes in the credit risk of that liability, is presented in other comprehensive income, unless the recognition of the effects of changes in the liability's credit risk in other comprehensive income would create or enlarge an accounting mismatch in profit or loss. Changes in fair value attributable to a financial liability's credit risk are not subsequently reclassified to profit or loss. Under IAS 39, the entire amount of the change in the fair value of the financial liability designated as FVTPL is presented in profit or loss.
In relation to the impairment of financial assets, IFRS 9 requires an ECL model, as opposed to an incurred credit loss model under IAS 39. The ECL model requires an entity to account for ECL and changes in ECL at each reporting date to reflect changes in credit risk since initial recognition. In other words, it is no longer necessary for a credit event to have occurred before credit losses are recognised. With the exception of purchased or originated credit-impaired financial assets, ECL are required to be measured through a loss allowance at an amount equal to:
the 12-month ECL (ECL that result from those default events on the financial instrument that are possible within 12 months after the reporting date), or
full lifetime ECL (ECL that result from all possible default events over the life of the financial instrument).
A loss allowance for full lifetime ECL is required for a financial instrument if the credit risk of that financial instrument has increased significantly since initial recognition. Purchased or originated credit-impaired financial assets are treated differently because the asset is credit-impaired at initial recognition. For these assets, the reporting entity recognizes changes in lifetime ECL since initial recognition as a loss allowance with any changes recognised in profit or loss. Under the requirements, any favorable changes for such assets are an impairment gain even if the resulting expected cash flows of a financial asset exceed the estimated cash flows on initial recognition.
The new general hedge accounting requirements retain the three types of hedge accounting mechanisms currently available in IAS 39. Under IFRS 9, greater flexibility has been introduced to the types of transactions eligible for hedge accounting, specifically broadening the types of instruments that qualify for hedging instruments and the types of risk components of non-financial items that are eligible for hedge accounting. In addition, the effectiveness test has been overhauled and replaced with the principle of an “economic relationship”.

National Bank of Greece
Consolidated Pillar III Report
16
Retrospective assessment of hedge effectiveness is also no longer required. Enhanced disclosure requirements about an entity’s risk management activities have also been introduced. IFRS 9 includes an accounting policy choice to continue IAS 39 hedge accounting, which the Group has exercised.
For more details and information on the accounting policies and critical judgments applied by the Group in order to comply with the requirements of IFRS 9, please refer to Notes 2.7 and 3, of the 2018 Annual Financial Report, respectively.
Regulatory transitional arrangements
On 12 December 2017 the European Parliament and the Council of the European Union adopted Regulation (EU) 2017/2395, which amended Regulation 575/2013 with Article 473a, allowing credit institutions to gradually apply the impact of the application of IFRS 9 to own funds. In particular, upon adoption of IFRS 9, credit institutions are allowed to include in the Common Equity Tier 1 capital (CET1), a portion of the increased ECL provisions over a 5-year transitional period starting in 2018. The portion of ECL provisions that can be included in CET1 should decrease over time down to zero to ensure the full implementation of IFRS 9, after the end of the transitional period. In addition, in accordance with paragraph (4) of the aforementioned Regulation, if the ECL provisions for Stages 1 and 2 incurred after the first adoption of IFRS 9 are increased, credit institutions are allowed to include the increase in the transitional arrangements. The Group decided to apply the transitional arrangements set out in Article 1 of the Regulation, including the provisions of paragraph (4), during the transitional period.
Roadmap on IFRS9 and IFRS9 benchmarking exercise
The European Banking Authority published its IFRS 9 roadmap providing a comprehensive overview of planned monitoring activities on IFRS 9 implementation. The EBA is scrutinising the effective implementation of IFRS 9 in the European Union. In doing so, it has already conducted several exercises on the standard’s impact on EU institutions and has communicated preliminary observations on the first stages of implementation, while a deeper analysis is ongoing. This roadmap is intended to provide an overview of the deliverables that the EBA plans to work on in the coming months and years. It also aims to prioritise them and to provide a timeline for their delivery.
The EBA also launched an IFRS 9 benchmarking exercise on a sample of institutions aimed at analysing the different modelling practices followed by institutions and how IFRS 9 implementation impacts the amount of expected credit losses in terms of own funds and regulatory ratios. The objective of this benchmarking exercise is to understand to what extent the use of different methodologies, models, inputs and scenarios could lead to material inconsistencies in ECL outcomes, affecting own funds and regulatory ratios. In particular, further investigation needs to be carried out on the use of macroeconomic scenarios and variables, the adjustments to be made to internal ratings-based (IRB) models when they are used as a starting point and the ways in which banks are managing data shortages. In addition, where simplified approaches are used for ECL modelling, including proxies and overlays decided on by banks, this merits further investigation. Finally, while IRB and standardised approach (SA) banks will be included in the scope of investigation, greater attention may be paid to SA banks at a later stage, owing to their generally more limited modelling experience.
Implementation status
In order to comply with the requirements of the new Standard, the Group established an IFRS 9 implementation program (“the Program”) to ensure a timely and high quality implementation, in accordance with the standard and additional regulatory guidance. The Program involved Finance, Group Risk Control and Architecture Division (“GRCAD”), Management Information and IT Divisions across the Group and was overseen by a Project Steering Committee. The Committee comprised of the Deputy CEO (Chair), Group CFO, Group CRO, Group COO, Group Treasurer and the General Managers of Retail, Corporate Banking, Corporate Special Assets and International Activities Divisions of the Bank. A full-time Project Management Office (PMO) was setup and a Project Manager assigned. The Program was divided into workstreams, for each of which leading Divisions and workgroup teams had been assigned. Subject matter experts were also appointed to assist in model development of IFRS 9 compliant credit risk parameters. The Board Risk Committee, Audit Committee and Board of Directors were regularly updated by the Executive Management on the status of the Program.
Transition to IFRS 9 on 1 January 2018
IFRS 9 was applied retrospectively, but the Group elected not to restate prior periods, in accordance with the transitional provisions of IFRS 9. Further, the Group elected to defer the provisions of IFRS 9 for its insurance subsidiary, Ethniki Hellenic General Insurance SA, as allowed by Commission Regulation (EU) 2017/1988 from 1 January 2018 to 1 January 2021, the adoption date of IFRS 17 Insurance Contracts. On 14 November 2018, the IASB tentatively decided to propose an amendment to IFRS 4 to allow insurers qualifying for deferral of IFRS 9 one additional year of deferral. This would mean that qualifying insurers could apply both standards for the first time in reporting periods beginning on or after 1 January 2022. As of 1 January 2018, Ethniki Hellenic General Insurance SA was classified as a discontinued operation and shall continue applying the requirements of IAS 39 after 1 January 2018.
The adoption of IFRS 9 on 1 January 2018, decreased the Group’s shareholders’ equity by approximately €1.5 billion, of which €1.3 billion, due to changes in impairment requirements and €0.2 billion due to classification and measurement. By applying the regulatory transitional arrangements for 2018, the Group’s and the Bank’s CET1 ratio as at 31 December 2017, decreased by approximately 58bps at 16.4% and 12bps at 16.7% respectively. On a fully loaded basis, as at 31 December 2017 the Group’s CET1 ratio decreased by approximately 373bps at 13.2%, while the Bank’s CET1 ratio decreased by approximately 408bps at 12.8%.

National Bank of Greece
Consolidated Pillar III Report
17
1.2. Pillar III Disclosures policy
Pillar III complements the minimum regulatory capital requirements (Pillar I) and the Internal Capital and Liquidity Adequacy Assessment Processes (ICAAP/ILAAP, i.e. Pillar II). NBG is committed to publicly disclose information in compliance with EU Regulation 575/2013 of the European Parliament and of the Council, as well as all applicable additional EU Regulations and EBA Guidelines, and to have adequate internal processes and systems in place to meet these disclosure requirements.
The Bank has established a Pillar III Disclosures Policy that describes the scope, the principles and the content of public disclosures under Pillar III. Moreover, the Policy defines the relevant disclosures’ governance, including the assessment of the appropriateness of the disclosures, their verification and frequency. Disclosures on a consolidated basis provide (inter alia) information on capital structure, capital adequacy, risk profile, and the processes in place for assessing and managing risks.
The Bank is firmly committed to best practices regarding public disclosures and recognises that Pillar III provides an additional layer of market information and transparency, hence contributing to financial stability. Additional information for investors and other stakeholders (regarding e.g. the members of the management body, the Corporate Governance Code etc) is to be found in the Bank’s website www.nbg.gr.
The objectives of the Pillar III Disclosures are:
To provide investors and other stakeholders with the appropriate, complete, accurate and timely information that they reasonably need to make investment decisions and informed judgements of NBG Group,
To foster and facilitate compliance with all applicable legal and regulatory requirements.
The Pillar III Disclosures Policy:
Formulates the disclosure framework, including frequency, location, monitoring and verification process for disclosures,
Defines the authorities and responsibilities for the management of the Pillar III process,
Articulates the principles for identifying information that is material, confidential and proprietary,
Raises awareness of the Bank’s approach to disclosure among the Board of Directors, Senior Management and Employees.

National Bank of Greece
Consolidated Pillar III Report
18
2. NBG’s TRANSFORMATION PROGRAMME
Following a clear mandate from its Board of Directors, NBG embarked in 2018 into a program to transform itself deeply and radically and achieve a viable and sustainable business model, which will enhance its capital adequacy. Building upon its long-lasting tradition of trust and service to society, NBG has set out to become more than just a modern banking institution: its aspiration is to outrun its local peers across all competitive dimensions, eventually reinstating itself as Greece’s banking champion and as one of Europe’s best Banks.
The Transformation Programme is delivered within Workstreams, each led by a General Manager/Assistant General Manager, member of the Bank’s Executive Committee. Some Workstreams coincide with the executive’s functional area, but cross-functional oversight is strongly encouraged.
Six Workstreams have been identified, as follows:
1. Healthy Balance Sheet Workstream: relating to the reduction of NPEs, the appropriate safeguarding of capital adequacy, as well as to the optimization of the funding structure.
2. Efficiency & Agility Workstream: relating to the timely and sustainable reduction of costs, as well as to the optimization of the Branch network (and, more broadly, real estate) footprint.
3. Best Bank for our Clients Workstream: relating to Retail and Corporate service and coverage model, product offerings, digital proposition, use of analytics and branding.
4. Technology & Processes Workstream: relating to the underlying technological platforms of the Bank as well as to the redesign of its processes towards an efficient and agile operating model.
5. People, Organization & Governance Workstream: relating to the redesign of the overall Human Resources framework, target organizational structure and the introduction of a unified, comprehensive and rigorous Performance Management System.
6. Visibility, Controls & Compliance Workstream: relating to the delivery of a Bank-wide Value Based Model framework, the management of non-financial risks, risk culture and a focused mechanism for the design and delivery of an enhanced system of internal controls.
The aforementioned Workstreams currently comprise 21 further initiatives and many more sub-initiatives.
The Transformation Programme consists of six-month execution intervals, named “Seasons”. All Transformation Programme initiatives / sub-initiatives have “locked-down” tangible objectives to be delivered, supporting the Bank’s Strategic Plan.

National Bank of Greece
Consolidated Pillar III Report
19
3. REGULATORY OWN FUNDS AND PRUDENTIAL REQUIREMENTS
In June 2013, the European Parliament and the Council of Europe issued Directive 2013/36/EU and Regulation (EU) No 575/2013, (known as CRD IV and CRR respectively), which incorporate the key amendments that had been proposed by the Basel Committee for Banking Supervision (known as Basel III). Directive 2013/36/EU has been transported into Greek Law by virtue of Greek Law 4261/2014, while Regulation (EU) No 575/2013 has been directly applicable to all EU Member States since 1 January 2014. Some changes under CRR/CRD IV are being implemented gradually, mainly between 2014 and 2019.
3.1. Structure of own funds
Regulatory capital, according to CRR rules falls into two categories: Tier I and Tier II capital. Tier I capital is further divided into Common Equity Tier I (CET1) capital and Additional Tier I capital.
CET1 capital includes the Bank’s ordinary shareholders’ equity, share premium, reserves and retained earnings and minority interest allowed in consolidated CET1.
The following items are deducted from the above:
positive or negative adjustments in the fair value of financial derivatives used for cash flow hedging
fair value gains and losses arising from the institution’s own credit risk related to derivative liabilities
prudent valuation adjustment calculated according to article 105 of Regulation (EU) No 575/2013
goodwill and intangibles
deferred tax assets not arising from temporary differences
deferred tax assets arising from temporary differences and significant investments that exceed 10%/ 17.65% of CET1 filter
NBG Group’s regulatory capital structure as of 30.06.2019 is presented below.
Table 4: Own Funds Structure
Group's Own Funds Structure € mio
Shareholders' Equity per balance sheet 5,316 Non-controlling interests 8
Non-controlling interests per balance sheet 18 Non-controlling interests not recognised in CET1 (10)
Regulatory Adjustments 1,277 IFRS9 transitional arrangements 1,353 Own credit risk (22) Prudent valuation adjustment (12)
Cash flow hedging resevre 21 AT1 deductions that exceed the AT1 capital (50) Other (13) Deductions (943)
Goodwill and intangibles (160) Significant Investments (538) Deferred tax assets that rely on future profitability and arise from temporary differences (245)
Common Equity Tier 1 Capital (CET1) 5,658
Additional Tier 1 Capital (AT1) -
Total Tier 1 Capital 5,658
Tier2 Capital -
Total Regulatory Capital 5,658
The main features of capital instruments issued by the Group categorised as CET1 are presented in the table below.
Table 5: Capital Instruments main features
Capital instruments’ main features template
1 Issuer National Bank of Greece, S. A. (Greece) 2 Unique identifier (eg CUSIP, ISIN or Bloomberg identifier for private placement GRS003003019 3 Governing law(s) of the instrument Greek
Regulatory treatment 4 Transitional CRR rules Common Equity Tier 1 5 Post-transitional CRR rules Common Equity Tier 1 6 Eligible at solo/(sub-)consolidated/solo & (sub-)consolidated Solo & Consolidated 7 Instrument type (types to be specified by each jurisdiction) Ordinary Shares
8 Amount recognised in regulatory capital (currency in million, as of most recent reporting date) € 2.744m

National Bank of Greece
Consolidated Pillar III Report
20
9 Nominal amount of instrument € 2,744m
(914,715,153 shares @ €3.00 each) 9a Issue price - 9b Redemption price - 10 Accounting classification Share Capital 11 Original date of issuance Various 12 Perpeptual or dated Perpetual 13 Original maturity date - 14 Issuer call subject to prior supervisory approval N/A 15 Optional call date, contingent call dates, and redemption amount N/A 16 Subsequent call dates, if applicable N/A
Coupons / dividends 17 Fixed or floating dividend/coupon N/A 18 Coupon rate and any related index N/A 19 Existence of a dividend stopper N/A
20a Fully discretionary, partially discretionary or mandatory (in terms of timing) partially discretionary
20b Fully discretionary, partially discretionary or mandatory (in terms of amount) partially discretionary 21 Existence of step up or other incentive to redeem No 22 Noncumulative or cumulative Non cumulative 23 Convertible or non-convertible Non convertible 24 If convertible, conversion trigger (s) N/A 25 If convertible, fully or partially N/A 26 If convertible, conversion rate N/A 27 If convertible, mandatory or optional conversion N/A 28 If convertible, specifiy instrument type convertible into N/A
29 If convertible, specifiy issuer of instrument it converts into N/A 30 Write-down features No 31 If write-down, write-down trigger (s) N/A 32 If write-down, full or partial N/A 33 If write-down, permanent or temporary N/A 34 If temporary write-down, description of write-up mechanism N/A
35 Position in subordination hierachy in liquidation (specify instrument type immediately senior to instrument)
Additional Tier 1
36 Non-compliant transitioned features No 37 If yes, specifiy non-compliant features N/A
3.2. IFRS 9 impact on own funds
On 12 December 2017 the European Parliament and the Council of the European Union adopted Regulation (EU) 2017/2395 (the "Regulation"), which amended Regulation 575/2013 with Article 473a, allowing credit institutions to gradually apply the impact of the application of IFRS 9 to own funds.
In particular, upon adoption of IFRS 9, credit institutions are allowed to include in the Common Equity Tier 1 capital (CET1), a portion of the increased ECL provisions over a 5-year transitional period starting in 2018. The portion of ECL provisions that can be included in CET1 should decrease over time down to zero to ensure the full implementation of IFRS 9, after the end of the transitional period.
In addition, in accordance with paragraph (4) of the Regulation, if the ECL provisions for Stages 1 and 2 incurred after the first adoption of IFRS 9 are increased, credit institutions are allowed to include the increase in the transitional arrangements.
The percentages of recognition in CET1 of the increased ECL provisions during the 5-year transition period are as follows:
0.95 during the period from 01/01/2018-31/12/2018
0.85 during the period from 01/01/2019-31/12/2019
0.70 during the period from 01/01/2020-31/12/2020
0.50 during the period from 01/01/2021-31/12/2021
0.25 during the period from 01/01/2022-31/12/2022
The Group has decided to apply the transitional arrangements set out in Article 1 of the aforementioned Regulation, including the provisions of paragraph (4), during the transitional period.
The table below presents a comparison of own funds, capital ratios and leverage ratios with and without the application of transitional arrangements for IFRS 9 or analogous ECLs.

National Bank of Greece
Consolidated Pillar III Report
21
Table 6: IFRS 9 impact
Comparison of own funds, capital ratios and leverage ratios with and without the application of transitional arrangements for IFRS 9 or analogous ECLs
€ mio
30.06.201
9 31.03.201
9 31.12.201
8 30.09.201
8 30.06.201
8
Available capital (amounts)
Common Equity Tier 1 (CET1) capital 5,658 5,495 5,619 5,737 5,840
Common Equity Tier 1 (CET1) capital as if IFRS 9 or analogous ECLs transitional arrangements had not been applied 4,305 4,413 4,409 4,490 4,601
Tier 1 capital 5,658 5,495 5,619 5,737 5,840
Tier 1 capital as if IFRS 9 or analogous ECLs transitional arrangements had not been applied 4,305 4,413 4,409 4,490 4,601
Total capital 5,658 5,537 5,659 5,768 5,872
Total capital as if IFRS 9 or analogous ECLs transitional arrangements had not been applied 4,305 4,455 4,449 4,521 4,633
Risk-weighted assets (amounts)
Total risk-weighted assets 38,235 35,110 35,015 35,023 36,054
Total risk-weighted assets as if IFRS 9 or analogous ECLs transitional arrangements had not been applied 37,640 34,720 34,584 34,626 35,604
Capital ratios
Common Equity Tier 1 (as percentage of risk exposure amount) 14.80% 15.65% 16.05% 16.4% 16.2%
Common Equity Tier 1 (as percentage of risk exposure amount) as if IFRS 9 or analogous ECLs transitional arrangements had not been applied 11.44% 12.71% 12.75% 13.0% 12.9%
Tier 1 (as percentage of risk exposure amount) 14.80% 15.65% 16.05% 16.4% 16.2%
Tier 1 (as percentage of risk exposure amount) as if IFRS 9 or analogous ECLs transitional arrangements had not been applied 11.44% 12.71% 12.75% 13.0% 12.9%
Total capital (as percentage of risk exposure amount) 14.80% 15.77% 16.16% 16.5% 16.3%
Total capital (as percentage of risk exposure amount) as if IFRS 9 or analogous ECLs transitional arrangements had not been applied 11.44% 12.83% 12.86% 13.1% 13.0%
Leverage ratio
Leverage ratio total exposure measure 59,882 61,089* 66,795* 64,289* 64,672*
Leverage ratio 9.45% 9.00%* 8.41%* 8.92%* 9.03%*
Leverage ratio as if IFRS 9 or analogous ECLs transitional arrangements had not been applied 7.26% 7.36%* 6.67%* 7.07%* 7.22%*
*Leverage ratio metrics reviewed due to release of EBA Q&A 2018_3995 on 15.02.2019 concerning the recalculation of leverage ratio for exposures under both Standardised and IRB Approach using the same scaling factor as defined in article 473(a) of EU 575/2013.
3.3. DTC Law
Article 27A of Law 4172/2013 (“DTC Law”), as currently in force, allows credit institutions, under certain conditions, and from 2017 onwards to convert deferred tax assets (“DTAs”) arising from (a) private sector initiative (“PSI”) losses, (b) accumulated provisions for credit losses recognized as at 30 June 2015, (c) losses from final write off or the disposal of loans and (d) accounting write offs, which will ultimately lead to final write offs and losses from disposals, to a receivable (“Tax Credit”) from the Greek State. Items (c) and (d) above were added with Law 4465/2017 enacted on 29 March 2017. The same Law 4465/2017 provided that Tax Credit cannot exceed the tax corresponding to accumulated provisions recorded up to 30 June 2015 less (a) any definitive and cleared tax credit, which arose in the case of accounting loss for a year according to the provisions of par.2 of article 27A, which relate to the above accumulated provisions, (b) the amount of tax corresponding to any subsequent specific tax provisions, which relate to the above accumulated provisions and (c) the amount of the tax corresponding to the annual amortization of the debit difference that corresponds to the above provisions and other losses in general arising due to credit risk.
The main condition for the conversion of DTAs to a Tax Credit is the existence of an accounting loss on a solo basis of a respective year, starting from accounting year 2016 and onwards. The Tax Credits will be calculated as a ratio of IFRS accounting losses to net equity (excluding the year’s losses) on a solo basis and such ratio will be applied to the remaining Eligible DTAs in a given year to calculate the Tax Credit that will be converted in that year, in respect of the prior tax year. The Tax Credit may be offset against income taxes payable. The non-offset part of the Tax Credit is immediately recognized as a receivable from the Greek State. The Bank is obliged to issue conversion rights to the Greek State for an amount of 100% of the Tax Credit in favour of the Greek State and will create a specific reserve for an equal amount. Common shareholders have pre-emption rights on these conversion rights. The reserve will be capitalized with the issuance of common shares in favour of the Greek State. This legislation allows credit institutions to treat such DTAs as not “relying on future profitability” according to CRD IV, and as a result such DTAs are not deducted from CET1, hence improving a credit institution’s capital position.
Furthermore, Law 4465/2017 amended article 27 “Carry forward losses” by introducing an amortization period of 20 years for losses due to loan write offs as part of a settlement or restructuring and losses that crystallize as a result of a disposal of loans.

National Bank of Greece
Consolidated Pillar III Report
22
On 7 November 2014 the Bank convened an extraordinary General Shareholders Meeting which resolved to include the Bank in the DTC Law. In order for the Bank to exit the provisions of the DTC Law it requires regulatory approval and a General Shareholders meeting resolution.
As of 30 June 2019, the amount of DTAs that were eligible for conversion to a receivable from the Greek State subject to the DTC Law was €4.5 billion (31 December 2018: €4.6 billion). The conditions for conversion rights were not met in the year ended 31 December 2018 and no conversion rights are deliverable in 2019.
3.4. Transitional own funds disclosure template
The table below provides information regarding the amounts and nature of specific items on own funds during the IFRS9 transitional period, in accordance with Annex IV of the Commission Implementing Regulation (EU) No 1423/2013.
Table 7: Transitional Own Funds
Transitional own funds disclosure template as of 30.06.2019 € mio
Common Equity Tier 1 capital: Instruments and Reserves 1 Capital instruments and the related share premium accounts 16,608 of which: ordinary shares 16,610
2 Retained earnings (17,115) 3 Accumulated other comprehensive income and other reserves 5,808
3a Funds for general banking risk 15 5 Minority Interests (amount allowed in consolidated CET1) 8 6 Common Equity Tier 1 (CET1) capital before regulatory adjustments 5,324
Common Equity Tier 1 capital: Regulatory Adjustments
7 Additional Value Adjustments (12) 8 Intangible assets (net of related tax liability) (160)
11 Fair value reserves related to gain or losses on cash flow hedges 21
14 Gains or losses on liabilities valued at fair value resulting from changes in own credit standing (22)
19 CET1 instruments of financial sector entities where the institution has a significant investment in those entities (amount above 10% threshold)
(538)
20 Adjustments due to IFRS 9 transitional arrangements 1,353
22 Amount exceeding the 17.65% threshold (245)
24 Of which: deferred tax assets arising from temporary differences (245)
25 Other CET1 capital elements or deductions (13)
27 Qualifying AT1 deductions that exceed the AT1 capital of the institution (50)
28 Total regulatory adjustments to Common equity Tier 1 (CET1) 334 29 Common Equity Tier 1 (CET1) capital 5,658
Additional Tier 1 (AT1) capital--
36 Additional Tier 1 (AT1) capital before regulatory adjustments -
Additional Tier 1 (AT1) capital: regulatory adjustments
42 Qualifying T2 deductions that exceed the T2 capital of the institution (negative amount) (50)
42a Excess of deduction from AT1 items over AT1 Capital (deducted in CET1) 50
43 Total regulatory adjustments to Additional Tier 1 (AT1) capital -
44 Additional Tier 1 (AT1) capital -
45 Tier 1 capital (T1 = CET1 + AT1 ) 5,658
Tier 2 (T2) capital
51 Tier 2 capital (T2) capital before regulatory adjustments -
Tier 2 (T2) capital: Regulatory adjustments
55 Direct and indirect holdings by the institution of the T2 instruments and subordinated loans of financial sector entities where the institution has a significant investment in those entities
(50)
56 Excess of deduction from T2 items over T2 Capital (deducted in AT1) 50
57 Total regulatory adjustments to Tier 2 (T2) capital -
58 Tier 2 (T2) capital -
59 Total capital (TC = T1 + T2) 5,658 60 Total Risk Weighted Assets (RWAs) 38,235
Capital Adequacy Ratios %
61 Common Equity Tier 1 14.80% 62 Tier 1 14.80% 63 TOTAL 14.80% 68 Common Equity Tier 1 available to meet buffers 3.80%

National Bank of Greece
Consolidated Pillar III Report
23
Amounts below the thresholds for deduction (before risk weighting)
72 Direct and indirect holdings of the capital of financial sector entities where the institution does not have a significant investment in those entities (amount below 10% threshold and net of eligible short positions
89
73 Direct and indirect holdings by the institution of CET1 instruments of financial sector entities where the institution has a significant investment in those entities (amount below 10% threshold and net of eligible short positions)
513
75 Deferred tax assets arising from temporary differences (amount below 10% threshold, net of related tax liability where the conditions in 38 (3) are met)
139
3.5. Capital requirements under Pillar I
The table below presents the risk exposure amounts (or Risk Weithted Assets - RWAs) and capital requirements at Group level under Pillar I as of 30.06.2019, according to the CRR/CRD IV regulatory framework. Capital requirements under Pillar I are equal to 8% of risk exposure amounts.
Table 8: EU OV1 - Overview of RWAs
RWAs
Minimum Capital
Requirements
30.06.2019 31.03.2019 30.06.2019
1 Credit risk (excluding CCR) 33,798 30,502 2,704 Article 438(c)(d) 2 Of which the standardised approach 33,798 15,221 2,704 Article 438(c)(d) 3 Of which the foundation IRB (FIRB) approach 11,197 Article 438(c)(d) 4 Of which the advanced IRB (AIRB) approach 4,084
Article 438(d) 5 Of which equity IRB under the simple risk-weighted approach or the IMA
Article 107 Article 438(c)(d)
6 CCR 401 335 32
Article 438(c)(d) 7 Of which mark to market 204 95 16 Article 438(c)(d) 8 Of which original exposure 9 Of which the standardised approach 96 141 8 10 Of which internal model method (IMM)
Article 438(c)(d) 11 Of which risk exposure amount for contributions to the default fund of a CCP
Article 438(c)(d) 12 Of which CVA 101 98 8
Article 438(e) 13 Settlement risk
Article 449(o)(i) 14 Securitisation exposures in the banking book (after the cap) 15 Of which IRB approach 16 Of which IRB supervisory formula approach (SFA) 17 Of which internal assessment approach (IAA) 18 Of which standardised approach
Article 438 (e) 19 Market risk 1,434 1,464 115 20 Of which the standardised approach 609 561 49 21 Of which IMA 825 903 66
Article 438(e) 22 Large exposures
Article 438(f) 23 Operational risk 2,602 2,809 208 24 Of which basic indicator approach 25 Of which standardised approach 2,602 2,809 208
26 Of which advanced measurement approach
Article 437(2), Article 48 and Article 60
27 Amounts below the thresholds for deduction (subject to 250% risk weight)
1,636 1,657 131
Article 500 28 Floor adjustment
29 Total 38,235 35,110 3,059
The disclosure regarding non deducted participations in insurance undertakings is not applicable since the Group does not apply the provisions set out in Article 49(1) of the CRR.

National Bank of Greece
Consolidated Pillar III Report
24
3.6. Leverage Ratio
Leverage ratio is calculated in accordance with the methodology set out in article 429 of the regulation (EU) No 575/2013 of the European Parliament and of the Council, as amended by European Commission delegated Regulation 62/2015 of 10 October 2014. It is defined as an institution's capital measure divided by that institution's total leverage exposure measure and is expressed as a percentage. The Group submits to the competent authority the leverage ratio on a quarterly basis.
As of 30 June 2019 Group leverage ratio, according to the transitional definition of Tier I and the EU Regulation 62/2015, amounts to 9.45%, exceeding the proposed minimum threshold of 3%.
Leverage ratio has increased to 9.45% (compared to 9.00% of March,31 2019) driven by CET1 increase due to strong H1.19 PAT and bond valuation gains (FVTOCI) along with total leverage exposures decrease.
The tables below include the summary and detailed disclosures on the Group’s leverage ratio with reference date 30.06.2019 (amounts in € mio):
Table 9: Leverage ratio
Tier I 5,658 Total Exposure Measure 59,882
Leverage Ratio 9.45%

National Bank of Greece
Consolidated Pillar III Report
25
4. CREDIT RISK
4.1. Definitions and general information
For accounting purposes, “past due” exposures are those exposures which are past due for at least 1 day. Credit impaired exposures include all past-due exposures more than 90 days.
The Group has aligned the accounting definition of default (stage 3), with the non performing exposures (NPE) definition used for regulatory purposes, as per EBA Implementing Technical Standards on Supervisory reporting on forbearance and non-performing exposures, as adopted by the Commission Implementing Regulation (EU) 2015/227 of 9 January 2015 amending Implementing Regulation (EU) No 680/2014 laying down implementing technical standards with regard to supervisory reporting of institutions according to Regulation (EU) No 575/2013 of the European Parliament and of the Council (“EBA ITS”), thus a financial asset is considered as credit impaired, when it is classified as NPE. The accounting definition of default (stage 3) is consistent with the one used for internal credit risk management purposes.
A debt security is considered as credit impaired, and is classified into Stage 3, when at least one payment of capital or interest is overdue by the issuer, based on the contractual terms of the instrument, irrespective of the days past due. In addition, a debt security is assessed as credit impaired if there is at least one external credit rating on the security or the issuer corresponding to Default or Selective Default.
4.2. Impairment – Expected Credit Losses
ECL are recognised for all financial assets measured at amortised cost, debt financial assets measured at FVTOCI, lease receivables, financial guarantees and certain loan commitments. ECL represent the difference between contractual cash flows and those that the Group expects to receive, discounted at the EIR. For loan commitments and other credit facilities in scope of ECL, the expected cash shortfalls are determined by considering expected future draw downs.
Recognition of expected credit losses
At initial recognition, an impairment allowance is required for ECL resulting from default events that are possible within the next 12 months (12-month ECL), weighted by the risk of a default occurring. Instruments in this category are referred to as instruments in Stage 1. For instruments with a remaining maturity of less than 12 months, ECL are determined for this shorter period.
In the event of a significant increase in credit risk (“SICR”), an ECL allowance is required, reflecting lifetime cash shortfalls that would result from all possible default events over the expected life of the financial instrument (“lifetime ECL”), weighted by the risk of a default occurring. Instruments in this category are referred to as instruments in Stage 2.
Lifetime ECL are always recognised on financial assets for which there is objective evidence of impairment, that is they are considered to be in default or otherwise credit-impaired. Such instruments are referred to as instruments in Stage 3.
Write-off
A write-off is made when the Group does not have a reasonable expectation to recover all or part of a financial asset. Write-offs reduce the principal amount of a claim and are charged against previously established allowances for credit losses. Recoveries, in part or in full, of amounts previously written off are generally credited to “credit provisions and other impairment charges”. Write-offs and partial write-offs represent derecognition or partial derecognition events.
Measurement of expected credit losses
The Group assesses on a forward-looking basis the ECL associated with all financial assets subject to impairment under IFRS 9. The Group recognises an ECL allowance for such losses at each reporting date. The measurement of ECL reflects:
An unbiased and probability-weighted amount that is determined by evaluating a range of possible outcomes. The Group uses three macroeconomic scenarios and estimates the ECL that would arise under each scenario. A weighting is allocated to each scenario, such that the weighted probabilities of all three scenarios are equal to one. The distribution of possible ECL may be non-linear, hence three distinct calculations are performed, where the associated ECLs are multiplied by the weighting allocated to the respective scenario. The sum of the three weighted ECL calculations represents the probability-weighted ECL.
The time value of money.
Reasonable and supportable information that is available without undue cost or effort at the reporting date about past events, current conditions and forecasts of future economic conditions.
For the purposes of measuring ECL, the estimate of expected cash shortfalls reflects the cash proceeds expected from collateral liquidation (if any) and other credit enhancements that are part of the contractual terms and are not recognised separately by the Group. The estimate of expected cash shortfalls on a collateralized loan exposure reflects the assumptions used regarding the amount and timing of cash flows that are expected from foreclosure on the collateral less the costs of obtaining and selling the collateral, irrespective of whether the foreclosure is probable.
The ECL calculations are based on Exposure at Default (“EAD”), Credit Conversion Factor (“CCF”), Probability of Default (“PD”), Loss given default (“LGD”) and Discount Rate.
The PD and LGD are determined for three different scenarios whereas EAD projections are treated as scenario independent.

National Bank of Greece
Consolidated Pillar III Report
26
The ECL is determined by projecting the PD, LGD and EAD for each time step between future cash flow dates and for each individual exposure or collective segment. These three components are multiplied together and adjusted for the likelihood of survival, if appropriate. This effectively calculates an ECL for each future period, which is then discounted back to the reporting date and summed.
Significant increase of credit risk
A financial asset is considered as non-credit impaired, when the definition for Stage 3 classification is not met. The exposure is classified as Stage 2 if it has suffered a SICR, otherwise it is classified as Stage 1.
At each reporting date, the Group performs the SICR assessment comparing the risk of a default occurring over the remaining expected lifetime of the exposure with the expected risk of a default as estimated at origination.
The Group’s process to assess SICR has three main components:
a quantitative element, i.e. reflecting a quantitative comparison of PD or credit rating at the reporting date versus the respective metric at initial recognition,
a qualitative element, i.e. all Forborne Performing Exposures (FPE), in accordance with EBA ITS, internal watch list for corporate obligors, and
“backstop” indicators. The Group applies on all lending exposures the IFRS 9 presumption that a SICR has occurred when the financial asset is more than 30 days past due.
4.3. Revert to Standardised Approach
National Bank of Greece obtained in 2008 (i.e. upon implementation of the Basel II framework) the approval of the National Competent Authority (NCA) to use the Internal Rating’s Based (IRB) approach for calculating own funds requirements for credit risk for the corporate (including Specialised Lending) and its residential mortgage exposures. In 2013, the Bank expanded the use of the IRB approach after relevant application in order to calculate own fund requirements for credit risk for the retail SME exposures.
Up to 31.12.2013, the regulatory documents governing the Standardised Approach (SA) and the Internal Ratings Based (IRB) approach were Bank of Greece Governor’s Acts 2588/20.8.2007 and 2589/20.8.2007 respectively. As of 1.1.2014 these documents were superseded by Regulation (EU) 575/2013 (CRR). The change of the regulatory framework did not alter the approaches used to calculate the own funds requirements for credit risk as regards the Bank’s portfolios.
The Bank had been using the Foundation-IRB approach (without own estimates of LGD or Conversion Factors) regarding its corporate exposures (including Specialised Lending) and the Advanced-IRB approach (with own estimates of LGD and/or Conversion Factors) regarding its residential mortgage and retail SME portfolios until Q1 2019. In specific, 46% of total exposures were subject to credit risk under IRB, 18% under Advanced IRB and 28% under Foundation IRB respectively. The own funds requirements for credit risk for all other portfolios are calculated using the Standardized Approach (SA)..
In July 2018 the Bank applied to the ECB for permission to revert to the use of the Standardised Approach (SA) for the calculation of the risk-weighted exposure amounts currently under the IRB approach, in accordance with Article 149 of Regulation (EU) 575/2013 (CRR) and following relevant approval by the Bank’s Executive Committee and Board of Directors.
The main rationale of the reversal to the use of the Standardised Approach request is the need for NBG to prioritise on resources and investments towards addressing the most critical challenges such as the implementation of an ambitious strategy for the reduction of the stock of non-performing exposures and operational costs reduction. Thus, the restriction of operational burden caused by the full roll-out and maintenance of the IRB Approach will serve the Bank to focus in the medium term on areas of strategic importance. Furthermore, RWAs will be more stable and predictable while an adverse immediate impact will be offset by the benefits of the planned NPE reduction.
NBG, following application for permission to migrate its credit IRB portfolios to Standardised Approach, has received a decision by ECB on permission to revert to Standardised Approach for calculating own funds requirements for credit risk as of 21st May 2019.
The reversal to Standardised Approach for calculating own funds requirements for credit risk was completed in Q2 2019 and the Bank officially reported the capital requirements under the Standardized Approach for the whole portfolio as of 30.06.2019. The impact of revert to Standardised Approach on CET1 of about 1.12%, partially offset by H1.19 PAT and bond valuation gains (FVTOCI). Nevertheless, both CET1 and Total Capital ratio are comfortably above SREP capital requirements for 2019 and 2020. The bank will preserve its internal modelling infrastructure and intends to take advantage of the experience gained with credit risk models in order to maintain and develop further the use of the models and enhance modelling capabilities used for risk management purposes covering the following areas indicatively : a)credit approval and risk based pricing; b) IFRS9 and credit risk adjustments calculation; c) risk management controls and monitoring; d) early warning systems; e) EVA and RAPM modelling; f) internal capital assessment and allocation.
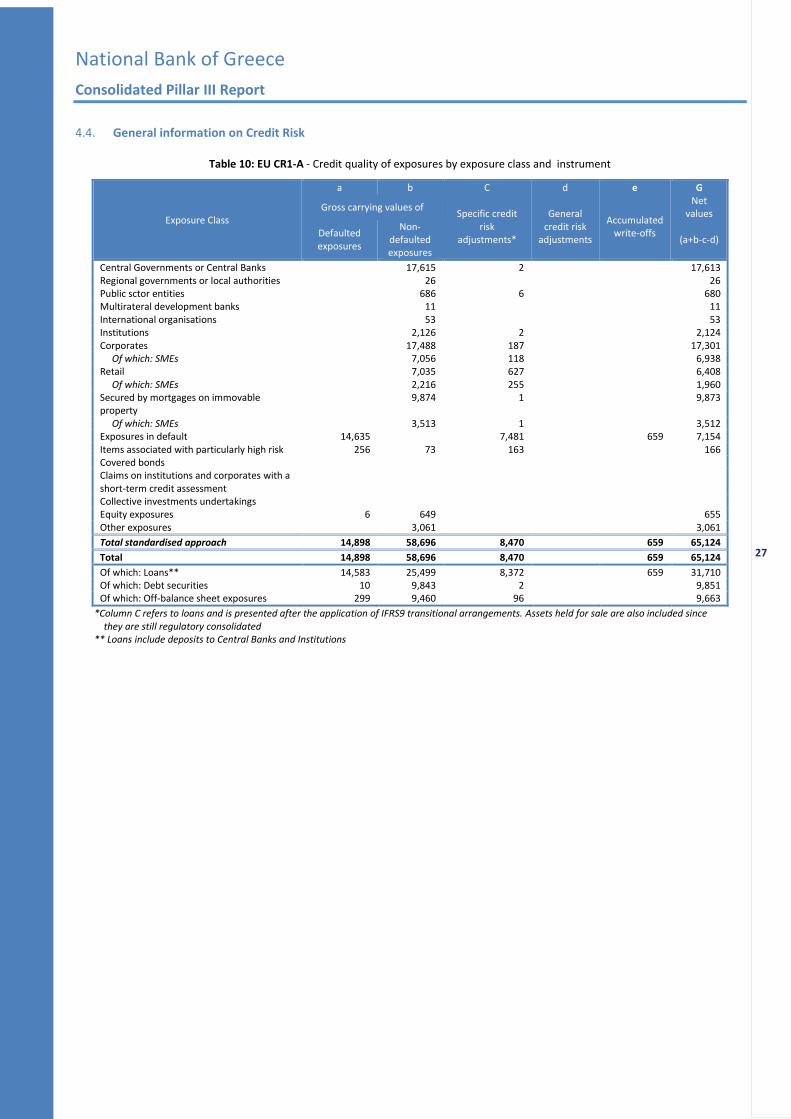
National Bank of Greece
Consolidated Pillar III Report
27
4.4. General information on Credit Risk
Table 10: EU CR1-A - Credit quality of exposures by exposure class and instrument
Exposure Class
a b C d e G
Gross carrying values of Specific credit
risk adjustments*
General credit risk
adjustments
Accumulated write-offs
Net values
Defaulted exposures
Non-defaulted exposures
(a+b-c-d)
Central Governments or Central Banks 17,615 2
17,613 Regional governments or local authorities 26
26
Public sctor entities 686 6
680 Multirateral development banks 11
11
International organisations 53
53 Institutions 2,126 2
2,124
Corporates 17,488 187
17,301 Of which: SMEs 7,056 118
6,938
Retail 7,035 627
6,408 Of which: SMEs 2,216 255
1,960
Secured by mortgages on immovable property
9,874 1
9,873
Of which: SMEs 3,513 1
3,512 Exposures in default 14,635
7,481 659 7,154
Items associated with particularly high risk 256 73 163 166 Covered bonds Claims on institutions and corporates with a short-term credit assessment
Collective investments undertakings
Equity exposures 6 649 655 Other exposures
3,061 3,061
Total standardised approach 14,898 58,696 8,470 659 65,124
Total 14,898 58,696 8,470 659 65,124
Of which: Loans** 14,583 25,499 8,372 659 31,710 Of which: Debt securities 10 9,843 2
9,851
Of which: Off-balance sheet exposures 299 9,460 96
9,663
*Column C refers to loans and is presented after the application of IFRS9 transitional arrangements. Assets held for sale are also included since they are still regulatory consolidated
** Loans include deposits to Central Banks and Institutions

National Bank of Greece
Consolidated Pillar III Report
28
Table 11: EU CR1-B - Credit quality of corporate exposures by industry
Sector
a b C d e G Gross carrying values of
Specific credit risk
adjustments
General credit risk
adjustments
Accumulated write-offs
Net values
Defaulted exposures
Non-defaulted exposures
(a+b-c-d)
Agriculture, forestry and fishing 131 135 48 13 218 Mining and quarrying 6 18 4 20 Manufacturing 1,323 4,907 824 82 5,407 Electricity, gas, steam and air conditioning supply
36 2,085 28 4 2,093
Water supply 2 95 1 96 Construction 290 2,003 193 15 2,101 Wholesale and retail trade 1,136 3,230 661 77 3,705
Transport and storage 415 2,826 239 30 3,002
Accommodation and food service activities 325 1,129 149 30 1,305
Information and communication 320 535 223 17 632
Other Financial Services 132 161 101 6 192
Real estate activities 401 798 241 23 958 Professional, scientific and technical activities
49 139 37 2 151
Administrative and support service activities
16 191 12 1 194
Public administration and defence, compulsory social security
5 5
Education 15 18 12 1 22 Activities of extraterritorial organisations and bodies
2 6 1 6
Human health services and social work activities
66 233 41 5 258
Arts, entertainment and recreation 54 132 41 2 144 Other services 40 28 32 2 37
Total 4,761 18,674 2,890 310 20,546
Table 12: EU CR1-C - Credit quality of exposures by geography
Country
a b C d e G Gross carrying values of
Specific credit risk
adjustments
General credit risk
adjustments
Accumulated write-offs
Net values
Defaulted exposures
Non-defaulted exposures
(a+b-c-d)
Greece 13,835 47,758 7,848 - 658 53,745 Cyprus 394 794 202 - - 987 Marshall Islands 93 931 44 - - 979 Romania 240 1,410 166 - 1 1,484 FYROM 117 1,658 83 - - 1,692 Luxemburg 8 159 5 - - 163 United Kingdom 17 1,215 10 - - 1,222 Other countries 194 4,770 112 - - 4,852
Total 14,898 58,696 8,470 - 659 65,124

National Bank of Greece
Consolidated Pillar III Report
29
4.5. Provision analysis
Table 13 : EU CR2-A - Changes in the stock of general and specific credit risk adjustments
a b
Accumulated specific
credit risk adjustment
Accumulated general credit
risk adjustment
1 Opening balance December 31, 2018 (9,552)
2 Increases due to amounts set aside for estimated loan losses during the period (174)
3 Decreases due to amounts reversed for estimated loan losses during the period
4 Decreases due to amounts taken against accumulated credit risks adjustments 657
5 Transfers between credit risk adjustments
6 Impact of exchange rate differences (5)
7 Other adjustments 75
8 Reclassified as Held for Sale 1,345
9 Closing balance June 30, 2019 (7,654)
10 Recoveries on credit risk adjustments recorded directly to the statement of profit or loss
Table 14 : EU CR2-B - Changes in the stock of defaulted and impaired loans and debt securities
a
Gross carrying value defaulted exposures
1 Opening balance December 31, 2018 14,473
2 Loans and debt securities that have defaulted or impaired since the last reporting period 2,171
3 Returned to non-defaulted status (290)
4 Amounts written off (659)
5 Other changes* (1,103)
6 Closing balance June 30,2019 14,593
* Other changes include repayments and sales
4.6. Non-performing and forborne exposures
The Bank continues to operate in a challenging economic environment as a result of the Greek financial crisis. Against this backdrop, the Bank is executing a well-developed strategy that aims to reduce its NPE ratio and maximise collections from the Bank’s troubled assets portfolio. This strategy includes a set of detailed operational targets and Key Performance Indicators as well as a time-bound action plan for their implementation with a view to significantly reducing NPE stocks.
The strategy establishes realistic but sufficiently ambitious targets, and NBG assesses its effectiveness and adequacy on a regular basis. The strategy is both consistent with, and linked to, the Bank’s business plan and the current ICAAP.
The Bank’s NPE Management actions as well as internal monitoring and modelling mechanisms are built around the Business segmentation criteria and largely operating in a bottom-up approach. The main strategy drivers of the Bank’s NPE Management Strategy are:
• Restructurings
• Sale & securitization of portfolios
• Liquidations
• Real estate collateral repossessions
The execution of the envisaged strategic actions and the related timetables depend on the legal, market and economic conditions and are consequently subject to ongoing re-evaluation.

National Bank of Greece
Consolidated Pillar III Report
30
Table 15: Credit quality of forborne exposures
a b c d e f g h
Gross carrying amount/ nominal amount of exposures with forbearance measures
Accumulated impairment Collateral received and financial guarantees received on forborne
exposures
Performing forborne
Non performing forborne On
performing forborne
exposures
On non-performing
forborne exposures
Of which collateral and financial guarantees
received on non-performing exposures
with forbearance measures
PD scale Of which defaulted
Of which impaired
1 Loans and advances 2,705 5,724 4,775 5,656 (232) (2,492) 4,831 3,093
2 Central Banks - - - - - - -
3 General Governments 30 32 32 32 (5) (18) 31 22
4 Credit Institutions - - - - - - - -
5 Other Financial Corporations 1 110 99 110 (0) (82) 11 8 6 Non-Financial Corporations 595 2,264 2,078 2,196 (72) (1,170) 1,265 1,006
7 Households 2,080 3,318 2,567 3,318 (155) (1,223) 3,524 2,057
8 Debt Securities - - - - - - - -
9 Loan Commitments given - - - - - - - -
10 Total 2,705 5,724 4,775 5,656 (232) (2,942) 4,831 3,093
Table 16: Credit quality of performing and non-performing exposures by past due days
a b c d e f g h i l
Gross carrying amount/ nominal amount Performing exposures Non performing exposures
PD scale
Not past due or
past due ≤30 days
Past due >30
days ≤90 days
Unlikely to pay that are not past due or are past due ≤90 days
Past due >90 days
≤180 days
Past due >180
days ≤1 year
Past due >1 year
Past due >5 years
Of which defaulted
1 Loans and advances 28,217 27,855 362 13,746 3,842 586 860 2,941 5,516 12,301
2 Central Banks 1,299 1,299 - - - - - - - -
3 General Governments 370 368 1 49 28 0 - 18 4 49
4 Credit Institutions 3,053 3,053 - 0 - 0 - - - -
5 Other Financial Corporations 135 135 0 140 65 1 4 55 16 128
6 Non-Financial Corporations 12,842 12,742 101 5,912 2,082 133 505 1,155 2,037 5,294
7 Of which SMEs 3,793 3,707 85 3,348 653 90 136 836 1,634 3,074
8 Households 10,518 10,258 260 7,645 1,667 453 351 1,714 3,460 6,830
9 Debt Securities 9,649 9,649 - - - - - - - -
10 Central Banks - - - - - - - - - -
11 General Governments 9,456 9,456 - - - - - - - -
12 Credit Institutions 61 61 - - - - - - - -
13 Other Financial Corporations 3 3 - - - - - - - -
14 Non-Financial Corporations 129 129 - - - - - - - -
15 Off-balance sheet exposures 8,955 213 144
16 Central Banks - - -
17 General Governments 57 0 0
18 Credit Institutions 3 - -
19 Other Financial Corporations 36 - -
20 Non-Financial Corporations 7,584 202 136
21 Households 1,274 11 8
22 Total 46,821 37,504 362 13,959 3,842 586 860 2,941 5,516 12,445

National Bank of Greece
Consolidated Pillar III Report
31
Table 17: Performing and non-performing exposures and related provisions
a b c d e f g h i j k l m n
Gross carrying amount/ nominal amount Accumulated impairment, accumulated negative changes
in fair value due to credit risk and provisions Collateral and financial
guarantees received
Performing exposures Non performing exposures Performing exposures-
accumulated impairment and provisions
Non-performing exposures- accumulated impairment,
accumulated negative changes in fair value due to
credit risk and provisions On
performing exposures
On non-performing exposures
Of
which stage 1
Of which
stage 2
Of which stage 2
Of which stage 3
Of which stage
1
Of which stage
2
Of which stage
2
Of which
stage 3
Loans and advances
28,217 20,789 7,431 13,746 - 13,746 (565) (145) (421) (7,062) - (7,062) 13,724 5,805
Central Banks 1,299 1,299 - - - - - - - - - -
General Governments
370 331 38 49 49 (8) (3) (5) (34) (34) (8) 15
Credit Institutions 3,053 3,053 - 0 0 (0) (0) - (0) (0) - -
Other Financial Corporations
135 112 25 140 140 (15) (10) (5) (106) (106) 25 16
Non-Financial Corporations
12,842 11,280 1,565 5,912 5,912 (221) (76) (147) (3,725) (3,725) 5,974 1,635
Of which SMEs 3,793 2,731 1,062 3,348 3,348 (136) (25) (111) (2,094) (2,094) 1,936 989
Households 10,518 4,714 5,804 7,645 7,645 (320) (56) (264) (3,198) (3,198) 7,733 4,138
Debt Securities 9,649 8,409 1,240 - - - (80) (24) (56) - - - - -
Central Banks - - - - - - - - - - -
General Governments
9,456 8,215 1,240 - - (79) (23) (56) - - -
Credit Institutions 61 61 - - - (0) (0) - - - -
Other Financial Corporations
3 3 - - - - - - - - -
Non-Financial Corporations
129 129 - - - (0) (0) - - - -
Off-balance sheet exposures
8,955 8,607 347 213 - 213 (12) (5) (7) (49) - (49) - -
Central Banks - - - - - - - - - - -
General Governments
57 57 1 0 0 (0) (0) (0) (0) (0) -
Credit Institutions 3 3 - - - - - - - - -
Other Financial Corporations
36 36 0 - - (0) (0) - - - -
Non-Financial Corporations
7,584 7,245 339 202 202 (11) (4) (7) (49) (49) -
Households 1,274 1,266 8 11 11 (0) (0) (0) (0) (0) -
Total 46,821 37,805 9,018 13,959 - 13,959 (657) (174) (484) (7,111) - (7,111) 13,724 5,805

National Bank of Greece
Consolidated Pillar III Report
32
4.7. Credit Risk Mitigation techniques
Since 2007, NBG uses a specialised Collateral Management system, both for corporate and retail exposures. The system aims to:
Record Bank’s collaterals
Establish a connection between loan contract and collateral
Assess qualitatively all collaterals
Monitor collaterals’ market value and estimate coverage ratio
Provide information regarding each and every obligor’s collaterals
Retrieve necessary data for the estimation of capital requirements per facility
Automatically monitor the obligor’s entire credit risk position.
The Collateral Management system provides a large number of control elements, reducing operational risk, also keeping track of all securities offered to the Bank, both those that are currently active and those that matured.
The system calculates and/or keeps the following values per collateral:
Value as of input day
Current market value (for traded securities, etc.)
Security/Guarantee value: this is lower than the Current market value by a fixed proportion which, in turn, is based on the collateral’s liquidation feasibility
Market value, Tax value, Forced Sale value, Land and Buildings value and Construction Cost for all real estate collaterals.
In principle, NBG accepts the following credit risk mitigation types (funded and unfunded):
Guarantees from: o Physical and Legal entities, both from the Private and Public Sector o Central governments, Regional governments, local authorities and PSEs o Financial institutions o The Greek Government and the Hellenic Fund for Entrepreneurship and Development (ETEAN SA)
Pledges of o Securities (cheques and bills of exchange) o Deposits o Equity, Mutual funds and Non-tangible securities (bonds, etc.) o Claims against Central Government, Public and Private Sector Entities o Goods, Exported claims and Leases o Letters of Guarantee and Trademarks o Claims on Insurance Contracts o Claims from Credit Cards’ sales
Liens o On Real Estate and Ships
Other o Discounting of Bills of Exchange o Cash o Receivables
Credit and Counterparty Risk exposures secured by CRR eligible credit risk mitigation instruments (collateral and guarantees) as of 30.06.2019 (in € mio) were as follows:
Table 18 : EU CR3 - CRM techniques – Overview
a b c d e
Exposures unsecured -
Carrying amount
Exposures secured - Carrying amount
Exposures secured by collateral
Exposures secured by financial guarantees
Exposures secured by
credit derivatives
1 Total loans 7,663 26,672 19,844 6,829
2 Total debt securities 9,529 41 41 0
3 Total exposures 17,192 26,713 19,885 6,829
4 Of which defaulted 2,754 4,278 3,185 1,094

National Bank of Greece
Consolidated Pillar III Report
33
4.8. Portfolios under the Standardised Approach
External Credit Assessment Institutions (ECAI) used to risk weight exposures under the Standardised Approach are Standard & Poor's, Moody's Investors Service Ltd and Fitch Ratings Ltd. There is no process to transfer the issuer and issue credit assessments onto items not included in the trading book, as this is not applicable to NBG Group’s portfolios.
The asset classes for which ECAI ratings are used are the following:
Central Governments and Central Banks
Regional Governments and Local Authorities
Public Sector Entities
Financial Institutions
Corporates
The table below presents the Exposures (net of accounting provisions), before and after Credit Risk Mitigation (CRM), as of 30.06.2019, according to the supervisory exposure classes (amounts are in € mio):
Table 19: EU CR4 - Standardised approach - Credit Risk Exposure and CRM effects
a b c d e f
Exposures before CCF and CRM Exposures post CCF and CRM RWAs and RWA density
Exposure classes On-balance-
sheet amount Off-balance-
sheet amount On-balance-
sheet amount Off-balance-
sheet amount RWAs*
RWA density
Central governments or central banks 17,615 18,528 5,314 29%
Regional governments or local authorities 24 2 23 5 22%
Public sector entities 623 62 590 5 199 34%
Multilateral development banks 11 50 0%
International organisations 53 53 0%
Institutions 1,978 148 2,000 48 229 11%
Corporates 10,146 7343 9,619 1,155 10,836 101%
Retail 5,220 1815 3,764 17 2,627 69%
Secured by mortgages on immovable property 9,802 72 9,801 36 3,578 36%
Exposures in default 14,337 298 6,751 97 6,987 102%
Exposures associated with particularly high risk 310 19 147 3 224 149%
Covered bonds
Institutions and corporates with a short-term credit assessment
Collective investment undertakings
Equity 655 655 1,425 218%
Other items 3,061 3,061 2,374 78%
Total 63,835 9,759 55,041 1,360 33,798 60%
*Counterparty Credit Risk RWAS are not included

National Bank of Greece
Consolidated Pillar III Report
34
Table 20 : EU CR5 - Standardised approach
Exposure classes Risk Weight
Total* 0% 20% 25% 35% 50% 75% 100% 150% 250%
1 Central governments or central banks 13,324 2 131 4,930 141 18,528
2 Regional governments or local authorities
23 23
3 Public sector entities 494 101 595
4 Multilateral development banks 50 0 50
5 International organisations 53 0 53
6 Institutions 1,319 591 89 14 35 2,048
7 Corporates 10,321 452 10773
8 Retail 3,782 3,782
9 Secured by mortgages on immovable property
7,383 2,455 9,838
10 Exposures in default 6,570 278 6,848
11 Exposures associated with particularly high risk
149 149
12 Covered bonds
13 Institutions and corporates with a short-term credit assessment
14 Collective investment undertakings
15 Equity 141 514 655
16 Other items 672 19 2,370 3,061
17 Total 15,418 1,129 131 7,383 2,544 3,782 655 56,403
*Counterparty Credit Risk exposures are not included

National Bank of Greece
Consolidated Pillar III Report
35
5. COUNTERPARTY CREDIT RISK
CCR derives from OTC derivative and secured interbank transactions, namely repurchase agreements, and is calculated in both the trading portfolio and the banking book. The main contributor to CCR within NBG Group is the Bank.
The approach for the calculation of the exposure values for CRR depends on the type of transaction. For OTC derivative transactions, the exposure at default (EAD) is calculated based on the mark-to-market method. In particular, the EAD is calculated as the current value plus the potential future credit exposure, based on regulatory add-ons, taking into account the netting clauses and collateral agreements that are in place. In the case of repurchase agreements (i.e., repo/reverse repo), the EAD is calculated in accordance with the financial collateral comprehensive method.
In addition, the GFLRM Division calculates the capital requirements against credit valuation adjustment (CVA) risk. CVA is an adjustment to the fair value of derivative instruments to account for CCR, due to possible changes in the creditworthiness of the counterparty. NBG employs the standardized approach for the calculation of the respective capital requirements. The calculations only refer to transactions with financial insitutions.
The RWAs for CCR decreased during the first six months of 2019, mainly due to the reduction of the repo transactions wih financial institutions. The components of CCR on a Group level are shown in the tables below, as of June 28th, 2019.
Table 21: EU CCR1 - Analysis of CCR exposure by approach (€ mio)
Notional Replacement cost/ current market value
Potential Future Credit
Exposure EEPE Multiplier
EAD post CRM
RWAs
1 Mark to market 762 782 1,745 204 2 Original exposure 3 Standardised approach 4 IMM (for derivatives and SFTs) 5 Of which securities financing transactions
6 Of which derivatives and long settlement transactions
7 Of which from contractual cross-product netting
8 Financial collateral simple method (for SFTs)
9 Financial collateral comprehensive method (for SFTs)
480 96
10 VaR for SFTs
11 Total 300
Table 22: EU CCR2 – CVA capital charge (€ mio)
Exposure
value RWAs
1 Total portfolios subject to the advanced method
2 (i) VaR component (including the 3x multiplier)
3 (ii) SVaR component (including the 3x multiplier)
4 All portfolios subject to the standardised method 106 101
EU4 Based on the original exposure method
5 Total subject to the CVA capital charge 106 101

National Bank of Greece
Consolidated Pillar III Report
36
Table 23: EU CCR8 – Exposures to CCPs (€ mio)
EAD post CRM RWAs
1 Exposures to QCCPs (total) 108
2 Exposures for trades at QCCPs (excluding initial margin and default fund contributions); of which
650 108
3 (i) OTC derivatives 612 100
4 (ii) Exchange-traded derivatives 38 8
5 (iii) SFTs
6 (iv) Netting sets where cross-product netting has been approved
7 Segregated initial margin
8 Non-segregated initial margin
9 Prefunded default fund contributions 6
10 Alternative calculation of own funds requirements for exposures
11 Exposures to non-QCCPs (total)
12 Exposures for trades at non-QCCPs (excluding initial margin and default fund contributions); of which
113 (i) OTC derivatives
14 (ii) Exchange-traded derivatives
15 (iii) SFTs
17 Segregated initial margin
18 Non-segregated initial margin
19 Prefunded default fund contributions
20 Unfunded default fund contributions
Table 24: EU CCR3 - Standardised approach - CCR exposures by regulatory portfolio and risk (€ mio)
Exposure classes Risk Weight Total
0% 2% 4% 10% 20% 50% 70% 75% 100% 150% Others
1 Central governments or central banks
944 944
2 Regional governments or local authorities
3 Public sector entities
4 Multilateral development banks
5 International organisations
6 Institutions 6 123 1,011 96 2 2 1,239 7 Corporates 41 1 42 8 Retail
9 Institutions and corporates with a short-term credit assessment
10 Other items
11 Total 950 123 1,011 96 42 3 2,225
Table 25: EU CCR6 - Credit derivatives exposures (€ mio)
Credit derivative hedges Other credit derivatives Protection bought Protection sold
Notionals Single-name credit default swaps 25
Index credit default swaps Total return swaps Credit options Other credit derivatives
Total notionals 25
Fair values
Positive fair value (asset)
Negative fair value (liability) 2

National Bank of Greece
Consolidated Pillar III Report
37
6. MARKET RISK
The Bank uses market risk models and specific processes to assess and quantify the portfolio’s market risk, based on best practice and industry-wide accepted risk metrics. More specifically, the Bank estimates the market risk of its trading and the held-to-collect-and-sell (HTCS) portfolios using the Value at Risk (VaR) methodology. In particular, it has adopted the Variance-Covariance (VCV) methodology, with a 99% confidence interval and 1-day holding period.
The variance-covariance methodology can be summarized as follows:
1. Collection of transactional data per type of product; 2. Identification of “risk factors” i.e., variables whose price changes could affect the value of the portfolio. The risk factors relevant to
the financial products in the Bank’s portfolio are interest rates, equity indices, foreign exchange rates and commodity prices; 3. Collection of market data for instruments/positions valuation; 4. Specification of the confidence interval and the holding period for the VaR calculations at 99% and 1-day, respectively; 5. Estimation of the model’s parameters:
o the variance of each risk factor, from which respective volatilities are derived; o the covariance of the risk factors, from which respective correlations are derived; o the beta of stocks; o the volatility for the estimation of equity specific risk.
6. Estimation of the VaR per type of risk (interest rate risk, equity risk, foreign exchange risk); 7. Estimation of Total VaR, taking into consideration the correlation matrix among all risk factors.
The calculation of the model’s parameters relies on the following statistical assumptions:
Returns on individual risk factors follow a normal distribution
Portfolio’s payout is considered to be linear
The VaR is calculated on a daily basis for the Bank’s trading and HTCS portfolios, along with the VaR per risk type (interest rate, equity and foreign exchange risk). The VaR estimates are used internally as a risk management tool, as well as for regulatory purposes. The GFLRM Division calculates the VaR of the Bank’s trading and HTCS portfolios, for internal use, on a daily basis, using the latest 75 exponentially weighted daily observations to construct the respective VCV matrices. For regulatory purposes, the calculations apply only on the trading portfolio and the VCV matrices are based on 252, equally weighted, daily observations per risk factor. Currently the number of risk factors involved in the VaR calculations is 1,439.
Morover, since the Bank has approval to use an internal model approach only for general market risk purposes, the issuer risk and the equity specific risk of the portfolio are excluded from the regulatory VaR calculations. The respective capital requirements are based on the Stansardized Approach.
Additionally, the GFLRM Division calculates the stressed VaR (sVaR) of the Bank’s trading portfolio, which is defined as the VaR, where model inputs are calibrated to historical data from a continuous 1-year period of significant financial stress, relevant to the Bank’s portfolio. To identify this 1-year time window of significant stress, NBG follows a conservative approach, which covers the entire period from the beginning of the financial crisis of 2008. More specifically, VCV matrices dating back to the 3rd of January 2008, are calculated on a daily basis and the VCV matrix that corresponds to the maximum VaR of NBG’s trading portfolio, over the entire period, is selected. To ensure consistency, at each year-end, the process is repeated for certain days of the last calendar month of the year, and subsequently the identified “stressed VCV matrix” is applied over the next year. Similarly to VaR, NBG calculates sVaR on a daily basis, using a 1-day holding period and 99% confidence level.
For the calculation of the regulatory capital requirements, the VaR and sVaR are scaled up to 10-days via the square-root-of-time rule1.
Based on the above, the capital charges for the Bank’s general market risk are calculated as the sum of the following two amounts:
the maximum of: a) the VaR of the previous day, calculated with a 10-days holding period, b) the average VaR of the last 60-days, using a 10-days holding period and multiplied by a factor(mc), determined by the regulator and varying between three (3) and four (4),
plus
the maximum of: a) the Stressed VaR of the previous day, calculated with a 10-days holding period, b) the average Stressed VaR of the last 60-days, using a 10-days holding period and multiplied by a factor (ms), determined by the regulator and varying between three (3) and four (4).
Finally, the use of internal model is granted only for NBG, therefore the calculation of market risk capital charges for the rest of the Group’s subsidiaries is based on the Standardized Approach.
The components of capital requirements under the standardized approach and the internal model approach for market risk, as of 28th June, 2019, are shown in the tables below.
1 10-day VaR is obtained by multiplying the 1-day VaR with the square root of 10 (i.e. 𝑉𝑎𝑅10−𝑑𝑎𝑦=𝑉𝑎𝑅1−𝑑𝑎𝑦∗√10)

National Bank of Greece
Consolidated Pillar III Report
38
Table 26: EU MR1 – Market risk under the standardized approach (€ mio)
RWAs Capital requirements
Outright products
1 Interest rate risk (general and specific) 56 4
2 Equity risk (general and specific) 81 6
3 Foreign echange risk 178 14
4 Commodity risk Options
5 Delta-plus method 294 24
6 Total 609 49
Table 27: EU MR2-A – Market risk under the IMA (€ mio)
RWAs Capital
requirements
1 VaR (higher of values a and b) 219 18 (a) Previous day’s VaR (Article 365(1) of the CRR (VaRt-1)) 6
(b) Average of the daily VaR (Article 365(1)) of the CRR on each of the preceding 60 business days (VaRavg) x multiplication factor (mc) in accordance with Article 366 of the CRR
18
2 SVaR (higher of values a and b) 606 48 (a) Latest SVaR (Article 365(2) of the CRR (SVaRt-1)) 16
(b) Average of the SVaR (Article 365(2) of the CRR) during the preceding 60 business days (SVaRavg) x multiplication factor (ms) (Article 366 of the CRR)
48
6 Total 825 66
Table 28: EU MR2-B – RWA flow statements of market risk expsoures under the IMA (€ mio)
VaR SVaR IRC Comprehensive
risk measure Other
Total RWAs
Total capital requirements
1 RWAs as of March 29, 2019 220 683 - - - 903 72
1a Regulatory adjustment 135 444 - - - 579 46
1b RWAs at the previous quarter-end (end of the day) 85 239 - - - 323 26
2 Movement in risk levels -5 -32 - - -
3 Model updates/changes - - -
4 Methodology and policy - - -
5 Acquisitions and disposals - - -
6 Foreign exchange movements - - -
7 Other -5 -10 - - -
8a RWAs at the end of the reporting period (end of the day) 75 197 - - - 272 22
8b Regulatory adjustment 145 408 - - - 553 44
8 RWAs as of June 28, 2019 219 606 - - - 825 66
The interest rate sensitivity of the Bank’s trading book decreased in the second quarter of 2019, thus leading to lower capital requirements against General Market Risk, under the internal method approach.
Finally, the Bank’s regulatory VaR and sVaR estimates during the last reporting period are shown in the table below.
Table 29: EU MR3 – IMA values for trading portfolios (€ mio)
VaR (10 day 99%)
1 Maximum value 9
2 Average value 6
3 Minimum value 5
4 Period end 6
SVaR (10 day 99%)
5 Maximum value 24
6 Average value 17
7 Minimum value 14
8 Period end 16

National Bank of Greece
Consolidated Pillar III Report
39
6.1. Stress Testing
The daily VaR refers to “normal” market conditions. Supplementary analysis is, however, necessary for capturing the potential loss that might incur under extreme and unusual conditions in financial markets. Thus, the GFLRM Division conducts stress testing on a weekly basis, through the application of different stress scenarios on the relevant risk factors (interest rates, equity indices, foreign exchange rates). Stress testing is performed on both the Trading and the HTCS portfolios, as well as separately on the positions of the Trading Book.
The scenarios used are shown in the table below:
Table 30: Stress test Scenarios
Scenario Description
Interest Rate Risk 0 - 3 months 3 months –5 years > 5 years
1 Parallel Curve shift +200 bps. +200 bps. +200 bps. 2 Parallel Curve shift -200 bps. -200 bps. -200 bps. 3 Steepening of the curve 0 bps. +100 bps. +200 bps. 4 Flattening of the curve +200 bps. +100 bps 0 bps.
Equity Risk -30% for all indices
Foreign Exchange Risk EUR depreciation by 30%/EUR appreciation by
30%
Additionally, the following volatility stress test scenarios are defined and the Trading and HTCS P&L is assessed, on a daily basis
Table 31: Volatility stress test Scenarios
Scenario Description
1 IR: normal +1bp, lognormal +1%, EQT & FX: +1%
2 IR: normal +5bp, lognormal +5%, EQT & FX: +5% 3 IR: normal +10bp, lognormal +10%, EQT & FX: +10% 4 IR: normal -1bp, lognormal -1%, EQT & FX: -1% 5 IR: normal -5bp, lognormal -5%, EQT & FX: -5% 6 IR: normal -10bp, lognormal -10%, EQT & FX: -10%
6.2. Back testing
In order to verify the predictive power of the VaR model used for the calculation of Market Risk capital requirements, the Bank conducts back-testing on a daily basis. In accordance with the guidelines set out in the Capital Requirements Regulation 575/2013, the calculations only refer to the Bank’s trading portfolio and involve the comparison of the hypothetical as well as the actual daily gains/losses of the portfolio, with the respective estimates of the VaR model used for regulatory purposes. The hypothetical gains/losses is the change in the value of the portfolio between days t and t+1, assuming that the portfolio remains constant between the two days. In the same context, the actual gains/losses is the change in the value of the portfolio between days t and t+1, including all the transactions and/or any realized gains/losses that took place in day t+1, excluding fees, commissions and net interest income.
Any excess of the hypothetical/actual losses over the VaR estimate is reported to the regulatory authorities within five business days. During the first six months of 2019, there was one case, in which the back-testing result exceeded the respective VaR calculation.
The graph below illustrates the regulatory VaR, as well as the hypothetical and the actual P&L, over the last year.
Figure 1: EU MR4 – Comparison of VaR estimates with gains/losses
-10
-5
0
5
10
EUR
mio
Actual Gain/Loss Hypothetical Gain/Loss Daily VaR Daily VaR