Embed Size (px)
Citation preview

IV Report Title
National Assessment of Shoreline Change: Historical Shoreline Change along the New England and Mid-Atlantic Coasts
Open-File Report 2010–1118U.S. Department of the InteriorU.S. Geological Survey

COVER: The cover is an oblique aerial photograph of Brigantine Inlet, looking south toward Atlantic City, NJ.

National Assessment of Shoreline Change: Historical Shoreline Change along the New England and Mid-Atlantic Coasts
by Cheryl J. Hapke, Emily A. Himmelstoss, Meredith G. Kratzmann, Jeffrey H. List, and E. Robert Thieler
Open-File Report 2010-1118
U.S. Department of the InteriorU.S. Geological Survey

U.S. Department of the InteriorKEN SALAZAR, Secretary
U.S. Geological SurveyMarcia K. McNutt, Director
U.S. Geological Survey, Reston, Virginia: 2011
This report and any updates to it are available online at: http://pubs.usgs.gov/of/2010/1118/
For product and ordering information: World Wide Web: http://www.usgs.gov/pubprod Telephone: 1-888-ASK-USGS (1-888-275-8747)
For more information on the USGS—the Federal source for science about the Earth, its natural and living resources, natural hazards, and the environment: World Wide Web: http://www.usgs.gov Telephone: 1-888-ASK-USGS
Any use of trade, product, or firm names is for descriptive purposes only and does not imply endorsement by the U.S. Government.
Although this report is in the public domain, permission must be secured from the individual copyright owners to reproduce any copyrighted material contained within this report.
Suggested citation: Hapke, C.J., Himmelstoss, E.A., Kratzmann, M.G., List, J.H., and Thieler, E.R., 2011, National assessment of shoreline change: Historical shoreline change along the New England and Mid-Atlantic coasts: U.S. Geological Survey Open-File Report 2010-1118, 57p.

iii
ContentsExecutive Summary .......................................................................................................................................1Introduction.....................................................................................................................................................2
U.S. Geological Survey National Assessment of Shoreline Change Project ..............................2The Role of State and Federal Governments ............................................................................................2Prior New England And Mid-Atlantic Coast Shoreline Assessments ..................................................4Methods Of Analyzing Shoreline Change ..................................................................................................4
Compilation of Shoreline Position ......................................................................................................4High Water Line (HWL) Shoreline .............................................................................................4Lidar-Derived Mean High Water (MHW) Shoreline ...............................................................6
The Proxy-Datum Bias Correction between HWL and MHW Shorelines ...................................9Uncertainty in the Proxy-Datum Bias .....................................................................................11Use of the Proxy-Datum Bias and Bias Uncertainty in Shoreline Change Analysis ......11
Estimation of Shoreline Position Uncertainty ................................................................................11HWL Shoreline Position Uncertainty ......................................................................................12Lidar-Derived MHW Shoreline Position Uncertainty ...........................................................12
Calculation and Interpretation of Shoreline Change Rates .........................................................13End-Point Rates (Short-Term) ..................................................................................................15Linear Regression Rates (Long-Term) ....................................................................................15
Estimation of Shoreline Change Rate Uncertainty ........................................................................16Rate Uncertainty at Individual Transects ..............................................................................16Regionally Averaged Rate Uncertainty ..................................................................................16
Human Beach Alterations that Influence Rates of Change .........................................................17Geology and Geomorphology of the New England and Mid-Atlantic Coast ......................................17
General Geologic Setting ..................................................................................................................17Coastal Processes ..............................................................................................................................19Sea-Level Rise .....................................................................................................................................21Sediment Sources and Transport ....................................................................................................22
Landforms of the New England and Mid-Atlantic Coasts .....................................................................24Coastal Landforms of New England ................................................................................................24Coastal Landforms of the Mid-Atlantic ..........................................................................................24Estuaries and Lagoons in the New England and Mid-Atlantic Areas ........................................24
History of Infrastructure Development ....................................................................................................25Historical Shoreline Change Analysis ......................................................................................................26
New England: Maine to Rhode Island .............................................................................................301: New England North Region ..................................................................................................332: Greater Boston Region .........................................................................................................353: Cape Cod Region ....................................................................................................................374: Massachusetts Islands Region ...........................................................................................395: New England South Region .................................................................................................41
Mid-Atlantic: New York to Virginia ..................................................................................................416: Long Island Region ................................................................................................................43

iv
7:New Jersey North Region .....................................................................................................458: New Jersey South Region ....................................................................................................479:Delmarva North Region .........................................................................................................49
10: Delmarva South/Southern Virginia Region........................................................................51Discussion and Additional Considerations ..............................................................................................52
Summary of Shoreline Changes .......................................................................................................52Influence of Human Activities ..........................................................................................................52Planned Updates and Related Research ........................................................................................53
Acknowledgments .......................................................................................................................................53References Cited..........................................................................................................................................53
Figures 1. Index map of New England and the Mid-Atlantic showing the 10 analysis regions used in this study ...............................................................................................................................32. Graphs showing an example of a lidar profile from Island Beach State Park in
New Jersey. ..............................................................................................................................83. Schematic diagrams showing examples of common conditions where
transects are eliminated in the absence of four shoreline intersections ....................154. Oblique aerial photograph showing an extensive groin field at
Beach Haven, NJ ...................................................................................................................18 5. Map of the (a) New England and (b) Mid-Atlantic coasts showing the
geomorphic provinces and the general distribution of coastal landforms. .................19 6. Map showing the Last Glacial Maximum extent of the Laurentide ice sheet in
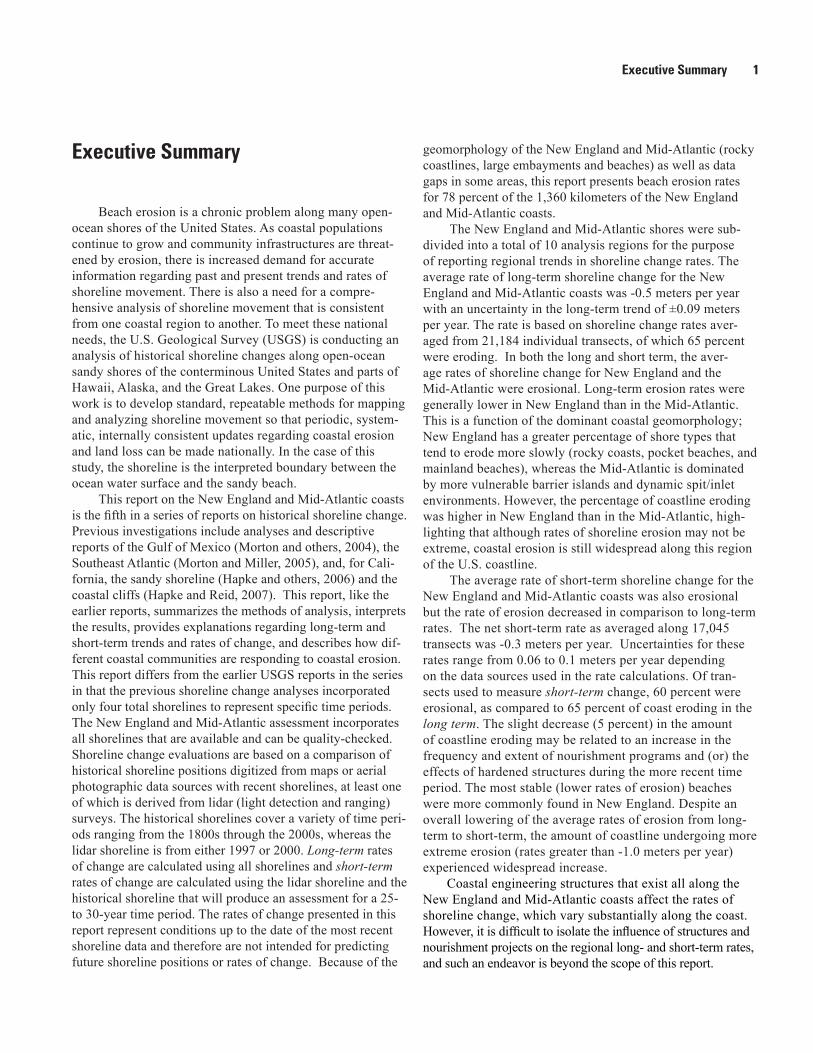
New England ..........................................................................................................................207. Graphs showing sea-level rise curves for the last (a) 160,000 years and (b) 24,000 years on the East Coast of the United States. ...................................................................21 8. Graphs showing long-term (100-year) trends in average annual sea level at selected
tide gages in New England and the Mid-Atlantic ............................................................239. Oblique aerial photographs showing the various geomorphic shore types
along the New England and Mid-Atlantic coasts ............................................................2510. Schematic diagram showing common coastal landforms of New England
and the Mid-Atlantic .............................................................................................................26 11. Index map of (a) New England and (b) the Mid-Atlantic showing geographic names
discussed in this report. .................................................................................................. 30-31 12. Graphs showing long- and short-term shoreline change rates for the
New England North region ...................................................................................................32 13. Oblique aerial photograph of Castle Neck, MA, in the New England
North region ...........................................................................................................................33 14. Graphs showing long- and short-term shoreline change rates for the Greater Boston
region.......................................................................................................................................34 15. Oblique aerial photographs of (a) Brace Cove, MA, looking west, with the city of
Gloucester in the background; and (b) Duxbury Beach, MA, a popular tourist beach south of Boston, looking south, in the Greater Boston region ..................................35
16. Graphs showing long- and short-term shoreline change rates for the Cape Cod region ....................................................................................................................36
17. Oblique aerial photograph of Monomoy Island, MA. ............................................................37

v
18. Graphs showing long- and short-term shoreline change rates for the Massachusetts Islands region ............................................................................................38
19. Oblique aerial photograph of Madaket Inlet and Esther Island in the Massachusetts Islands region.........................................................................................................................39
20. Graphs showing long- and short-term shoreline change rates for the New England South region. .................................................................................................40
21. Oblique aerial photographs of locations in the New England South region. ....................41 22. Graphs showing long- and short-term shoreline change rates for the
Long Island region. ................................................................................................................42 23. Oblique aerial photograph looking east along Jones Beach, NY .......................................43 24. Graphs showing long- and short-term shoreline change rates for the
New Jersey North region ....................................................................................................44 25. Oblique aerial photograph looking west along Long Branch, NJ .......................................45 26. Graphs showing long- and short-term shoreline change rates for the
New Jersey South region ....................................................................................................46 27. Oblique aerial photograph at Brigantine Inlet, looking south toward
Atlantic City, NJ .....................................................................................................................47 28. Graphs showing long- and short-term shoreline change rates for the
Delmarva North region. ........................................................................................................48 29. Oblique aerial photograph of Ocean City Inlet in the Delmarva North region. .................49 30. Graphs showing long- and short-term shoreline change rates for the
Delmarva South/Southern Virginia region ........................................................................50 31. Oblique aerial photograph looking southwest along the southern end of Cedar Island in
the Delmarva South/Southern Virginia region..................................................................51
Tables
1. Providers and original sources of historical shorelines for each New England and Mid-Atlantic (NEMA) region ..........................................................................................5
2. Shorelines used to calculate short- and long-term change rates of the (a) New England region and (b) Mid-Atlantic region ................................................................... 6-7
3. List of tide-gage measurements used to calculate mean high water (MHW) elevation .................................................................................................9
4. Absolute horizontal and vertical differences between High Water Line (HWL) and Mean High Water Line (MHWL) shorelines ......................................................................10
5. Average uncertainties for the New England and Mid-Atlantic shorelines .......................13 6. Long-term (a) and short-term (b) shoreline change rate uncertainties for New
England and Mid-Atlantic regional averages ...................................................................14 7. Summary of major tropical and extratropical storms impacting the
New England and Mid-Atlantic coasts since 1900 ..........................................................22 8. Relative distribution of geomorphic shore-types along the New England and
Mid-Atlantic coasts ..............................................................................................................27 9. Average long-term (a) and short-term (b) shoreline change rates for the
New England and Mid-Atlantic (NEMA) coasts .............................................................28 10. Maximum shoreline change rates for the (a) New England and
(b) Mid-Atlantic coast ...........................................................................................................29
Executive Summary
Beach erosion is a chronic problem along many open-ocean shores of the United States. As coastal populations continue to grow and community infrastructures are threat-ened by erosion, there is increased demand for accurate information regarding past and present trends and rates of shoreline movement. There is also a need for a compre-hensive analysis of shoreline movement that is consistent from one coastal region to another. To meet these national needs, the U.S. Geological Survey (USGS) is conducting an analysis of historical shoreline changes along open-ocean sandy shores of the conterminous United States and parts of Hawaii, Alaska, and the Great Lakes. One purpose of this work is to develop standard, repeatable methods for mapping and analyzing shoreline movement so that periodic, system-atic, internally consistent updates regarding coastal erosion and land loss can be made nationally. In the case of this study, the shoreline is the interpreted boundary between the ocean water surface and the sandy beach.
This report on the New England and Mid-Atlantic coasts is the fifth in a series of reports on historical shoreline change. Previous investigations include analyses and descriptive reports of the Gulf of Mexico (Morton and others, 2004), the Southeast Atlantic (Morton and Miller, 2005), and, for Cali-fornia, the sandy shoreline (Hapke and others, 2006) and the coastal cliffs (Hapke and Reid, 2007). This report, like the earlier reports, summarizes the methods of analysis, interprets the results, provides explanations regarding long-term and short-term trends and rates of change, and describes how dif-ferent coastal communities are responding to coastal erosion. This report differs from the earlier USGS reports in the series in that the previous shoreline change analyses incorporated only four total shorelines to represent specific time periods. The New England and Mid-Atlantic assessment incorporates all shorelines that are available and can be quality-checked. Shoreline change evaluations are based on a comparison of historical shoreline positions digitized from maps or aerial photographic data sources with recent shorelines, at least one of which is derived from lidar (light detection and ranging) surveys. The historical shorelines cover a variety of time peri-ods ranging from the 1800s through the 2000s, whereas the lidar shoreline is from either 1997 or 2000. Long-term rates of change are calculated using all shorelines and short-term rates of change are calculated using the lidar shoreline and the historical shoreline that will produce an assessment for a 25- to 30-year time period. The rates of change presented in this report represent conditions up to the date of the most recent shoreline data and therefore are not intended for predicting future shoreline positions or rates of change. Because of the
geomorphology of the New England and Mid-Atlantic (rocky coastlines, large embayments and beaches) as well as data gaps in some areas, this report presents beach erosion rates for 78 percent of the 1,360 kilometers of the New England and Mid-Atlantic coasts.
The New England and Mid-Atlantic shores were sub-divided into a total of 10 analysis regions for the purpose of reporting regional trends in shoreline change rates. The average rate of long-term shoreline change for the New England and Mid-Atlantic coasts was -0.5 meters per year with an uncertainty in the long-term trend of ±0.09 meters per year. The rate is based on shoreline change rates aver-aged from 21,184 individual transects, of which 65 percent were eroding. In both the long and short term, the aver-age rates of shoreline change for New England and the Mid-Atlantic were erosional. Long-term erosion rates were generally lower in New England than in the Mid-Atlantic. This is a function of the dominant coastal geomorphology; New England has a greater percentage of shore types that tend to erode more slowly (rocky coasts, pocket beaches, and mainland beaches), whereas the Mid-Atlantic is dominated by more vulnerable barrier islands and dynamic spit/inlet environments. However, the percentage of coastline eroding was higher in New England than in the Mid-Atlantic, high-lighting that although rates of shoreline erosion may not be extreme, coastal erosion is still widespread along this region of the U.S. coastline.
The average rate of short-term shoreline change for the New England and Mid-Atlantic coasts was also erosional but the rate of erosion decreased in comparison to long-term rates. The net short-term rate as averaged along 17,045 transects was -0.3 meters per year. Uncertainties for these rates range from 0.06 to 0.1 meters per year depending on the data sources used in the rate calculations. Of tran-sects used to measure short-term change, 60 percent were erosional, as compared to 65 percent of coast eroding in the long term. The slight decrease (5 percent) in the amount of coastline eroding may be related to an increase in the frequency and extent of nourishment programs and (or) the effects of hardened structures during the more recent time period. The most stable (lower rates of erosion) beaches were more commonly found in New England. Despite an overall lowering of the average rates of erosion from long-term to short-term, the amount of coastline undergoing more extreme erosion (rates greater than -1.0 meters per year) experienced widespread increase.
Coastal engineering structures that exist all along the New England and Mid-Atlantic coasts affect the rates of shoreline change, which vary substantially along the coast. However, it is difficult to isolate the influence of structures and nourishment projects on the regional long- and short-term rates, and such an endeavor is beyond the scope of this report.
Executive Summary 1

2 National Assessment of Shoreline Change: Historical Shoreline Change along the New England and Mid-Atlantic Coasts
Introduction
U.S. Geological Survey National Assessment of Shoreline Change Project
Sandy ocean beaches are some of the most popular tourist and recreational destinations in the United States, and consti-tute some of the most valuable real estate in the country. These dynamic interfaces between water and land are commonly the sites of high-density residential and commercial development, despite the frequent natural hazards that can occur, including flooding, storm impacts, coastal erosion, and tsunami inunda-tion. Partly in response to growing coastal hazards, the U.S. Geological Survey (USGS) is currently conducting a nation-wide assessment of shoreline change rates and trends for open-ocean coasts. Shoreline position is one of the most commonly monitored indicators of environmental change (Morton, 1996), and is an easily understood feature representing the historical movement of beaches.
A principal purpose of the USGS shoreline change research is to develop a consistent methodology that allows for periodic updates that incorporate improved methods and data, yet still results in a dataset that is internally consistent at a national scale. In particular, recent methods for develop-ing datum-based shorelines using lidar (light detection and ranging) data and assessing coastal change will provide the opportunity to achieve and incorporate more comprehensive error assessments in the future. The primary objectives of this effort are to conduct research on improved methods of assess-ing and monitoring shoreline movement and develop a better understanding of the processes controlling shoreline change. Achieving these objectives requires research that (1) examines the original sources of shoreline data (maps, air photos, lidar), (2) evaluates the errors associated with each data source, (3) investigates new methods for developing datum-based shore-lines and quantifying potential bias and errors associated with integrating shoreline proxies from different sources, (4) devel-ops standard, uniform methods of shoreline change analysis, (5) assesses the effects of human activities on shoreline move-ment and rates of change, and (6) integrates shoreline change observations with other information, such as geologic frame-work and sediment transport data.
This report summarizes historical changes (accretion and erosion) of sandy shorelines in 10 regions of the U.S. New England and Mid-Atlantic coasts (fig. 1). The report emphasizes the hazard from erosion at regional scales and strives to relate this hazard to the body of knowledge regard-ing coastal geology of the New England and Mid-Atlantic region because of its potential impact on natural resources and the economy. Results of the National Assessment of Shoreline Change are organized by coastal regions (Mor-ton and others, 2004; Morton and Miller, 2005; Hapke and others, 2006; and Hapke and Reid, 2007). This report for the New England and Mid-Atlantic coasts is part of a series
of reports that include text summarizing methods, results, and implications of the results. In addition, the geographic information system (GIS) data used in the analyses are made available for download. The rates of shoreline change are being published for the purpose of regional characterization. The shoreline change results and products presented in this report are not intended for detailed site-specific analysis of shoreline movement, nor are they intended to replace any official sources of shoreline change information identified by local or State government agencies, or other Federal entities that are used for regulatory purposes.
Rates of shoreline change presented herein may differ from other published rates, and differences do not necessarily indicate that the other rates are inaccurate. Some discrepan-cies are to be expected, considering the many possible ways of determining shoreline positions and rates of change, and the inherent uncertainty in calculating these rates. Rates of shoreline change presented in this report represent shoreline movement under past conditions and are not intended for use in predicting future shoreline positions or future rates of shoreline change.
The Role of State and Federal Governments
One reason for conducting this National Assessment of Shoreline Change is that there had been no widely accepted standardized method of analyzing shoreline changes. Each state or region has its own data needs and coastal-zone man-agement responsibilities (for example, construction set-back lines). Therefore, different techniques and standards are used to compile shorelines and to calculate rates of shoreline move-ment. Consequently, existing calculated rates of shoreline change and projected shoreline positions are inconsistent from state to state and even within states, and cannot be compared directly or used to understand regional trends. These inconsis-tencies were clearly demonstrated by the Federal Emergency Management Agency- (FEMA) sponsored erosion studies (Crowell and Leatherman, 1999) that were used as the basis for evaluating erosion hazards (Heinz Center, 2000). The USGS National Assessment of Shoreline Change represents the first effort to compile shorelines from original data sources and calculate rates of shoreline change on a national scale using internally consistent methods. The results of the analyses allow direct comparison of rates of change from one coastal segment to another and form the basis for future comparison of shoreline position.
Several Federal agencies (USGS, FEMA, the National Oceanic and Atmospheric Administration (NOAA), U.S. Army Corps of Engineers (USACE)) have regulatory or

The Role of State and Federal Governments 3
New York
Pennsylvania
Vermont
New Jersey
New Hampshire
Massachusetts
Maine
Maryland
Connecticut
Delaware
Virginia
RhodeIsland
Canada
1
2
3
45
6
7
8
9
10
ATLANTIC
OCEAN
Analysis Region1 New England North
2 Greater Boston
3 Cape Cod
4 Massachusetts Islands
5 New England South
6 Long Island
7 New Jersey North
8 New Jersey South
9 Delmarva North
10 Delmarva South/Southern Virginia
Figure 1. Base from Medium Resolution (1:70,000 scale, NAD 83) Digital Vector Shoreline of the coterminous United States: National Oceanic and Atmospheric Administration, 1994.
0 10050 KILOMETERS
0 10050 MILES
70°W72°W74°W76°W44°N
42°N
40°N
38°N
EXPLANATION
Figure 1. Index map of New England and the Mid-Atlantic showing the 10 analysis regions used in this study.

4 National Assessment of Shoreline Change: Historical Shoreline Change along the New England and Mid-Atlantic Coasts
administrative responsibilities pertaining to shorelines, yet these responsibilities are quite different, requiring different approaches and offering substantial opportunities for coop-eration. For example, the USACE is authorized and funded by Congress to report on the economic and environmental implications of shoreline change and the costs of erosion miti-gation. The National Shoreline Management Study (Stauble and Brumbaugh, 2003) is being conducted by the USACE using existing shoreline data. The USGS will share data and information, such as the lidar-derived shoreline and rates of change, in support of their effort. NOAA has the mandate to establish the official shoreline boundary for the Nation using tidal datums. Because its emphasis is on safe naviga-tion, NOAA is using the shoreline to generate nautical charts. FEMA is authorized and partially funded by Congress to map coastal (and riverine) flood-hazard areas. These maps and associated information are used for flood-risk assessment, flood-plain management, and setting insurance rates through the National Flood Insurance Program (NFIP). As a result of discrepancies that were identified in the way the NFIP assesses coastal erosion, Congress authorized FEMA to report on the economic impact of erosion hazards on coastal communi-ties, and on the NFIP. To accomplish this, FEMA contracted with State agencies and academic researchers to conduct a pilot study of erosion hazards that included shoreline change data for limited geographic areas. The USGS is responsible for conducting research pertaining to coastal change hazards including shoreline change, understanding the processes that cause coastal change, and developing models to predict future change. The USGS is the only government agency that has a dedicated program to monitor coastal change into the future using consistent methods nationwide. Such a program is critically important for addressing national issues, such as identifying regions of chronic erosion due to storms, sediment deficits, and sea-level rise.
Prior New England and Mid-Atlantic Coast Shoreline Assessments
Few studies of regional shorelines change exist for the New England and Mid-Atlantic coast. The USACE (1971) conducted the first national assessment of coastal erosion that included New England and the Mid-Atlantic. The 1971 study identified areas of critical and non-critical erosion on the basis of economic development and potential for property loss, but rates of shoreline movement were not quantified. An abun-dance of analyses of shoreline change at specific sites has been conducted by private consultants or contractors, or cities and counties where data on erosion rates have been required for regulatory or management purposes. Some of these analyses were incorporated into regional shoreline change assessments by Dolan and others (1985), who presented rates of change on
maps and summarized trends. This effort was expanded with the compilation of data in the Coastal Erosion Information System (Dolan and others, 1989), which was the first digital database that provided shoreline change information from different sources to make them available to end-users. The rates of change incorporated into the Coastal Erosion Informa-tion System were determined by using a variety of methods, techniques, and original data sources and, therefore, there was little consistency for comparison of rates or trends in a regional context.
Since the publication of these earlier works, methods of obtaining, analyzing, displaying, and storing shoreline data have improved substantially. Coastal scientists have not agreed on standard methods for analyzing and reporting shoreline changes, nor have they identified rigorous mathematical tests that are widely accepted for quantifying the change and associated errors, although many are based on the research presented in Dolan and others (1991). The FEMA-sponsored erosion study (Crowell and Leatherman, 1999) highlighted the variety of approaches being utilized for measuring shoreline change in different parts of the country. For the New Eng-land and Mid-Atlantic coast, researchers presented shore-line change analyses for one county each in Massachusetts (O’Connell and Leatherman, 1999), New York (Leatherman and Anders, 1999), and New Jersey (Farrell and others, 1999); the State of Delaware (Leatherman and Eskandary, 1999); and the City of Virginia Beach (Fenster and Dolan, 1999). Despite the more recent efforts using modern digital techniques for measuring coastal change, there is still a critical need for (1) a nationwide compilation of reliable shoreline data, including the most recent shoreline position; and (2) a standardization of methods for obtaining and comparing shoreline positions and mathematically analyzing the trends.
Methods of Analyzing Shoreline Change
Compilation of Shoreline Position
High Water Line (HWL) ShorelineCoastal researchers in universities and government
agencies in the United States have been quantifying rates of shoreline movement and studying coastal change for decades. Before global positioning system (GPS) and lidar technologies were developed, the most commonly used sources of historical shoreline position were NOAA T-sheets (Shalowitz, 1964) and aerial photographs. Extraction of shoreline position from these data sources involves geo-referencing maps or aerial photographs, and subsequently interpreting and digitizing a shoreline position. Depending on location, data source, and scientific preference, different

Methods of Analyzing Shoreline Change 5
Organization Original Data Source Spatial Coverage
National Oceanic and Atmospheric Administra-tion (NOAA), Coastal Services Center Scanned NOAA T-sheets All NEMA regions
U.S. Geological Survey Lidar data cooperative with NOAA and U.S. Army Corps of Engineers All NEMA regions
U.S. Army Corps of Engineers, Coastal Engineer-ing Research Center (CERC)
Paper “CERC” maps compiled from NOAA T-sheets and air photos
Delmarva South and Southern Virginia,
Delmarva North
VA Coast Reserve Long-Term Ecological Re-search (LTER) Project
Digitized shorelines from NOAA T-sheets and 1967 air photos Delmarva South
MD Department of Natural Resources Digitized shorelines from NOAA T-sheets Delmarva North
NJ Department of Environmental Protection Digitized shorelines from NOAA T-sheets and 1970s air photos
New Jersey North,New Jersey South
NY Sea Grant Digitized shorelines from NOAA T-sheets and 1980-90s air photos Long Island
NY State Department of State Digitized shorelines from NOAA T-sheets, and 1960-80s air photos Long Island
RI Geological Survey / Univ. of Rhode Island Digitized shorelines from air photos New England South
MA Coastal Zone Management (CZM) Digitized shorelines from NOAA T-sheets and 1970-90s air photos All New England regions
Table 1. Providers and original sources of historical shorelines for each New England and Mid-Atlantic (NEMA) region.
proxies for shoreline position are used to document coastal change, including high water line (HWL), wet-dry line, veg-etation line, dune toe or crest, toe or berm of the beach, cliff base or top, and the line of mean high water (MHW).
The USGS National Assessment of Shoreline Change analysis for the New England and Mid-Atlantic coast incor-porates shoreline positions from a variety of dates and data sources. The earliest shoreline data are derived from T-sheets dating back to the mid-1800s. Several organizations have provided the USGS with digital maps and (or) shoreline data (table 1). In addition to shorelines from other organizations, shorelines were digitized from many historical T-sheets that were georeferenced in-house.
NOAA T-sheet indexes were used to determine T-sheet availability for shorelines that were not already available for download as Environmental Systems Research Institute (ESRI) GIS shapefiles. T-sheets were then requested from NOAA and received as scanned TIFF images. Existing digital shorelines from other data sources were compiled and a qual-ity assessment was performed.
T-sheets were rectified using ERDAS IMAGINE geo-graphic imaging software by placing at least six well-spaced ground control points (GCPs) on selected T-sheet graticules
in geographic coordinates. Some T-sheets produced before 1930 required additional coordinate transformation informa-tion from NOAA to convert from the United States Stan-dard Datum (USSD) to the North American Datum of 1927 (NAD 27). The datum transformation was applied to T-sheet graticule coordinates prior to rectification. Total root mean square error (RMSE) for the rectification process was main-tained below 1 pixel, which is approximately 4 m at a scale of 1:20,000 and approximately 1.5 m at a scale of 1:10,000. Typically the resulting RMSE was much lower than 1 pixel. Newly georeferenced T-sheets were loaded in ArcGIS and shorelines were digitized. All shoreline vectors were con-verted to the Universal Transverse Mercator (UTM) projec-tion on the North American Datum of 1983 (NAD 83).
Although the most recent shoreline used in the analy-sis is generally a mean high water (MHW) contour derived from lidar data (see next section), in several regions there are shorelines from aerial photography that are more recent than the lidar shorelines. Tables 2a and b list the final range of years for shorelines compiled for each period by region. Additional details on the years (and months, where known) of specific shorelines and their spatial coverage are available in the com-panion online data report (Himmelstoss and others, 2010).

6 National Assessment of Shoreline Change: Historical Shoreline Change along the New England and Mid-Atlantic Coasts
Region
Short-Term Rate (End Point)
Long-Term Rate (Linear Regression)
Date1 Source Type Date1 Source TypeNew England North 1978/1979 Air photo HWL 1850-1871 T-sheet HWL 2000 Lidar MHW 1901-1955 T-sheet HWL 1978-1979 Air photo HWL 2000 Lidar MHWGreater Boston 1978 Air photo HWL 1847-1895 T-sheet HWL 2000 Lidar MHW 1909-1960 T-sheet HWL 1978 Air photo HWL 1994 Air photo HWL 2000 Lidar MHWCape Cod 1970/1978 Air photo HWL 1848-1886 T-sheet HWL 2000 Lidar MHW 1909-1954 T-sheet HWL 1978-1979 Air photo HWL 1994 Air photo HWLMA Islands 1970/1978 Air photo HWL 1845-1897 T-sheet HWL 2000 Lidar MHW 1978-1979 Air photo HWL 1994 Air photo HWL 2000 Lidar MHWNew England South 1975/1978 Air photo HWL 1844-1895 T-sheet HWL 2000 Lidar MHW 1934-1963 T-sheet HWL 1975-1978 Air photo HWL 1985-1997 Air photo HWL 2000 Lidar MHW
2003 Air photo HWL2004 Air photo HWL2006 Air photo HWL
1Dates listed cover all available data for the Mid-Atlantic region. For details about dates of shoreline data used at a specific location within a region, refer to the shoreline data files available for download in the companion online data report (Himmelstoss and others, 2010).
[HWL, high water line; MHW, mean high water; Lidar, light detection and ranging]
Table 2a. Shorelines used to calculate short- and long-term change rates of the New England region.
Lidar-Derived Mean High Water (MHW) ShorelineAlthough in most cases the most recent shoreline used
in this National Assessment is a lidar-derived shoreline, in a few areas an aerial photograph-derived shoreline that is more recent than the lidar data was available. In these cases, a lidar-derived shoreline is still incorporated into the analysis, but it is not the most recent. The lidar data were collected by the USGS in cooperation with the National Aeronautics and Space Agency (NASA). This collaborative group has been using the NASA Airborne Topographic Mapper (ATM and ATMII) to map coastal areas since 1997 (Krabill and others, 2000; Sallenger and others, 2003). The data used in this study are part of the 2000 Fall East Coast Airborne Lidar Assessment
of Coastal Erosion (ALACE) Project. The ATM surveys ground elevation using an elliptically rotating blue-green laser. GPS positions and inertial navigation systems are used to correct for aircraft pitch, roll, and heading, providing ground elevations with accuracies of about ±15 cm (Sallenger and others, 2003). The lidar surveys used to extract shorelines for this report were conducted in 1997 and 2000.
To define the shoreline contour used, a shoreline defined as the operational MHW elevation contour was extracted from the lidar surveys using a method similar to the one developed by Stockdon and others (2002) (fig. 2). To determine the opera-tional MHW elevation, the New England and Mid-Atlantic region was divided into five sections: Maine to Upper Cape Cod, Outer Cape Cod and Nantucket, Martha’s Vineyard and

Methods of Analyzing Shoreline Change 7
Region
Short-Term Rate (End Point)
Long-Term Rate (Linear Regression)
Date1 Source Type Date1 Source TypeLong Island 1983 Air photo HWL 1830-1892 T-sheet HWL 2000 Lidar MHW 1902-1962 T-sheet HWL 1970-1979 Air photo HWL 1983 Air photo HWL 1988 Air photo HWL 1991-1999 Air photo HWL 2000 Lidar MHW 2001 Lidar MHW 2002 Lidar MHW 2005 Lidar MHW 2006 Lidar MHW 2007 Lidar MHWNew Jersey North 1977 Air photo HWL 1836-1899 T-sheet HWL 2000 Lidar MHW 1932-1953 T-sheet HWL 1971 Air photo HWL 1977 Air photo HWL 2000 Lidar MHWNew Jersey South 1977 Air photo HWL 1841-1899 T-sheet HWL 2000 Lidar MHW 1933-1953 T-sheet HWL 1971 Air photo HWL 1977 Air photo HWL 2000 Lidar MHWDelmarva North 1980 Air photo HWL 1845-1882 T-sheet HWL 1997/2000 Lidar MHW 1903-1962 T-sheet HWL 1970-1979 T-sheet HWL 1980-1989 Air photo HWL 1997-2000 Lidar MHWDelmarva South and Southern Virgina 1980 Air photo HWL 1851-1888 T-sheet HWL 1997 Lidar MHW 1905-1979 T-sheet HWL
1980 Air photo HWL 1997 Lidar MHW
Table 2b. Shorelines used to calculate short- and long-term change rates for the Mid-Atlantic region.
[HWL, high water line; MHW, mean high water; Lidar, light detection and ranging]
1Dates listed cover all available data for the Mid-Atlantic region. For details about dates of shoreline data used at a specific location within a region, refer to the shoreline data files available for download in the companion online data report (Himmelstoss and others, 2010).

8 National Assessment of Shoreline Change: Historical Shoreline Change along the New England and Mid-Atlantic Coasts
0 100 200 300 400 500 600 700−2
0
2
4
6
8
10
Cross-shore position, in meters
Elev
atio
n, in
met
ers
abov
e N
AVD
88
A
Dunes and Beach
Foreshore
Atlantic Ocean
Mean High WaterPoint used in regression
364 366 368 370 372 374 376 378 380 382-1
-0.5
0
0.5
1
1.5
Cross-shore position, in meters
Elev
atio
n, in
met
ers
abov
e N
AVD
88
Total errorShorelineLinear fitPoint used in regression
B
Figure 2. Graphs showing an example of a lidar profile from Island Beach State Park in New Jersey showing (A) the entire cross-shore region and (B) an expanded view of the foreshore region. (A) Laser returns off the water’s surface are seen as green symbols. Blue symbols indicate data points on the foreshore that were used in the linear regression to find the MHW shoreline. Red symbols indicate data points on the foreshore that were not used in the linear regression, as well as points along the rest of the beach and dunes. (B) Linear regression through the selected foreshore points in (A) is shown. The asterisk marks the cross-shore position of the operational MHW shoreline. The horizontal error bar represents the total error on the shoreline position. Modified from Stockdon and others (2002).
the south shores of Massachusetts and Rhode Island, the south shore of Long Island, and New Jersey to the North Carolina bor-der. For each section, the operational MHW elevation represents an average of MHW elevations from individual open-ocean or near open-ocean tide gages (Weber and others, 2005). The lidar-extracted MHW shoreline is not necessarily the same as a MHW shoreline surveyed by a licensed land surveyor. The operational MHW elevation used for the lidar shoreline is an average of the MHW elevations at several tide gages (see Weber and others, 2005). Furthermore, the lidar-extracted shoreline
is intended only as a reference feature for measuring shoreline change, not as a basis for establishing legal boundaries.
Shorelines were extracted from cross-shore profiles, which consist of bands of lidar data 2 m wide in the alongshore direction and spaced every 20 m along the coast. For each pro-file, the seaward-sloping foreshore points were identified and a linear regression was fit through them (fig. 2b). The regres-sion was evaluated at the operational MHW elevation (table 3) to yield the cross-shore position of the MHW shoreline. If the MHW elevation was obscured by water points, or if a data gap

Methods of Analyzing Shoreline Change 9
Region Average of MHW (m) Geographic Area
New
Eng
land
New England North1.22 Cliff Island, ME, to Barnstable, MA
Greater Boston
Cape Cod 0.98 Race Point, MA, to south end of Nauset Spit, MA
Massachusetts Islands
0.39 Monomoy Island, Cape Cod, MA, to Tom Never’s Head, Nan-tucket, MA
0.29 South shore of Nantucket (Tom Never’s Head) to Martha’s Vine-yard, MA
New England South0.36 Acoaxet, MA, to Point Judith, RI
0.22 Point Judith, RI, to Napatree Point, RI
Mid
-Atla
ntic
Long Island 0.46 Montauk Point, NY, to Rockaway Point, NY
New Jersey North0.43 Sandy Hook, NJ, to Cape May Point, NJ
New Jersy South
Delmarva North0.34 Delaware Bay entrance to Chesapeake Bay entrance
Delmarva South and Southern Virginia 0.26 Chesapeake Bay entrance to Cape Lookout, NC
Table 3. List of tide-gage measurements used to calculate mean high water (MHW) elevation.[mean high water; m, meters]
was present at MHW, the linear regression was extrapolated to the operational MHW elevation. Repeating this procedure at successive profiles generated points that were then connected to create a continuous shoreline.
Because inland bays are not suitable sites for extraction of a lidar shoreline using the methods employed in this analy-sis and because this report focuses on the open-ocean coasts, shorelines of extensive bay areas such as Narragansett Bay, Chesapeake Bay, and Delaware Bay were not included in the shoreline change analysis. Also, lidar data were not available for all sandy beaches along the New England and Mid-Atlan-tic coast; gaps exist along the south shore of Cape Cod, and the north shore of Cape Cod from Sandwich to Provincetown.
The Proxy-Datum Bias Correction between HWL and MHW Shorelines
Inclusion of a lidar-derived shoreline in coastal change analyses represents a modern approach to the investigation of shoreline change. The pre-lidar historical shorelines used
in this study were derived from topographic maps, aerial photographs, or field interpretations that use the HWL as the shoreline proxy. For more than 150 years, the HWL has served as the most commonly used shoreline because it could be visually identified in the field (Shalowitz, 1964; Anders and Byrnes, 1991). With advanced technologies, such as GPS and lidar, it is now possible to define the shoreline more objectively on the basis of an elevation or a tidal datum, such as MHW. Changing the shoreline definition from a proxy-based physical feature that is uncontrolled in terms of an elevation datum (HWL) to a datum-based shoreline defined by an elevation contour (MHW) has important implications with regard to inferred changes in shoreline position and calculated rates of change.
Morton and others (2004) first compiled published and unpublished data to evaluate the horizontal and verti-cal differences in HWL determined from beach profiles, aerial photographs, or GPS surveys, and the MHW derived from beach profiles, GPS surveys, or lidar surveys. Hapke and others (2006) updated this dataset to include the most recent analyses available (table 4). The HWL and MHW

10 National Assessment of Shoreline Change: Historical Shoreline Change along the New England and Mid-Atlantic Coasts
Location
Survey Date Length of
Coast (km)
Number of Observations
Average Horizontal Offset (m)
Average Verti-cal Offset (m)
%MHWL with
Seaward Offset
Data Source or ReferenceHWL MHWL
Galveston Island, TX1 01-27-95 01-27-95 Point 1 18 0.6 100
Morton and Speed, 1998North Padre Island, TX1 08-16-95 08-16-95 1.6 6 8 0.4 100
09-14-95 09-14-95 1.6 6 8 0.2 10009-28-95 09-28-95 1.6 6 12 0.2 10010-06-95 10-06-95 1.6 6 6 0.3 100
Duck, NC2 1994-19962 Point 111 40 2.0 100 Pajak and Leatherman, 2002
Klipsan, WA3
05-26-99 05-28-99 3.0 171 22 0.5 100
Ruggiero and others, 2003
09-21-99 09-24-99 3.0 171 52 0.8 100
Ocean Shores, WA3 05-26-99 05-28-99 4.0 200 23 1.0 100
07-27-99 07-22-99 4.0 200 8 0.2 10005-06-01 05-07-01 4.0 200 30 1.0 100
Oysterville, WA3 09-21-99 09-10-99 3.5 201 49 0.9 100
Assateague Island,MD/ VA4
03-16-98, 03-17-98 04-03-98 58.6 1,172 11 0.7 99
M. Duffy, National Park Service, oral commun., 2007
09-29-99, 10-28-99 10-01-99 60.0 1,200 20 1.6 10006-13-01, 06-14-01 06-05-01 52.4 1,049 8 0.6 92
10-01-02 09-12-02 47.7 953 22 1.4 98
M. Byrnes, Coastal Research and Engineering, Inc., oral commun., 2007
05-06-02 05-06-02 47 470 18.8 1.2 – 1.3 100 Moore and others, 2006
1 Simultaneous measurement of HWL and MHWL at beach profiles coordinated with tide-gage measurements2 Video camera projections of HWL for 111 days during a 3-year period and MHWL from generalized beach profiles3 Nearly simultaneous aerial photographs (HWL) and GPS surveys (MHWL) 4 Nearly simultaneous GPS (HWL) and lidar surveys (MHWL)
[km, kilometers; m, meters; modified from Morton and others, 2004]
Table 4. Absolute horizontal and vertical differences between high water line (HWL) and mean high water line (MHWL) shorelines.
positions were established at the same time, or within a few weeks of one another, at multiple sites around the United States where the beach and wave characteristics are diverse. The HWL and MHW positions are compared with the assumption that the observed proxy-datum offsets are entirely artifacts of shoreline definition and are not related to actual changes in the beach profile due to sediment transport (erosion or accretion processes) between the survey dates. This is a relatively safe assumption considering the short intervals between surveys or the knowledge that a particular shoreline segment is relatively stable. Moore and others (2006) avoided the need for this assumption by deriv-ing HWL and MHW shorelines from aerial photography and lidar data collected during the same tidal cycle.
The average absolute horizontal and vertical offsets between the HWL and MHW range from a few meters to more than 50 m, and vertical offsets can be as much as 2 m (table 4). Most of the horizontal offsets are less than 20 m, and most of the vertical offsets are less than 1 m. Offsets are typically greatest on relatively flat beaches where large waves produce high wave run-up (for example, southwest Washington). Offsets are smallest where beaches are relatively steep and wave run-up is low. For the data analyzed by Morton and others (2004), the percentage of MHW shorelines offset seaward of the HWL exceeded 98 percent within the 17 survey dates (table 4). This nearly systematic unidirectional horizontal offset between the HWL and MHW causes shoreline positions and calculated rates

Methods of Analyzing Shoreline Change 11
of change to appear to have slower erosion or faster accretion than is indicated by actual shoreline movement, or a change from erosion to accretion that did not actually occur.
Recent studies by Hapke and others (2006), Moore and others (2006) and Ruggiero and List (2009) illustrate that, over-all, the importance of incorporating a proxy-datum offset into shoreline change analysis depends on several factors, includ-ing the magnitude of the offset, the length of time over which rates are being measured, and the statistical significance of the shoreline change rates. The proxy-datum offset is particularly important when averaging shoreline change rates alongshore. Because the proxy-datum offset is a bias that virtually always acts in the same direction, the error associated with the apparent shoreline change rate shift is not canceled during averaging. It is important to quantify this bias in order to resolve the shift it can cause in reported rates. The shoreline change rates presented in this report have accounted for and incorporated the proxy-datum bias into the rate calculations using the latest version of the Dig-ital Shoreline Analysis System (DSAS). The specific methodol-ogy used to determine the proxy-datum bias values is detailed in Ruggiero and List (2009) and described briefly below.
Comparison of HWL shorelines and a MHW datum-based shoreline for a single-day survey on Assateague Island (Moore and others, 2006) revealed an average horizontal offset between shoreline indicators of 18.8 m (table 4). Vertical offsets were also substantial and were strongly correlated with foreshore beach slope. A simple total water level model, which combines the effects of tidal variations and wave run-up (Ruggiero and others, 1996; Ruggiero and others, 2001; Ruggiero and others, 2003), successfully reproduced these vertical offsets, indicating that the proxy-datum offset may be governed primarily by wave run-up. In order to estimate the proxy-datum bias for the New England and Mid-Atlantic region, we use the approach outlined in Ruggiero and List (2009), which includes the improvement wave run-up formulation of Stockdon and others (2006). The horizontal offset between HWL and MWH shorelines can be estimated by
Equation (1)
1/22(1/2)
( )
(0.563tan 0.0041.1 0.35 tan ( )
2
tan
HWL MHW
o oT o o MHW
Bias X X
H LZ H L Z
= − =
+ + + −
where ZT is the tide level, tan β is the beach slope, H
o is the
deepwater significant wave height, and Lo is the deepwater
wave length given by linear theory as gT2/2π, where g is the acceleration due to gravity and T is the peak wave period.
In order to calculate the bias, long-term best estimates and measures of uncertainty are derived for beach slope, wave height, wave length, and tide level. The best estimate for beach slope was derived by averaging individual lidar cross-shore
profile slope estimates within 1-km blocks along the coast. The long-term mean wave height and length are used as the best-estimate values in the bias calculation. The long-term mean wave height is derived from averaging USACE Wave Information Studies (WIS) hindcasts whereas the long-term mean wave length is averaged from long-term buoy records (NDBC and CDIP) along the New England and Mid-Atlantic coast. Finally, the best estimate of the tide level responsible for generating HWL shorelines is used as the elevation of MHW (see table 3) (Weber and others, 2005). The proxy-datum bias varies widely alongshore, but averages 8.6 m through the NEMA study area.
Uncertainty in the Proxy-Datum BiasBecause each of the variables in equation (1) has
associated uncertainties, the proxy-datum bias correction also has an uncertainty. The measures of uncertainty for the beach slope, wave height, and wave length are estimated as the difference between the 95-percent exceedance statistic and the 50-percent exceedance statistic of the cumulative distribution for each variable. This provides a 90-percent confidence interval (CI) for each of the three cumulative distributions. The uncertainty of assuming that the tide is responsible for producing the HWL shoreline proxy, and that it is approximately the elevation of MHW, is calculated by subtracting MHW from is calculated by subtracting MHW from mean high high water (MHHW). Using these values of uncertainty for each of the variables in equation (1), the bias uncertainty is calculated using the procedure described in Ruggiero and List (2009), following Taylor (1997).
Use of the Proxy-Datum Bias and Bias Uncertainty in Shoreline Change Analysis
The proxy-datum bias and bias uncertainty are calculated at each of the 1-km blocks in which the average beach slope has been calculated. Version 4.1 of DSAS can incorporate proxy-offset values into proxy-datum bias shifts to reconcile the horizontal offsets between the MHW and HWL shoreline proxies described above. The operational MHW shoreline points extracted from the lidar data at 20-m alongshore spacing are written to a table containing xy locations and three associated values: (1) shoreline position uncertainty, (2) the proxy-datum bias, and (3) the proxy-datum bias uncertainty. The proxy-datum bias is incorporated in the shoreline change statistics calculations to correct for datum offsets between the MHW and HWL shorelines (Himmelstoss, 2009), and the uncertainty values are used in the estimation of shoreline change uncertainty (see High Water Line Shoreline Position Uncertainty).
Estimation of Shoreline Position Uncertainty
The uncertainty of calculated rates of shoreline change depends on the total shoreline position uncertainty. Shoreline

12 National Assessment of Shoreline Change: Historical Shoreline Change along the New England and Mid-Atlantic Coasts
position uncertainties from sources that can be quantified are described below for both HWL- and MHW-type shorelines.
A potentially large source of shoreline position uncer-tainty that we do not quantify results from the local short-term variability of true shoreline positions (Morton, 1991; Douglas and Crowell, 2000). Along the New England and Mid-Atlantic coast, as in many locales worldwide, there are pronounced cyclical and event-driven erosion and accretion of the shore-line. This variability is driven by variations in wave conditions from summer to winter, years with severe as opposed to aver-age storms or swells, and episodic events like hurricanes and “nor’easters” (extratropical cyclones). The seasonal shoreline variability also has a high spatial variability, depending on the orientation of the coast with respect to the wave direction and effects of refraction or reflection from headlands and man-made structures. As a result, calculating an uncertainty term to quantify seasonal shoreline variability for regionally averaged shoreline change rates is difficult. Site-specific, temporally dense data are required to evaluate short-term shoreline vari-ability. The lack of reliable high-frequency data regarding short-term variability (of true shoreline position) at most coastal sites limits the ability to quantify this uncertainty as part of the overall shoreline position uncertainty. Because of the lack of accurate, systematic data regarding the seasonal varia-tion of the shoreline along the New England and Mid-Atlantic coast, the uncertainty values reported here (tables 6a and 6b) do not include an uncertainty term for the seasonal shoreline posi-tion variability in the quantification of uncertainties associated with the regionally averaged shoreline change rates.
HWL Shoreline Position UncertaintyAnders and Byrnes (1991), Crowell and others (1991),
Thieler and Danforth (1994), and Moore (2000) provided general estimates of the typical HWL measurement uncertain-ties associated with (1) mapping methods and materials for historical shorelines, (2) the registration of shoreline position relative to geographic coordinates, and (3) shoreline digitiz-ing. As in the methods outlined by Crowell and others (1993), we identify five uncertainty terms for HWL-type shorelines: georeferencing uncertainty ( gU ), digitizing uncertainty ( dU ), T-sheet survey uncertainty ( tU ), air photo uncertainty ( aU ), and the uncertainty of the high water line at the time of survey, which is found as the proxy-datum bias uncertainty ( pdU ).
The georeferencing uncertainty represents the elected maximum acceptable RMS error for T-sheets at a scale of 1:20,000 in this study. The georeferencing uncertainty, ±4.0 m, is applied to the historical shorelines that are derived from T-sheets only (1800s-1980s). The digitizing uncertainty, ±1.0 m, reflects the maximum error specified in past studies (Anders and Byrnes, 1991; Crowell and others, 1991; Moore, 2000), and is applied to all HWL shorelines. The maximum T-sheet survey uncertainty, determined by Shalowitz (1964), incorporates all of the errors associated with the mapping process, including distance to rodded points, plane-table
position, and identification of the HWL. The T-sheet survey uncertainty is applied to all historical shorelines; however, the uncertainty associated with the 1960s-to-1980s-era T-sheets (±3.0 m) is considerably lower than that associated with the older T-sheets from the 1800s to the 1950s (±10.0 m). This difference is based on findings by Ruggiero and others (2003), as well as the fact that more recent shorelines are derived from aerial photos or other sources. The air-photo uncertainty, ±3.0 m, is applied to shoreline positions from 1990s-to-2000s air photos that were digitized as part of this study. A previously unreported uncertainty term in shoreline change analyses is the uncertainty in HWL shorelines due to variations in water levels. The uncertainty of the proxy-datum bias, found using equation 1 and the uncertainty estimation techniques of Taylor (1997), can be shown to be equivalent to the uncertainty of the HWL shoreline due to water-level variations (Ruggiero and List, 2009). The HWL uncertainty varies alongshore as a func-tion of the variables in equation 1, but averages ±4.5 m in our study. For each HWL shoreline position, the total uncertainty is found as the square root of the sum of squares (Taylor, 1997) of the relevant uncertainty terms, based on an assump-tion that each term is random and independent of the others. For shorelines derived from the 1800s-to-1980s T-sheets, the total shoreline position uncertainty at each transect, i, is:
Equation (2)
2 2 2 2p g d t pdi i i i iU U U U U= + + +
and the uncertainty for the 1990s-to-2000s air photos is: Equation (3)
2 2 2p d a pdi i i iU U U U= + +
The shoreline position uncertainties given by equations (2) and (3) vary alongshore because of a spatially varying pdU .
Values of piU are available in the companion online data report (Himmelstoss and others, 2010). For reference, the average values of uncertainty terms and the total average shoreline position uncertainty, pU , for each shoreline type are given in table 5. Note that these average values are not used to determine shoreline change uncertainty (see Estimation of Shoreline Change Rate Uncertainty).
Lidar-Derived MHW Shoreline Position UncertaintyEach MHW lidar shoreline position, derived at a 20-m
alongshore spacing, has an associated uncertainty that includes three components. The first is the 95-percent CI associated with the regression estimate in the determination of the linear regression MHW position for each cross-shore profile of lidar point cloud data. The second uncertainty component is the uncertainty associated with the raw lidar data position, espe-cially the elevation. Sallenger and others (2003) determined

Methods of Analyzing Shoreline Change 13
Table 5. Average uncertainties for the New England and Mid-Atlantic shorelines.
that the vertical accuracy of NASA’s Airborne Topographic Mapper lidar system is approximately ±15 cm, which can be thought of as a bias in lidar elevation (not random error). This vertical uncertainty is converted to a horizontal shoreline position uncertainty using the beach slope determined by the linear regression. The third component of the total uncertainty is the uncertainty due to extrapolation (the difference between an observed position and a position predicted on a projected regression line). Although the 95-percent CI on MHW position is larger when extrapolation is used, this method assumes that the foreshore slope is constant from the limit of the lidar data to the position of MHW. Because this may not be the case, we find an additional MHW uncertainty term by assuming a certain degree of cross-shore slope variability and finding the corresponding variability in extrapolated MHW position. The slope variability was found through an extensive compilation of foreshore slope variability extracted from more than 1,200 km of coastal lidar data from the Northwest, Northeast, and Mid-Atlantic regions of the United States. The three uncer-tainty terms—the 95-percent CI on MHW from the linear regression, the elevation-bias uncertainty, and the extrapola-tion uncertainty—are then added using the square root of the sum of the squares to give the piU for the MHW shoreline at each lidar profile. This total uncertainty for MHW shore-lines varies alongshore on a profile-by-profile basis, with the NEMA-average value of ±2.3 m (table 5).
Calculation and Interpretation of Shoreline Change Rates
Rates of long-term shoreline change at each transect,iR , were generated using the DSAS version 4.1, an ArcGIS
tool developed by the USGS (Thieler and others, 2009). The tool is a freely available application designed to work within the ESRI ArcGIS software. For this study, DSAS is used to generate orthogonal transects at 50-m spacing along the coast and to consequently calculate change statistics (linear regres-sion, weighted linear regression, and end-point rate). Infor-mation derived from lidar data at a 20-m alongshore spacing including: MHW shoreline positions, the proxy-datum bias, and the proxy-datum bias uncertainty, is interpolated onto the 50-m DSAS transect spacing. Linear regression is the most commonly applied statistical technique for expressing shore-line movement and estimating rates of change (Crowell and Leatherman, 1999) where there is a statistically valid number of samples. Linear regression fails to recognize the potential for temporal differences in trend (trend reversals) and acceler-ations or decelerations (Fenster and others, 1993; Fenster and Dolan, 1994; Morton, 1991; Morton, 1996), so average trends and rates of shoreline change in this study were calculated for both long-term (entire period) and short-term (most recent) time scales to capture potential changes in shoreline change rates or trends.
[-, not applicable; m, meters]
Measurement Uncertainty (meters) T-sh
eets
(180
0-19
50s)
T-sh
eets
(196
0-19
80s)
Air p
hoto
s (1
970-
2000
s)
Lida
r (1
997-
2000
)
Georeferencing ( gU ) 4 4 - -
Digitizing ( dU ) 1 1 1 -
T-sheet survey( tU ) 10 3 - -
Air photo ( aU ) - - 3 -
Uncertainty of the High Water Line ( pdU ) 4.5 4.5 4.5 -
Lidar total position uncertainty ( pU ) - - - 2.3
Total shoreline position uncertainty ( pU ) (m) 11.7 6.8 5.5 2.3

14 National Assessment of Shoreline Change: Historical Shoreline Change along the New England and Mid-Atlantic Coasts
Table 6a. Long-term shoreline change rate uncertainties for New England and Mid-Atlantic regional averages.
[m/yr, meters per year; m, meters; uncertainty numbers in red are confidence interval values that are less than the average rate indicating that the average rate is significant]
RegionAverage rate
(m/yr)Number of transects
Average uncertainty
(m)Independent n
Uncertainty reduced for independent n
(m)
New
Engla
nd
New England North 0.1 1,642 0.4 77 0.05
Greater Boston -0.09 2,005 0.3 100 0.03
Cape Cod -0.4 1,666 1.5 10 0.5
Massachusetts Islands -1.4 1,775 0.6 43 0.09
New England South -0.2 1,136 0.2 45 0.03
Mid-
Atlan
tic
Long Island 0.08 3,518 0.6 11 0.2
New Jersey North -0.6 2,234 0.9 22 0.2
New Jersey South 0.8 1,408 1.3 22 0.3
Delmarva North -0.5 2,235 0.7 19 0.2Delmarva South and
Southern Virginia -2.9 2,165 1.7 10 0.5
New England total -0.4 8824 0.6 39 0.1
Mid-Atlantic total -0.6 11,560 1.0 61 0.1
Total -0.5 19,784 0.8 91 0.09
Table 6b. Short-term shoreline change rate uncertainties for New England and Mid-Atlantic regional averages.
[m/yr, meters per year; m, meters; uncertainty numbers in red are confidence interval values that are less than the average rate indicating that the average rate is significant]
RegionAverage rate
(m/yr)Number of transects
Average uncertainty
(m)Independent n
Uncertainty reduced for independent n
(m)
New
Engla
nd
New England North -0.4 414 0.3 7 0.1
Greater Boston -0.1 1,381 0.3 32 0.06
Cape Cod 0.3 1,665 0.2 6 0.09
Massachusetts Islands -0.8 1,759 0.3 8 0.1
New England South -0.09 1,135 0.3 7 0.1
Mid-
Atlan
tic
Long Island 0.8 3,210 0.4 20 0.09
New Jersey North 0.5 2,108 0.3 20 0.06
New Jersey South 0.2 1,349 0.4 20 0.1
Delmarva North -0.8 2,244 0.4 70 0.04Delmarva South and
Southern Virginia -2.7 2,074 0.5 12 0.1
New England total -0.2 6,354 0.3 11 0.09
Mid-Atlantic total -0.3 10,985 0.4 16 0.1
Total -0.3 17,339 0.4 11 0.1

Methods of Analyzing Shoreline Change 15
Landward
Seaward
Landward
Seaward
A Inlet/stream mouths B Missing data
C Coastal structures D Rocky coastline
Offshore baseline Offshore baseline
Offshore baseline Offshore baseline
Shorelines Transects
Eliminated
Used for calculation1800s 2000s1970s1930s Transect/shoreline intersection
End-Point Rates (Short-Term)Short-term rates of shoreline change were calculated at
each transect using an end-point rate between a shoreline posi-tion from the time period 1971-84 and the most recent shore-line (1997-2006) to provide an approximately 30-yr short-term rate (see tables 2a and 2b for data sources). The end-point rate is found as the difference in shoreline position between the 2 shoreline years, divided by the time between surveys. The proxy-datum bias was applied to remove the bias between the HWL and MHW shorelines by adjusting the horizontal distance of the MHW shoreline before rates were calculated. For an end-point rate, there is no assumption that the rate was linear between the 2 survey years; the rate represents the net change between the surveys, annualized to facilitate compari-sons with long-term rates found through linear regression, described below.
Linear Regression Rates (Long-Term)Long-term rates of shoreline change were calculated at
each transect as the slope of the linear regression through all shoreline positions from the earliest (1800s) to the most recent (generally the lidar-derived shoreline). The proxy-datum bias was used to adjust the distance of the MHW shoreline prior to rate calculation, in order to remove the bias between the HWL and MHW methods of delineating shoreline position.
A minimum of 4 shoreline years at each DSAS transect was required for the calculation of long-term rates of change. One of the shorelines must be the lidar-surveyed shoreline. Fewer than four shorelines can result from one or more of the following conditions (fig. 3): (1) the position of an inlet or stream mouth has changed or migrated, (2) shoreline seg-ments are missing (data gaps), (3) a harbor or other coastal structure eliminated one or more of the shorelines, and (4) no
Figure 3. Schematic diagrams showing examples of common conditions where transects are eliminated in the absence of four shoreline intersections: (A) inlet/stream mouths, (B) missing data, (C) coastal structures, and (D) rocky coastline.

16 National Assessment of Shoreline Change: Historical Shoreline Change along the New England and Mid-Atlantic Coasts
lidar-derived shoreline is available for rocky coasts. Table 2 indicates the shoreline dates and sources used for the linear regression in each region; the dates that cover specific coastal locations can be found in Himmelstoss and others (2010).
The linear regression method of determining shoreline change rates does assume a linear trend of change between the earliest and latest shoreline dates. However, there are clearly areas where such a linear trend does not exist—that is, shore-line change rates have not remained constant through time. In these cases it is expected that the resulting linear fit to the data would be poorer, and the shoreline change rate uncertainty, described below, would be higher.
Estimation of Shoreline Change Rate Uncertainty
Rate Uncertainty at Individual TransectsThe uncertainty of a single transect’s end-point shore-
line change rate is found as the quadrature addition of the uncertainties for each year’s shoreline position, divided by the number of years between the shoreline surveys:
Equation (4)
1 2
2
2 2
1
p pi iRi
U UU
year year=
−+
where 1p iU and 2p iU are the shoreline position uncertainties of the first ( 1year ) and second ( 2year ) shorelines, respectively, at transect i, found through equation (2) or (3). For the linear regression method, the uncertainty of a single transect’s shoreline change rate, RiU , is found here as the 90-percent CI on the linear regression slope.
Regionally Averaged Rate UncertaintyIn addition to shoreline change rates and rate uncertain-
ties at individual transects, this report provides regionally averaged rates, R , and the associated average rate uncertainty (tables 6a and 6b), as a measure of broader scale trends. The procedure for finding the uncertainty associated with region-ally averaged shoreline change rates, described below, is the same for both the end-point and linear regression methods.
A common method for finding the uncertainty on a mean value is based on variations in the measurement values them-selves, typically using a t-distribution confidence interval on the mean of a limited sample from a population found as:
Equation (5)
(2),t xC t s = ±
where (2),t is the two-tailed t-distribution value in which is the confidence level and is the degrees of
freedom, and /xs s n= is the standard error on the sample mean with s the standard deviation of the sample and n the sample size. The regionally averaged rates of change pre-sented in this report, however, are not a limited sample from a larger population as assumed in equation (5). The mean shoreline change for a region is essentially a measure of the whole population, given the 50-m spacing of the DSAS transects. Therefore, the uncertainty associated with regional variations in shoreline change rate is negligible. However, a much larger source of uncertainty arises from the uncertainty of each individual shoreline change value used in the mean. Each transect’s value of shoreline change rate, iR , has an uncertainty, RiU , which can be used to estimate the uncertainty of the regionally, averaged shoreline change R .
Given that regionally averaged shoreline change rate is found as:
/n
ii
R R n= ∑
where n is the number of transects within the region, the simplest method of finding the associated uncertainty is:
Equation (7)
1RR
n
ii
UUn
= ∑
However, in this method it is assumed that there is no
advantage in having multiple transects—that is, there is no cancellation of uncertainties between transects due to random variability. Shoreline change rate uncertainties found with equation (7) are, in most cases, larger than the regionally-averaged shoreline change rate found by equation (6). We consider equation (7) to result in an overestimate of the uncer-tainty because some cancellation of uncertainties is likely in a regional analysis.
An alternative method of estimating uncertainty can be applied if we assume that each transect’s uncertainty is random and independent of all the other transects. In this case the uncertainty associated with regionally averaged shoreline change rates can be found as: Equation (8)
21iRq
n
Ri
UUn
= ∑
which represents a quadrature average of uncertainties follow-ing Taylor (1997). Quadrature average results in very small values of uncertainty, on the order of ±1 to 2 cm, and is likely an underestimate of the uncertainty because it is unlikely that all transect uncertainties are independent of all the others.
Equation (6)

Geology and Geomorphology of the New England and Mid-Atlantic Coasts 17
A better estimate of the regionally averaged shoreline change rate uncertainty likely falls between the extremes of equations (7) and (8), whereby each transect rate uncertainty is partially independent of the others. To estimate the regionally averaged uncertainty of partially independent transect rates, we first evaluate the effective number of independent uncertainty values, n*. Following Garrett and Toulany (1981), we find n* based on the spatially lagged auto-correlation of RiU . In all regions, this method results in a large reduction in the original sample size, n, as shown in tables 6a and 6b.
Substitution of n* into equation (8) is not possible without knowledge of which values of RiU represent the independent samples. Using n* in the denominator of equa-tion (8) while finding the quadrature sum of all the values of
RiU in the numerator gives a much larger uncertainty than the uncertainty calculated using equation (7). We use a simpli-fied version of equation (8) to find an average rate uncertainty which accounts for the reduced effective sample size, n*. When all RiU values are equal, the right-hand side of equation (8) reduces to /RU n . Assuming that the RiU of a region can be represented by RU , we find the uncertainty of a regionally averaged change rate as:
Equation (9)
*1
*Rq RU Un
=
Equation (9) is used to estimate the uncertainty of regionally averaged shoreline change rates in this report, with values given in tables 6a and 6b.
Human Beach Alterations that Influence Rates of Change
Differentiating between natural rates of erosion and the influences of beach nourishment and engineering structures is difficult because few studies have been conducted to address these issues specifically. In addition, available data may be inadequate to address these questions because the number of available shoreline positions immediately before, after, and between nourishment projects or structure emplace-ment is insufficient. Human responses to shoreline erosion are included in the discussion of the results of the shoreline change analysis where possible.
Attempts to stabilize the shore can greatly influence rates of shoreline change. Activities such as beach nourishment or emplacement of shoreline stabilization structures tend to alter coastal processes, sediment transport, and shoreline position. For example, beach nourishment artificially causes rapid, temporary shoreline accretion. Depending on the frequency of beach nourishment, the placement of large volumes of sand on the beach will bias the rates of observed shoreline change toward accretion or stability, even though the natural beach, in
the absence of nourishment, may have an erosional trend. In addition, the emplacement of shoreline protection structures such as seawalls, bulkheads, and revetments can result in both active and passive erosion of the beach. In the case of passive erosion, the back-beach area is fixed by a structure, and the beach in front gradually narrows. Eventually erosion ceases (until the structure fails), thus indicating a stable shoreline in the shoreline change record. Active erosion associated with shoreline protection structures refers to the accelera-tion of shoreline erosion in front of a structure caused by the alteration of wave, tide, and current patterns. Other coastal modifications that influence the shoreline change trends are structures, such as groins and jetties, that disrupt alongshore sediment transport. Depending on the timing of emplace-ment relative to the shoreline database, there will be a zone of accretion updrift from shore-perpendicular structures and erosion on the downdrift side. Many areas of the New England and Mid-Atlantic region, especially from New Jersey through Virginia, have extensive groin fields. Stabilized inlets are more common from Long Island south to Maryland (fig. 4).
Pilkey and Clayton (1989) and Valverde and others (1999) provide summaries of beach nourishment projects on U.S. East Coast barrier islands through 1986 and 1996, respectively, that date back as far as 1923. Haddad and Pilkey (1998) compiled similar information for the New England coast and documented nourishment episodes up to 1996. The Program for the Study of Developed Shorelines (PSDS) at Western Carolina University currently maintains an electronic database of nationwide nour-ishment projects (http://www.wcu.edu/1038.asp) that is updated regularly and includes projects conducted as recently as 2007. These records were used to help identify shoreline segments that have been influenced by beach nourishment. Valverde and others (1999) show that from the 1920s through the 1990s, the total volume of nourishment sand placed on East Coast barrier beaches increased exponentially. Based on the current PSDS records, more than 200,000,000 m3 of material was placed on New England and Mid-Atlantic beaches from 1923 to 2007, and this number continues to grow.
Geology and Geomorphology of the New England and Mid-Atlantic Coasts
General Geologic Setting
The East Coast of the United States is a trailing margin coastline (sometimes referred to as a “passive margin”), a tec-tonic description that indicates the coastline does not coincide with a plate boundary. Trailing margin coasts typically have a wide continental shelf and predominantly low-lying coastal landforms (Inman and Nordstrom, 1971). Regionally, the vari-ation in landform type is a function of geomorphic province.

18 National Assessment of Shoreline Change: Historical Shoreline Change along the New England and Mid-Atlantic Coasts
The New England Appalachian Province of Maine, New Hampshire, Massachusetts, and Rhode Island (Fenneman, 1946) is highly variable in terms of coastal landforms (fig. 5), and ranges from rocky coastlines characterized by headlands and pocket beaches to mainland beaches, linear bar-rier islands, and coastal bluffs formed from soft glacial depos-its that are fronted by narrow beaches. The Atlantic Coastal Plain is the major geomorphic province from Long Island through Virginia (but also includes Cape Cod, Nantucket, and Martha’s Vineyard to the north), and consists primarily of mainland and barrier-beach coastal landforms.
Both provinces of the New England and Mid-Atlantic coasts have their origins in the early mountain-building history of the East Coast of the United States. The most recent episode was the Appalachian (sometimes called the Alleghenian) Orogeny. The Appalachian Orogeny occurred at the end of the Paleozoic Era (350 to 300 million years ago), forming the supercontinent of Pangaea (Bird and Dewey, 1970; Leitch, 1975; Rast, 1984; Walker and Coleman, 1987; Rast, 1989). Igneous and sedimentary rocks that were deposited prior to the continental collision were uplifted and metamorphosed during the mountain-building period. In the millions of years follow-ing the Appalachian Orogeny the mountains gradually eroded,
Figure 4. Oblique aerial photograph showing an extensive groin field at Beach Haven, NJ. Groin fields such as this are common in many parts of New England and the Mid-Atlantic. Photograph is taken looking to the northwest.
burying the deformed Paleozoic bedrock beneath a thick sequence of sediment. These sediments were deposited along the shoreline of the trailing margin coast that developed as the Atlantic Ocean opened.
The geologic history of the Mid-Atlantic and New England coastal regions began to diverge substantially at the beginning of the Pleistocene Epoch, as large continental ice sheets formed and advanced over much of northern North America, including New England (Schafer and Hartshorn, 1965; Hughes and others, 1985; Dyke and others, 2002). Four major periods of glaciation directly impacted the New England coast and indirectly affected the Mid-Atlantic coast as sea level and sedimentation rates rose and fell with gla-cial advance and retreat. In New England, the thick layers of coastal plain sediments were eroded by the glaciers, expos-ing bedrock throughout much of the region, especially in the north. The irregular morphology of the rocky coast of New England is controlled largely by the fabric of the exposed bedrock and variations in exposed lithologies (Kelley, 1987; FitzGerald and others, 1994).
The glacial and sea-level history of New England is well documented (Kaye, 1964; Oldale, 1982; Uchupi, 1996), and stratigraphic evidence indicates that at the Late Wisconsinan

Geology and Geomorphology of the New England and Mid-Atlantic Coasts 19
´
´
´
Barrier beachMainland beachBluff with linear beachRocky coastAtlantic Coastal PlainNew England Appalachian Highlands
EXPLANATION70°W72°W74°W76°W
44°N
42°N
40°N
38°N
72°W73°W74°W75°W76°W
41°N
40°N
39°N
38°N
37°N
69°30'W70°W70°30'W71°W71°30'W
43°30'N
43°N
42°30'N
42°N
41°30'N
0 10050 MILES
0 10050 KILOMETERS
ATLANTIC OCEAN
ATLANTIC OCEAN
0 10050 KILOMETERS
0 10050 MILES
A New England
B Mid-Atlantic
B
AME
NH
MA
RI
CTNY
NJPA
DE
MD
VA
Base from Medium Resolution (1:70,000 scale, NAD 83) Digital Vector Shoreline of the coterminous United States: National Oceanic and Atmospheric Administration, 1994.
maximum (18,000 to 17,000 b.p.) the terminus of the Lauren-tide ice sheet extended from southern Long Island to Martha’s Vineyard and Nantucket (fig. 6) (Larson, 1982; Dyke and others, 2002). This position was demarcated by a terminal moraine, the deposits of which are exposed in modern coastal bluffs at these locations. Beach development in the post-glacial Holocene Epoch of New England is confined largely to pocket beaches formed from sediment trapped between rocky headlands; barrier spits; and rare, long barrier systems, such as on the outer coast of Cape Cod.
The present morphology of the Mid-Atlantic region is also related to glaciations and the rise and fall of sea level (Colquhoun and others, 1991). During low stands, rivers cre-ated large valleys that were then submerged as sea level rose. Sediments deposited on the continental shelf filled the valleys and provided the material to create the barrier-island chains that dominate the region (Swift and others, 1972; Wright, 1995). Modern rivers no longer drain to the coast; rather, they empty into the estuaries and lagoons formed behind the barrier islands, resulting in a sediment-starved coast (Wright, 1995). The modern barrier-island system of the Mid-Atlantic region formed approximately 5,000 to 6,000 years before present, when rates of sea-level rise began to slow (fig. 7). Numerous
authors have explored barrier island formation and evolution throughout New England and the Mid-Atlantic (Fisher, 1968; Kraft, 1971; Swift, 1975; Leatherman, 1979; Belknap and Kraft, 1985; Leatherman, 1985; Oertel, 1985; Davis, 1994), although the majority of the analyses have been carried out in the Mid-Atlantic. The geologic framework of the Mid-Atlantic larely controls the locations of inlets, estuaries, and capes, which appear to be related to river and stream valleys that eroded the shelf during periods of lower sea level (Kraft, 1971; Belknap and Kraft, 1985; Demarest and Leatherman, 1985; Fletcher and others, 1990). Additionally, the geologic framework exerts control over the type and amount of sedi-ment present. In areas of relatively higher antecedent topog-raphy, headlands formed as sea level rose provide a sediment source to the littoral system as they erode.
Coastal Processes
The New England and Mid-Atlantic coasts are storm-dominated (Niederoda and others, 1985; Swift and others, 1985; Morton and Sallenger, 2003), and the active processes that shape the coast are largely the result of meteorological
Figure 5. Map of the (A) New England and (B) Mid-Atlantic coasts showing the geomorphic provinces and the general distribution of coastal landforms.

20 National Assessment of Shoreline Change: Historical Shoreline Change along the New England and Mid-Atlantic Coasts
!
!
!
!
!
!
Ocean City
Virginia Beach
New York City
Providence
Boston
Portland
Cape Cod
ATLANTIC OCEAN
VA
PA
MD
DE
NJ
NY
CT RI
MA
VT NH
ME
Long Island
Massachusetts Islands
Modified from Dyke and others (2002) and Hughes and others (1985)
70°W72°W74°W76°W78°W44°N
42°N
40°N
38°N
0 10050 KILOMETERS
0 10050 MILES
EXPLANATION
CityExtent of ice at Last Glacial MaximumPresent-day political boundary
!
Canada
Base from Medium Resolution (1:70,000 scale, NAD 83) Digital Vector Shoreline of the coterminous United States: National Oceanic and Atmospheric Administration, 1994.
Figure 6. Map showing the Last Glacial Maximum extent of the Laurentide ice sheet in New England.

Geology and Geomorphology of the New England and Mid-Atlantic Coasts 21
0
-50
+50
-150
-2000 20 40 60 80 100 120 140 160
Time (thousands of years)
Sea
leve
l (m
eter
s) Present sea level
LGM
0
-100
-50
-150
Sea
leve
l (m
eter
s)
0 3 6 9 12 15 18 21 24
Last Glacial Maximum
Younger Dryas cold period
Time (thousands of years)
Periods of accelerated sea level rise
A
B
Figure 7. Graphs showing sea-level rise curves for the last (A) 160,000 years and (B) 24,000 years on the East Coast of the United States. Modified from Chappell and Shackelton (1986). Curve since the Last Glacial Maximum is modified from Fleming and others (1998) showing the estimated change in sea level for the last 21,000 years.
events in the form of tropical and extratropical (“nor’easter”) cyclones. Morphologies of barrier islands in New England and the Mid-Atlantic are dictated by the relative dominance of waves or tides (Hayes, 1979). The intensity, duration, and direction of winds, and, therefore, wind-driven waves, vary seasonally at a given location and spatially alongshore. Mean wave heights along the Atlantic Coast range from 0.7 to 1.3 m and mean wave periods from 6.4 to 7.4 s (U.S. Army Corps of Engineers, 2006). Wave characteristics along the New Eng-land and Mid-Atlantic coast depend on weather patterns (espe-cially cyclonic activity), coastline orientation, storm climatol-ogy, and local bathymetry. Extratropical storms generally are less intense (lower sustained winds) than tropical storms but often impact a given portion of the coast for days as opposed to hours. Table 7 lists some of the major tropical and extra-tropical storms that have generated some of the largest and longest duration waves along the New England and the Mid-Atlantic coast over the past century. The frequency with which hurricanes have a direct impact is smaller in New England and the Mid-Atlantic than in the Southeast and Gulf coasts. However, hurricanes that never make landfall but that track, or even stall, along the Eastern Seaboard can generate large waves and storm surges that can cause severe erosion over a
broad swath of the coast. The primary source of storm waves along the New England and Mid-Atlantic coast is extratropical cyclones, which can have dramatically varying intensities and durations. Extratropical storms can occur throughout the year but are most frequent during the fall and winter months.
The New England and Mid-Atlantic seaboard has a semidiurnal tidal regime of two unequal high and low tides per day. The range is controlled partly by the width and gradi-ent of the continental shelf and related steepening of the tidal wave as it crosses the shelf (Redfield, 1958; Nummendal and others, 1977; Clarke, 1991). The highest tidal ranges are found where the shelf is wide and has a low gradient. Along the New England and Mid-Atlantic coast, the highest tidal range, 2.7 m, is found along the coast of Maine, to the location of the widest shelf in the New England and Mid-Atlantic region (Davis and Fitzgerald, 2004). The range decreases southward as the shelf narrows. Tidal range influences beach processes and barrier-island morphologic characteristics because it determines the extent of beach exposure and inundation throughout the tidal cycle. Especially crucial to beach-erosion episodes are the timing and height of the highest tides as well as the maximum wave height and surge developed during storms.
Sea-Level Rise
Geologic evidence (recessional moraines and outwash plains) around Cape Cod indicates that ice was retreating from New England between 15,300 and 14,250 b.p. (Larson, 1982; Uchupi, 1996). Relative sea-level curves indicate that the Holocene transgression in New England, south of Boston, was steady and continuous until the sea reached present-day levels (FitzGerald and others, 1994). North of Boston, rates of sea-level rise and isostatic rebound associated with glacial retreat resulted in variable relative sea levels until 5,000 to 6,000 b.p. (Kelley and others, 1992). Sea-level rise slowed throughout New England about 3,000 to 4,000 b.p. (Oldale and O’Hara, 1980), and associated sediment deposition led to the formation of modern barrier coasts. Along the Mid-Atlantic coast, areas experienced subsidence related to isostatic rebound as the ice sheet was removed (Peltier, 1997), resulting in different rates of Holocene sea-level rise than in New England. Psuty (1986) presents data that indicate sea level in the New Jersey area rose rapidly until approximately 7,000 b.p. and then slowed from that time period on.
Modern rates of sea-level rise along the New England and Mid-Atlantic coast vary spatially and temporally (Douglas, 2001, 2005; Englehart and others, 2009), as can be seen in the tide-gage records for the past century (fig. 8). Anderson and others (1989) attribute the variability in sea-level rise in New England primarily to residual post-glacial isostatic rebound, hydrostatic loading, differential increases in tidal range, and neotectonics. Relative rates of sea-level rise are highest (3–4 mm/yr) in the Mid-Atlantic, where tidal ranges are high and

22 National Assessment of Shoreline Change: Historical Shoreline Change along the New England and Mid-Atlantic Coasts
Table 7. Summary of major tropical and extratropical storms impacting the New England and Mid-Atlantic coasts since 1900.
[Hx= hurricane category (Saffir-Simpson Hurricane Scale); TS= tropical storm, E= extratropical cyclone (“nor’easter”); storms are listed in chronological order]
Storm Category Year Date Region SourceHurricane (not named) H1 1903 9/16 Mid-Atlantic NOAAHurricane (not named) H1 1916 7/21 New England NOAAHurricane (not named) H1 1936 9/19 New England NOAAGreat New England Hurricane (“Long Island Express”)
H3-E 1938 9/21 New England Morang and others, 1999;NOAA
Hurricane (not named) H1-H2 1944 9/14-9/15 New EnglandMid-Atlantic
Morang and others, 1999;NOAA
Extratropical Cyclone (not named) E 1950 11/25 Mid-Atlantic Morang and others, 1999
Hurricane Carol H2 1954 8/31 New EnglandMid-Atlantic
Morang and others, 1999;NOAA
Hurricane Edna H1-H2 1954 9/11 New England NOAA
Hurricane Donna H1-H2 1960 9/12-9/13 New EnglandMid-Atlantic NOAA
Ash Wednesday Storm E 1962 3/6-3/8 Mid-Atlantic Davis and Dolan, 1993; Morang and others, 1999
Hurricane Belle H1-H2 1976 8/9-8/10 Mid-Atlantic NOAABlizzard of 1978 E 1978 2/5-2/7 New England Glass and others, 1979Hurricane Gloria H1-H2 1985 9/27 Mid-Atlantic NOAAExtratropical Cyclone (not named) E 1989 3/7-3/11 Mid-Atlantic Dolan and others, 1990Hurricane Bob H2 1991 8/19 New England NOAAHalloween nor’easter or, “All Hallow’s Eve” storm, or, Perfect Storm
E 1991 10/28-10/31 New EnglandMid-Atlantic
Davis and Dolan, 1992; Morang and others, 1999
Extratropical Cyclone (not named) E 1992 12/11-12/14 Mid-Atlantic Morang and others, 1999
“Storm of the Century” E 1993 3/12-3/13 New EnglandMid-Atlantic Davis and Dolan, 1993
Hurricane Floyd H1-TS-E 1999 9/16-9/17 New EnglandMid-Atlantic NOAA
Patriots Day Storm E 2007 4/15-4/18 New England Marrone, 2008“Nor’Ida” E 2009 11/11-11/15 Mid-Atlantic USGS
coastal subsidence is occurring, especially in New Jersey and Delaware. In Maine, a low tidal range coupled with residual isostatic rebound results in the lowest relative rate of sea-level rise (1.8 mm/yr) in New England and the Mid-Atlantic.
Sediment Sources and Transport
The primary sources of coastal sediment for the New England and Mid-Atlantic region are updrift eroding coasts and offshore riverine and glacial deposits (Niederoda and oth-ers, 1985; Swift and others, 1985). Rivers are not considered a primary source of sediment within the modern coastal system,
as little modern river sediment reaches the present-day coast (Meade and Emery, 1971; Wright, 1995). An exception to this is riverine input along the coast of Maine, where large rivers provide sediment to the coast (Fenster and FitzGerald, 1996) and smaller systems deliver sediment to form pocket beaches between headlands, and small barrier spits in low-lying areas.
Along the more elongate barrier islands of the Mid-Atlantic, the coastline is relatively straight and wave approach is oblique, driving net sediment transport in a specific direction (that is westward along the Long Island coast, and, in general, south along the New Jersey and Delmarva coasts). Along the more irregular, crenulated New England coast, sediment transport is confined between headlands or embayments. Little exchange of material occurs in or out of the embayments and,
Geology and Geomorphology of the New England and Mid-Atlantic Coasts 23
Portsmouth, VA
Lewes, DE
3.8 mm/yr
1900 1910 1920 1930 1940 1950 1960 1970 1980 1990 2000 2010
3.2 mm/yr
Atlantic City, NJ4.0 mm/yr
Montauk, NY2.8 mm/yr
Newport, RI2.6 mm/yr
Woods Hole, MA2.6 mm/yr
Portland, ME1.8 mm/yr
500
250
0
500
250
0 500
250
0
500
250
0
500
250
0500
250
0
500
250
0
Sea
-leve
l cha
nge
(mill
imet
ers)
Sea level-change (m
illimeters)
Year
Figure 8. Graphs showing long-term (100-year) trends in average annual sea level at selected tide gages in New England and the Mid-Atlantic. Data are from the Permanent Service for Mean Sea Level (PSMSL) and can be downloaded from www.psmsl.org/data/obtaining/. (mm/yr, millimeters per year)

24 National Assessment of Shoreline Change: Historical Shoreline Change along the New England and Mid-Atlantic Coasts
as a result, there is no net longshore movement of material. Along less crenulated portions of the New England coast, long-shore-transport directions are highly variable (Jensen, 1983; FitzGerald and others, 1994) and are driven by the direction of wave approach, which is locally influenced by the presence of shoals, islands, and headlands and by coastal orientation.
Landforms of the New England and Mid-Atlantic Coasts
The New England and Mid-Atlantic region is composed of four general coastal geomorphologic types: rocky coasts; bluffs with narrow fronting beaches; mainland beaches, which are considered to be beaches connected to the mainland, whether fronting bluffs, dunes, or extensive marshes; and barrier beaches (which for this report include both islands and spits). Figure 5 shows the regional distribution of these features and highlights the diversity of landform type along the New England and Mid-Atlantic coast. Long, linear barrier beaches, with associated lagoons, inlets, and spits, are most common in the Mid-Atlantic, whereas the rocky coasts and the majority of the bluffed coasts are in New England. Table 8 provides the relative distribution of shore type in New England and the Mid-Atlantic, which is dominated by linear or mainland beaches (78 percent), followed by rocky coasts (15 percent) and bluffs with fronting beaches (7 percent). Photo-graphic examples of each type of coastal geomorphology are shown in figure 9 and a schematic diagram of different coastal features found along the New England and Mid-Atlantic coasts is shown in figure 10.
Coastal Landforms of New England
Coastal landforms of New England (for this report, defined as extending from central Maine through Rhode Island) are paraglacial (Forbes and Syvitski, 1994) and include fjords, rocky headlands, periglacial deposits such as moraines and drumlins, and sand and gravel beaches derived from outwash and other glacial deposits. Glaciogenic sediment, which can range widely in size, is dominant in paraglacial coasts. As a result, mixed-sediment beaches derived from these materials are composed of a wide range of sediment sizes, and are com-monly composed of sand and cobble- to boulder-sized material.
Barrier beaches in New England are typically small and discontinuous as a result of localized and limited sediment sources and partitioning of the coast by headlands (FitzGer-ald and others, 1994; van Heteren and others, 1998). Small pocket beaches, bound by rocky headlands, occur in areas that lack a substantial sediment source and sufficient low-land area to migrate or grow as a barrier spit. Beaches in New England are primarily transgressive, with barrier-spit
beaches exhibiting evidence of overwash and peat exposure in the intertidal zone. With no room to transgress, pocket beaches tend to be composed of lag sediments dominated by larger sizes (gravel and larger), as sand tends to be lost from the system during large storms.
Rocky and bluffed portions of the coast comprise outcroppings of crystalline bedrock and glacial deposits, respectively. Rocky areas of the coastline form headlands that protect and isolate pocket beaches and are relatively stable coastal features. Coastal bluffs in New England and northeast-ern Long Island are the result of the erosion of higher relief landforms, such as drumlins and moraines, during thousands of years of sea-level rise. Eroded bluff sediment forms narrow beaches in front of eroding bluffs. Coarser material may form a lag deposit that remains after finer sediments are transported away, marking the approximate former position of the bluff (Kelley, 2004).
Coastal Landforms of the Mid-Atlantic
The most common coastal landforms in the Mid-Atlantic are barrier islands and barrier spits, with fewer occurrences of mainland beaches (table 8). A small stretch of high glacial bluffs with fronting beaches occurs at the eastern terminus of Long Island. The shape and morphology of barrier beaches are a function of the wave energy and direction, and tidal range (Hayes, 1979). Long, linear barrier beaches form in microtidal environments where storm processes, such as overwash and breaching, dominate. Inlets are widely spaced along coast and have small ebb-tide deltas compared to flood-tide deltas. The relatively low tidal flow in microtidal settings is not sufficiently strong to maintain an opening if an island breaches during a storm. Flood currents through established inlets tend to be much stronger than return (ebb) flows.
Short, wide barrier islands are also common in the Mid-Atlantic region and are associated with a mixed-energy envi-ronment in which both storm processes and a relatively large tidal range work together to shape the islands and maintain the inlets (Hayes, 1979). Stronger tidal currents develop within island breaches, allowing storm-created channels to remain open. Large ebb deltas commonly form on the seaward side of mixed-energy barriers. The ebb shoals can influence patterns of wave approach, leading to higher rates of erosion adjacent to the inlets and transportation and deposition of sediment along the downcoast portion of the island. As a result, the islands narrow on one end and widen on the other, forming what is referred to as a “drumstick” barrier (Hayes, 1979; Davis, 1994).
Estuaries and Lagoons in the New England and Mid-Atlantic Areas
According to a classification by Healy and Kirk (1982), there are four types of estuaries, including (1) fiords, which are flooded valleys of glacial origin; (2) drowned river valleys; (3)

History of Infrastructure Development 25
Figure 9. Oblique aerial photographs showing the various geomorphic shore types along the New England and Mid-Atlantic coasts: (A) pocket beach, Cape Neddick, Maine; (B) bluff with linear beach, Colony Beach, Massachusetts; (C) mainland beach, Hither Hills Beach, New York; and (D) barrier island beach, Assateague Island, Maryland.
barrier-enclosed estuarine lagoons composed of barrier islands and spits that enclose or partially enclose a shallow lagoon; and (4) structurally induced estuaries. These categories are not independent or mutually exclusive; rivers and glaciers may follow structurally weak zones that are subsequently flooded as sea level rises. Most of the large estuaries in New England and the Mid-Atlantic are fiords and drowned river valleys, respectively, and are perpendicular or at a high angle to the shoreline. Some of the larger estuaries include Buzzards Bay, Narragansett Bay, Delaware Bay, and Chesapeake Bay. Narra-gansett Bay is the largest estuary in New England and Chesa-peake Bay is the largest estuary in the United States.
Lagoon systems occur throughout New England and the Mid-Atlantic coast. Some of the larger systems include Great South Bay, Barnegat Bay, and Chincoteague Bay. Many of the narrow coastal lagoons, especially in the Mid-Atlantic, are formed from flooded smaller rivers and streams that flowed parallel to shore.
Estuary and lagoon environments are important coastal ecosystems and occur along much of the Atlantic Seaboard. They serve as sediment sinks, preventing material from reaching the Atlantic littoral system. The accumulation of continental sediments in estuaries provides the substrate upon which extensive marsh systems develop. Estuary and lagoon shorelines are not evaluated in this report because of the focus on open-ocean coasts.
History of Infrastructure Development
The first European to explore the coast of New England and the Mid-Atlantic is widely held to be Italian explorer Giovanni da Verrazano, in 1524. The earliest permanent settlement was Jamestown, VA, in 1607. In 1609, Henry

26 National Assessment of Shoreline Change: Historical Shoreline Change along the New England and Mid-Atlantic Coasts
Ocean
LandBluff
Waves
Bay or estuaryMarsh
River
Bayhead delta
Mainland beach
Spit
Barrier islandTidalinlet
Longshore current
Longshore current
LagoonPocket beach
Flood tidal delta
Ebb tidal delta
NOT TO SCALE
Figure 10. Schematic diagram showing common coastal landforms of New England and the Mid-Atlantic.
Hudson, representing Dutch interests, landed on Manhattan Island. Shortly afterwards, the Dutch West Indies Company sent the first permanent European settlers to Manhattan Island, on which the proto-New York town of New Amsterdam was founded in 1624. After multiple skirmishes with the English, the Dutch surrendered in 1664 and the town was renamed New York. Settlements established concurrently with the found-ing history of New York were established up and down the New England and Mid-Atlantic coast, which rapidly became a thriving region for ports and trading.
According to the U.S. Census Bureau, the total popula-tion of the original Colonies in the New England and Mid-Atlantic region was 4,700 in 1630. By 1780, this number had grown to more than 1.6 million. Exponential population growth prompted the building of coastal fortifications, includ-ing military installations, and the emplacement of structures to protect harbors and navigation channels. Most of the coastal alteration, however, was restricted to the large popula-tion centers. The coast outside these areas was sparsely, if at all, populated.
The coast did not become a vacation destination until the mid-1800s, when railroads connecting the interior lands to the coast were constructed (Houston, 2003). The first of these con-nected Camden to Atlantic City, NJ. As automobiles became common and more roads were constructed, beaches became an increasingly popular tourist destination.
Coastal structures are ubiquitous along many portions of the New England and Mid-Atlantic coastline, from groin fields and seawalls built to protect individual buildings or communities to jetties and breakwaters built to stabilize inlets and harbors and to keep navigation channels open. The longest period of beach development began following World War II
(Pilkey and Dixon, 1996) and has continued to the present day. It is estimated from a USGS overflight of the coast in 2009 that approximately 33 percent of the New England and Mid-Atlantic coast exhibits some type of coastal structure (unpub-lished data available at the U.S. Geological Survey, Woods Hole, MA). The various structures have interrupted sediment-transport processes and, in the case of seawalls, resulted in the loss of beaches in many areas. To counter the effects of the structures, as well as damage from storms, beach nourish-ment projects are frequently undertaken. As a result, there are very few locales in New England and the Mid-Atlantic where coastal processes proceed unimpeded.
Although many areas of the New England and Mid-Atlantic coast are heavily developed or urbanized, the Federal government began setting aside coastal lands as national parks and wildlife refuges. In 1961, the first national park in the New England and Mid-Atlantic region, Cape Cod National Seashore, was established. Presently, long stretches of the New England and Mid-Atlantic coast are public lands, including Fire Island National Seashore, Gateway National Recreation Area, and Assateague Island National Seashore. Although the National Park Service attempts to allow natural processes to occur without interference, the extensive development within or adjacent to parks presents management challenges.
Historical Shoreline Change Analysis
This section presents the results of the New England and Mid-Atlantic sandy shoreline change analysis and discusses,

Historical Shoreline Change Analysis 27
Shore-type Length (km)Percent of total
length
Rocky coast 211 15
Bluffs with linear beaches 104 7
Mainland beaches 340 23
Barrier beaches 805 55
Total length of coast 1460 100
Structures present 384 26
where possible, the potential effects of engineering structures and beach nourishment projects on the rates of shoreline change. The New England and Mid-Atlantic coast is sub-divided into 10 regions (fig. 1), which are based broadly on coastal geomorphology and the orientation of the coast. Tables 9a and 9b summarize both long-term and short-term average rates of shoreline change within each region. Additionally, tables 10a and 10b present the maximum and minimum ero-sion and accretion rates for each region in New England and the Mid-Atlantic. The descriptions of shoreline change include discussion of human-induced changes. Many of the substantial erosion/accretion trends and (or) reversals in trend are related to human intervention within the natural coastal system. The New England and Mid-Atlantic shorelines are thought to be eroding primarily because of sea-level rise and climatic changes, and as a consequence of human activities that disrupt the natural sediment supply. For each region, the level of development is described as sparse, moderate, dense, heavy, or urban. These categories are subjective but, for the purposes of this report, are broadly defined as follows:
Sparse – widely spaced, single-family homes not clustered in communities; little to no tourist infrastructure or commercial development.
Moderate – predominantly single-family homes, possibly concentrated in communities; some open space between communities; some tourist infrastructure such as parking lots and bath houses; limited commercial development.Dense – single-family homes and hotels/apartments of only several stories; nearly continuous communities; some tourist infrastructure and commercial development. Heavy – predominantly multi-storied hotels and condominium complexes continuous alongshore; tourist infrastructure such as boardwalks and parking lots; substantial commercial development.Urban – multi-storied hotels, condominium complexes and apartment buildings continuous alongshore; extensive commercial and some industrial infrastructure; limited tourist infrastructure.
In the discussions below, rates are referenced from tables 9a and 9b where shoreline change rates are presented as the region-averaged net rate for the long-term (1800s—1997/2000) and short-term (1960-70s—1997/2000) analyses. The region-averaged net change rates are the average of both negative (erosional) and positive (accretional) rates; hence, the use of the term net to distinguish this rate from the erosion-only rates that are also presented in tables 9a and 9b. Additionally, we present the percent of the measured coastline that is erod-ing at rates faster than -1 and -3 m/yr. For the rates reported herein, erosional trends are presented as negative values and accretional trends are presented as positive values. Although shoreline change rates in some areas are relatively low or accretional, many beaches in the New England and Mid-Atlan-tic are narrow and even a small amount of local erosion may present serious hazards to the coastal resources and community infrastructure in a given area.
Errors and uncertainty values for each region are included in tables 9a and 9b. A statistical t-test was performed to deter-mine whether the long-term and short-term rates were signifi-cantly different from one another at the 90-percent confidence interval. The t-test results indicate that the difference between long-term and short-term rates is statistically significant in all regions. In the Delmarva North and Delmarva South/Southern Virginia regions, the short-term rates of change became more erosional. In the remaining eight analysis regions, the average shoreline change rates either did not change over time or were more accretional in the short term than in the long term. This trend is likely attributable to increases in nourishment projects within most regions of New England and Mid-Atlantic coasts during the more recent period (~25-30 yr). Tables 10a and 10b list the maximum erosion and accretion rates for each region for both the long and short term.
The average net rate of long-term shoreline change for New England was -0.4 m/yr and for the Mid-Atlantic was -0.6 m/yr, an erosional trend. These rates are based on shoreline change rates averaged from 19,784 individual transects, of which 65 percent were eroding. The analysis showed that three regions in New England and the Mid-Atlantic experi-enced long-term positive net shoreline change: New England North (0.1 m/yr), Long Island (0.08 m/yr), and New Jersey South (0.8 m/yr) (table 9a). The highest negative (erosional) region-averaged net rate was measured in the Delmarva South/Southern Virginia region (-3.7 m/yr). Overall, New England had a slightly less erosional net long-term shoreline change than the Mid-Atlantic (-0.4 m/yr and -0.6 m/yr, respectively). The percentage of coast eroding in the long term in New Eng-land was greater than in the Mid-Atlantic (71 and 67 percent, respectively). However, a larger percentage of the Mid-Atlantic coast was eroding at higher rates in the long term: 18 percent of the New England coast was eroding at rates greater than -1 m/yr, compared to 26 percent of the Mid-Atlantic coast. In New England, only 3 percent of the coast was found to be eroding at rates greater than -3 m/yr in the long term, whereas 11 percent of the Mid-Atlantic coast was eroding at rates greater than -3 m/yr.
Table 8. Relative distribution of geomorphic shore-types along the New England and Mid-Atlantic coasts.
[km, kilometer]

28 National Assessment of Shoreline Change: Historical Shoreline Change along the New England and Mid-Atlantic Coasts
Region Average of rates (m/yr)
Percent eroding
Average rate of
erosion (m/yr)
Percent eroding
more than -1 m/yr
Percent eroding
more than -3 m/yr
New
Engl
and
New England North 0.1 ± 0.05 41 -0.2 2 < 1
Greater Boston -0.09 ± 0.03 73 -0.2 <1 0
Cape Cod -0.4 ± 0.5 74 -1.1 23 5
Massachusetts Islands -1.4 ± 0.09 90 -1.6 61 10
New England South -0.2 ± 0.03 84 -0.3 1 0
Mid-
Atlan
tic
Long Island 0.08 ± 0.2 60 -0.6 9 3
New Jersey North -0.6 ± 0.2 71 -1.1 23 5
New Jersey South 0.8 ± 0.3 38 -1.0 15 2
Delmarva North -0.5 ± 0.2 78 -1.2 29 8Delmarva South/Southern Virginia -2.9 ± 0.5 83 -3.7 62 40
New England totals -0.4 ± 0.1 71 -0.5 18 3
Mid-Atlantic totals -0.6 ± 0.1 67 -2.2 26 11
NEMA totals -0.5 ± 0.09 65 -1.4 23 8
Region Average of rates (m/yr) Percent eroding
Average rate of
erosion(m/yr)
Percent eroding
more than -1 m/yr
Percent eroding
more than -3 m/yr
New
Engl
and
New England North -0.4 ± 0.1 75 -0.9 20 2
Greater Boston -0.1 ± 0.06 68 -0.6 11 < 1
Cape Cod 0.3 ± 0.09 73 -2.9 42 16
MA Islands -0.8 ± 0.1 74 -1.7 43 10
New England South -0.09 ± 0.1 62 -0.4 2 < 1
Mid-
Atlan
tic
Long Island 0.8 ± 0.09 36 -1.0 15 1
New Jersey North 0.5 ± 0.06 58 -0.9 3 1
New Jersey South 0.2 ± 0.1 48 -2.2 28 10
Delmarva North Delmarva South/ -0.8 ± 0.04 71 -2.1 45 16 Southern Virginia -2.7 ± 0.1 66 -5.6 50 35
New England total -0.2 ± 0.09 70 -1.5 27 7
Mid-Atlantic total -0.3 ± 0.1 54 -2.5 27 12
NEMA total -0.3 ± 0.1 60 -2.1 27 10
Table 9a. Average long-term shoreline change rates for the New England and Mid-Atlantic (NEMA) coasts. [m/yr, meters per year]
Table 9b. Average short-term shoreline change rates for the New England and Mid-Atlantic (NEMA) coasts. [m/yr, meters per year]

Historical Shoreline Change Analysis 29
Region Long-termrate (m/yr) Location Short-term
rate (m/yr) Location
New England NorthMax. erosion -2.5 Morse River, Phippsburg, ME -4.9 Castle Neck Beach, MAMax. accretion 3.5 Morse River, Phippsburg, ME 9.4 Castle Neck Beach, MAGreater BostonMax. erosion -2.1 New Inlet, at Herring River -4.8 North Situate BeachMax. accretion 2.9 West side of Cape Cod Canal 8.0 Sandy NeckCape CodMax. erosion -8.0 Monomoy Island -21.6 Chatham InletMax. accretion 8.1 Monomoy Island 59.3 South BeachMA IslandsMax. erosion -4.4 South Beach, Martha’s Vineyard -11.7 Tuckernuck Island, NantucketMax. accretion 4.4 Esther Island, Nantucket 29.7 Tuckernuck Island, NantucketNew England South
Max. erosion -1.4 East Matunuck State Beach, RI -1.9 Horseneck Point, MA at the entrance to Westport Harbor
Max. accretion 1.1 West side (jettied) inlet to Pt. Judith Pond, RI 1.9 Card Pond, Matunuck, RI
Table 10a. Maximum shoreline change rates: New England coast. [m/yr, meters per year; max., maximum]
Table 10b. Maximum shoreline change rates: Mid-Atlantic coast. [m/yr, meters per year; max., maximum]
Region Long-termrate (m/yr) Location Short-term
rate (m/yr) Location
Long IslandMax. erosion -4.9 Western end of Gilgo Beach -4.2 Fire Island, by William Floyd Pkwy cupola
Max. accretion 20.2 Western end of Jones Beach 19.6 Eastern end of Gilgo BeachNew Jersey NorthMax. erosion -8.6 South end of Long Beach Island -6.1 South end of Long Beach Island
Max. accretion 5.9 Sandy Hook 33.6 Barnegat Lighthouse State Park
New Jersey South
Max. erosion -4.3 Cape May, west of Beach Ave and series of groins -19.3 North of Brigantine Island, adjacent to
Brigantine Inlet
Max. accretion 15.4 North end Little Beach island, adjacent to Little Egg Inlet 10.3 Spit on south side of Corson Inlet
Delmarva NorthMax. erosion -6.2 North end of Assateague -9.2 South end of AssateagueMax. accretion 21.5 South end of Assateague 40.3 South end of Assateague
Delmarva South /
Southern VirginiaMax. erosion -18.5 South end of Hog Island -40.3 South end of Parramore Island
Max. accretion 10.0 Eastern side of Fishermans Island 50.6 North end of Hog Island

30 National Assessment of Shoreline Change: Historical Shoreline Change along the New England and Mid-Atlantic Coasts
MA
NH
ME
RI
CT
New England North
Greater Boston
Cape Cod
New England North
Greater Boston
Massachusetts Islands
GreaterBoston
New England South
1 Phippsburg2 Popham Beach3 Morse River4 Casco Bay5 Portland6 Old Orchard Beach7 Kennebunkport8 Cape Neddick9 Piscataqua River Inlet10 Portsmouth11 Hampton12 Merrimack River Inlet13 Plum Island14 Plum Island Sound15 Castle Neck16 Essex River17 Cape Ann
18 Good Harbor19 Gloucester20 Salem Sound21 Salem22 Nahant23 Boston24 Boston Harbor25 Nantasket Beach26 Cohasset27 North Scituate Beach28 Scituate29 New Inlet30 Herring River31 Duxbury32 Plymouth Harbor33 Plymouth34 Cape Cod Canal35 Sandwich36 Sandy Neck
37 Race Point Light38 Provincetown39 Truro40 Cape Cod National Seashore41 Marconi Beach42 Nauset Marsh43 Cape Cod44 Nauset Beach45 Chatham Inlet46 South Beach47 Monomoy Island
48 Nantucket49 Great Point50 Siasconset Beach51 Esther Island52 Madaket Harbor53 Tuckernuck Island54 Nantucket Sound55 Martha’s Vineyard56 Vineyard Haven57 Oak Bluffs58 Edgartown59 Cape Poge60 Chappaquiddick Island61 Wasque Point62 Squibnocket Point63 Gay Head
64 Clarks Cove65 South Dartmouth66 Mishaum Point67 Westport Harbor68 Horseneck Beach69 Horseneck Point
70 Narragansett Bay71 Aquidneck Island72 Newport73 Conanicut Island74 Jamestown75 Narragansett
76 Point Judith Pond77 East Matunuck State Beach78 Matunuck79 Card Pond80 Watch Hill81 Napatree Point
ATLANTIC
OCEAN
CapeCod
New EnglandSouth
Massachusetts Islands
0 3015 KILOMETERS
0 3015 MILES
69°W71°W
43°N
41°N
70°W
42°N
Base from Medium Resolution (1:70,000 scale, NAD 83) Digital Vector Shoreline of the coterminous United States: National Oceanic and Atmospheric Administration, 1994.
2
54
6
7
8
910
1213
15 1719
2021
22
2423 2526
2928
3332
34 35 36
11
1
3
1614
18
31
30
27
43
383739
4041
42
4445
4647
48
49
5052
5153
54596055
6162
63
5856 57
646567 6672
81
70
717374
77767978
686975
80Figure 11. Index map of (A) New England and (B) the Mid-Atlantic showing geographic names discussed in this report.
The average net rate of short-term change for New Eng-land and the Mid-Atlantic was -0.3 m/yr based on 17,339 tran-sects, 60 percent of which were eroding. Negative (erosional) net short-term shoreline change was measured in 6 of the 10 regions. The percentage of coast eroding in the short term was higher in New England (70 percent) than in the Mid-Atlantic (54 percent). The percentage of coastline eroding at short-term rates greater than -1.0 m/yr was the same in New England and the Mid-Atlantic (27 percent). However, more of the Mid-Atlantic coast was eroding at faster rates (>-3.0 m/yr).
New England: Maine to Rhode Island
The shoreline change analysis of New England covers the coast from Popham Beach, ME, through Rhode Island, a distance of approximately 714 km (fig. 1). For the presentation of the shoreline change analysis, New England was divided into five regions: New England North, Greater Boston, Cape Cod, Massachusetts Islands, and New England South (fig. 11a).
The geomorphology of the New England coast is highly variable (fig. 5). Rocky coastlines occur in the Northern and

Historical Shoreline Change Analysis 31
ATLANTIC
OCEAN
8384
PA NJ
MD
DE
NY
VA
DelmarvaNorth
107108109110111112113
114
116
117
119120
124125126
127128
130131
132133134
135136
137
144145
146
148149
153 150154
155156157158
159
173
174
175
176NC
106
82
105
118
115
129
147
152
177
151
Long Island
Long Island
New JerseyNorth
Delmarva Southand
Southern Virginia
CT
Delmarva North
Delmarva South and Southern Virginia
82 Long Island Sound83 Montauk Point84 Montauk85 Easthampton86 Southampton87 Southampton Beach88 Shinnecock Inlet89 Westhampton Beach Island90 Westhampton91 Moriches Inlet92 Fire Island National Seashore93 Fire Island94 Democrat Point95 Fire Island Inlet96 Cedar Beach97 Gilgo Beach98 Jones Beach Island99 Jones Inlet100 Long Beach Island101 East Rockaway Inlet102 Rockaway103 Breezy Point104 Rockaway Inlet105 New York City
93
87908991
9594
969798
99100
101102104103
8685
92
88
New Jersey North106 Hudson River107 Raritan Bay108 Sandy Hook109 Monmouth Beach110 Long Branch111 Shark River Inlet112 Manasquan Inlet113 Bay Head114 Island Beach115 Island Beach State Park116 Barnegat Inlet117 Long Beach Island118 Little Egg Harbor Inlet119 Little Egg Inlet
New Jersey South120 Little Beach Island121 Edwin B. Forsythe Wildlife Refuge122 Brigantine Inlet123 Brigantine Island124 Absecon Inlet125 Atlantic City126 Absecon Island127 Great Egg Harbor Inlet128 Ocean City129 Corson Inlet130 Ludlam Island131 Townsends Inlet132 Seven Mile Island133 Hereford Inlet134 North Wildwood135 Five Mile Beach136 Cape May Inlet137 Cape May Point
138
139140141142
143
138 Delaware Bay139 Cape Henlopen140 Rehoboth Beach141 Indian River Inlet142 Bethany Beach143 Fenwick Island144 Ocean City145 Ocean City Inlet146 Assateague Island147 Assateague Island National Seashore148 Toms Cove149 Fishing Point
166167168169
170
171172
New JerseySouth
150 Chincoteague Inlet151 NASA Wallops Flight Facility152 Gunboat Point153 Wallops Island154 Assawoman Island155 Metompkin Island156 Metompkin Inlet157 Cedar Island158 Wachapreague Inlet159 Parramore Island160 Quinby Inlet161 Hog Island162 Great Machipongo Inlet163 Cobb Island164 Sand Shoal Inlet
165 Wreck Island166 New Inlet167 Ship Shoal Island168 Ship Shoal Inlet169 Myrtle Island170 Little Inlet171 Smith Island172 Smith Island Inlet173 Fishermans Island174 Chesapeake Bay175 Cape Henry176 Virginia Beach177 Shipps Bay
121122123
72°W73°W
41°N
40°N
39°N
38°N
37°N
74°W75°W76°W
160161162
163164165
Base from Medium Resolution (1:70,000 scale, NAD 83) Digital Vector Shoreline of the coterminous United States: National Oceanic and Atmospheric Administration, 1994.
0 5025 KILOMETERS
0 5025 MILES
Figure 11. Index map of (A) New England and (B) the Mid-Atlantic showing geographic names discussed in this report.
Southern New England regions, as well as the northern portion of the Greater Boston region. Mainland beaches backed by marshes are typically interspersed within sections of rocky coast. Barrier beaches occur in all analysis regions of New England, although they are not the long, linear barrier islands typical of the Mid-Atlantic. Bluffs fronted by narrow beaches are the least common type of coast, and occur at the northern and southern portions of the Greater Boston region, along the outer part of Cape Cod, and in small sections of the Massachu-setts Islands region.
New England has a crenulated, rocky coastline with small sections of pocket beaches, except for shorelines adja-cent to river mouths and a few areas where coastal bluffs are fronted by narrow beaches. As a result of this geomorphol-ogy, there are many gaps in the data; the short-term change was measured along a total of 441 km of the shoreline, and short-term change was measured over 307 km. Both long-term (−0.4 m/yr) and short-term (−0.2 m/yr) net shoreline change rates were erosional when averaged over all of the New England transects. Of the 8,824 transects along which

32 National Assessment of Shoreline Change: Historical Shoreline Change along the New England and Mid-Atlantic Coasts
-8-4
04
812
-8-4
04
812
0 10 20 30 40 50 60 70 80 90 100
110
120
130
140
150
160
170
180
0
10
40
50
60
70 80
90
100 11
0 120
130
140 15
0
160
170
180
$
010
5M
ILES
010
5KI
LOM
ETER
S
Distance alongshore (kilometers)
Mer
rimac
k Rive
r Inle
t
Plum
Isla
nd
Pisc
ataq
ua R
iver
Inle
tPo
rtsm
outh
Cape
Ned
dick
Kenn
ebun
kpor
t
Old
Orch
ard
Beac
h
Portl
and
Casc
o Ba
y
Poph
am B
each
Cape
Ann
Eros
ion
Ac
cret
ion
Eros
ion
Ac
cret
ion
Saco
Riv
er In
let
Mai
ne
New
Ham
pshi
re
Mas
sach
uset
tsCa
stle
Nec
k
Poph
am B
each
Casc
o Ba
y
Portl
and
Old
Orch
ard
Beac
h
Kenn
ebun
kpor
t
Cape
Ned
dick
Pisc
ataq
ua R
iver
Inle
t
Mer
rimac
k Ri
ver I
nlet
Plum
Isla
ndPl
um Is
land
Cast
le N
eck
Cast
le N
eck
Phip
psbu
rg
Mor
se R
iver
Shor
elin
e ch
ange
: N
ew E
ngla
nd N
orth
Long
-term
rate
of c
hang
e (m
eter
s pe
r yea
r)Sh
ort-t
erm
rate
of c
hang
e (m
eter
s pe
r yea
r)
Figu
re 1
2.
Grap
hs s
how
ing
long
- and
sho
rt-te
rm s
hore
line
chan
ge ra
tes
for t
he N
ew E
ngla
nd N
orth
regi
on. T
he lo
catio
n of
the
regi
on is
sho
wn
in fi
gure
1.
Bot
h th
e m
axim
um lo
ng-te
rm e
rosi
on (-
2.5
met
ers
per y
ear)
and
accr
etio
n ra
tes
(3.5
met
ers
per y
ear)
wer
e at
the
mou
th o
f the
Mor
se R
iver
nea
r Ph
ipps
burg
, ME.
Gra
y ce
nter
ed b
ars
on lo
ng- a
nd s
hort-
term
rate
plo
ts in
dica
te th
e av
erag
e ra
nge
of s
hore
line
chan
ge fo
r the
regi
on.

Historical Shoreline Change Analysis 33
Figure 13. Oblique aerial photograph of Castle Neck, Massachusetts, in the New England North region. Both the maximum short-term erosion (-4.9 meters per year) and accretion (9.4 meters per year) rates were measured here. The average short-term change rate for the region was -0.4 ± 0.1 meters per year. Photograph is taken looking toward the northwest. General location of the site is shown in figure 11a.
long-term shoreline change was measured, 71 percent had an erosional trend, with an average erosion rate of –0.5 m/yr (table 9a). For the short-term analysis, the percentage of beach eroding was 70 percent and the average short-term erosion rate increased from the long-term rate to –2.5 m/yr (table 9b).
1: New England North RegionThe New England North region covers approximately 309
km of coastline and extends from Popham Beach, ME, to Cas-tle Neck, MA, on the north side of Cape Ann (figs. 11a and 12). The New England North region includes the southern Maine coast, the New Hampshire coast, and the northernmost por-tion of coastal Massachusetts. The coastline in this region is sparsely developed with the exception of more moderate beach development at popular tourist centers such as Kennebunkport and Old Orchard Beach, ME; Hampton, NH; and Plum Island MA. Long stretches of the coastline are not developed and are managed as State reserves, State parks, or conservation areas. Engineering structures are restricted to jetties at some of the larger river mouths and inlets, and occasional back-beach riprap to protect homes.
For the New England North region, long-term change rates were measured along 82 km of shoreline. The net long-term rate, averaged over 1,642 transects, was 0.1 m/yr. Forty-one percent of transects in New England North region were experiencing erosion (average erosion rate = −0.2 m/yr) in the long term, but only 2 percent of the coast was experienc-ing erosion rates greater than −1.0 m/yr (table 9a). The New England North region was the only region in New England to exhibit a positive long-term net shoreline change rate, likely as
a result in part of the stabilization of river mouths where high accretion rates occurred as fillets developed on the upcoast side of jetties, and from continual but localized sediment input from river systems and estuaries. Sediment yields also may have increased over the past century as development practices and deforestation in the watersheds mobilized more sediment to the coast. The maximum long-term erosion rate (−2.5 m/yr) occurred at the mouth of the Morse River near Phipps-burg, ME, on the shoreline of a dynamic spit that extends across much of the river mouth (table 10a).
Short-term rates of change in the New England North region were measured only for a small section of coastline in northern Massachusetts. The lack of short-term data for New Hampshire and Maine is a result of the lack of recent (1970s-era) historical shoreline data to include in end-point calcula-tions. Consequently, short-term rates were measured along only 21 km of coast. The average short-term net shoreline change rate in the New England North region is erosional (−0.4 m/yr), a significant increase over the long-term rate (table 9b). Erosion in the short term was measured on 75 percent of transects in the New England North region and rates exceeded -1.0 m/yr on 20 percent of transects. Both the highest short-term erosion rate (−4.9 m/yr) and the highest short-term accretion rate were measured along Castle Neck Beach, which is a dynamic spit, just north of Cape Ann, MA (table 10a and fig. 13). The percentage of coastline eroding at rates greater than −1.0 m/yr increased by an order of magni-tude from the long to the short term (2 to 20 percent) and the average rate of change became more erosional, indicating an increase in erosion during the later portion of the 20th century in the New England North region.

34 National Assessment of Shoreline Change: Historical Shoreline Change along the New England and Mid-Atlantic CoastsGr
eate
r Bos
ton
Shor
eline
chan
ge (m
/yr)
-8-6
-4-2
02
46
8
Distance alongshore (km)
0 10 20 30 40 50 60 70 80 90 100
110
120
130
140
150
160
170
-8-6
-4-2
02
46
8
0 10 20 30 40 50 60 70 80 90 100
110
120
130
140
150
160
170
Distance alongshore (kilometers)
Eros
ion
Ac
cret
ion
Eros
ion
Ac
cret
ion
$
010
5KI
LOM
ETER
S
010
5M
ILES
0
1020
40 60
70
80
90 100
110
120
130
140
150
160
30
50
Mas
sach
uset
ts
Cape
Ann
Glou
cest
erSa
lem
Sou
ndSa
lem
Nah
ant
Bost
onHa
rbor
Nan
task
et
Coha
sset
Scitu
ate
New
Inle
t
Plym
outh
Harb
or
Cape
Cod
Can
al
Sand
wic
h
Sand
y N
eck
Cape
Ann
Cape
Ann
Sale
m S
ound
Sale
m S
ound
Nah
ant
Nah
ant
Bost
on H
arbo
rBo
ston
Har
bor
Nan
task
etN
anta
sket
Coha
sset
Coha
sset
Scitu
ate
Scitu
ate
New
Inle
tN
ew In
let
Plym
outh
Harb
orPl
ymou
thHa
rbor
Cape
Cod
Can
alCa
pe C
od C
anal
Sand
wic
hSa
ndw
ich
Sand
y N
eck
Sand
y N
eck
Herr
ing
Rive
r
Shor
elin
e ch
ange
: G
reat
er B
osto
n
Long
-term
rate
of c
hang
e (m
eter
s pe
r yea
r)Sh
ort-t
erm
rate
of c
hang
e (m
eter
s pe
r yea
r)
Figu
re 1
4. G
raph
s sho
win
g lo
ng- a
nd sh
ort-t
erm
shor
elin
e ch
ange
rate
s for
the
Grea
ter B
osto
n re
gion
. The
loca
tion
of th
e re
gion
is sh
own
in fi
gure
1.Th
e m
axim
um lo
ng-
term
ero
sion
rate
was
-2.1
met
ers p
er ye
ar a
t New
Inle
t nea
r the
Her
ring
Rive
r mou
th, a
nd th
e m
axim
um sh
ort-t
erm
ero
sion
rate
of -
4.8 m
eter
s per
year
was
mea
sure
d al
ong
Nor
th S
citu
ate
Beac
h. G
ray c
ente
red
bars
on
the
rate
plo
ts in
dica
te th
e av
erag
e ra
nge
of sh
orel
ine
chan
ge fo
r the
regi
on.

Historical Shoreline Change Analysis 35
2: Greater Boston RegionThe Greater Boston region extends 227 km from Good
Harbor, MA, on the south side of Cape Ann to Sandy Neck Beach on Upper Cape Cod (figs. 11a and 14). The coastline in the Greater Boston Region falls entirely within the State of Massachusetts. The Greater Boston Region is one of the most geomorphically variable regions in New England and the Mid-Atlantic, with the northern portion dominated by rocky coastline with small pocket beaches between headlands (fig. 15a). In the vicinity of Boston, mainland beaches are more dominant, and tall bluffs with narrow linear beaches occur between Plymouth and the Cape Cod Canal. Long barrier spits such as Duxbury, Plymouth, and Sandy Neck are popular tourist beaches located south of Boston (fig. 15b). The Greater Boston region is the most densely populated of the analysis regions in New England, and includes the population centers of Gloucester and Boston and towns of historical significance
Figure 15.
A
B
Figure 15. Oblique aerial photographs of (A) Brace Cove, MA, looking west, with the city of Gloucester in the background; and (B) Duxbury Beach, MA, a popular tourist beach south of Boston, looking south, in the Greater Boston region.
such as Salem and Plymouth. The Greater Boston region is moderately to heavily developed, and engineering structures are relatively common and include jetties and breakwaters at harbor entrances, scattered groin fields, and long stretches of riprap and seawalls. The density of structures is especially high along the more heavily populated areas.
Long-term shoreline change for the Greater Boston region was measured on 2,005 transects, covering a total of 100 km of coastline. The long-term net shoreline change rate for the Greater Boston region was -0.09 m/yr, an erosional trend. Most of the measured shoreline was eroding in the long term (73 percent, average erosion rate = -0.2 m/yr) (table 9a); however, rates exceeding -3.0 m/yr were measured on fewer than 1 percent of transects. The maximum erosion rate, -2.1 m/yr, was measured along a highly dynamic spit at New Inlet, at the mouth of the Herring River (table 10a). Long-term change varies considerably along the coast and rates of accre-tion are highest at harbor and river mouths (fig. 14), likely as a result of sediment accumulation on the updrift side of stabilizing jetties.
Short-term net average shoreline change rates for the Greater Boston region were measured along 69 km of coastline and averaged -0.1 m/yr, the same net rate as in the long term. The percentage of shoreline eroding in the short term, 68 per-cent, decreased slightly from the long term (73 percent) (table 9b), and the averaged rate on transects with an erosional trend was -0.6 m/yr. Less than 1 percent of transects in the Greater Boston region were eroding at rates greater than -3.0 m/yr. The highest short-term erosion rate (-4.8 m/yr) was measured at North Scituate Beach (table 10a) on a small pocket beach formed between rocky headlands and a large seawall. The high-est short-term accretion rate occurred near the end of a barrier spit at Sandy Neck Beach near Sandwich, MA, on the upper part of Cape Cod. The rate of shoreline change in the Greater Boston region did not change from the long term to the short term; however, the percentage of coastline eroding in the more recent time period at rates greater than -1.0 m/yr increased significantly, from 1 to 11 percent.

36 National Assessment of Shoreline Change: Historical Shoreline Change along the New England and Mid-Atlantic Coasts
-24
-16
-80
816
2448
5664
Eros
ion
Ac
cret
ion
-24
-16
-80
816
24
0 10 20 30 40 50 60 70 80 90
Eros
ion
Ac
cret
ion
Distance alongshore (kilometers)
$
05
2.5
MIL
ES
05
2.5
KILO
MET
ERS
0
10
20
30
40 50
60
70
80
90
Prov
ince
tow
n
Race
Poi
nt L
ight
Trur
o
Mar
coni
Beac
h
Nau
set
Mar
sh
Nau
set B
each
Chat
ham
Inle
tSo
uth
Beac
h
Mon
omy
Isla
nd
Prov
ince
tow
nPr
ovin
ceto
wn
Race
Poi
nt L
ight
Race
Poi
nt L
ight
Trur
oTr
uro
Mar
coni
Beac
hM
arco
niBe
ach
Nau
set
Mar
shN
ause
tM
arsh
Nau
set B
each
Nau
set B
each
Chat
ham
Inle
tCh
atha
m In
let
Sout
hBe
ach
Sout
h Be
ach
Mon
omy
Isla
ndM
onom
y Is
land
Shor
elin
e ch
ange
: Ca
pe C
od
Long
-term
rate
of c
hang
e (m
eter
s pe
r yea
r)Sh
ort-t
erm
rate
of c
hang
e (m
eter
s pe
r yea
r)
Figu
re 1
6. G
raph
s sh
owin
g lo
ng- a
nd s
hort-
term
sho
relin
e ch
ange
rate
s fo
r the
Cap
e Co
d re
gion
. The
loca
tion
of th
e re
gion
is s
how
n in
figu
re 1
.The
max
imum
lo
ng-te
rm e
rosi
on ra
te w
as -8
.0 m
eter
s pe
r yea
r at M
onom
oy Is
land
, and
the
max
imum
sho
rt-te
rm e
rosi
on ra
te o
f -21
.6 m
eter
s pe
r yea
r was
mea
sure
d at
Ch
atha
m In
let.
Gray
cen
tere
d ba
rs o
n lo
ng- a
nd s
hort-
term
rate
plo
ts in
dica
te th
e av
erag
e ra
nge
of s
hore
line
chan
ge fo
r the
regi
on.

Historical Shoreline Change Analysis 37
3: Cape Cod RegionThe Cape Cod region extends along 88 km of coastline
in Massachusetts and covers the region from the outer tip of Cape Cod at Provincetown to Monomoy Island (figs. 11a and 16). This portion of the New England coast is sparsely developed and most of this region lies within the boundar-ies of Cape Cod National Seashore. The geomorphology is almost equally divided between tall bluffs with narrow fronting beaches in the northern part of the region and bar-rier islands and spits to the south (fig. 17). The linear barrier system on Cape Cod is the most extensive in New England. There are no engineering structures in the Cape Cod region, making it the only region in New England and the Mid-Atlantic with a natural system.
Rates of shoreline change are lower and more uniform in the north and more highly variable along the southern bar-rier system in the Cape Cod region (fig. 16). Long-term rates of change were measured along 83 km of Cape Cod and the average net rate was -0.4 m/yr (table 9a). In the long term, 74 percent of the coast was found to be eroding (erosion-only
Figure 17. Oblique aerial photograph of Monomoy Island, MA, where the maximum long-term erosion (-12.1 meters per year) and accretion (8.1 meters per year) rates in the Cape Cod region were measured. The photograph is looking to the north.
average rate = -1.1 m/yr), with 23 percent of the measured shoreline eroding at rates greater than -1.0 m/yr, and 5 percent eroding at rates greater than -3.0 m/yr. Both the long-term ero-sion and accretion measurements were highest (-8.0 m/yr and 8.1 m/yr, respectively) on Monomoy Island (fig. 17).
The short-term rates of change in the Cape Cod region are highly variable, especially in the southern part of the region along the barrier system (fig. 16). The net short-term rate was accretional, 0.3 m/yr, and is greatly influenced by the large shoreline progradation at South Beach, south of Chatham Inlet (fig. 16). The shoreline was eroding (averaged erosion rate = -2.9 m/yr) along 73 percent of the 83 km on which short-term rates were measured (table 9b). Erosion rates exceeded -1.0 m/yr along 42 percent of the shoreline, nearly double the percentage of long-term rates that exceeded -1.0 m/yr. Rates exceeded -3.0 m/yr along 16 percent of the coast, which is also an increase from the long-term rates. The rates of both short-term erosion (-21.6 m/yr) and accretion (59.3 m/yr) were high-est on South Beach adjacent to Chatham Inlet, where the island underwent substantial counterclockwise rotation (erosion to the north, accretion on the south end).

38 National Assessment of Shoreline Change: Historical Shoreline Change along the New England and Mid-Atlantic Coasts
-12
-8-4
04
824
32
0 10 20 30 40 50 60 70 80 90 100
110
-12
-8-4
04
824
32
0 10 20 30 40 50 60 70 80 90 100
110
70
80 90 100
110
0
10
20
30
40
50
Mar
tha’
sVi
neya
rd
Nan
tuck
et
Chap
paqu
iddi
ckIs
land
Tuck
ernu
ck Is
land
Gay
Head
Squi
bnoc
ket P
oint
Was
que
Poin
tCa
pe P
oge
Mad
aket
Har
bor
Sias
cons
etBe
ach
Grea
t Poi
nt
Esth
er Is
land
Eros
ion
Ac
cret
ion
Eros
ion
Ac
cret
ion
Grea
t Poi
nt
Sias
cons
et B
each
Esth
er Is
land
Tuck
ernu
ckIs
land
Cape
Pog
e
Chap
paqu
iddi
ckIs
land
Was
que
Poin
t
Squi
bnoc
ket P
oint
Gay
Head
Grea
t Poi
nt
Sias
cons
et B
each
Esth
er Is
land
Mad
aket
Har
bor
Tuck
ernu
ck Is
land
Cape
Pog
e
Chap
paqu
iddi
ckIs
land
Was
que
Poin
t
Squi
bnoc
ket P
oint
Gay
Head
010
20KI
LOM
ETER
S
05
10M
ILES
Distance alongshore (kilometers)
$
N
Shor
elin
e ch
ange
: M
assa
chus
etts
Isla
nds
Long
-term
rate
of c
hang
e (m
eter
s pe
r yea
r)Sh
ort-t
erm
rate
of c
hang
e (m
eter
s pe
r yea
r)
Figu
re 1
8. G
raph
s sh
owin
g lo
ng- a
nd s
hort-
term
sho
relin
e ch
ange
rate
s fo
r the
Mas
sach
uset
ts Is
land
s re
gion
. The
loca
tion
of th
e re
gion
is s
how
n in
figu
re 1
. Bo
th th
e m
axim
um lo
ng-te
rm a
nd s
hort-
term
ero
sion
rate
s, -7
.1 m
eter
s pe
r yea
r and
-11.
7 m
eter
s pe
r yea
r, re
spec
tivel
y, w
ere
mea
sure
d at
Tuc
kern
uck
Isla
nd
on N
antu
cket
. Gra
y ce
nter
ed b
ars
on lo
ng- a
nd s
hort-
term
rate
plo
ts in
dica
te th
e av
erag
e ra
nge
of s
hore
line
chan
ge fo
r the
regi
on.

Historical Shoreline Change Analysis 39
4: Massachusetts Islands RegionThe Massachusetts Islands region covers the south and
east coasts of Nantucket and Martha’s Vineyard, a total dis-tance of 93 km. Shoreline change measurements were made from Great Point to Tuckernuck Island on Nantucket and from Cape Poge to Gay Head on Martha’s Vineyard (figs. 11a and 18). The geomorphology of these islands includes both barrier and mainland beaches, as well as tall bluffs composed of soft glacial deposits. Barrier beaches are more predominant on Martha’s Vineyard than on Nantucket, with the barriers formed as spits across the mouths of small coastal lagoons. Nantucket is moderately developed and the concentration of coastal homes is greatest along the Siasconset Beach area (fig. 11a). There are no coastal engineering structures on the open-ocean coastline of Nantucket. The open coast of Martha’s Vineyard is sparsely to moderately developed. The larger population centers of Edgartown, Vineyard Haven, and Oak Bluffs are all on the Nantucket Sound side of the island. There are a few small, isolated structures (one groin, several small seawalls) in this area.
Long-term shoreline change was measured along 89 km of the Massachusetts Islands region. The average long-term net change was -1.4 m/yr, the highest erosional net change in New England (table 9a). In the long term, 90 percent of the 1,775 transects in the Massachusetts Island region were erosional (average rate for erosional transects = -1.6 m/yr), and rates exceeded -1.0 m/yr along 61 percent of the measured coast, the largest percentage in New England. The highest long-term
erosion rate in the Massachusetts Islands region (-4.4 m/yr) was measured at South Beach on the southern side of Martha’s Vine-yard (fig. 18). The highest long-term accretion rate, 4.4 m/yr (table 10a), was measured on Esther Island, a dynamic bar-rier spit at the entrance to Madaket Harbor immediately south of Tuckernuck Island on Nantucket (fig. 19).
The average net short-term rate in the Massachusetts Island region, -0.8 m/yr, was also the most erosional of the average net rates in New England, based on measurements from 1,759 transects. Erosion occurred on 74 percent of the measured transects (average rate for erosional transects = -1.7 m/yr), a significant decrease from the percentage erod-ing in the long term (table 9b). Rates of erosion exceeded -1.0 m/yr along 43 percent of the shoreline, and exceeded -3.0 m/yr along 10 percent. The highest short-term erosion rate (-11.7 m/yr; table 10a) was measured on Tuckernuck Island on Nantucket, although high rates of a similar mag-nitude (-11.0 m/yr) were measured at Wasque Point on the southeastern corner of Martha’s Vineyard. The highest short-term accretion rate was measured on the northwestern tip of Tuckernuck Island on Nantucket, near the location of the highest long-term accretion rate.
Rates of shoreline change in the Massachusetts Islands region became less erosional from the long to the short term. Additionally, both the total percentage of coast eroding and the percentages eroding at higher rates (−1.0 and −3.0 m/yr) decreased. Regardless of the decreases in rates and percentages of erosion, the Massachusetts Islands region has the highest ero-sion rates and percentages of coast eroding in New England.
Figure 19. Oblique aerial photograph of Madaket Inlet and Esther Island in the Massachusetts Islands region. The highest long-term and short-term shoreline change rates were measured in this vicinity. Photograph is taken looking to the north.

40 National Assessment of Shoreline Change: Historical Shoreline Change along the New England and Mid-Atlantic Coasts
-20
2-2
02
0 10 20 30 40 50 60 70 80 90 100
110
$
N
010
5M
ILES
010
5KI
LOM
ETER
S
Distance alongshore (kilometers)
Mis
haum
Poi
nt
Hors
enec
k Be
ach
Hors
enec
k Po
int
Nar
raga
nset
t Bay
Nar
raga
nset
t
Poin
t Jud
ith
Mat
unuc
k
Wat
ch H
ill
Nap
atre
e Po
int
Mas
sach
uset
ts
Rhod
e Is
land
Conn
ectic
ut
0
10
20
30
40
50 110100
908070
60
Clar
ks C
ove
Sout
h Da
rtmou
th
Mis
haum
Poi
nt
Hors
enec
k Be
ach
Hors
enec
k Po
int
Nar
raga
nset
t Bay
Nar
raga
nset
t
Poin
t Jud
ith
Mat
unuc
k
Wat
ch H
ill
Nap
atre
e Po
int
Mat
unuc
k
Poin
t Jud
ith
Nar
raga
nset
t
Wat
ch H
ill
Nap
atre
e Po
int
Nar
raga
nset
t Bay
Hors
enec
k Po
int
Hors
enec
k Be
ach
Mis
haum
Poi
nt
Eros
ion
Ac
cret
ion
Eros
ion
Ac
cret
ion
Shor
elin
e ch
ange
: N
ew E
ngla
nd S
outh
Long
-term
rate
of c
hang
e (m
eter
s pe
r yea
r)Sh
ort-t
erm
rate
of c
hang
e (m
eter
s pe
r yea
r)
Figu
re 2
0. G
raph
s sh
owin
g lo
ng- a
nd s
hort-
term
sho
relin
e ch
ange
rate
s fo
r the
New
Eng
land
Sou
th re
gion
. The
loca
tion
of th
e re
gion
is s
how
n in
fig
ure
1. T
he m
axim
um lo
ng-te
rm e
rosi
on ra
te w
as -1
.4 m
eter
s pe
r yea
r at E
ast M
atun
uck
Beac
h, R
I, an
d th
e m
axim
um s
hort-
term
ero
sion
rate
of -
1.9
met
ers
per y
ear w
as m
easu
red
at H
orse
neck
Poi
nt, M
A. G
ray
cent
ered
bar
s on
long
- and
sho
rt-te
rm ra
te p
lots
indi
cate
the
aver
age
rang
e of
sho
relin
e ch
ange
for t
he re
gion
.

Historical Shoreline Change Analysis 41
5: New England South RegionThe New England South region is 111 km long and
extends from Clarks Cove in South Dartmouth, MA, to Napa-tree Point, RI, at the Rhode Island-Connecticut border (figs. 11a and 20). The region ranges from moderately to densely developed. Although engineering structures exist, they are not widespread. However, structures are numerous enough to disrupt littoral transport and potentially impact the reported rates of change. Between South Dartmouth and Narragansett Bay, the coastline is predominantly mainland beaches (fig. 21a) occasionally backed by low bluffs, and stretches of rocky coastline. Narragansett Bay is a dominant feature of this region and is the largest estuary in New England. Although several of the southern islands within Narragansett Bay have open-coast beaches (Aquidneck Island and Conanicut Island, where the towns of Newport and Jamestown are located, respectively), there are gaps in the historical shoreline data. Therefore, rates of change are not reported for these beaches. Along the coastline west of Narragansett Bay, the beaches are barrier spits formed across the openings of coastal lagoons (fig. 21b). Overall, rates of shoreline change in the New England south region are vari-able along coast but tend to fall in a range between -1.0 and 1.0 m/yr (fig. 20), with a few anomalous rates generally associated with coastal engineering structures or beach replenishment.
Long-term shoreline change was measured on 1,136 tran-sects for a total coverage of 57 km. The average net long-term rate was -0.2 m/yr (table 9a). Eighty-four percent of the long-term rates were erosional, but only 1 percent exceeded -1.0 m/yr. Of the transects along which the shoreline was erod-ing, the average of the long-term erosion rates was -0.3 m/yr. The highest single long-term erosion rate was -1.4 m/yr, at East Matunuck State Beach (table 10a). The highest long-term accretion rate was 1.1 m/yr, immediately adjacent to the west-ern jetty at the mouth of Point Judith Pond.
The net short-term rate in the New England South region, −0.09 m/yr, was averaged from 1,135 transects along 57 km of coast, and is slightly lower than the long-term change rate. Gaps in the short-term record are a result of missing historical data in the eastern part of the region (fig. 20). Sixty-two percent of the measured coast was eroding in the short term (averaged erosion-only rates = -0.4 m/yr). As for the long-term erosional trend, the percentage of coast eroding at rates greater than -1.0 m/yr was low (2 percent). The site with the highest short-term erosion rate, -1.9 m/yr, was Horseneck Point, MA, at the entrance to Westport Habor. The highest short-term accretion rate, 1.9 m/yr, was measured at Card Pond in Matunuck, RI, at a location where a barrier inlet periodically opens and closes.
Mid-Atlantic: New York to Virginia
The Mid-Atlantic coast extends from the eastern tip of Long Island to the Virginia/North Carolina border, a total distance of approximately 644 km (fig. 11b). The Mid-Atlan-tic includes five analysis regions: Long Island, New Jersey North, New Jersey South, Delmarva North, and Delmarva South/Southern Virginia.
The Mid-Atlantic is dominated by barrier-island and barrier-spit beaches, with mainland beaches occurring along small stretches of the Long Island, New Jersey North, Del-marva North, and Delmarva South/ Southern Virginia regions (fig. 5). The only bluffed coasts in the Mid-Atlantic are along the far eastern portion of the Long Island region at Montauk, NY, and at several locations in New Jersey.
Long-term rates of change are presented for 619 km and short-term rates are presented for 545 km of sandy shoreline along the Mid-Atlantic coast. Rates are not presented for any portions of mainland coast that are fronted by barriers, or within any of the large estuaries or bays that include Raritan Bay at the mouth of the Hudson River and Chesapeake and
Figure 21. Oblique aerial photographs of locations in the New England South region: (A) Slocums Neck, MA, a mainland beach looking to the west; and (B) Shelter Harbor, RI, a barrier beach more typical of the area west of Narragansett Bay, looking to the north.
A
B

42 National Assessment of Shoreline Change: Historical Shoreline Change along the New England and Mid-Atlantic Coasts
-16
-12
-8-4
04
812
1620
2435
40-1
2-8
-40
48
1216
20
0
10 20 30 40 50 60 70 80 90
100
110
120
130
140
150
160
170
180
190
180
16014
0
12010
080
6040200
Mor
iche
s In
let
Gilg
o Be
ach
Mon
tauk
Poin
t
Shin
neco
ckIn
let
Westhampton Beach Island
Wes
tham
pton
Fire Island
Dem
ocra
tPo
int
Fire
Isla
nd In
let
Jone
sIn
let
East
Roc
kaw
ay In
let
Rock
away
Inle
t
Long Beach IslandJones Beach Island
Rockaway
Bree
zy P
oint
Mon
tauk
Poi
ntM
onta
uk P
oint
010
20KI
LOM
ETER
S
05
10M
ILES $
Eros
ion
Ac
cret
ion
Eros
ion
Ac
cret
ion
Distance alongshore (kilometers)
Shor
t-ter
m ra
te o
f cha
nge
(met
ers
per y
ear)
Long
-term
rate
of c
hang
e (m
eter
s pe
r yea
r)
Shin
neco
ck In
let
Mor
iche
s In
let
Dem
ocra
t Poi
nt
Gilg
o Be
ach
Rock
away
Bree
zy P
oint
Wes
tham
pton
Long BeachIsland
Jones BeachIsland
Fire IslandWesthamptonBeach Island
Fire
Isla
nd In
let
East
Roc
kaw
ay In
let
Rock
away
Inle
t
Jone
s In
let
Shin
neco
ck In
let
WesthamptonBeach Island
Wes
tham
pton
Mor
iche
s In
let
Fire Island
Dem
ocra
t Poi
ntFi
re Is
land
Inle
t
Jones BeachIsland
Gilg
o Be
ach
Jone
s In
let
Long BeachIsland
Long BeachIsland
East
Roc
kaw
ay In
let
Long BeachIsland
Shor
elin
e ch
ange
: L
ong
Isla
nd
Figu
re 2
2. G
raph
s sh
owin
g lo
ng- a
nd s
hort-
term
sho
relin
e ch
ange
rate
s fo
r the
Lon
g Is
land
regi
on. T
he lo
catio
n of
the
regi
on is
sho
wn
in fi
gure
1. T
he
max
imum
long
-term
ero
sion
rate
was
-4.9
met
ers
per y
ear a
t the
wes
tern
end
of G
ilgo
Beac
h. T
he m
axim
um s
hort-
term
ero
sion
rate
of -
4.2
met
ers
per y
ear w
as lo
cate
d on
Fire
Isla
nd, b
y th
e W
illia
m F
loyd
Par
kway
cup
ola.
Gra
y ce
nter
ed b
ars
on lo
ng- a
nd s
hort-
term
rate
plo
ts in
dica
te th
e av
erag
e ra
nge
of s
hore
line
chan
ge fo
r the
regi
on.

Historical Shoreline Change Analysis 43
Delaware Bays. Both long-term (-0.6 m/yr) and short-term (-0.3 m/yr) net rates of change were erosional, and greater than the net change rates in New England. Long-term rates of change were measured on 11,560 transects. Results show that 67 percent of the Mid-Atlantic was eroding in the long term and 54 percent was eroding in the short term. The overall percentage of coast undergoing erosion was smaller in the Mid-Atlantic than in New England. However, the net change rates in the Mid-Atlantic were more erosional and more of the coastline was eroding at higher rates.
6: Long Island RegionThe Long Island region is 191 km long and extends
from Montauk, NY, at the entrance to Long Island Sound to Breezy Point at the mouth of Raritan Bay, NY (figs. 11b and 22). This stretch of coast is dominated by barrier islands in the western and central parts of the region. At Southampton the barrier system joins the mainland and the elevation of the back beach increases eastward. Tall bluffs are the dominant coastal feature at and near Montauk Point. The Long Island region is moderately to densely developed, with some urbanized coastlines and several areas with no development in National, State, or county parks and wilderness areas. Development and the degree of urbanization increase with proximity to New York City. There are few visible engineering structures east of Westhampton Beach, except for several groins in the East Hampton area and a large riprap seawall at Montauk Point. There are many rock revetments and bulkheads on individual properties that are generally buried in sand except during large storms. Sand fencing is present along many portions of this region, as it is commonly used to stabilize dunes. Beginning with the jetties at Shinnecock Inlet, there are many littoral interceptors along the Long Island coast, including a groin
field at Westhampton and six stabilized inlets (Shinnecock, Moriches, Fire Island, Jones, East Rockaway, and Rockaway). West of Jones Inlet, groin fields are nearly continuous along the coast. In addition to the widespread engineering structures, especially in the western portion of the Long Island region, there is a long history of beach nourishment projects (Western Carolina University, 2010). Rates of change, especially in the long term, are low and relatively uniform along coast (fig. 22). From Fire Island Inlet to Breezy Point, however, rates are highly variable. The variation in and magnitude of shoreline change rates directly correspond to the level of engineering (structures or nourishment) along the coast.
Long-term shoreline change was measured on 3,518 transects, covering 176 km of coastline. Both the long-term (−0.08 m/yr) and short-term (0.8 m/yr) net shoreline change rates were accretional (table 9a). In the long term, 60 percent of the Long Island region was undergoing erosion (average of erosional rates = -0.6 m/yr), with 9 percent of the measured transects experiencing erosion rates greater than -1.0 m/yr. The maximum long-term erosion rate was along Gilgo Beach in the location of a now-closed inlet (table 10b). The maximum long-term accretion rate was 20.2 m/yr, at the western end of Jones Beach, at the tip of a spit that has accreted since it was stabilized in 1959 (fig. 23).
The percentage of coastline eroding in the Long Island region decreased from the long term (60 percent) to the short term (36 percent) (table 9a). However, the percentage of coast eroding at rates greater than -1.0 m/yr increased from the long term to the short term, from 9 to 15 percent. Sites of accretion are most commonly located near stabilized inlets. The maxi-mum short-term erosion (−4.2 m/yr) is found on Fire Island, by the William Floyd parkway cupola. The maxiumum short-term accretion (19.6 m/yr) is found on the eastern end of Gilgo Beach, near Fire Island Inlet (table 10b).
Figure 23. Oblique aerial photograph looking east along Jones Beach, NY. This is the location of the maximum long-term accretion rate (20.2 meters per year) in the Long Island analysis region.

44 National Assessment of Shoreline Change: Historical Shoreline Change along the New England and Mid-Atlantic Coasts
-12
-8-4
04
812
1620
3236
-12
-8-4
04
812
1620
3236
0 10 20 30 40 50 60 70 80 90 100
110
Eros
ion
Ac
cret
ion
Eros
ion
Ac
cret
ion
Distance alongshore (kilometers)
05
MIL
ES
05
KILO
MET
ERS
$Lo
ng B
ranc
h
Shar
k Ri
ver I
nlet
Man
asqu
an In
let
Barn
egat
Inle
t
Littl
e Eg
g In
let
Rarit
an B
ay
Long Beach IslandIsland Beach
Sandy Hook
Mon
mou
th B
each
Bay
Head
Sandy Hook
Sandy Hook
Mon
mou
th B
each
Mon
mou
th B
each
Long
Bra
nch
Long
Bra
nch
Shar
k Ri
ver I
nlet
Shar
k Ri
ver I
nlet
Man
asqu
an In
let
Man
asqu
an In
let
Bay
Head
Bay
Head
Island Beach
Island Beach
Barn
egat
Inle
tBa
rneg
at In
let
Long Beach Island
Long Beach Island
Littl
e Eg
g In
let
Littl
e Eg
g In
let
0
10
20 30 40 50 60 70
80
90
100
110
Shor
elin
e ch
ange
: N
ew J
erse
y N
orth
Long
-term
rate
of c
hang
e (m
eter
s pe
r yea
r)Sh
ort-t
erm
rate
of c
hang
e (m
eter
s pe
r yea
r)
Figu
re 2
4. G
raph
s sh
owin
g lo
ng- a
nd s
hort-
term
sho
relin
e ch
ange
rate
s fo
r the
New
Jer
sey
Nor
th re
gion
. The
loca
tion
of th
e re
gion
is s
how
n in
figu
re 1
. Bot
h th
e m
axim
um lo
ng-te
rm a
nd s
hort-
term
ero
sion
rate
s, -8
.6 m
eter
s pe
r yea
r and
-6.1
met
ers
per y
ear,
resp
ectiv
ely,
wer
e m
easu
red
at th
e so
uth
end
of L
ong
Beac
h Is
land
. Gra
y ce
nter
ed b
ars
on lo
ng- a
nd s
hort-
term
rate
plo
ts in
dica
te th
e av
erag
e ra
nge
of s
hore
line
chan
ge fo
r the
regi
on.

Historical Shoreline Change Analysis 45
7: New Jersey North RegionThe New Jersey North region is 111 km long and extends
from Sandy Hook to Little Egg Inlet, NJ (figs. 11b and 24). The extreme northern extent of this region is a barrier spit at Sandy Hook. From approximately Monmouth Beach to Bay Head, the coastal system is composed of mainland beaches. South of Bay Head, the sandy shoreline beaches are along bar-rier islands and spits. The New Jersey North region is one of the most heavily engineered coasts within New England and the Mid-Atlantic, and as a result the reported rates of change reflect human modifications more than natural processes. Nearly the entire region is modified with hard structures (groins, jetties, seawalls, etc.) (fig. 25), and there is a long history of beach nourishment programs that are still ongo-ing. There are three stabilized inlets in the New Jersey North region: Barnegat, Manasquan, and Shark River Inlets. Little Egg Harbor is one of the few non-stabilized inlets in the New Jersey North region. Most of the region is densely to heav-ily developed, with the exception of the Edwin B. Forsythe Wildlife Refuge and Island Beach State Park. The patterns of regional shoreline change (fig. 24) indicate relatively low-magnitude and low-variability trends in the central part of the area. Both the highest rates of change and the highest vari-ability are near the major inlets. The low rates of change in the central portion are likely a result of a diminished natural signal by littoral interceptors and beach nourishment.
Long-term rates of shoreline change for the New Jersey North region were measured on 2,234 transects for a total of 112 km of coastline. The average net long-term rate was -0.6 m/yr, an erosional trend (table 9a). In the long term, 71 percent of the measured transects were erosional (average of erosional rates = -1.1 m/yr), and 23 percent had erosion rates exceeding -1.0 m/yr. Long-term rates greater than -3.0 m/yr occurred along 5 percent of the transects in the New Jersey North region. The maximum long-term erosion rate was -8.6 m/yr, at the southern end of Long Beach Island (table 10b), on the non-modified portion of the barrier spit. The highest long-term accretion rate was 5.9 m/yr, measured at the north-ern end of the New Jersey North region at Sandy Hook.
In the short term, the net shoreline change rate was 0.5 m/yr, a significant increase from the long-term net change rate (table 9b). The short-term rates were averaged from 2,108 transects covering 105 km of coast. Fifty-eight percent of the coast was undergoing erosion in the short term, a decrease from the long term (table 9b). The percent-age of transects eroding at rates greater than -1.0 m/yr also decreased in the short term, from 23 to 3 percent. The maxi-mum short-term erosion rate, -6.1 m/yr, was in the same area as the long-term maximum, along the rapidly changing spit at the southern end of Long Beach Island (table 10b). The maximum short-term accretion rate, 33.6 m/yr, was at the northern end of Long Beach Island, likely as a result of the development of a fillet adjacent to the inlet jetty.
Figure 25. Oblique aerial photograph looking west along Long Branch, NJ. Groins such as those shown here are common throughout the New Jersey North region.

46 National Assessment of Shoreline Change: Historical Shoreline Change along the New England and Mid-Atlantic Coasts
$0
5M
ILES
05
10KI
LOM
ETER
S
Distance Alongshore (km)
0 10 20 30 40 50 60 70 80 90
-20
-16
-12
-8-4
04
812
-12
-8-4
04
812
16
0 10 20 30 40 50 60 70 80 90
Distance alongshore (kilometers)
Five
Mile
Bea
ch
Brig
antin
e In
let
Abse
con
Inle
t
Atla
ntic
City
Grea
t Egg
Har
bor I
nlet
Cors
on’s
Inle
t
Tow
nsen
ds In
let
Here
ford
Inle
t
Cape
May
Inle
t
Nor
th W
ildw
ood
Littl
e Be
ach
Isla
nd
Seve
n M
ile Is
land
Ludl
am Is
land
Ocea
n Ci
ty
Abse
con
Isla
nd
Brig
antin
eIs
land
Cape
May
Poi
nt
Little
Egg I
nlet
Brig
antin
e In
let
Abse
con
Inle
t
Atla
ntic
City
Grea
t Egg
Har
bor I
nlet
Cors
on’s
Inle
t
Tow
nsen
ds In
let
Here
ford
Inle
t
Cape
May
Inle
t
Nor
th W
ildw
ood
Littl
e Be
ach
Isla
nd
Ludl
am Is
land
Ocea
n Ci
ty
Abse
con
Isla
nd
Brig
antin
eIs
land
Cape
May
Poin
t
Five
Mile
Bea
ch
Brig
antin
e In
let
Abse
con
Inle
t
Atla
ntic
City
Grea
t Egg
Har
bor I
nlet
Cors
on’s
Inle
t
Tow
nsen
ds In
let
Here
ford
Inle
t
Cape
May
Inle
t
Nor
thW
ildw
ood
Littl
e Be
ach
Isla
nd
Seve
n M
ile Is
land
Ludl
am Is
land
Ocea
n Ci
ty
Abse
con
Isla
nd
Brig
antin
eIs
land
Cape
May
Poi
nt
Eros
ion
Ac
cret
ion
Eros
ion
Ac
cret
ion
0
10
20
30
40 50
60 70
80
90
Seve
n M
ile Is
land
Five
Mile
Bea
ch
Shor
elin
e ch
ange
: N
ew J
erse
y So
uth
Long
-term
rate
of c
hang
e (m
eter
s pe
r yea
r)Sh
ort-t
erm
rate
of c
hang
e (m
eter
s pe
r yea
r)
Figu
re 2
6. G
raph
s sh
owin
g lo
ng- a
nd s
hort-
term
sho
relin
e ch
ange
rate
s fo
r the
New
Jer
sey
Sout
h re
gion
. The
loca
tion
of th
e re
gion
is s
how
n in
figu
re
1. T
he m
axim
um lo
ng-te
rm e
rosi
on ra
te w
as -4
.3 m
eter
s pe
r yea
r mea
sure
d at
Cap
e M
ay, a
nd th
e m
axim
um s
hort-
term
rate
of -
19.3
met
ers
per y
ear
was
foun
d at
the
north
end
of B
rigan
tine
Isla
nd a
djac
ent t
o Br
igan
tine
Inle
t. G
ray
cent
ered
bar
s on
long
- and
sho
rt-te
rm ra
te p
lots
indi
cate
the
aver
age
rang
e of
sho
relin
e ch
ange
for t
he re
gion
.

Historical Shoreline Change Analysis 47
8: New Jersey South RegionThe New Jersey South region extends along 86 km of
coastline from Little Egg Inlet to Cape May Point (figs. 11b and 26). The region is composed of a series of barrier islands separated from the mainland by both coastal lagoons and extensive marshes. The barrier islands of the New Jersey South region are shorter and wider than those in the Long Island, New Jersey North, and Delmarva North regions, indi-cating a mixed wave- and tide-dominated system, rather than a predominantly wave-dominated system. The coast is highly engineered, with seawalls, groin fields, and jetties common along the coast. The New Jersey South region, like the New Jersey North region, has a long history of beach nourishment. Therefore, rates of shoreline change are heavily influenced by these structures and modifications to the beach. Of the eight inlets in this region, five are stabilized with jetties. The non-stabilized inlets include Little Egg, Brigantine, and Corson. Development in the region ranges from dense to urban (for example, Atlantic City and Ocean City). The patterns of shoreline change are variable along the coast (fig. 26); the highest rates of change occur adjacent to both stabilized and non-stabilized inlets.
The long-term net shoreline change rate in the New Jersey South region is strongly accretional (0.8 m/yr), as measured on 1,408 transects covering 70 km of coastline (table 9a). It is the highest accretional long-term net change rate in New England and the Mid-Atlantic. Although 15
percent of the measured coast was undergoing erosion at rates greater than -1.0 m/yr, erosion occurred on 38 percent of the total number of measured transects (average of erosional rates = -1.0 m/yr), the lowest percentage in the Mid-Atlantic. The maximum long-term erosion rate (-4.3 m/yr) was along the southern part of the region at Cape May (table 10a). A maximum accretion rate of 15.4 m/yr was documented at the northern tip of Little Beach Island, next to a non-stabilized and sparsely developed inlet.
The averaged net short-term shoreline change rate in the New Jersey South region, 0.2 m/yr, was calculated from 1,349 transects covering 57 km of coastline (table 9b). The percentage of coast eroding increased from the long term to the short term (38 to 48 percent), and the percentage of coast eroding at rates greater than -1.0 m/yr increased to 28 percent, compared to the long-term percentage exceeding -1.0 m/y (15%). The maximum short-term erosion rate (-19.3 m/yr) was located north of Brigan-tine Island, adjacent to Brigantine Inlet (figure 27; table 10b). The maximum short-term accretion rate, 10.3 m/yr, was measured on the south side of Corson Inlet, and is associated with the north-ward migration of the inlet.
Overall, in the New Jersey South region, the amount of coast undergoing erosion increased and the rates of change became less accretional from the long to the short term. Additionally, the per-centage of coast eroding at rates higher than -1.0 m/yr increased from 15 to 28 percent. Although rates of change were variable along the coast, the areas of greatest erosion and accretion were associated with spit migration in non-stabilized inlets.
Figure 27. Oblique aerial photograph at Brigantine Inlet, looking south toward Atlantic City, NJ. This is the location of the maximum short-term erosion rate (-19.3 meters per year) in the New Jersey South region.

48 National Assessment of Shoreline Change: Historical Shoreline Change along the New England and Mid-Atlantic Coasts
-12
-8-4
04
812
1620
2440
-12
-8-4
04
812
1620
24
0 10 20 30 40 50 60 70 80 90 100
110
120
Cape
Hen
lope
nCa
pe H
enlo
pen
Reho
both
Bea
chRe
hobo
th B
each
Beth
any
Beac
hBe
than
y Be
ach
Indi
an R
iver
Inle
tIn
dian
Riv
er In
let
Ocea
n Ci
ty In
let
Ocea
n Ci
ty In
let
Tom
sCo
veTo
ms
Cove
Eros
ion
Ac
cret
ion
Eros
ion
Ac
cret
ion
Shor
elin
e Ch
ange
: Del
mar
va N
orth
Fenwick Island
Fenwick Island Assateague Island
Assateague Island
Ocea
n Ci
tyOc
ean
City
Distance alongshore (kilometers)
Shor
t-ter
m ra
te o
f cha
nge
(met
ers
per y
ear)
Long
-term
rate
of c
hang
e (m
eter
s pe
r yea
r)
Mar
ylan
d
Dela
war
e
Virg
inia
0
10
20
30
40 50
60
70
80
90
100
110
120
Dela
war
eBa
yCa
pe H
enlo
pen
Reho
both
Beac
h
Indi
an R
iver
Inle
t
Beth
any
Beac
hFe
nwic
k Is
land
Ocea
nCi
tyOc
ean
City
Inle
t
Assateague Island
Tom
s
Fish
ing
Poin
t
Cove
$
05
MIL
ES
05
10KI
LOM
ETER
S
Figu
re 2
8. G
raph
s sh
owin
g lo
ng- a
nd s
hort-
term
sho
relin
e ch
ange
rate
s fo
r the
Del
mar
va N
orth
regi
on. T
he lo
catio
n of
the
regi
on is
sho
wn
in fi
gure
1. T
he
max
imum
long
-term
ero
sion
rate
was
-6.2
met
ers
per y
ear a
t the
nor
th e
nd o
f Ass
atea
gue
Isla
nd a
nd th
e m
axim
um s
hort-
term
ero
sion
rate
of -
9.2
met
ers
per
year
was
mea
sure
d at
the
sout
h en
d of
Ass
atea
gue
Isla
nd. G
ray
cent
ered
bar
s on
long
- and
sho
rt-te
rm ra
te p
lots
indi
cate
the
aver
age
rang
e of
sho
relin
e ch
ange
for t
he re
gion
.

Historical Shoreline Change Analysis 49
9: Delmarva North RegionThe Delmarva North region extends along 114 km of
predominantly barrier-island coast from Cape Henlopen, DE, in the north to Chincoteague Inlet at the southern end of Assateague Island, VA (figs. 11b and 28). The barrier islands in this region tend to be the long, linear barriers that are indica-tive of wave-dominated regimes. Development in the Delmarva North region ranges from none to urban, with the heavier development concentrated in popular tourist centers such as Rehobeth Beach, DE, and Ocean City, MD. Large stretches of nondeveloped areas include a number of State parks in Dela-ware and Assateague Island National Seashore in Maryland. There are only two inlets in the Delmarva North region, Indian River and Ocean City Inlets, and both are stabilized with jetties. Ocean City Inlet is commonly used as the type location for the alteration of natural coastal processes due to the presence of littoral drift interceptors and structures that fix beaches in place. South of Ocean City Inlet, Assateague Island is relatively unaltered and has migrated landward more than 500 m, whereas Fenwick Island and the highly engineered coast of Ocean City have remained fixed since the inlet was stabilized in 1935 (fig. 29). With the exception of the inlet jetties and a few locations with small groin fields (Bethany Beach, Ocean City), there are relatively few shore-perpendicular structures in the Delmarva region. More common are hardened back-shores, including sea-walls and revetments protecting houses and tourist infrastruc-ture. These structures tend to be confined to the larger tourist centers. Nourishment, especially in Delaware and Ocean City, Maryland, was relatively widespread during the period from the 1960s to the 1990s (Western Carolina University, 2010) and less common in more recent times. Patterns of shoreline change are variable along the coast but tend to be less variable and smaller in magnitude north of Ocean City Inlet than on Assateague Island south of Ocean City Inlet. This difference is related
to the efforts to stabilize the coast (through nourishment and structures) in the north, in contrast to the natural response and behavior of the coastal system on Assateague Island.
Long-term rates of change were calculated on a total of 2,235 transects covering 112 km in the Delmarva North region. The average net long-term change rate was -0.5 m/yr (table 9a). Erosion occurred on 78 percent of the transects (average of ero-sional rates = -1.2 m/yr), with 29 percent exhibiting long-term erosion rates greater than -1.0 m/yr and 8 percent exhibiting long-term erosion rates greater than -3.0 m/yr. Maximum long-term rates of both erosion and accretion occurred on Assateague Island. The maximum erosion rate of -6.2 m/yr was on the northern end of Assateague Island approximately 1.5 km south of Ocean City Inlet (table 10b). The maximum accretion rate, 21.5 m/yr, was measured on the southern end of Assateague Island adjacent to Toms Cove, and is the highest long-term accretion rate measured in New England and the Mid-Atlantic.
In the short term the net change rate of −0.8 m/yr was aver-aged from 2,244 transects covering 112 km of coast (table 9a). The shoreline was found to be eroding along 71 percent of the measured coastline, a slight decrease from the long-term percent-age. However, the percentage of coastline eroding at rates greater than -1.0 m/yr increased substantially from the long-term to the short term (from 29 to 45 percent) and the percentage of coast eroding at rates higher than -3.0 m/yr doubled. Both the maximum short-term erosion (-9.2 m/yr) and accretion (40.3 m/yr) rates were measured at the southern end of Assateague Island along a re-curved spit forming Toms Cove (table 10b).
In the Delmarva North region, the percentage of coastline eroding decreased slightly (from 78 to 71 percent) from the long term to the short term, but the percentage of coast eroding at higher rates increased significantly. The highest rates of change were associated with more natural areas of the coast, accentu-ating the highly dynamic nature of barrier island systems that have not been heavily altered by anthropogenic influences.
Figure 29. Oblique aerial photograph of Ocean City Inlet in the Delmarva North region. Assateague Island (on the left) has migrated more than 500 meters since the inlet was stabilized in the 1930s. Ocean City, MD, is on the north side of the inlet.

50 National Assessment of Shoreline Change: Historical Shoreline Change along the New England and Mid-Atlantic Coasts
Shore
line R
ate of
Cha
nge (
m/yr)
-28-24
-20-16
-12-8
-40
48
1216
2048
52
0 10 20 30 40 50 60 70 80 90 100
110
120
130
140
150
160
170
Shore
line R
ate of
Cha
nge (
m/yr)
-44-40
-36-32
-28-24
-20-16
-12-8
-40
48
1216
2048
52
Distance alongshore (km)
0 10 20 30 40 50 60 70 80 90 100
110
120
130
140
150
160
170
0
10
20 30 40
50 60
70
80 90
100
110 13
0
140
150
160
170
Chin
cote
ague
Inle
t
Cape
Henr
y Virg
inia
Beac
h
Wal
lops
Isla
nd
Met
ompk
inIs
land
Ceda
r Isl
and
Parr
amor
e Is
land
Sand
Sho
al In
let
Fish
erm
ans
Isla
nd
Ches
apea
keBa
y
Hog
Isla
nd
Assa
wom
anIs
land Met
ompk
in In
let
Wac
hapr
eagu
e In
let
Quin
by In
let
Grea
t Mac
hipo
ngo
Inle
tCo
bbIs
land
Ship
Sho
al Is
land
Wre
ck Is
land
New
Inle
tSh
ip S
hoal
Inle
tM
yrtle
Isla
nd
Smith Island
Little
Inlet
Smith
Islan
d Inle
t
Nor
th C
arol
ina
Distance alongshore (kilometers)
Shor
t-ter
m ra
te o
f cha
nge
(met
ers
per y
ear)
Long
-term
rate
of c
hang
e (m
eter
s pe
r yea
r)
Eros
ion
Ac
cret
ion
Eros
ion
Ac
cret
ion
Ches
apea
keBa
yCh
esap
eake
Bay
Virg
inia
Bea
chVi
rgin
ia B
each
Hog
Isla
ndHo
g Is
land
Quin
by In
let
Parra
mor
e Is
land
Parra
mor
e Is
land
Quin
by In
let
Met
ompk
in In
let
Met
ompk
in In
let
Wre
ck Is
land
Wre
ck Is
land
Met
ompk
in Is
land
Cobb
Isla
ndCo
bb Is
land
Grea
t Mac
hipo
ngo
Inle
tGr
eat M
achi
pong
o In
let
Met
ompk
in Is
land
Smith
Isla
ndSm
ith Is
land
Myr
tle Is
land
Ship
Sho
al Is
land
New
Inle
t
Ship
Sho
al In
let
Ship
Sho
al Is
land
Myr
tle Is
land
Little
Inle
t
Shor
elin
e Ch
ange
: Del
mar
va S
outh
and
Sou
ther
n Vi
rgin
ia
New
Inle
t
05
10M
ILES
010
20KI
LOM
ETER
S
$
Figu
re 3
0. G
raph
s sh
owin
g lo
ng- a
nd s
hort-
term
sho
relin
e ch
ange
rate
s fo
r the
Del
mar
va S
outh
/Sou
ther
n Vi
rgin
ia re
gion
. Th
e lo
catio
n of
the
regi
on is
sho
wn
in fi
gure
1. T
he m
axim
um lo
ng-te
rm e
rosi
on ra
te w
as -1
8.5
met
ers
per y
ear a
t the
sou
th e
nd o
f Hog
Isla
nd a
nd th
e m
axim
um s
hort-
term
ero
sion
rate
of -
40.3
m
eter
s pe
r yea
r was
mea
sure
d at
the
sout
h en
d of
Par
ram
ore
Isla
nd. G
ray
cent
ered
bar
s on
long
- and
sho
rt-te
rm ra
te p
lots
indi
cate
the
aver
age
rang
e of
sh
orel
ine
chan
ge fo
r the
regi
on.

Historical Shoreline Change Analysis 51
10: Delmarva South/Southern Virginia RegionThe Delmarva South/Southern Virginia region extends 142
km from Gunboat Point at the south side of Chincoteague Inlet to the Virginia/North Carolina border near Shipps Bay (figs. 11b and 30). The region is composed of barrier islands north of the Chesapeake Bay and mainland beaches along the southern Vir-ginia coast. The 90 km of coast north of the Chesapeake Bay is composed of 11 islands and 10 inlets. The short barrier islands are indicative of mixed wave- and tide-dominated coasts. With the exception of the structures at NASA’s Wallops Flight Facil-ity (including a seawall protecting facility infrastructure), the Delmarva South region north of the Chesapeake Bay is not developed and the dynamic islands are located within parks and wildlife refuges (fig. 31). South of the Chesapeake Bay, devel-opment ranges from none within a few State parks to heavy in the vicinity of Virginia Beach. In the developed areas, back beaches are commonly fixed in place with seawalls. The only groin fields in this region are shore-parallel and found in the Cape Henry area. Virginia Beach has a history of nourishment dating back to the 1950s (Western Carolina University, 2010). Patterns of shoreline change in the Delmarva South/Southern Virginia region, especially the section north of the Chesapeake Bay, are highly variable along coast. This region exhibits the greatest range of rates within the entire New England and Mid-Atlantic coast. Rates south of the Chesapeake Bay are lower overall, as a result of both the geomorphology (mainland as opposed to barrier beach) and dampening of natural processes through nourishment projects.
In the Delmarva South/Southern Virginia region, rates of long-term shoreline change were measured on 2,165 tran-sects, covering a total of 108 km (90 north of the Chesapeake
Bay and 42 to the south). The average net long-term change rate was -2.9 m/yr, the highest rate in this study (table 9a). However, net rates in the Southern Virginia portion of the region were significantly lower, -0.7 m/yr; the extreme shoreline change is confined to the Delmarva South coastline. In the long term, 83 percent of the transects were eroding (average of erosional rates = -3.7 m/yr), with 62 percent erod-ing at rates greater than -1.0 m/yr, and 40 percent eroding at rates greater than -3.0 m/yr. The maximum long-term accre-tion rate was located at the eastern end of Fisherman’s Island.The maximum long-term erosion rate was -18.5 m/yr (table 10b) and occurred on the south end of Hog Island. This is the highest long-term rate measured along the New England and Mid-Atlantic coast (fig. 30).
In the short term, rates of net shoreline change for the Delmarva South/Southern Virginia region averaged −2.7 m/yr (table 9b), measured along 104 km of coast (2,074 transects). Like the net long-term rate, the net short-term rate is the most erosional in New England and the Mid-Atlantic. Sixty-six percent of the coast is erosional in the short term. Erosion rates exceeded -1.0 m/yr along 50 percent of the coast, and exceeded -3.0 m/yr along 35 percent. The high erosion and accretion rates are focused in the area north of the Chesapeake Bay, simi-lar to the long-term maximums. There is a range of 90.9 m/yr in the maximum short-term erosion and accretion rates, -40.3 m/yr and 50.6 m/yr, respectively. These rates were measured adjacent to Quinby Inlet where the barrier islands are undergo-ing clockwise rotation (high accretion rates on the north end and high erosion to the south). The maximum short-term ero-sion rate was measured on the south end of Parramore Island and the maximum short-term accretion rate was measured on the north end of Hog Island.
Figure 31. Oblique aerial photograph looking southwest along the southern end of Cedar Island in the Delmarva South/Southern Virginia region. This area is experiencing long-term erosion rates greater than -3.0 meters per year.

52 National Assessment of Shoreline Change: Historical Shoreline Change along the New England and Mid-Atlantic Coasts
The Delmarva South/Southern Virginia region has the most extreme coastal change in New England and the Mid-Atlantic. Rates of shoreline change became more accretional from the long to the short term, but the percentage of coastline that was eroding decreased in the more recent time period. Maximum ero-sion and accretion shoreline change rates were in the Delmarva South portion of the region, north of the Chesapeake Bay.
Discussion and Additional Considerations
Summary of Shoreline Changes
The total length of the coastline in the 10 analysis regions presented in this report for New England and the Mid-Atlantic is 1,358 km. Because of data gaps or areas with no sandy shoreline (that is, rocky coast sections), the long-term analysis represents shoreline change rates for 77 percent of the coast. There are more gaps in the data used for the short-term analy-sis and, as a result, rates are reported for 64 percent of the New England and Mid-Atlantic coast.
Where long-term rates of change were quantified, 65 percent of the New England and Mid-Atlantic shorelines are eroding; the highest regionally averaged long-term net rate of change, -2.9 m/yr, occurred in the Delmarva South/Southern Virginia region. The high rates in this region are a result of the rapid rotation of drumstick barrier islands in the southern por-tion of the Delmarva Peninsula. The regions with the highest percentage of eroding coastline in the long-term assessment were the Delmarva South/Southern Virginia region in the Mid-Atlantic (83 percent eroding) and in the Massachusetts Islands region in New England, where 90 percent of the measured coast is eroding. The highest long-term erosion rate in New England and the Mid-Atlantic (-18.5 m/yr) was on the south end of Hog Island in the Delmarva South/Southern Virginia region. In New England, the highest measured long-term erosion rate, -8.0 m/yr, was on Monomoy Island in the Cape Cod region.
Overall, the percentages of coast eroding in both the long and short term were higher in New England than in the Mid-Atlantic, but the amount of coastline eroding at high rates (greater than -1.0 and -3.0 m/yr) was greater in the Mid-Atlantic. The single highest long-term accretion rate measured in this study was 40.3 m/yr, at the southern end of Assateague Island. The high accretion rate is associated with a prograding barrier spit in a non-engineered portion of the coast.
In general, the percentage of sandy shoreline in both New England and the Mid-Atlantic that was eroding was greater in the long term (65 percent) than in the short term (60 percent); the decrease is more pronounced in the Mid-Atlantic (from 67 to 54 percent). Additionally, the average net shoreline change rate became less erosional from the
long term (-0.5 m/yr) to the short term (-0.3 m/yr). However, the percentage of coastline eroding at higher rates increased from the long term to the short term in most regions, indicat-ing an increase in erosion hazard that may be related to the impacts of sea-level rise. Less erosional trends in the net shoreline change rates are likely an artifact of an increase in nourishment projects and, in some cases, engineering structures that work temporarily to counteract the effects of increasing erosion rates.
Influence of Human Activities
As coastal communities continue to grow along the New England and Mid-Atlantic coast, potential conflicts will continue to arise between preservation of property (typically privately owned) and conservation of the beach (typically publicly owned). Past social responses indicate that these conflicts will likely be resolved through a combination of beach nourishment projects and shoreline protection struc-tures. Both of these engineering responses to erosion alter the natural beach processes and eventually lead to artificial shoreline positions.
Adding sand to eroding beaches is a common method of storm-damage mitigation and maintaining a recreational beach. Beach nourishment alters the rates of retreat by caus-ing rapid temporary accretion of the shoreline. In those areas where nourishment is frequent, the trends of shoreline change will be biased toward accretion or stability. Passive erosion of the beach by emplacement of seawalls or revetments may initially lead to an increase in the rate of erosion, but the rate will slow to zero when the beach in front of the structure erodes away. Many beaches are already altered by shoreline protection projects and more are likely to be altered in the future. Using methods of analyzing shoreline movement that take shoreline-stabilization activities into account will ensure that the documented trends and derived rates of change are expressed within the proper context.
Distinguishing between natural rates of shoreline move-ment and those influenced directly by human activities is crucial when historical rates of change are used for planning or management purposes and to forecast future shoreline positions. Improving methods of analyzing shoreline move-ment will help to accurately document the natural rates of shoreline change.
Planned Updates and Related Research
The USGS plans to revise and update rates of shoreline change every 5 to 10 years. Therefore, this report and associ-ated data are a work in progress. The revision interval will depend on the availability of new information and techno-logical advances that will allow relatively rapid shoreline position acquisition, processing, and dissemination. Future

References Cited 53
revisions will also incorporate the results of ongoing shore-line research. For example, we plan to continue to refine the methodology that we applied to quantify the effects of using different shoreline proxies on the shoreline change rates. The dynamics of sandy beaches ensure that short-term shore-line fluctuations will not be eliminated entirely from future shoreline positions, but data being collected in various coastal regions as part of the USGS regional studies will provide quantitative assessments of seasonal and interannual changes in shoreline position. These assessments will provide a means to determine whether the detected shoreline change is within the expected range of movement and provide additional con-straint on the uncertainties.
Acknowledgments
This report was made possible by the hard work and generous cooperation of many individuals. We thank Adam Bode of the National Oceanic and Atmospheric Administra-tion (NOAA) for providing digital historical shorelines and scans of selected NOAA topographic sheets (T-sheets), and David Doyle (NOAA) for providing datum corrections so that T-sheets could be rectified before they were digitized by the USGS. Amy Farris and Kathy Weber (USGS) contributed greatly by extracting shorelines from lidar data and calculating the proxy-datum bias. We thank Jessica Zichichi on the latest version of DSAS (v 4.1) and Ayhan Ergul of Innovate! Inc. for their programming skills on the latest version of DSAS (v4.1) and Rachel Hehre for georeferencing photos and digitizing shorelines for Rhode Island. Tara Miller (USGS) provided valuable help with compiling data sources. We would like to acknowledge Karen Morgan for taking most of the oblique aerial photographs used in this report.
References Cited
Anders, F.J., and Byrnes, M.R., 1991, Accuracy of shoreline change rates as determined from maps and aerial photo-graphs: Shore and Beach, v. 59, p. 17-26.
Anderson, W.A., Borns, H.W.J., Kelley, J.T., and Thomp-son, W.B., 1989, Neotectonic activity in coastal Maine, in Anderson, W.A., and Borns, H.W.J., eds., Neotectonics of Maine: Studies in seismicity: Augusta, Maine, Maine Geo-logical Survey, Department of Conservation, p. 1-10.
Belknap, D.F., and Kraft, J.C., 1985, Influence of antecedent geology on stratigraphic preservation potential and evolu-tion of Delaware’s barrier system: Marine Geology, v. 63, no. 1-4, p. 235-262.
Bird, J.M., and Dewey, J.F., 1970, Lithosphere plate-continen-tal margin tectonics and the evolution of the Appalachian orogen: Geological Society of America Bulletin, v. 81, p. 1031-1061.
Clarke, A.J., 1991, The dynamics of barotropic tides over the continental shelf and slope (a review), in Parker, B.B., ed., Tidal hydrodynamics: New York, John Wiley & Sons, Inc., p. 79-108.
Colquhoun, D.J., Johnson, G.H., Peebles, P.C., Huddleston, P.F., and Scott, T., 1991, Quaternary geology of the Atlantic coastal plain, in Morrison, R.B., ed., Quaternary nonglacial geology: Conterminus U.S.: Boulder, Colorado, Geological Society of America, p. 629-650.
Crowell, M., and Leatherman, S.P., 1999, Coastal erosion mapping and management: Journal of Coastal Research, Special Issue 28, 196 p.
Crowell, M., Leatherman, S.P., and Buckley, M.K., 1991, Historical shoreline change: Error analysis and mapping accuracy: Journal of Coastal Research, v. 7, p. 839-852.
Crowell, M., Leatherman, S.P., and Buckley, M.K., 1993, Shoreline change rate analysis: Long-term versus short-term: Shore and Beach, v. 61, no. 2, p. 13-20.
Davis, R.E., and Dolan, R., 1993, Nor’easters: American Sci-entist, v. 81, p. 428-439.
Davis, R.A., and Fitzgerald, D.M., 2004, Beaches and coasts: Malden, MA, Blackwell Publishing, 419 p.
Davis, R.A., Jr., 1994, Barrier island systems — A geologic overview, in Davis, R.A., Jr., ed., Geology of Holocene bar-rier island systems: New York, Springer-Verlag, p. 435-456.
Demarest, J.M., and Leatherman, S.P., 1985, Mainland influ-ence on coastal transgression — Delmarva Peninsula: Marine Geology, v. 63, no. 1-4, p. 19-33.
Dolan, R., Inman, D.L., and Hayden, B., 1990, The Atlantic coast storm of March 1989: Journal of Coastal Research, v. 6, no. 3, p. 721-725.
Dolan, R., Anders, F., and Kimball, S., 1985, Coastal ero-sion and accretion: National Atlas of the United States of America, U.S. Geological Survey, Reston, VA, 1 sheet, scale 1:7,500,000.
Dolan, R., Fenster, M.S., and Holme, S., 1991, Temporal analysis of shoreline recession and accretion: Journal of Coastal Research, v. 7, no. 3, p. 723-744.

54 National Assessment of Shoreline Change: Historical Shoreline Change along the New England and Mid-Atlantic Coasts
Dolan, R., Trossbach, S., and Buckley, M., 1989, Patterns of erosion along the Atlantic coast, in Barrier islands: Process and management, American Society of Civil Engineers, Coastal Zone ‘89, 6th Symposium on Coastal and Ocean Management, Charleston, SC, July 11-14, 1989, p. 17-22.
Douglas, B.C., 2001, Sea level change in the era of the record-ing tide gauges, in Douglas, B.C., ed., Sea level rise: His-tory and consequences: San Diego, Academic Press, p. 37-64.
Douglas, B.C., 2005, Gulf of Mexico and Atlantic Coast sea-level change, Circulation in the Gulf of Mexico: Observa-tions and models: Geophysical Monograph Series: Wash-ington, D.C., American Geophysical Union, p. 111-121.
Douglas, B.C., and Crowell, M., 2000, Long-term shore-line position prediction and error propagation: Journal of Coastal Research, v. 16, p. 145-152.
Dyke, A.S., Andrews, J.T., Clark, P.U., England, J.H., Miller, G.H., Shaw, J., and Veillette, J.J., 2002, The Laurentide and Innuitian ice sheets during the Last Glacial Maximum: Quaternary Science Reviews, v. 21, p. 9-31.
Englehart, S.E., Horton, B.P., Douglas, B.C., Peltier, W.R., and Tornqvist, T.E., 2009, Spatial variability of late Holocene and 20th century sea-level rise along the Atlantic coast of the United States: Geology, v. 37, p. 1115-1118.
Farrell, S., Lepp, T., Speer, B., and Mauriello, M., 1999, Map-ping erosion hazard areas in Ocean County, New Jersey: Journal of Coastal Research, Special Issue 28, p. 50-57.
Fenneman, N.M., 1946, Physical divisions of the United States, U.S. Geological Survey map: Washington, D.C., U.S. Geological Survey, scale 1:7,000,000.
Fenster, M.S., Dolan, R., and Elder, J., 1993, A new method for predicting shoreline positions from historical data: Jour-nal of Coastal Research, v. 9, no. 1, p. 147-171.
Fenster, M.S., and Dolan, R., 1994, Large-scale reversals in shoreline trends along the U.S. Mid-Atlantic coast: Geol-ogy, v. 22, no. 6, p. 543-546.
Fenster, M.S., and Dolan, R., 1999, Mapping erosion haz-ard areas in the city of Virginia Beach: Journal of Coastal Research, Special Issue 28, p. 58-68.
Fenster, M.S., and FitzGerald, D., 1996, Morphodynamics, stratigraphy, and sediment transport patterns in the Kenne-bec River Estuary, Maine, U.S.A.: Sedimentary Geology, v. 107, no. 1-2, p. 99-120.
Fisher, J.J., 1968, Barrier island formation: Discussion: Geo-logical Society of America Bulletin, v. 79, p. 1421-1426.
FitzGerald, D.M., Rosen, P.S., and van Heteren, S., 1994, New England barriers, in Davis, R.A., Jr., ed., Geology of Holo-cene barrier island systems: Berlin, Springer-Verlag, p. 305-394.
Fletcher, C.H., Knebel, H.J., and Kraft, J.C., 1990, Holocene evolution of an estuarine coast and tidal wetlands: Geologi-cal Society of America Bulletin, v. 102, no. 3, p. 283-297.
Forbes, D.L., and Syvitski, J.P.M., 1994, Paraglacial coasts, in Carter, R.W.G., and Woodroffe, C.D., eds., Coastal evolution — Late Quaternary shoreline morphodynamics: Cambridge, University Press, p. 373-424.
Garrett, C.J.R., and Toulany, B., 1981, Variability of the flow through the Strait of Bele Isle: Journal of Marine Research, v. 39, p. 163-189.
Glass, R.I., O’Hare, P., and Conrad, J.L., 1979, Health conse-quences of the snow disaster in Massachusetts, February 6, 1978: American Journal of Public Health, v. 69, no. 10, p. 1047-1049.
Haddad, T.C., and Pilkey, O.H., 1998, Summary of the New England beach nourishment experience (1935-1996): Jour-nal of Coastal Research, v. 14, no. 4, p. 1395-1404.
Hapke, C.J., and Reid, D., 2007, National assessment of shore-line change: Part 4: Historical coastal cliff retreat along the California coast: U.S. Geological Survey Open-File Report 2007-1133, 51 p.
Hapke, C.J., Reid, D., Richmond, B.M., Ruggiero, P., and List, J., 2006, National assessment of shoreline change: Part 3: Historical shoreline changes and associated coastal land loss along the sandy shorelines of the California coast: U.S. Geological Survey Open-File Report 2006-1219, 72 p.
Hayes, M.O., 1979, Barrier island morphology as a function of tidal and wave regime, in Leatherman, S.P., ed., Bar-rier islands from the Gulf of St. Lawrence to the Gulf of Mexico: New York, Academic Press, p. 211-236.
Healy, T.R., and Kirk, R.M., 1982, Coasts, in Soons, J., and Selby, M., eds., Landforms of New Zealand: Auckland, Longman-Paul, p. 80-104.
Heinz Center, 2000, Evaluation of erosion hazards: Wash-ington, D.C., The H. John Heinz III Center for Science, Economics and the Environment, 203 p.
Himmelstoss, E.A., 2009, DSAS 4.0 Installation Instructions and User Guide, in Thieler, E.R., Himmelstoss, E.A., Zichi-chi, J.L., Ergul, A., 2009, Digital Shoreline Analysis System (DSAS) version 4.0 - An ArcGIS extension for calculating shoreline change: U.S. Geological Survey Open-File Report 2008-1278, available at http://woodshole.er.usgs.gov/proj-ect-pages/dsas/version4/.

References Cited 55
Himmelstoss, E.A., Kratzmann, M., Hapke, C.J., Thieler, E.R., and List, J., 2010, The national assessment of shoreline change — A GIS compilation of vector shorelines and asso-ciated shoreline change data for the New England and Mid-Atlantic coasts: U.S. Geological Survey Open-File Report 2010-1119, available at http://pubs.usgs.gov/of/2010/1119/.
Houston, J.R., 2003, The coastal structure debate — Pub-lic and policy aspects, in Mohan, R.K., Magoon, O., and Pirrello, M., eds., American Society of Civil Engineers, Advances in Coastal Structure Design: Reston, VA, p. 1-17.
Hughes, T., Borns, H.W., Fastook, J.L., Hyland, M.R., Kite, J.S., and Lowell, T.V., 1985, Models of glacial reconstruc-tion and deglaciation applied to Maritime Canada and New England, in Borns, H.W., Jr., LaSalle, P., and Thompson, W.B., eds., Late Pleistocene history of northeastern New England and adjacent Quebec: Geological Society of America Special Paper 197, p. 139-150.
Inman, D.L., and Nordstrom, C.E., 1971, On the tectonic and morphologic classification of coasts: Journal of Geology, v. 79, no. 1, p. 1-21.
Jensen, R.E., 1983, Atlantic coast hindcasting shallow water significant wave information: Wave Information Study Report, Vicksburg, MS, v. 8, p. 75.
Kaye, C.A., 1964, Outline of Pleistocene geology of Martha’s Vineyard, Massachusetts: U.S. Geological Survey Profes-sional Paper 501-C, p. C134-C139.
Kelley, J.T., 1987, An inventory of coastal environments and classification of Maine’s glaciated shoreline, in Fitzgerald, D.M., and Rosen, P.S., eds., Glaciated coasts: London, Aca-demic Press, Inc., p. 151-176.
Kelley, J.T., 2004, Coastal bluffs of New England, in Hamp-ton, M.A., and Griggs, G.B., eds., Formation, evolution, and stability of coastal cliffs – Status and trends: U.S. Geologi-cal Survey Professional Paper 1693, p. 95-105.
Kelley, J.T., Dickson, S.M., Belknap, D.F., and Stuckenrath, R.J., 1992, Sea-level change and Quaternary sediment accumulation on the southern Maine inner continental shelf, in Fletcher, C., and Wehmiller, J., eds., Quaternary coasts of the United States: Marine and lacustrine systems: Society of Economic and Paleontologic Mineralogy Spec. Pub., p. 23-34.
Krabill, W., Wright, C., Swift, R., Frederick, E., Man-izade, S., Yungel, J., Martin, C., Sonntag, J., Duffy, M., Hulslander, W., and Brock, J., 2000, Airborne laser map-ping of Assateague National Seashore Beach: Photogram-metric Engineering & Remote Sensing, v. 66, p. 65-71.
Kraft, J.C., 1971, Sedimentary facies patterns and geologic history of a Holocene marine transgression: Geological Society of America Bulletin, v. 82, no. 8, p. 2131-2158.
Larson, G.J., 1982, Nonsynchronous retreat of ice lobes from southeastern MA, in Larson, G.J., and Stone, B.D., eds., Late Wisconsinian of New England: Dubuque, Kendell/Hunt, p. 101-114.
Leatherman, S.P., 1979, Migration of Assateague Island, Maryland, by inlet and overwash processes: Geology, v. 7, no. 2, p. 104-107.
Leatherman, S.P., 1985, Geomorphic and sedimentary analysis of Fire Island, New York: Marine Geology, v. 63, no. 1-4, p. 173-195.
Leatherman, S.P., and Anders, F.J., 1999, Mapping and manag-ing coastal erosion hazards in New York: Journal of Coastal Research, Special Issue 28, p. 34-42.
Leatherman, S.P., and Eskandary, L.S., 1999, Evaluation of coastal erosion hazards along Delaware’s Atlantic Coast: Journal of Coastal Research, Special Issue 28, p. 43-49.
Leitch, E.C., 1975, Plate tectonic interpretation of the Paleo-zoic history of the New England Fold Belt: Geological Society of America Bulletin, v. 86, no. 1, p. 141-144.
Marrone, J.F., 2008, Evaluation of impacts of the Patriots’ Day storm (April 15-18, 2007) on the New England coastline, in American Society of Civil Engineers, Proceedings of the Solutions to Coastal Disasters Congress, Oahu, HI, April 13-16, v. 312, p. 46.
Meade, R.H., and Emery, K.O., 1971, Sea level as affected by river runoff, eastern United States: Science, v. 173, no. 3995, p. 425-428.
Moore, L., Ruggiero, P., and List, J., 2006, Comparing mean high water and high water line shorelines: Should proxy-datum offsets be incorporated in shoreline change analysis?: Journal of Coastal Research, v. 22, no. 4, p. 894-905.
Moore, L.J., 2000, Shoreline mapping techniques: Journal of Coastal Research, v. 16, p. 111-124.
Morang, A., Rahoy, D.S., and Grosskopf, W.G., 1999, Regional geologic characteristics along the south shore of Long Island, New York, in American Society of Civil Engineers, Coastal Sediments ’99, Proceedings of the 4th International Symposium on Coastal Engineering and Science of Coastal Sediment Processes, Long Island, New York, p. 1568-1583.
Morton, R.A., 1991, Accurate shoreline mapping: Past, pres-ent, and future, in American Society of Civil Engineers, Coastal Sediments ‘91, Proceedings of a Specialty Con-ference on Quantitative Approaches to Coastal Sediment Processes, Seattle, WA, June 25-27, v. 1, p. 997-1010.

56 National Assessment of Shoreline Change: Historical Shoreline Change along the New England and Mid-Atlantic Coasts
Morton, R.A., 1996, Geoindicators of coastal wetlands and shorelines, in Berger, A.R., and Iams, W.J., eds., Geoin-dicators: Assessing rapid environmental changes in earth systems: Rotterdam, A.A. Balkema, p. 207-230.
Morton, R.A., and Miller, T.L., 2005, National assessment of shoreline change: Part 2: Historical shoreline changes and associated coastal land loss along the U.S. Southeast Atlantic Coast: U.S. Geological Survey Open-File Report 2005-1401, 35 p.
Morton, R.A., Miller, T.L., and Moore, L.J., 2004, National assessment of shoreline change: Part 1: Historical shoreline changes and associated coastal land loss along the U.S. Gulf of Mexico: U.S. Geological Survey Open-File Report 2004-1043, 45 p.
Morton, R.A., and Sallenger, A.H., 2003, Morphological impacts of extreme storms on sandy beaches and barriers: Journal of Coastal Research, v. 19, no. 3, p. 560-573.
Morton, R.A., and Speed, F.M., 1998, Evaluation of shorelines and legal boundaries controlled by water levels on sandy beaches: Journal of Coastal Research, v. 14, no. 4, p. 1373-1384.
Niederoda, A.W., Swift, D.J.P., Figgueiredo, A.G., and Free-land, G.L., 1985, Barrier island evolution, middle Atlantic shelf, USA, Part II: Evidence from the shelf floor: Marine Geology, v. 63, no. 1-4, p. 363-396.
Nummendal, D., Oertel, G.F., Hubbard, D.K., and Hine, A.C., 1977, Tidal inlet variability: Cape Hatteras to Cape Canav-eral, in American Society of Civil Engineers, Coastal Sedi-ments ‘77, Charleston, SC, Nov. 2-4, 1977, p. 543-562.
O’Connell, J.F., and Leatherman, S.P., 1999, Coastal erosion hazards and mapping along the Massachusetts shore: Jour-nal of Coastal Research, Special Issue 28, p. 27-33.
Oertel, G.F., 1985, The barrier island system: Marine Geology, v. 63, no. 1-4, p. 1-18.
Oldale, R.N., 1982, Pleistocene stratigraphy of Nantucket, Martha’s Vineyard, the Elizabeth Islands, and Cape Cod, Massachusetts, in Larson, G.J., and Stone, B.D., ed., Late Wisconsinan glaciation of New England: Proceedings of the Symposium: Dubuque, Iowa, Kendall/Hunt, p. 1-34.
Oldale, R.N., and O’Hara, C.J., 1980, New radiocarbon dates from the inner continental shelf off southeastern Massa-chusetts and a local sea-level rise curve for the past 12,000 years: Geology, v. 8, p. 102-106.
Pajak, M.J., and Leatherman, S.P., 2002, The high water line as a shoreline indicator: Journal of Coastal Research, v. 18, p. 329-337.
Peltier, W.R., 1997, Postglacial variations in the level of the sea: Implications for climate dynamics and solid-earth geo-physics: Reviews of Geophysics, v. 36, p. 603-689.
Pilkey, O.H., and Clayton, T.D., 1989, Summary of beach replenishment experience on U.S. East Coast barrier islands: Journal of Coastal Research, v. 5, no. 1, p. 147-159.
Pilkey, O.H., and Dixon, K.L., 1996, The Corps and the shore: Washington, D.C., Island Press, 272 p.
Psuty, N.P., 1986, Holocene sea level in New Jersey: Physical Geography, v. 7, p. 156-167.
Rast, N., 1984, The Alleghanian orogeny in eastern North America, in Hutton, D.H.W., and Sanderson, D.J., eds., Variscan tectonics of the North Atlantic region: Geological Society of London, p. 197-218.
Rast, N., 1989, The evolution of the Appalachian Orogen, in Bally, A.W., and Palmer, A.R., eds., The geology of North America: An overview: Boulder, Colorado, Geological Society of America, p. 323-348.
Redfield, A.C., 1958, The influence of the continental shelf on tides of the Atlantic coast of the United States: Journal of Marine Research, v. 17, p. 432-448.
Ruggiero, P., Kaminsky, G.M., and Gelfenbaum, G., 2003, Linking proxy-based and datum-based shorelines on a high-energy coastline: Implications for shoreline change analy-ses: Journal of Coastal Research, Special Issue 38, p. 57-82.
Ruggiero, P., Komar, P.D., McDougal, W.G., and Beach, R.A., 1996, Extreme water levels, wave runup, and coastal ero-sion, in American Society of Civil Engineers, Proceedings of the 25th International Conference on Coastal Engineer-ing, Orlando, FL, September 2-6, p. 2793-2805.
Ruggiero, P., Komar, P.D., McDougal, W.G., Marra, J.J., and Beach, R.A., 2001, Wave runup, extreme water levels and the erosion of properties backing beaches: Journal of Coastal Research, v. 17, no. 2, p. 407-419.
Ruggiero, P., and List, J., 2009, Improving accuracy and statistical reliability of shoreline position and change rate estimates: Journal of Coastal Research, v. 25, no. 5, p. 1069-1081.
Sallenger, A.H., Krabill, W., Swift, R., Brock, J., List, J., Hansen, M., Holman, R. A., Manizade, S., Sonntag, J., Meredith, A., Morgan, K., Yunkel, J.K., Frederick, E., and Stockdon, H., 2003, Evaluation of airborne scanning lidar for coastal change applications: Journal of Coastal Research, v. 19, p. 125-133.
Schafer, J.P., and Hartshorn, J.H., 1965, The quaternary of New England, in Wright, H.E., and Frey, D.G., eds., The quaternary of the United States: Princeton, N.J., Princeton University Press, p. 113-128.
Shalowitz, A.L., 1964, Shore and sea boundaries: U.S. Department of Commerce Publication 10-1, Washington, D.C., 749 p.

References Cited 57
Stauble, D.K., and Brumbaugh, R.W., 2003, An assessment of the nation’s shorelines, USA: Shore and Beach, v. 71, p. 11-18.
Stockdon, H.F., Holman, R.A., Howd, P.A., and Sallenger, A.H., 2006, Empirical parameterization of setup, swash, and runup: Coastal Engineering, v. 53, no. 7, p. 573-588.
Stockdon, H.F., Sallenger, A.H., List, J.H., and Holman, R.A., 2002, Estimation of shoreline position and change from air-borne topographic lidar data: Journal of Coastal Research, v. 18, p. 502-513.
Swift, D.J.P., 1975, Barrier island genesis: Evidence from the central Atlantic shelf, eastern USA: Sedimentary Geology, v. 14, no. 1, p. 1-43.
Swift, D.J.P., Kofoed, J.W., Saulsbury, P.J., and Sears, P., 1972, Holocene evolution of the shelf surface, central and southern Atlantic shelf of North America, in Swift, D.J.P., Duane, D.B., and Pilkey, O.H.J., eds., Shelf sediment transport: Process and pattern: Stroudsburg, PA, Dowden, Hutchinson and Ross, p. 499-574.
Swift, D.J.P., Niederoda, A.W., Vincent, C.E., and Hopkins, T.S., 1985, Barrier island evolution, middle Atlantic shelf, USA, Part I: Shoreface dynamics: Marine Geology, v. 63, no. 1-4, p. 331-361.
Taylor, J.R., 1997, An introduction to error analysis: The study of uncertainties in physical measurement: Sausalito, CA, University Science Books, 327 p.
Thieler, E.R., and Danforth, W.W., 1994, Historical shoreline mapping (1). Improving techniques and reducing position-ing errors: Journal of Coastal Research, v. 10, p. 549-563.
Thieler, E.R., Himmelstoss, E.A., Zichichi, J.L., and Ergul, A., 2009, Digital Shoreline Analysis System (DSAS) ver-sion 4.0 — An ArcGIS extension for calculating shoreline change: U.S. Geological Survey Open-File Report 2008-1278, available at http://woodshole.er.usgs.gov/project-pages/dsas/version4/.
Uchupi, E., Giese, G.S., Aubrey, D.G., and Kim, D.J., 1996, The Late Quaternary construction of Cape Cod, Massachu-setts: A reconsideration of the W.M. Davis model: Geologi-cal Society of America Special Paper, v. 309, p. 1-69.
U.S. Army Corps of Engineers, 1971, National shoreline study, California Regional Inventory: U.S. Army Engineer Division, South Pacific, San Francisco, CA, 106 p.
U.S. Army Corps of Engineers, 2006, Meterology and wave climate, in Coastal Engineering Manual, Part II, Chapter 2, 72 p., accessed January 21, 2010, at http://140.194.76.129/publications/eng-manuals/em1110-2-1100/PartII/Part_II-Chap_2.pdf.
Valverde, H.R., Trembanis, A.C., and Pilkey, O.H., 1999, Summary of beach nourishment experience on East Coast barrier islands: Journal of Coastal Research, v. 15, no. 4, p. 1100-1118.
van Heteren, S., Fitzgerald, D.M., McKinlay, P.A., and Buynevich, I.V., 1998, Radar facies of paraglacial barrier systems: Coastal New England, U.S.A.: Sedimentology, v. 45, p. 181-200.
Walker, H.J., and Coleman, J.M., 1987, Atlantic and Gulf Coast Province, in Graf, W.L., ed., Geomorphic Systems of North America: Boulder, CO, Geological Society of America, p. 51-110.
Weber, K.M., List, J.H., and Morgan, K.M., 2005, An opera-tional mean high water datum for determination of shore-line position from topographic lidar data: U.S. Geological Survey Open-File Report 2005-1027, available at http://pubs.usgs.gov/of/2005/1027/index.html.
Western Carolina University, 2010, Beach nourishment: The U.S. beach nourishment experience including New England, east coast barrier islands, Pacific coast, and Gulf of Mexico shorelines: Western Carolina University, accessed January 21, 2010, at http://www.wcu.edu/1038.asp.
Wright, L.D., 1995, Morphodynamics of Inner Continental Shelves: Boca Raton, FL, CRC Press, 241 p.

Hapke and others—N
ational Assessm
ent of Shoreline Change: Historical Shoreline Change along the New
England and Mid-A
tlantic Coasts—Open-Fille Report 2010—
1118