Embed Size (px)
Citation preview

National and Regional Innovation Systems and Policies for Development: From Learning Regions to Research-
Intensive Clusters
Dr. Marina RangaNewcastle University Business School
International Conference on Knowledge-based DevelopmentMinsk, Republic of Belarus, 10-12 June 2009

2
OutlineInnovation modelsNational and Regional Innovation SystemsMeasuring innovation in national and regional systemsRegional development perspectivesLearning regionsClustersResearch-intensive clustersPolicy issues for cluster support

3
Innovation – why is it important?Innovation is a core characteristic of the knowledge-economy
Major source of competitiveness nationally, regionally, internationallyFirm innovation particularly SMEs & start-ups, directly (own activities) and indirectly (interaction with mature firms). Social innovation: public sector organisations, private firms and third sector organisations innovate in response to social needs
Wide range of skills: S&T/R&D, managerial, marketing, organisational, social, economic, administrative knowledge
Not standardised/uniform in the world opportunities to learn from monitoring and benchmarking of successful policies elsewhere
Cuts across many other policy areas (e.g. education, environment, IP, competition, taxation, etc.)
Key priority for revival in current economic crisis

4
Evolving innovation models
Five generations of innovation models (Rothwell)
Generation Key features
First, second (1950s -1970s)
Simple linear models – technology push, market pull
Third(1980s)
Simultaneous coupling model – interaction, feedback loops between different elements
Fourth(1990s-200s)
Parallel model, process integration within the firm, upstream with key suppliers and downstream with customers, emphasis on linkages and alliances
Fifth(1990s-200s)
Multi-actor process, systems integration, extensive networking, flexible and customised response, continuous innovation (role of Internet)

5
National Innovation SystemsAdam Smith (1776) – Wealth of Nations
relates knowledge creation and specialised services of scientists to production
Friedrich List (1841) – national systems of production and learningwide set of national institutions (incl. education and training) and infrastructures, e.g. networks for the transport of people and goodsdevelopment of productive forces rather than allocation of scarce resources need to build national infrastructure and institutions, lacks the analytical tools for developing ideas beyond loose suggestions.
• B.-A. Lundvall (1985) introduces the concept of ‘innovation system’
• Freeman (1988), Lundvall (1988, 1992), Nelson (1993), Edquist (1997) -‘national systems of innovation’
– Includes industries and firms + universities, research institutes, government– R&D activities, government policies viewed as components of a single national
system; linkages at the aggregate level.
6
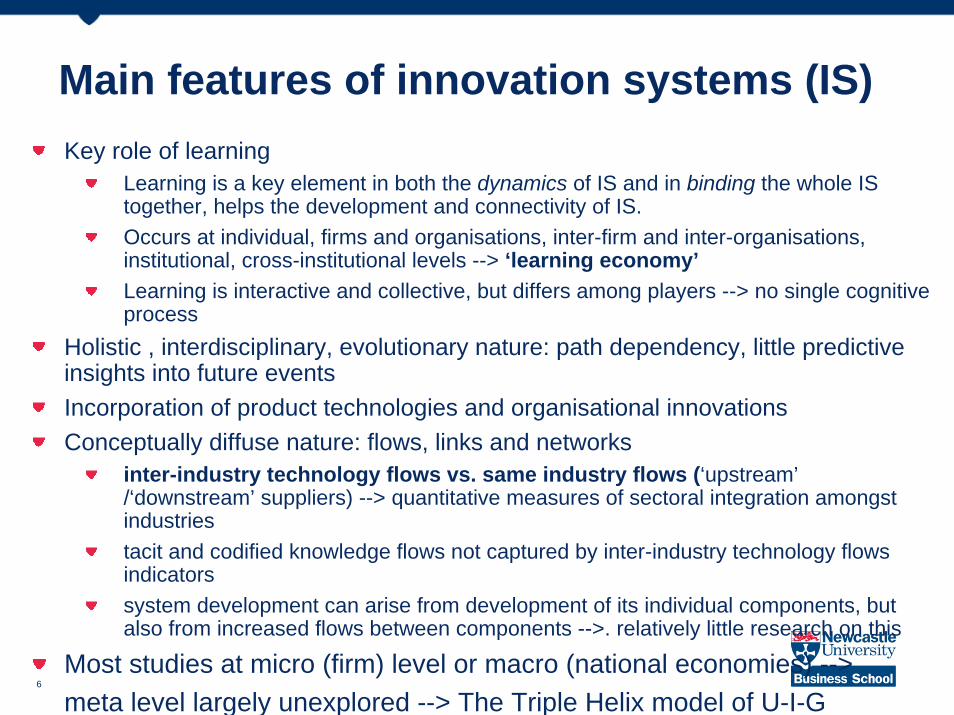
Main features of innovation systems (IS) Key role of learning
Learning is a key element in both the dynamics of IS and in binding the whole IS together, helps the development and connectivity of IS.Occurs at individual, firms and organisations, inter-firm and inter-organisations, institutional, cross-institutional levels --> ‘learning economy’Learning is interactive and collective, but differs among players --> no single cognitive process
Holistic , interdisciplinary, evolutionary nature: path dependency, little predictive insights into future events Incorporation of product technologies and organisational innovationsConceptually diffuse nature: flows, links and networks
inter-industry technology flows vs. same industry flows (‘upstream’/‘downstream’ suppliers) --> quantitative measures of sectoral integration amongst industries tacit and codified knowledge flows not captured by inter-industry technology flows indicatorssystem development can arise from development of its individual components, but also from increased flows between components -->. relatively little research on this
Most studies at micro (firm) level or macro (national economies) -->meta level largely unexplored --> The Triple Helix model of U-I-G

7
A generic NSI structure
DemandConsumers (final demand)Producers (intermediate demand)
Framework conditionsFinancial environmentTaxation and incentivesPropensity to innovations and entrepreneurshipMobility, etc.
Company systemLarge companiesMature SMEsNTBFs
IntermediariesResearch institutesBrokers
Education & research syst.
Professional education and trainingHigher education and researchPublic sector research
Political SystemGovernmentGovernanceSTI policies
InfrastructureBanking
Venture capitalIPR
Information systems
Source: Arnold and Kuhlman (2001)

8
Interactions in NSI
Provision of R&D and consultancy servicesCompetence building Formation of new product markets, development of existing ones Creating and changing organisationsNetworking Incubation activities Financing Collaboration Intermediation
Absorptive capacity (Cohen and Levinthal, 1990).

9
Regional Systems of Innovation (RSI)Emerging in early 1990s as a framework for understanding innovation in regional economies (clusters)
Interacting private and public interests, formal institutions and other organisations that generate, use and disseminate knowledge
Origin: (i) systems of innovation theory - innovation as an evolutionary and social process, stimulated by many actors internal and external to the firm; (ii) regional science: innovation is a spatially localised process
Rationale: improve capabilities and business performance in local firms--> interactive learning between different actors (firms, universities, research institutes, start-ups, large firms etc.) easier to manage economic policy at regional level rather than national level

10
Units of analysis in RSI studiesCity - cities generate innovation because they act as arenas for the confluence of innovative factors
Metropolitan regions - offer firms spatial, technological and institutional proximity and specific resources
Local districts within cities or metropolitan areas - e.g. the Garment district in New York, the software industry in Oslo, the electronic cluster in Toronto, media industry in Montreal, etc.
Nomenclature of territorial units developed by Eurostat (NUTS II, III) -used in the Community Innovation Surveys
Supra-regional/sub-national scale - e.g. the Canadian provinces of Ontario and Quebec , Belgium provinces of Flanders and Wallonia

11
Comparison of NSI and RSI NSI:
Explain differences in technological development, economic growth and competitiveness between countries in terms of differences between NSI componentsEmphasise the policy aspects of innovation: nation as the primary level of political activity -> knowledge input to policy-makers to increase a nation’s comparative advantage
RSI:Explain differences in sectoral patterns of innovation mainly in terms of ability to exploit technological trajectories, by technology transfer, intramural R&D, spillovers, networking, articulation of demand factors Technological trajectory: “the dominant direction along which the opportunities offered by any technological paradigm are exploited”(Nelson and Winter, 1977)Emphasise the firm and technology aspects of innovation
12 12
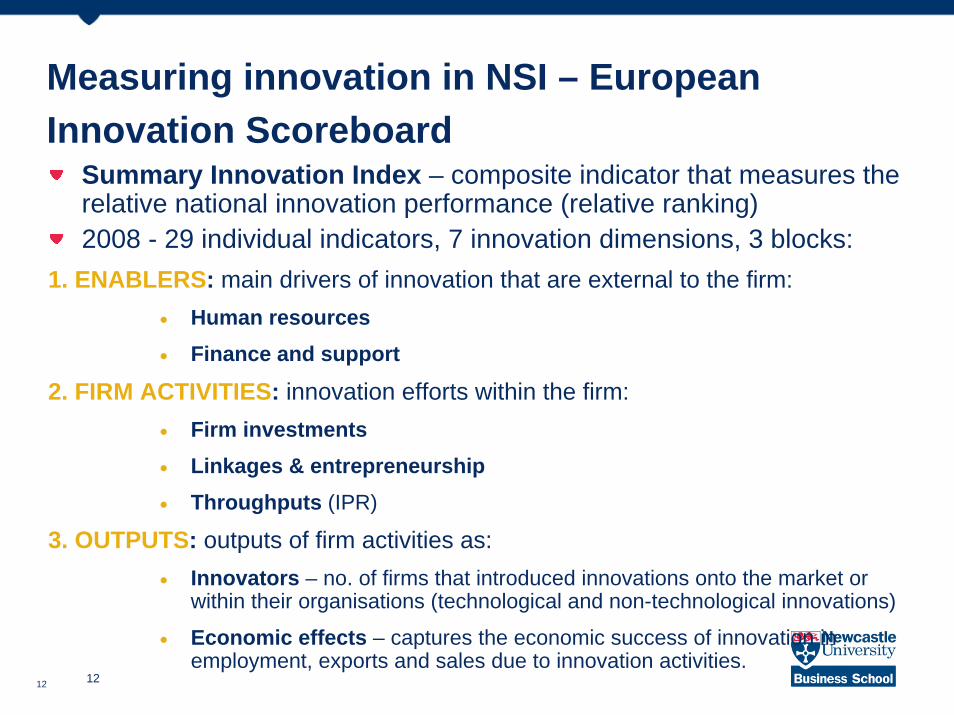
Measuring innovation in NSI – European Innovation Scoreboard
Summary Innovation Index – composite indicator that measures the relative national innovation performance (relative ranking)2008 - 29 individual indicators, 7 innovation dimensions, 3 blocks:
1. ENABLERS: main drivers of innovation that are external to the firm: • Human resources• Finance and support
2. FIRM ACTIVITIES: innovation efforts within the firm: • Firm investments• Linkages & entrepreneurship• Throughputs (IPR)
3. OUTPUTS: outputs of firm activities as: • Innovators – no. of firms that introduced innovations onto the market or
within their organisations (technological and non-technological innovations)
• Economic effects – captures the economic success of innovation in employment, exports and sales due to innovation activities.

13 13
2008 Summary Innovation Index (SII)
• Innovation leaders: SII well above that of the EU27 and all other countries
• Innovation followers: SII below that of innovation leaders but above that of the EU27.
• Moderate innovators: SII below the EU27
• Catching-up countries: SII well below the EU average, but increasing towards the EU average over time, with the exception of HR and LT

14 14
Mobility between country groupsCountry group membership in 2008 remained the same for most countries group membership as in EIS 2007.
Exceptions: GR and PT moved from ‘Catching-up countries’ in EIS 2007 to ‘Moderate innovators’ in EIS 2008 --> strong growth in innovation performance and revised set of indicators used in calculating SIIIS dropped from the ‘Innovation followers’ in EIS 2007 to ‘Moderate innovators’ in EIS 2008 --> revised method of calculating countries’ SII

15 15
Innovation dimensions by country groups
• In all groups, the strongest drivers of growth are the Throughputs, Finance and support and Human resources dimensions.
• ‘Moderate innovators’ and ‘Catching-up countries’ show improvements in Economic effects, Linkages & entrepreneurship and Firm investments,
• ‘Innovation leaders’ and ‘Innovation followers’ are on average stagnating or declining across these dimensions.
• All groups show some decline in the Innovators dimension.

16 16
EU 27 innovation performance
EU27 average annual growth rate of 2.3% over a 5-year period due to:Human resources (4.0%), Finance and support (7.1%) Throughputs (4.0%) Linkages & entrepreneurship (0.0%) Economic effects (1.1%)Firm investments (-0.9%) Innovators (-1.3%).
EU27 relative strengths in: Youth education, Public R&D expenditures, Broadband access, IT expenditures, Knowledge-intensive services employment, Medium-high and high-tech manufacturing exports, Knowledge-intensive services exports and Sales of new-to-market products
EU27 relative weaknesses in: S&E and SSH doctorate degrees, Life-long learning, Innovative SMEs collaborating with others, Technology Balance of Payments flows and Resource efficiency innovators.
Highest growth since 2004
Small improvement
Slight worsening

17 17
18 18
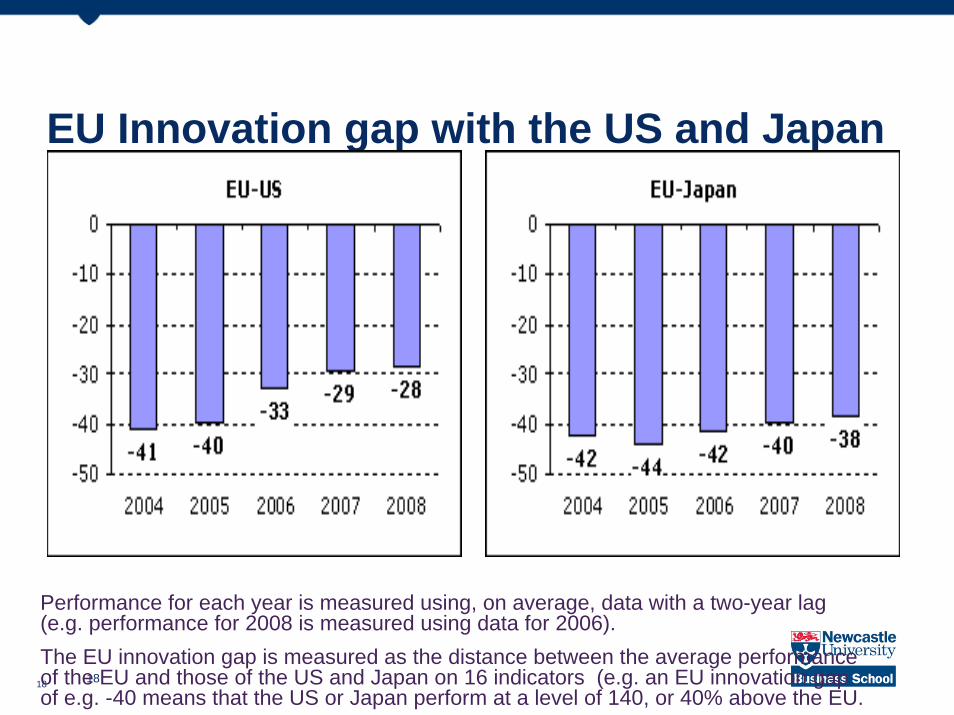
EU Innovation gap with the US and Japan
Performance for each year is measured using, on average, data with a two-year lag (e.g. performance for 2008 is measured using data for 2006). The EU innovation gap is measured as the distance between the average performance of the EU and those of the US and Japan on 16 indicators (e.g. an EU innovation gap of e.g. -40 means that the US or Japan perform at a level of 140, or 40% above the EU.

19 19
EU-US Comparison
US performing better than EU27 in 12 indicators (relative values)
EU performs better only in S&E graduates, Trademarks, TechnologyBalance of Payments flows and Medium-high and high-tech manufacturing employment.
Overall clear performance gap in favour of the US --> better performance in Enablers, Firm activities and Outputs.
BUT the US innovation lead is declining --> US innovation annual growth rate of 0.95%, EU27 annual growth rate of 2.65%.
EU27 outperforms the US in growth performance in all of the indicators except Business R&D, EPO patents and PCT patents.

20 20
EU - Japan Comparison
Japan performs better than EU27 in 12 indicators.
EU27 performs better only in Trademarks, Technology Balance of Payments flows, Knowledge-intensive services employment and Knowledge-intensive services exports.
Overall clear performance gap in favour of Japan --> better performance in Enablers, Firm activities and Outputs.
BUT the Japanese innovation lead is decreasing --> JP annual innovation growth rate of 1.65%, while EU27 growth rate of 2.65%.
The EU27 is increasing its lead in Trademarks, Technology Balance of Payments flows and Knowledge-intensive services employment.
Japan improves its lead in Business R&D, EPO patents, PCT patents and Medium-high and high-tech manufacturing employment

21 21
Global Innovation Scoreboard (GIS) 2008
Compares innovation performance of EU27 to other major R&D spenders in the world: Argentina, AUS, BR, CAN, CN, HK, IN, IL, JP, NZ, RoK, MX, RUS, SG, SA, US.
GIS (Dimension Composite Innovation Index): 9 indicators, 3 dimensions
1. Firm Activities and Outputs: • Triadic patents per population (3 years average)• Business R&D (BERD) as a % of GDP
2. Human Resources and Infrastructures• S&T tertiary enrolment ratio • Labour force with tertiary education (% total labour force) • R&D personnel per population • Scientific articles per population
3. Absorptive Capacity• ICT expenditures per capita • Broadband penetration per population • Public R&D (HERD + GERD) as a % of GDP

22 22
Relative contributions
of the three
dimensions to GIS
2005

23 23
Country performance in GIS 2008http://www.proinno-europe.eu/index.cfm?fuseaction=page.display&topicID=437&parentID=51#
Countries rank fairly stable over ten years Fastest improving countries: China (+8), Portugal (+7), Singapore (+7), Spain (+6), Cyprus (+5), Turkey (+5) and Brazil (+5). Singapore: increase based on Firm Activities and Human ResourcesSpain and Portugal: Human Resources. China: best performance in Firm Activities and Infrastructures and Absorptive Capacity, while it looses 3 positions on Human Resources. Brazil: strong increases in Firm activities and Infrastructures and Absorptive Capacity, moderate increase in Human Resources. Other BRIC countries: India (+1), Russian Federation (-2).EU27 ranks 20th -> good performance particularly on Firm Activities, relatively “balanced” innovation performance in the three dimensions US: similar composition to that of EU27,
Japan: innovation performance more based on business activities.

24 24
RIS 2002 RIS 2003 RIS 2006
European Regional Innovation Scoreboard (2006)
Countries: EU15 EU15 EU25Regions: 148 173 208Indicators: 7 13 7
RIS 2006Human Resources in Science and Technology – Core (% of population)Participation in life-long learning per 100 population aged 25-64Public R&D expenditures (% of GDP)Business R&D expenditures (% of GDP) Employment in medium-high and high-tech manufacturing (% of total workforce):Employment in high-tech services (% of total workforce):EPO patents per million population
Revealed Regional Summary Innovation Index (RRSII)

25
Regional developmentSpatially uneven regional development in recent decades as a result of technological change and capital accumulation
Important roles of R&D and innovation in these processes knowledge spillover effects on the regional economy
Techno-economic development dependent on education, R&D, innovativeness, capacity for regeneration
Interplay between different factors involved is highly complex and difficult to demonstrate various theoretical approaches and models adopted in economics and geography:
1.General macro-level perspective (techno-organizational paradigm, new growth theory, evolutionary and industrial economics, institutional economics, NSI, technological trajectories 2. Regional perspective: New industrial spaces, Learning regions, Industrial clusters

26
Learning regionsHigh learning capacity and absorptive capacity
Emphasis on codified and tacit knowledge, accumulation of knowledge, lifelong education and training
Collective interactive learning is a socially embedded process that is the fundamental element of innovation
Innovation as concurrent technical and social processes non-linear process
Territorial and institutional embeddedness of learning organisations, key role of PPPs as ‘regional development coalitions’

27
Learning regions (cont.)‘Learning organisations’: implement organisational innovations (e.g. transition to non-hierarchic, flat and flexible organisational structures) at intra- and inter-organisation level and regional level.
Dependent on:human capital (individual know-how), structural capital (organisational know-how)social capital (know-how embedded in the region/community) density and quality of networking within the regional productive system inter-firm and PPPs providing complementary investment in R&D as well as the institutional framework for innovation absorptive capacity assimilate and utilise knowledge, depends on the internal capabilities of a firm and region and existing stocks of knowledge cumulative causation in learning and innovation.

28
Learning regions - typologya. Industrial districts (Becattini, 1979 based on Alfred Marshall’s concepts)
• Small-firms, shift in R&D and innovation from the single firm to the local or regional system
b. Innovative milieus:• Universities, financial institutions and geographic proximity to markets.
Creativity and continuous innovation as a result of a collective learning process, intergenerational transfer of know-how, imitation of successful managerial practices and technological innovations, face-to-face contacts, formal or informal cooperation between firms, circulation of commercial, financial or technological informationTechnological innovation as a product of social innovation at intra- and inter-regional level
c. Industrial clusters: “geographic concentrations of interconnected companies and institutions in a particular field…an array of linked industries and other entities important to competition…universities, standards-setting agencies, think tanks, vocational training providers, and trade associations - that provide specialized training, education, information, research, and technical support.” (Porter, 1999:78).

29
Research-intensive clusters (RICs)1. Strong science base
quality research infrastructure and labs, high level talents and skillspublic & private funding for infrastructure, to motivate or attract talents, skills. balance basic and applied research activities to be attractive for enterprises
2. Strong entrepreneurial culture growth and jobs, public sector support
3. Fast firm formation: high growth start-ups (gazelles), spin offs (from universities or firms) , increase RDTI absorption capacity of SMEs
4. Attractive to talented people and students: virtuous cycle: talent develops new ideas which create an attractive environment to students new ideas.
5. Skilled workforce at each stage of the innovation process

30
Research-intensive clusters (RICs)
6. Availability of finance, seed and venture capital, R&D funding, business angels, banks and guarantee providers, investment readiness schemes.
7. Availability of value-added business support services: testing facilities, incubation spaces, mentoring, economic intelligence, IPR protection advice, access to a wide range of funding tools.
8. Good location for research centres of large corporations: science based environment, good quality of life, good transport infrastructures (e.g. science parks)
9. Effective formal and informal networks for interactions and cross-fertilisation of ideas between TH players strong RIC identity among the stakeholders.
10. Provision of international co-operation framework as part of transnational networks.

31
RIC typologies
31
1. Spontaneous "bottom up" vs. publicly-supported ‘top-down’ onesSpontaneous bottom-up: started from a few regional stakeholders addressing needs or opportunities through sharing knowledge and experiences in a loose informal network of committed organisations.Publicly supported ones: "top down" strategy initiated by ministries (industry, research, education, regional development) to facilitate or urge stakeholders to work together to improve their competitiveness.
2. By sectoral focus: strong sectoral focus vs. multisectored and/or technology focused.
3. By aims: strengthen the trade capacities of their members vs. create or exploit new knowledge collaboration and a renewed portfolio of activities such as market research, research, supply chain linking or integration of technologies in other product or process innovations.
c) By openness and formal organisation: formal memberships based on fees vs. loose, no defined boundaries, open to new partners, networks.
d) By geographical coverage: regional impact zone , transregional or national..

32
Importance of collaboration within RICs
1. Knowledge transfer and innovationSpillovers through proximity, face-to-face interactions between firms with complementary assets and skills new ideas, trust.
2. Economies of scope: less costly to combine two or more products in one production system than to produce them separately. E.g. joint bids of companies with complementary skills for large projects which each individual firm would have been unable to compete for alone.
3. Economies of scale: further specialising production within each firm, by joint purchasing of common raw materials to attract bulk discounts, joint marketing, sharing knowledge about best practice and reduce costs by jointly sourcing services and suppliers.
32
33
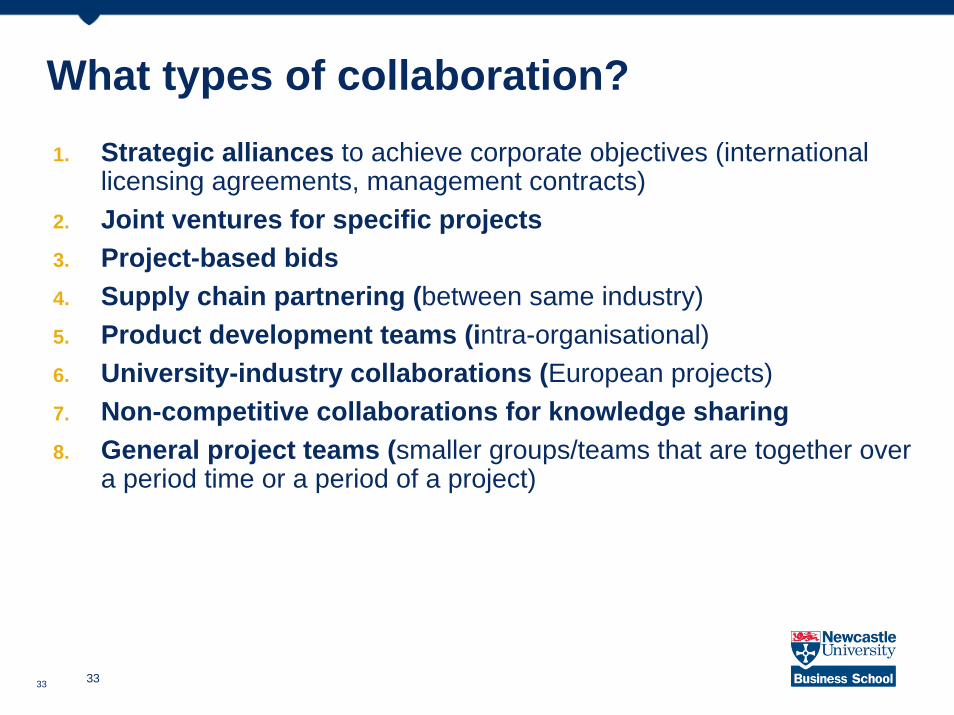
What types of collaboration?1. Strategic alliances to achieve corporate objectives (international
licensing agreements, management contracts)2. Joint ventures for specific projects3. Project-based bids4. Supply chain partnering (between same industry)5. Product development teams (intra-organisational)6. University-industry collaborations (European projects)7. Non-competitive collaborations for knowledge sharing8. General project teams (smaller groups/teams that are together over
a period time or a period of a project)
33

34
Support activities of public authorities:Assessment of current levels and desire for improvement
Source: European Commission (2006) Innobarometer 2006 on clusters

35
Current and planned EU initiatives in support of clusters

36
Case studies of clusters by the European Cluster Observatory