Embed Size (px)
Citation preview

U.S. DEPARTMENT OF HEALTH, EDUCATION IS WELFARE
OFFICE OF EDUCATION
THIS DOCUMENT HAS BEEN REPRODUCED EXACTLY AS RECEIVED FROM THE
PERSON OR ORGANIZATION ORIGINATING IT. POINTS OF VIEW OR OPINIONS
STATED DO NOT NECESSARILY REPRESENT OFFICIAL OFFICE OF EDUCATION
POSITION OR POLICY.
ekkft..""s.
,;.
US. DEPARTMENT ED#Ojeriolsi,Public ileatth Servici
Consumer Protection and Enitronniental, Health Service
LOWE.,-;

AIR QUALITY CRITERIA
FOR
SULFUR OXIDES
U.S. DEPARTMENT OF HEALTH, EDUCATION, AND WELFARE
Public Health ServiceConsumer Protection and Environmental Health Service
National Air Pollution Control Administration
Washington, D. C.
January 1969

National Air Pollution Control Administration Publication No. AP-50
e
i

Preface
Air quality criteria tell us what science hasthus far been able to meaure of the obviousas well as the insidious effects of air pollutionon man and his environment. Such criteriaProvide the most realistic basis that wePresently have for determining to what pointthe levels of pollution must be reduced if weare to protect the public health and welfare.
The criteria that we can issue at thepresent time do not tell us all that we wouldlike to know. If all of man's previous experi-ence in evaluating environmental hazardsprovides us with a guide, it is likely that im-proved knowledge will show that there areidentifiable health and welfare hazards as-sociated with air pollution levels that werepreviously thought to be innocuous. As ourscientific knowledge grows, air quality cri-teria will have to be reviewed and, in allprobability, revised. But the Congress hasmade it clear that we are expected, withoutdelay, to make the most effective use of theknowledge we now have.
The Air Quality Act of 1967 requires thatthe Secretary of Health, Education, and Wel-fare ". . . from time to time, but as soon asPracticable, develop and issue to the Statessuch criteria of air quality as in his judgmentmay be requisite for the protection of thepublic health and welfare. . . Such criteriashall . . . reflect the latest scientific knowledgeuseful in indicating the kind and extent of allidentifiable effects on health and welfarewhich maybe expected from the presence ofan air pollution agent. . ."
Under the Air Quality Act, the issuance ofair quality criteria is a vital step in a pro-gram designed to assist the States in takingresponsible technological, social, and politicalaction to protect the public from the adverseeffects of air pollution.
Briefly, the Act calls for the Secretary ofHealth, Education, and Welfare to define the
broad atmospheric areas of the Nation inwhich climate, meteorology, and topography,all of which influence the capacity of air todilute and disperse pollution, are generallyhomogeneous.
Further, the Act requires the Secretary todefine those geographical regions in the coun-try where air pollution is a problemwheth-er interstate or intrastate. These air qualitycontrol regions will be designated on thebasis of meteorological, social, and politicalfactors which suggest that a group of com-munities should be treated as a unit for set-ting limitations on concentrations of atmos-pheric pollutants. Concurrently, the Secre-tary is required to issue air quality criteriafor those pollutants he believes may be harm-ful to health or welfare, and to publish re-lated information on the techniques whichcan be employed to control the sources ofthose pollutants.
Once these steps have been taken for anyregion, and for any pollutant or combinationof pollutants, then the State or States respon-sible for the designated region are on noticeto develop ambient air quality standards ap-plicable to the region for the pollutants in-volved, and to develop plans for action formeeting the standards.
The Department of Health, Education, andWelfare will review, evaluate, and approvethese standards and plans, and once they areapproved, the States will be expected to takeaction to control pollution sources in the man-ner outlined in their plans.
At the direction of the Secretary, the Na-tional Air Pollution Control Administrationhas established appropriate programs tocarry out the several Federal responsibilitiesspecified in the legislation.
The Air Quality Act of 1967 requires thati 4
. . . criteria issued prior to enactment of thissection November 21, 1967 shall be re-
iii

evaluated in accordance with the consultationprocedure . . . and, if necessary, modified andreissued." Air Quality Criteria for SulfurOxides was first published in March 1967.This edition reflects the reevaluation, and re-sulting modification called for by the Act.
In accordance with the Act, a National AirQuality Criteria Advisory Committee wasestablished, having a membership broadlyrepresentative of industry, universities, con-servation interests, and all levels of govern-ment. The committee, whose members arelisted following this discussion, providedinvaluable advice on policies and proceduresunder which to issue criteria, and providedmajor assistance in reevaluating the originaldocument.
With the help of a Subcommittee on SulfurOxides, expert consultants were retained torewrite and edit portions of the document,with other segments being revised by staffmembers of the National Air Pollution Con-trol Administration. After the initial revi-sions, there followed a sequence of review bythe subcommittee, and by the full committee,as well as by individual reviewers especiallyselected for their competence and expertisein the many fields of science and technologyrelated to the problems of atmospheric pollu-
iv
tion by sulfur oxides. These efforts, withoutwhich this document could not have beencompleted successfully, are acknowledgedindividually on the following pages.
As also required by the Air Quality Act of1967, appropriate Federal departments andagencies, also listed on the following pages,were consulted prior to issuing this criteriadocument. A Federal consultation committee,comprising members designated by the headsof seventeen departments and agencies, re-viewed the document, and met with staff per-sonnel of the National Air Pollution ControlAdministration to discuss their comments.
This Administration is pleased to acknowl-edge the efforts of each of the persons speci-fically named, as well as the many not namedwho contributed to the publication of thisvolume. In the last analysis, however, theNational Air Pollution Control Administra-tion is responsible for its content.
JOHN T. MIDDLETON,
Commissioner, National Air PollutionControl Administration

NATIONAL AIR QUALITY CRITERIA ADVISORY COMMITTEE
ChairmanDR. JOHN T. MIDDLETON, Commissioner
National Air Pollution Control Administration
Dr. Herman R. AmbergManager, Manufacturing Services Dept.Central Research DivisionCrown Zellerbach Corp.Camas, Wash.
Dr. Nyle C. BradyDirector, Agricultural Experiment
StationCornell UniversityIthaca, N.Y.
Dr. Seymour CalvertDirector, Statewide Air Pollution
Research CenterUniversity of California, RiversideRiverside,, Calif.
Dr. Adrian Ramond ChamberlainVice PresidentColorado State UniversityFort Collins, Colo.
*Dr. Raymond F. DasmannSenior EcologistConservation FoundationWashington, D.C.
Mr. James R. GarveyPresident and DirectorBituminous Coal Research, Inc.Monroeville, Pa.
Dr. David M. GatesDirectorMissouri Botanical GardensSt. Louis, Mo.
* Resigned, October 14, 1968
Dr. Neil V. HakalaPresidentEsso Research & Engineering Co.Linden, N.J.
Dr. Ian T. HigginsProfessor, School of Public HealthThe University of MichiganAnn Arbor, Mich.
Mr. Donald A. JensenExecutive EngineerFord Motor Co.Dearborn, Mich.
Dr. Herbert E. KlarmanProfessor of Public Health Administration
and Political EconomySchool of Hygiene and Public HealthJohns Hopkins UniversityBaltimore, Md.
Dr. Leonard T. KurlandProfessor of EpidemiologyMayo Graduate School of MedicineHead, Medical StatisticsEpidemiology and Population GeneticsSection, Mayo ClinicRochester, Minn.
Dr. Frederick Sargent IIDean, College of Environmental
SciencesUniversity of WisconsinGreen Bay, Wis.
Mr. William J. StanleyDirector, Chicago Department of
Air Pollution ControlChicago, Ill.
V

CONTRIBUTORS
Dr. Mary 0. AmdurAssociate Professor of ToxicologyDepartment of PhysiologySchool of Public HealthHarvard UniversityBoston, Mass.
Dr. Rodney R. BeardExecutive Head, Department
of Preventive MedicineStanford University Medical SchoolPalo Alto, Calif.
Dr. Francis E. BlacetEmeritus Professor of ChemistryUniversity of California, Los AngelesLos Angeles, Calif.
Dr. L. J. BrasserHead, Atmospheric Pollution DivisionResearch Institute for
Public Health EngineeringDelft, The Netherlands
Dr. Robert CarrolProfessor of EpidemiologyAlbany Medical CollegeAlbany, N.Y.
Dr. Eric J. CassellAssociate Professor of Community MedicineThe Mount Sinai HospitalMt. Sinai School of MedicineNew York, N.Y.
Dr. R. E. EckardtDirectorMedical Research DivisionEsso Research and Engineering Co.Linden, N.J.
Dr. James G. EdingerProfessor of MeteorologyUniversity of CaliforniaLos Angeles, Calif.
Dr. David W. FassettDirector, Laboratory of Industrial MedicineEastman Kodak Co.Rochester, N.Y.
Dr. Lars FribergChief, Departmerft of HygieneKarolinska Institute of HygieneStockholm, Sweden
vi
AND REVIEWERS
Dr. John R. GoldsmithChief, Environmental Hazards
Evaluation UnitDepartment of Public HealthState of CaliforniaBerkeley, Calif.
Dr. Leonard GreenburgProfessor of Preventive and
Environmental MedicineAlbert Einstein College of MedicineNew York, N.Y.
Mr. John H. JacobsPrincipal Research PhysicistBell & Howell Research Center(Chicago, Ill.)Pasadena, Calif.
Dr. P. E. JoostingMedical ServiceResearch Institute for
Public Health EngineeringDelft, The Netherlands
Dr. Herbert LandesmanConsulting ChemistPasadena, Calif.
Mr. Benjanmin LinskyProfessor, Department of Civil EngineeringWest Virginia UniversityMorgantown, W. Va.
Dr. Harold MacFarlandProfessor, York University Faculty of
Arts and SciencesToronto, Ontario
Dr. Robert MasonGraduate Department of
Community PlanningUniversity of CincinnatiCincinnati, Ohio
Dr. James R. Mc CarrollProfessor of Preventive MedicineSchool of MedicineUniversity of WashingtonSeattle, Wash.
Dr. James N. Pitts, Jr.Professor of ChemistryUniversity of California, RiversideRiverside, Calif.

Mr. Alexander Rihm, Jr., P.E.Assistant CommissionerDivision of Air ResourcesNew York State Department of HealthAlbany, N.Y.
Dr. Bernard SaltzmanKettering LaboratoryUniversity of CincinnatiCincinnati, Ohio
Mr. Jean J. SchuenemanChief, Division of Air Quality ControlMaryland State Department of HealthBaltimore, Md.
Dr. William S. SpicerDirector, Division of Respiratory DiseasesUniversity of Maryland School of MedicineBaltimore, Md.
Dr. Wayne T. SproullConsultant in PhysicsPasadena, Calif.
Dr. E. StephensResearch ChemistAir Pollution Research CenterUniversity of California, RiversideRiverside, Calif.
Dr. 0. Clifton TaylorAssociate DirectorStatewide Air Pollution Research Center
University of California, RiversideRiverside, Calif.
Dr. Moyer D. ThomasEditor, Inter-Society Committee Manual of
Methods for Ambient Air Sampling andAnalysis
Riverside, Calif.
Dr. Paul UroneProfessorDepartment of ChemistryUniversity of ColoradoBoulder, Colo.
Mr. Hans K. UrySpecial ConsultantEnvironmental Hazards Evaluation UnitCalifornia State Department of Public HealthBerkeley, Calif.
Mr. Ralph C. WandsDirector, Advisory Center on ToxicologyNational Research CouncilWashington, D.C.
Dr. Richard P. WayneOxford UniversityLondon, EnglandVisiting Professor in PhotochemistryUniversity of California, RiversideRiverside, Calif.
vii

FEDERAL AGENCY LIAISON REPRESENTATIVES
Department of AgricultureKenneth E. GrantAssociate AdministratorSoil Conservation Service
Department of CommercePaul T. O'DayStaff Assistant to the Secretary
Department of DefenseColonel Alvin F. Meyer, Jr.ChairmanEnvironmental Pollution Control Committee
Department of Housing and UrbanDevelopment
Charles M. HaarAssistant Secretary for Metropolitan
Development
Department of the InteriorHarry PerryMineral Resources Research Advisor
Department of JusticeWalter Kiechel, Jr.Assistant ChiefGeneral Litigation SectionLand and Natural Resources Division
Department of LaborDr. Leonard R. LinsenmayerDeputy DirectorBureau of Labor Standards
Department of TransportationWilliam H. CloseAssistant Director for Environmental
ResearchOffice of Noise Abatement
viii
Department of the TreasuryGerard M. BrannonDirectorOffice of Tax Analysis
Federal Power CommissionF. Stewart BrownChiefBureau of Power
General Services AdministrationThomas E. CrockerDirectorRepair and Improvement DivisionPublic Buildings Service
National Aeronautics and SpaceAdministration
Major General R. H. Curtin, USAF (Ret.)Director of Facilities
National Science FoundationDr. Eugene W. Bier lyProgram Director for MeteorologyDivision of Environmental Sciences
Post Office DepartmentLouis B. FeldmanChiefTransportation Equipment BranchBureau of Research and Engineering
Tennessee Valley AuthorityDr. F. E. GartrellAssistant Director of Health
Atomic Energy CommissionDr. Martin B. BilesDirectorDivision of Operational Safety
Veterans AdministrationGerald M. HollanderDirector of Architecture and EngineeringOffice of Construction

AIR QUALITY CRITERIA FOR SULFUR OXIDES
TABLE OF CONTENTSChapter
PrefacePage
111
Introduction . x
1 Physical and Chemical Properties and the Atmospheric Reactionsof the Oxides of Sulfur 1
2 Sources and Methods of Measurements of Sulfur Oxides in theAtmosphere 17
3 Atmospheric Concentrations of Sulfur Oxides . 31
4 Effects of Sulfur Oxides in the Atmosphere on Materials 49
5 Effects of Sulfur Oxides in the Atmosphere on Vegetation 59
6 Toxicological Effects of Sulfur Oxides on Animals 71
7 Toxicological Effects of Sulfur Oxides on Man .. ........... . 89
8 Combined Effects of Experimental Exposures to Sulfur Oxides andParticulate Matter on Man and Animals 103
9 Epidemiological Appraisal of Sulfur Oxides .. 113
10 Summary and Conclusions . .. ....... ... 151
Appendices
A Symbols 164
B Abbreviations . 165
C Conversion Factors 166
D Glossary 167
Author Index . . .. ..... .. 172
Subject Index 175
Acknowledgements 178
ix

INTRODUCTION
Pursuant to authority delegated to theCommissioner of the National Air PollutionControl Administration, Air Quality Criteriafor Sulfur Oxides is issued in accordancewith Section 107b1 of the Clean Air Act (42U.S.C. 1857c-2b1).
Air quality criteria are an expression ofthe scientific knowledge of the relationshipbetween various concentrations of pollutantsin the air and their adverse effects on manand his environment. They are issued to as-sist the States in developing air quality stand-ards. Air quality criteria are descriptive; thatis, they describe the effect that have been ob-served to occur when the ambient air level ofa pollutant has reached or exceeded a specificfigure for a specific time period. In develop-ing criteria, many factors have to be con-sidered. The chemical and physical charac-teristics of the pollutants and the techniquesavailable for measuring these characteristicsmust be considered, along with exposuretime, relative humidity, and other conditionsof the environment. The criteria must con-sider the contribution of all such variables tothe effects of air pollution on human health,agriculture, materials, visibility, and climate.Further, the individual characteristics of thereceptor must be taken into account. Table Ais a listing of the major factors that need tobe considered in developing criteria.1
Air quality standards are prescriptive.They prescribe pollutant exposures which apolitical jurisdiction determines should notbe exceeded in a specified geographic area,and are used as one of several factors in de-
' Calvert S. Statement for air quality criteriahearings held by the Subcommittee on Air and WaterPollution of the U.S. Senate Committee on PublicWorks, July 30, 1968, published in "Hearings Beforethe Subcommittee on Air and Water Pollution of theCommittee on Public Works, United States Senate(Air Pollution-1968, Part 2)."
x
signing legally enforceable pollutant emis-sion standards.
This document focuses on the sulfur oxides,commonly found in the atmospheresulfurdioxide, sulfur trioxide, their acids, and thesalts of their acids. Other oxides of sulfurare well known in the laboratory, but theirpresence in the atmosphere has not beendemonstrated. Futher, this document consid-ers the effects of the sulfur oxides in conjunc-tion with other pollutant classes, especiallyparticulate matter, where important syner-gistic effects are observed. (Atmosphericparticulate matter is treated in detail in acompanion document: Air Quality Criteriafor Particulate Matter.)
This publication reviews the chemical andphysical characteristics of the sulfur oxides,and considers the various analytical methodsfor measuring them in the atmosphere. Alsodiscussed are the effects of the sulfur oxideson visibility, vegetation, and materials. Thetoxicological effects of sulfur oxides on ani-mals and on man are considered in separatechapters. Finally, there is a discussion ofepidemiological studies that assesses the dose-population response and the response ofpopulation subgroups (i.e., children, theelderly, respiratory cripples, etc.) to sulfuroxides and to sulfur dioxide in the presenceof particulate matter.
In general, the terminology employed fol-lows usage recommended in the publicationsstyle guide of the American Chemical Society.A glossary of terms, list of symbols and ab-breviations, list of conversion factors forvarious units of measurement, author index,and subject index are provided.
The literature has been generally reviewedthrough June 1968. The results and conclu-sions of foreign investigations are evaluatedfor their possible application to the air pollu-tion problem in the United States. This docu-

L
ment is not intended as a complete, detailedliterature review, and it does not cite everypublished article relating to sulfur oxides inthe ambient atmosphere. However, the litera-ture has been reviewed thoroughly for infor-mation related to the development of criteria,and the document not only summarizes thecurrent scientific knowledge of sulfur oxidesair pollution, but also points up the majordeficiencies in that knowledge and the needsfor further research.
The technological and economic aspects ofair pollution control are considered in com-panion volumes to criteria documents. Thebest methods bind techniques for controllingthe sources of sulfur oxides emissions, as wellas the costs of applying these techniques, aredescribed in: Control Techniques for SulfurOxide Air Pollutants.
Table A.FACTORS TO BE CONSIDERED INDEVELOPING AIR QUALITY CRITERIA
Properties of Pollution:ConcentrationChemical compositionMineralogical structureAdsorbed gasesCoexisting pollutantsPhysical state of pollutant
SolidLiquidGaseous
Rate of transfer to receptor domainMeasurement Methods:
Hi-Vol samplerSpot tape sampler
Dust fall bucket (rate of deposition)Condensation nuclei counterImpinger (liquid filled)Cascade impactorElectrostatic precipitatorLight scattering meterChemical analysisGas analysis (non-adsorbing)Adsorbed gas analysisLight scattering or attenuation
(Ringelmann or visibility observation)Colored suspensionNucleation of precipitationStabilization of fogOdorTaste
Exposure Parameters:DurationConcomitant conditions, such as
TemperaturePressureHumidity
Characteristics of Receptor:Physical characteristicsIndividual susceptibilityState of healthRate and site of transfer to receptor
Responses:Effects on health (diagnosable effects, latent
effects, and effects predisposing the organismto disease)
Human healthAnimal healthPlant health
Effects on human comfortSoilingOther objectionable surface depositionCorrosion of materialsDeterioration of materialsEffects on atmospheric propertiesEffects on radiation and temperature
xi

Chapter 1
PHYSICAL AND CHEMICAL PROPERTIES AND THEATMOSPHERIC REACTIONS OF THE OXIDES OF SULFUR

Table Page
Acid Solutions intive Humidities
1-3 Scattering RatiosEquilibrium with
Equilibrium with Water Vapor at Different Re la-10
for Various Size Droplets of Sulfuric Acid Mist inWater Vapor at Various Relative Humidities 11

Chapter 1
PHYSICAL AND CHEMICAL PROPERTIES AND THE ATMOSPHERICREACTIONS OF THE OXIDES OF SULFUR
A. INTRODUCTION
Sulfur diokide, sulfur trioxide, and thecorresponding acids and salts (sulfites andsulfates) are common atmospheric pollutantswhich arise mainly from combustion proc-esses. In this chapter, the chemical and phys-ical properties of these substances are dis-cussed in relation to their chemical reactionsin the atmosphere and their effect in reducingvisibility through the atmosphere, and withrespect to the methods employed for their es-timation. Analytical methods are describedmore fully in Chapter 2. More extensivetreatments of the chemistry of sulfur oxidesare to be found in most works on inorganicchemistry (e.g., references 1 and 2).
B. OCCURRENCE
The oxides SO2 (sulfur dioxide) and SO3(sulfur trioxide) , with the correspondingacids 112503 (sulfurous acid) and H2504(sulfuric acid) and the salts of these acids,are well known in atmospheric studies. Othersulfur oxidesSO, S203, S207, and 504areknown in laboratory studies, but their ex-istence in the atmosphere has not been de-monstrated. It has been suggested, however,that S207 may exist in some atmospheres asa result of the reaction between sulfur di-oxide and ozone.3
Solid and liquid fossil fuels generally con-tain appreciable quantities of sulfur, usuallyin the form of inorganic sulfides and/or sul-fur-containing organic compounds. Combus-tion of the fuel in power plants forms sulfuroxides in the ratio of 40 to 80 parts of sulfurdioxide to 1 part of sulfur trioxide. Asidefrom naturally occurring oxides of sulfur,the burning of fossil fuels such as coal andpetroleum in the United States constitutes
the major source of sulfur oxides in theatmosphere.
C. PHYSICAL PROPERTIES OFSULFUR DIOXIDES
Sulfur dioxide is a nonflammable, non-explosive, colorless gas. In concentrationsabove 0.3 ppm to 1 ppm in air, most peoplecan detect it by taste; in concentrationsgreater than 3 ppm it has a pungent, ir-ritating odor to most people.'-? The gas ishighly soluble in water: 11.3 g/100 ml at20°C, as compared to 0.004, 0.006, 0.003, and0.169 g/100 ml for oxygen, nitric oxide,carbon monoxide, and carbon dioxide, re-spectively. The physical properties of sulfurdioxide are listed in Table 1-1.
Table 1-1.PHYSICAL PROPERTIES OF SULFURDIOXIDE
Molecular weight 64.06Density (gas), g/liter 2.927 at 0°C; 1 atmSpecific (liquid) gravity 1.434 at 10° CMolecular volume (liquid),
ml 44Melting point, °C 75.46Boiling point, °C 10.02Critical temperature, °C 157.2Critcal pressure, atm 77.7Heat of fusion, Kcal/mole 1.769Heat of vaporization,
Kcal/mole 5.96Dielectric constant (prac-
tical units) 13.8 at 14.5°CViscosity, dyne sec/cm2 0.0039 at 0°CMolecular boiling point
constant, °C/1000g 1.45Dipole moment, Debye
units 1.61
D. CHEMICAL PROPERTIES OF SULFURDIOXIDES AND SULFUROUS ACID
Sulfur dioxide is a gas under ambientatmospheric conditions and can act as a re-
5

ducing agent or as an oxidizing agent. Ofconsiderable importance to the problem ofair pollution is the ability of the gas to reacteither photochemically or catalytically withmaterials in the atmosphere to form sulfurtrioxide, sulfuric acid, and salts of sulfuricacid. These atmospheric reactions are dis-cussed separately in Section G.
Laboratory experiments demonstrate thatsulfur dioxide may act as an oxidizing or asa reducing agent at room temperature. In thegaseous state, sulfur dioxide oxidizes hyrogensulfide to form elemental sulfur and water.A catalyst is generally used for this process,which is known as the Claus reaction.
2H2S + SO2 ---> 3S + 2H 20. (1-1)As a reducing agent, the gas reacts very slow-ly with oxygen at 400°C to yield sulfur tri-oxide, but catalytic oxidation to sulfur tri-oxide occurs at temperatures as low as roomtemperature.
1/2 00SO2 > S03. (1-2)catalyst
Catalysts effective in this oxidation includefinely divided platinum, charcoal, vanadicoxide (V20,), graphite, chromic oxide, ferricoxide, and the nitrogen oxides. The nitrogenoxides are used as the catalyst in the chamberprocess of manufacturing sulfuric acid fromsulfur dioxide.
Ferrous sulfate (FeSO4) catalyzes thedirect oxidation of sulfur dioxides to sulfuricacid in the presence of oxygen and water.
H20 + SO2 1/20----t---> H2SO4. (1-3)FeSO4
Some metal oxides oxidize sulfur dioxidedirectly to sulfate. Magnesium oxide (Mg0),ferric oxide (Fe:203), zinc oxide (ZnO ) , man-ganic oxide (Mn203), cerous oxide (Ce203),and cupric oxide (CuO) are examples. A sul-fide is also formed as a product if the metalion is not reduced to a lower valence state.4Mg0 + 4S02 --> 3MgSO4 + MgS
(1-4)Magnesium Sulfur Magnesium Magnesium
oxide dioxide sulfate sulfideLead peroxide (Pb02) is an active oxidiz-
ing agent and is used to obtain an estimate ofthe amount of oxidizable sulfur compoundsin air, e.g.,
6
Pb0:2 + SO2 ----> PbSO4. (1-5)Hydrogen peroxide (H20) is used exten-
sively as an oxidizing agent in the analysisof air samples for sulfur dioxide: sulfuricacid is formed, and is estimated conducto-metrically or by titration.
Sulfur dioxide reacts with the halogens.With chlorine, the product is thionyl chloride(SOC12) . On the other hand, the reactionwith iodine in aqueous solution yields sul-furic acid and hydrogen iodide, and the de-colorization of a starch-iodine mixture is usedin one of the methods for the determinationof atmospheric SO2.
Sulfur dioxide reacts with water to formsulfurous acid (112S03)
SO2 + H2O H2503. (1-6)
The pure acid is unstable and exists only inaqueous solution. Sulfurous acid can reactdirectly with many organic dyes. The West-Gaeke method for the determination of at-mospheric sulfur dioxide takes advantageof this property; pararosaniline is used as theorganic dye.
E. PHYSICAL AND CHEMICAL PROP-ERTIES OF SULFUR TRIOXIDE
Sulfur trioxide in ambient air is eitherderived from combustion sources directly orfrom the oxidation of atmospheric sulfur di-oxide. Sulfur trioxide may exist in the airas a vapor if the water vapor concentrationin the air is low enough; but if sufficient wa-ter vapor is present (as there probably al-ways is in ambient air) , the sulfur trioxidecombines immediately with water to yieldsulfuric acid in the form of droplets.
SO3 + H20 ---> H2SO4. (1-7)Sulfuric acid, rather than sulfur trioxide, isthus the compound normally found in the at-mosphere. Because of the difficulty of measur-ing free sulfur trioxide in the air, little isknown about how much may be present undervarious circumstances; presumably, it ispresent in the unhydrated form only in traceamounts.
Sulfur trioxide is a strong acid and readi-ly converts basic oxides to sulfates. It is alsoa dehydrating agent. When phosphates, car-bonates, perchlorates, and salts of other oxy-

acids react with sulfur trioxide, the 'cor-responding anhydride of the oxy-acid isformed by extraction of the elements ofwater. Sulfur trioxide may also act as anoxidizing agent, giving free halogens (ex-cept fluorine) with many metal and non-metal halides. Sulfur trioxide reacts as aLewis acid with a variety of nitrogen-con-taining organic ring systems to form additioncomplexes. Gilbert 8 recently reviewed thenumerous and diverse reactions of sulfur tri-oxide with organic compounds.
F. ATMOSPHERIC REACTIONS OFSULFUR OXIDES
1. Laboratory InvestigationsSulfur dioxide is oxidized in the atmos-
phere by two main processes: photochemicaland catalytic. Gerhard and Johnstone 9 deter-mined that the oxidation of sulfur dioxide in30 percent sulfuric acid droplets of 0.3-/z dia-meter in the absence of catalysts proceedsat a rate negligible compared to the rate ofphotochemical oxidation. They pointed out,however, that even in the absence of cat-alysts the rate of liquid-phase oxidation in awater fog might be faster than in a photo-chemical smog if the rate depends upon thetotal amount of dissolved sulfur dioxide.
Junge and Ryan" studied the oxidation ofsulfur dioxide in solution and found that es-sentially no reaction occurred in the absenceof a catalyst. When ferric chloride was usedas a catalyst, oxidation did take place. Thefinal amount of sulfate formed was onlyslightly dependent on the concentration ofcatalyst but was a linear function of sulfurdioxide concentration. Johnstone and Cough-anowr 11 estimated from their study of sul-fur dioxide oxidation in small droplets that,if manganese sulfate was present as 1-/A crys-tals, the oxidation rate in fog droplets at 1ppm SO, would be about 1 percent per min-ute. Both investigators found that manga-nese salts were more effective catalysts thaniron salts. Bracewell and Gall 12 also mea-sured rates of catalytic oxidation of sulfurdioxide in droplets and estimated that, in thepresence of ferric or manganous ions, ratesof oxidation could be sufficient to account forthe sulfuric acid content of urban fogs (as-
suming sulfur dioxide concentrations of1750 µg /m3 or about 0.6 ppm; see appendixfor conversion factors).
The oxidation of sulfur dioxide essentiallystopped when the pH of the water dropletsapproached 2 in Junge and Ryan's experi-ments," and they suggested that the effectis due, at least in part, to the low solubilityof sulfur dioxide in strongly acidic solutions.If ammonia was present in the air to neu-tralize the acid as it was formed, oxidationof sulfur dioxide continued. Van den Heuveland Mason 13 found that for given concen-trations of ammonia and sulfur dioxide themass of sulfate formed was proportional tothe product of the surface area of the dropsand the time of exposure.
The catalytic oxidation of sulfur dioxidemay also proceed after adsorption of the gason the surfaces of suspended solid particles.Smith et a/.14 demonstrated preferentialchemisorption of sulfur dioxide at ambientconcentrations on iron oxide and aluminumoxide aerosols followed by multilayered phys-ical adsorption at higher concentrations. Li-berti and associates 15 were unable to desorbsulfur dioxide from atmospheric dust sam-ples and concluded from analyses of thesesamples that adsorbed sulfur dioxide is eitheroxidized to sulfate or reacts to form a varietyof organic compounds. The interaction ofsulfur dioxide with atmospheric aerosols isimportant also from the point of view of thetoxicological effects of such pollutant combi-nations (see Chapter 8).
Gerhard and Johnstone 9 found the photo-oxidation rat') of sulfur dioxide in air andsunlight to be 0.1 percent to 0.2 percent perhour; the rate did not depend upon the pres-ence of sodium chloride nuclei or nitrogendioxide, or on changes of relative humiditybetween 30 percent to 90 percent. Renzettiand Doyle " found appreciable formation ofH2504 aerosol by irradiation, at 3130 A, ofsulfur dioxide at concentrations below 1 ppmand at relative humidity below 50 percent.More recently Urone et al.17 investigated re-actions of sulfur dioxide in air in the pres-ence of water vapor with irradiation at 3100A-4200 A; their results indicate a fasterphotooxidation rate when hydrocarbon andnitrogen dioxide are present.
7

Of primary interest in the photochemicaloxidation of sulfur dioxide is the formationof particulate matter in hydrocarbon-nitro-gen oxides systems. In the absence of sulfurdioxide, little or no aerosol is formed whenmixtures of nitrogen oxides and most hydro-carbons (all at atmospheric concentrations)are irradiated. (Varying amounts of par-ticulate matter are, however, formed whennitrogen oxides are irradiated with any ofseveral particular hydrocarbons such as cy-clic olefins.) 18-20 In the absence of nitrogenoxides, Johnstone and Dev Jain 21 obtainedparticulate matter when they irradiated sul-fur oxide with n-butane both at 20 mm Hgpartial pressure; but Kopczynski and Alt-shuller 22 were unable to detect any forma-tion of particular matter when sulfur diox-ide at atmospheric concentration togetherwith atmospheric concentrations of eitherolefins or paraffins were irradiated. In fact,Renzetti and Doyle 16 and Dainton and Ivin 23
demonstrated that olefins can suppress theproduction of particulate matter during ir-radiation of sulfur dioxide in the absence ofnitrogen oxides.
On the other hand, mixtures of olefins,nitrogen dioxide, and sulfur dioxide definitelyform an aerosol in the presence of sunlight.Thus a major product of the complex photo-chemical reaction is sulfuric acid,16 24-26 whichis a hygroscopic material that adsorbs waterto form light-scattering droplets of sulfuricacid mist. The density of such a haze obvious-ly will depend on the prevailing relative hu-midity. Sulfuric acid is sufficiently nonvolatileto self-nucleate even at realistic atmosphericconcentrations but this may not be neces-sary in view of the large numbers of nucleipresent even in "clean" air. The exact mech-anism by which sulfur dioxide is converted tosulfuric acid mist remains unclear. Evenmore uncertain is the chemical nature of theaerosol reportedly formed in hydrocarbon-nitrogen oxide systems without sulfur di-oxide.
For detailed reviews of photochemical airpollution, the work of Leighton,27 Altshullerand Buffalini,28 and Stern 29 should be con-sulted. The basic spectroscopy and photo-chemistry of sulfur dioxide are discussed byCalvert and Pitts.3°
8
2. Field Investigations
Gartrell et al.31 studied the oxidation of sul-fur dioxide in coal-burning power plantplumes. Soluble sulfates were collected onmembrane filters, and sulfur dioxide wascollected in hydrogen peroxide. The sulfurtrioxide concentration in the stack gas was15 ppm to 40 ppm and the sulfur dioxideconcentration was about 2200 ppm. Thus, ona weight basis, the ratio of sulfuric acid tosulfur dioxide as initially about 0.03. Insuccessive samples collected from the plume,the investigators found oxidation rates rang-ing from zero to 2 percent per minute. In-creasing rates of oxidation were observedwith increasing relative humidity, and the in-vestigators concluded that moisture withinthe plume of the ambient strata was themost important factor affecting the rate ofoxidation.
Katz 32 made simultaneous collections oftwo air samples in the Sudbury, Ontario,nickel-smelting area to determine sulfur di-oxide and "total sulfur contaminants," whichhe interpreted as sulfur dioxide, sulfur tri-oxide, and sulfuric acid. The sample for"total sulfur contaminants" was collected ina dilute solution of sulfuric acid and hydro-gen peroxide, and the sulfur dioxide equiv-alent was determined from electroconductivi-ty measurements. The second sample wascollected in a starch-iodine solution so thatsulfur dioxide could be determined idometri-cally. Katz found that (1) the average ratioof sulfur dioxide to total sulfur contaminantsor to net gaseous acid was highest when theconcentration of gases was highest and (2)the ratio decreased from about 95 percent in1 hour to 65 percent in 12 hours residencetime of the pollutant.32 33 Although reserva-tions exist about the quantitative nature ofthese ratios because of a number of apparent-ly uncontrolled or uncontrollable parametersin the experiments, they nevertheless in-dicate qualitatively that sulfur dioxide isoxidized in the atmosphere. In the experi-ments, interferences may arise from thepossible presence of the acidic gas, nitrogendioxide, the possible selective removal of ba-sic substances in the air with time, the vari-able effectiveness of the filter in removing

particulate matter and sulfuric acid from theair, etc. Analysis of the data presented byKatz shows that over the relatively narrowrange of conditions studied the rate of de-crease in the ratio of sulfur dioxide to totalsulfur contaminants appears to be independ-ent of concentration of contaminants, of thetime of day at which the measurements weremade, and of ambient temperature. The ratewas about 0.035 percent per minute. Fromthis oxidation rate it follows that, if theinitial concentration of sulfur dioxide were 1ppm (2860 11g/m3 at 0°C) , the concentration,assuming no dilution, would be approximate-ly 2850 µg /m3 after 10 minutes, 2800 µg /m3after 1 hour, and 2300 µg /m3 after 10 hours.The cJrresponding sulfur trioxide (as sul-furic acid) concentrations would be approxi-mately 15 µg /m3, 90 µg /m3, and 830 µg /m3,and the weight ratios of sulfuric acid to sul-fur dioxide at the respective times would beapproximately 0.005, 0.032, and 0.358.
This rate, obtained from the work of Katz,is much smaller than that reported byGartrell and associates," perhaps in part be-cause Gartrell had more efficient sulfuricacid collection and perhaps in part becauseatmospheric conditions were not the same. Asnoted previously, Gartrell and his associatesconcluded that moisture within the plumeof the ambient air strata is the primary rate-determining factor in the oxidation.
The effect of concentration on reaction ratealso must be considered. Whereas Katz' dataindicated that the rate of loss of sulfur di-oxide was independent of concentration, thesulfur dioxide concentrations of the samples(taken in the open air) generally were lessthan 2 ppm. Although Gartrell et al. did notindicate concentrations of the contaminantsin their plume samples, concentrations insuch a plume would be much higher than 1ppm to 2 ppm; at the higher concentrationsthe reaction rate may be faster and concen-tration dependent.
3. Particulate Sulfate in Polluted Air
The oxidation of atmospheric sulfur di-oxide results in the formation of sulfuricacid and other sulfates that typically accountfor about 5 percent to 20 percent of the totalsuspended particulate matter in urban air.
In general, as expected, there is a relation-ship (Commins;34 see also Chapter 3, SectionC) between the concentrations of sulfuricacid or sulfate and sulfur dioxide.
In recent years, some studies have beenmade of the particle size distribution of sus-pended atmospheric sulfate. This propertydetermines visibility reduction 35 and is animportant factor in physiological responsesbecause of its relation to the degree of pene-tration and retention of particles in lungs.Roesler et a1.3" reported sulfate size distribu-tions in downtown Chicago and Cincinnatibased on 24-hour samples collected withcascade impactors. They found values formass median diameter (MMD), i.e., forequivalent spheres of unit density, that aver-age 0.3/2 to 0.4/2 in the two cities. These werewithin the range of average MMD value fortotal sulfur (0.2/2 to 0.9p) found by Ludwigand Robinson "I in the Los Angeles and SanFrancisco Bay areas. From 8-hour samplescollected continuously for a week in each offour cities, Wagman et al." found values foraverage sulfate MMD (i.e., 0.42p in Chicago,Cincinnati, and Fairfax, and 0.60/2 in Phila-delphia) that were in good agreement withthese measurements. They also found thatsulfate particle sizes generally increased withincreasing relative humidity, whereas sulfateconcentration was more closely correlatedwith absolute humidity. Of particular signifi-cance is the fact that all of these investiga-tions showed that a major fraction (generally80 percent or more) of urban atmosphericsulfate is associated with particles below 2/2in diameter. Suspended sulfate is thereforelargely in the respirable fraction of particu-late matter and is associated mainly withparticles that cause the most pronounced re-duction in visibility.
G. EFFECTS OF SULFUR OXIDES ONLIGHT TRANSMISSION IN ATMOSPHERE
One of the most noticeable physical effectsof air pollution is the reduced visibility inpolluted atmospheres. Comprehensive treat-ments of the subject include those of Stef-fens," Middleton,35 and Robinson.40 A com-panion document, Air Quality Criteria forParticulate Matter, also discusses the sub-ject in Chapter 3, "Effects of Atmospheric
9

Particulate Matter on Visibility." Since themeteorological effects, as well as reduction ofvisibility, are considered in detail in the abovedocument, only the salient features of thisproblem are summarized here.
1. Reduction of Visibility by Air Pollutants
Visibility in the atmosphere is reduced bythe scatter and absorption of visibile radia-tion by air molecules and aerosol particles.Attenuation by scatter and absorption of thelight passing from objects to observer re-duces the brightness and contrast betweenobjects with the result that the eye's abilityto distinguish objects from their backgroundis reduced.
In addition to reducing visibility by at-tenuation, aerosols that scatter light efficient-ly are effective in reducing object contrastand visibility because they also scatter lightfrom the sky and sun into the line of sightof an observer. It is a common observationthat dark objects, for example mountainridges, become progressively lighter in shadeas they become more distant. The most dis-tant mountain that one can distinguish istypically almost as light or bright as its skybackground. Since particulate sulfur oxidesare most effective in scattering light," theyrepresent air pollutants that play an impor-tant role in reducing visibility in the atmos-phere.
2. Scattering of Light by Sulfuric Acid andSulfate Particles
The quantitative contribution made by theoxides of sulfur to the total scattering oflight in various atmospheres has not beenresolved, but sulfuric acid mist and other sul-fate particulate matter are recognized asimportant sources of scattering. The latterarise, as noted earlier, from complex oxida-tion processes, some of which are photo-chemical in nature.
Regardless of the mechanism by which theparticulate matter is formed, one can, never-theless, formulate an expression for the dis-tance we can see through the atmosphere. Thevisual range, L, along a given path is de-fined " as the greatest distance a black ob-ject may be seen when viewed against the
10
sky at the horizon, and for monodisperseparticles and monochromatic light at athreshold contrast of 2 percent, is given bythe relation
L--,--3.92 3.92_
g NAE(1-8)
where (T is the scattering coefficient (per unitpath length),
N is the number of particles per unit vol-ume of atmosphere,
A is the cross-sectional area of the parti-cles, and
E is the particles scattering ratio.4°
The particles scattering ratio, E, is theratio of the area of the wave front acted onby the particles to the geometric area of theparticle. This ratio depends on the particle'srefractive index, its shape, and its size rela-tive to the wave-length of the light. Refrac-tive indices of sulfuric acid in equilibriumwith water vapor at various relative humidi-ties are given in Table 1-2 and in Table 1-3,values for E when it= 0.54p, are given for
Table 1-2.-DENSITY, PERCENT SULFURIC ACID,AND REFRACTIVE INDEX OF SULFURIC ACIDSOLUTIONS IN EQUILIBRIUM WITH WATERVAPOR AT DIFFERENT RELATIVE HUMIDI-TIES 42 4'3
Relativehumidity,percent
H2SO4,percent
Density Refractiveindex
0 100.00 1.8305 1.4402 84.41 1.7615 1.4345 69.44 1.6015 1.421
10 64.45 1.5485 1.41420 57.76 1.4775 1.40730 52.45 1.4205 1.39940 47.71 1.3705 1.39350 43.10 1.3305 1.38755 40.75 1.3105 1.38460 38.35 1.2885 1.38165 35.80 1.2665 1.37870 33.09 1.2435 1.37475 30.14 1.2205 1.37080 26.79 1.2025 1.36685 22.88 1.1645 1.36290 17.91 1.1265 1.35695 11.08 1.0745 1.34797.5 7.42 1.0385 1.34398 4.99 1.0315 1.340

Table 1-3.-SCATTERING RATIOS FOR VARIOUS SIZE DROPLETS OF SULFURIC ACID MIST IN EQUI-LIBRIUM WITH WATER VAPOR AT VARIOUS RELATIVE HUMIDITIES (INTERPOLATED FROMREFERENCE NO. 44)
Percent relative humidity
d a 50 55 60 65 70 75 80 85 90 95 98
0.1 0.02 0.02 0.02 0.02 0.02 0.02 0.02 0.02 0.02 0.02 0.010.2 0.24 0.24 0.23 0.23 0.22 0.22 0.21 0.21 0.20 0.19 0.180.3 0.88 0.87 0.85 0.84 0.81 0.80 0.78 0.76 0.73 0.69 0.660.4 1.63 1.60 1.58 1.56 1.53 1.50 1.47 1.44 1.40 1.33 1.280.5 2.50 2.42 2.43 2.41 2.36 2.32 2.27 2.23 2.17 2.07 1.990.6 3.18 3.13 3.11 3.06 3.02 2.93 2.92 2.88 2.81 2.69 2.600.7 3.63 3.58 3.52 3.53 3.50 3.46 3.42 3.39 3.34 3.23 3.160.8 3.94 3.92 3.91 3.89 3.87 3.81 3.84 3.82 3.78 3.72 3.670.9 4.00 4.00 3.99 3.98 3.97 3.98 3.97 3.97 3.95 3.94 3.921.0 3.84 3.85 3.85 3.85 3.86 3.87 3.87 3.87 3.88 3.89 3.891.1 3.30 3.33 3.31 3.38 3.42 3.45 3.48 3.52 3.58 3.67 3.731.2 2.84 2.93 2.98 3.02 3.53 3.14 3.21 3.27 3.35 3.49 3.591.3 2.33 2.50 2.54 2.58 2.65 2.71 2.78 2.84 2.93 3.07 3.161.4 2.20 2.23 2.22 2.29 2.33 2.38 2.37 2.46 2.52 2.63 2.701.5 1.78 1.85 1.81 1.88 1.90 1.92 1.95 1.99 2.05 2.16 2.271.6 1.66 1.61 1.62 1.68 1.71 1.72 1.76 1.79 1.86 1.90 2.081.7 1.92 1.91 1.91 1.91 1.90 1.90 1.90 1.90 1.90 1.90 1.901.8 2.11 2.12 2.10 2.08 2.04 2.01 1.98 1.94 1.89 1.82 1.751.9 2.47 2.42 2.39 2.35 2.30 2.25 2.21 2.16 2.08 1.91 1.882.0 2.43 2.40 2.43 2.40 2.32 2.33 2.29 2.26 2.20 2.10 2.03
a Diameter in microns.
various concentrations of sulfuric acid mistof various particle sizes.a. Droplet Size
When particles of different sizes and dif-ferent refractive indices are involved, theequation Ly = 3.9/NAE for visual range,must be modified as follows:
3.9pL,-Is,T iAii.e.,,i
(1-9)
where L. is the visual range in standardunits with a contrast limit(threshold) of 0.02,
i&j identify a class of particles of agiven diameter (d) and a givenrefractive index (n), respectively,
Nii represents the number of ij par-ticles per unit volume,
Au represents the cross-sectionalarea of an ij particle,
Eli
1)
is the scattering ratio of the ijparticle,is unity if L, is in the same unitsas N and A, e.g., L. is in metersif Nii is number of particles percubic meter and Au is cross-sec-tional area in square meters, butp is 62.14 x 10⁻⁵ if L. is in'miles,Nii is in number of particles percubic meter, and Ali is in squaremeters.
Waller and co- workers 4" studied aciddroplets in urban air and presented datapertaining to a 39 µg /m" sample of sulfuricacid mist with a mass median diameter of0.4 and a geometric standard deviation of8. The relative humidity at the time thesample was collected was 85 percent. Thenumber of particles of various sizes was cal-culated from the density of sulfuric acid inequilibrium with water vapor at 85 percentrelative humidity, and the mass distributionof the sample.
11
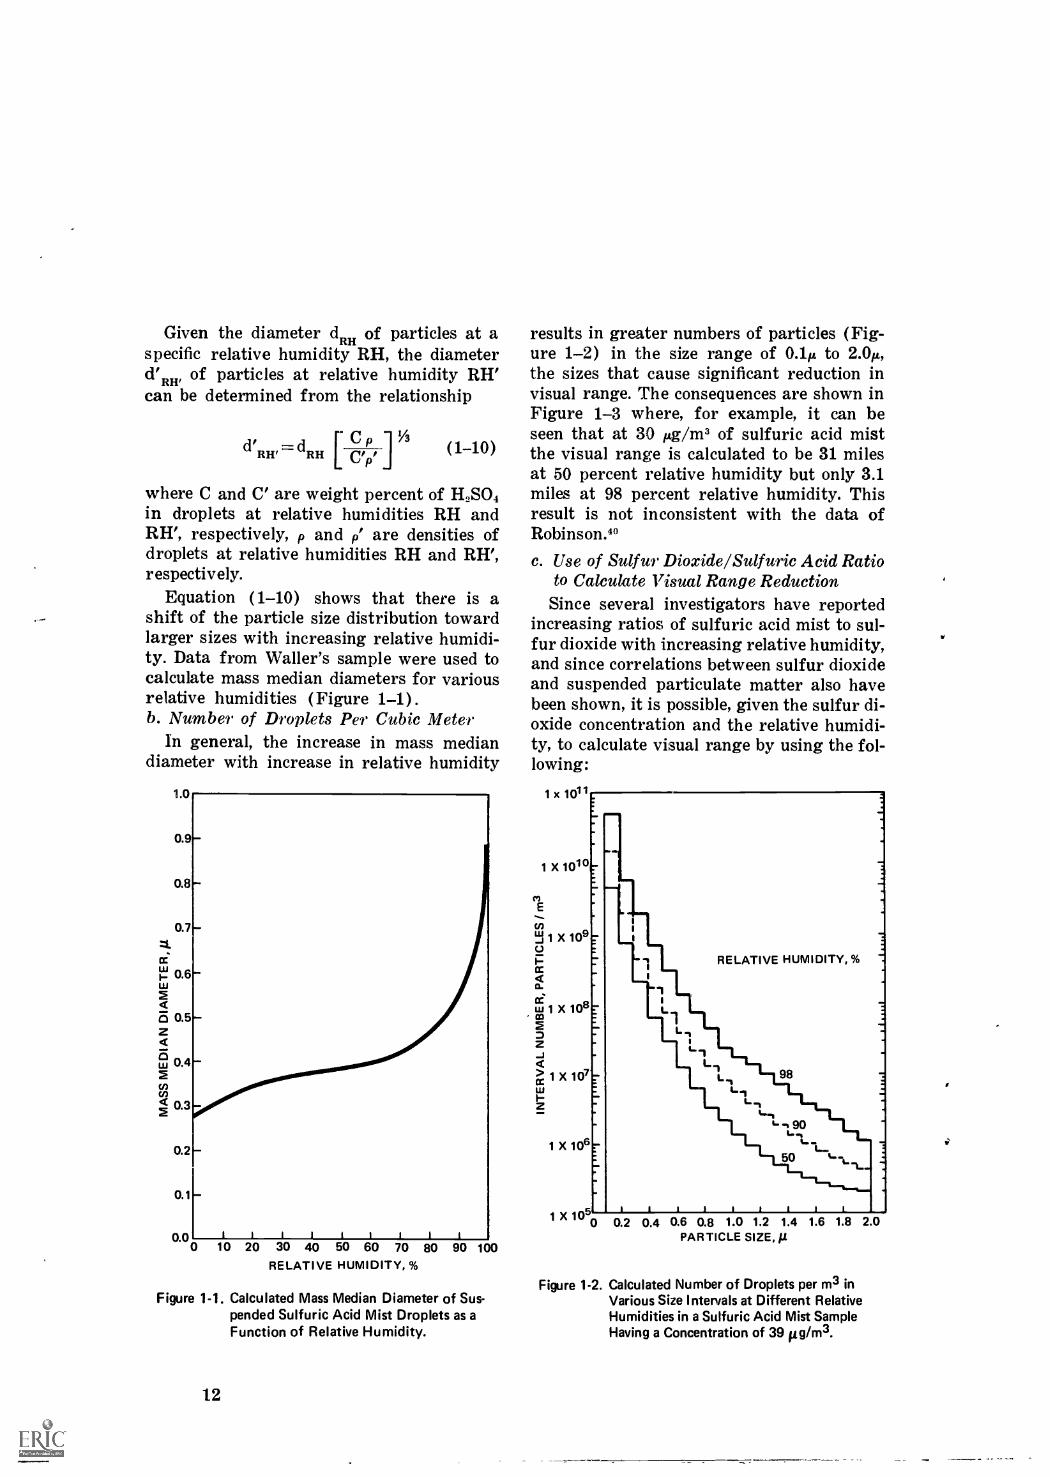
Given the diameter dRH of particles at aspecific relative humidity RH, the diameterd'RH, of particles at relative humidity RH'can be determined from the relationship
d' =d p[C 11A (1-10)RH' RH Up/
where C and C' are weight percent of H2SO4in droplets at relative humidities RH andRH', respectively, p and p' are densities ofdroplets at relative humidities RH and RH',respectively.
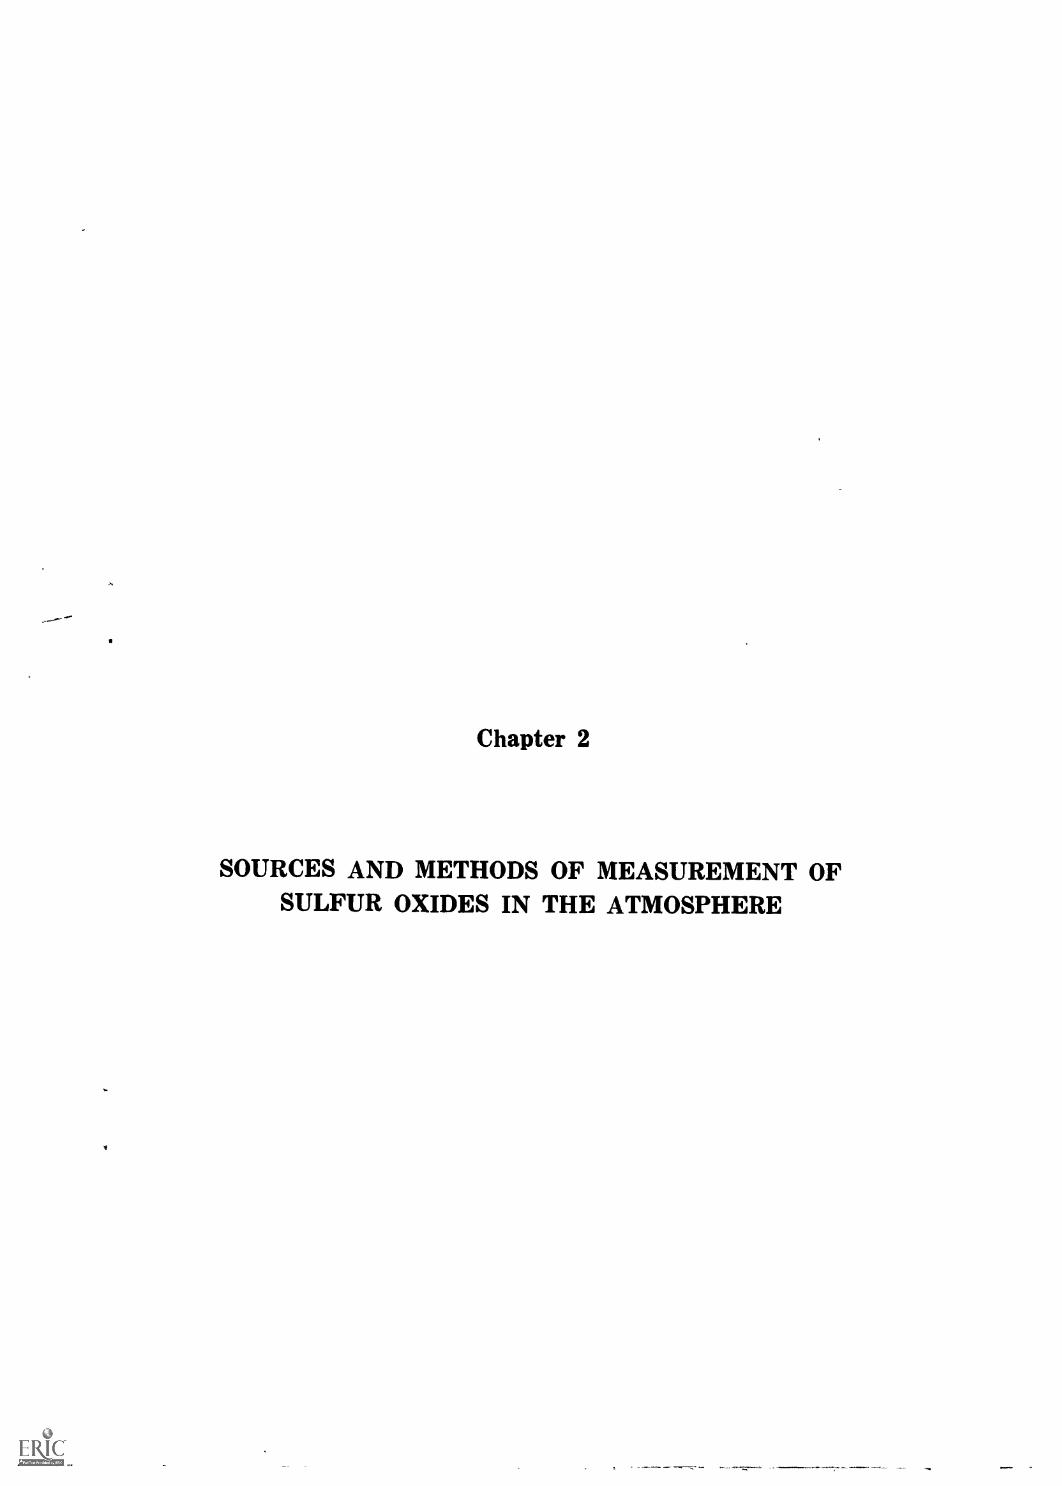
Equation ( 1-10 ) shows that there is ashift of the particle size distribution towardlarger sizes with increasing relative humidi-ty. Data from Waller's sample were used tocalculate mass median diameters for variousrelative humidities (Figure 1-1).b. Number of Droplets Per Cubic Meter
In general, the increase in mass mediandiameter with increase in relative humidity
1.0
0.9
0.8
0.7
ccw1 0.6w
a5 0.5z<aw 0.4
CI)cng 0.3
0.2
0.1
0.0010 20 30 40 50 60 70 80 90 100
RELATIVE HUMIDITY, %
Figure 1-1. Calculated Mass Median Diameter of Sus-pended Sulfuric Acid Mist Droplets as aFunction of Relative Humidity.
12
results in greater numbers of particles (Fig-ure 1-2) in the size range of 0.1p to 2.0p,the sizes that cause significant reduction invisual range. The consequences are shown inFigure 1-3 where, for example, it can beseen that at 30 µg /m3 of sulfuric acid mistthe visual range is calculated to be 31 milesat 50 percent relative humidity but only 3.1miles at 98 percent relative humidity. Thisresult is not inconsistent with the data ofRobinson.4°
c. Use of Sulfur Dioxide/ Sulfuric Acid Ratioto Calculate Visual Range ReductionSince several investigators have reported
increasing ratios of sulfuric acid mist to sul-fur dioxide with increasing relative humidity,and since correlations between sulfur dioxideand suspended particulate matter also havebeen shown, it is possible, given the sulfur di-oxide concentration and the relative humidi-ty, to calculate visual range by using the fol-lowing:
lx 1 011
1 X 10¹⁰
CIE
cnLU 1 X10⁹IC.)
RCC
<0.
CCs
lli 1 X 10⁹co2Dz_1
> 1 x 10⁷ccLI,1z
1X10⁶
1
"-1
I.
L
i
1
1
11
t
L1
RELATIVE HUMIDITY, %
I._,
L1Ll
I. *198
LlL,
L.,"'s 90I--,Li--50 (--t-1--
i 1 1 i t i 1
x1050 0.2 0.4 0.6 0.8 1.0 1.2 1.4 1.6 1.8 2.0PARTICLE SIZE, 1
Figure 1-2. Calculated Number of Droplets per m3 inVarious Size Intervals at Different RelativeHumidities in a Sulfuric Acid Mist SampleHaving a Concentration of 39 pg/m3.

1. Figure 1-4 shows the average concen-trations of sulfuric acid mist (measured as11,SO4) associated with various concentra-tions of sulfur dioxide at various relativehumidities as calculated from the ratiosreported by Bushtueva.4T Ratios similar tothose reported by Bushtueva have also beenreported by Coste and Courtier,495° Com-mins," and Thomas.52
2. The average contribution of sulfuricacid mist to the denominator of the visualrange equation
2.4 x 10⁻³
:SiNji Ai1 Eu
varies with relative humidities as follows:at 50 percent relative humidity, 0.26 x 10⁻⁵per µg /m"; at 90 percent relative humidity,0.69 x 10- -: per µg /m3; and at 98 percent rela-tive humidity, 2.55 x 10 per µg /m3.
3. From National Air Surveillance Net-work data for New York City (1964-1965)a typical ratio of suspended particulate mat-
101100 101 102 103
SULFURIC ACID MIST CONCENTRATION, lig I m3
Figure 1-3. Calculated Visibility (Visual Range) in Milesat Various Sulfuric Acid Mist Concentrationsand Different Relative Humidities.
This graph shows that visibility decreases with increas-ing acid mist concentration, and with increasing relativehumidity.
ter to sulfur dioxide concentration is 1200µg /m3 to 1 ppm. If the components of thesuspended particulate matter other than sul-furic acid are assumed nonhygroscopic, theircontribution to the denominator of the visibil-ity equation, determined from the investiga-tions of Charlson,53 may range from0.16 x 10-5 to 0.66 x 10⁻⁵ per µg /m3 with amean value of 0.33 x 10 per µg /m3.
For example, in New York City, at 0.3 ppmsulfur dioxide concentration, the suspendedparticulate matter other than sulfuric acidis 0.3 x 1200 or 360pg/m3. At 90 percent rela-tive humidity the sulfuric acid mist contentis 78pg/m3 .
Then,
L, =2.4 x 10-"
(360) (0.33 x 10 5) + (78) (0.69x10 -5)
2.4 x 10 3=1.4 miles (1-12)
173 x 10-5
The results of a series of such calculationsapplicable to New York City (1964-1965) areshown in Figure 1-5. Estimates of visual
300
260E
;D-220
0Q 180ccI
zc.) 1400UOr.5Q 100
it
60U.
V)
20
98
90
RELATIVE HUMIDITY, %
50
0.2 0.4 0.6 0.8SULFUR DIOXIDE, ppm
Figure 1-4. Ratios of Sulfuric Acid to Sulfur DioxideConcentrations at Different RelativeHumidities.
13
10

102
101
100
10-1
10-3 10-2 10-1
SULFUR DIOXIDE, ppm
loo
Figure 1-5. Calculated Visibility (Visual Range) in Milesat Various Sulfur Dioxide Concentrationsand at Different Relative Humidities inNew York City.
This graph shows that visibility decreases with increasingsulfur dioxide concentration, and with increasing relativehumidity. It is based on a calculation combining the re-lationships shown in Figure 1-3 with those shown inFigure 1-4.
range can be obtained for various concentra-tions of sulfur dioxide. The data become par-ticularly significant in relation to aircraft op-erations. At a visual range of less than 5miles, operations are slowed at airports be-cause of the need to maintain larger distancesbetween aircraft; Federal Aviation Adminis-tration restrictions on aircraft operations be-come increasingly severe as the visual rangedecreases below 5 miles.
H. SUMMARY
The burning of coal and fuel oil, whichcontain inorganic sulfides and sulfur-contain-ing organic compounds, results in the emis-sion of appreciable quantities of sulfur di-oxide into the atmosphere. Other oxides ofsulfur are also emitted, but in quantities thatare small by comparison; for example, about
14
40 to 80 parts of sulfur dioxide to one part ofsulfur trioxide are emitted from fossil-fueledpower plants. Sulfur dioxide is a nonflam-mable, nonexplosive, colorless gas that mostpeople can taste at concentrations from 0.3ppm to 1 ppm in air. At concentrations above3 ppm the gas has a pungent, irritating odor.In the atmosphere, sulfur dioxide, an acid an-hydride, is partly converted to sulfur trioxideor to sulfuric acid and its salts by photo-chemical or catalytic processes. Sulfur tri-oxide is immediately converted to sulfuricacid in the presence of moisture. Laboratoryand field investigations have shown that theoxidation of sulfur dioxide may proceed byseveral types of mechanism including (1) ho-mogeneous gas phase reactions, (2) homoge-neous catalysis in liquids, (3) heterogeneousgas-solid interactions, and (4) heterogeneousgas-liquid interactions. The predominantmechanism and the degree of oxidation aredetermined by a number of factors, includingthe concentration, the residence time in theatmosphere, the temperature, the humidity,the intensity and spectral distribution of in-cident radiation, and the presence of otherpollutants such as metal oxides, hydro-carbons, and oxides of nitrogen.
Visibility in the atmosphere is reduced bythe scatter and absorption of visible radiationby small particles in the size range from0.1p, to 1p, in radius. This phenomenon is alsodescribed in Chapter 3 of a companion docu-ment, Air Quality Criteria for ParticulateMatter. The attenuation of light from an ob-ject and the illumination of the air betweenthe object and the observer reduce the con-trast of object and hence reduce its visi-bility. Of the total suspended particulatematter in urban air, about 5 percent to 20percent consists of sulfuric acid and othersulfates, and generally 80 percent or more ofthese particles by weight are smaller than 1II radius. Suspended sulfates in the air con-sequently are very effective in reducing vis-ibility.
The contribution of sulfuric acid mist andother suspended sulfates to the total scatter-ing of light and therefore to reduced visibilitycan be estimated from data on the concentra-tion and particle size distribution. Generally,a good correlation exists between the con-

centrations of sulfuric acid or sulfate and theconcentrations of sulfur dioxide. Increasesin the humidity result in increases in theratio of sulfuric acid to sulfur dioxide, ac-companied by a shift of the mass median di-ameter of sulfuric acid droplets towardlarger sizes and an increase of sulfuric acidconcentration in the size range characteristicof acid fogs. Since correlations between sul-fur dioxide levels and suspended particu-late matter can be found, it is possible for agiven relative humidity to estimate the vis-ibility from the sulfur dioxide concentration.The relationship between the visual range,which is the greatest distance a black objectmay be seen when viewed against the sky atthe horizon, and the sulfur dioxide concentra-tion is shown in Figure 1-5 for a ratio ofconcentrations of sulfur dioxide and particu-late matter typical of New York City (1964-1965) .
I. REFERENCES
1. Brasted, R. C. "Comprehensive InorganicChemistry." Vol. 8, D. Van Nostrand Co., Inc.,Princeton, N. J., 1961, 306 pp.
2. Moeller, T. "Inorganic Chemistry." John Wileyand Sons, Inc., New York, 1953, 966 pp.
3. Jacobs, M. B. "Methods for the Differentiationof Sulfur-Bearing Components of Air Contami-nants." In: Air Pollution, L. C. McCabe (ed.),McGraw-Hill, New York, 1952, pp. 201-209.
4. Amdur, M. 0. "Report on Tentative AmbientAir Standards for Sulfur Dioxide and SulfuricAcid." Ann. Occup. Hyg., Vol. 3, pp. 71-83.
5. Patty, F. A. (ed.) "Industrial Hygiene andToxicology. Vol. II. Toxicology." D. W. Fas-sett and D. D. Irish (eds.), Interscience Pub.,Inc., New York, 1963, pp. 831-2377.
6. McCord, C. P. and Witheridge, W. M. "Odors,Physiology and Control." McGraw-Hill, NewYork, 1949, 53 pp.
7. Bienstock, D., Brunn, L. W., Murphy, E. M., andBenson, H. E. "Sulfur DioxideIts Chemis-try and Removal from Industrial Waste Gases."U.S. Bureau of Mines, Information Circular7836, 1958, 22 pp.
8. Gilbert, E. E. "The Reactions of Sulfur Tri-oxide and of its Adducts, with Organic Com-pounds." Chem. Rev., Vol. 62, pp. 549-589, 1962.
9. Gerhard, E. R. and Johnstone, G. F. "Photo-chemical Oxidation of Sulfur Dioxide in Air."Ind. Eng. Chem., Vol. 47, pp. 972-976, May 1955.
10. Junge, C. E. and Ryan, T. "Study of the SOOxidation in Solution and its Role in Atmos-pheric Chemistry." Quart. J. Roy. Meteorol.Soc., Vol. 84, pp. 46-55, Jan. 1958.
11. Johnstone, H. F. and Coughanowr, D. R. "Ab-sorption of Sulfur Dioxide from Air. Oxidationin Drops Containing Dissolved Catalysts." Ind.Eng. Chem., Vol. 50, pp. 1169-1172, 1958.
12. Bracewell, J. M. and Gall, D. "The CatalyticOxidation of Sulfur Dioxide in Solution at Con-centrations Occurring in Fog Droplets." Pro-ceedings Symposium on the Physico-chemicalTransformation of Sulfur Compounds in theAtmosphere and the Formation of Acid Smogs.Organization for Economic Cooperation and De-velopment, Mainz, Germany, June 1967.
13. Van Den Heuvel, A. P. and Mason, B. J. "TheFormation of Ammonium Sulfate in Water Drop-lets Exposed to Gaseous Sulfur Dioxide andAmmonia." Quart. J. Roy. Meteorol. Soc., Vol.89, pp. 271-275, April 1963.
14. Smith, B. M., Wagman, J., and Fish, B. R. "In-teraction of Airborne Particles with Gases."Presented at Symposium on Colloid and SurfaceChemistry in Air and Water Pollution, 156thNational Meeting of American Chemical Society,Atlantic City, New Jersey, September 11, 1968.Submitted for publication in Environmental Sci-ence and Technology, 1968.
15. Liberti, A. and Devitofrancesco, G. "Evaluationof Sulfur Compounds in Atmospheric Dust."Proceedings of the Symposium on the Physico-chemical Transformation of Sulfur Compoundsin the Atmosphere and the Formation of AcidSmogs. Organization for Economic Cooperationand Development, Mainz, Germany, June 1967.
16. Renzetti, N. A. and Doyle, G. J. "PhotochemicalAerosol Formation in Sulfur Dioxide-Hydrocar-bon Systems." Intern. J. Air Pollution, Vol. 2,pp. 327-345, June 1960.
17. Urone, P., Lutsep, H., Noyes, C. M., and Parcher,J. F. "Static Studies of Sulfur Dioxide Reac-tions in Air." Environ. Sci. Technol., Vol. 2, pp.611-618, 1968.
18. Shuck, E. A. and Doyle, G. J. "Photooxidationof Hydrocarbons in Mixtures Containing Oxidesof Nitrogen and Sulfur Dioxide." Air PollutionFoundation, San Marino, California, Report 29.
19. Doyle, G. J., Endow, N., and Jones, J. L. "SulfurDioxide Role in Eye Irritation." Arch. Environ.Health, Vol. 3, pp. 657-667, Dec. 1961.
20. Prager, M. J., Stevens, E. R., and Scott, W. E."Aerosol Formation from Gaseous Air Pollu-tants." Ind. Eng. Chem., Vol. 52, pp. 521-524,June 1960.
21. Johnston, H. S. and Dev Jain, K. "Sulfur Di-oxide Sensitized Photochemical Oxidation ofHydrocarbons." Science, Vol. 131, pp. 1523-1524,May 20, 1960.
22. Kopczynski, S. L. and Altshuller, A. P. "Photo-chemical Reactions of Hydrocarbons with SulfurDioxide." Intern. J. Air Water Pollution, Vol.6, pp. 133-135, March-April 1962.
23. Dainton, F. S. and Ivin, K. 3. "PhotochemicalFormation of Sulfinic Acids from Sulfur Diox-ide and Hydrocarbons." Trans. Faraday Soc.,Vol. 46, pp. 374-381, 1950.
15

24. Shuck, E. A. Doyle, G. J., and Endow, N. "AProgress Report on the Photochemistry of Pol-luted Atmospheres." Air Pollution Foundation,San Marino, California, Dec. 1960.
25. Endow, N., Doyle, G. J., and Jones, J. L. "TheNature of Some Model Photochemical Aerosols."J. Air Pollution Control Assoc., Vol. 13, pp. 141-147, April 1963.
26. Goetz, A. and Pueschel, R. F. "Basic Mecha-nisms of Photochemical Aerosol Formation."Atmos. Environ., Vol. 1, pp. 287-306, 1967.
27. Leighton, P. A. "Photochemistry 0f Air Pol-lution." Academic Press, New York, 1961,300 pp.
28. Altshuller, A. P. and Buffalini, J. J. "Photo-chemical Aspects of Air Pollution: A Review."Photochem. Photobiol., Vol. 4, pp. 97-146, 1965.
29. Stern, A. C. (ed.) "Air Pollution." 2nd edition,Vols. I and II, Academic Press, New York, 1968.
30. Calvert, J. G. and Pitts, J. N., Jr. "Photochem-istry." John Wiley and Sons, Inc., New York,1966, pp. 209-211.
31. Gartrell, F. E., Thomas, F. W., and Carpenter,S. B. "Atmospheric Oxidation of SO2 in Coal-Burning Power Plant Plumes." Am. hid. Hyg.Assoc. J., Vol. 24, pp. 113-120, March-April 1963.
32. Katz, M. "Photoelectric Determination of At-mospheric Sulfur Dioxide, Employing DiluteStarch-Iodine Solutions." Anal. Chem., Vol. 22,
pp. 1040-1047, 1950.33. Katz, M. "Sulfur Dioxide in the Atmosphere and
its Relation to Plant Life." Ind. Eng. Chem.,Vol. 41, pp. 2450-2465, Nov. 1949.
34. Commins, B. T. "Some Studies on the Synthesisof Particulate Acid Sulfate from the Productsof Combustion of Fuels and Measurement of theAcid in Polluted Atmospheres." Proceedings ofthe Symposium on the Physico-chemical Trans-formation of Sulfur Compounds in the Atmos-phere and the Formation of Acid Smogs, Or-ganization for Economic Cooperation and De-velopment, Mainz, Germany, June 1967.
35. Middleton, W. E. K. "Vision through theAtmosphere." Univ. of Toronto Press, Toronto,1952, 250 pp.
36. Roesler, J. F., Stevenson, H. J. R., and Nader,J. S. "Size Distribution of Sulfate Aerosols inthe Ambient Air." J. Air Pollution ControlAssoc., Vol. 15, pp. 576-579, 1965.
37. Ludwig, F. L. and Robinson, E. "Size Distribu-tion of Sulfur-Containing Compounds in UrbanAerosols." J. Colloid Sci., Vol. 20, pp. 571-584,1965.
38. Wagman, J., Lee, R. E., Jr., and Axt, C. J. "In-fluence of Some Atmospheric Variables on theConcentration and Particle Size Distribution ofSulfate in Urban Air." Atmospheric Environ-ment, Vol. 1, pp. 479-498, 1967.
39. Steffens, C. "Visibility and Air Pollution." In:Air Pollution Handbook, P. L. Magill, F. R.
16
Holden, and C. Ackley (eds.), McGraw-Hill, NewYork, 1956, pp. 6-1 to 6-43.
40. Robinson, E. "Effects of Air Pollution on Visi-bility." In: Air Pollution, 2nd edition, Vol. I,A. C. Stern (ed.), Academic Press, New York,1968, pp. 349-400.
41. Huschke, R. E. (ed.) "Glossary of Meteor-ology." American Meteorological Society, Boston,Massachusetts, 1959.
42. Lange, N. A. and Forker, G. M. (eds.) "Hand-book of Chemistry," 10th edition, McGraw-Hill,New York, 1961, 1969 pp.
43. Weast, R. C., Selby, S. M., and Hodgman, C. D.(eds.) "Handbook of Chemistry and Physics,"45th edition, The Chemical Rubber Co., Cleve-land, 1964, 1495 pp.
44. Tendorf, R. B. "New Table of Mie ScatteringFunctions. Part 6." Geophys. Res. Paper 45,Air Tone Cambridge Research Laboratory, Bed-ford, Massachusetts, AFCRC-TR-56-20416, 1956.
45. Waller, R. E. "Acid Droplets in Town Air." Int.J. Air Water Pollution, Vol. 7, pp. 773-778, Oct.1963.
46. Waller, R. E., Brooks, A. G. F., and Cartwright,J. "An Electron Microscope Study of Particlesin Town Air." Int. J. Air Water Pollution, Vol.7, pp. 779-786, Oct. 1963.
47. Bushtueva, K. A. "Ratio of Sulfur Dioxide andSulfuric Acid Aerosol in Atmospheric Air, inRelation to Meteorological Conditions." Gig. iSanit., Vol. 11, pp. 11-13, 1954. In: U.S.S.R.Literature on Air Pollution and Related Occu-pational Diseases. A Survey. Vol. 4. Trans-lated by B. S. Levine, U.S. Dept. of Commerce,Office of Technical Services, Washington, D.C.,Aug. 1960, pp. 193-196.
48. Bushtueva, K. A. "The Determination of theLimit of Allowable Concentration of SulfuricAcid in Atmospheric Air." In: Limits of Allow-able Concentrations of Atmospheric Pollutants.Book 3, 1957. Translated by B. S. Levine, U.S.Dept. of Commerce, Office of Technical Services,Washington, D.C., pp. 20-36.
49. Coste, J. H. "Investigation of Atmospheric Pol-lution." Cong. Int. Quim. Pura Aplicada (Ma-drid), Vol. 6, pp. 274-287, 1934.
50. Coste, J. H. and Courtier, G. B. "Sulfuric Acidas a Disperse Phase in Town Air." Trans. Fara-day Soc., Vol. 32, pp. 1198-1202, 1936.
51. Commins, B. T. "Determination of ParticulateAcid in Town Air." Analyst, Vol. 88, pp. 364-367, May 1963.
52. Thomas, M. D. "Sulfur Dioxide, Sulfuric AcidAerosol and Visibility in Los Angeles." Int. J.Air Water Pollution, Vol. 6, pp. 443-454, Nov. -Dec. 1962.
53. Charlson, R. J., Ahlquist, N. C., and Horvath, H."On the Generality of Correlation of AtmosphericAerosol Mass Concentration and Light Scatter."Atmospheric Environment, Vol. 2, pp. 455-464,1968.
Chapter 2
SOURCES AND METHODS OF MEASUREMENT OFSULFUR OXIDES IN THE ATMOSPHERE

Table of ContentsPage
A. INTRODUCTION . 19
B. SOURCES OF ATMOSPHERIC SULFUR OXIDES . 19
C. MEASUREMENT OF GASEOUS SULFUR DIOXIDECONCENTRATIONS 20
1. Sampling Techniques .. . 202. Colorimetric Method: Pararosaniline 213. Conductometric Methods ... . 214. Acid Titration Method: Hydrogen Peroxide . . 225. Spectroscopic Methods . . ..... 226. Other Methods . ....... . 237. Use and Comparison of Methods 23
D. MEASUREMENT OF SULFURIC ACID AND SULFATES 24E. OTHER METHODS OF MEASURING POLLUTION BY SULFUR
OXIDES 241. Sulfation Rates of Lead Peroxide Candles 242. Suspended Sulfate . 253. Sulfate in Dustfall 254. Sulfuric Acid Mist 25
F. SUMMARY 25
G. REFERENCES
List of Tables
27
Table
2-1 Atmospheric Sulfur Dioxide Emissions in 1963 and 1966 by Source .... 20
18

Chapter 2
SOURCES AND METHODS OF MEASUREMENT OF SULFUROXIDES IN THE ATMOSPHERE
A. INTRODUCTION
Oxidized sulfur in the atmosphere exists inseveral different chemical and physical forms.Under normal conditions, the predominantstate is gaseous sulfur dioxide, together withsmaller amounts of non-volatile sulfuric acidmist or sulfate salts.
Since the proper and efficient establish-ment of criteria and standards ultimately de-pends upon reliable analytical data, it is par-ticularly important that proper attention begiven to (1) the sampling techniques, and(2) the analytical procedures employed.These have been reviewed recently by Hend-rickson 1 and Katz."
If gaseous sulfur dioxide were the sole pol-lutant in the atmosphere, its quantitativedetermination, even in the fractional ppmrange, would not be unduly difficult. Thepresence of both sulfuric acid mist and sul-fate salts adds complications to the analyticalprocedures. These are further complicated byreal or potential interferences from a varietyof additional air pollutants often found inconjunction with sulfur dioxide.
Some of the methods used for determiningSO2 are specific, while others are general anddepend on a general property such as acidityor conductivity and are subject to errors be-cause of interferences. This has led to someproblems in the interpretation of analysesfrom different laboratories using differenttechniques.
In the following discussion, the man-madesources of atmospheric oxides of sulfur willbe outlined, and the more important methodsof their determination, including recent tech-niques involving remote sensing of SO., willbe discussed.
Agreement between the various methodsof measurement is not always good, becauseeach method is subject to interference fromdiffering causes which may lead to eitherhigh or low results.
Sulfuric acid mist is determined by theseparation of the mist from sulfur dioxideand the subsequent measurement of the acidor of the sulfate content. Measurements ofsuspended particulate sulfate and sulfate industfall are obtained by means of conven-tional sulfate determinations.
B. SOURCES OF ATMOSPHERICSULFUR OXIDES
Sulfur dioxide pollution results primarilyfrom the combustion of fossil fuels, the re-fining of petroleum, the smelting of ores con-taining sulfur, the manufacture of sulfuricacid, the burning of refuse, paper making,and the burning or smoldering of coal refusebanks. In all of these processes, a smallamount of sulfur trioxide or sulfuric acidalso is emitted. Sulfur trioxide is normallypresent in the atmosphere in extremely smallconcentrations because it is converted tosulfuric acid soon after its entry into the at-mosphere.
Specific reviews covering the coal industry,petroleum refineries, fuel oil combustion,burning coal mine refuse banks, sulfuric acidmanufacture, the iron and steel industry, andsulfite pulping have been published.3-12Sources of sulfur oxides in the atmospherealso have been reviewed by Rohrman andLudwig.'"
Of considerable importance to the meteor-ological and chemical behavior of sulfuroxides in the atmosphere, as well as to their
19
measurement, are the kinds of emitters,whether large or small and whether disperseor point sources. The trend of operations hasbeen away from sulfur dioxide pollution bylow-level disperse sources and toward largepoint sources, except for space heating anddiesel trucks using fuels of high sulfur con-tent. The large source emissions containlower concentrations of polynuclear hydro-carbons and higher concentrations of nitro-gen oxides and sulfuric acid. Particulate mat-ter which interacts with the oxides of sulfurcan be controlled to a greater extent whenemitted from the larger sources. Further,emissions from large sources usually areemitted from higher stacks and although thispractice appears to reduce average groundlevel concentrations and the frequency of airpollution episodes, 9 10 14-17 it may result inearly morning fumigations.
Sources of atmospheric sulfur oxides canbe considered from the viewpoint of theirannual production. Obviously, sulfur-contain-ing coal and fuel oil utilized for heating dur-ing the winter will produce a seasonal in-crease in atmospheric SO,. This is in contrastwith industrial sources, such as power sta-
tions and factories, whose effluents are moreor less constant throughout the year.
Major sources of sulfur dioxide released tothe atmosphere in 1963 " and in 196618 arepresented in Table 2-1.
C. MEASUREMENT OF GASEOUSSULFUR DIOXIDECONCENTRATIONS
1. Sampling Techniques
Before discussing specific analytical meth-ods, it is important to recognize that regard-less of how accurate the technique may be,the validity of the final results is dependentupon the sampling technique employed forthe determination. For example, considera-tion must be given to factors such as adsorp-tion on, and desorption from, inlet tubes uti-lized in the sampling apparatus.19 Teflon *,Tygon *, glass, stainless steel and aluminumhave been tested for various lengths and flowrates; in general, a conditioning period is re-
* Mention of commercial products does not constituteendorsement by the National Air Pollution ControlAdministration.
Table 2-1.ATMOSPHERIC SULFUR DIOXIDE EMISSIONS IN 1963 AND 1966 BY SOURCE
Sulfur dioxide a
ProcessTons
1963
Percent oftotal
emissions
1966
TonsPercent of
totalemissions
Burning of coal:Power generation (211,189,000 tons, 1963 data) 9,580,000 41.0 11,925,000 41.6.Other combustion (112,630,000 tons, 1963 data) 4,449,000 19.0 4,700,000 16.6
Subtotal 14,029,000 60.0 16,625,000 58.2Combustion of petroleum products:
Residual oil 3,703,000 15.9 4,386,000 15.3Other products 1,114,000 4.8 1,218,000 4.3
Subtotal 4,817,000 20.7 5,604,000 19.6Refinery operations 1,583,000 6.8 1,583,000 5.5Smelting of ores 1,735,000 7.4 3,500,000 12.2Coke processing 462,000 2.0 500,000 1.8Sulfuric acid manufacture 451,000 1.9 550,000 1.9Coal refuse banks 183,000 0.8 100,000 0.4Refuse incineration 100,000 0.4 100,000 0.4
Total Emissions 23,360,000 100.0 28,562,000 100.0
a A small amount of this tonnage is converted to sulfuric acid mist before discharge to the atmosphere.The rest is eventually oxidized and/or washed out. Only under unusual meteorologic conditions (Chapter 3)does accumulation occur. The increasing output of sulfur oxides due to increasing power demand is evident.
20

quired by Tygon and aluminum tubing. Forrelatively high flow rates (28.3 1/min) , alu-mina required a conditioning period of about5 hours at 0.2 ppm and Tygon required amuch longer period and should be avoided.Neither adsorption nor desorption was sig-nificant in glass or stainless steel tubing atvarious flow rates for tubing lengths as greatas 30.5 meters. Teflon tubing falls into thissame class. Any of these three materials canbe used for sampling sulfur dioxide at suffi-ciently high flow velocities (greater than 3.7m/sec) without prior conditioning and with-out effect by temperature or humidity.
Both continuous and intermittent samplingare commonly used for sulfur dioxide. To alarge extent the type of instrument selectedis dependent upon the measurement principledesired. The West-Gaeke and the Conducto-metric methods are most commonly employedin the United States. Many agencies in thecountry use intermittent or manual samplingwhere the collected sample is returned to thelaboratory for analysis. Intermittent samp-ling can be used to provide integrated samplesof from 1 hour to 24 hours and is less expen-sive than continuous monitoring. Continuousmonitoring is necessary where it is importantto show diurnal changes or the influence oflocal sources and meteorology.
2. Colorimetric Method: Pararosaniline
In the West-Gaeke method, sulfur dioxideis absorbed in dilute aqueous sodium tetra-chloromercurate to form the nonvolatiledichlorosulfitomercurate ion, which thenreacts with formaldehyde and bleached para-rosaniline to form red-purple pararosanilinemethylsulfonic acid. This reaction is specificfor sulfur dioxide and sulfite salts. The colorintensity of the dye, which is proportional tothe concentration of sulfur dioxide, is meas-ured at a wavelength of 560 mt,t. The methodcan be used to determine concentrations inthe air from 0.002 ppm to 5 ppm. Ozone andnitrogen dioxide reduce the apparent concen-tration by destroying some of the dye,although interference by nitrogen dioxide canbe eliminated by adding sulfamic acid aftersample collection or just prior to analysis.Heavy metal salts, especially iron salts,oxidize dichlorosulfitomercurate, which also
results in a lowering of the apparent sulfurdioxide concentration. This effect can beeliminated by a membrane prefilter or byincluding the disodium ethylenediaminete-traacetic acid in the absorbing reagent tosequester metallic ions. Hydrogen sulfideprecipitates mercuric sulfide from the collect-ing reagent, and such a precipitate must beremoved by centrifugation from the samplebefore proceeding with color development.
Recently two improved West-Gaeke (para-rosaniline) methods were developed for thedetermination of sulfur dioxide in ambientair.2') These give greater sensitivity andreproducibility, as well as adherence to Beer'sLaw throughout a greater working range,than does the original West-Gaeke method.The improvements resulted from optimiza-tion of several important parameters. Speci-fically the pararosaniline dye was purifiedand standardized to reduce variability.Phosphoric acid was used in the final colordevelopment to control pH. The pararosani-line methylsulfonic acid produced in the reac-tion exhibits a hypsochromic spectral shiftwith increasing pH. Hence the reaction pro-duct behaves as a two-color pH indicator, andregardless of the pH condition under whichthe reaction is carried out, the spectra can beinterchanged by addition of acid or base. Thesharp peak with an absorbance maximum atA = 548 mt,t (rose-red) at the higher pH value(1.68) shifts to A = 575 mt,t (magenta) at alower pH value (1.02) . Interferences fromnitrogen oxides, ozone, and heavy metals areminimal, and laboratory results are repro-ducible to within 4.9 percent (at 95 percentconfidence level) if recommended precautionsare taken. It is noted that these modifications,although specifically developed for sulfurdioxide in the atmosphere, can be applied todetermination of sulfite in other materials.This method has been adopted as the standardor reference method by the NAPCA,
3. Conductometric Methods
The basis of these methods is the oxidationof sulfur dioxide to sulfuric acid by aqueoushydrogen peroxide, and the subsequentmeasurement of the increased electrical con-ductivity of the solution. This is a generaltechnique and one must take special precau-
21

tions to eliminate other pollutants whichcould affect the conductivity of the solution.For example, acidic gases such as the hydro-gen halides will increase the conductivity ofthe solution so that, in the presence of suchgases, incorrectly high SO2 values will beindicated. Weakly acidic gases such as hydro-gen sulfide cause practically no intereferencebecause of their slight solubility and poorconductivity, and nitrogen dioxide producesminimum interference because it is poorlyabsorbed. Sulfuric acid mist is not efficientlycollected in the usual gas "scrubber" andtherefore is not measured. Salt spray fromice and snow control may give high readings.Ammonia interferes with electroconductivitymeasurements by neutralizing the acid andforming the ammonium ion which has a hightransport number of the opposite charge.
2NH3 +Ammonia
H,SO4> (NH4) ,SO4 (2-1)Sulfuric Ammonium
Acid Sulfate
Conductivities that are too low are thenrecorded, since the transport number of allother cations is several times less than that ofthe hydrogen ion.
Conductometric methods can be automatedreadily so that one can obtain instantaneousreadings. Air is drawn through either acidichydrogen peroxide solution or through deion-ized water, and the sulfur dioxide concentra-tion is estimated from the conductivity of thefinal solution. The interference effects ofvarious gases on the conductivity have beendescribed. 21 22
4. Acid Titration Method: HydrogenPeroxide
In this method, the air sample is bubbledthrough 0.03N hydrogen peroxide solutionadjusted to pH 5. Any sulfur dioxide presentforms sulfuric acid, which is then titratedwith standard alkali. The presence of otheracidic gases in the sample will lead to erron-eously high results, and alkaline gases or re-active basic solids give erroneously low re-sults. Generally, a filter is placed in front ofthe sampling bottle so that no particulatematter or other aerosols are absorbed in the
22
hydrogen peroxide solution. It is importantthat this be an efficient filter.
This technique is straightforward and theapparatus is inexpensive. It may be auto-mated, if desired. Often, it is used to obtain24-hour averages, particularly in Europe,where it is widely employed as the standardapparatus and procedure.
5. Spectroscopic Methods
In addition to techniques for making "on-the-spot" analyses for atmospheric sulfurdioxide, it would be a great advantage to haveadditional methods by which atmosphericconcentrations of SO2 could be determinedby means of an instrument remote from theemission source or from the actual air massbeing investigated. Recently, there have beendeveloped several spectroscopic techniqueswhich provide such remote sensing capability.Two of the most important are the multiplescan infrared interference spectrometer andthe correlation spectrometer. Such instru-mentation, though expensive, yields data ina uniquely useful form for a variety of appli-cations.
A commercial model of a multiple-scan in-frared interference spectrometer has beendeveloped by Block Engineering Corpora-tion* and its utilization in the field has beendiscussed by Low.23 With this instrument,remote detection of SO, and CO, in the stackeffluent of a power plant has been reported byLow and Clancy.-4
A correlation spectrometer mounted in anairplane recently has been used by Barringerand associates to estimate atmospheric sulfurdioxide "contours" for several U.S. cities.25-"The instrumental technique utilizes sunlightreflected from the earth's surface as a "lightsource" and, in a sophisticated fashion, meas-ures the absorption of this reflected solar ra-diation by the sulfur dioxide in the air. Themethod depends on the fact that sulfur diox-ide has a clearly structured absorption spec-trum in the region near 3100A and it gives
* Mention of commercial products does not constituteendorsement by the National Air Pollution ControlAdministration.

the total sulfur dioxide concentration in the"line of sight" of the spectrometer. Whilework to date has been carried out primarilyfrom aircraft, correlation spectrometry neednot be limited to airborne applications.
6. Other Methods
The earliest methods for determining sul-fur dioxide were based on its ability to reducea starch-iodine solution. This method wasconsidered to be reasonably accurate in therange 0.8 ppm to 3 ppm and it later wasmodified to cover the range 0.1 ppm to 60ppm. This method has now been automated.2sThese and other methods are discussed byKatz." He also reported a method of measur-ing the titratable acidity of the air by absorb-ing acid components in a water solution ofhyperol, a compound formed by reacting hyd-rogen peroxide with urea. The oxidizable acidcomponents react with the peroxide.
Sulfur dioxide can be determined by a fuch-sin-formaldehyde method reviewed by Hoch-heiser 3" and reported by Alekseeva and Sam-orodiva." The sample is collected in 0.1Nsodium hydroxide in glycerol-water solution.Another procedure, reported by Bushtueva,"made use of collection in a potassium chloratesolution. The method of analysis was not stat-ed, but it probably was by nephelometricanalysis of barium sulfate or turbidimetricanalysis of lead sulfate. Lyubimov 3" describ-ed a monitoring instrument in which sulfurdioxide is absorbed in a solution of bariumchloride, and light transmission through theturbid solution, inversely related to the sulfurdioxide concentration, is recorded.
A further method for determining ozoneand sulfur dioxide has been reported recent-ly." The measurement principle involves lib-eration of iodine by ozone from an iodidesolution in one channel of the analyzer andthe consumption of iodine by sulfur dioxidein a second analyzer channel.
7. Use and Comparison of Methods
The hydrogen peroxide acid titration meth-od or an automatic conductometric versionof the same method is used most frequentlyin Europe; in the United States, the colori-metric pararosaniline and automated conduc-
tometric (using either acidified peroxide ordeionized water) methods are used most fre-quently.
The values obtained by the various methodsof measuring gaseous sulfur dioxide in ambi-ent air may not always correlate well withone another, since they do not measure thesame thing and because interfering substan-ces are present in varying amounts from timeto time and from place to place. It is gener-ally assumed that sulfur dioxide is the majorconstituent in air that will respond to any ofthe methods discussed; that the assumptionmay not be entirely valid is shown in somerecent studies.""
Recently the conductivity and colorimetricpararosaniline techniques have been evalu-ated in depth,41 12 and others have reportedon comparisons between the methods.41 46 Inone study, no consistent relationship betweenthe two measurements was found, althoughthe conductometric method usually gave high-er values.44
There is evidence that hydrochloric acidmay contribute significantly to the values ob-tained by the hydrogen peroxide method inEngland, but this may not be true for cer-tain sections of the United States because ofthe negligible amounts of chloride found inthe coal burned.43-4'
Recently a flame photometric instrumentwas reported for the detection of total sulfurcompounds in the atmosphere." The instru-ment is based on the principle that when sul-fur compounds in air are introduced into ahydrogen-rich flame, they emit light between300 mti to 425 nip. A photomultiplier tubelooks at the light of wavelength 394 intithrough a narrow-band optical filter. Thequantity of light is proportional to the con-centration of sulfur compounds. This instru-ment is readily automated for continuousmonitoring.
Several commercial instruments are alsoavailable which are based on coulometry.These instruments measure the reducingproperties of sulfur dioxide and, with theuse of a suitable scrubber, can provide rela-tively specific and continuous measurementsof sulfur dioxide. The principle of this methodinvolves the titration of sulfur dioxide byelectrogenerated bromine or iodine.
23

D. MEASUREMENT OF SULFURIC ACIDAND SULFATES
These forms of sulfur are always found inthe particulate phase in polluted air, either assuspended matter which can be removed byspecial measurement techniques or in dust-fall. The acidity may be measured by titra-tion or by a related procedure; alternatively,sulfate ion may be measured (frequently byconversion to the insoluble barium salt) .
Since the particle size is very small, the ini-tial collection of the sample requires specialtechniques. Any technique for separatingparticulate matter from air may be used, butfiltration and impaction usually have beenemployed.
A system capable of filtering 50 cubic feetto 60 cubic feet of air in 1 hour throughWhatman No. 4 filter paper (1-inch diam-eter) that had previously been washed withdistilled water until the washing had a pHof 7 ± 0.10, is described by Mader.5° The testfilter holding the pollutants was maceratedin 20 ml of distilled water, and the pH of theresulting solution was determined. Total acid-ity (sulfuric acid) was determined by titra-tion of 0.002N sodium hydroxide to an endpoint equivalent to the pH of carbon-dioxide-free distilled water and corrected by a blankdetermination.
Commins 51 has described a method inwhich sulfuric acid in the air was collected byfiltering air through Whatman No. 1 filterpaper. The amount of acid was determinedby immersing the collected sample in a knownexcess of 0.01N sodium tetraborate in deion-ized water of pH 7 and titrating back to pH7 with 0.01N sulfuric acid.
Sulfuric acid aerosol has been collected byimpaction or filtration to separate sulfuricacid from sulfur dioxide.52 The acid is decom-posed at controlled temperatures under anitrogen stream, and the liberated sulfur tri-oxide is then reduced with hot copper to sul-fur dioxide. Sulfur dioxide is determinedspectrophotometrically, coulometrically, or byflame photometry. The method measures sul-furic acid in the presence of 10 to 100 timesas much sulfur dioxide and inert sulfates.Ammonium sulfate, a primary lung irritant,is also measured as sulfuric acid; however,this sulfate probably originates in the atmos-
24
phere from the reaction of sulfuric acid andammonia. The sensitivity is in the parts perbillion range using 1 m3 of air as a sample.DuBois has described a method in which sul-furic acid is collected on glass fiber filters andtitrated following thermal separation at 200°C in a nitrogen atmosphere. This methodmeasures free sulfuric acid and does not in-clude ammonium sulfate or sulfuric acidwhich reacts with particles on the filter.
E. OTHER METHODS OF MEASURINGPOLLUTION BY SULFUR OXIDES
1. Sulfation Rates of Lead Peroxide Candles
A method for measuring sulfation involvesuse of the lead peroxide "candle." A pastemade of lead peroxide in a gum tragacanthsolution is applied to a cotton gauze wrappedaround a glass or porcelain form; the productis the lead peroxide candle. The candle isexposed to the ambient air in a louvered shel-ter for an extended period of time, usually amonth, and the lead sulfate formed in thecandle is then determined. It is abvious thatthe method cannot give any information onshort-term variations in sulfur oxides pollu-tion levels and that it is only an empiricalestimate of the average concentration. Themethod measures sulfuric acid, hydrogen sul-fide, and other sulfur-containing compoundswhich can form sulfate. In spite of these limi-tations, sulfation measurements have corre-lated well with data on biological effects andthe deterioration of materials.
A small, dish-type lead peroxide measuringdevice termed a "sulfation plate," which canbe exposed without a protective shelter, hasbeen described.53 The plates are more reac-tive than candles, and it is proposed that ex-posure periods could be shortened to 1 daywith more sensitive analytical methods. Tur-bidimetric determination of sulfate wasfound, not unexpectedly, to be less time-con-suming than gravimetric analysis, thoughnot as accurate.
The primary application of the lead perox-ide candle is for mapping sulfur pollution ina given area as related to sources and meteor-ology. It is convenient since a simple shelterrequiring no electrical power is used. A major

problem with the lead peroxide candle is thatresults are influenced by wind movement andhumidity. Another major drawback to thelead peroxide candle is that the laboratorypreparation and analysis is quite time con-suming. The cost of preparing and analyzinga lead peroxide candle is approximately thesame as for collecting and analyzing a 24-hour integrated sulfur dioxide sample by theWest-Gaeke procedure. Also, the lead perox-ide candle provides intelligence on the oxi-dizable sulfur compounds in the atmospherewhich seldom can be directly related to sulfurdioxide. It has been observed that in manycases monthly averages of sulfur dioxide riseand fall somewhat parallel to monthly sulfa-tion values.
Sulfation rates in United States cities havebeen observed to range from a few hun-dredths of a milligram to about 8 mg of sul-fur trioxide per 100 cm2 of exposed lead per-oxide candle surface per day (mg S03/100cm2-day) .35-37 55
2. Suspended Sulfate
Sulfate (sulfuric acid and sulfate salts) insuspended particulate matter has been exten-sively measured for a number of years by theNational Air Surveillance Networks.48 56Sulfates are extracted from the particulatematter on the glass fiber filter by refluxingwith distilled water. Sulfate in the extract isdetermined by the methyl thymol blue auto-mated method or by the turbidimetricmethod. The maximum 24 -hmir average con-centration estimated from 2,197 samplescollected over the years 1957 to 1960 is 94p. g/m3, and the national average for thisperiod is 11.8 µg /m3. There is considerablegeographic variation. The observed averageconcentrations of 18.8 µg /m3, 15.0 µg /m3,14.5 µg /m3, and 13.3 µg /m3 occur in the Mid-Atlantic, Midwest, Mideast, and New Eng-land areas, respectively. Lower average con-centrations of 10.7 µg /m3, 9.0 µg /m3, 8.7µg /m3, 7.4 µg /m3, and 5.8 µg /m3 have beenobserved in the Southeast, Pacific coast,Great Plains, Gulf south, and Rocky Moun-tain areas, respectively. As with sulfur diox-ide, the highest concentrations occur mostfrequently in the fall and winter months.
3. Sulfate in Dustfaii
The register of Air Pollution Analyses 56lists only four organizations which havemeasured and reported sulfate in dustfall inthe United States. This measure may be ex-pressed either as percent sulfate in total dust-fall or as tons of sulfate per square mile permonth. In a southwestern city, where 32 col-lecting stations were used, sulfate averaged10.8 percent of the total dustfall, or 15.5tons /mil -month over a 3-month period. In anorthwestern city, sulfate averaged 27 per-cent of the total dustfall, or 7.4 tons/mi2-month, which is similar to the 32 percent ofthe total dustfall and 7.8 tons/mile2-monthobserved in a New England town.54 57-56
4. Sulfuric Acid Mist
Few attempts have been made to measuresulfuric acid mist in the United States. Con-centrations measured in Los Angeles aver-age about 25 µg /m3, and a high concentra-tion of 50 µg /m3 has been observed.5° 60 61 InChicago, during the months of November andDecember 1964, the average for the hours 10a.m. to 4 p.m. was 9.2 µg /m3.62
F. SUMMARY
In 1966, an estimated 28.6 million tons ofsulfur dioxide were emitted to the atmos-phere, as compared with 23.4 million tons in1963. The principal share, i.e., 58.2 percent,came from the combustion of coal, most ofwhich was used to generate electrical power.The combustion of residual fuel oil and otherpetroleum products accounted for 19.6 per-cent of the total, while the remainder camefrom the refining of petroleum (5.5 percent),the smelting of sulfur-containing ores (12.2percent) , the manufacturing of sulfuric acid(1.9 percent) , the burning of refuse (0.4 per-cent), and the burning or smoldering of coalrefuse banks (0.4 percent) . Paper-makingand some other industrial operations alsocontributed minor amounts to the total. In allof these processes, small amounts of sulfurtrioxide or sulfuric acid are emitted also.
In the United States, the two most com-mon methods of measurement are the color-metric West-Gaeke (pararosaniline) and the
25
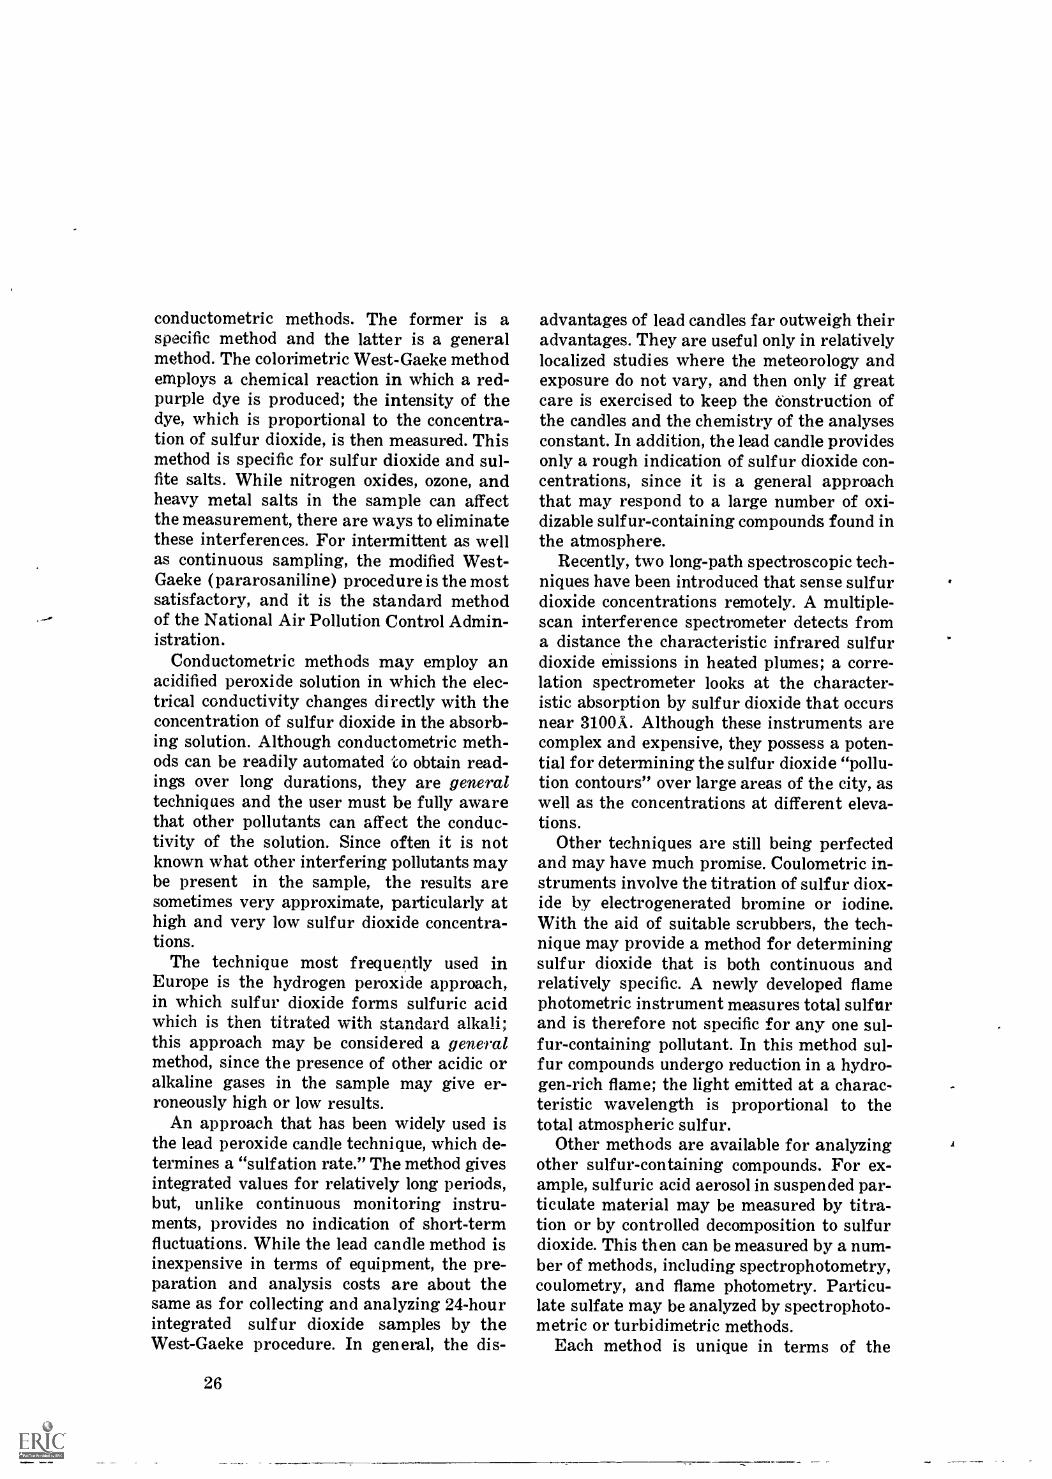
conductometric methods. The former is aspecific method and the latter is a generalmethod. The colorimetric West-Gaeke methodemploys a chemical reaction in which a red-purple dye is produced; the intensity of thedye, which is proportional to the concentra-tion of sulfur dioxide, is then measured. Thismethod is specific for sulfur dioxide and sul-fite salts. While nitrogen oxides, ozone, andheavy metal salts in the sample can affectthe measurement, there are ways to eliminatethese interferences. For intermittent as wellas continuous sampling, the modified West-Gaeke (pararosaniline) procedure is the mostsatisfactory, and it is the standard methodof the National Air Pollution Control Admin-istration.
Conductometric methods may employ anacidified peroxide solution in which the elec-trical conductivity changes directly with theconcentration of sulfur dioxide in the absorb-ing solution. Although conductometric meth-ods can be readily automated to obtain read-ings over long durations, they are generaltechniques and the user must be fully awarethat other pollutants can affect the conduc-tivity of the solution. Since often it is notknown what other interfering pollutants maybe present in the sample, the results aresometimes very approximate, particularly athigh and very low sulfur dioxide concentra-tions.
The technique most frequently used inEurope is the hydrogen peroxide approach,in which sulfur dioxide forms sulfuric acidwhich is then titrated with standard alkali;this approach may be considered a generalmethod, since the presence of other acidic oralkaline gases in the sample may give er-roneously high or low results.
An approach that has been widely used isthe lead peroxide candle technique, which de-termines a "sulfation rate." The method givesintegrated values for relatively long periods,but, unlike continuous monitoring instru-ments, provides no indication of short-termfluctuations. While the lead candle method isinexpensive in terms of equipment, the pre-paration and analysis costs are about thesame as for collecting and analyzing 24-hourintegrated sulfur dioxide samples by theWest-Gaeke procedure. In general, the dis-
26
advantages of lead candles far outweigh theiradvantages. They are useful only in relativelylocalized studies where the meteorology andexposure do not vary, and then only if greatcare is exercised to keep the construction ofthe candles and the chemistry of the analysesconstant. In addition, the lead candle providesonly a rough indication of sulfur dioxide con-centrations, since it is a general approachthat may respond to a large number of oxi-dizable sulfur-containing compounds found inthe atmosphere.
Recently, two long-path spectroscopic tech-niques have been introduced that sense sulfurdioxide concentrations remotely. A multiple-scan interference spectrometer detects froma distance the characteristic infrared sulfurdioxide emissions in heated plumes; a corre-lation spectrometer looks at the character-istic absorption by sulfur dioxide that occursnear 3100A. Although these instruments arecomplex and expensive, they possess a poten-tial for determining the sulfur dioxide "pollu-tion contours" over large areas of the city, aswell as the concentrations at different eleva-tions.
Other techniques are still being perfectedand may have much promise. Coulometric in-struments involve the titration of sulfur diox-ide by electrogenerated bromine or iodine.With the aid of suitable scrubbers, the tech-nique may provide a method for determiningsulfur dioxide that is both continuous andrelatively specific. A newly developed flamephotometric instrument measures total sulfurand is therefore not specific for any one sul-fur-containing pollutant. In this method sul-fur compounds undergo reduction in a hydro-gen-rich flame; the light emitted at a charac-teristic wavelength is proportional to thetotal atmospheric sulfur.
Other methods are available for analyzingother sulfur-containing compounds. For ex-ample, sulfuric acid aerosol in suspended par-ticulate material may be measured by titra-tion or by controlled decomposition to sulfurdioxide. This then can be measured by a num-ber of methods, including spectrophotometry,coulometry, and flame photometry. Particu-late sulfate may be analyzed by spectrophoto-metric or turbidimetric methods.
Each method is unique in terms of the

measuring time resolution, the costs, the skilland time required for the analysis, and thekinds of pollutants which may cause inter-ference and thus impair the accuracy of theresults. The techniques selected, therefore,are usually a compromise. Moreover, a singleprogram often will make use of both generaland specific methods. In selecting a technique,it is especially important to consider the de-gree to which the resulting data can be con-verted for comparison with results obtainedfrom other instruments and at other timeperiods.
G. REFERENCES
1. Hendrickson, E. R. "Air Sampling and Quan-tity Measurement." Air Pollution, 2nd edition,Vol. II, A. C. Stern (ed.), Academic Press, NewYork, 1968, pp. 3-52.
2. Katz, M. "Analysis of Inorganic Gaseous Pol-lutants." Air Pollution, 2nd edition, Vol. II,A. C. Stern (ed.), Academic Press, New York,1968, pp. 53-114.
3. Smith, W. S. "Atmospheric Emission from FuelOil Combustion." U.S. Dept. of Health, Educa-tion, and Welfare, Public Health Service, PHS-Pub-999-AP-2, Nov. 1962.
4. "Atmospheric Emissions from Petroleum Refin-eries." U.S. Dept. of Health, Education, andWelfare, Public Health Service, PHS-Pub-763,1960.
5. Schueneman, J. J., High, M. D., and Bye, W. E."Air Pollution Aspects of the Iron and SteelIndustry." U.S. Dept. of Health, Education, andWelfare, Public Health Service, PHS-Pub-999-AP-1, June 1963.
6. Smith, W. S. and Gruber, C. W. "AtmosphericEmissions from Coal Combustion. An Inven-tory Guide." U.S. Dept. of Health, Education,and Welfare, Public Health Service, PHS-Pub-999-AP-24, 1966.
7. "Atmospheric Emissions from Sulfuric AcidManufacturing Processes." Cooperative StudyProject Manufacturing Chemists' Association,Inc., and U.S. Public Health Service, PHS-Pub-999-AP-13, 1965.
8. Stahl, R. W. "Survey of Burning Coal-MineRefuse Banks." U.S. Bureau of Mines, Infor-mation Circular 8209, 1964.
9. Hangebrauck, R. P., von Lehmden, D. J., andMeeker, J. E. "Emissions of Polynuclear Hy-drocarbons and Other Pollutants from Heat-Generation and Incineration Processes." J. AirPollution Control Assoc., Vol. 14, pp. 267-278,July 1964.
10. Cuffe, S. T., Gerstle, R. W., Orning, A. A., andSchwartz, C. H. "Air Pollutant Emissions fromCoal-Fired Power Plants, Report 1." J. Air Pol-lution Control Assoc., Vol. 14, pp. 353-362, Sept.1964.
11. Hendrickson, E. R. (ed.) "Proceedings Confer-ence on Atmospheric Emissions from SulfitePulping." Sanibel Island, April 28, 1966.
12. Cuffe, S. T. and Gerstle, R. W. "Emissions fromCoal-Fired Power Plants: A ComprehensiveSummary." U.S. Dept. of Health, Education, and
Welfare, Public Health Service, PHS-Pub-999--AP-35, 1967.
13. Rohrman, F. A. and Ludwig, J. H. "Sources ofSulfur Dioxide Pollution." Chem. Eng. Prog.,Vol. 61, pp. 59-63, Sept. 1965.
14. Engdahl, R. B. "Combustion in Furnaces, In-cinerators and Open Fires." Air Pollution, Vol.II, A. C. Stern (ed.), Academic Press, New York,1962, pp. 3-39. (See also 2nd edition, Vol. III,in press).
15. Lucas, D. H., Moore, D. J., and Spurr, G. "TheRise of Hot Plumes from Chimneys." Int. J. Air& Water Pollution, Vol. 7, pp. 473-500, Aug.1963.
16. Lucas, D. H. "The Atmospheric Pollution ofCities." Int. J. Air Pollution, Vol. 1, pp. 71-86,Oct. 1958.
17. Scorer, R. S. and Barret, C. F. "Gaseous Pol-lution from Chimneys." Int. J. Air Pollution,Vol. 6, pp. 49-63, 1962.
18. Electrical World, 168(20) :101, Nov. 13, 1967.19. Wohlers, W. C., Trieff, N. M., Newstein, H., and
Stevens W. "Sulfur Dioxide Abiorption on andDesorption from Teflon, Tygon, Glass, StainlessSteel, and Aluminum Tubings." Atmos. En-viron., Vol. 1, pp. 121-130, March 1967.
20. Scaringelli, F. P., Saltzman, B. E., and Frey,S. A. "Spectrophotometric Determination ofAtmospheric Sulfur Dioxide." Anal. Chem., Vol.39, pp. 1709-1719, Dec. 1967.
21. Kuczynski, E. R. "Effects of Gaseous Air Pol-lutants and the Response of the Thomas SO2Autometer." Environ. Sci. Technol., Vol. 1, p.69, Jan. 1967.
22. Rodes, C. F., Elfers, L. A., Palmer, H. F., andNorris, C. H. Sixty-First Annual Meeting of theAir Pollution Control Association, St. Paul, Min-nesota, June 23-27, 1968.
23. Low, M. J. D. "Multiple-Scan Infrared Inter-ference Spectroscopy." J. Chem. Ed., Vol. 43,p. 637, 1966.
24. Low, M. J. D. and Clancy, F. K. "Remote Sens-ing and Characterization of Stack Gases by In-frared Spectroscopy. An Approach Using Mul-tiple-Scan Interferometry." Environ. Sci. Tech-nol., Vol. 1, pp. 73-74, 1967.
25. Barringer, A. R. and Newberry, B. C. "RemoteSensing Correlation Spectrometry for PollutionMeasurements." Ninth Conference on Methodsin Air Pollution and Industrial Hygiene, Pasa-dena, California, Feb. 7-9, 1968.
26. Barringer, A. R. and Newberry, B. C. "Molec-ular Correlation Spectroscopy for Sensing Gas-ous Pollutants." 60th Annual Air Pollution Con-trol Association Meeting, Paper 67/196, 1967.
27. Barringer, A. R. and Shock, J. P. "Progress inthe Remote Sensing of Vapors for Air Pollu-
27

tion, Geologic, and Oceanographic Applications."Proceedings of the 4th Symposium on RemoteSensing of the Environment, April 1966, pp.779-791.
28. Bokhoven, C. and Niessen, H. G. L. "The Con-tinuous Monitoring of Traces of Sulfur Diox-ide in Air on the Basis of Discoloration of theStarch-Iodine Reagent with Prior Eliminationof Interfering Compounds." Int. J. Air Pollu-tion, Vol. 10, pp. 223-243,1966.
29. Katz, M. "Sulfur Dioxide in the Atmosphereof Industrial Areas." In: Effect of Sulfur Di-oxide on Vegetation, National Research Council,Ottawa, Canada, 1939, pp. 14-50.
30. Hochheiser, S. "Methods of Measuring andMonitoring Atmospheric Sulfur Dioxide." U.S.Dept. of Health, Education, and Welfare, PublicHealth Service, PH S-Pub-999-AP-6, Aug. 1964.
31. Alekseeva, M. V. and Samorodiva, R. Ya. S."Determination of Sulfur Dioxide Colorimetri-cally with the Aid of Fuchsin-Formaldehyde So-lution." Gig. i Sanit., Vol. 10, p. 42, 1953. In:Limits of Allowable Concentrations of Atmos-pheric Pollutants, Book 2, Office of TechnicalServices, Washington, D.C., 1955, pp. 90-95.
32. Bushtueva, K. A. "Ratio of Sulfur Dioxide andSulfuric Acid Aerosol in Atmospheric Air, inRelation to Meteorological Conditions." Gig. i
Sanit., Vol. 11, pp. 11-13, 1954. In: U.S.S.R.Literature on Air Pollution and Related Occu-pational Diseases. A Survey. Vol. 4. Translatedby B. S. Levine, U.S. Dept. of Commerce, Officeof Technical Services, Washington, D.C., Aug.1960, pp. 193-196.
33. Lyubimov, N. A. "A Nephelometer with an Au-tomatic 24-Hour Device for Continuous Record-ing of Sulfur Dioxide Concentrations in Atmos-pheric Air." In: Limits of Allowable Concen-trations of Atmospheric Pollutants. Book 5.Translated by B. S. Levine, U.S. Dept. of Com-merce, Office of Technical Services, Washington,D.C., 1962, pp. 120-127.
34. Schulze, F. "Versatile Combination Ozone andSulfur Dioxide Analyzer." Anal. Chem., Vol.38, pp. 298-752, May 1966.
35. McCaldin, R. 0. and Bye, W. E. "Air PollutionAppraisalSeward and New Florence, Pa." U.S.Public Health Service, Robert A. Taft SanitaryEngineering Center, 1961.
36. Stalker, W. W., Dickerson, R. C., and Kramer,G. D. "Atmospheric Sulfur Dioxide and Par-ticulate MatterA Comparison of Methods ofMeasurements." Am. Ind. Hyg. Assoc. J., Vol.29, pp. 68-79, Jan. and Feb. 1963.
37. Farmer, J. R. and Williams, J. D. "InterstateAir Pollution Study, Phase II Project Report,Section III, Air Quality Measurements." Inter-state Air Pollution Study St. Louis-East St.Louis Metropolitan Areas. U.S. Dept. of Health,Education, and Welfare, Public Health Service,Dec. 1966.
38. Hochheiser, S., Santner, J. T., and Ludman, W.F. "The Effect of Analytical Method on Indi-
28
cated Atmospheric SO2 Concentration." J. AirPollution Control Assoc., Vol. 16, pp. 266-270,May 1966. (Presented at Annual Meeting, AirPollution Control Association, Toronto, June1965.)
39, Greenburg, L. and Jacobs, M. B. "Sulfur Di-oxide in New York City Atmosphere." Ind. Eng.Chem., Vol. 48, pp. 1517-1521, Sept. 1956.
40. Tabor, E. C. and Golden, C. C. "Results of FiveYears' Operation of the National Gas SamplingNetwork." J. Air Pollution Control Assoc., Vol.15, pp. 7-11, Jan. 1965.
41. Terabe, M., Comichi, S., Benson, F. B., Newill,V. A., and Thompson, J. E. "Relationships Be-tween Sulfur Dioxide Concentration Determinedby the West-Gaeke and Electroconductivity Meth-ods." J. Air Pollution Control Assoc., Vol. 17,pp. 673-675, Oct. 1967.
42. Shikiya, J. M. and McPhee, R. D. "Multi-Instru-ment Performance Evaluation of ConductivityType Sulfur Dioxide Analyzers." Presented at61st Annual Meeting, Air Pollution Control As-sociation, St. Paul, 1968.
43. Trieff, N. M., Wohlers, H. C., O'Malley, J. A.,and Newstein, H. "Appraisal and Modificationof West-Gaeke Method for Sulfur Dioxide Deter-mination." J. Air Pollution Control Assoc., Vol.18, pp. 329-331, May 1968.
44. Booras, S. G. and Zimmer, C. E. "A Comparisonof Conductivity and West-Gaeke Analyses forSulfur Dioxide." J. Air Pollution Control Assoc.,Vol. 18, pp. 612-615, Sept. 1968.
45. "Air Quality Data (1963) National Air Sam-pling Network." U.S. Dept. of Health, Educa-tion, and Welfare, Public Health Service, 1965.
46. Gorham, E. "Atmospheric Pollution by Hydro-chloric Acid." Quart. J. Roy. Meteorol. Soc.,Vol. 84, pp. 274-276, July 1958.
47. Cummins, B. T. "Chemistry in Town Air." Re-search, Vol. 15, pp. 421-426, Oct. 1962.
48. "Air Pollution Measurements of the NationalAir Sampling Network, Vol. I. Analyses of Sus-pended Particulates, 1953-1957." U.S. Dept. ofHealth, Education, and Welfare, Public HealthService, PHS-Pub-637, 1958.
49. Stevens, R. K., O'Keeffe, A. E., and Ortman,G. C. Title not known, Environ. Sci. Technol.(In press, 1968.)
50. Mader, P. P., Hamming, W. J., and Be llin, A."Determination of Small Amounts of SulfuricAcid in the Atmosphere." Anal. Chem., Vol. 22,pp. 1181-1183, Sept. 1950.
51. Cummins, B. T. "Determination of ParticulateAcid in Town Mr." Analyst, Vol. 88, pp. 364-367, May 1963.
52. Scaringelli, F. P. and Rehme, K. A. "Determi-nations of Atmospheric Concentrations of Sul-furic Acid by Spectrophotometry, Coulometry,and Flame Photometry." (To be published inAnal. Chem.)
53. Huey, N. A. "The Lead Peroxide Estimation ofSulfur Dioxide Pollution." J. Air Pollution Con-trol Assoc., Vol. 18, pp. 610-611, Sept. 1968.

54. Ken line, P. A. "In Quest of Clean Air for Ber-lin, New Hampshire." U.S. Public Health Ser-vice, Robert A. Taft Sanitary EngineeringCenter, Tech. Rept. A62-9, 1962.
55. "Air Pollution Measurements of the NationalAir Sampling Network, Vol. II. Analyses ofSuspended Particulates, 1957-1961." U.S. Dept.of Health, Education, and Welfare, PublicHealth Service, PHS-Pub-978, 1962.
56. "Register of Air Pollution Analyses." U.S. Dept.of Health, Education, and Welfare, PublicHealth Service, PHS-Pub-610, Vol. I, 1958 andVol. II, 1961.
57. "Air Pollution in the El Paso, Texas Area. Re-port on a Two-Year Study under a CommunityAir Pollution Demonstration Project Grant." ElPaso City-County Health Unit, 1959.
58. Tyler, R. G. "Report on an Air Pollution Studyfor City of Seattle." Univ. of Washington, En-
viron. Res. Lab., March 15, 1952.59. Anderson, D. M., Lieben, J., and Sussman, V. H.
"Pure Air for Pennsylvania." PennsylvaniaDept. of Health and U.S. Dept. of Health, Edu-cation, and Welfare, Public Health Service, Nov.1961.
60. Chaney, A. L. "Investigations to Detect the At-mospheric Conversion of Sulfur Dioxide to Sul-fur Trioxide." Am. Petrol. Inst., Vol. 38, pp.306-312, 1958.
61. Thomas, M. D. "Sulfur Dioxide, Sulfuric AcidAerosol, and Visibility in Los Angeles." Int. J.Air Pollution, Vol. 6. pp. 443-454, Nov.-Dec.1962.
62. Boone, R.E. and Brice, R. M. "Continuous Mea-surement of Acid Aerosol in the Atmosphere."APCA Paper 65-119. (Presented at AnnualMeeting Air Pollution Control Association, To-ronto, June 1965.)
29

Chapter 3
ATMOSPHERIC CONCENTRATIONS OF SULFUR OXIDES

Table of Contents Page
A. INTRODUCTION 33
B. ATMOSPHERIC CONCENTRATIONS OF SULFUR DIOXIDE 331. Concentrations in Urban Areas 332. Concentrations Related to Point Sources 42
a. Copper Smelter, Australia, 1962 . . 42b. Oil Refinery, 1965 42c. Smelter, Canada, 1958 42d. Smelter, Trail, Canada, 1931 to 1937 42e. Power Plant, 1966 42f. Power Plant, Pennsylvannia, 1961 42
C. SULFURIC ACID AND ITS ,RELATION TO SULFUR DIOXIDE 42
D. ACIDITY OF RAINWATER AND PARTICULATE MATTER 45
E. SUMMARY 45
F. REFERENCES 47
Figure
3-1 Long-time Average Sulfur Dioxide Concentrations (ppm) and As-sociated Maximum Average Concentrations for Various Time Periodsfor 12 Sites in 11 Cities 36
3-2 Frequency Distribution of Sulfur Dioxide Levels in Selected Ameri-can Cities, 1962 to 1967 .... 37
3-3 Annual Average Sulfur Dioxide Concentrations for Eight AmericanCities . 39
3-4 Concentrations of Sulfur Dioxide in Chicago for Various AveragingTimes and Frequencies, from December 1,1963, to December 1,1964. 41
List of Figures
List of TablesTable
3-1 CAMP Data on Sulfur Dioxide Concentrations (ppm by Volume) 34
3-2 Comparison of Calculated and Observed Maximum Sulfur DioxideConcentrations for Various Averaging Times in 1964 in Chicago 41
3-3 Concentration of Sulfur Dioxide and Sulfuric Acid Mist Observed inthe Air 43
3-4 Concentrations of Sulfur Dioxide and Sulfuric Acid Mist Observedin 1961 in Air over Los Angeles and One of its Suburbs, El Segundo 44
32

Chapter 3
ATMOSPHERIC CONCENTRATIONS OF SULFUR OXIDES
A. INTRODUCTION
This chapter discusses the short and long-term measured concentrations of sulfur ox-ides in urban areas and in the vicinity ofpoint sources such as power plants, refineries,and smelters. The relation of sulfur oxidesin the atmosphere to the acidity of rainwaterand of particulate matter also is reviewed.
B. ATMOSPHERIC CONCENTRATIONSOF SULFUR DIOXIDE
1. Concentrations in Urban Areas
Two major programs sponsored by the U.S.Public Health Service have provided thelargest body of data on atmospheric sulfurdioxide concentrations in urban areas. TheContinuous Air Monitoring Project (CAMP)use the electroconductirity method for SO,determination in six large cities; more re-cently, CAMP has installed and is operatingcontinuous, colorimetric SO2 monitoring de-vices at all sites in addition to electroconduc-tivity instruments. The National Air Surveil-lance Networks (NASN) use the colorimetric(West-Gaeke) method to provide 24-hour-sample data for about 100 locations on a 26-times -per -year basis.
Extensive monitoring programs yield largequantities of data which need to be reducedto a useful form. Maximum or average valuesalone do not provide a total picture of airquality. Distribution plots, showing the per-centage of the time sulfur dioxide concentra-tions are above certain levels, give a morecomplete insight into the distribution of sul-fur dioxide concentrations for a given site.
The frequency distributions obtained fromCAMP measurements (for example, see Zim-mer and Larsen 1) show that sulfur dioxide
concentrations are not symmetrically dis-tributed but follow a log-normal distribution.This also has been established by Brasser,Joosting, and van Zuilen.2 CAMP data areplotted as a frequency ditribution for sixcities in Figure 3-2. The lower levels of sulfurdioxide that prevail in Los Angeles and SanFrancisco, as compared with some Easterncities, are clearly evident.
Table 3-1 gives sulfur dioxide concentra-tions, in ppm (determined by the hydrogenperoxide method), for 1962 to 1967 at theCAMP sites in eight cities for six differentaveraging times: 5 minutes, 1 hour, 8 hours,1 day, 1 month, and 1 year. For some years,the monitoring systems were not in operationat some locations, and this is indicated byasterisks in the columns. The first columngives the calculated maximum concentrationusing the approach of Larsen 3 describedlater in the chapter. Listed in the second andthird columns are the geometric mean and thestandard geometric deviation, similarly cal-culated, which describe the statistical distri-bution of the data. Columns 4 and 5 list therange of maximum values that were recordedduring the 6-year period, while the maximumfor each year is listed in columns 6 to 11.
From the data shown in Table 3-1, it is ap-parent that higher maxima are obtained asthe averaging time becomes shorter. This isbecause, for shorter averaging times, the in-stantaneous fluctuations have much greaterinfluence on the resulting values. This trendis shown quite clearly in Figure 3-1, in whichthe maximum average concentrations areplotted against the averaging time for differ-ent cities. The standard geometric deviation(column 3 of Table 3-1) indicates the degreeto which a given set of samples deviate fromtheir geometric mean, and therefore it in-
33

Table 3-1.-CAMP DATA ON SULFUR DIOXIDE CONCENTRATIONS (ppm by volume)
City andaveraging
time
1962-1967
62 63
Maximum for year
64 65 66 67
Perct.
dataavail.
Ca lc.
annl.max.
Geomean
SGD Maxima
Max. Min.
(1) (2) (3) (4) (5) (6) (7) (8) (9) (10) (11)
Chicago:
5min 3.33 0.104 2.20 1.94 1.11 1.13 1.94 1.62 1.59 1.11 1.62 82
1 hr 1.60 0.111 2.01 1.69 0.86 0.86 1.69 1.12 1.14 0.98 1.11 82
8hr 0.87 0.118 1.84 1.02 0.45 0.45 0.87 1.02 0.74 0.63 0.80 84
1 day 0.64 0.121 1.75 0.79 0.36 0.36 0.71 0.79 0.55 0.48 0.65 85
1 rno 0.24 0.133 1.44 0.35 0.13 0.18 0.33 0.35 0.27 0.27 0.32 93
1 yr 0.14 0.142 1.00 0.18 0.09 0.10 0.14 0.18 0.13 0.09 0.12 100
Cincinnati:
5 min 1.85 0.016 2.94 1.15 0.65 0.84 0.99 0.88 1.15 0.70 0.65 82
1 hr 0.70 0.018 2.60 0.57 0.41 0.46 0.48 0.55 0.57 0.41 0.42 82
8 hr____ _ 0.31 0.020 2.31 0.38 0.14 0.14 0.23 0.27 0.38 0.18 0.18 83
1 day 0.21 0.021 2.16 0.18 0.10 0.11 0.11 0.14 0.18 0.10 0.13 83
1 rno 0.06 0.025 1.65 0.06 0.04 0.04 0.06 0.06 0.06 0.05 0.04 86
1 yr 0.03 0.029 1.00 0.04 0.02 0.03 0.03 0.04 0.03 0.03 0.02 100
Denver:
5min 0.36 0.013 2.11 0.96 0.33 0.95 0.96 0.33 84
1 hr 0.18 0.014 1.94 0.36 0.17 0.36 0.26 0.17 84
8hr 0.10 0.015 1.79 0.14 0.05 0.14 0.10 0.05 85
1 day 0.07 0.015 1.71 0.06 0.02 0.06 0.05 0.02 86
1 rno 0.03 0.017 1.41 0.03 0.01 0.03 0.02 0.01 92
1 yr 0.02 0.018 1.00 0.02 0.01 0.02 0.01 100
Los Angeles:
5 min 0.47 0.013 2.28 0.68 0.24 0.24 0.51 0.68 59
1 hr 0.22 0.014 2.07 0.29 0.13 0.13 0.19 0.29 67
8hr 0.12 0.015 1.90 0.13 0.08 0.08 0.09 0.13 71
1 day 0.09 0.015 1.80 0.10 0.06 0.06 0.07 0.10 71
1 rno 0.03 0.017 1.46 0.03 0.02 0.03 0.03 0.02 64
1 yr 0.02 0.018 1.00 0.02 0.02 0.02 0.02 67
Philadelphia:
5 min 2.60 0.055 2.40 1.25 0.79 1.25 1.05 1.00 1.11 0.79 1.12 75
1 hr 1.16 0.060 2.17 1.03 0.66 1.03 0.85 0.84 0.94 0.66 0.77 76
8 hr 0.60 0.064 1.98 0.71 0.43 0.56 0.58 0.54 0.71 0.43 0.56 77
1 day 0.42 0.067 1.87 0.46 0.35 0.35 0.46 0.43 0.35 0.36 0.35 79
1 rno 0.15 0.075 1.50 0.15 0.12 0.13 0.12 0.15 0.13 0.13 0.13 86
1 yr 0.08 0.081 1.00 0.10 0.06 0.09 0.06 0.09 0.08 0.09 0.10 100
St. Louis:
5 min 2.40 0.028 2.75 1.42 0.85 1.16 1.42 1.25 0.85 81
1 hr 0.96 0.031 2.45 0.96 0.55 0.73 0.96 0.84 0.55 81
8hr 0.45 0.034 2.20 0.36 0.24 0.31 0.36 0.33 0.24 82
1 day 0.30 0.036 2.06 0.26 0.18 0.26 0.19 0.18 0.21 84
1 rno 0.09 0.042 1.60 0.08 0.05 0.08 0.06 0.06 0.05 88
1 yr 0.05 0.047 1.00 0.06 0.03 0.06 0.05 0.04 0.03 100
San Francisco:
5min 0.56 0.005 2.87 0.33 0.16 0.16 0.33 0.26 64
1 hr 0.22 0.006 2.54 0.26 0.11 0.11 0.26 0.16 64
8 hr 0.10 0.007 2.27 0.10 0.06 0.06 0.07 0.10 65
1 day 0.07 0.007 2.12 0.08 0.05 0.05 0.05 0.08 65
1 rno 0.02 0.008 1.63 0.03 0.01 0.01 0.02 0.03 75
1 yr 0.01 0.010 1.00 0.02 0.01 0.01 0.02 67
Washington:
5 min 1.19 0.039 2.17 0.87 0.42 0.42 0.56 0.87 0.44 0.47 0.44 69
1 hr 0.58 0.042 1.99 0.62 0.35 0.38 0.48 0.62 0.35 0.45 0.37 69
8hr 0.32 0.044 1.83 0.35 0.22 0.23 0.35 0.32 0.27 0.34 0.22 70
1 day 0.23 0.046 1.74 0.25 0.15 0.18 0.25 0.22 0.20 0.25 0.15 71
1 rno 0.09 0.050 1.43 0.11 0.07 0.10 0.11 0.09 0.08 0.10 0.07 75
1 yr 0.05 0.050 1.00 0.05 0.04 0.05 0.05 0.04 0.05 0.04 83
34

Table 3-1 (continued).-CAMP DATA ON SULFUR DIOXIDE CONCENTRATIONS (ppm by volume)
City andaveraging
time
Percent of time concentration is exceeded
.001 0.01 0.1 1 10 30 50 70 90
(12) (13) (14) (15) (16) (17) (18) (19) (20)
Chicago:
5 min 1.75 1.34 1.03 0.68 0.33 0.16 0.08 0.03 0.01
1 hr 1.12 0.96 0.65 0.33 0.16 0.08 0.03 0.01
8 hr 0.76 0.57 0.32 0.16 0.09 0.04 0.01
1 day 0.50 0.31 0.16 0.09 0.05 0.02
1 mo 0.27 0.17 0.09 0.06 0.03
1 yr 0.12
Cincinnati:
5min 0.90 0.70 0.42 0.19 0.07 0.03 0.02 0.01 0.00
1 hr 0.53 0.35 0.17 0.07 0.03 0.02 0.01 0.00
8hr 0.22 0.12 0.06 0.04 0.02 0.02 0.01
1 day 0.10 0.06 0.04 0.03 0.02 0.01
1 mo 0.05 0.04 0.03 0.02 0.01
1 yr 0.03
Denver:
5min 0.64 0.33 0.18 0.07 0.03 0.01 0.01 0.00 0.00
1 hr 0.26 0.11 0.06 0.03 0.02 0.01 0.00 0.00
8 hr 0.08 0.04 0.03 0.02 0.01 0.00 0.00
1 day 0.04 0.03 0.02 0.01 0.00 0.00
1 mo 0.02 0.02 0.01 0.01 0.00
1 yr 0.01
Los Angeles:
5 min 0.56 0.38 0.15 0.08 0.04 0.02 0.01 0.01 0.00
1 hr 0.25 0.13 0.08 0.04 0.02 0.01 0.01 0.00
8 hr 0.10 0.07 0.04 0.02 0.02 0.01 0.00
1 day 0.06 0.04 0.02 0.02 0.01 0.00
1 mo 0.02 0.02 0.02 0.01 0.01
1 yr 0.02
Philadelphia:
5 min 1.18 0.95 0.72 0.47 0.21 0.09 0.05 0.03 0.01
1 hr 0.85 0.66 0.45 0.21 0.09 0.05 0.03 0.01
8 hr 0.49 0.37 0.19 0.10 0.06 0.04 0.01
1 day 0.29 0.18 0.10 0.07 0.04 0.02
1 mo 0.12 0.10 0.08 0.07 0.03
1 yr 0.09
St. Louis:
5 min 1.23 0.96 0.58 0.29 0.11 0.05 0.02 0.01 0.00
1 hr 0.73 0.50 0.25 0.11 0.05 0.03 0.01 0.00
8 hr 0.29 0.19 0.09 0.06 0.04 0.02 0.00
1 day 0.14 0.09 0.05 0.04 0.02 0.01
1 mo 0.06 0.05 0.04 0.03 0.02
1 yr 0.04
San Francisco:
5min 0.30 0.18 0.13 0.07 0.03 0.01 0.01 0.00 0.00
1 hr 0.16 0.11 0.07 0.03 0.01 0.01 0.00 0.00
8 hr 0.09 0.06 0.03 0.02 0.01 0.00 0.00
1 day 0.05 0.03 0.02 0.01 0.00 0.00
1 mo 0.02 0.01 0.01 0.01 0.00
1 yr 0.01
Washington:
5min _ 0.65 0.49 0.36 0.22 0.11 0.06 0.03 0.02 0.01
1 hr_ 0.46 0.35 0.21 0.10 0.06 0.03 0.02 0.01
8hr 0.26 0.19 0.10 0.06 0.04 0.02 0.01
1 day 0.17 0.10 0.06 0.04 0.02 0.01
1 mo 0.09 0.05 0.04 0.03 0.02
1 yr 0.04
35

10.0987654
3
2
1.0 987654
3
2
0.109
0.01
0.001
87654
3
2
9876543
2
II
-
I I I II I I I I
CH
S.L.PH
CIND
W-2L.A.
N.Y.0
S.F.
NEW YORKCITY
LONDONWINDSOR 2
PHILADELPHIA
WINDSOR 1WASHINGTON, D.C.
ST. LOUISCINCINNATI
LOS ANGELES
SAN FRANCISCO
DENVER_ _
I I I I I I I I I
.1
am*
OM.
11
3 sec 30 sec 5 min 1 hr 8 hr 1 day 4 daysAVERAGING TIME
1 mo 1 yr 10 yr
Figure 3-1. Long-time Average Sulfur Dioxide Concentrations (ppm) and Associated Maximum Average Con-centrations for Various Time Periods for Twelve Sites in Eleven Cities.
For each of the given lines, the last point on the right is the long-term average over the interval specified, while theother points represent the maxima within the interval for the averaging periods shown. If, for example, one completeyear of data were available in terms of hourly averages, there would be one maximum hourly value for that year. Iffive years of data were available, in terms of hourly averages, five maxima (one for each year) would be obtained,and the highest of these five maxima would constitute the maximum hourly average for the five-year period.
36

1 0.2aaz0I=<ccI-zwUz8 0.1 -N 0.090-0
ti) 0.08
0.07'
0.06
0.05
0.04
0.03
CINCINNATI
0.02
LOS ANGELES
SAN FRANCISCO
0.01 I I t I 1 1 1 1 1 I I i I
0.01 0.05 0.1 0.2 0.5 1 2 5 10 20 30 40 50 60 70 80
PERCENT OF TIME CONCENTRATION IS EXCEEDED
Figure 3-2. Frequency Distribution of Sulfur Dioxide Levels in Selected American Cities,1962 to 1967 (1-Hour Averaging Time, Data From Table 3-1).
The approximate log normality of the distribution of sulfur dioxide concentrations is shown bythe rather straight lines of the distribution functions when these are plotted on a logarithmicscale (concentrations) against a normal distribution frequency.
37
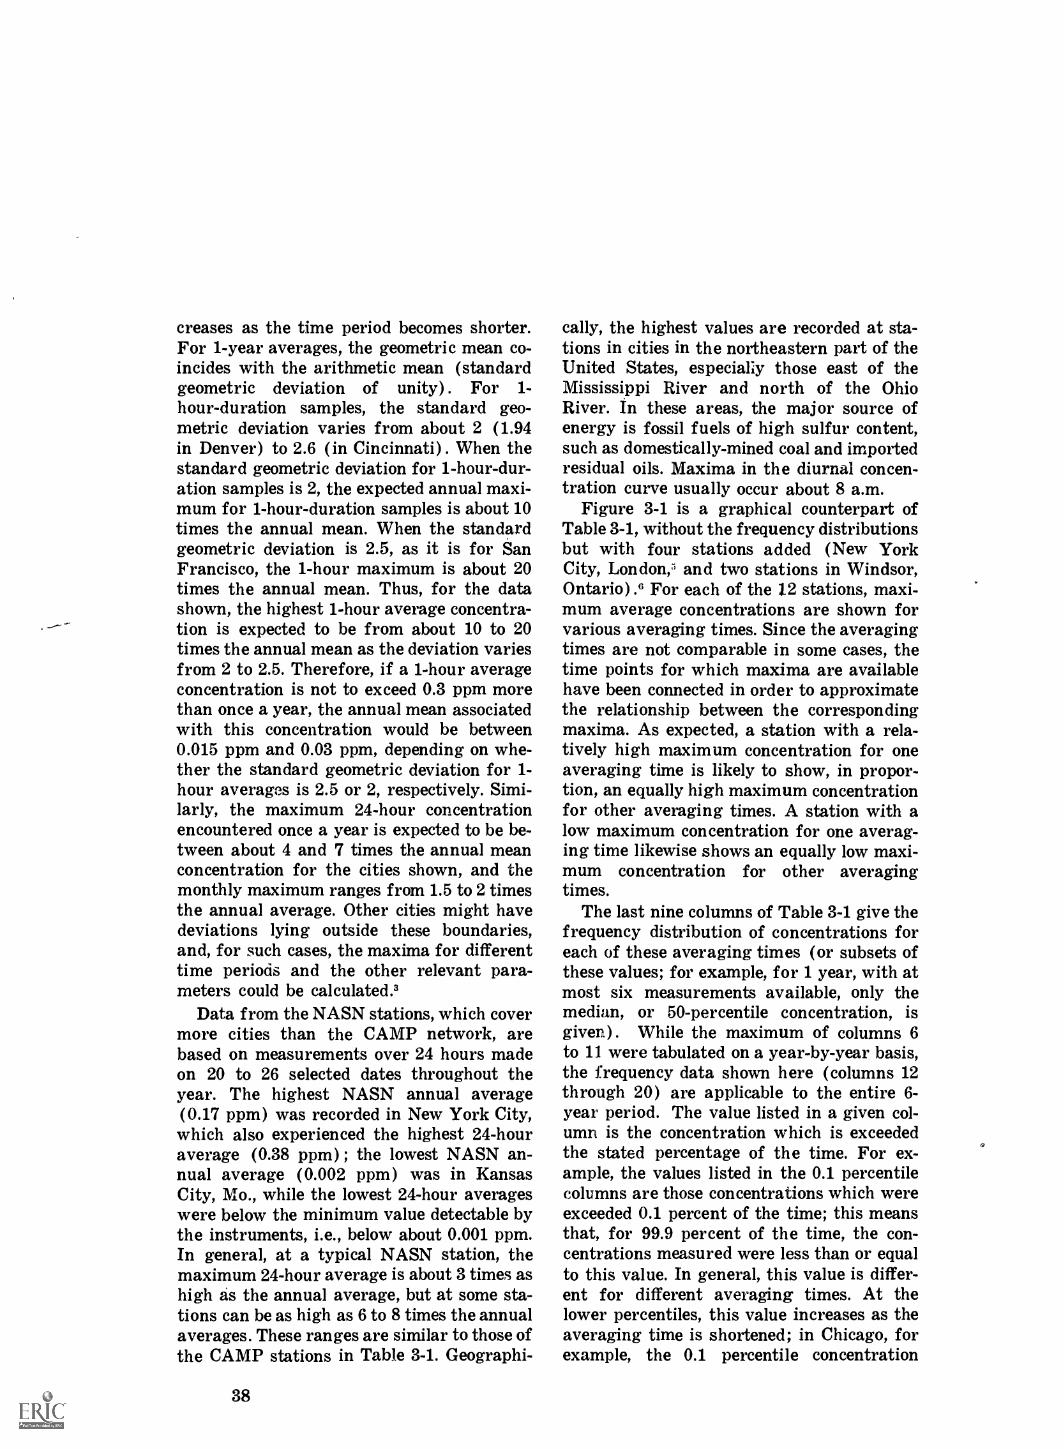
creases as the time period becomes shorter.For 1-year averages, the geometric mean co-incides with the arithmetic mean (standardgeometric deviation of unity) . For 1-hour- duration samples, the standard geo-metric deviation varies from about 2 (1.94in Denver) to 2.6 (in Cincinnati) . When thestandard geometric deviation for 1-hour-dur-ation samples is 2, the expected annual maxi-mum for 1-hour-duration samples is about 10times the annual mean. When the standardgeometric deviation is 2.5, as it is for SanFrancisco, the 1-hour maximum is about 20times the annual mean. Thus, for the datashown, the highest 1-hour average concentra-tion is expected to be from about 10 to 20times the annual mean as the deviation variesfrom 2 to 2.5. Therefore, if a 1-hour averageconcentration is not to exceed 0.3 ppm morethan once a year, the annual mean associatedwith this concentration would be between0.015 ppm and 0.03 ppm, depending on whe-ther the standard geometric deviation for 1-hour averages is 2.5 or 2, respectively. Simi-larly, the maximum 24-hour concentrationencountered once a year is expected to be be-tween about 4 and 7 times the annual meanconcentration for the cities shown, and themonthly maximum ranges from 1.5 to 2 timesthe annual average. Other cities might havedeviations lying outside these boundaries,and, for such cases, the maxima for differenttime periods and the other relevant para-meters could be calculated.3
Data from the NASN stations, which covermore cities than the CAMP network, arebased on measurements over 24 hours madeon 20 to 26 selected dates throughout theyear. The highest NASN annual average(0.17 ppm) was recorded in New York City,which also experienced the highest 24-houraverage (0.38 ppm) ; the lowest NASN an-nual average (0.002 ppm) was in KansasCity, Mo., while the lowest 24-hour averageswere below the minimum value detectable bythe instruments, i.e., below about 0.001 ppm.In general, at a typical NASN station, themaximum 24-hour average is about 3 times ashigh as the annual average, but at some sta-tions can be as high as 6 to 8 times the annualaverages. These ranges are similar to those ofthe CAMP stations in Table 3-1. Geographi-
38
cally, the highest values are recorded at sta-tions in cities in the northeastern part of theUnited States, especiahy those east of theMississippi River and north of the OhioRiver. In these areas, the major source ofenergy is fossil fuels of high sulfur content,such as domestically-mined coal and importedresidual oils. Maxima in the diurnal concen-tration curve usually occur about 8 a.m.
Figure 3-1 is a graphical counterpart ofTable 3-1, without the frequency distributionsbut with four stations added (New YorkCity, London,5 and two stations in Windsor,Ontario) .6 For each of the 12 stations, maxi-mum average concentrations are shown forvarious averaging times. Since the averagingtimes are not comparable in some cases, thetime points for which maxima are availablehave been connected in order to approximatethe relationship between the correspondingmaxima. As expected, a station with a rela-tively high maximum concentration for oneaveraging time is likely to show, in propor-tion, an equally high maximum concentrationfor other averaging times. A station with alow maximum concentration for one averag-ing time likewise shows an equally low maxi-mum concentration for other averagingtimes.
The last nine columns of Table 3-1 give thefrequency distribution of concentrations foreach of these averaging times (or subsets ofthese values; for example, for 1 year, with atmost six measurements available, only themedian, or 50-percentile concentration, isgiven) . While the maximum of columns 6to 11 were tabulated on a year-by-year basis,the frequency data shown here (columns 12through 20) are applicable to the entire 6-year period. The value listed in a given col-umn is the concentration which is exceededthe stated percentage of the time. For ex-ample, the values listed in the 0.1 percentilecolumns are those concentrations which wereexceeded 0.1 percent of the time; this meansthat, for 99.9 percent of the time, the con-centrations measured were less than or equalto this value. In general, this value is differ-ent for different averaging times. At thelower percentiles, this value increases as theaveraging time is shortened; in Chicago, forexample, the 0.1 percentile concentration

changes from 0.76 ppm to 1.03 ppm as the av-eraging interval is shortened from 8 hours to5 minutes. At the higher percentiles, the op-posite occurs: the concentration decreases asthe averaging time is shortened. The 30-per-centile point (which is very close to the arith-metic mean) apparently represents an equili-brium condition, since the concentrationassociated with this point is approximatelythe same for all averaging times. Thus, the30-percentile concentration, i.e., the valuewhich is not exceeded for 70 percent of thetime, might be used as a simple indicator ofthe "general sulfur dioxide level" of a city,irrespective of the averaging time. For the
.18
.16
.14
.12
.10
.08
.06
.04
.02
0
1962 1963 1964
eight cities tabulated, using this index, Chi-cago clearly shows the highest level (0.16ppm) , followed by Philadelphia, Washing-ton, St. Louis, Cincinnati, Los Angeles, Den-ver, and San Francisco. That this is a goodindex is borne out by Figure 3-3, whichshows the annual average sulfur dioxide con-centrations, by year, for these same cities.The ordering of the cities, from most severeto least severe, appears to be the same, withChicago on the top and San Francisco on thebottom.
The conversion of the maximum concen-tration for one averaging time to that for an-other may be approached in a number of
WASHINGTON, D.C.
CINCINNATI
LOS ANGELES
1
fti,1.1osc°AVER
1965 1966
Figure 3-3. Trends in Sulfur Dioxide Concentration for Eight Cities.
This figure shows that the sulfur dioxide concentrations for the years 1962-1967 werehighest in Chicago and Philadelphia. (Sampling periods begin on December 1 of thepreceeding year and run until November 30 of the year shown).
39
1967

ways. Brasser, Joosting, and van Zuilen 2, ina manner similar to that described above, at-tempt to establish empirically the relationshipbetween maxima for different averagingtimes from measurements carried out overlong periods and under different meteoro-logical conditions.
Larsen 3 computes the expected maximumconcentration (C) for a given averaging timeby using the geometric mean (Mg) , the stand-ard geometric deviation (0g) , and the "stand-ard normal deviate" of no more than oneoccurrence in 1.67N trials (z) . His formula is
(3-1)For example, if data for 1 year are avail-able, if the 1-hour geometric mean concentra-tion is 0.044 ppm, and if the 1-hour standardgeometric deviation is 2.46, then the calcu-lated maximum hourly concentration, expect-ed to occur about once a year is
= (0.044 ppm) (2.46) 3.81C max (hour)
=1.36 ppm,
since there are 8,760 hours in a year and thestandard normal deviate corresponding to aprobability of 1 (or 0.0000685)
(8760) (1.67)is 3.81. Likewise, if Mg and 0g are unchang-ed but the total period of observation is only26 hours, then, since the standard normaldeviate corresponding to a probability of
1 or (0.0231) is 1.99,(26) (1.67)
= (0.044 ppm) (2.46) 1.99C max (hour)
= 0.27 ppm.Or, in other words, this concentration is ex-pected to be exceeded about once a day.
In a similar manner, it is possible also tocalculate the minimum concentration for agiven averaging time, as well as the concen-trations at various percentiles, using the geo-metric mean and the standard geometric de-viation for that averaging time. In addition,the geometric mean and the standard geo-metric deviation for one averaging time canbe calculated from data obtained for otheraveraging times, although the accuracy of
40
the results will depend on the number of airsamples taken compared to the total numberof samples that could have been taken if airsampling had been continuous. A set of 2224-hour-duration random values were sel-ected from the CAMP data by use of anNASN sampling schedule and were analyzedby Zimmer and Larsen. 1 For the 1-hour-aver-aging values, these investigators calculated ageometric mean of 0.054, as compared with0.051, and a standard geometric deviation of1.76, as compared with 1.94. Thus, a fairlygood approximation of the year's hourly aver-age frequency distribution could have beenobtained with these 22 random samples.
Maxima calculated by Larsen's method arereasonable for averaging times of 1 hour orgreater but tend to give overestimates for5-minute periods; they do so for six of theeight cities in Table 3-1 (first column) . Thelower measured values may be partially dueto the response times of the instruments.Table 3-2 compares the calculated maximumconcentrations for six averaging times forthe period from December 1, 1963, to Dec-ember 1, 1964, with those actually observedin Chicago during the calendar year 1964. Itis seen that the calculated value for averag-ing times as short as 5 minutes deviates sig-nificantly from the observed value. A plot ofsulfur dioxide concentration data for Chicagofrom December 1, 1963, to December 1, 1964,is given in Figure 3-4. Averaging time is ona logarithmic scale, as is concentration inppm, while frequency (percent) is given ona normal probability scale. The crosses andtriangles in the figure denote observed values,while the lines represent calculated concen-trations. For example, for an averaging timeof 1 hour, 30 percent of the 1-hour-durationsamples obtained during the year exceeded aconcentration of about 0.2 ppm, and 0.1 per-cent of these samples showed a concentrationin excess of 1 ppm. (These two points aremarked with asterisks in the figure.) The13 lines in the figure represent the 11 percen-tiles and the maximum and the minimumlines. In addition, several expected maximumconcentration values are listed at the top ofthe figure. Thus the middle line representsthe expected 50 percentile (or median) line,i.e., the concentration values which one would
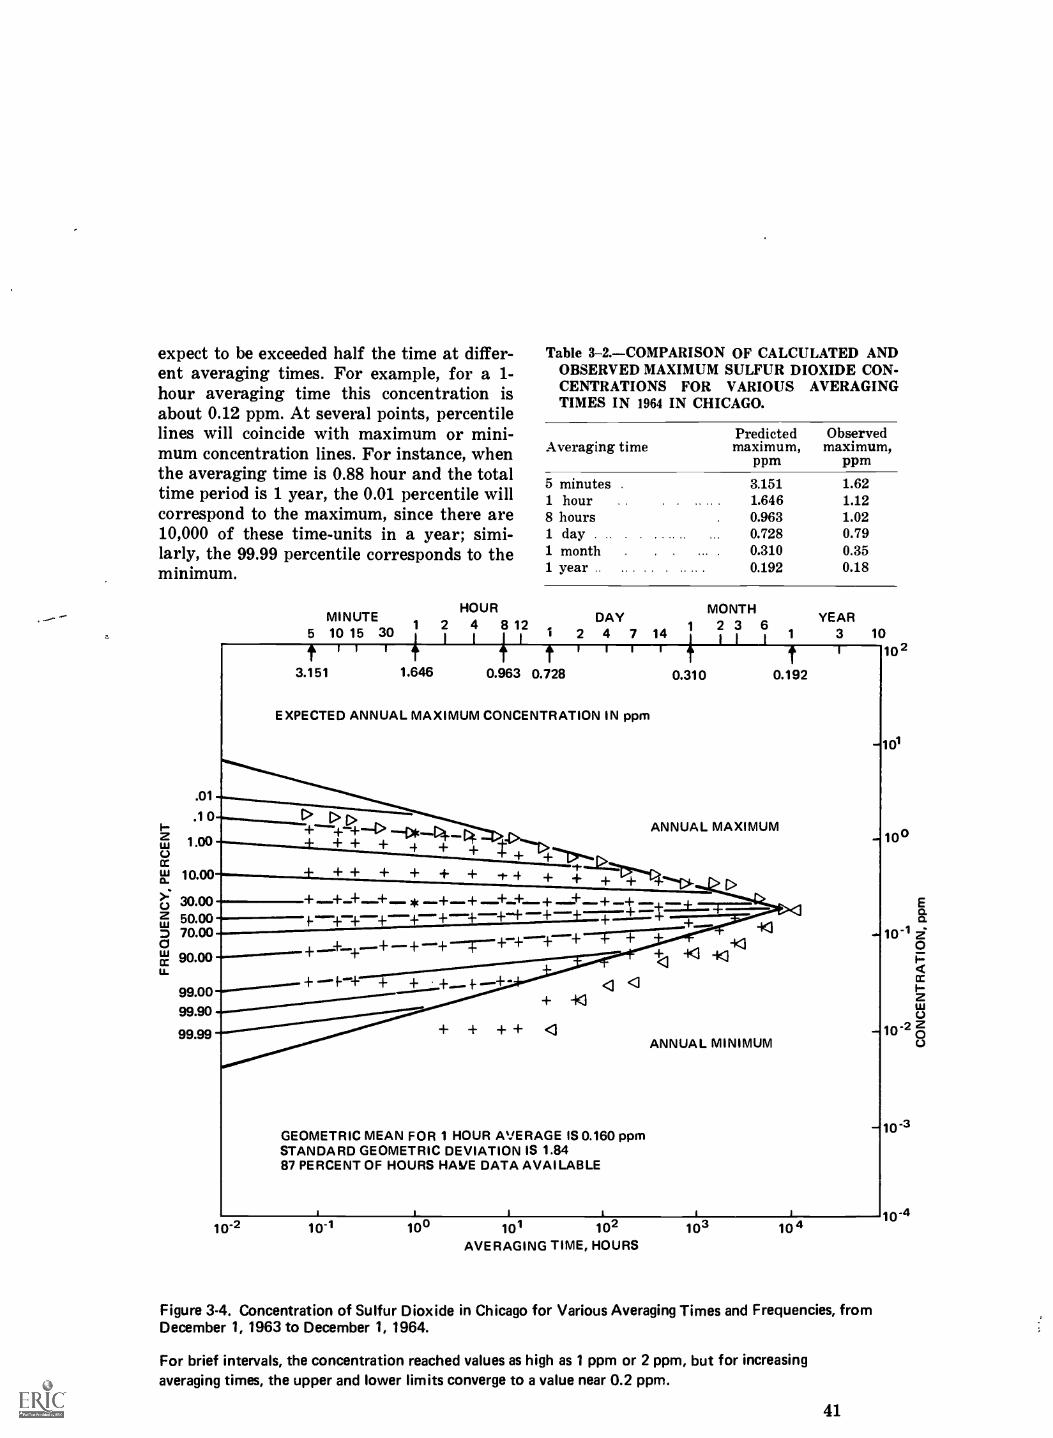
expect to be exceeded half the time at differ-ent averaging times. For example, for a 1-hour averaging time this concentration isabout 0.12 ppm. At several points, percentilelines will coincide with maximum or mini-mum concentration lines. For instance, whenthe averaging time is 0.88 hour and the totaltime period is 1 year, the 0.01 percentile willcorrespond to the maximum, since there are10,000 of these time-units in a year; simi-larly, the 99.99 percentile corresponds to theminimum.
.01
.1 0
1,00
10.00
30.0050.0070.00
90.00
99.00
99.90
99.99
MINUTE5 10 15 30
Table 3-2.COMPARISON OF CALCULATED ANDOBSERVED MAXIMUM SULFUR DIOXIDE CON-CENTRATIONS FOR VARIOUS AVERAGINGTIMES IN 1964 IN CHICAGO.
Averaging timePredictedmaximum,
ppm
Observedmaximum,
ppm
5 minutes 3.151 1.621 hour 1.646 1.128 hours 0.963 1.021 day 0.728 0.791 month 0.310 0.351 year .. 0.192 0.18
HOUR2 4 812
1t "3.151 1.646
I
t0.963 0.728
MONTHDAY YEAR2 32 4 7 14
1
116
1 13 10
11 1 02
0.310 0.192
EXPECTED ANNUAL MAXIMUM CONCENTRATION IN ppm
+ + + 4 +
3- ++ + + + + 4 +
+ * +.41- "+1- ++++ + + ++ ++
opoor".
+ + +-+
ANNUAL MAXIMUM
"4--
GEOMETRIC MEAN FOR 1 HOUR AVERAGE IS 0.160 ppmSTANDARD GEOMETRIC DEVIATION IS 1.8487 PERCENT OF HOURS HAVE DATA AVAILABLE
10.2a
10-1 10° 101 102AVERAGING TIME, HOURS
ANNUAL MINIMUM
103 104
Figure 3-4. Concentration of Sulfur Dioxide in Chicago for Various Averaging Times and Frequencies, fromDecember 1, 1963 to December 1, 1964.
For brief intervals, the concentration reached values as high as 1 ppm or 2 ppm, but for increasingaveraging times, the upper and lower limits converge to a value near 0.2 ppm.
41
10'
10°
10 -3
10 -4

2. Concentrations Related to Point Sources
An industry which emits large quantitiesof sulfur dioxide is described as a pointsource. The area near such sources may ex-perience high concentrations or immeasur-ably small values, depending on the prevail-ing winds, throughput differences, intermit-tent operations, intermittent pressure releas-es, and differences in velocity and tempera-ture of emissions. Several studies of suchsituations have been reported.' `a. Copper Smelter. Australia. 1962
Sullivan " reported that the maximum dailyaverage concentrations were from 8 to 17times the annual average concentration. Ata station located 1.5 miles from the smelter,the hydrogen peroxide method gave a maxi-mum daily average of 0.60 ppm, while theannual average was 0.036 ppm. A ThomasAutometer (conductometric) indicated peak
Average SO,. ppmHours with SO,>0.25 ppm
1931
0.032140
The concentrations are 6-month averagesand the hours during which more than 0.25ppm of sulfur dioxide was measured consti-tute from 0.2 percent to 3.5 percent of thetotal time. Maximum concentrations thatlasted from 4 minutes to 54 minutes rangedfrom 0.48 poll to 1.30 ppm or from 30 timesto 160 times the respective 6-month aver-ages. The latter represents a considerablyhigher ratio than those which can be calcu-lated from Table 3-1 and demonstrates theimpact of point sources versus . multiplesources.
e. Power Plant, 1966Sulfur dioxide fro'll a 1,000-inegawatt
Power station buming '.i.`30 tons of 1.3 percentsulfur coal per hour was stud'ed by Martinand Barber." Sixteen sulfur dioxide record-ers were spaced around a r:ig of radiusabout 3 miles to 4 miles ,cepteiZ,,d on the sta-tion, i.e., near the zone of calcula;ed maxi-mum ground-level pollution. The maximum 3-minute concentration duriw the year wasabout 0.62 ppm.; the maximum hou,rly aver-age was about 0.47 ppm, the maximum daily
42
concentrations from 1 ppm to 5 ppm on 30occasions during a 6-month period and amaximum peak of 13.5 ppm.b. Oil Refinery, 1965
Concentrations in excess of 0.5 ppm for10 hours during 1 month with momentaryPeaks over 2 ppm in an area near an oil re-finery were reported by Linzon.7c. Smelter, Canada, 1958
A station located 8 miles from a smelterrecorded an average concentration of 0.03ppm during a 4-month study (May-August1958). Measureable concentrations were pre-sent about 20 percent of the time, and con-centrations above 0.25 ppm occurred 4 per-cent of the time.1"d. Smelter, Trail, Canada, 1931 to 1937
During the 6-month growing season, a sta-tion 15 miles south of the smelter recordedthese data:
1932 193 1934 1935 1936 1937
0.007 0.008 0.012 0.023 0.022 0.013
8.5 18 32.5 36 47 7
average was 0.11 ppm, and the annual aver-age was about 0.027 ppm.f. Power Plant, Pennsylvania, 1961
One of the few studies of sulfur dioxideconcentrations near a coal-fired power plantwas made by McCaldin and Bye.' A ThomasAutometer 1/0 m:.le from this plant indicatedan average concentration of 0.17 ppm fromJanuary to April (0.09 ppm by colormetricWest-Gaeke) with a maximum hourly aver-age of 2.9 ppm and a momentary peak con-ceritratiol,!). of 4.7 ppm.
C. : SULITRIIP, ACID AND ITS RELATIONv6
, TO iULFUR DIOXIDEkreasureme), s of sulfuric acid along with
sulfur dioxidstimations are of interest be-cause of the hi',Ther irritant potential of sul-furic acid, and because the ratio of the con-centrations of t :le two pollutants found undervarious conditicls helps in our understandingof the mecharkil,m of the oxidation of sulfurdioxide sulfueic acid in the atmosphere.,1.
Coste ', ' " mAtide simultaneous measure-ments of sulfur:,i3 acid and sulfur dioxide in
'1

London, England. Sulfur dioxide concentra-tions ranged from 0.13 ppm to 0.58 ppm (371p.g/m" to 1657 µg /m3) , sulfuric acid concen-trations ranged from 4 µg /m3 to 20 µg /m3.The weight ratio of sulfuric acid to sulfurdioxide was 0.011 at the higher concentrationof sulfur dioxide and 0.013 at the lower con-centration. The highest ratio of sulfuric acidto sulfur dioxide was 0.023 on a misty day.
A maximum sulfur dioxide concentrationof 1.47 ppm (4200 µg /m3) in London duringthe period December 2 through December 5,1957, was reported by Commins.1 Duringthe same period the maximum concentrationof sulfuric acid was 222 µg /m3. The ratio ofmaximum sulfuric acid to maximum sulfurdioxide was 0.053. Commins also reportedthat sulfuric acid could be as much as 10 per-cent of the total sulfur, corresponding to aweight ratio of sulfuric acid to sulfur dioxideof 0.167.
An extensive study of the simultaneouspresence of sulfur dioxide and sulfuric acidmist in the air was made by Bushtueva." "Between August 1953 and January 1954, shecollected 198 paired samples for sulfur diox-ide and sulfuric acid determination. The dataare presented in Table 3-3. The sulfuric acidand sulfur dioxide were originally reportedin mg/m" rather than in p.g/m" as shown inthe table. The concentrations of sulfur diox-ide in ppm have been added for convenience
of comparison with other data reported inppm. These data show that as the sulfur diox-ide concentration increases so does the sul-furic acid concentration, although at a slowerrate.
Bushtueva also studied the effect of windspeed and relative humidity on the concentra-tions of sulfur dioxide and sulfuric acid. Boththe sulfuric acid concentration and the ratioof sulfuric acid to sulfur dioxide were high-est during periods of fog, and lowest duringperiods of precipitation. In the absence ofprecipitation, the ratio of sulfuric acid to sul-fur dioxide increased from about 0.045 at60 percent relative humidity to about 0.090at 90 percent relative humidity, and to 0.15at relative humidities above 91 percent. Atwind speeds below about 4.5 miles per hour,the ratio of sulfuric acid to sulfur dioxidewas 0.173, and at wind speeds greater thanabout 9 miles per hour, the ratio was only0.068. Thus calm days, high humidity, andespecially foggy weather are associated withhigh concentrations of sulfuric acid.
Although they did not study the relationof sulfuric acid to sulfur dioxide, Mader etal." found that the sulfuric acid concentra-tion at Los Angeles increased as the relativehumidity increased.
Chaney'`' studied the relationship betweensulfur dioxide (West-Gaeke measurement)and sulfuric acid in the Los Angeles area.
..,
Table 3-3.CONCENTRATION OF SULFUR DIOXIDE AND SULFURIC ACID MIST OBSERVED IN AIR 1617
SO2 concentrations Average concentrationNumber
"tSOkt1
,. .. H2t-,L.,1
112504 : SO2Weightratio
lAg/In't ppm
oftests
ppm /m3 ilpx/m3
24-hour samples:25-100 .: 0.009-0.035 6 0.01 30 12.6 0.420101-250:: 0.035-0.088 18 0.06 176 19.6 0.112251-5001 0.088-0.175 38 0.14 387 20.0 0.051501-750 0.176-0.263 20 0.23 663 31.0 0.045751-1000,, . 0.264-0.350 6 0.30 866 29.10 0.033Over 10C1 over 0.35 11 0.43 1220 C,..0 0.035
Single sample'i. ;Up to 250- up to 0.088 15 0.05 128 17.5 0.137251-750 . i 0.988-0.263 8 0.15 428 41.6 0.097Over 75(4 ove't 0.263 2 0.48 1380 326.0 0.235
43

During the time of the study, sulfur dioxidevalues were generally very low and some-times there was no measurable sulfate. Theweight ratios of sulfuric acid to sulfur diox-ide ranged from 0.037 to 3.0 and the sulfatelevels were relatively high compared to thesulfur dioxide concentrations. In the data ofthe National Air Surveillance Network, thereis also a large amount of sulfate per unit ofsulfur dioxide as measured by the West-Gaeke technique. In the strongly oxidizingatmosphere of Los Angeles, sulfur dioxidemay be rather rapidly oxidized. On the otherhand, the high ozone and nitrogen dioxideconcentrations in Los Angeles may signifi-cantly interfere with the West-Gaeke pro-cedure so that if the sulfamic acid modifica-tion is not used, values lower than actual sul-fur dioxide concentrations may be recorded;consequently, oxidation of sulfur dioxide maybe more apparent than real.
Thomas 2° used an automatic electrocon-ductivity measuring instrument for the sim-ultaneous measurement of sulfur dioxide and
sulfuric acid mist concentrations during thewinter of 1961 in Los Angeles. Concentra-tions of sulfur dioxide up to 0.21 ppm (600/A g/m3) and of sulfuric acid up to 50 µg /m3were observed. Thomas originally reportedthe data in ppm; but to make them compar-able with other data in this report they havebeen converted to µg /m3 and are presentedin Table 3-4. The weight ratios of sulfuricacid to sulfur dioxide lie between 0.032 and0.246; these ratios are within the range ofvalues reported by other investigators forother places.
Thomas' data indicate a nonlinear relation-ship between sulfur dioxide and sulfuric acidconcentrations. Sulfuric acid increases assulfur dioxide increases up to some criticalvalue, depending upon the location. Beyondthe critical value, sulfuric acid decreases assulfur dioxide increases. In El Segundo, amaximum sulfuric acid concentration ofabout 25 µg /m3 was observed when the sul-fur dioxide concentration was between 0.15ppm and 0.20 ppm (425 µg /m3 to 570 µg /m3),
Table 3-4.-CONCENTRATIONS OF SULFUR DIOXIDE AND SULFURIC ACID MIST OBSERVED IN1961 IN AIR OVER LOS ANGELES AND ONE OF ITS SUBURBS, EL SEGUNDO"
DateSulfur dioxide Sulfuric acid
H2504 : SO2
ppm µg /m' ppm lug/m'Weight ratio
El Segundo26 Jan 0.065 185 0.0016 6.4 0.0356 Feb 0.061 174 0.0031 12.4 0.071
22 Jan 0.062 177 0.0050 20.0 0.1128 Feb 0.062 177 0.0054 21.6 0.112
10 Feb 0.055 158 0.0050 20.0 0.12731 Jan 0.120 342 0.0046 18.4 0.05411 Feb 0.102 291 0.0047 18.8 0.06428 Jan 0.110 313 0.0055 22.0 0.07015 Feb 0.125 356 0.0068 27.2 0.0769 Feb 0.130 371 0.0075 30.0 0.081
30 Jan 0.205 584 0.0048 19.2 0.0322 Feb ......... 0.194 553 0.0098 39.2 0.071
Los Angeles:24 Mar .. ..... .... .. 0.057 162 0.0048 19.2 0.11821 Mar 0.067 191 0.0070 28.0 0.14622 Mar 0.063 180 0.0072 28.8 0.16010 Mar 0.057 162 0.0080 32.0 0.2009 Mar 0.064 182 0.0092 36.8 0.201
13 Mar 0.065 185 0.0099 39.6 0.21414 Mar 0.050 143 0.0084 35.2 0.24622 Mar 0.122 348 0.0072 28.8 0.08213 Mar 0.122 348 0.0126 50.4 0.145
44
whereas, in downtown Los Angeles, a maxi-mum sulfuric acid concentration of about 30µg /m3 was observed when the sulfur dioxideconcentration was between 0.05 ppm and 0.10ppm (140 µg /m3 to 280 µg /m3) .
During the past several years the NationalAir Surveillance Networks have taken simul-taneous measurements of 24-hour averagesulfur dioxide and suspended sulfate in vari-ous cities.-' 23 Unpublished analyses of thesedata show that correlation coefficients be-tween sulfur dioxide and suspended sulfate(sulfuric acid and sulfate salts) range be-tween 0.5 and 0.9. Manganese and iron in thesuspended particulate matter, relative hum-idity, and temperature were studied as vari-ables that might affect this correlation. Asrelative humidity and the concentration ofmetals increased, so did suspended sulfate.Temperature had no effect on suspended sul-fate concentrations.
The data from field studies thus agree es-sentially with data from laboratory investi-gations; both show that sulfur dioxide can beoxidized to sulfuric acid or a salt of the acidin the atmosphere. The field studies show,from evidence taken in a number of geo-graphical locations, that a relationship existsbetween sulfur dioxide and sulfuric acid con-centrations in the air. The relationship isdependent partly upon the amount of moist-ure in the air, partly upon the time the sulfurcontaminants have been in the atmosphere,the amount of catalytic particulate matterPresent in the air, the amount (intensity andduration) of sunlight, the amounts of hydro-carbons and co Odes of nitrogen, and theamount of directly reactive and adsorptivematerials in the air, as well as on the extrntof recent precipitation.
D. ACIDITY OF RAINWATER ANDPARTICULATE MATTER
Gorham 2.1 studied the acidity (pH) of rain-fall in two cities of England and found thatit was more strongly related to the chloridecontent than to the sulfate content. Such astudy apparently has not been made in theUnited States; however, examination of somerainfall samples collected by the National AirSurveillance Network showed pH values
around 3. The National Air Surveillance Net-work data indicate that the chloride contentof suspended particulate matter is generallyvery low in atmospheres of the UnitedStates 25 except along coastal areas.
In another set of unpublished data collect-ed by the National Air Pollution Control Ad-ministration, sulfate accounted for 21 percentof the variation in pH of solutions of the sus-pended particulate matter, with an increaseof 12 µg /m3 of sulfate reducing the pH by 1unit. The pH values in both sets of dataranged from approximately 4 to 7.5. In thePresence of substantial amounts of ammonia,calcium carbonate, hydroxide, or other alka-line material, most of the sulfate is in saltform. The similarity of the magnitude of at-mospheric sulfuric acid concentrations, whencompared with the magnitude of total sulfateconcentrations, indicates that in some atmos-pheres a large part of the total sulfate maybe sulfuric acid.19-22 26
Measurements of acidity of dustfall, thoughseldom reported, indicate that dustfall may becapable of providing a few pounds of hydro-gen ions and a few hundred pounds of sulfateions per acre per year._; -2" The importanceof this to soil management is difficult to evalu-ate because of the heterogeneity of soils, theirgenerally great buffering capacity, and theprobable large, though unknown, bufferingcapacity of the dustfall itself. An order ofmagnitude estimation of the effect of acidityin dustfall is that approximately twice asmuch lime might have to be applied to thesoil in areas near large cities, as to the soilof rural areas. This assumes that the near-urban areas have average annual sulfate de-posits of eight to twelve tons per square milePer month (300 to 450 pounds per acre peryear). An approximately tenfold reduction insulfate deposit would be required to reduce itto about the amount removed by plants andleaching."" 31 Even though sulfur in some com-pounds is a major plant nutrient and is usedas a fertilizer element under certain condi-tions, it would seem that uncontrolled deposi-tion of sulfate from air pollution is undesir-able."2
E. SUMMARYTwo major programs for the surveillance
of atmospheric sulfur dioxide on a nation-
45

wide basis are operated by the U.S. PublicHealth Service and are (1) the National AirSurveillance Networks (NASN) , in which24-hour samples are obtained from about100 sites 26 times a year, and (2) the Con-tinuous Air Monitoring Project (CAMP) , inwhich 5-minute average concentrations arerecorded continuously in six large U.S. citiesWashington, Philadelphia, Cincinnati,Chicago, St. Louis, and Denver. The NASNProgram employs the colorimetric (i.e., West-Gaeke) method of analysis, while the CAMPProgram uses the electro-conductivity tech-nique and recently has added continuous,colorimetric ( West-Gaeke) SO2 monitoringdevices at all six locations.
Levels recorded in CAMP cities over theperiod from 1962 to 1967 show mean annualconcentrations ranging from 0.01 ppm, inSan Francisco, to 0.18 ppm, in Chicago, withthe averages exceeding, for 1 percent of thetime, a concentration range between 0.09ppm and 0.68 ppm for the different cities.The NASN annual average concentrationsranged from 0.002 ppm, in Kansas City, Mis-souri, to 0.17 ppm, in New York City. Thehighest 24-hour average concentration was0.38 ppm, also in New York City, while thelowest 24-hour avearges were below the mini-mum value detectable by the instrumentsbelow approximately 0.001 ppm. Geographi-cally, the highest values were recorded in thenortheastern part of the United States, es-pecially east of the Mississippi River andnorth of the Ohio River, where large quanti-ties of high-sulfur fossil fuels are burned.
Extensive monitoring programs, such asthose described above, yield large quantitiesof data. Information expressed in terms ofaverage or maximum values does not give ascomplete a picture of air quality as does fre-quency distribution information, which showsthe percentage of time that concentrations ex-ceed specified levels. For a given averagingtime, measurements of sulfur dioxide concen-trations follow a log-normal frequency dis-tribution. The two statistical parameterscommonly used to describe this distributionare the geometric mean and the standard geo-metric deviation. CAMP data covering eightcities from 1962 to 1967 show that, as aver-aging times become shorter, higher maxima
46
and lower minima are obtained. This happensbecause, for shorter intervals, instantaneousfluctuations have greater effect on the record-ed values. The standard geometric deviation,which is an index of the deviation of thesamples from their geometric mean, there-fore is greater for shorter averaging periods.
Based on data from eight CAMP cities, the1-hour maximum value for the year is expect-ed to be about 10 to 20 times the annual aver-age, corresponding to standard geometricdeviations of 2 and 2.5, respectively. Thus, ifthe highest hourly average concentration forthe year is 0.3 ppm, the annual mean wouldbe about one-twentieth of this value, or 0.015ppm, for a city with a standard geometricdeviation of 2.5 and about one-tenth of thisvalue, or 0.03 ppm, for a city with a standardgeometric deviation of 2. Similarly, the 8-hour maximum ranges from about 6 to 10times the annual mean; the one-day maximumranges from 4 to 7 times the annual mean;and the maximum monthly average rangesfrom about 1.5 to 2 times the annual mean.
The CAMP data appear to be fairly repre-sentative of large U.S. metropolitan areas,but, for a city with a deviation outside theseboundaries, a method exists to calculate theexpected maximum concentrations, providingthe averaging times are 1 hour or greater."It is possible also to calculate the minimumconcentration for a given averaging time, aswell as the concentrations at various percen-tiles. These calculations make use of thegeometric mean and the standard geo-metric deviation of samples obtained ata particular averaging time, and it is pos-sible to derive the geometric mean and thestandard geometric deviation for one aver-aging time from samples obtained at otheraveraging times. The accuracy of methods forcalculating expected maxima, minima, orother concentrations from observed data forthe same or for different averaging times de-pends on the number of air samples takenrelative to the number of samples that couldbe taken if air sampling were continuous. Itappears that a fairly good approximation ofthe frequency distribution of hourly aver-ages over a year may be obtained withsamples covering 24-hour periods on 22 ran-domly selected days.

Frequency data on the percent of the timethat certain concentrations are exceeded usu-ally necessitate the use of a computer butprovide a very detailed description of airquality. For a given percentile, the concen-trations measured over different averagingtimes usually vary. However, for the 30-percentile point, i.e., the value which is notexceeded for 70 percent of the time, the con-centration appears to be about the same forall averaging times. Thus the 30-percentilevalue might be used as an indicator of the"general sulfur dioxide level" of a city, anindex useful for ranking one city against an-other.
The ratio of the maximum sulfur dioxideconcentration to the average value may begreater for measurements made near a singlepoint source than for a city as a whole. Foraveraging periods from 4 to 54 minutes, forexample the maximum concentrations en-countered near a point source were, respec-tively, 30 to 160 times the 6-month averagevalue. These ratios are considerably higherthan those calculated from the data for eightcities and 6 years shown in Table 3-1, andthey demonstrate the kind of impact that apoint source may have.
Hourly average concentrations of sulfurdioxide as high as 2.9 ppm have been meas-ured 1/4 mile from a coal-fired power plant.In general, concentrations decrease as (1)the distance from sources increase, and (2)the averaging time is extended. When aver-aged over many hours or days, concentrationsmeasured several miles from a large sourcemay be only a few hundredths of a part permillion. Near the point of discharge, powerplants, oil refineries, smelters, and sulfuricacid production units may yield high ground-level sulfur dioxide concentrations.
Sulfur dioxide is partially oxidized to sul-furic acid in the atmosphere. The ratio be-tween the two substances is dependent,among other things, on the oxidation rate,which in turn is dependent on the sunlightavailable and the concentration of moisture,catalysts, hydrocarbons, nitrogen oxides, andthe quantity of directly reactive and adsorp-tive materials in the air. Recent precipitationalso has an effect, as does the time varioussulfur contaminants have been in the atmos-phere.
F. REFERENCES1. Zimmer, C. E. and Larsen, R. I. "Calculating
Air Quality and its Control." J. Air PollutionControl Assoc., Vol. 15, pp. 565-572, Dec. 1965.
2. Brasser, L. J., Joosting, P. E., and van Zuilen,D. "Sulfur DioxideTo What Level is it Ac-ceptable?" Research Institute for Public HealthEngineering, Report G-300, Delft, The Nether-lands, July 1967.
3. Larsen, R. I. "A New Mathematical Model ofAir Pollution Concentration, Averaging Time,and Frequency." (Presented at 61st AnnualMeeting of the Air Pollution Control Associa-tion, St. Paul, Minnesota, June 23-27, 1968.)
4. "Concentrations of Volatile Sulfur Compoundsin Atmospheric Air." Air Industrial HygieneFoundation of America, Inc., Spec. Res. Bulls.1 and 2, 1937, 1938.
5. Commins, B. T. and Waller, R. E. "Observationsfor a Ten-Year Study of Pollution at a Site inthe City of London." Atmos. Environ., Vol. 1,pp. 49-68, 1967.
6. "Report of the International Joint Commission,United States and Canada, on the Pollution ofthe Atmosphere in the Detroit River Area."International Joint Commission (United Statesand Canada), Washington, D.C./Ottawa, Can-ada, p. 115.
7. Linzon, S. N. "Sulfur Dioxide, Injury to Treesin the Vicinity of Petroleum Refineries." ForestChronicle, Vol. 41, pp. 245-250, June 1965.
8. Katz, M. "Sulfur Dioxide in the Atmosphere ofIndustrial Areas." In: Effect of Sulfur Dioxideon Vegetation, National Research Council, Ot-tawa, Canada, 1939, pp. 14-50.
9. Sullivan, J. L. "The Nature and Extent of Pol-lution by Metallurgical Industries in Port Kem-bla." In: Air Pollution by Metallurgical Indus-tries, Div. Occupational Health N. S. W., Dept.of Public Health, Sydney, Australia, Vol. 1, 1962,pp. 1-59.
10. Linzon, S. N. "The Influence of Smelter Fumeson the Growth of White Pine in the SudburyRegion." Joint Pub. Ontario Dept. Lands andForests/Toronto Dept. Mines, 1958.
11. Martin, A. and Barber, F. R. "Investigations ofSulfur Dioxide Pollution Around a ModernPower Station." J. Inst. Fuel, Vol. 39, pp. 294-307, July 1966.
12. McCaldin, R. 0. and Bye, W. E. "Air PollutionAppraisal, Seward and New Florence, Pennsyl-vania." U.S. Public Health Service, Robert A.Taft Sanitary Engineering Center, 1961.
13. Coste, J. H. "Investigation of Atmospheric Pol-lution." Cong. Intern. Quin.). Pura Aplicada (Ma-drid), Vol. 6, pp. 274-287, 1934.
14. Coste, J. H. and Courtier, G. B. "Sulfuric Acidas a Disperse Phase in Town Air." Trans.Faraday Soc., Vol. 32, pp. 1198-1202, 1936.
15. Commins, B. T. "Determination of ParticulateAcid in Town Air." Analyst, Vol. 88, pp. 364-367, May 1963.
47

16. Bushtueva, K. A. "Ratio of Sulfur Dioxide and 23.Sulfuric Acid Aerosol in Atmospheric Air, inRelation to Meteorological Conditions." Gig. i
Sanit., Vol. 11, pp. 11-13, 1954. In: U.S.S.R.Literature on Air Pollution and Related Occu- 24.pational Diseases. A Survey, Vol. 4, Translatedby B. S. Levine, U.S. Dept. of Commerce, Officeof Technical Services, Washington, D.C., August 25.1960, pp. 193-196.
17. Bushtueva, K. A. "The Determination of theLimit of Allowable Concentrations of SulfurAcid in Atmospheric Air." In: Limits of Allow-able Concentrations of Atmospheric Pollutants,Book 3, 1957, Translated by B. S. Levine, U.S.Dept. of Commerce, Office of Technical Services,Washington, D.C., pp. 20-36.
18. Mader, P. P., Hamming, W. J., and Be llin, A."Determination of Small Amounts of SulfuricAcid in the Atmosphere." Anal. Chem., Vol. 22,pp. 1181-1183, Sept. 1950.
19. Chaney, A. L. "Investigations to Detect the At-mospheric Conversion of Sulfur Dioxide to Sul-fur Trioxide." Am. Petrol. Inst., Vol. 38, pp.306-312, 1958.
20. Thomas, M. D. "Sulfur Dioxide, Sulfuric AcidAerosol and Visibility in Los Angeles." Int. J.Air Water Pollution, Vol. 6, pp. 443-454; Nov. -Dec. 1962.
21. "Air Quality Data (1962) National Air Sam-pling Network." U.S. Dept. a Health, Educa-tion, and Welfare, Public Health Service, 1964.
22. "Air Quality Data (1963) National Air Sam-pling Network." U.S. Dept of Health, Educa-tion, and Welfare, Public Health Service, 1965.
48
26.
27.
28.
29.
30.
31.
32.
Perry, W. H. and Tabor, E. C. "National AirSampling Network Measurement of SO2 andNO2." Arch. Environ. Health, Vol. 4, pp. 254-264, March 1962.Gorham, E. "Atmospheric Pollution by Hydro-chloric A ;id." Quart. J. Roy. Meteorol. Soc., Vol.84, pp. 274-276, July 1958."Air Pollution Measurements of the NationalAir Sampling Network. Vol. I. Anal7ses of Sus-pended Particulates, 1953-1957." U.S. Dept. ofHealth, Education, and Welfare, Public HealthService, PHS-Pub-637, 1958."Air Pollution Measurements of the NationalAir Sampling Network. Vol. II. Analysis of Sus-pended Particulates, 1957-1961." U.S. Dept. ofHealth, Education, and Welfare, Public HealthService, PHS-Pub-978, 1962."Air Pollution in the El Paso, Texas Area. Re-port on a Two-Year Study under a CommunityAir Pollution Demonstration Project Grant." ElPaso City-County Health Unit, 1959.Katz, M. "Some Aspects of the Physical andChemical Nature of Air Pollution." W.H.O.Monograph Series 46, Columbia Univ. Press,New York, 1961, pp. 97-158.Junge, C. E. "Sulfur in the Atmosphere." J.Geophys. Res., Vol. 65, pp. 227-237, Jan. 1960.Lyon, T. L., Buckman, H 0., and Brady, N. 0."The Nature and Properties of Soils." 6th edi-tion, Macmillan, New York, 1960, 567 pp.Bertramson, B. R., Fried, M., and Tisdale, S. L."Sulfur Studies of Indiana Soils and Crops."Soil Sci., Vol. 70, pp. 27-41, 1950.Katz, M. "Sulfur Dioxide in the Atmosphere andits Relation to Plant Life." Ind. Eng. Chem.,Vol. 41, pp. 2450-2465, Nov. 1949.

Chapter 4
EFFECTS OF SULFUR OXIDES IN THE ATMOSPHEREON MATERIALS

Table of ContentsPage
A. INTRODUCTION 51
B. EFFECTS ON PAINTED SURFACES 51
C. DAMAGE TO METALS .. 51
D. EFFECTS ON BUILDING MATERIALS 54
E. EFFECTS ON TEXTILE FIBERS, DYES, AND MISCELLANEOUSMATERIALS 54
F. SUMMARY 55
G. REFERENCES 56
List of FiguresFigure4-1 Relationship Between Corrosion of Mild Steel and ,Corresponding
Mean Sulfur Dioxide Concentration for 3-, 6-, and 12-Month Ex-posures at Seven Chicago Sites (September 1963-1964)
50
53
Chapter 4
EFFECTS OF SULFUR OXIDES IN THE ATMOSPHERE ON MATERIALS
A. INTRODUCTION
In reviews of the effects of air pollution onmaterials, Yocom 1 and Burdick and Bark-ley 2 discuss the damage to metals, buildingmaterials, leather, paper, and textiles by theoxides of sulfur. Much of this damage is dueto the conversion of sulfur oxides to highlyreactive sulfuric acid. The combined actionof sulfur oxides and particulate matter isdiscussed in the companion report Air Qual-ity Criteria for Particulate Matter.
B. EFFECTS ON PAINTED SURFACESHolbrow 3 found that the drying times of
linseed, tung, and bodied dehydrated castoroil paint films exposed to 1 to 2 ppm SO,were increased by 50-100 percent. At higherconcentrations, 7 to 10 ppm, drying was de-layed by up to two to three days. Time ofexposure to SO, was not mentioned. It maybe assumed, however, that the exposure last-ed until the paint films were dry. Oleoresin-ous and alkyd paints pigmented with titan-ium dioxide had both their touch- and hard-dry times increased substantially.
Based on these results Holbrow concludedthat concentrations of SO, encountered infogs or near industrial sites can increase thedrying time and hardening time of certainkinds of paint systems. Some films becomesofter and others more brittle than thosedried in the absence of 50,a factor likelyto influence subsequent durability.
Holbrow 3 also found that when severaltypes of paints (simple oil, oleoresinous oralkyd) were allowed to dry in clean air for24 hours, then exposed to moisture and ab-normally high levels of SO, (12,000 ppm ormore; exposure time not specified), followedby exposure to warmth (temperature notstated) and moisture (quantity not indicat-
ed) for one hour, a significant reduction ingloss developed. Depending on the type ofpaint, the reduction in gloss, expressed as apercentage of the original value, ranged from85 percent to 10 percent. Alone, SO2 andmoisture caused no more than a small reduc-tion in gloss; it is only after exposure to fur-ther moisture and warmth that a largechange occurred. It appeared that SO, rend-ered the films water sensitive. Control ex-periments omitting SO, showed no loss ofgloss. Sensitivity to SO, is gradually lost thelonger paint is allowed to dry prior to ex-posure.
The blueing of Brunswick green occurswhen freshly applied paint is exposed to SO2levels of 0.2 ppm (duration of exposure notindicated) and subsequently exposed towarmth and moisture.3
Another troublesome paint defect is crys-talline bloom which results when paints areexposed to SO,, moisture, and ammonia.Bloom is due to the formation of very smallcrystals of ammonium sulfate. CalculatedSO, levels of 0.1 ppm (duration of exposurenot indicated) could cause moderate bloom.
C. DAMAGE TO METALS
Under normal conditions damage to metalsby the oxides of sulfur increases with in-creasing relative humidity and temperature.Particulate matter in the air also contributesto the deleterious effects. Sulfur oxides gen-erally accelerate corrosion by first being con-verted to sulfuric acid, either in the atmos-phere itself or on metal surfaces. The cor-rosion products are mainly sulfate salts ofthe exposed metals.4-7 In addition, atmos-pheric sulfuric acid can react with some sus-pended particles to form sulfate salts thatalso can accelerate corrosion of many metals.
51
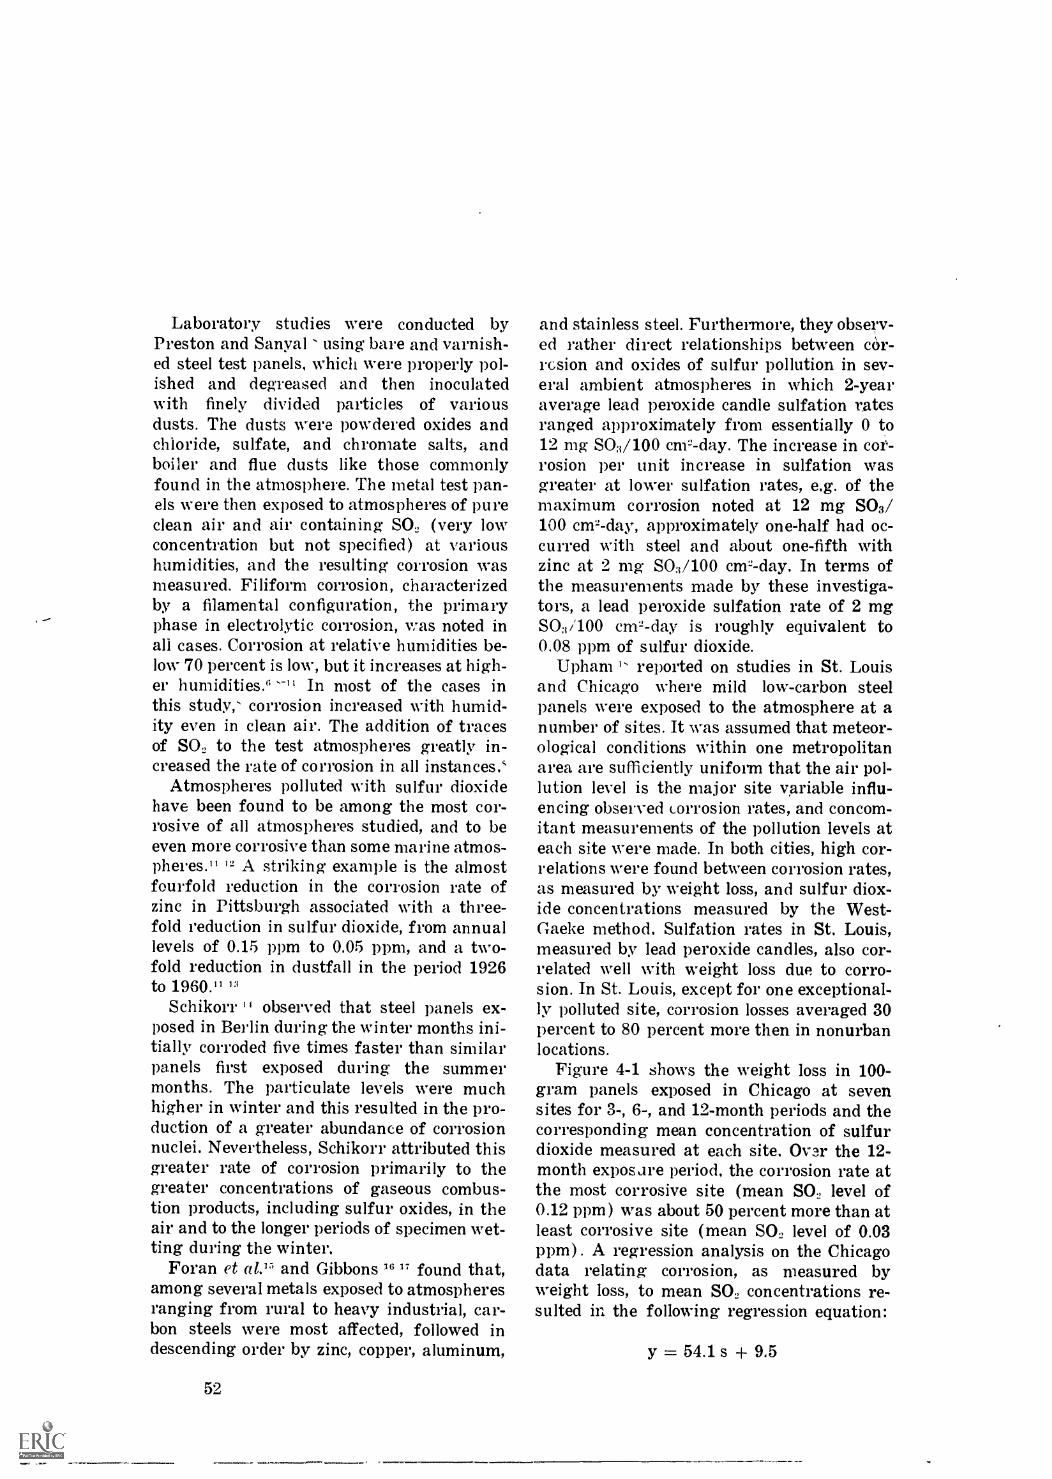
Laboratory studies were conducted byPreston and Sanyal using bare and varnish-ed steel test panels, which were properly pol-ished and degreased and then inoculatedwith finely divided particles of variousdusts. The dusts were powdered oxides andchloride, sulfate, and chromate salts, andboiler and flue dusts like those commonlyfound in the atmosphere. The metal test pan-els were then exposed to atmospheres of pureclean air and air containing SO2 (very lowconcentration but not specified) at varioushumidities, and the resulting corrosion wasmeasured. Filiform corrosion, characterizedby a filamental configuration, the primaryphase in electrolytic corrosion, was noted inall cases. Corrosion at relative humidities be-low 70 percent is low, but it increases at high-er humidities." 11 In most of the cases inthis study,' corrosion increased with humid-ity even in clean air. The addition of tracesof SO2 to the test atmospheres greatly in-creased the rate of corrosion in all instances.'
Atmospheres polluted with sulfur dioxidehave been found to be among the most cor-rosive of all atmospheres studied, and to beeven more corrosive than some marine atmos-pheres." 12 A striking example is the almostfourfold reduction in the corrosion rate ofzinc in Pittsburgh associated with a three-fold reduction in sulfur dioxide, from annuallevels of 0.15 ppm to 0.05 ppm, and a two-fold reduction in dustfall in the period 1926to 1960." 1"
Schikorr " observed that steel panels ex-posed in Berlin during the winter months ini-tially corroded five times faster than similarpanels first exposed during the summermonths. The particulate levels were muchhigher in winter and this resulted in the pro-duction of a greater abundance of corrosionnuclei. Nevertheless, Schikorr attributed thisgreater rate of corrosion primarily to thegreater concentrations of gaseous combus-tion products, including sulfur oxides, in theair and to the longer periods of specimen wet-ting during the winter.
Foran et 0.15 and Gibbons 16 " found that,among several metals exposed to atmospheresranging from rural to heavy industrial, car-bon steels were most affected, followed indescending order by zinc, copper, aluminum,
52
and stainless steel. Furthermore, they observ-ed rather direct relationships between car-rcsion and oxides of sulfur pollution in sev-eral ambient atmospheres in which 2-yearaverage lead peroxide candle sulfation ratesranged approximately from essentially 0 to12 mg S03/100 cm -- day. The increase in cor-rosion per unit increase in sulfation wasgreater at lower sulfation rates, e.g. of themaximum corrosion noted at 12 mg S03/100 cm_ -day, approximately one-half had oc-curred with steel and about one-fifth withzinc at 2 mg SO,,/100 cm- -day. In terms ofthe measurements made by these investiga-tors, a lead peroxide sulfation rate of 2 mgS03/100 cm- -day is roughly equivalent to0.08 ppm of sulfur dioxide.
Upham 1' reported on studies in St. Louisand Chicago where mild low-carbon steelpanels were exposed to the atmosphere at anumber of sites. It was assumed that meteor-ological conditions within one metropolitanarea are sufficiently uniform that the air pol-lution level is the major site variable influ-encing observed corrosion rates, and concom-itant measurements of the pollution levels ateach site were made. In both cities, high cor-relations were found between corrosion rates,as measured by weight loss, and sulfur diox-ide concentrations measured by the West-Gaeke method. Sulfation rates in St. Louis,measured by lead peroxide candles, also cor-related well with weight loss due to corro-sion. In St. Louis, except for one exceptional-1.Y polluted site, corrosion losses averaged 30Percent to 80 percent more then in nonurbanlocations.
Figure 4-1 shows the weight loss in 100-gram panels exposed in Chicago at sevensites for 3-, 6-, and 12-month periods and thecorresponding mean concentration of sulfurdioxide measured at each site. Ov 3r the 12-month exposure period, the corrosion rate atthe most corrosive site (mean SO2 level of0.12 ppm) was about 50 percent more than atleast corrosive site (mean SO2 level of 0.03ppm) . A regression analysis on the Chicagodata relating corrosion, as measured byweight loss, to mean SO2 concentrations re-sulted in the following regression equation:
y = 54.1 s + 9.5

18.0
:,4 16.0cy)
w 14.0Z<
12.0<cc(. 10.000.cr 8.0wa.v)U) 6.00-J
I- 4.0i(.5
LI2.0
Cr 0.02 0.04 0.06 0.08 0.10 0.12 0.14 0.16 0.18MEAN SULFUR DIOXIDE CONCENTRATION: ppm
Figure 4-1. Relationship between corrosion of mildsteel and corresponding mean sulfurdioxide concentration for 3-, 6-, and12-month exposures at seven Chicagosites (Sept. 1963-1964).
where
y = corrosion weight loss in grams per hun-dred gram panel (4" / 6" x 0.035" dimen-sions) and
s = mean SO2 concentration in ppm.
The regression coefficient was statisticallysignificant at the one-percent level. The linearrelationship expressed by this equation wouldbe valid only over the range of the observeddata (i.e., from 0.03 to 0.12 ppm mean annualconcentration) and in locatons with topog-graphy and climate similar to that of Chica-go. The relationships were linear also in St.Louis, although the slope for the 3-month ex-posure period was greater than that in Chi-cago, presumably because the 3-month ex-posure took place during the winter monthsin St. Louis and during the autumn in Chica-go. Differences between the two cities interms of climate and exposure site configura-tion also may have been influential.
Suspended particulate levels were meas-ured in Chicago at all seven sites with high-volume samplers, and these values correlatedwith corrosion rates. Since sulfur dioxide
concentrations and particulate concentrationsthemselves tend to correlate, a covarianceanalysis was carried out to determine therelative influence of these two pollutants.This adjusted analysis indicated that thedifference in corrosion rates at the varioussites resulted primarily from differences insulfur dioxide concentrations and not fromdifferences in particulate levels. Thus, sulfurdioxide levels appeared to have the dominantinfluence on corrosion rates. Dustfall meas-urements made in St. Louis did not show astatistically significant correlation with cor-rosion rates.
The economic significance of metal cor-rosion has not been adequately investigated.In England, it has been estimated that aboutone-third of the annual replacement cost forsteel rails is caused by air pollution.19Couy 2O-22 investigated the effect of atmos-pheric corrosion on maintenance and econom-ics of overhead line hardware and guy wiresin Pittsburgh. The conditions of actual ma-terials in use over the period roughly from1920 to 1940 were determined for areas ofsevere and average pollution. Areas of severepollution included valleys traversed by rail-ways and areas in direct windline with in-dustrial fumes. Formulae were developed todetermine the amount of inspection required,the materials needed, and the costs involvedfor a particular situation. No direct cost esti-mates were made but it appeared that the lifeof the materials in the severely polluted areaswas reduced to about two-thirds of that ofthe materials in the areas of average pollu-tion. The average annual sulfur dioxide con-centration during the period of the study wasinitially high (0.15 ppm) but had declinedto approximately 0.05 ppm by 1940 (0.04ppm in 1963) .'"
The effects of air pollution on electric con-tacts result in increased costs because of thelosses associated with increased resistance ofcontacts having corrosion films and becausemore costly, less reactive, metals must beused. The use of gold instead of silver forcontacts costs about 14.8 million dollars an-nually. If gold could be replaced by palla-dium, an annual savings of 8 million dollarswould result, but palladium tarnishes in asulfur dioxide atmosphere.'"
0 or 9

D. EFFECTS ON BUILDING MATERIALS
There has been little recent investigationof effects of ambient concentrations of sulfuroxides on building materials. Early work2 25-27shows that sulfur oxides may be associatedwith damage to various building materials.Sulfur dioxide, in the presence of moistureis converted to sulfurous or sulfuric acidswhich are capable of attacking a wide varietyof building materials, including limestone,marble, roofing slate, and mortar.2'--3° Anycarbonate-containing stone is damaged byhaving the carbonate converted to relativelysoluble sulfates, and then being leached awayby rainwater._`' 3" Other types of stone, suchas granite and certain sandstones, in whichthe grains are cemented together with ma-terials containing no carbonate, are relativelyunaffected by sulfur oxides in the atmos-phere.28
Building stones erode to a greater or lesserdegree according to their chemical composi-tion. Softer building stones, such as the lime-stones and dolomites, are attacked more read-ily by the acids formed by the interaction ofindustrial smokes (even in small quantities)and moisture."' The dolomites contain bothcalcium and magnesium carbonates, thelatter being readily soluble in an acid en-vironment; the dolomitic stones are thusmore vulnerable.2" "' 32 The calcium sulfateformed on the surface of masonry is abouttwice as bulky as the carbonate of the stonefrom which it was formed, so the stone ap-pears to grow leprous."' Granites, gneiss, andmany sandstones, which do not contain car-bonates, and well-baked bricks, glazed bricks,and glazed tiles are attacked less readily bythe sulfurous and sulfuric acids from the at-mosphere. Additionally, serious disintegra-tion of stone, caused in part by the expansiondue to corrosion of iron tie rods, can occur."Slates containing carbonates and the cal-careous sandstones often used as roofing ma-terials are also attacked by polluted acid at-mospheres.-'" Decay occurs mainly on theundersides, especially between the laps,where moisture is held as a thin film.
Baines 25 reported that the expansive force,which developed from the crystallization ofcalcium and magnesium salts along thl cleav-
54
age planes of stones in the buildings in vari-ous English cities, slowly opened up the oldsealed vents where they could be attacked byatmospheric acid, and even lifted fragmentsof stone several tons in weight. On the Brit-ish Houses of Parliament, which were ap-proximately 90 years old when the surveywas made, he found sulfate, which could onlyhave been derived from the attack upon thestone by atmospheric acid, in cracks and fis-sures as much as 20 inches from the surface.He observed that the increase in the volumeof crystallization of from 1 to 4.2 had thrownoff great pieces of stone. Over 35 tons ofstone were picked off portions of the buildingwithout using tools.
The deterioration of some of the finestmonuments of antiquity and thousands ofPieces of sculpture and carving in the open,on public buildings, and on cathedrals is amatter of increasing concern. The rate ofdecay has accelerated in recent years be-cause of the increased pace of TwentiethCentury industrialization and larger emis-sions of combustion products containing sul-fur oxides and particulate matter. Cleopat-ra's Needle, the large stone obelisk movedfrom Alexandria, Egypt, to London, has suf-fered more deterioration in the damp, smokyacid atmosphere of London in 70 to 80 yearsthan in the earlier 3,000 or more years of itshistory.
E. EFFECTS ON TEXTILE FIBERS,DYES, AND MISCELLANEOUS
MATERIALS
The vulnerability of textile fabrics andfurnishings to acid products of combustion,which are often sorbed on the particles emit-ted simultaneously by combustion sources,depends on the chemical composition of thetextiles."2 Cellulosic vegetable fibers, such ascotton, linen, hemp, jute, rayons, and syn-thetic nylons, are particularly sensitive toacid products of combustion such as sulfur-ous and sulfuric acids. After exposure tothese acids, such fibers lose tensile strength.""Animal fibers, such as wool and furs, aremore resistant to acid damage.32
Dyed fabrics containing certain classes ofdyes are attacked by acid compounds oftensorbed on atmospheric particles; the dye

coloring is reduced or sometimes destroyedentirely. Color changes of dyed fabrics ex-posed without sunlight to the atmospheres ofLos Angeles, Chicago, Phoenix, and Sarasota,Florida, were studied during the period Octo-ber through December, 1961." 35 For somedyes, maximum and severe fading occurredin Chicago, where sulfur dioxide concentra-tions were highest (NASN annual averageabout 0.09 ppm) .36 37
In controlled environment studies," se-lected dye-fabric combinations were exposedto a variety of pollutants (in the absence oflight) in order to assess dye fading char-acteristics. Auto exhaust showed no fading;clean air plus SO2 (1 ppm) showed no fad-ing; irradiated auto exhaust produced signifi-cant fading in some dyes; and irradiated autoexhaust plus SO2 (1 ppm) gave rise to fadingin additional dyes as well as more pro-nounced fading in those dyes that faded with-out SO,. This shows the positive synergisticeffect of SO2, and again emphasizes that inmany cases damage is a function of pol-lutants working together rather than bythemselves.
Leather has a strong affinity for SO.,which causes it to lose much of its strengthand ultimately to disintegrate. The storage ofvaluable leather-bound books in city librariescan pose a serious problem. Book bindingsstored in rooms with a free exchange of pol-luted air were found to deteriorate muchmore rapidly than those stored in confinedspaces or inside of glass cases.'"
Paper also absorbs SO2 which is oxidized tosulfuric acid. The sulfuric acid causes dis-coloration and renders the paper brittle andfragile.'" Exposures to SO. (2-9 ppm) for 10days resulted in embrittlement and a de-crease in folding resistance of both book andwriting paper.'
F. SUMMARY
Although more quantitative data present-ing dose-response relationships are needed,sufficient evidence exists to conclude that at-mospheres polluted with oxides of sulfur di-rectly and indirectly attack and damage awide range of materials and property. Muchof this damage is due to the conversion of sul-fur oxides to highly reactive sulfuric acid.
In the laboratory, steel test panels dustedwith particles commonly found in pollutedatmospheres (e.g., powdered oxides, boilerand flue dusts, and chloride, sulfate, andchromate salts) corroded at a low rate inclean air at relative humidities below 70Percent. The corrosion rate increased athumidities higher than 70 percent, and itgreatly increased when traces of sulfur diox-ide were added to the laboratory air.
Corrosion rates of most metals and es-pecially iron, steel, and zinc are acceleratedby sulfur dioxide-polluted environments. Par-ticulate matter, high humidity, and tempera-ture also play an important synergistic partin this corrosion reaction, Atmospheric cor-rosion studies show increased corrosion ratesin industrial areas where air pollution levels,including sulfur dioxide and related pollut-ants, are higher. Further, corrosion rates arehigher in the fall and winter seasons whenparticulate and sulfur oxides pollution ismore severe due to a greater consumption offuel for heating. Depending on the kind ofmetal exposed as well as location and dura-tion of exposure, corrosion rates were 1-1/2to 5 times greater in polluted atmospheresthan in rural environments. In Pittsburgh,from 1926 to 1960, when annual sulfur diox-ide levels were reduced from 0.15 ppm to 0.05ppm, zinc corrosion rates exhibited a four-fold reduction. In Chicago and St. Louis,where steel panels were exposed at a numberof sites, high correlations were found in eachcity between corrosion rates, as measuredby weight loss, and sulfur dioxide concentra-tions measured by the West-Gaeke method.In St. Louis, except for one exceptionally pol-luted site, corrosion losses averaged 30 per-cent to 80 percent more than in nonurbanlocations. Over a 12-month exposure periodin Chicago, the corrosion rate at the mostcorrosive site (mean SO2 level of 0.12 ppm)was about 50 percent more than at the leastcorrosive site (mean SO. level of 0.03 ppm) .
These correlations were statistically signifi-cant at the one-percent level. Sulfation ratesin St. Louis, measured by lead peroxide can-dle, also correlated well with weight loss dueto corrosion. Although suspended particulatelevels measured in Chicago with high-volumesamplers correlated with corrosion rates, a
55

covariance analysis indicated that sulfur di-oxide concentrations were the dominant in-fluence on corrosion. Measurements of dust-fall in St. Louis did not correlate significantlywith corrosion rates. Based on these data, itappears that considerable corrosion may takeplace (i.e., from 11 percent to 17 percentweight loss in steel panels) at annual sulfurdioxide concentrations in the range of 0.03ppm to 0.12 ppm, and although high particu-late levels tend to accompany high sulfur di-oxide levels, the sulfur dioxide concentrationhas a greater influence on the degree of cor-rosion that takes place.
Qualitative examples of effects resultingfrom corrosion by sulfur dioxide include:
1. a one-third reduction in the life ofoverhead power line hardware andguy wires;
2. the necessary use of more expensive,less corrodible metals such as gold insome electrical contacts; and
3. one-third of the annual damage tosteel rails in England.
Atmospheres containing oxides of sulfuralso attack and damage a wide variety ofbuilding materialslimestone, marble, roof-ing slate, and mortaras well as statuaryand other works of art, causing discolorationand actual physical deterioration. Certaintextile fiberssuch as cotton, rayon, andnylonare also harmed by atmospheric sul-fur oxides, and in the presence of other pol-lutants, fading of dyed fabrics may occur.Severe fading was noted for some dyes infabrics exposed in Chicago, where annualaverage sulfur dioxide levels were 0.09 ppm.Leather exposed to sulfur dioxide may losemuch of its strength while paper becomesdiscolored and brittle.
Concentrations of 1 ppm SO) can increasethe drying time of some oil-based paints by50 percent to 100 percent. Some films becomesofter and others more brittle, a factor likelyto influence subsequent durability. Sulfur di-oxide also appears to render some paint filmswater sensitive, resulting in reduced gloss.Under certain conditions, SO, levels of 0.1ppm to 0.2 ppm can cause the blueing ofBrunswick green, and in the presence of am-monia produce a troublesome defect called
56
crystalline bloom, due to the formation ofvery small ammonium sulfate crystals.
G. REFERENCES1. Yocum, J. E. and McCaldin, R. 0. "Effects of Air
Pollution on Materials and the Economy." In:Air Pollution, 2nd edition, Vol. I, A. C. Stern(ed.), Academic Press, New York, 1968, pp. 617-654.
2. Burdick, L. R. and Barkley, J. F. "Effect of Sul-fur Compounds in the Air on Various Materials."U.S. Bureau of Mines, Information Circular7064, April 1939.
3. Holbrow, G. L. "Atmospheric Pollution: ItsMeasurement and Some Effects on Paint." J. OilColour Chem. Assoc., Vol. 45, pp. 701-718, Oct.1962.
4. Serada, P. J. "Atmospheric Factors Affectingthe Corrosion of Steel." Ind. Eng. Chem., Vol.2, pp. 157-160, Feb. 1960.
5. Greenblatt, J. H. and Pearlman, R. "The Influ-ence of Atmospheric Contaminants on the Cor-rosion of Steel." Chem. Canada, Vol. 14, pp.21-23, Nov. 1962.
6. Vernon, W. H. J. "The Corrosion of Metals, Lec-ture I." J. Roy. Soc. Arts, pp. 578-610, July 1,1949.
7. Sanyal, B. and Bhardwar, D. V. "The Corrosionof Metals in Synthetic Atmospheres ContainingSulphur Dioxide." J. Sci. Ind. Res. (New Delhi),Vol. 18A, pp. 69-74, Feb. 1959.
8. Preston, R. St. J. and Sanyal, B. "AtmosphericCorrosion by Nuclei." J. Appl. Chem., Vol. 6, pp.26-44, Jan. 1956.
9. Vernon, W. H. J. "A Laboratory Study of theAtmospheric Corrosion of Metals, Parts II andIII." Trans. Faraday Soc., Vol. 31, pp. 1668-1700, Dec. 1935.
10. Vernon, W. H. J. "The Atmospheric Corrosionof Metals." Soc. Chem. Ind. (Chem. Eng.Group), Prof., Vol. 19, pp. 14-22, 1937.
11. Tice, E. A. "Effects of Air Pollution on theAtmospheric Corrosion Behavior of Some Metalsand Alloys." J. Air Pollution Control Assoc.,Vol. 12, pp. 553-559, Dec. 1962.
12. "Symposium on Atmospheric Corrosion of Non-Ferrous Metals." Spec. Tech. Pub. 175. (Pre-sented at the 58th Annual Meeting, AmericanSociety for Testing Materials, Atlantic City,N. J., June 29, 1955.)
13. Anderson, D. M., Lieben, J., and Sussman, V. H."Pure Air for Pennsylvania." PennsylvaniaDept. of Health and U.S. Dept. of Health, Edu-cation, and Welfare, Public Health Service, Nov.1961.
14. Schikorr, G. "The Atmospheric Rusting of Iron."Korrosion and Metallschutz., pp. 305-313, Sept.17, 1941.
15. Foran, M. R., Gibbons, E. V., and Wellington,J. R., "The Measurement of Atmospheric Sul-phur Dioxide and Chlorides." Chem. Canada,Vol. 10, pp. 33-41, May 1958.

16. Gibbons, E. V. "Atmospheric Corrosion Testingof Metals in Canada." Corrosion, Vol. 17, pp.318-320,1961.
17. Gibbons, E. V. "The Corrosion Behavior of theMajor Architectural and Structural Metals inCanadian Atmospheres. Summary of Two-YearResults." National Research Council, Ottawa,Canada, Feb. 25,1959.
18. Upham, J. B. "Atmospheric Corrosion Studiesin Two Metropolitan Areas." J. Air PollutionControl Assoc., Vol. 17, pp. 398-402, June 1967.
19. "Committee on Air Pollution, Beaver, H., Chair-man, Report." Her Majesty's Stationery Office,London, 1954.
20. Couy, C. J. "Effect of Atmospheric Corrosionon Maintenance and Economics of Overhead LineHardware and Guy Strand, Part 1." Corrosion(Natl. Assoc. Corr. Eng.), Vol. 4, pp. 133-140,April 1948.
21. Couy, C J. "Effect of Atmospheric Corrosion onMaintenance and Economics of Overhead LineHardware and Guy Strand, Part 2." Corrosion(Natl. Assoc. Corr. Eng.), Vol. 4, pp. 207-218,May 1948.
22. Couy, C. J. "Effect of Atmospheric Corrosion onMaintenance and Economics of Overhead LineHardware and Guy Strand, Part 3." Corrosion(Natl. Assoc. Corr. Eng.), Vol. 4, pp. 287-303,June 1948.
23. Gilbert, P. T. "The Protection of Steel AgainstAtmospheric Corrosion by Metallic Coatings."Ind. Chem., Belge., Vol. 19, pp. 405-415, Sept.1963.
24. Antler, M. and Gilbert, J. "Effects of Air Pol-lution on Electric Contacts." J. Air PollutionControl Assoc., Vol. 13, pp. 405-415, Sept. 1963.
25. Baines, F. "Examination into Effects of Air Pol-lution on Building-Stones, etc." National SmokeAbatement Society, Manchester, England, 1934.
26. Parker, A. "The Destructive Effects of Air Pol-lution on Materials." In: Proceedings, 1955 An-nual Conference, National Smoke Abatement So-
ciety, London, 1955, pp. 3-15. (Presented atSixth Des Voeux Memorial Lecture.)
27. Mc Burney, J. W. "Effect of the Atmosphere onMasonry and Related Materials." In: Sympo-sium on Some Approaches to Durability in Struc-tures, Boston, Massachusetts, June 23,1958, Spec.Tech. Pub. 236, pp. 45-52.
28. Yocum, J. E. "The Deterioration of Materials inPolluted Atmospheres." J. Air Pollution ControlAssoc., 8(4) :203-208, Nov. 1958.
29. Benner, R. C., IV. "The Effect of Smoke onStone." In: Papers on the Effect of Smoke onBuilding Materials, University of Pittsburgh,Mellon Institute of Industrial Research andSchool of Specific Industries, Buhetin 6, 1913.
30. Turner, T. H. "Damage to Structures by Atmos-pheric Pollution." Smokeless Air, Vol. 23, pp.22-26, Autumn 1952.
31. Regan, C. J. "A Chadwick Lecture on Air Pol-lution." Smokeless Air, Vol. 88, pp. 67-76, 1953.
32. Petrie, T. C. "Smoke and the Curtains." Smoke-less Air, Vol. 18, pp. 62-64, Summer 1948.
33. Waller, R. E. "Acid Droplets in Urban Air."Int. J. Air Water Pollution, Vol. 7, pp. 773-778,1963.
34. Salvin, V. S. "Effect of Air Pollutants on DyedFabrics." J. Air Pollution Control Assoc., Vol.13, pp. 416-422, Sept. 1963.
35. Salvin, V. S. "Relation of Atmospheric Con-taminants and Ozone to Lightfastness." Am.Dyestuff Rep., Vol. 53, pp. 33-41, Jan. 6, 1964.
36. "Air Quality Data (1962) National Air Sam-pling Network." U.S. Dept. of Health, Educa-tion, and Welfare, Public Health Service, 1964.
37. "Air Quality Data (1963) National Air Sam-pling Network." U.S. Dept. of Health, Educa-tion, and Welfare, Public Health Service, 1965.
38. Ajax, R. L., Conlee, C. J., and Upham, J. B."The Effects of Air Pollution on the Fading ofDyed Fabrics." J. Air Pollution Control Assoc.,Vol. 17, pp. 220-224, April 1967.
57

Chapter 5
EFFECTS OF SULFUR OXIDES IN THE ATMOSPHEREON VEGETATION

Table of ContentsPage
A. INTRODUCTION 61
B. SYMPTOMS IN VEGETATION OF EXPOSURE TO SULFURDIOXIDE 611. Acute Injury 612. Chronic Injury 623. Physiological Effects 624. Mechanism of Injury 63
C. SUSCEPTIBILITY OF VEGETATION TO SULFUR DIOXIDE 63
D. FACTORS AFFECTING PHYTOTOXICITY 651. Temperature 652. Relative Humidity . 663. Soil Moisture 664. Light Intensity 665. Nutrient Supply 666. Age of Plant Tissue 66
E. SYNERGISTIC EFFECTS OF SULFUR DIOXIDE AND OZONE . 66
F. EFFECTS OF SULFURIC ACID MIST ON VEGETATION
G. SUMMARY
H. REFERENCES
List of FiguresFigure
5-1. Curves Showing Concentrations of Sulfur Dioxide Which Will Pro-duce Three Different Stages of Acute Alfalfa Leaf Damage in Differ-ent Time Periods under Conditions of Maximum Absorption . .
60
66
67
68
64

Chapter 5
EFFECTS OF SULFUR OXIDES IN THE ATMOSPHERE ON VEGETATION
A. INTRODUCTION
Extensive experiments and observationshave been made for over one hundred yearson the effects of sulfur dioxide on vegetationby investigators in all parts of the world.Substantial reviews of vegetation injuryfrom the oxides of sulfur have been made byThomas,1-4 Sheffer and Hedgcock,5 Brandtand Heck,6 and Katz and McCallum,7 andDaines.s Summaries of acute effects on alarge number of plant species susceptible tosulfur dioxide injury are given by Wood 9and in the Environmental Biology Volume ofBiological Handbooks.10 Although Thomas 4stated that the effects of sulfur dioxide onplants are fairly well understood, there arestill some points of unresolved controversyin the literature. The response of plantsto sulfur dioxide presents a many facetedproblems and involves the interactions ofplant characteristics, environmental condi-tions, and dosage of the toxicant.
According to Katz,11 one of the first de-scriptions of sulfur dioxide injury to plantswas by Schroeder and Ruess in 1883. De-scriptions of injury have appeared in numer-ous publications since that time.6-8 12-14 Two
general types of injury are produced by sul-fur dioxide, acute and chronic.1 6-8 Any over-all effect on growth and production is ap-parently associated with some degree of acuteinjury from sulfite or sulfurous acid or tochronic injury resulting from accumulationof sulfates."
B. SYMPTOMS IN VEGETATION OFEXPOSURE TO SULFUR DIOXIDE
1. Acute Injury
Acute injury results from the rapid ab-sorption of toxic concentrations of sulfur di-
oxide." Immediately after exposure, tissuesin sharply defined marginal and intercostalarea take on a dull water-soaked appearance.1'These areas subsequently dry out and bleachto an ivory color. On some species the lesionsfinally become brown to reddish-brown.4 6 15 16A sharp line usually separates the injuredlesion from surrounding, apparently healthy,leaf tissue. Injury seldom extends across theveins of broad-leafed plants unless the injuryis severe.=
Acute injury in pine usually occurs inbands on the tips of needles with the injuredarea taking on a red-brown color.? The in-jured area changes from the usual dark greencolor to a lighter green, then definite areasturn yellow-brown and finally red-brown,giving the banded appearance. The discolora-tion in conifers may involve the whole needleor limited areas of any portion. Abscissionmay follow after some interval and the af-fected trees are often deficient in needles.
The basic bleached and collapsed blotchesdescribed on broad-leafed plants are, how-ever, also typical on grass foliage.1718 Thefinal bleached pattern between the parallelveins of grass leaves gives a streaked effect.Often only the principal vein or ,"midrib"remains intact. The collapsed lesion generallyextends uniformly though the entire thick-ness of the leaf blade.
Holmes et a/.12 found that barley, growingin the field, was severely injured by fumiga-tions with 5 ppm sulfur dioxide administeredone hour a day on six successive days. If thesame total dosage was applied for muchshorter intervals during the six days, therewas much less injury. Apparently injurycould be repaired if sufficient periods free oftoxicant were provided. It was also reportedthat injury to very young barley plants didnot reduce final yield but that injury late in
61

the life of the plants caused significant reduc-tion in yield. No yield reduction occurred un-less visible damage symptoms were detectedon the foliage.
2. Chronic InjurySublethal concentrations of sulfur dioxide
may require several days or weeks to causethe development of the gradual yellowing orchlorotic symptom of chronic injury.2 Theslow fading of green color over a period ofseveral days suggests that the chlorophyll-making mechanism is being destroyed andthat the green pigment cannot be replenished.If only a few cells in an area are affected, thearea may become chlorotic or brownish-red.A large amount of sulfate is found in leaveswith chronic symptoms," whereas leaveswhich are acutely injured show only a smallincrease in sulfate content. Large quantitiesof sulfate may be accumulated in leaf tissuewithout causing injury. 14 27 Yet, if excessiveamounts are absorbed rapidly, acute injuryresults.
Sulfur dioxide is very soluble in water andis absorbed by leaves. If absorbed slowly itis oxidized or perhaps reduced to a small ex-tent." The sulfuric acid resulting from oxi-dation and hydrolysis in the leaf tissue israpidly metabolized by organic bases. Acidsformed in the leaf tissue may reduce thebuffer capacity without changing pH andwhen the buffering capacity is exceeded,chlorosis results. A recent report 19 indicatesthat the reduction of sulfur dioxide in the leaftissue may have more significance than pre-viously proposed by Thomas," since consid-erable hydrogen sulfide was given off bytomato plants during, and for a time after,fumigation with sulfur dioxide.
3. Physiological EffectsThe "invisible injury" theory suggesting
that suppression of growth and yield may oc-cur because of long-term low concentrationexposure to sulfur dioxide, even if visiblesymptoms of foliage injury do not develop,was proposed by Stoklasa.2° According to Set-terstrom,21 this theory was supported by sev-eral investigators, including Wieler, Brede-mann, Janson, and Bleasdale. Many investi-gators accept the thesis that growth and yieldare not affected unless visible symptoms of
62
injury occur on the foliage. 1 2 6 22-24 There isa straight-line relationship between yield ofalfalfa and either the total area destroyed byacute symptoms or the area covered by thechlorotic symptom.25 The amount of yieldreduction produced by sulfur dioxide symp-toms can be duplicated by clipping a compa-rable amount of leaf area from healthyplants.76 Destruction of portions of the leafarea and accompanying defoliation not onlyreduces yield of the current crop but mayadversely affect the next one or two clippings.
Reduction in growth of pine trees in thevicinity of sulfur dioxide sources has beenreported.? 26 27 This growth reduction wasevidently due to heavy defoliation and de-struction of portions of needles during pro-longed exposure to levels of sulfur dioxidesufficient to kill cells and tissue or to buildsulfate concentrations to a level which de-stroyed chlorophyll. Needles of many coni-fers are normally retained for three or moreyears and accumulate sulfate from continuedlow concentrations of sulfur dioxide. Needledrop is stimulated by high levels of sulfates,and trees growing near sulfur dioxidesources often have very sparse foliage.27
Defoliation of citrus trees exposed to sul-fur dioxide has been observed in Japan.28Defoliation increased with increasing con-centrations, and increased sulfur content offoliage coincided with the rate of defoliation.It was concluded that leaf analyses for sulfurcontent may be useful for evaluating chronicinjury, but such analyses could not be usedfor evaluating acute injury. A lower rate ofabsorption may produce symptoms of chloro-sis and reduce CO. exchange, causing tempo-rary disruption of photosynthesis and respi-ration. The rate of carbon dioxide exchangereturns to normal soon after the toxicant isremoved if visible symptoms do not develop.At very low concentrations, the sulfur oxidesmay be utilized by plants deficient in sulfurcausing stimulation of growth and produc-tion." 21 21 Bleasdale," in a study conductednear Manchester, England, found that yieldsof rye grass grown in unfiltered air weresignificantly lower than similar plants grownin filtered air. The SO2 levels in the unfilteredair ranged from 0.01 ppm to 0.06 ppm withexposure periods varying from 46 to 81 days.

No visible symptoms were observed on theplants exposed to SO.), it is not known wheth-er other gaseous pollutants were present.
4. Mechanism of InjuryThe mechanism by which sulfur dioxide
causes injury to leaf tissue is not thoroughlyunderstood, although a number of sugges-tions have been made. The acute symptomsare generally attributed to excessive sulfiteor sulfurous acid in the tissue."{ With ahigh rate of absorption, sulfite is thought toaccumulate; sulfurous acid is then formedand subsequently attacks the cells. Sulfur di-oxide enters the leaf through the stomataand is thought to be oxidized, perhaps byoxygen, a by-product of photosynthesis.2 Sul-furic acid is then formed and reacts withorganic bases." The resulting sulfates areapparently translocated with the transpira-tion stream and deposited at the tip or edgesof the leaf. Haselhoff 3° suggested that sulfurdioxide attaches itself to aldehydes and sug-ars in the leaf and as these products degrade,sulfurous or sulfuric acid is formed and in-jury results. Dorries 31 reasoned that localacidity from the sulfur dioxide split magne-sium from the chlorophyll molecule andformed pheophytin. Noack "2 suggested thatiron in the chloroplasts was inactivated bysulfur dioxide, causing interference with theassimilation of organic compounds by theplant.
C. SUSCEPTIBILITY OF VEGETATIONTO SULFUR DIOXIDE
Different species, different varieties withina plant species, and even individuals withina plant variety vary considerably in their sus-ceptibility to sulfur dioxide.6'. " Thomas 2-4tabulates many plants according to their sen-sitivity to sulfur dioxide. Since alfalfa is oneof the most sensitive plants, it was used as areference species and all other species andvarieties were compared with it. The orderof sensitivity was calculated by Thomas 25from unpublished data of O'Gara on resist-ance factors for over 300 plants. Accordingto Thomas, 25 O'Gara's method of determiningresistance consisted of fumigating the plantsfor one hour with a measured concentrationof sulfur dioxide just sufficient to causetraces of injury. A corrected threshold con-
centration for injury was calculated for 100percent relative humidity. This calculatedvalue was then divided by 1.25 ppm, whichwas the concentration required for incipientmarking on alfalfa in the 1-hour period. Theratings range from alfalfa, barley, endive,and cotton, the most sensitive, with ratingsof 1, through celery, citrus, and cantaloupe,with ratings of about 7, to privet leaves, themost resistant with a rating of 15.
O'Gara's unpublished data and his funda-mental equation for the "Law of gas actionon the plant cell "33 have been used extensive-ly by Thomas ' 3 4 12 23 to calculate relativesensitivity of various plants to sulfur dioxidefumigation and to determine the effect onyield. O'Gara's formula was:
t(CC) =K (5-1)
where t is time (hrs) through whichthe gas acts to produce a cer-tain effect,
C is the concentration (ppm) ofthe gas,
C. is the threshold concentration(ppm) of the gas for injury tothe plant, and
K is a constant.According to Thomas 25 the amount of in-
jury caused by a given quantity of sulfur di-oxide varies with the rate of absorption; thatis, a given amount of gas, absorbed in a shorttime period, will cause more leaf destructionthan if the absorption were to occur over alonger period. General time-concentration-absorption equations for data obtained fromfumigations of alfalfa are proposed. By ap-plying these equations to data from numer-ous fumigations, it was possible to calculatethe dosage required to produce any observeddegree of injury under conditions of maxi-mum sensitivity. For example, equations rep-resenting incipient marking, 50 percent leafdestruction and 100 percent leaf destruction,under conditions of maximum sensitivitywere:
tC =0.94 +0.24t (traces of leafdestruction appear),tC =2.1 + 1.4t (50 percent leafdestruction occurs), andtC =3.2 +2.6t (100 percent leafdestruction occurs) .
63

Injury thus begins after four hours of ex-posure to 0.45 ppm, etc. Curves constructedfrom these calculations are plotted in Figure5-1. Guderian et a/.32 did not believe that theO'Gara equation fitted their observations andsuggested that an exponential equation of theform
t=ke-a (Cr) (5-2)where k, a, and r are parameters varyingwith species and degree of injury, best de-scribed their data.
An apparatus was developed by Spier-ings 37) whereby susceptibility of trees andshrubs to air pollutants could be determinedunder natural conditions without disruptionof prevailing climates. Fumigation experi-ments with sulfur dioxide showed that appleand pear varieties were the most susceptible10
1O 8
EaaI
cc
:R 6ZN0
u)
3zO 4Pacc1.-zu.ic.)Z 20c.)
0
100% LEAF DESTRUCTIONt (C 2.6) = 3.2
50% LEAF DESTRUCTIONt (C 1.4) = 2.1
TRACES OF LEAFDESTRUCTION APPEAR
t IC .24) = .94
0 1 2 3TIME (t) OF FUMIGATION HOURS
4
Figure 5-1. Curves Showing Concentrations of SulfurDioxide Which Will Produce Three DifferentDegrees of Acute Alfalfa Leaf Damage inDifferent Time Periods Under Conditionsof Maximum Absorption.
These curves from experimental data may be used toestimate the extent of damage to alfalfa at any sulfurdioxide concentration and exposure time.
64
of the fruit trees and that mountain-ash wasone of the most susceptible of the deciduousforest trees. Six-hour exposures of the fruitvarieties to 0.48 ppm produced injury, where-as injury to the mountain-ash was producedby three-hour exposures to 0.54 ppm of sul-fur dioxide.
Sheffer and Hedgcock 5 reported injury toponderosa pine, western larch, Pacific nine-bark, and creambush rockspirea during anexposure to 0.5 ppm for 7 hours. They con-cluded that the lowest concentration of sulfurdioxide that injures conifers is 0.25 ppm.Alfalfa is generally considered to be one ofthe most sensitive plants, and Thomas 16reported that photosynthesis or respirationby alfalfa plants was not affected by concen-trations up to 0.3 ppm unless the exposurewas so long that sulfate injury occurred.Katz and McCallum 7 reported that larch, oneof the most sensitive conifers, developedslight symptoms from 0.3 ppm sulfur dioxidein an 8-hour exposure. They concluded thatif concentrations higher than 0.3 ppm to 0.5ppm do not occur and if the duration of con-centration at the 0.3 ppm level is short in asingle gas exposure, plant damage should notoccur.
In the vicinity of the smelter at Trail,British Columbia, which in 1929 emitted anaverage of 18,600 tons of sulfur dioxide permonth, plant injury was noted as far as 52miles south of the smelter."' Three zones ofinjury were delineated on the basis of thepercentage injury to ponderosa pine, Douglasfir, and forest shrubs: in Zone 1 there was 60percent to 100 percent injury; in Zone 2, 30percent to 60 percent injury;, in Zone 3, 1percent to 30 percent injury. Zone 1, in whichinjury was acute, extended about 30 milessouth of the smelter in a river valley; Zone 3,at higher elevations, extended 52 miles southof the smelter and contained trees with rela-tively slight markings and trees sufferingfrom slow but progressive deterioration. Aft-er sulfur dioxide control devices were in-stalled, measurements in 1934 and again in1935 2" showed that the injury to broadleaftrees and to shrubs had dropped to 20 per-cent in the former Zone 1 and to 4 percent inthe former Zone 3. Appraisal of ponderosapine cone production in 1936 revealed that 81

Percent of the pines in Zone 1 had no conesand that outside the zone, 16 percent of thePines had no cones.5 Sulfur dioxide concen-trations 15 miles south of the smelter in Zone1 averaged about 0.03 ppm during the sum-mer with occasional peak concentrations inexcess of 0.5 ppm for a total time of 5 to 10hours.
Linzon "" reported marked growth suppres-sion and chlorotic needles on white pine atlocations 25 miles and less from the Sudbury,Ontario, shelter where measurable sulfur di-oxide concentrations were present from 10percent to 20 percent of the time. Concentra-tions of sulfur dioxide above 0.25 ppm werePresent less than 1 percent of the time; theremainder of the measurable concentrationswere less than 0.25 ppm. The annual aver-age concentrations apparently ranged down-ward from 0.03 ppm.
Sullivan "' reported damage to 36 percentof the home gardens in an area near a smel-ter in Australia where the annual averagesulfur dioxide concentration was 0.009 ppmand the maximum daily average 0.155 ppm.In another area more influenced by the smel-ter, 89 percent of the gardens were damaged;there the annual average was 0.033 ppm andthe maximum daily average 0.60 ppm. In thelatter area, during brief fumigations, sulfurdioxide concentrations ranged up to 10 ppm.
Injury to at least 15 tree species, includ-ing both conifers and hardwoods, in the vi-cinity of petroleum refineries processingcrude oil, which used 3 percent sulfur pitchresidue in the refinery furnaces, was re-ported by Linzon.3" Concentrations of sul-fur dioxide measured in the atmosphere ex-ceeded 0.5 ppm during 10 hours in one monthin this area with momentary peaks over 2ppm. Slight to severe acute injury was re-ported for all species within 1 to 2 milesfrom the refineries.
Reports of deteriorated vegetation in areasPolluted by sulfur dioxide 233" " make it clearthat injury can occur where annual aver-age concentrations are very low when thesources of pollution and/or the meteorologi-cal conditions are such that threshold forinjury is exceeded occasionally. There issome evidence of growth suppression andParticularly chronic injury, where concen-
trations never exceed 0.1 ppm.2"In Eastern Tennessee some mortality of
white pine has occurred from a disease calledpost-emergence chronic tipburn. The dis-ease has been noted only in industrial areas,generally within about 20 miles of plantswith substantial stack emissions. The af-fected area in Eastern Tennessee containsseveral large plants, including a large coal-fired power plant, a major uranium refine-ment operation, a pulp mill, a ferro-alloyreduction plant, and an iron foundry. Thereis convincing evidence that the causal agentof the disease is atmospheric. While SO2 wasconsidered by some as the most likely causeof the disease, the cause was regarded bythe investigators to be repeated or long con-tinued low-level fumigations with some un-identified gas or gases produced in the af-fected area. Whatever the causal agent, somewhite pine are so sensitive to it that theyhave developed striking foliage symptoms atdistances many miles from the pollutionsource.""
D. FACTORS AFFECTINGPHYTOTOXICITY
The response of vegetation to sulfur diox-ide as an air pollutant is influenced greatlyby temperature, relative humidity, light in-tensity, soil moisture, nutrient supply, andage of plant or tissue exposed. Each of thesefactors is discussed below.
1. TemperatureA plant is much more resistant to sulfur
dioxide at temperatures below 5° C (40°F).21 21 " Setterstrom and Zimmerman 4°found that buckwheat plants were equallysusceptible to injury at 65° F and 105° F.Several investigators " 21 2S have reportedgreater resistance in winter and have relatedthis to lower physiological activity of thePlants. Physiological activity of broad-leafedPlants declines sharply as the leaves becomesenescent and drop in fall and winter, butactivity is much higher in spring and earlysummer. Sensitivity to sulfur dioxide injuryis similarly higher in spring.11 Weaver andMorgensen 12 found that transpiration fromconifers in winter was scarcely greater thanfrom the defoliated stems of broad-leafed
65

trees. Apparently the conifers are essen-tially dormant in winter and gas exchangeby the needles is very low, thus increasingresistance to toxicants.
2. Relative HumidityAlthough reports of various investigators
do not show good agreement, susceptibilityof plants to sulfur dioxide generally tendsto increase with increases in relative humid-ity, providing light and soil moisture are notlimiting.' 1 21 23 40
3. Soil Moisture
Minor variations in soil moisture duringexposure have no detectable effect on sus-ceptibility if there is sufficient moisture fornormal plant growth.'" When plants ap-proach the wilting point, resistance increasessignificantly. Plants grown with an amplewater supply are much more susceptible thanPlants grown with inadequate water.
4. Light IntensityPlants in complete darkness are highly re-
sistant to sulfur dioxide and the resistancedecreases as the light intensity is increasedup to 3,000 candles. Plants grown in shadebefore exposure to the toxicant are moresusceptible than those grown in fullsun. 13 21 23 40
5. Nutrient SupplyAlfalfa plants grown in a deficient nutri-
ent supply were more susceptible to sulfurdioxide than plants receiving adequate nu-trients."
6. Age of Plant TissueYoung plants and newer foliage are much
more resistant to sulfur dioxide than olderleaves. Middle-aged leaves have highest sus-ceptibility.°
E. SYNERGISTIC EFFECTS OF SULFURDIOXIDE AND OZONE
Menser and Heggestad ° demonstratedsynergistic action between sulfur dioxideand ozone. Combinations of sublethal con-centrations of sulfur dioxide (0.24 ppm) andozone (0.03 ppm) in two-hour fumigationsproduced injury to tobacco plants. When theexposure time was doubled (4 hours), the
66
severity of response was approximately dou-bled, but there was no response when fumi-gation consisted of either sulfur dioxide orozone alone. Heck " found moderate to se-vere injury on tobacco from 4-hour expos-ures to 0.03 ppm of ozone in combinationwith 0.1 ppm of sulfur dioxide. Middletonet al.' reported that the addition of smallamounts of sulfur dioxide to polluted atmos-pheres in the Los Angeles Basin reduced theamount of injury produced in plants. Healso reported that a ratio of sulfur dioxideto ozone less than 4:1 made the plants lesssusceptible to ozone damage; but if the ra-tio was 6: 1 or higher, there was no evidenceof interference with ozone susceptibility.Studies by Hindawi .15 substantiate the syner-gistic responses reported for ozone and sul-fur dioxide. Heck -" reported a synergisticreaction between nitrogen dioxide and sulfurdioxide. A 4-hour exposure to a mixture of0.1 ppm of nitrogen dioxide and 0.1 ppm ofsulfur dioxide produced moderate injury toa sensitive tobacco variety. If there is asynergistic response between ozone and sul-fur dioxide or other pollutants, it offers aPartial explanation for occasional inconsist-encies between findings in the laboratorywith single agents and findings on plant re-sponse in the natural environment.
F. EFFECTS OF SULFURIC ACID MISTON VEGETATION
Thomas et al.'2 discussed experiments inwhich plants were exposed to sulfuric acidmists in concentrations of from 108 mg/m3to 2160 mg/m3. Sulfuric acid droplets havesettled on dry leaves without causing injury,but when the leaf surface was wet a spottedinjury has developed. Middleton et a/.15 andThomas 2 reported that this type of injuryoccurred in the Los Angeles area during pe-riods of heavy air pollution accompanied byfog when the surface of the leaf may be wet.Injury may also occur in the absence of fognear combustion effluents containing sulfuroxides when the gas affluent dew point per-mits acid droplet formation.
The sequence of symptom development isone in which the exposed surface, usuallythe upper surface, shows the initial necrosis.The pH of the leaf-surface moisture may be

less than three. Cellular collapse in manysmall spots develops progressively throughVie upper epidermis, mesophyll, and lowerepidermis of the leaf, leaving scorched areas.No glazing or bleaching accompanies thisinjury, and leaf areas covered by exposedleaves show no marking. In the Los Angelesarea, swiss chard and beets have shown themost typical injury (described above) ofall plant species examined. Alfalfa has alsodeveloped a spotted injury pattern. Spinachis more uniformly wetted by fog and hasshown a more diffuse type of injury.
G. SUMMARY
Sulfur dioxide absorbed by plants mayproduce two types of visible leaf injury,acute and chronic. Acute injury, which isassociated with high concentrations overrelatively short intervals, usually results inthe injured tissues drying to an ivory color,but sometimes they darken to a reddish-brown. Brownish discoloration occurs in thetips of pine needles, which may be followedby abscission, while broad-leaved plants andgrasses show necrotic blotching. Chronic in-jury, which results from lower concentra-tions over a number of days or weeks, leadsto a gradual yellowing (i.e., chlorosis, inwhich the chlorophyll-making mechanism isimpeded) or pigmentation of leaf tissue.Generally, for growth and production to beaffected, visible symptoms of injury, such asacute lesions, chronic chlorosis, or excessiveleaf drop, also occur.
The mechanism by which acute injury oc-curs apparently involves the plant's abilityto transform absorbed sulfur dioxide intosulfuric acid and then into sulfates which aredeposited at the tip or edges of the leaf;with a high rate of absorption, sulfite isthought to accumulate, and sulfurous acidis then formed which subsequently attacksthe cells. Chronic injury, on the other hand,results from the gradual accumulation of ex-cessive amounts of sulfate in the leaf tissue.Sulfate formed in the leaf from sulfur diox-ide absorbed from the atmosphere is addi-tive to sulfate absorbed through the roots.Although levels of sulfate in some leaf tis-sue five to ten times above normal have beennoted with no detectable symptoms of in-
jury, very high levels cause chronic symp-toms and stimulate leaf drop.
The amount of acute injury caused by sul-fur dioxide depends on the absorption rateof the gas, which is a function of the con-centration. Thus a given amount of gas ob-sorbed in a short period (at a high concen-tration) will cause more leaf destructionthan if the same amount of gas were ab-sorbed over a longer period (at a lower con-centration). Mathematical expressions havebeen worked out which, for some plant spe-cies, may be used to relate concentration,time of exposure, and amount of damage.Different varieties of plants vary widely intheir susceptibility to sulfur dioxide injury.The threshold response of alfalfa to acuteinjury is 1.25 ppm over one hour, whereasprivet requires 15 times this concentrationfor the same amount of injury to develop.Some species of trees and shrubs have showninjury at exposures of 0.5 ppm for sevenhours, while injury has been produced inother species at 3-hour sulfur dioxide expo-sures of 0.54 ppm and, in still others, at 8-hour exposures of 0.3 ppm. From such stud-ies, it appears that acute symptoms will notoccur if the maximum concentration for theyear does not exceed 0.3 ppm. From thedata on the CAMP cities (Chapter 3), an 8-hour maximum concentration of 0.3 ppmwould correspond to a mean annual concen-tration of between 0.03 ppm and 0.05 ppm.
Chronic symptoms and excessive leaf dropmay be produced by long-term exposures tolower concentrations and have been reportedin locations where the mean annual concen-tration is below about 0.03 ppm. Becausechronic injury results from the slow build-up of sulfate in the tissue, leaf sulfate analy-ses may be a useful index for evaluatingchronic injury.
The suppression of growth and yield us-ually is accompanied by visible symptomsof injury. A straight-line relationship, forexample, has been found between the yieldof alfalfa and the total area destroyed byacute symptoms or the area covered by thechlorotic symptoms. However, it has beensuggested that, in some cases, sulfur dioxidemight suppress growth and yield withoutcausing visible injury. One investigator re-
67

ported that yields of rye grass grown in un-filtered air were significantly lower thansimilar plants grown in filtered air, with novisible symptoms in the plants. Sulfur di-oxide levels in the unfiltered air ranged from0.01 ppm to 0.06 ppm with exposure periodsranging from 46 to 81 days, although it isnot known whether other gaseous pollutantswere present.
Sensitivity of plant materials is affectedsignificantly by such environmental condi-tions as temperature, relative humidity, soilmoisture, light intensity, nutrient level, andby sulfate content of the soil and irrigationwater. At locations in the vicinity of pointsources of sulfur dioxide, high concentra-tions occur with greater frequency and dam-age to plants is more likely to occur. Plantdamage has been noted as much as 52 milesdownwind from a smelting operation whichemitted large quantities of sulfur dioxide.Slight-to-severe injury was reported to atleast 15 tree species, including both conifersand hardwoods, in the vicinity of petroleumrefineries where concentrations exceeded 0.5ppm during 10 hours in one month withmomentary peaks as high as 2 ppm.
Sulfur dioxide concentrations from 0.05to 0.25 ppm will react synergistically witheither ozone or nitrogen dioxide in shortterm exposures (e.g., 4 hours) to producemoderate-to-severe injury on certain sensi-tive plants.
Sulfuric acid mist, which may occur inpolluted fogs and mists, also damages leaves.The acid droplets cause a spotted injury toleaves which are wet due to fog conditions.Such injury may occur at concentrations of0.1 mg /ms.
5.
6.
7.
8.
9.
10.
14.
15.
16.
17.H. REFERENCES
1. Thomas, M. D. "Gas Damage to Plants." Ann.Rev. Plant Physiol., Vol. 2, pp. 293-322, 1951.
2. Thomas, M. D., Hendricks, R. H., and Hill, G. R."Some Impurities in the Air and Their Effects 18.on Plants." In: Air Pollution, L. C. McCabe(ed.), McGraw-Hill, New York, 1952, pp. 41-47.
3. Thomas, M. D. and Hendricks, R. H. "Effect ofAir Pollutants on Plants." In: Air PollutionHandbook, McGraw-Hill, New York, 1956. 19.
4. Thomas, M. D. "Effects of Air Pollution onPlants." In: Air Pollution, W. H. 0. Monograph 20.Series 46, Columbia Univ. Press, New York,1961, pp. 233-275.
68
Sheffer, T. C. and Hedgcock, G. G. "Injury toNorthwestern Forest Trees by Sulfur Dioxidefrom Smelters." U.S. Dept. Agri., Forest Ser-vice, Tech. Bull. 1117, 1955.Brandt, C. S. and Heck, W. W. "Effects of AirPollutants on Vegetation." In: Air Pollution,2nd edition, Vol. I, A. C. Stern (ed.), AcademicPress, New YorkLondon, 1968, pp. 401-443.Katz, M. and McCallum, A. W. "The Effect ofSulfur Dioxide on Conifers." In: Air Pollu-tion, Chapt. 8, L. C. McCabe (ed.), 1952, pp.84-96.Daines, R. H. "Sulfur Dioxide and Plant Re-sponse." Preprint. (Presented at Symposiumon Air Quality Criteria, New York, June 5,1968.)Wood, F. A. J. Occup. Med., Vol. 10, pp. 92-102,1962. (Discussion at Symposium on Air QualityCriteria, New York, June 4-5, 1968.)Altman, P. L. and Dittner, D. S. (eds.) "En-vironmental Biology (Biological Handbooks)."Federation of American Societies for Experi-mental Biology, Bethesda, Maryland, 1966, p.315.Katz, M. "Sulfur Dioxide in the Atmosphere andits Relation to Plant Life." Ind. Eng. Chem.;Vol. 41, pp. 2450-2465, 1949.Holmes, J. A., Franklin, E. C., and Gould, R. A."Selby Report." U.S. Bureau of Mines, Bulletin98, 1915.Solberg, R. A. and Adams, D. F. "HistologicalResponse of Some Plant Leaves to HydrogenFluoride and Sulfur Dioxide." Amer. J. Bot.,Vol. 43, pp. 755-760, 1956.Thomas, M. D., Hendricks, R. H., and Hill, G. R."Sulfur Metabolism of Plants: Effect of SulfurDioxide on Vegetation." Ind. Eng. Chem.,42 (11) :2231-2235, 1950.Middleton, J. T., Darley, E. F., and Brewer, R. F."Damage to Vegetation from Polluted Atmos-pheres." J. Air Pollution Control Assoc., Vol. 8,pp. 9-15, 1958.Thomas, M. D. and Hill, G. R. "Relation of Sul-fur Dioxide in the Atmosphere to Photosynthesisand Respiration of Alfalfa." Plant Physiol.,Vol. 12, pp. 309-383, 1937.Brennan, L. and Daines, R. H. "Investigation ofSO2 Effects on Rubber Trees as a Means of Fore-stalling Injury to Malayan Plantations fromRefinery Emissions." J. Air Pollution ControlAssoc., Vol. 14, pp. 229-233, 1964.Massey, L. M. "Similarities Between DiseaseSymptoms and Chemically Induced Injury toPlants." In: Air Pollution, Chapt. 3, L. C. Mc-Cabe, (ed.), McGraw-Hill, New York, 1952, pp.48-58."Plants Absorb Sulfur Dioxide, Release Hydro-gen Sulfide." Sulfur Institute J., 4 (2) :17, 1968.Stoklasa, J. "Die Beschadigung der Vegetation(lurch Rauchgase und Fabriksexhalationen."Urban und Schwartzenberg, Berlin, 1923.

21. Setterstrom, C. "Effects of Sulfur Dioxide onPlants and Animals." Ind. Eng. Chem., Vol. 32,pp. 473-479, 1940.
22. Swain, R. E. and Johnson, A. B. "Effect of Sul-fur Dioxide on Wheat Development; Action atLow Concentration." Ind. Eng. Chem., 28 ( 1 )42-47, 1936.
23. Wells, A. E. "Results of Recent Investigationsof the Smelter Smoke Problem." Ind. Eng.Chem., Vol. 9, pp. 640-646, 1917.
24. Zimmerman, P. W. "Chemicals Involved in AirPollution and their Effects upon Vegetation."Professional Papers, Boyce Thompson Institute,New York 2(14) :124-445, 1955.
25. Thomas, M. D. and Hill, G. R. "Adsorption ofSulfur Dioxide by Alfalfa and its Relation toLeaf Injury." Plant Physiol., Vol. 10, pp. 291-307, 1935.
26. "Effects of Sulfur Dioxide on Vegetation." Na-tional Research Council of Canada, Ottawa, Pub.815, 1939, p. 447.
27. Whitby, G. S. "The Effects of Sulfur Dioxide onVegetation." Chem. Ind., Vol. 58, p. 99, 1939.
28. Matushima, J. and Horada, M. "Sulfur DioxideGas Injury to Fruit Trees. V. Absorption of Sul-fur Dioxide by Citrus Trees and its Relation toLeaf Fall and Mineral Contents of Leaves." J.Soc. Hort. Sci. (Tokyo), 35(3) :241-246, 1966.
29. Bleasdale, J. K. A. "Atmospheric Pollution andPlant Growth." Nature, Vol. 169, p. 376, 1952.
30. Haselhoff, E. and Lindau, G. "Die Beschadigungder Vegetation (lurch Rauch." Verlagsbuchhand-lung Gebrueder Borntraeger, Leipzig, 1903, p.412.
31. Dorries, W. "Uber (lie Brauchbarkeit der spec-troscopischen Phaophytinprobe in der Rauch-schaden-Diagnostik." Z. Pflanzenkrankheiten u.Gallenkunde, Vol. 42, pp. 257-273, 1932.
32. Noack, K. "Damage to Vegetation from Gases inSmoke." Z. Angew. Chem., Vol. 42, pp. 123-126, 1929.
33. O'Gara, P. J. Ind. Eng. Chem., Vol. 14, p. 744,1922.
34. Guderian, R., von Haut, H., and Stratman, H. Z.Pflanzenkrankh. Pflanzenschutz, Vol. 67, p. 257,1960. (Quoted in ref. 6, p. 421.)
35. Spierings, F. "Method for Determining the Sus-ceptibility of Trees to Air Pollution by ArtificialFumigation." Atmos. Environ., Vol. 1, pp. 205-210, 1967.
36. Linzon, S. N. "The Influence of Smelter Fumeson the Growth of White Pine in the Sudbury Re-gion." Ontario Dept. of Lands and Forest, On-tario Dept. of Mines, Toronto, 1958, pp. 1-45.
37. Sullivan, J. L. "The Nature and Extent of Pol-lution by Metallurgical Industries in Port Kem-bla." In: Air Pollution by Metallurgical Indus-tries, Dept. of Public Health, Div. of Occupa-tional Health, Sydney, Australia, Vol. 1, pp.1-59, 1962.
38. Linzon, S. N. "Sulfur Dioxide Injury to Trees inthe Vicinity of Petroleum Refineries." ForestChronicle, Vol. 41, pp. 245-250, 1965.
39. Berry, C. R. and Hepting, G. H. "Injury to East-ern White Pine by Unidentified Atmospheric Con-taminants." Forest Sci., Vol. 10, pp. 2-13, 1964.
40. Setterstrom, C. and Zimmerman, P. W. "FactorsInfluencing Susceptibility of Plants to Sulfur Di-oxide Injury." Boyce Thompson Institute, NewYork, Vol. 10, pp. 155-181, 1939.
41. Swain, R. E. "Atmospheric Pollution by Indus-trial Wastes." Ind. Eng. Chem., Vol. 15, pp.296-301, 1923.
42. Weaver, J. E. and Morgenson, A. "RelativeTranspiration of Coniferous and Broad-LeafedTrees in Autumn and Winter." Bot. Gaz., Vol.68, pp. 393-424, 1919.
43. Menser, H. A. and Heggestad, H. E. "Ozone andSulfur Dioxide Synergism: Injury to TobaccoPlants." Science, Vol. 153, pp. 424-425, 1966.
44. Heck, W. W. "Discussion of 0. C. Taylor'sPaper: Effects of Oxidant Air Pollutants." J.Occup. Med., Vol. 10, pp. 497-499, 1968.
45. Hindawi, I. J. "The Effects of Sulfur Dioxideon Vegetation Grown in the Washington, D.C.Metropolitan Area." Preprint. (Presented at theWashington, D.C. Area Air Pollution AbatementActivity Conference, Dec. 13, 1967.)
69

Chapter 6
TOXICOLOGICAL EFFECTS OF SULFUR OXIDESON ANIMALS

Table of Contents Page
A. INTRODUCTION 73
B. EVALUATION BY MORTALITY AND PATHOLOGY 73
1. Sulfur Dioxide Exposure 732. Sulfuric Acid Aerosol 75
C. EVALUATION BY PULMONARY FUNCTION 761. Sulfur Dioxide Exposure 762. Mechanism of Response 793. Sulfuric Acid and Particulate Sulfate Exposures 80
D. EFFECTS OF SULFUR DIOXIDE ON CILIARY ACTION 81
E. LIFETIME EXPOSURE OF ANIMALS TO SULFUR DIOXIDE 82
F. ABSORPTION AND DISTRIBUTION OF SULFUR DIOXIDE 82
G. MISCELLANEOUS BIOCHEMICAL EFFECTS OF SULFURDIOXIDE 84
H. SUMMARY 84
I. REFERENCES 85
72

Chapter 6
TOXICOLOGICAL EFFECTS OF SULFUR OXIDES ON ANIMALS
A. INTRODUCTION
The toxicology of oxides of sulfur is re-viewed in Chapters 6 to 8 of this document.Unfortunately, published data generally re-fer to concentrations far in excess of thoselikely to be found in polluted atmospheres,and therefore have little relevance to cri-teria for atmospheric pollutants. Even wherethe animal studies are carried out at morerealistic levels, it is certain that the healthhazard associated with community air pol-lution can only be evaluated directly in epi-demiologic terms (chapter 9) . Nevertheless,toxicological experiments do indicate thekinds of physiological and pathological re-sponse of which animals and man are ca-pable. Studies have been chosen for reviewin Chapters 6 to 8 on the basis of their pos-sible relevance to air pollution problems, andthe chapters are not comprehensive treat-ments of sulfur oxide toxicology.
While unreliable conversions and extrap-olations are necessary in assessing healtheffects on man from toxicological experi-ments on animals, such experiments do,however, permit the use of higher concen-trations, longer exposure times, larger num-bers of subjects, surgical procedures, post-mortem examinations, and other liberties notopen to the experimenter with human sub-jects. Since man is an animal, the resultsof such animal experiments should havesome relation to man, even though it is onlyqualitative. Therefore, this chapter dealswith the toxicology of the oxides of sulfurin animals.
Methods of evaluation include challenginganimals with the pollutant or pollutant com-binations and examining mortality andchanges in lung function that precede irre-versible pathology. Absorption, distribution,
and retention of sulfur oxides have also beenexamined, as have biochemical change andciliary response in the organism. The effectsof oxides of sulfur on animals have been re-viewed by Setterstrom 1 and by Negherbon.2
B. EVALUATION BY MORTALITY ANDPATHOLOGY
1. Sulfur Dioxide ExposureThe response of various species including
guinea pigs, mice, grasshoppers, and cock-roaches to sulfur dioxide 13 4 5 has been stud-ied. Concentrations from 10 ppm to 1,000ppm ( -30 mg/m3 to 30,000 mg/m3) weremonitored and duplicate chambers were usedfor control animals." Exposures were con-tinuous up to the time of death of 50 percentof the animals or until no progressive symp-toms appeared after a considerable time. Atconcentrations of 25 ppm (,,,72 mg/m3) nomortality was produced by treatment up toabout 45 days. At concentrations of 150 ppm(430 mg/m3) and below, mice were more re-sistant than guinea pigs. For example, it re-quired 847 hours to kill 50 percent of themice at 150 ppm, whereas 50 percent of theguinea pigs exposed to 130 ppm ( -370mg/m3) died in 154 hours. At concentra-tions of 300 ppm ( ,,,860 mg/m3) to 1,000ppm mice were less resistant than guineapigs. At levels of around 1,000 ppm, 50 per-cent of the mice died in about 4 hours where-as about 20 hours were needed to kill guineapigs. The susceptibility of the two insectspecies approximated that of the mice. Itis thus apparent that extrapolations fromhigh to lower concentrations of such param-eters as species sensitivity are frequently notreliable.
No significant mortality or signs of dis-tress were noted among healthy animals ex-
73

Posed to concentrations of 33 ppm (94mg/m3) or below. Longer exposure wasneeded to cause mortality when the exposureswere intermittent. Exercise increased sus-ceptibility of guinea pigs exposed to 1,000ppm but had no effect at lower concentra-tions.
Symptoms produced by the higher concen-trations included coughing, moderate dYsP-nea, rhinitis, lachrymation, conjuctivitis,abdominal distension, lethargy, weakness,and paralysis of the hind quarters. Patho-logic changes included slight to moderatevisceral congestion, slight to moderate pul-monary edema, and distension of the gallbladder and stomach. Higher concentrationsProduced hemorrhages of lungs and stomachand acute dilation of the right heart.
The mean survival time of mice, guineapigs, and rats was measured as a means ofevaluating the effect of pretreatment withhistamine, or of adrenalectomy, on the tox-icity of sulfur dioxide.'" Concentrations inthe range of 600 ppm to 5,000 ppm (1700mg/m" to 14,000 mg/m3) were used, pre-sumably because it was the aim to kill nor-mal animals within a convenient time in-terval. For normal animals the susceptibil-ity was highest in mice, intermediate inguinea pigs and least in rats. At the con-centrations used in these experiments therelative susceptibility of mice and guineapigs is in agreement with the earlier dataof Weeden et al.` mentioned above. Hista-mine given by intraperitoneal injection atlevels of 200 mg/kg of animal weight 10minutes before exposure significantly de-creased the survival time of rats and mice.Adrenalectomy in rats also reduced survivaltime.
The extent of changes in lung pathologyand the amount of fluid in the alveoli wereprimarily dependent upon the exposure time.In normal animals, pulmonary edema andareas of consolidation were usually observed,while animals whose survival time had beenreduced by pretreatment, exhibited bronchialobstruction. Two mechanisms of death wereobserved in guinea pigs. A portion of eachtest group succumbed rapidly when intro-duced into the sulfur dioxide atmosphere.Occlusion of the bronchioles and venous con-
74
gestion with little or no fluid in the alveoliwere the pathological changes observed inthese animals. Those animals which sur-vived 2 to 4 hours showed fluid in the alveoli,distended bronchioles and partially desqua-mated mucosal membranes.
Goldring et al.9 reported that 10,000 ppm(29.000 mg/m3) produced 100 percent mor-tality of Syrian hamsters within 8 to 10 min-utes. Exposures to 3,250 ppm (9,300 mg/m3)for periods up to 1 1/2 hours produced 50 per-cent mortality within 24 hours. Exposuresof 650 ppm (1,850 mg/m3) for 75 days didnot produce significant histopathologicalchanges in the pulmonary tree of hamsters.Sodium chloride aerosol was also present inall exposures. ( See Chapter 8 and Air Qual-ity Criteria for Particulate Matter, a com-panion document, for a discussion of syner-gistic effects.)
A limited number of swine was exposedto 5, 10, 20, and 40 ppm (about 14, 29, 57,and 114 mg/m") sulfur dioxide for 8 hours.1°Symptoms at 5 ppm were limited to slighteye irritation and excess salivation. Athigher concentrations there was excess sali-vation, excess nasal secretion and shallower,more rapid respiration during the first 4hours, after which the symptoms abated.Twenty-four hours after exposure the lungsshowed hemorrhage and emphysema. Thechanges were less marked in animals killeda week after exposure. Two animals exposedto 40 ppm and one animal exposed to 20ppm, which were killed 160 days after ex-posure, showed some areas of fibrosis, andthe lungs were a darker color and less wellinflated than in normal animals.
Reid " attempted to produce hypertrophyof the goblet cells and mucous glands of ratswhich would simulate chronic bronchitis.Initially, animals were exposed 5 hours aday, 5 days a week, to about 40 ppm sulfurdioxide. Since no great change was foundin the lungs after 3 months, the dose wasincreased to 300 ppm to 400 ppm (about 900mg/m3 to 1,100 mg/m3) , in order to producethe desired changes. There followed an in-crease in the number of mucus-secreting cellsboth in the main bronchi, where goblet cellsare normally frequent, and in the fine pe-ripheral airways from which they are nor-

mally absent. Excessive mucus was seen inthe bronchial lumen, probably reflecting anincreased number of mucus-secreting cellsas well as greater secretory activity, asso-ciated with reduced ciliary activity leadingto retention. The changes apparently werenot mediated through infection, as pathogenswere not more frequently found in the bron-chi and lungs of animals exposed to the ir-ritant than in the controls. Although infec-tion may act as an irritant, these experimentsindicate that it is by no means an essentialfactor in the development of excessive mu-cous cells characteristic of chronic bron-chitis.
In one experiment, the reaction was greatin all but 2 animals, whereas in another ex-periment only half the animals responded.At the time of the diminished responsive-ness, however, the supplier had made an at-tempt to breed a strain of animals lesssusceptible to bronchiectasis. It is likely thatthere is considerable difference in responsebetween strains.
The excess of goblet cells persisted for atleast 3 months after exposure to the irri-tant had ceased, even in the absence of in-fection. Most of the goblet cells were dis-tended with secretion, suggesting that theydischarged less mucus than during the ex-posure. The cessation of irritant exposureseemed to arrest the increase in cells.
Dalhamn 12 studied the morphology of tra-cheal mucosa in rats following exposures forperiods of 18 to 67 days to about 10 ppm(about 30 mg/m") sulfur dioxide. Exposureswere 6 hours a day for 5 days a week, and3 hours on Saturday; there was no exposureon Sunday.
Severe morphologic changes of the epi-thelium and lamina propria were observed.The epithelial surface was irregular withdeep crypts, probably produced by cell pro-liferation. Since the cilia lining these cryptscould not contribute to transport of mucus,such changes were a probable cause of ob-served retarded mucus flow. The changeswere present at 18 days as well as at 67 days,and they had not regressed 4 weeks afterexposure in six animals examined at thattime. Support is thus lent to Reid's finding 11of slow reversibility. There was no alter-
ation of the ciliary ultrastructure althoughthe surrounding tissues including ciliarycells showed severe changes. There was moremucus in the trachea of exposed animals. Inhealthy rats the mucus blanket was about5-tt thick and the secretion contained only afew cellular elements. After sulfur dioxideexposure the mucus blanket was 20-pt to25-tt thick and the secretion appeared morecompact and contained numerous elementssuch as shed cells and white blood cells.Since the trachea is the main site of absorp-tion of sulfur dioxide these changes are notsurprising at 10 ppm.
2. Sulfuric Acid Aerosol
Treon et al." exposed rabbits, rats, mice,and guinea pigs to sulfuric acid mist ofwhich 95 percent was below 2 I.L. Only a fewanimals were used in the exposures, and theconcentrations were at levels of 87 to 1,600mg/m3; nevertheless, a clear-cut species dif-ference emerged. The order of increasingsensitivity was: rabbits, rats, mice, andguinea pigs. Mathur and Olmstread " alsofound that mice were much more resistantthan guinea pigs.
Amdur et al.15 found the 8-hour LC,,, ofsulfuric acid (MMD 1 -v) to be 18 mg /ms forone- to two-month-old guinea pigs and 50mg/m" for 18-month-old animals. Pattle etal.'" determined the 8-hour LC, for 200 gto 250 g guinea pigs exposed to sulfuric acidof two particle sizes, MMD 2.7-pt and MMD0.8-/A. The LC, was 27 mg/m3 for the largeparticles and 60 mg/m" for the small parti-cles. At 0° C with 0.8-pt particles the LC,was 47 mg/m3, a value significantly differentfrom that at room temperature. The guineapig is a tropical animal and the differencein effect is considered a direct action of coldon the animals. Ammonium carbonate suffi-cient to provide an excess of ammonia in thechamber gave protection from levels of sul-furic acid which, in the absence of ammonia,would have caused 50 percent mortality, em-phasizing that the toxicity is related toacidity.
The pathological findings were similar inthe two investigations. Animals dying aftershort exposure (less than 2 hours) showgrossly distended and emphysematous lungs
75

with no other serious lesions.'° The causeof death in these animals appeared to beasphyxia caused by bronchoconstriction andlaryngeal spasm. Animals dying after longerexposures showed gross pathological lesionsincluding capillary engorgement and hemor-rhage.'-. '6 It is suggested that these obser-vations were mainly sequelae of the com-bined effects of anoxia and increased intra-thoracic pressure caused by bronchoconstric-tion and laryngeal spasm.". That animalssuccumbing quickly show a pathology differ-ent from those surviving longer exposuresis similar to the findings of Leong et al.' forguinea pigs exposed to massive concentra-tions of sulfur dioxide. The animals thatsurvived the exposures showed spotty areasof old hemorrhage and some areas of con-solidation, especially around the hilar re-gions. Such damage to the animals survivingan exposure lethal to others is repaired veryslowly.
Amdur et al.' next extended exposuretimes to 72 hours and found that the in-creased exposure did not produce mortalityat 8 mg nor did it, at higher concentra-tions, increase the mortality beyond thatwhich was observed in 8-hour exposures. Inthe 8-hour exposures, most of the animalsthat died did so within the first 4 hours.Thickening of the alveolar walls and areasof consolidation were much greater in ani-mals exposed for 72 hours to 8 mg/m" thanin animals exposed for 8 hours. It was postu-lated that sulfuric acid has two distinct toxicactions:
1. It promotes laryngeal and broncho-spasm as the cause of death,
2. It can also cause parenchymal lungdamage; this action is dependent ontotal dosage.
As Pattle et a1.1" have observed, the damageis probably a direct irritant effect of the acidmist deposited on the lung tissue and maybe the mechanism by which the mist causesdeath in those animals more resistant thanthe guinea pig to brochospasm.
Longer exposure times ranging from 18to 40 clays were used by Thomas et al." withparticle sizes of 0.0,u, 0.9,u, and 4,it and withconcentrations up to 4 mg /ms. The ages of
76
the animals were not given, but old animalswere less sensitive to the pathological effectsof the mist than the young animals. Thisis in agreement with acute toxicity based onLC,.'5 Of the three sizes used, 0.9,u parti-cles produced greater change than either thelarger or the smaller ones. Lesions of theupper respiratory tract consisting of a slightedema of the larynx and trachea and a de-crease in mucus in the major bronchi, wereobserved with the 4-itt particles. In the younganimals exposed to 0.9-,u acid, the lungs wereslightly edematous, and a rare capillaryhemorrhage was noted. In minor, but notin major, bronchi there was some increasein desquamated epithelial cells, and the epi-thelium appeared intact; both major andminor bronchi showed a reduced amount ofmucus and less spasm than controls. Thespasm in the controls was presumably a re-sult of sacrificing the animals by chloroforminhalation. On the whole, the observed pul-monary pathology was slight, and it wasconcluded that the guinea pig can toleratelevels of about 2 mg/m" for more than 3months of continuous exposure with onlyminor pathological effects.
Bushtueva 1" reported that guinea pigsexposed to 2 mg/m" of sulfuric acid mist ofunspecified particle size for 5 days developededema and thickening of the alveolar walls.One- to 2-week exposures to 1 mg/m" pro-duced a slight catarrhal condition of the mu-cous membranes of the trachea and bronchiand slightly defined, but widely distributedinterstitial proliferative processes accom-panied by round lymphoid cell infiltration.surrounding the blood vessels and bronchi.These latter changes seemed progressive asthey were more highly developed 2 to 3months after exposure. A concentration of0.5 mg /ms produced only a slight lung ir-ritation.
C. EVALUATION BY PULMONARYFUNCTION
1. Sulfur Dioxide ExposureIn a series of papers, Amdur and her co-
workers have reported on the respiratoryresponse of guinea pigs to various irritantair pollutants, among them sulfur dioxide.

The methods employed in all these studiesare doOmented in the original paper deal-ing NNT-,11 sulfur dioxide '2" and in a paperdealings with physiological methods of mea-surerner':t.2' The method has the advantagethat th&,animal is unanesthetized and breath-ing spontaneously. The information obtainedin these experiments is, however, limited incomparis =on with studies of irritant actionusing anjsthetized larger species. The meth-od is suAable for routine daily use by acarefully trained technician, and data onnumbers 6af animals exposed only once to aspecific irritant can readily be obtained. Thiseliminates 'the need for re-exposure follow-ing "recov.:?.ry" which is necessary in com-plicated pl-i`ysiological experiments.
Amdur a'rid her co-workers used a stand-ard exposul':,e time of 1 hour; thus the ap-plicability 6, air pollution criteria would bein connection with the possible effects ofshort-term leak values. Although the ani-mals were ut-,a,nesthetized during the controland exposure:periods, an intrapleural cathe-ter was used, ';and this was put in place withthe animals cinder light ether anesthesia.Mead 22 used atlother method which measuredflow resistance',without the need for an intra-pleural catheter to measure the resistance ofguinea pigs before and after intubation, andfound that the 'procedure had caused an in-crease. It was Aot determined whether thisincrease was cajsed by the presence of thecatheter or by tie recent exposure to ether.
The method y)'-.elds information on pulmo-nary flow- resistance and compliance (a mea-sure of the elastic: behavior of the lungs) ;20 23as well as tidal: volume, respiratory fre-quency, and minite volume. One-hour ex-posures produced `.;tatistically significant in-creases in resistarbe ranging from about 10percent at 0.16 pin (460 µg/m") to about265 percent at 83i* ppm (2,390 mg/m3) .21For most normal human subjects, an in-crease in resistanc, of 300 percent or lesswould have no ma6ed physiological conse-quences.
After exposure w&f; terminated, resistancedecreased and at concentrations up to 100ppm (-290 mg /ms) returned to pre -ex-posure levels in the course of an hour. Re-sistance was back to normal 2 hours after
exposure to 300 ppm (860 mg/m).25 A de-crease in respiratory frequency was ob-served, and it became statistically significantat concentrations above 25 ppm.
The pattern of response produced by sul-fur dioxide is typical 23 of the response ofthe guinea pig to a group of respiratoryirritants which includes acetic acid, form-aldehyde, and droplets of sulfuric acidsmaller than 11,t. At levels of 2 ppm ( 6mg/m3 to 14 mg/m"), the other irritants allevoked a greater response than did sulfurdioxide. For this group of irritants, in-creased flow resistance is the most sensitiveindicator of response.
Pulmonary edema is a relatively minorfactor in the pathology of sulfur dioxide andsimilar irritants (although it is importantfor ozone and oxides of nitrogen);'" The pat-terns of pathological response may relate tothe ability of the irritant to penetrate to pe-ripheral areas of the lung. Penetration is animportant factor, but is not the only expla-nation, since irritant aerosols, of a size ex-pected to penetrate readily, produced the pat-tern typified by sulfur dioxide and alde-hydes.27
Amdur and her co-workers also measuredthe response of guinea pigs breathing irri-tants through a tracheal cannula.2') 23 24 Theresponse to a given concentration of sulfurdioxide was greater when the gas reachedthe lungs through a tracheal cannula at con-centrations of :2 ppm (-6 mg/m") and above.At concentrations near 0.4 ppm to 0.5 ppm( 1.1 mg /m3 to 1.4 mg /ms) the response wasnot altered by the tracheal cannula. Thissupports the data of Strandburg indicatingthat low concentrations of sulfur dioxide arenot efficiently removed by the upper respira-tory tract.
Exposures of guinea pigs breathing nor-mally and via a tracheal cannula to sulfurdioxide at 5 ppm to 10 ppm (about 14mg/m3 to 29 mg/m3) are reported by Daviset al.2" Exposures of normal animals pro-duced increases in resistance and tidal vol-ume and decreases in respiratory rate andminute volume. Insufficient data are givento evaluate the specific effects of the irri-tant. There were no changes in respiratoryfunction in animals exposed via tracheal can-
77

nula. Such animals did, however, respondwith a resistance increase to inhalation ofhistamine aerosol. The authors conclude thatsulfur dioxide is without effect on the lungand the entire response seen in normal ani-mals is due to an increase in resistance ofthe upper airways.
This interpretation may be questionedsince the pulmonary function tracings showevidence of technical errors where flow andvolume appear completely out of phase withthe pressure tracing. The results are not inagreement with those of Amdur and Mead 2"and of Amdur _:1 obtained on guinea pigs, norwith the results discussed below for othel'species.
Balchum et al."" "" exposed anesthetizeddogs to sulfur dioxide by nose and mouthbreathing and by means of a tracheal can-nula. Concentrations ranged from around1 ppm to around 140 ppm (about 3 mg/m"to 400 mg/m3), and exposure periods were20 minutes to 40 minutes. The dogs werenot breathing spontaneously, but were venti-lated at constant stroke volume following adose of intravenous nembutal sufficient tostop spontaneous respiration. This repre-sents an unusually deep level of anesthesia.A decrease in compliance and an increasein resistance was found at all concentrationsused. These alterations were also producedwhen only an isolated segment of tracheawas exposed to sulfur dioxide."" The resist-ance change was greatest in animals breath-ing via a tracheal cannula, intermediate inthose nose-breathing, and least in those dogsin which only a tracheal segment was ex-posed. The compliance changes, on the otherhand, were of the same order of magnitudein all cases. The compliance changes werepossibly caused by some extraneous influ-ence and not by sulfur dioxide, since spon-taneous compliance decreases are a commonphenomenon in dogs lying on their backs dur-ing prolonged physiological experiments.'
Salem and Aviado "5 ventilated dogs byPump through a tracheal cannula and mea-sured the "dynamic" pressure-volume char-200 ppm. to 850 ppm (570 mg/m" to 2400mg/m3) sulfur dioxide for periods of 1 to4 minutes. The changes that ensued wereacteristics of the lungs during exposures of
78
consistent with bronchoconstriction precededand followed by bronchodilation. Thesechanges were interpreted as protective meas-ures leading to a reduction in the amount ofsulfur dioxide absorbed via the pulmonarycirculation. They also observed pulmonaryvasoconstriction, increase in pulmonary ar-terial blood pressure, a depression of myo-cardial force of contraction accompanied bybrachycardia, and systemic shock.
Yokoyama and Ishikawa "" measured theeffect of sulfur dioxide on the mechanicalbehavior of the lungs of dogs exposed to 50ppm to 350 ppm (140 mg/m3 to 1,000mg/m") via a tracheal cannula. There wasconsistent increase, occasionally as much astenfold, in flow resistance. There were noconsistent changes in pulmonary compliance.
Frank and Speizer "7 compared the func-tional response of several levels of the res-piratory system to inhaled sulfur dioxide.Dogs were lightly anesthetized and exposedby nose, by tracheal cannula, and by an iso-lated segment of trachea. Concentrationsranged from 7 ppm to 230 ppm (20 mg/m3to 660 mg/m"), and routine exposures werefor 15 minutes. Intervals of at least 20 min-utes were allowed between exposures, andno animal was exposed more than 4 times.In eight animals exposed by nose the nasalresistance was measured. At levels of 7 ppmto 61 ppm (175 mg/m3) , the nasal resistanceincreased in a manner roughly proportionalto the concentration, and at concentrationsabove 25 ppm (about 70 mg/m") it becameprogressively greater with duration of ex-posure. One animal showed a ,reduction innasal resistance in the first 2 exposures andan increase in the second 2 exposures. Dur-ing recovery, which lasted 15 to 40 min-utes, the values reverted partially or com-pletely to control values. The authors specu-late that these changes probably reflectmucosal swelling, increased secretion of mu-cus or both. The resistance of the larynxappeared to rise and fall about an equal num-ber of times during exposure and recovery.A significant change in one direction or theother occurred in about 45 percent of theobservations. During nose-breathing the re-sistance of the lungs rose and fell about anequal number of times and the direction of

change was not related to concentration ofgas nor to duration of exposure. About one-third of these changes were considered sta-tistically significant. Significant changes ineither direction occurred more frequently athigher concentrations. During recovery thelung resistance tended to increase above con-trol levels. Compliance was only slightlylower during exposure. Minute ventilationfell owing to slight reduction in both tidalvolume and respiratory frequency.
When exposure was by tracheal cannula,pulmonary flow resistance rose rapidly,reaching a peak within several minutes, andthen decreased. Limiting the exposure to thelarynx and upper trachea produced a muchless pronounced increase in lung resistance.
2. Mechanism of ResponseBasic information on the mechanism of re-
sponse to irritants is importar, t in the com-plex task of assessing the irritant potentialof air pollution. This is the realm of thephysiologist, who may, for example, experi-ment with the effects of an irritant materialon nerve fibers, or with the specific block-ing effect of drugs. Exposures are usuallybrief, sometimes only a single breath, andquite frequently the concentration is notspecified, but can be assumed to be very high.
Widdicombe 38 studied, in cats, the coughreflex elicited by mechanical stimulation,powdered talc or starch, and sulfur dioxide.He found that sulfur dioxide elicited thecough reflex when given through an endo-bronchial catheter so that the gas came incontact only with the lungs and smaller bron-chi, and not with the trachea and extrapul-monary bronchi. The cough reflex producedin this way was always stronger than whenthe gas was applied to the trachea and mainbronchi alone. After several inhalations ofsulfur dioxide the cats became completelyrefractory to the gas but gave normal re-sponses to mechanical stimulation of. thetrachea. This result suggested that the re-ceptors sensitive to mechanical stimuli werenot being stimulated by sulfur dioxide. Fur-ther evidence that the two receptors weredistinct was provided by the fact that pro-caine solution sprayed into the tracheablocked the mechanical cough reflex but did
not affect the response to sulfur dioxide.Widdicombe 39 also made a systematic ex-
amination of different nerve endings in thetracheobronchial tree. One hundred singlevagal fibers, which were excited by inflationof the lungs, were dissected, and the responsewas studied under various conditions. Onegroup of these fibers was first sensitized, theninhibited, by sulfur dioxide. This particulargroup of fibers was distributed throughoutthe lower trachea and main bronchi. Theresponses of these fibers were not inhibitedby procaine; this results parallels the obser-vation that the cough reflex elicited by sul-fur dioxide is not inhibited by procaine.24Another group of fibers was sensitive to me-chanical stimuli but insensitive to sulfur di-oxide; this sensitivity parallels the finding 24that the mechanical cough reflex was stillpresent in animals rendered refractory tosulfur dioxide. Vagal temperatures of 7° Cto 10° C blocked the fibers sensitive to sulfurdioxide. As with mechanical stimuli, sulfurdioxide acts via the sympathetic nervous sys-tem as well as the vagus nerves, and thegroup of fibers sensitive to sulfur dioxide hasbeen shown to connect with the sympathetictrunk.
The mechanism of bronchoconstrictionproduced by sulfur dioxide in cats was alsoexamined." The animals were anesthetized,the respiratory muscles were paralyzed withgallamine triethiodide, and the animals wereventilated with a pump via a tracheal can-nula. Sulfur dioxide was delivered eitherto the lungs or to the upper airways. Totalpulmonary resistance was measured. Sulfurdioxide delivered to the lower airways andlungs during a single inflation cycle pro-duced an increase in resistance which beganduring the first breath after exposure andreturned to control levels within 1 minute.Exposing only the upper airways also pro-duced a resistance increase. During cool-ing of the cervical vagosympathetic nervesthe response was abolished whether the sul-fur dioxide was delivered to the lung or tothe upper airways. After rewarming of thenerves, the response was re-established. Theresponse was also abolished by the intra-venous injection of atropine. The rapidityof the response and its reversal suggests that
79

changes in smooth muscle tone are the causeof the bronchoconstriction. This response de-pends upon intact motor parasympatheticpathways. Similar results were reported byWiddecombe et al.' 9 41 for bronchoconstric-tion caused by inhalation of fine charcoaldust.
3. Sulfuric Acid and Particulate SulfateExposures
The respiratory response of guinea pigsto sulfuric acid mist was studied by Amdur.42Concentrations ranged from 2 mg/m3 to 40mg/m3. Three particle sizes were used, 0.81.t,2.5p, and 7p, MMD. The 7-At particles even
.....-- at a concentration of 30 mg/m3 caused onlya slight increase in resistance and no otherdetectable alterations. Particles of this sizewould not penetrate to any extent beyondthe nasal passages. The 0.8-p, particles pro-duced an increase in resistance (accompaniedby a lesser decrease in compliance and anincrease in work of breathing) which wasstatistically significant at the lowest con-centration tested, 1.9 mg/m3. The responsewas prompt in onset and resembled the pat-,tern observed in response to sulfur dioxide.The 2.5-p, particles produced a greater re-sistance increase at concentrations of 40mg/m3 than the smaller particles. This fitswith the finding of Pattle et al." that par-ticles of 2.7p, were more lethal than those of0.8p, when the LC,,, was the criterion of re-sponse. On the other hand, at concentrationsabout 2 mg /m3, the smaller particles pro-duced a greater response. This underlinesonce again the fact that data obtained usingonly high concentrations can fail to predictaccurately the response to low concentra-tions. Response to the larger particles wasmuch slower in onset with minimal alter-ation during the first 15 minutes of exposure.Response to the smaller particles in 10 to15 minutes had reached levels similar tothose prevailing at the end of 1-hour ex-posure to the larger particles. The delayedresponse suggests the possibility of a dif-ferent mechanism of action, and this pos-sibility is borne out by both the mechanicalbehavior of the lungs and the post-mortemappearance of the lungs. In the animals ex-posed to the 2.5-µ particles, resistance in-
80
creases were accompanied by more markedcompliance changes than those produced bythe smaller particles or by sulfur dioxide.Such changes are consistent with the devel-opment of obstruction of major airways. AtPost-mortem the animals exposed to highconcentrations of the large particles showedareas of atelectasis frequently involving anentire lobe. The lungs from these animalsshowed a lung weight to body weight ratiogreater than in control animals. Such alter-ations were not produced by the exposuresto sulfur dioxide or smaller sulfuric aciddroplets. The large particles probably actby producing mucosal swelling, secretion,and exudation of fluid which leads to ob-struction of major airways, whereas thesmaller particles act via bronchoconstriction.
The response shown by 2 mg/m3 (a 50Percent increase in resistance for the 0.8-p,sulfuric acid) is well above the sensitivityof the method for detection of response inthe guinea pig. Data on concentrations lowerthan this are not currently available.
The irritant potency of zinc ammoniumsulfate (which may be regarded as the proto-typical acid sulfate) was studied at 4 differ-ent particle sizes between 0.29/A and 1.4p,(mean size by weight) .27 Concentrationswere from 0.25 mg/m3 to 3.6 mg/m3, andall levels tested produced an increase in flowresistance in guinea pigs. The irritant po-tency increased as the particle size decreased,a small increment in concentration of smallParticles producing a greater increment inresponse than did the larger particles. Theimportance of particle size emphasizes theinadequacy of using mass concentration dataalone when attempting to assess the irritantPotency of particulate material. Zinc sulfateand ammonium sulfate were also irritant buttheir potency was much less than that of thedouble salt. The authors, while not advanc-ing an "explanation" of the Donora disaster,indicate that the zinc ammonium sulfate,zinc sulfate, and ammonium sulfate reportedby Hemeon 4" as constituents of the Donorafog could have been contributors to respira-tory effects if present as 0.3-p, to 0.5-p, par-ticles; if the particles were 1.4/A or larger,the substances would have contributed littleto the effects.

Nadel et a/.44 studied the effect of aerosolsof histamine and zinc ammonium sulfate (asan example of an irritant aerosol) admin-istered to anesthetized and artificially venti-lated cats. The aerosol particles were smallerthan 1/A and the concentration for the sulfatewas 40 mg/m4 to 50 mg/m3. The sulfateaerosol produced a physiological responsesimilar to that of histamine but lesser indegree. The response to 3-minute inhalationincluded increased pulmonary resistance, de-creased pulmonary compliance, and in-creased end-expiratory transpulmonary pres-sure. Injection of atropine did not preventthe changes in compliance but decreased thechanges in resistance. A bronchodilatorgiven intravenously or as an aerosol priorto administration of the irritant preventedthe changes, suggesting that they were dueto smooth muscle contraction. Cardiac ar-rest during histamine inhalation did not pre-vent the changes, suggesting that histamineacts directly on the airway smooth muscleand is not dependent on the circulatory route.To correlate with the physiological responses,anatomical studies were made after rapidfreezing of the lungs in the open thorax.These showed that the principal sites of con-striction were the alveolar ducts and ter-minal bronchioles. Bronchioles up to 400/A
were narrower than in control animals andshowed longitudinal furrowing of the mu-cosa. Bronchi and bronchioles larger than400/A were not significanty different fromcontrols. The authors conclude: "It remainsto be demonstrated that acute changes re-ported here at aerosol concentrations of 40
mg/m3 to 50 mg/m" are exaggerated, butsimilar in nature to those produced, if any,at lower concentrations."
Amdur and Underhill 45 have recently re-ported that 1 mg /m3 of ferric sulfate pro-duced a 77 percent increase in flow resistancein guinea pigs, which classified it as irritant.On the other hand, neither ferrous sulfatenor manganous sulfate at this concentrationproduced any alteration in resistance, sug-gesting that the irritant potency is not re-lated to the sulfate ion as such. In experi-ments on guinea pigs with sulfuric acid orparticulate sulfate;232742 the response re-mained above control values following expos-
ure instead of reverting to control valueswithin an hour in the manner seen with ex-posure to sulfur dioxide. This difference aris-es since the irritant particle is cleared lessrapidly from the lung than the irritant gas.
D. EFFECTS OF SULFUR DIOXIDE ONCILIARY ACTION
Cralley 4" studied the effect of irritant gas-es, among them sulfur dioxide, on the ciliaryactivity of excised rabbit trachea. Tempera-ture and humidity were controlled and thegas to be studied was passed over the tissueat a rate comparable to that of breathing bythe animal. The time needed for cessation ofciliary activity following irritant exposurewas related to the concentration of irritantadministered. There was a rough correlationbetween the concentrations of sulfur dioxideneeded to produce ciliary cessation in 10 min-utes in the rabbit trachea (18 ppm to 20ppm), and the values reported for concen-trations causing immediate irritation of thethroat in human subjects (8 ppm to 12 ppm).
The most extensive studies of the effect ofsulfur dioxide and other irritant gases onciliary activity of experimental animals havebeen made by Dahamn and his co-workers,using rats 12 47 and rabits.47-5°
The original work with rats 12 51 developedmethods for measuring both rate of trans-port of mucus and the frequency of ciliarybeat in the trachea of living animals undercarefully controlled conditions of tempera-ture and humidity. The action of sulfur diox-ide on ciliary activity was tested at 50 ppm,25 ppm, and 12 ppm (140 mg/m3, 70 mg/m3and 35 mg/m3) . The time required for cessa-tion of ciliary beat varied with the concentra-tion, being 50 seconds at 50 ppm, 2 minutesat 25 ppm, and 4 to 6 minutes at 12 ppm. Ratswhich had been exposed to 10 ppm (about30 mg/m3) for 48 days were examined foracute response to 20 ppm (about 60 mg /m3)to compare their response with that of con-trol rats not previously exposed. The resultsindicated that the previous exposure had notaltered the reactivity of the cilia to the 20-ppm exposure. In all these experiments thecilia regained mobility a few minutes afterexposure ceased.
There was a marked slowing of mucus
81

transport and a complete cessation of flow insome rats exposed for 18 to 67 days to about10 ppm sulfur dioxide. On the other hand,the rate of ciliary beat was slightly diminish-ed in the shorter term exposures and unaffec-ted in the longer exposures. These findingswere readily accounted for by the morpho-logical changes which included a thickeningof the mucus blanket from 5p, to 25p, and evi-dence of excess secretion. The rate of trans-port of mucus remained depressed in animalsexamined a month or so after the termina-tion of exposure, in agreement with the per-sistence of the observed morphologicalchanges.
Dalhamn studied the acute effect of sulfurdioxide on ciliary activity on the trachea ofthe rabbit in vivo and in vitro. The in vivostudies were made with the animals breath-ing spontaneously through the nose. Concen-trations of the order of 300 ppm (about 860mg/m3) were required to produce cessationof ciliary beat in the spontaneously breath-ing rabbits. Obvious explanations for the con-trast of this finding with the earlier findingson rats were either that the cilia of the rabbittrachea were relatively insensitive to sulfurdioxide or that the sulfur dioxide was notreaching the site of action. Experiments withthe rabbit trachea in vitro showed that con-centrations of sulfur dioxide of 7 ppm to 10ppm (20 mg /m3 to 29 mg/m3) were suffici-ent to produce cessation of ciliary activity.The absorption studies discussed below indi-cate that these findings are explicable on thebasis of major absorption in the nasal cavityand pharynx of animals exposed via thisroute.
E. LIFETIME EXPOSURE OF ANIMALSTO SULFUR DIOXIDE
There are two brief reports 52 5" of a studyin which rats were exposed over most of theirlifetime to concentrations of 1, 2, 4, 8, 16,and 32 ppm (about 3, 6, 11, 23, 46, and 92mg/m3) sulfur dioxide. The life span of therats appeared to be reduced by 0.08 monthsfor each 1 ppm increase of sulfur dioxideconcentration. Statistical analysis,34 however,fails to attach significance to these changes.
82
F. ABSORPTION AND DISTRIBUTIONOF SULFUR DIOXIDE
Balchum et al.3° 31 33 used labelled S3502 tomeasure the absorption, distribution, andretention of sulfur dioxide in dogs. Theeffect of nose and mouth breathing as com-pared with breathing the gas through a tra-cheal cannula was examined, as well as theuptake and distribution following exposureof a segment of trachea only. Following in-halation, the sulfur dioxide was widely dis-tributed to the tissues with obviously greateramounts in the respiratory tract. A smallerporportion of the inhaled gas was found inthe trachea, lungs, hilar lymph nodes, liver,and spleen when the animals breathedthrough the nose and mouth than when thesame amount was inhaled via a tracheal can-nula. The labelled S350., was only slowly re-moved from the trachea and lungs, and itsPresence in these tissues could be detected aweek after exposure. Ninety percent of in-haled sulfur dioxide was removed from theairstream and became localized in the respir-atory tract including the pharynx. When atracheal segment alone was exposed to thegas, 535 was detected in various tissues, indi-cating that it can be absorbed from the up-per respiratory tract alone. 535 was detectedin the urine but not in the feces.
Bystrova 55 found a wide distribution of535 throughout the tissues of rats followinginhalation of high concentrations of sulfur(S33) dioxide. The amount of 5:15 found in theblood and tissues was related to the concen-tration inhaled. The S33 was attached to pro-tein and could still be found 11 days after ex-posure. Traces, especially in the lungs, weredetectable 3 weeks aftr exposure.
Frank et al.5" exposed the surgically iso-lated airways of the head and upper neck ofanesthetized, paralyzed dogs to 22-ppm (63mg /ms) sulfur dioxide labelled with S35 anddelivered at a rate of 3.5 1/min for 30 to 60minutes. The trachea was cannulated belowthis region, and the lungs were ventilatedwith room air by a positive displacementpump. In 10 out of 12 measurements, over95 percent of the sulfur dioxide administeredto the isolated upper airways was found to beabsorbed by the mucosa. In two of the ani-

mals, sampling was continued into the re-covery period after the upper airways hadbeen returned to room air, and sulfur dioxidewas detected in one dog 5 to 37 minutes afterexposure. In the other dog sulfur dioxide waspresent in the downstream sample 10 min-utes after exposure but not at 60 minutes.The presence of sulfur dioxide was presum-ably due to desorption from the mucosa. Inall 5 animals, sulfur dioxide was found in oneor more expired gas samples collected eitherat the carina or from a bronchus. Since nosulfur dioxide entered the lower airways ininspired air, the authors conclude that thelungs were releasing the sulfur dioxide dur-ing expiration, presumably from the pulmon-ary capillaries. S35 appeared in the bloodwithin 5 minutes of the start of exposure andcontinued to increase throughout the expos-ure. The radioactivity of the blood fell slowlyduring the 2-hour observation period follow-ing exposure; it was greater in the plasmathan in the blood cells. Aeration of the venousblood sample caused a loss of about 20 per-cent of its radioactivity, but little or no radio-activity was lost by aeration of arterial blood.Radioactivity was also detected in the urinewithin minutes after exposure.
Dalhamn and co-workers 48-513 studied theabsorptive capacity of the nasal cavity ofrabbits for sulfur dioxide. Some animalsbreathed spontaneously through the nosefrom a chamber containing sulfur dioxide,and samples were taken from cannula insert-ed in the trachea immediately below the thy-roid. In such animals, an initial exposure con-centration of about 100 ppm ( ,-,290 mg/m3)had been reduced to about 2 ppm (about 6mg/m3) by the time it reached the trachealsampling tube. A concentration of about 240ppm (about 690 mg/m3) was reduced toabout 2 ppm to 3 ppm by passage through thenasal cavity. During experiments in whichair was pulled through the animal's mouth,the absorption was less. A concentration of190 ppm (540 mg/m3) in the inhaled airreached the trachea at about 15 ppm (about43 mg/m3). This observation fits with theobservation by Speizer and Frank 57 that theincrease in pulmonary flow resistance in hu-man subjects was greater during mouth-breathing than during nose-breathing at a
given concentration of sulfur dioxide in theinhaled air. Somewhat lower absorption val-ues were obtained when air was suckedthrough the nasal cavity than had been ob-tained with the animals breathing spontane-ously through the nose.
The overall conclusion is that at levels of100 ppm to 300 ppm (290 mg/m3 to 860mg/m3) , 90 percent or more of the inhaledsulfur dioxide does not reach the lungs. Thisoffers a reasonable explanation for the highlevels that are needed in experimental ani-mals to produce lung pathology and mortal-ity.
Standberg 28 studied the absorption of sul-fur dioxide by rabbits breathing spontane-ously through the nose. A sampling devicewas implanted in the trachea, and the sulfurdioxide was tagged with S35 for analyticalpurposes. A concentration range of 0.05 ppmto 700 ppm (145 µg /m3 to 2,000 mg/m3) inthe inhaled air was studied. There was con-siderable scatter in the data, but it was clearthat at concentrations of about 100 ppm( ,-,290 mg/m3) there was an absorption ofapproximately 95 percent at inspiration andapproximately 98 percent at expiration. Asthe concentration decreased, the absorptionwas less efficient, and at levels of 0.1 ppm(285 µg /m3) and below only about 40 percentwas absorbed during inspiration and about 80percent at expiration, with some experimentsshowing even lower absorption efficiencies.It was proposed that the higher concentra-tions cause excess secretion of mucus and in-crease the absorption efficiency.
Amdur 24 made use of Strandberg's datato replot the dose-response curve relating re-sistance increase to concentration of sulfurdioxide. The data on guinea pigs were avail-able over the range of 0.16 ppm to 835 ppm(460 µg /m3 to 2,390 mg/m3) , which was es-sentially the same range covered by Strand-berg's studies. If the nasal absorption was 95percent or 98 percent for high concentrationsbut only 40 percent or 50 percent for lowconcentrations as Strandberg observed, andif the response observed resulted from theconcentration reaching the lung, this couldperhaps explain the nonlinearity of the doseresponse curve. When the air concentrationswere calculated as effective "lung concentra-
83

tions" using Strandberg's data, a straightline did result. At levels below 100 ppm( ,-,290 mg/m3), the experimental curve foranimals breathing through a tracheal can-nula gave values quite close to the hypotheti-cal "lung" curve. Strandberg's finding that,at low concentrations, sulfur dioxide pene-trated the upper respiratory tract probablyexplains the similarity of response with andwithout the cannula at concentrations of 0.4ppm (1.1 mg/m"). Strandberg's data obtain-ed on rabbits appear to be applicable to gui-nea pigs.
G. MISCELLANEOUS BIOCHEMICALEFFECTS OF SULFUR DIOXIDE
Since experiments have demonstrated thewide distribution of S35 throughout the bodyfollowing inhalation of sulfur dioxide, it isreasonable to search for possible biochemicaleffects. A biochemical lesion often is the fun-damental basis for the response of an organ-ism to toxic agents, and with many com-pounds the finding of such a biochemical le-sion has provided the key to an understand-ing of their toxic action. There have beena few biochemical studies,, "-"1 of animals ex-posed to sulfur dioxide, but from these noclear-cut picture of a biochemical lesion hasemerged.
H. SUMMARY
This chapter describes animal toxicologyof sulfur oxides. Both sulfur dioxide and sul-furic acid are considered in terms of dosagerequired to produce death, pathologicalchange, and changes in pulmonary function.
Both sulfur dioxide and sulfuric acid irri-tate the respiratory system; they must, how-ever, be employed at high concentrations ifmortality is chosen as the criterion of re-sponse. Sulfuric acid is more toxic than sul-fur dioxide, and its toxicity is dependent onparticle size. The guinea pig is apparently themost susceptible laboratory animal studied todate, although it can withstand concentra-tions of sulfuric acid which would be intol-erable to .man.
Compared to realistic air pollutant levels,it requires relatively high concentrations ofsulfur dioxide or sulfuric acid to producepathological lung change or mortality in ani-
84
mals. The type of pathological change observ-ed in the guinea pig depends on whether thedeath was rapid as a result of bronchialspasm or Was delayed.
Sulfur dioxide is capable of producingbronchoconstriction in experimental animalssuch as the guinea pig, the dog, the cat, andalso in man. This bronchoconstrictive prop-erty is common to various respiratory irri-tants. Receptors in the tracheobronchial treehave been shown to be sensitive to sulfurdioxide, and bronchoconstriction can be elic-ited by exposing only the upper airways tosulfur dioxide. The response is blocked byatropine or by cooling; of the cervical vago-sympathetic nerves.
Dose-response curves have been establish-ed for the guinea pig; they relate the con-centration of sulfur dioxide to the observedincrease in pulmonary flow resistance pro-duced by one hour exposures. Slight increasesin resistance are detectable at 0.16 ppm (460mg/in") and the changes are readily revers-ible. The speed of onset (at least at high con-centrations) and ready reversibility suggestthat changes in smooth muscle tone are thecause of the observed bronchoconstriction.
Sulfuric acid and some, but not all, par-ticulate sulfates also produce bronchocon-striction in the guinea pig. The response ishighly dependent on particle size, with thesmallest particles showing the greatest irri-tant potency. Comparative data are availableonly for the guinea pig; in this animal, sul-furic acid and irritant particulate sulfateshave a greater irritant potency at a givenconcentration than sulfur dioxide alone.
Data obtained on guinea pigs suggest thatthe response to low concentrations is simi-lar in type to that produced by higher con-centrations but that the response decreasesin magnitude with decreasing concentration.The nature of the experimental techniquesused on guinea pigs may 1..,,nder the animalsespecially sensitive to irritant action. In-creases in flow-resistance produced in theseanimals are not considered as indications ofmajor physiological change and are not suit-able for direct extrapolation.
The physiological response elicited in catsby small particulate irritants is probablycaused by reflex action on airway smooth

muscle. Morphological studies show that theprincipal sites of constriction are the aveolarducts and terminal bronchioles. Bronchi andbronchioles larger than 400 p, are unaffected.The response to the particulate irritants dis-appeared more slowly than did the responseto gaseous irritants.
To summarize our knowledge of the ab-sorption and distribution of sulfur dioxide,it has been shown that sulfur dioxide is ab-sorbed in the upper airways, and nasal ab-sorption can account for as much as 95 per-cent to 98 percent at high sulfur dioxide con-centrations. This absorption provides a pro-tective effect to the remainder of the pulmon-ary system and responses are generallygreater when sulfur dioxide is breathed viatracheal cannulae.
I. REFERENCES1. Setterstrom, C. "Effects of Sulfur Dioxide on
Plants and Animals." Ind. Eng. Chem., Vol. 32,pp. 473-479, April 1940.
2. Negherbon, W. 0. "Sulfur Dioxide, Sulfur Tri-oxide, Sulfuric Acid and Fly Ash: Their Natureand Their Role in Air Pollution." Edison Elec-tric Institute, New York, Pub.-66-900, 1966.
3. Weedon, F. R., Hartzell, A., and Setterstrom, C."Toxicity of Ammonia, Chlorine, Hydrogen Cya-nide, Hydrogen Sulphide, and Sulphur DioxideGases. V. Animals." Contrib. Boyce ThompsonInstitute, Vol. 11, pp. 365-385, Oct.-Dec. 1940.
4. McCallum, S. E. and Setterstrom, C. "Toxicityof Ammonia, Chlorine, Hydrogen Cyanide, Hy-drogen Sulphide, and Sulphur Dioxide Gases. I.General Methods and Correlations." Contrib.Boyce Thompson Institute, Vol. 11, pp. 325-330,1940.
5. Weedon, F. R. "Experimental Acute GastricUlcer Produced in Animals by Exposure to Sul-fur Dioxide Gas." New York State J. Med., Vol.42, pp. 620-623, 1942.
6. Setterstrom, C. and Zimmerman, P. W. "Appa-ratus for Studying Effects of Low Concentra-tions of Gases on Plants and Animals." Contrib.Boyce Thompson Institute, Vol. 9, pp. 161-169,1938.
7. Leong, K. J., MacFarland, H. A., and Sellers,E. A. "Acute SO, Toxicity: Effects of HistamineLiberation." Arch. Environ. Health, Vol. 3, pp.668-675, 1961.
8. Weedon, F. R., Hartzell, A., and Setterstrom, C."Effects on Animals of Prolonged Exposure toSulfur Dioxide." Contrib. Boyce Thompson In-stitute, Vol. 10, pp. 281-324, 1939.
9. Goldring, I. P., Cooper, P., Ratner, I. M., andGreenburgh, L. "Pulmonary Effects of SulfurDioxide Exposure in the Syrian Hamster." Arch.
Environ. Health, Vol. 15, pp. 167-176, 1967.10. O'Donoghue, J. C. and Graesser, F. E. "Effects
of SO, on Guinea Pigs and Swine." Canad. J.Comp. Med. and Vet. Sci., Vol. 26, pp. 255-263,1962.
11. Reid, L. "An Experimental Study of Hypersecre-tion of Mucus in the Bronchial Tree." Brit. J.Exp. Pathol., Vol. 44, pp. 437-445, Aug. 1963.
12. Dalhamn, T. "Mucus Flow and Ciliary Activityin Trachea of Healthy Rats and Rats Exposedto Respiratory Irritant Gases (SO2, NH3,HCHO) : A Functional and Morphologic (LightMicroscopic and Electron Microscopic Study),with Special Reference to Technique." ActaPhysiol. Scand., Vol. 36, Supplementum No. 123,pp. 1-152, 1956.
13. Treon, J. F., Dutra, F. R., Cappel, J., Sigmon,H., and Younker, W. "Toxicity of Sulfuric AcidMist." A.M.A. Arch. Ind. Hyg. Occup. Med.,Vol. 2, pp. 716-734, 1950.
14. Mathur, K. and Olmstread, P. "Inhalation Tox-icity of Sulfuric Acid Mist: Animal ExperimentStudy of the Problem." Thesis, Harvard Schoolof Public Health, Boston, Massachusetts, Sept.1948.
15. Amdur, M. 0., Schulz, R. Z., and Drinker, P."Toxicity of Sulfuric Acid Mist to Guinea Pigs."A.M.A. Arch. Ind. Hyg. Occup. Med., Vol. 5,pp. 318-329, April 1952.
16. Pattle, R. E., Burgess, F., and Cullumbine, H."The Effects of Cold Environment and of Am-monia on the Toxicity of Sulphuric Acid Mistto Guinea Pigs." J. Pathol. Bacteriol., Vol. 72,pp. 219-232, July 1956.
17. Thomas, M. D., Hendricks, R. H., Gunn, F. D.,and Critchlow, J. "Prolonged Exposure of GuineaPigs to Sulfuric Acid Aerosol." A.M.A. Arch.Ind. Health, Vol. 17, pp. 70-80, Jan. 1958.
18. Bushtueva, K., A. "Toxicity of H2504 Aerosol."Gig. i Sanit., Vol. 22, pp. 17-22, 1957. In:U.S.S.R. Literature on Air Pollution and RelatedOccupational Diseases. A Survey. Vol. I. Trans-lated by B. S. Levine, U.S. Dept of Commerce,Office of Technical Services, Washington, D.C.,Jan. 1960, pp. 63-66.
19. Bushtueva, K. A. "Experimental Studies on theEffect of Low Oxides of Sulfur Concentrationson the Animal Organism." In: Limits of Allow-able Concentrations of Atmospheric Pollutants.Book 5. V. A. Ryazanov (ed.), B. S. Levine(trans.), U.S. Dept. of Commerce, Office of Tech-nical Services, Washington, D.C., March 1962,pp. 92-102.
20. Amdur, M. 0. and Mead, J. "A Method forStudying the Mechanical Properties of the Lungsof Unanesthetized Animals. Application of theStudy to Respiratory Irritants." In: Proc. 3rdNational Air Pollution Symposium, Pasadena,California, April 18-20, 1955, pp. 150-159.
21. Amdur, M. 0. and Mead, J. "Mechanics of Res-piration in Unanesthetized Guinea Pigs." Am.J. Physiol., Vol. 192, pp. 364-368, 1958.
85

22. Mead, J. "Control of Respiratory Frequency." 37.J. Appl. Physiol., Vol. 15, pp. 325-336, 1960.
23. Amdur, M. 0. "The Physiological Response ofGuinea Pigs to Atmospheric Pollutants." Int. J. 38.Air Pollution, Vol. 1, pp. 170-183, Jan. 1959.
24. Antdur, M.O. "Respiratory Absorption Data andSO2 Dose-Response Curves." Arch. Environ. 39.Health, Vol. 12, pp. 729-732, 1966.
25. Amdur, M. 0. "The Effect of Aerosols on theResponse to Irritant Gases." In : Inhaled Par- 40.tides and Vapors, C. N. Davies (ed.), Proc. Int.Symposium, Oxford, March 29-April 1, 1960,Pergamon Press, Oxford, 1961, pp. 281-292.
26. Murphy, S. D. "A Review of Effects on Animalsof Exposure to Auto Exhaust and Some of itsComponents." J. Air Pollution Control Assoc.,Vol. 14, pp. 303-308, 1964.
27. Amdur, M. 0. and Corn, M. "The Irritant Po-tency of Zinc Ammonium Sulfate of DifferentParticle Sizes." Am. Ind. Hyg. Assoc. J., Vol.24, pp. 326-333, July-Aug. 1963.
28. Strandberg, L. G. "F.102 Absorption in the Res-piratory Tract." Arch. Environ. Health, Vol. 9,pp. 160-166, Aug. 1964.
29. Davis, T. R. A., Battista, S. P., and Kensler, C. J."Mechanism of Respiratory Effects During Ex-posure of Guinea Pigs to Irritants." Arch. En-viron. Health, Vol. 15, pp. 412-419, 1987.
30. Balchum, 0. J., Dybicki, J., and Meneeiy, G. R."The Dynamics of Sulfur Dioxide Inhalation(Absorption, Distribution, and Retention)."A.M.A. Arch. Ind. Health, Vol. 21. pp. 564-569,June 1960.
31. Balchum, O. J., Dybicki, J., and Meneely, G. R."Adsorption and Distribution of 5'02 InhaledThrough the Nose and Mouth by Dogs." Am. J.Physiol., Vol. 197, pp. 1317-1321, Dec. 1959.
32. Balchum, 0. J., Dybicki, J., and Meneely, G. R."Measurement of Pulmonary Resistance andCompliance with Concurrent Tissue RadioactiveSulfur Distribution in Dogs Inhaling a LabeledAir Pollutant: Sulfur Dioxide." Fed. Proc., Vol.18, p. 6, March 1959.
33. Balchum, 0. J., Dybicki, J., and Meneely, G. R."Pulmonary Resistance and Compliance withConcurrent Radioactive Sulfur Distribution inDogs Breathing S'02." J. Appl. Physiol., Vol.15, pp. 6246, Jan. 1960.
34. Mead, J. and Collier, C. "Relation of VolumeHistory of Lungs to Respiratory Mechanics inAnesthetized Dogs." J. Appl. Physiol., Vol. 14,pp. 660-678, 1959.
35. Salem, H. and Aviado, D. M. "Inhalation of Sul-fur Dioxide. Comparative Behavior of Bron-chiolar and Pulmonary Vascular Smooth Mus-cles." Arch. Environ. Health, Vol. 2, pp. 656-662, June 1961.
36. Yokoyama, E. and Ishikawa, K. "The Effect of 51.Sulfur Dioxide upon Mechanical Properties ofthe Lungs in Dogs." Japan J. Industr. Health,Vol. 4, pp. 22-32, 1962.
41.
42.
43.
44.
45.
46.
47.
48.
49.
50.
86
Frank, N. R. and Speizer, F. E. "SO2 Effects onthe Respiratory System in Dogs." Arch. Environ.Health, Vol. 11, pp. 624-634, 1965.Widdicombe, J. G. "Respiratory Reflexes fromthe Trachea and Bronchi of the Cat." J. Physiol.,Vol. 123, pp. 55-70, 1954.Widdicombe, J. G. "Receptors in the Trachea andBronchi of the Cat." J. Physiol., Vol. 123, pp.71-104, 1954.Nadel, J. A., Salem, H., Tamplin, B., and Yoki-wa, Y. "Mechanism of Bronchoconstriction."Arch. Environ. Health, Vol. 10, pp. 175-178, Feb.
1965.Widdicombe, J. G., Kent, D. C., and Nadel, J. A."Mechanism of Bronchoconstriction during In-halation of Dust." J. Appl. Physiol., Vol. 17, pp.613-616, 1962.Amdur, M. 0. "The Respiratory Response ofGuinea Pigs to Sulfuric Acid Mist." A.M.A.Arch. Ind. Health, Vol. 18, pp. 407-414, Nov.1958.Hemeon, W. C. L. "The Estimation of HealthHazards from Air Pollution." A.M.A. Arch. Ind.Health, Vol. 11, pp. 397-402, 1955.Nadel, J. A., Corn, M., Zwi, S., Ferch, J., andGraf, P. "Location and Mechanism of AirwayConstriction after Inhalation of Histamine Aero-sol and Inorganic Sulfate Aerosol." Proceedings,2nd International Symposium on Inhaled Parti-cles and Vapors, C. N. Davies (ed.),' PergamonPress, Oxford, 1966, p. 55.Amdur, M. 0. and Underhill, D. "The Effect ofVarious Aerosols on the Response of GuineaPigs to Sulfur Dioxide." Arch. Environ. Health,Vol. 16, pp. 460-468, 1968.Cralley, L. V. "The Effect of Irritant Gases uponthe Rate of Ciliary Activity." J. Ind Hyg. Toxi-col., Vol. 24, pp. 193-198, 1942.Dalhamn, T. and Strandberg, L. "Acute Effectof Sulfur Dioxide on the Rate of Ciliary Beatin the Trachea of Rabbit, In Vivo and In Vitro,with Studies or the Absorptional Capacity ofthe Nasal Cavity." Int. J. Air Water Pollution,Vol. 4, pp. 154-167, Sept. 1961.Dalhamn, T. "Studies on the Effect of SulfurDioxide on Ciliary Activity in Rabbit TracheaIn Vivo and In Vitro and on the ResorptionalCapacity of the Nasal Cavity." Am. Rev. Resp.Dis., Vol. 83, pp. 566-567, April 1961.Dalhamn, T. and Sjoholm, J. "Studies on SO2,NO2, and NI-12: Effect on Ciliary Activity in Rab-bit Trachea of Single In Vitro Exposure and Re-sorption in Rabbit Nasal Cavity." Acta Physiol.Scand., Vol. 58, pp. 287-291, 1963.Dalhamn, T. and Strandberg, L. "Synergism be-tween Sulphur Dioxide and Carbon Particles.Studies on Adsorption and on Ciliary Movementsin the Rabbit Trachea In Vivo." Int. J. AirWater Pollution, Vol. 7, pp. 517-529, 1963.Dalhamn, T. and Rohdin, J. "Mucous Flow andCiliary Activity in the Trachea of Rats Exposedto Pulmonary Irritant Gas." Brit. J. Ind. Med.,Vol. 13, pp. 110-113. April 1956.

52. Ball, C. 0. T., Heyssel, R. M., and Balchum, 0.J., Elliott, G. 0., and Meneely, G. R. "Survivalof Rats Chronically Exposed to Sulfur Dioxide." 59.Physiologist, Vol. 3, p. 15, Aug. 1960.
53. "Air Pollution Conference Report." Pub. HealthReports, Vol. 75, pp. 1173-1189, Dec. 1960.
54. Goldsmith, J. R. Personal communication.55. Bystrova, T. A. "Effects of Sulfur Dioxide Stud-
ied with the Use of Labeled Atoms." Gig. iSanit., Vol. 20, pp. 30-37, 1957. In: U.S.S.R.Literature on Air Pollution and Related Occu-pational Diseases. A Survey, Vol. 1, Translatedby B. S. Levine, U.S. Dept. of Commerce, Officeof Technical Services, Washington, D.C., pp. 89-97, Jan. 1960.
56. Frank, N. R., Yoder, R. E., Yokoyama, E., andSpeizer, F. E. "The Diffusion of SO2 from TissueFluids into the Lungs Following Exposure ofDogs to 802." Health Physics, Vol. 13, pp. 31-38,1967.
57. Speizer, F. E. and Frank, N. R. "A Comparisonof Changes in Pulmonary Flow Resistance inHealthy Volunteers Acutely Exposed to SO2 byMouth and by Nose." Brit. J. Indust. Med., Vol.23, pp. 75-79, 1966.
58. Thompson, J. R. and Pace, D. M. "The Effectsof Sulphur Dioxide upon Established Cell Lines
60.
61.
Cultivated In Vitro." Canad. J. Biochem. Phys-iol., Vol. 40, pp. 207-217, 1962.Navrotskii, V. K. "Effects of Chronic Low Con-centration Sulfur Dioxide Poisoning on the Im-muno-Biological Reactivity of Rabbits." Gig. i
Sanit., Vol. 24, pp. 21-25, 1959. In: U.S.S.R.Literature on Air Pollution and Related Occu-pational Diseases. A Survey, Vol. 6, Translatedby B. S. Levine, U.S. Dept. of Commerce, Officeof Technical Services, Washington, D.C., April1961, pp. 157-163.Prokhorov, Yu. D. and Rogov, A. A. "Histopath-ological and Histochemical Changes in the Or-gans of Rabbits after Prolonged Exposure toCarbon Monoxide, Sulfur Dioxide, and theirCombination." Gig. i Sanit., Vol. 24, pp. 22-26,1959. In: U.S.S.R. Literature on Air Pollutionand Related Occupational Diseases. A Survey,Vol. 5, Translated by B. S. Levine, U.S. Dept.of Commerce, Office of Technical Services, Wash-ington, D.C., 1961, pp. 81-86.Lobova, E. K. "Effect of Low Sulfur DioxideConcentrations on the Animal Organism." In:U.S.S.R. Literature on Air Pollution and Re-lated Occupational Diseases. A Survey, Vol. 8,Translated by B. S. Levine, U.S. Dept. of Com-merce, Office of Technical Services, Washington,D.C., 1963, pp. 79-89.
87

Chapter 7
TOXICOLOGICAL EFFECTS OF SULFUR OXIDESON MAN

A. INTRODUCTION
Table of ContentsPage91
B. EVALUATION BY PULMONARY FUNCTION . 911. Sulfur Dioxide . 91
a. Short-Term Exposures 91b. Repeated Exposures 93
2. Sulfuric Acid Aerosol 94
C. NASAL ADSORPTION 95
D. EFFECT ON REMOVAL OF MUCUS FROM THERESPIRATORY TRACT 96
E. SENSORY THRESHOLD CONCENTRATIONS .. .. ............. .. 961. Odor Perception Threshold . 962. Sensitivity of the Dark-Adapted Eye . 973. Interruption of Alpha Rhythm . 984. Optical Chronaxie . 98
F. SUMMARY 99
G. REFERENCES 100
List of Tables
Table
7-1 Threshold Concentrations of Sulfur Dioxide, SulfuricAcid and their Combinations for Various Reflex Responses 99
90

Chapter 7
TOXICOLOGICAL EFFECTS OF SULFUR OXIDES ON MAN
A. INTRODUCTIONReviews of the health effects of air pollu-
tion have been made by Heimann,' Gold-smith,2 Lawther,3 Phair,4 Phillips,3 Catcott,6Stokinger,7 and Anderson.8 In addition, anumber of shorter papers report the healtheffects of polluted air which contains oxidesof sulfur along with other pollutants.6-27These papers reveal the complexity of theproblem of assessing the effects of air pol-lution. Anderson 8 states that although thereare many serious limitations to publishedresearch on the health hazards of air pollu-tion, both epidemiological and detailed clin-ical, physiological, and animal experimentsconfirm that these hazards exist. He em-phasizes the importance of particulate ma-terial as a major contributor to the notedresponses, or as an index of air pollution re-lated to these effects.
This chapter considers the available evi-dence, reported in the literature, on the tox-icological effects of the oxides of sulfur onman. More extensive reviews of the toxicol-ogy of oxides of sulfur have been presentedby Greenwald 2's and Amdur." The combinedeffects of sulfur dioxide and particulate mat-ter are discussed in Chapter 8.
Much of the human toxicological researchhas been oriented towards occupationalhealth. Considerations affecting communityair pollution must take account of the re-actions of unusually sensitive individuals, sothat the published studies are generally oflimited applicability to the establishment ofcommunity air quality criteria.
B. EVALUATION BY PULMONARYFUNCTION
Various investigators have examined theresponse of human subjects exposed for briefperiods to known concentrations of sulfur
dioxide or sulfuric acid mist, and measuredthe effects on pulmonary function. The mostvaluable of these studies are those dealingwith constriction of the airways as reflectedin measurements of pulmonary flow resist-ance. Such experiments evaluate directly theresponse of man, thus having the advantagethat extrapolation from the response of someother species of animal is avoided. On theother hand, the number of individuals usedin these studies is necessarily limited, anda paper reporting the response of 10 sub-jects is considered a major contribution. It isdifficult to extend results obtained on so lim-ited a sample to define the response of anyspecies of animals, and no one seriously pro-poses such extrapolations.
1. Sulfur Dioxidea. Short-Term Exposures
Sim and Pattie 30 exposed healthy malesaged 18 to 45 to sulfur dioxide either by facemask (264 exposures) for 10 minutes or ina chamber (330 exposures) for 60 minutes.During the chamber exposures the men wereallowed to walk around or smoke if theywished. Mask exposures used concentrationsfrom about 1 ppm to 80 ppm (,--,3 mg/m3to 230 mg/m3) , while concentrations in thechamber were from 1 ppm to 23 ppm (,--,3mg/m3 to 65 mg/m3) . The subjects were ob-served clinically, and increases in airway re-sistance greater than 20 percent were re-corded.
From the wide range of concentrations,and the large number of exposures, a dose-response relationship was found. Unfortu-nately, it was not expressed in as muchdetail as the extensive experimental datawarranted on this occasion. It was reportedthat with dosages below 800 mg-min/m3(equivalent to exposures of 10 minutes to
91

30 ppm or 60 minutes to 5 ppm) little changewas noted either clinically or by measure-ment of lung resistance to air flow. Occa-sionally, there was an increase in lung re-sistance sufficient to be detected by the in-strument used. At the same time, there wereauscultatory signs of irritation in the chestof some, but not all, of the subjects. Whendosages above 1330 mg-min/m3 (presumably50 ppm for 10 minutes or 9 ppm for 60 min-utes) were used, the lung resistance in-creased significantly above normal in 50 per-cent of the people exposed. The authors didnot define "significantly above normal" inthis context. Measurements made during ex-posure showed that the increase of airwayresistance occurred within the first 10 min-utes with little further change at the endof an hour, which makes the authors' choiceof the C x t-relationship to describe the pat-tern of response seem at variance with theirfindings. Rhinorrhea and lachrymation werecommon symptoms at higher dosages, butthe most frequent physical finding was thepresence of high-pitched musical rales, witha tendency to prolongation of the expiratoryphase of respiration. Moist rales were com-monly heard in the more peripheral regionsof the lung after prolonged exposure, where-as in those who received smaller dosages orshorter exposures, rales were heard anteri-orly over the large bronchi. Once again, thisresult seems at variance with the use of aC x t-relationship in connection with thedata.
There was no correlation between familialhistory of allergy and symptomatology, butin isolated instances there was evidence ofincreased flow resistance and considerablediscomfort in those who had previously beensensitive to fog in the London area or whohad definite personal histories of allergy.The effect of the smoking habits of the sub-jects, or the effect of smoking during ex-posure, were not discussed.
In 8 out of the 594 exposures there wereundefined "significant changes" in pulserate, respiratory rate, volumes of tidal orsupplemental air, vital capacity, maximumbreathing capacity, or blood pressure. Twoof these individuals had previous personalhistories of allergy and 2 had experienced
92
previous discomfort from smog. The other4 were suffering from the onset of mild res-piratory infections on the day nf exposure.One person developed a unilateral, nonspe-cific pleural effusion 1 week after exposure.The investigators themselves were in nor-mal health at the start of the experiments,which extended over a 10-month period.They both developed what appeared to bean increased sensitivity to sulfur dioxide andsulfuric acid mist. One of them, who wasentirely free of chest symptoms at the out-set, developed a moderately severe but ex-tremely persistent bronchitis which was im-mediately exacerbated into an uncomfortableperiod of coughing and wheezing on exposureto either sulfur dioxide or sulfuric acid.
Frank and co-workers 31-34 have examinedthe response of human subjects to sulfur di-oxide. In the experiments reported ini-tially,31 11 healthy adults were exposed onseparate occasions to average sulfur dioxideconcentrations of 1 ppm ( -.3 mg/m3) , 5ppm ( ,-,14 mg/m3), and 1,3 ppm (,-,37mg/m3) . Exposures lasted 10 minutes to30 minutes and, for each subject, werespaced at least 1 month apart. The subjectswere seated in a body plethysmograph,breathing spontaneously by mouth whilemeasurements of respiratory mechanics weremade with an esophageal catheter. The meas-urements did not necessitate the interruptionof exposure to the gas. At 1 ppm, only oneof the 11 subjects showed a statistically sig-nificant increase in flow resistance, and hiscontrol resistance was the highest encoun-tered. One other subject showed a statis-tically significant decrease in resistance dur-ing exposure to 1 ppm. At the 5 ppm level,9 out of the 11 subjects showed a statisticallysignificant increase in resistance over con-trol values, and the average increase for thegroup was 39 percent above control. At 13ppm all subjects showed an increase in re-sistance, and 9 of these measurements werestatistically significant on an individual ba-sis. The average increase for the group was72 percent above control.
The data obtained in man may be com-pared with data obtained by similar methodsin guinea pigs exposed to the same concen-trations. Data for guinea pigs were avail-

able for animals breathing normally andbreathing through a tracheal cannula. Thehuman subjects were mouth-breathing. Itwas found that, except at the lowest gas con-centration, the human subjects appeared tobe slightly more sensitive than the guineapigs. The most comparable dose-responserelationships were for the tracheotomizedguinea pigs and the normal human subjects.
The time course of the resistance changeswas examined. Within 1 minute of exposure,flow resistance had increased significantly.The increase after 5 minutes was greaterthan the increase at 1 minute, but no fur-ther significant change occurred between 5minutes and 10 minutes. If the 5-minuteand 10-minute values are averaged to repre-sent the "peak" response, then 45 percentof this peak was reached within the firstminute of exposure. Five exposures to thehigher two concentrations (5 ppm and 13ppm) were extended to 30 minutes, but al-though the resistance remained elevatedthroughout this exposure period, the resist-ance tended to decrease slightly from the10-minute values. (In this regard, the re-sponse of human subjects to sulfur dioxidediffered from that of guinea pigs, in whichthe resistance did not decline during an ex-posure period of 1 hour 35' 36 and continuedto increase in a limited number of animalsexposed for 3 hours.) The extension of theexposure time to 30 minutes for 5 subjectsexposed to 1 ppm did not produce an in-crease in flow resistance, suggesting that,within the limited time intervals studied, theresponse is related to the concentration ofsulfur dioxide and not to a C x t-relationship.This statement cannot obviously be extrap-olated to long-term exposures.
The average flow resistance for the groupstill remained elevated 15 minutes after theend of exposure to both 5 ppm and 13 ppmsulfur dioxide. At 5 ppm the difference wasstatistically significant in 4 individual sub-jects; at 13 ppm it was not significant forany individual subject. In 5 subjects, pe-riodic measurements were made within the15-minute period and it was found that, attimes, recovery may be completed withinless than 5 minutes after exposure ceases.This point should be borne in mind when
using techniques which involve a lapse oftime between exposure and measurement.
A decrease in compliance was noted in onlyone single instance during an exposure to13 ppm. At the same time the increase inflow resistance of this individual was belowthe average of the group. Once again theresponse of human subjects appears to differfrom that of guinea pigs in which slight de-creases in compliance appeared to accom-pany the resistance increase. There was aslight increase in functional residual capac-ity at 13 ppm, but the two lower concentra-tions (1 ppm and 5 ppm) produced nochange. Alterations in maximum flow rate(as measured with the Wright peak flow-meter) and in timed vital capacity were min-imal when compared to alterations in pul-monary flow resistance. Exposures whichincreased the pulmonary flow resistance by89 percent showed only a 7 percent decreasein peak flow and, though the timed vital ca-pacity values were generally lower, thechanges expressed as percentages were mini-mal. A possible explanation for the relativeinsensitivity of these measurements is thatthey are preceded by a maximal inspiratoryeffort which may temporarily obliteratechanges of flow resistance of the magnitudeof those seen in this study. The smokinghabits of the subjects did not appear to in-fluence the response to sulfur dioxide.
b. Repeated ExposuresFrank et al." also found that when sulfur
dioxide (either with or without sodium chlo-ride aerosol) is administered twice in thecourse of one experiment (with a 15-minuteperiod of clean air between exposures), theresponse to the second exposure is less thanthe response to the first. The human sub-jects thus showed an adaptation to repeatedexposure to the gas.
Speizer and Frank "" compared the effectof sulfur dioxide on human subjects breath-ing the gas by nose and by mouth. Eightsubjects were studied. Exposures were toeither 15 ppm ( ,--s43 mg/m") or 28 ppm( ,80 mg/m3) sulfur dioxide and were of10-minute duration. Pulmonary flow resist-ance was measured during both types of ex-posure. The flow resistance of the nose was
93

measured during the nose breathing ex-posures. When sulfur dioxide was breathedby mouth the pulmonary flow resistance in-creased in 9 out of 12 experiments, and themagnitude of the change was on the aver-age greater at the higher concentration.When the same concentrations of sulfur di-oxide were administered by nose, pulmonaryflow resistance increased in only 3 out of12 experiments and decreased in one experi-ment. During the 15 minutes following theend of exposure the resistance remained ele-vated in 5 of the 12 experiments in which thegas was breathed by mouth. Four of theseexposures were to 28 ppm. When the gaswas breathed by nose the pulmonary flowresistance was often higher during the re-covery period than it had been during ex-posure. In 3 experiments it rose significantlyfor the first time during the recovery period,and in 2 others the increase was greater dur-ing recovery than it had been during ex-posure.
The response of nasal resistance to sulfurdioxide was variable. In 8 of the 12 experi-ments it increased at some point during ex-posure; in 3 experiments there was a de-crease; and 1 subject showed first a decreaseand then an increase during the same ex-posure. The subjects who showed an in-creased nasal resistance experienced no dif-ficulty in breathing.
When exposed by mouth, most of the sub-jects coughed several times during the firstfew minutes and had slight burning sensa-tions of the throat and substernal area forat least 5 minutes. When exposed by nose,there was little coughing and no chest symp-toms although some subjects did experienceirritation of the posterior pharynx whichlasted a few minutes.
Nadel et al.37 reported that airway resist-ance, determined with a body plethysmo-graph, was increased by exposure to 2 ppm(--,6 mg/m3) and 5 ppm ( --,14 mg/3) sul-fur dioxide for 3 to 10 minutes. One indi-vidual out of 7 exposed to 5 ppm for 10 min-utes, showed a marked increase in airwayresistance which was reversible by isopio-terenol inhalation. This subject had no pre-vious history of pulmonary disease. In laterstudies 38 39 an examination was made of the
94
response of 7 subjects exposed by mouth for10 minutes to from 4 ppm to 6 ppm sulfurdioxide. Such exposures increased the air-way resistance, and the onset of change va-ried from 10 seconds to 4 minutes. A maxi-mum response was usually observed within1 minute, but in 2 subjects the resistance in-creased during continued exposure, and in2 others the resistance decreased during ex-posure. The subject who showed the greatestchange became dyspneic and wheezed duringthe exposure. After subcutaneous injectionof 1.2 mg to 1.8 mg atropine sulfate, sulfurdioxide caused no significant change in air-way resistance. Most subjects coughed andsome experienced irritation of the pharynxand substernal area. These symptoms werenot affected by the atropine.
Tomono 40 reported that the lowest level ofsulfur dioxide which could induce broncho-constriction in 46 healthy male subjects was1.6 ppm ( --4.6 mg/m3). The changes wererelieved by isoproterenerol inhalation.
Burton et al.41 examined airway resistanceand dynamic lung compliance in 10 subjectsimmediately following 30-minute exposuresto 1 ppm (,--,3 mg/m3) to 3 ppm ( ,...,9
mg/m3) sulfur dioxide. Comparison with in-dividual or mean group controls did not re-veal significant increases in resistance orcompliance during quiet breathing or duringhyperventilation.
2. Sulfuric Acid Aerosol
Amdur et al.42 exposed subjects to sulfuricacid mist of MMD 1p, at concentrations of0.35 mg/m3 to 5 mg/m3 for 15 minutes. Res-piration rate, tidal volume, and minute vol-ume were measured. The subject's breathedthrough a pneumotachograph which permit-ted the measurement of inspiratory and ex-piratory flow rate. In 15 subjects exposedto 0.35 mg/m3 to 0.5 mg/m3, the respirationrate increased about 30 percent above con-trol values, the maximum inspiratory and ex-piratory flow rates decreased about 20 per-cent, and tidal volume decreased about 28percent. These changes occurred within thefirst 3 minutes of exposure and were main-tained throughout the 15-minute exposureperiod. When the exposure ended, lung func-tion returned rapidly to preexposure levels.

The first minute after termination of the ex-posure the tidal volume rose above controlvalues and then returned to preexposurelevels. Breathing through the same appa-ratus with omission of the acid mist wasdone as a control and no such changes wereobserved. At the highest level (5 mg/m3)the acid mist was perceptible to all, and somesubjects showed a marked response. The re-sponse was much more varied at this level,the main effect being a decrease in minutevolume and a prolongation of the expiratoryphase of the respiratory cycle. These experi-ments do not indicate whether bronchocon-striction was the response to sulfuric acid,although they suggest that this may be thecase.
Sim and Pattie "" studied the response ofhealthy males, aged 18 to 46, to sulfuric acidmist. They made 183 exposures of 10 min-utes by mask and 316 60-minute chamberexposures to an acid mist at a relative hu-midity of 62 percent. The droplet size was1ti and the strength of the sulfuric acid drop-lets was 10 N. They also made a total of 40exposures in the chamber at 91 percent rela-tive humidity. The droplet size was 1.5ti andthe normality was 4 N, and concentrationsof the dry mist were 3 mg/m" to 39 mg /maand of the wet mist were 11.5 mg/m" to38 mg/m". The reporting of the results wasvague. The sulfuric acid was more irritantat high humidity, when exposure at 20.8mg /m8 for 30 minutes produced intensecoughing which did not cease entirelythroughout the exposure period. The mistwas described as "almost intolerable at theonset" but the men "were able to continuefor a period of 30 minutes." No airway re-sistance measurements could be made dur-ing the first 10 minutes. When the coughinghad diminished enough to permit measure-ment, the increases ranged from 43 percentto 150 percent above normal. When the ex-posure was to dry mist at 39 mg/m" for a60-minute exposure, the mist was well tol-erated and there was minimal coughing. All12 men in the group showed an increase inresistance with a range of changes from 35.5percent to 100 percent above normal. Aswas mentioned previously, the investigatorsthemselves became sensitive to both sulfur
dioxide and sulfuric acid mist. One of themhad his last exposure to 39.4 mg/m3 of thedry mist, and he then exhibited chest symp-toms for the remainder of the exposure andwheezed persistently for 4 days thereafter.Two subjects exposed to sulfuric acid devel-oped long-lasting bronchitic symptoms.
Two points of value from this study applyto toxicological evaluation. One is the ob-served effect of high humidity on the irri-tant potency of sulfuric acid. The other isthat, in terms of sulfur equivalent, sulfuricacid is considerably more irritant to humansubjects than is sulfur dioxide.
Lawther 43 believes that experiments in thelaboratory in which normal subjects have in-haled sulfuric acid mists of various particlesizes but of concentrations of approximately1 mg /m3 have failed to produce significantalterations in airway resistance. He men-tions that certain individuals show a re-sponse to sulfur dioxide at concentrations atwhich the group tested as a whole did notrespond and suggests that no such hyper-sensitivity to sulfuric acid has been recorded.These opinions are presumably based on theauthor's own unpublished data and are diffi-cult to evaluate.
C. NASAL ADSORPTION
Frank and Speizer 44 45 made measure-ments of the uptake and release of sulfurdioxide by the human nose. Subjectsbreathed through a face mask with specialports for sampling tubes. Samples could betaken within the mask within the nose 1 cmto 2 cm beyond the alae nasi, and within theoropharynx as far back as could be toler-ated. The electrical conductivity method wasused to determine the concentration of sul-fur dioxide in samples taken during both in-spiration and expiration. The concentrationwithin the mask averaged 16 ppm ( -46mg /ma), and exposures were of 25-minutesto 30-minutes duration. The average con-centration in the nose was 13.8 ppm ( -39.5mg /ms), representing a decrease of 14 per-cent. The concentration at the oropharynxwas too small to be measured accurately.During exhalation, the sample from the nosecontained an average of 2 ppm, suggesting
95
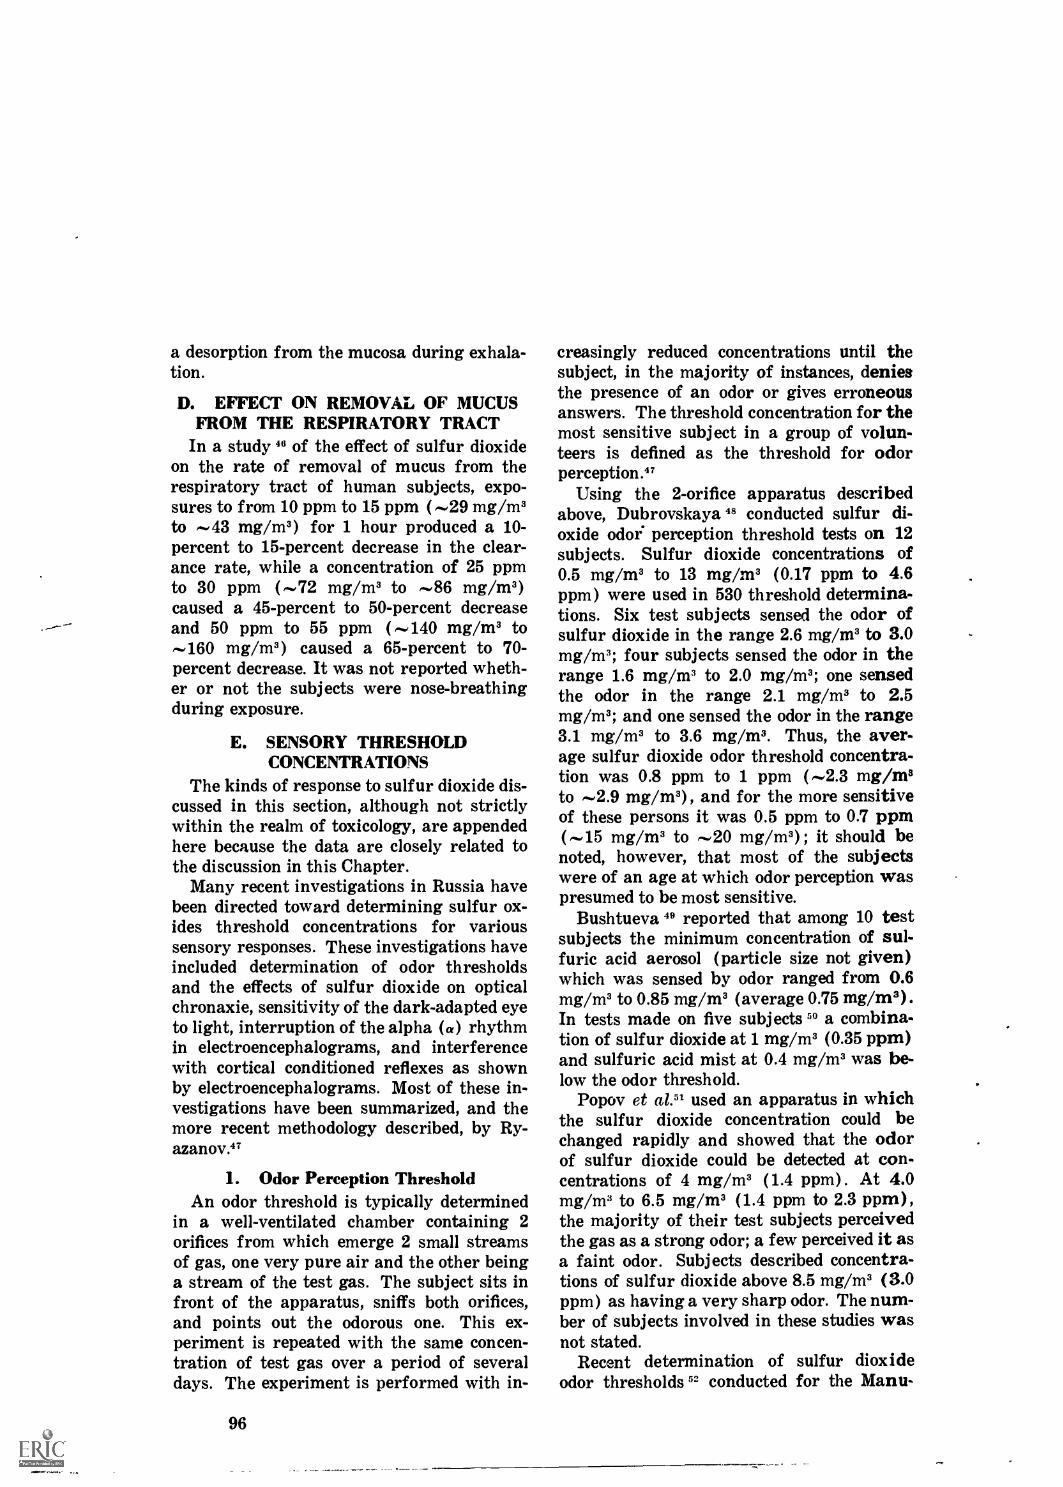
a desorption from the mucosa during exhala-tion.
D. EFFECT ON REMOVAL OF MUCUSFROM THE RESPIRATORY TRACT
In a study 46 of the effect of sulfur dioxideon the rate of removal of mucus from therespiratory tract of human subjects, expo-sures to from 10 ppm to 15 ppm ( -29 mg/m3to -43 mg/m3) for 1 hour produced a 10-percent to 15-percent decrease in the clear-ance rate, while a concentration of 25 ppmto 30 ppm ( -72 mg/m3 to -86 mg/m3)caused a 45-percent to 50-percent decreaseand 50 ppm to 55 ppm ( -140 mg/m3 to-160 mg/m3) caused a 65-percent to 70-percent decrease. It was not reported wheth-er or not the subjects were nose-breathingduring exposure.
E. SENSORY THRESHOLDCONCENTRATIONS
The kinds of response to sulfur dioxide dis-cussed in this section, although not strictlywithin the realm of toxicology, are appendedhere because the data are closely related tothe discussion in this Chapter.
Many recent investigations in Russia havebeen directed toward determining sulfur ox-ides threshold concentrations for varioussensory responses. These investigations haveincluded determination of odor thresholdsand the effects of sulfur dioxide on opticalchronaxie, sensitivity of the dark-adapted eyeto light, interruption of the alpha (a) rhythmin electroencephalograms, and interferencewith cortical conditioned reflexes as shownby electroencephalograms. Most of these in-vestigations have been summarized, and themore recent methodology described, by Ry-azanov.47
1. Odor Perception ThresholdAn odor threshold is typically determined
in a well-ventilated chamber containing 2orifices from which emerge 2 small streamsof gas, one very pure air and the other beinga stream of the test gas. The subject sits infront of the apparatus, sniffs both orifices,and points out the odorous one. This ex-periment is repeated with the same concen-tration of test gas over a period of severaldays. The experiment is performed with in-
96
creasingly reduced concentrations until thesubject, in the majority of instances, deniesthe presence of an odor or gives erroneousanswers. The threshold concentration for themost sensitive subject in a group of volun-teers is defined as the threshold for odorperception.'?
Using the 2-orifice apparatus describedabove, Dubrovskaya 48 conducted sulfur di-oxide odor perception threshold tests on 12subjects. Sulfur dioxide concentrations of0.5 mg/m3 to 13 mg/m3 (0.17 ppm to 4.6ppm) were used in 530 threshold determina-tions. Six test subjects sensed the odor ofsulfur dioxide in the range 2.6 mg/m3 to 3.0mg/m3; four subjects sensed the odor in therange 1.6 mg/m3 to 2.0 mg/m3; one sensedthe odor in the range 2.1 mg/m3 to 2.5mg/m3; and one sensed the odor in the range3.1 mg/m3 to 3.6 mg/m3. Thus, the aver-age sulfur dioxide odor threshold concentra-tion was 0.8 ppm to 1 ppm ( -2.3 mg/m3to -2.9 mg/m3) , and for the more sensitiveof these persons it was 0.5 ppm to 0.7 ppm( -15 mg/m3 to -20 mg/m3) ; it should benoted, however, that most of the subjectswere of an age at which odor perception waspresumed to be most sensitive.
Bushtueva 46 reported that among 10 testsubjects the minimum concentration of sul-furic acid aerosol (particle size not given)which was sensed by odor ranged from 0.6mg/m3 to 0.85 mg/m3 (average 0.75 mg/m3).In tests made on five subjects " a combina-tion of sulfur dioxide at 1 mg/m3 (0.35 ppm)and sulfuric acid mist at 0.4 mg/m3 was be-low the odor threshold.
Popov et al.51 used an apparatus in whichthe sulfur dioxide concentration could bechanged rapidly and showed that the odorof sulfur dioxide could be detected at con-centrations of 4 mg/m3 (1.4 ppm) . At 4.0mg/m3 to 6.5 mg/m3 (1.4 ppm to 2.3 ppm),the majority of their test subjects perceivedthe gas as a strong odor; a few perceived it asa faint odor. Subjects described concentra-tions of sulfur dioxide above 8.5 mg/m3 (3.0ppm) as having a very sharp odor. The num-ber of subjects involved in these studies wasnot stated.
Recent determination of sulfur dioxideodor thresholds 52 conducted for the Manu-

facturing Chemists' Association gave some-what lower values than those cited above.The concentrations at which first one-halfand then all of the panel members could posi-tively recognize the odor were reported bothto be 0.47 ppm (1.3 mg/m3) . The details ofthe test procedure are thoroughly discussedin the report, but one important aspect isreiterated as a reminder that odor thresholdsusually represent values derived under ideal-ly suited conditions and with trained indi-viduals. The investigators, who were highlyqualified to judge on the basis of substantialexperience with consumer evaluation ofknown flavor and odor situations, derivedthreshold values, in test rooms under idealconditions, lower than those which would berecognized by the majority of a populationunder ordinary atmospheric conditions. Thisdoes not mean that normal individuals ex-posed to sulfur dioxide under ideal test con-ditions could not perceive the 0.47 ppm levelindicated, but because of background odorand lack of awareness or concern with am-bient odor conditions, such individuals inan everyday situation would probably be lessresponsive to this low concentration than aresubjects undergoing a test.
2. Sensitivity of the Dark-Adapted Eye
The sensitivity of the eye to light whilea subject is in darkness increases with time.Several investigations have been made of theeffects of inhalation of sulfur oxides on thissensitivity. Typically, measurements of asubject's normal sensitivity are taken in a
idark, well-ventilated chamber in completesilence (sudden stimuli, including noise, maychange the sensitivity). Each subject istested once daily following preliminary con-ditioning at a high light level. Light sensi-tivity is measured at 5-minute or 10-minuteintervals, and a normal curve of increasingsensitivity to light is established from meas-urements taken over a period of 7 days to10 days:"
Dubrovskaya " studied the effect of in-haling sulfur dioxide in concentrations from0.96 mg/m3 to 19.2 mg/m3 for 15 minutesbefore measuring light sensitivity duringdark adaptation. She reported that lightsensitivity was increased by sulfur dioxide
concentrations of 0.96 mre/m3 to 1.8 mg/m3(0.34 ppm to 0.63 ppm), that the increase insensitivity reached a maximum at concen-trations of 3.6 mg/m3 to 4.8 mg/m3 (1.3 ppmto 1.7 ppm), and that further increases in thesulfur dioxide concentration resulted in pro-gressive lowering of eye sensitivity to lightuntil at 19.2 mg/m3 the sensitivity was iden-tical with that of the unexposed subject.
In exposures during light adaptation, sul-fur dioxide concentrations of 0.6 mg/m3 to7.2 mg/m3 (0.21 ppm to 2.5 ppm) causedslight increases in eye sensitivity. Maximumsensitivity was attained at 1.5 mg/m3 (0.52ppm) ; at higher concentrations the increasedsensitivity began to abate. Two human sub-jects were used in these experiments. Theodor threshold was between 2.5 mg/m3 and3.0 mg/m3 for one subject and between 3.0mg/m3 and 3.6 mg/m3 for the other, so thatchanges in sensitivity to light during darkadaptation were caused by sulfur dioxide con-centrations below the odor threshold.
Bushtueva 49 studied the effect of sulfuricacid mist on the sensitivity td light of twotest subjects. The test periods were 60, 90,and 120 minutes. During the first half hour,sensitivity was measured every 5 minutes,and after that every 10 minutes. In eachsubject a control curve was established by7 repeated tests, and then the effect on lightsensitivity of sulfuric acid aerosol exposurefor 4 minutes and for 9 minutes at the 15thand 60th minutes, respectively, was deter-mined. With sulfuric acid mist of undeter-mined particle size at a concentration of 0.6mg/m3, a just detectable increase in lightsensitivity was found as a result of the ex-posure at the 15th minute, but no detectableeffect was observed as a result of the ex-posure at the 60th minute. Concentrationsin the range of 0.7 mg/m3 to 0.96 mg/m3brought about a well-defined increase in lightsensitivity. With 2.4 mg/m3, increased sensi-tivity to light was elicited by the exposuresat both the 15th and 60th minutes of the test;normal sensitivity was restored in 40 to 50minutes.
Bushtueva 59 studied the effect of sulfurdioxide, sulfuric acid mist and combinationsof the two on sensitivity of the eye to lightin 3 subjects. The combination of sulfur di-
97

oxide at 0.65 mg/m3 (0.23 ppm) with sul-furic acid mist at 0.3 mg/m3 resulted in nochange in sensitivity of the eye to light. Anincrease of approximately 25 percent in lightsensitivity resulted from exposure to eithersulfur dioxide at 3 mg/m3 ( -1.0 ppm) orsulfuric acid mist at 0.7 mg/m3. The combi-nation of sulfur dioxide at 3 mg/m3 with sul-furic acid mist at 0.7 mg/m3 resulted in anincrease of approximately 60 percent inlight sensitivity. Exposures lasted for 41/2minutes.
3. Interruption of Alpha RhythmThe electroencephalogram is a composite
record of the electrical activity of the brainrecorded as the difference in electrical poten-tial between 2 points on the head. In theadult, the electroencephalogram character-istically shows a fairly uniform frequencyfrom 8 cycles to 12 cycles per second in theposterior head regions. Variations occurwith age, and the state of wakefulness andattentiveness, or as a result of incomingsensory stimuli from exteroceptive or in-teroceptive receptors. The dominant fre-quency is inhib5ted or attenuated by eye open-ing and by mental activity."
Subjects with well-defined a-rhythms stud-ied in a silent and electrically-shielded cham-ber show a temporary attenuation of thea-rhythm each time they are given a lightsignal. When the light is excluded, thea-rhythm returns to normal. A concentra-tion of test gas is determined which is so lowthat by itself it does n )t cause attenuation ofthe a-rhythm. A subject breathes the gas atthis concentration, and then he receives thelight signal. After exposure to this sequence(gas then light) several times (5 to 30 timesin 1 day), a subject will show attenuationbefore he receives the light signal; that is,he responds to the unperceived odor. Theunperceived odor thus becomes the condi-tioning stimulus and brings about the so-called conditioned electrocortical reflex.4T
Bushtueva et al." reported that 20-secondexposures of 6 human subjects to sulfur di-oxide concentrations from 0.9 mg/m3 to 3mg/m3 (-0.3 ppm to -1.0 ppm) producedattenuation of the a-wave lasting 2 to 6 sec-onds; at concentrations of 3.0 mg/m3 to 5.0mg/m3 (-1.0 ppm to 1.7 ppm) attenuation
98
lasted throughout the 20- second exposure.Exposures to 0.6 mg/m3 (-0.2 ppm) did notcause attenuation of the a-wave: Exposuresto sulfuric acid mist at 0.6 mg/m3 to 0.75mg/m3 caused attenuation of the a-wave,whereas exposures to 0.4 mg/m3 to 0.5mg/m3 did not. For both substances, thethreshold for attenuation of the a-wave isthe same as the odor threshold or the thresh-old of irritation of the respiratory tract. Inother experiments, Bushtueva demonstratedthat electrocortical conditioned reflexes couldbe developed with sulfur dioxide at 0.6mg/m3 ( -0.2 ppm) or with sulfuric acidmist at 0.4 mg/m3, but not with lesser con-centrations of either substance. Finally,Bushtueva 55 demonstrated that combinationsof sulfur dioxide at 0.50 mg/m3 (0.17 ppm)with sulfuric acid mist at 0.15 mg/m3 or sul-fur dioxide at 0.25 mg/m3 (0.087 ppm) withsulfuric acid mist at 0.30 mg/m3 could pro-duce electrocortical conditioned reflexes.
4. Optical Chronaxie
Chronaxie is defined as the time requiredfor excitation of a nervous element by adefinite stimulus. In the determination ofioptical chronaxie, a weak electrical currentis applied to the eyeball to give the sensa-tion of a light flash. For each subject thereis an intensity of stimulation (measured involts) below which no sensation of lighttakes place. The time required for this mini-mal voltage to produce the sensation of lightin a subject is the optical chronaxie for thesubject. According to Pavlovian theory, theexcitation of one area of the cerebral cortexmay inhibit the excitation of other areasthrough the rule of induction.4 It has there-fore been postulated that excitation of theolfactory sensory area by the oxides of sul-fur inhibits the light-sensing area of thecerebral cortex and thus increases opticalchronaxie.
Bushtueva 5° studied the effects of differ-ent concentrations of sulfur dioxide, sulfuricacid mist, and combinations of the two onthe optical chronaxie of three subjects. Op-tical chronaxie was determined in each testsubject at 3-minute intervals as follows: atthe start and on the 3rd, 6th, 9th, 12th and15th minutes. Between the 6th and 9th min-

utes the subjects inhaled sulfur dioxide, sul-furic acid mist, or their combination for 2minutes. In each subject the threshold con-centrations of sulfur dioxide and sulfuricacid mist were first determined independ-ently, and then threshold concentrations forcombinations of the two were determined.
Results presented for one subject were:1. Neither sulfur dioxide at 900 µg /m3
nor sulfuric acid mist at 600 µg /m3produced increased optical chronaxie,but the combination of these concen-trations produced a 16 percent in-crease in optical chronaxie;
2. concentrations of sulfur dioxide at1200 µg /m3 with sulfuric acid mist at400 µg /m3 produced no increase inoptical chronaxie; and
3. concentrations of either sulfur diox-ide at 1500 µg /m3 or sulfuric acid mistat 750 µg /m3 increased optical chro-naxie, and the effects of the combina-tion at these concentrations were ad-ditive. Similar results were reportedfor the other subjects.
The data obtained by Bushtueva 55 aresummarized in Table 7-1. Consideration ofthe levels noted provides information whichmay be relevant to the establishment of"Level I" and "Level II" of the World HealthOrganization's "guides to air quality."56These "guides," equivalent in usage to ourterm "criteria," covers sets of concentrationsand exposure times at which specified typesof effects are noted or at which no effect is
Table 7-1. THRESHOLD CONCENTRATIONSAND THEIR COMBINATIONS
noted. The definitions of these levels are asfollows:
Level I (Range I) Concentrationsand exposure times at or below which,according to present knowledge, neitherdirect nor indirect effects ( including al-teration of reflexes or of adaptive or pro-tective reactions) have been observed.
Level II (Range II) Concentrationsand exposure times at and above whichthere is likely to be irritation of thesensory organs, harmful effects on vege-tation, visibility reductions, or other ad-verse effects on the environment.
Level III (Range III) Concentrationsand exposure times at and above
which there is likely to be impairmentof vital physiological functions orchanges that may lead to chronic dis-eases or shortening of life.
Level IV (Range IV) Concentrationsand exposure times at and above whichthere is likely to be acute illness or deathin susceptible groups of the population.
The practical ramifications of these neuro-physiological responses have not been ex-plored. In addition, one should be cautionedin the interpretation of these data since therehave been no replicate studies to confirm thereported neuro-physiological responses andinformation concerning the experimentalconditions was less than adequate.
F. SUMMARYVarious animal species, including man,
respond to sulfur dioxide by bronchoconstric-
OF SULFUR DIOXIDE, SULFURIC ACID,FOR VARIOUS RESPONSES'
Procedure Used
Threshold Concentration
H2504 SO2 H2504 + SO2
,ug/m3 Ng/m3 pz/m3 µg /m3
Threshold Concentration of IrritationEffects and Odor Perception .. . 600-850 1600-2600 >300 500
Data Obtained by the Method of EyeAdaptation to Darkness . . . 630-730 920 >300 500
Data Obtained by the Method of......Optical Chronaxie .. . 730 1500 600 1200
Encephalographic Method 630 900 >300 500"Electrocortical" Conditioned Reflex 400 600 150 500
300 250
99

tion, which may be assessed in terms of aslight increase in airway resistance. Normalindividuals, exposed to sulfur dioxide via themouth, exhibit small changes in airway re-sistance which are often insufficient to pro-duce any respiratory symptoms. The effectsmay be even smaller when the subjectbreathes through his nose.
Laboratory observations of respiratory ir-ritations suggest that most individuals willshow a response to sulfur dioxide at concen-trations of 5 ppm (,-,14 mg/m3) and above.At concentrations of 1 ppm to 2 ppm ( .3mg/m3 to ,-..,6 mg/m3) an effect can be de-tected only in certain sensitive individuals,and on occasion, exposures to 5 ppm to 10ppm ( ,--,14 mg/m3 to ,--,30 mg/m3) have beenshown to cause severe bronchospasm in suchpersons; no further special study at lowerconcentrations has been carried out withthese individuals. The exposure of the moresensitive individuals to 1 ppm ( -3 mg/m3),although it does not produce severe broncho-spasm, does elicit a detectable response.
Sulfuric acid is a much more potent irri-tant to man than is sulfur dioxide, and itseffects are highly dependent on particle size.Insufficient data are available for quantita-tive assessment of the health hazard. Thereis inadequate information on the responseof human subjects to any of the other par-ticulate sulfates. Nasal absorption and de-sorption of oxides of sulfur, and the effectof the oxides on the removal of mucus fromthe respiratory tract are briefly considered.
In most of the studies discussed, an in-crease in pulmonary flow resistance was theindicator of response employed. However,the concentrations of oxides of sulfur justneeded to elicit certain sensory responses arepresented, although the practical ramifica-tions of these neurophysiological responseshave not been fully explored. These valuesmay ultimately have significance for the es-tablishment of Levels I and II of air qualityas promulgated by the World Health Organi-zation.
G. REFERENCES1. Heimann, H. "Effects of Air Pollution on Hu-
man Health." In: Air Pollution, World HealthOrganization Monograph Series 46, ColumbiaUniv. Press, New York, 1961, pp. 159-220.
100
2. Goldsmith, J. R. "Effects of Air Pollution onHumans." In: Air Pollution, 2nd edition, Vol.1, A. C. Stern (ed.), Academic Press, New York,1968, pp. 547-615.
3. Lawther, P. J., Martin, A E., and Wilkins, E.T. "Epidemiology of Air Pollution." WorldHealth Organization, Pub. Health Paper 15, Ge-neva, 1962.
4. Phair, J. J. "The Epidemiology of Air Pollu-tion." In: Air Pollution Handbook, P. L. Magill,F. R. Holden, and C. Ackley (eds.), McGraw-Hill, New York, 1956, pp. 7-1 to 7-14.
5. Phillips, P. H. "The Effects of Air Pollutantson Farm Animals." In: Air Pollution Hand-book, P. L. Magill, F. R. Holden, and C. Ackley(eds.), McGraw-Hill, New York,. 1956, pp. 8-1to 8-12. ---,
6. Catcott, E. J. "Effects of Air Pollution on Ani-mals." In: Air Pollution, World Health Organi-zation Monograph Series i46, Columbia Univ.Press, New York, 1961, pp. 221-231.
7. Stokinger, H. E. and Coffin, D. L. "BiologicalEffects of Air Pollutants." In: Air Pollution,Vol. 1, A. C. Stern (ed.), Academic Press, NewYork, 1968, pp. 445-546.
8. Anderson, D. 0. "The Effects of Air Contami-nation on Health, Parts I, II, and III." Cana-dian Med. Assn. J., Vol. 97, pp. 528-536, 585-593,802-806, 1967.
9. Roberts, A. "Air Pollution and Bronchitis." Am.Rev. Res. Dis., Part I, Vol. 80, pp. 582-584, Oct.1959.
10. Ascher, L. "Smoke-Nuisance in Large Towns."Eng. News, Vol. 58, pp. 434-435, Oct. 24, 1907.
11. "Smog and Disease." Lancet, Vol. 267, pp. 1163-1164, Dec. 4, 1954.
12. "The Lethal Aerosol." Lancet, Vol. 265, p. 976,Nov. 7, 1953.
13. "Our Natural Element." Lancet, Vol. 265, pp.765-766, Oct. 10, 1953.
14. Drinker, P. "Atmospheric Pollution." Ind. Eng.Chem., Vol. 31. po. 1316-1320, 1939.
15. Laidlaw, S. A. "The Effects of Smoke Pollutionon Health." J. Institute Fuel, Vol. 27, pp. 96-99,Feb. 1954.
16. Andelman, S. L. "Air Pollution, the RespiratoryTract and Public Health." Eye, Ear, Nose andThroat Monthly, Vol. 39, pp. 961-964, Dec. 1960.
17. Farber, S. M. and Wilson, R. H. L. "Air Con-tamination: A Respiratory Hazard." J. Amer.Med. Assoc., Vol. 180, pp. 362-366, May 5, 1962.
18. Goldsmith, J. R. "Effects of Air Pollution onMan." Connecticut Med., Vol. 27, pp. 455-464,Aug. 1963.
19. Barnes, J. M. "Mode of Action of Some ToxicSubstances. With Special Reference to the Ef-fects of Prolonged Exposure." Brit. Med. J., Vol.2, pp. 1097-1104, Oct. 28, 1961.
20. Nelson, H. W. and Lyons, C. J. "Sources andControl of Sulfur-Bearing Pollutants." J. AirPollution Control Assoc., Vol. 7, pp. 187-193,Nov. 1957.

21. Prindle, R. A. and Landau, E. "Health Effectsfrom Repeated Exposures to Low Concentrationsof Air Pollutants." Pub. Health Reports, Vol.77, pp. 901-908, Oct. 1962.
22. Catteral, M. "Air Pollution, the Human Prob-lem." Smokeless Air, Vol. 39, pp. 142-148, 1963.
23. Bell, A. "The Air We Breathe." Med. J. Austra-lia, Vol. 44, pp. 897-921, June 15, 1957.
24. Oswald, N. C. "Physiological Effects of Smog."Roy. Meteorol. Soc. J., Vol. 80, pp. 271-278, 1954.
25. Anderson, R. J. "Epidemiologic Studies of AirPollution." Diseases of the Chest, Vol. 42, pp.474-481, Nov. 1962.
26. Cooper, W. C. "Epidemiologic Studies on AirPollution." Amer. Med. Assoc., Arch. Ind.Health, Vol. 15, pp. 177-180, 1957.
27. Wallace, A. S. "Mortality from Asthma andBronchitis in the Auckland 'Fumes Area'." NewZealand Med. J., Vol. 56, pp. 242-249, 1957.
28. Greenwald, I. "Effects of Inhalation of Low Con-centrations of Sulfur Dioxide Upon Man andOther Mammals." Amer. Med. Assoc., Arch, Ind.Hyg. and Occup. Med., Vol. 10, pp. 455-475, Dec.1954.
29. Amdur, M. 0. "Report on Tentative Ambient AirStandards for Sulfur Dioxide and SulfuricAcid." Ann. Occup. Hyg., Vol. 3, pp. 71-83, Feb.1961.
30. Sim, V. M. and Pattle, R. E. "Effect of PossibleSmog Irritants on Human Subjects." J. Amer.Med. Assoc., Vol. 165, pp. 1908-1913, Dec. 14,1957.
31. Frank, N. R., Amdur, M. 0., Worcester, J., andWhittenberger, J. L. "Effects of Acute Con-trolled Exposure to SO, on Respiratory Mechan-ics in Healthy Male Adults." J. Appl. Physiol.,Vol. 17, pp. 252-258, March 1962.
32. Frank, N. R. "Studies on the Effects of AcuteExposure to Sulfur Dioxide in Human Subjects."Proc. Roy. Soc. Med., Vol. 57, pp. 1029-1033,1964.
33. Speizer, F. E. and Frank, N. R. "A Comparisonof Changes in Pulmonary Flow Resistance inHealthy Volunteers Acutely Exposed to SO2 byMouth and by Nose." Brit. J. Ind. Med., Vol. 23,pp. 75-79, 1966.
34. Frank, N. R., Amdur, M. 0., and Whittenberger,J. L. "A Comparison of the Acute Effects ofSO, Administered Alone or in Combination withNaCI Particles on the Respiratory Mechanics ofHealthy Adults." Int. J. Air Water Pollution,Vol. 8, pp. 125-133, 1964.
35. Amdur, M. 0. "The Effect of Aerosols on theResponse to Irritant Gases." In : Inhaled Parti-cles and Vapors. C. N. Davies (ed.), Proc. In-tern Symposium, Oxford, March 29-April 1,1960, Pergamon Press, Oxford, 1961, pp. 281-292.
36. Amdur, M. 0. "The Physiological Response ofGuinea Pigs to Atmospheric Pollutants." Intern.J. Air Pollution, Vol. 1, pp. 170-183, Jan. 1959.
37. Nadel, J. A., Tierney, D. F., and Comroe, J. H."Pulmonary Responses to Aerosols." Proc. 3rdAir Pollution Med. Res. Conference, CaliforniaState Dept. of Public Health, Los Angeles, Cali-fornia, Dec. 9, 1959, pp. 66-74.
38. Nadel, J. A., Salem, H., Tamplin, B., and Tokiwa,Y. "Mechanism of Bronchoconstriction." Arch.Environ. Health, Vol. 10, pp. 175-178, Feb. 1965.
39. Nadel, J. A., Salem, H., Tamplin, B., and Tokiwa,Y. "Mechanism of Bronchoconstriction DuringInhalation of Sulfur Dioxide." J. Appl. Physiol.,Vol. 20, pp. 164-167, 1965.
40. Tomono, Y. "Effects of SO2 on Human Pulmon-ary Functions." Japan J. Ind. Health, Vol. 3, pp.77-85, Feb. 1961.
41. Burton, G. G., Corn, M., Gee, J. B. L., Vassallo,D., and Thomas, A. "Absence of 'Synergistic Re-sponse' to Inhaled Low Concentration Gas-Aero-sol Mixtures in Healthy Adult Males." (Present-ed at 9th Annual Air Pollution Medical ResearchConference, Denver, Colorado, July 1968.)
42. Amdur, M. 0., Silverman, L., and Drinker, P."Inhalation of Sulfuric Aicd Mist by HumanSubjects." Amer. Med. Assoc. Arch. Ind. Hyg.Occup. Med., Vol. 6, pp. 306-313, Oct. 1952.
43. Lawther, P. J. "Compliance with the Clean AirAct. Medical Aspects." J. Inst. Fuel, Vol. 36, pp.341-344, Aug. 1963.
44. Frank, N. R. and Speizer, F. E. "Uptake andRelease of SO2 by the Human Nose." Physiol.,Vol. 7, p. 132, Aug. 1964.
45. Speizer, F. and Frank, N.R. "The Uptake andRelease of SO2 by the Human Nose." Arch.Environ. Health, Vol. 12, pp. 725-728, 1966.
46. Cralley, L. V. "The Effect of Irritant GasesUpon the Rate of Ciliary Activity." J. Ind. Hyg.& Toxicol., Vol. 24, pp. 193-198, 1942.
47. Ryazanov, V. A. "Sensory Physiology as BasisFor Air Quality Standards." Arch. Environ.Health, Vol. 5, pp. 479-494, Nov. 1962.
48. Dubrovskaya, F. I. "Hygienic Evaluation of Pol-lution of Atmospheric Air of a Large City withSulfur Dioxide Gas." In: Limits of Allow-able Concentrations of Atmospheric Pollutants,Book 3, Translated by B. S. Levine, U.S. Dept.of Commerce. Office of Technical Services, Wash-ington, D.C., 1957, pp. 37-51.
49. Bushtueva, K. A. "The Determination of theLimit of Allowable Concentration of SulfuricAcid in Atmospheric Air." In: Limits of Allow-able Concentrations of Atmospheric Pollutants,Book 3, Translated by B. S. Levine, U.S. Dept.of Commerce, Office of Technical Services, Wash-ington, D.C., 1957, pp. 20-36.
50. Bushtueva, K. A. "Threshold Reflex Effect ofSO, and Sulfuric Acid Aerosol SimultaneouslyPresent in the Air." In: Limits of AllowableConcentrations of Atmospheric Pollutants, Book4, Translated by B. S. Levine, U.S. Dept. ofCommerce, Office of Technical Services, Washing-ton, D.C., Jan. 1961, pp. 72-79.
101

51. Popov, I. N., Cherkasov, Ye. F., and Trakhtman,0. L. "Determination of Sulfur Dioxide OdorThreshold Concentration." Gig. i Sanit., Vol. 5,pp. 16-20, 1952. In : U.S.S.R. Literature on AirPollution and Related Occupational Diseases. ASurvey, Vol. 3, Translated by B. S. Levine, U.S.Dept. of Commerce, Office of Technical Services,Washington, D.C., May 1960, pp. 102-106.
52. "Determination of Odor Thresholds for 53 Com-mercially Important Organic Compounds." Re-port by Arthur D. Little, Inc. to the Manufactur-ing Chemists' Association, Jan. 11, 1968, 21 pp.
53. Grollman, A. (ed.) "The Functional Pathologyof Disease; The Physiologic Basis of ClinicalMedicine." 2nd edition, McGraw-Hill, New York,1963, 979 pp.
54. Bushtueva, K. A., Polezhaev, E. F., and Semen-enko, A. D. "Electroencephalographic Determina-
102
tion of Threshold Reflex Effect of AtmosphericPollutants." Gig. i Sanit., Vol. 25, pp. 54-61,1960. In: U.S.S.R. Literature on Air Pollutionand Related Occupational Diseases. A Survey,Vol. 7, Translated by B. S. Levine, U.S. Dept. ofCommerce, Office of Technical Services, Washing-ton, D.C., 1962, pp. 137-142.
55. Bushtueva, D. A. "New Studies of the Effect ofSulfur Dioxide and of Sulfuric Acid Aerosol onReflex Activity of Man." In: Limits of Allow-able Concentrations of Atmospheric Pollutants.Book 5, Translated by B. S. Levine, U.S. Dept. ofCommerce, Office of Technical Services, Washing-ton, D.C., March 1962, pp. 86-92.
56. "Atmospheric Pollutants." World Health Organ-ization, Technical Report Series 271, Geneva,1964.

Chapter 8
COMBINED EFFECTS OF EXPERIMENTAL EXPOSURES TOSULFUR OXIDES AND PARTICULATE MATTER ON MAN
AND ANIMALS

Table of ContentsPage
A. INTRODUCTION 105
B. EVALUATION BY MORTALITY AND PATHOLOGYIN ANIMALS 1051. Sulfur Dioxide, Sulfuric Acid, and Particles 1052. Sulfur Dioxide and Sulfuric Acid 106
C. EVALUATION BY PULMONARY FUNCTION IN ANIMALS 107
D. EVALUATION BY PULMONARY FUNCTION IN MAN 109
E. SUMMARY 111
F. REFERENCES 111
104

Chapter 8
COMBINED EFFECTS OF EXPERIMENTAL EXPOSURES TOSULFUR OXIDES AND PARTICULATE MATTER ON MAN AND ANIMALS
A. INTRODUCTION
The problem of interactions of irritantgases and particulate material is one ofgreatest interest in air pollution toxicology.Its implications are far broader than the pre-sent specific discussion of the effect of par-ticulate material on the response to sulfurdioxide. For a treatment of the broader as-pects of the problem, see Chapters 9 and 10in the companion document, Air Quality Cri-teria for Particulate Matter.
B. EVALUATION BY MORTALITYAND PATHOLOGY IN ANIMALS
1. Sulfur Dioxide, Sulfuric Acid, andParticles
Schnurer I exposed rabbits and rats (23hours per day for 80 days) and mice (17days) to atmospheres produced from burn-ing equal amounts of anthracite coal, of coke,and of bituminous coal. The resulting sulfurdioxide concentrations were 1.91 ppm (5.46mg/m3) for anthracite coal, 9.12 ppm (26.1mg/m3) for coke, and 7.51 ppm (21.5mg/m3) for bituminous coal. The correspond-ing particle concentrations were 312, 370,and 4,410 particles per cc. The control atmos-phere contained 125 particles per cc. Takingthe weight gain of control animals as 100 per-cent, the rats exposed to anthracite smokegained 105 percent, the rats exposed to cokesmoke gained 114 percent, and the rats ex-posed to bituminous coal smoke gained 75percent. With the rabbits these values were84 percent, 77 percent, and 9 percent respec-tively. The hemaglobin percentage and thered and white blood cell counts rose in allgroups, but this rise was less pronounced inthe rabbits exposed to anthracite smoke. The
greatest changes in the above measurements,the greatest number of uncomplicated pneu-monias, and the greatest incidence of bron-chitis were observed in the animals exposedto bituminous coal smoke. No significantpathological change could be detected in thelungs of animals exposed to coke or anthra-cite smoke 21/2 months or 14 months afterexposure. Animals exposed to bituminouscoal smoke developed evidence of fibrosis,proliferation of the bronchial epithelium, andmarked peribronchial lymphoid hyperplasia.
The exposures to anthracite coal smokeand coke smoke were essentially equivalentin terms of particle concentration, but thesmoke from the coke contained about 9 ppm( -.26 mg/m3) sulfur dioxide as opposed toabout 2 ppm ( ,-..,6 mg/m3) for the anthracitecoal smoke. Neither of these exposures pro-duced pathological alterations in the lungs.The smoke from coke and bituminous coalcontained about 9 ppm ( m.,26 mg/m3) and 8ppm (--,23 mg/m3) sulfur dioxide, but theparticle concentration of the bituminous coalsmoke was over 10 times that of the smokefrom the coke. The bituminous smoke pro-duced pathological alterations which werenot observed in animals exposed to the smokefrom the coke.. The pathological alterationsobserved in the animals exposed to bitumin-ous coal smoke may possibly be associatedwith the simultaneous presence of high levelsof sulfur dioxide and smoke. Unfortunately,however, the experiments do not allow asimple interpretation.
Susceptibility to infection by pneumococciof rats exposed to coal dust or smoke hasbeen studied.= Sulfur dioxide concentrationsin the coal smoke ranged between 0.7 ppm(2.0 mg/m3) and 1.6 ppm (4.6 mg/m3), and
105

smoke concentrations would have been con-sidered as "dense" on visual inspection(equivalent to about a No. 3 reading on theRingelmann chart). Exposures ranged from2 to 154 days, and no difference was notedbetween the control animals and exposed ani-mals in regard to mortality or susceptibilityto infection. On the other hand, the strain ofrats used normally are known to developareas in the lung which are filled with mucusor pus, and the incidence of this conditionwas 20 percent in the control animals and 40percent in animals exposed to smoke formore than 20 weeks.
Pattle and Burgess " studied the effect ofmixtures of sulfur dioxide and smoke on miceand guinea pigs. The concentrations of sulfurdioxide used were in the range of 2,700mg/m3 to 12,000 mg/m3 (940 ppm to 4,200ppm) and the smoke concentrations were inthe range of 50 mg/m3 to 135 mg/m3. Theend point was the dosage required to producedeath. With concentrations of this magnitude,the results obtained have little applicabilityto air pollution criteria. Although they found.that the lethality of mixtures of sulfur di-oxide and smoke was greater than the lethal-ity of the sulfur dioxide alone, they consid-ered the effect to be a simple additive one re-sulting from the action of smoke in blockingthe bronchi and alveoli.
Salem and Cullumbine 4 studied the effectsof kerosene smoke on the acute toxicity toguinea pigs and mice of various irritants,among them sulfur dioxide and sulfuric acid.As in the work of Pattle and Burgess,3 theconcentrations were orders of magnitudegreater than those found in polluted atmos-pheres. Sulfur dioxide concentrations werebetween 1, 200 ppm (3,400 mg/m3) and 2,700ppm, (7,700 mg/m3) while sulfuric acid con-centrations were in the range 55/4/m3 to174 p, g/m". The smoke concentrations werepresumably about 600 mg/m3, although it isnot clearly stated whether this was the con-centration used in the combinations. The endpoint was the mean fatal dose. The adminis-tration, of smoke prior to exposure to the ir-ritant substances did not alter the toxicity incontrast with a report by Pattle and Bur-gess 3 of a protective effect. The effect ofsmoke on the toxicity of the various irritants
106
was highly variable when the two agentswere given simultaneously. In guinea pigs thetoxicity of sulfur dioxide was decreased bythe smoke and in mice it was increased; thetoxicity of sulfuric acid was increased by thesmoke.
Gross et al.5 reported the typical lesions ofpneumontis in the lungs of hamsters, rats,and guinea pigs exposed to "a sufficientlylarge number of carbon particles with eitheradsorbed sulfur dioxide or nitrogen dioxide."Exposure was 8 hours per day, 5 days a week,for 4 weeks. The histological sections fromanimals killed about a month after the end ofexposure, indicated that the lesions were per-sistent. The lesions were concentrated in theregions of the respiratory bronchioles andalveolar ducts and consisted of cellular wallthickening. Data were not provided about theamount of irritant absorbed by the activatedcarbon particles, or the particle size of thecarbon, nor on the meaning of "a sufficientlylarge number of carbon particles." It wasconcluded that under certain experimentalconditions the irritant gases were capable ofrendering normally inert particles irritant,but these conditions were not defined.
2. Sulfur Dioxide and Sulfuric Acid
The effect of a combination of sulfur diox-ide and sulfuric acid on guinea pigs has beenreported.6 Only one combination of concen-trations was used, 89 ppm (255 mg/m3)sulfur dioxide and 8 mg/m3 sulfuric acid(1-11 MMD) . Eight animals were exposedto this combination for 8 hours and 2 of theseanimals were reexposed 4 days later to thesame combination. Since only one combina-tion of concentrations was used in these ex-periments, they do not provide evidence forsynergism, and the author concludes thatfurther studies are needed before the resultscan be interpreted.
Bushtueva " reported that exposure ofguinea pigs to 0.5 mg/m3 sulfuric acid pro-duced only slight lung irritation. When thesulfuric acid was combined with 0.3 ppm( -0.9 mg/m3) sulfur dioxide, considerablechanges in lung pathology were observed 2months after a 2-week exposure. Thesechanges included thickening of the inter-
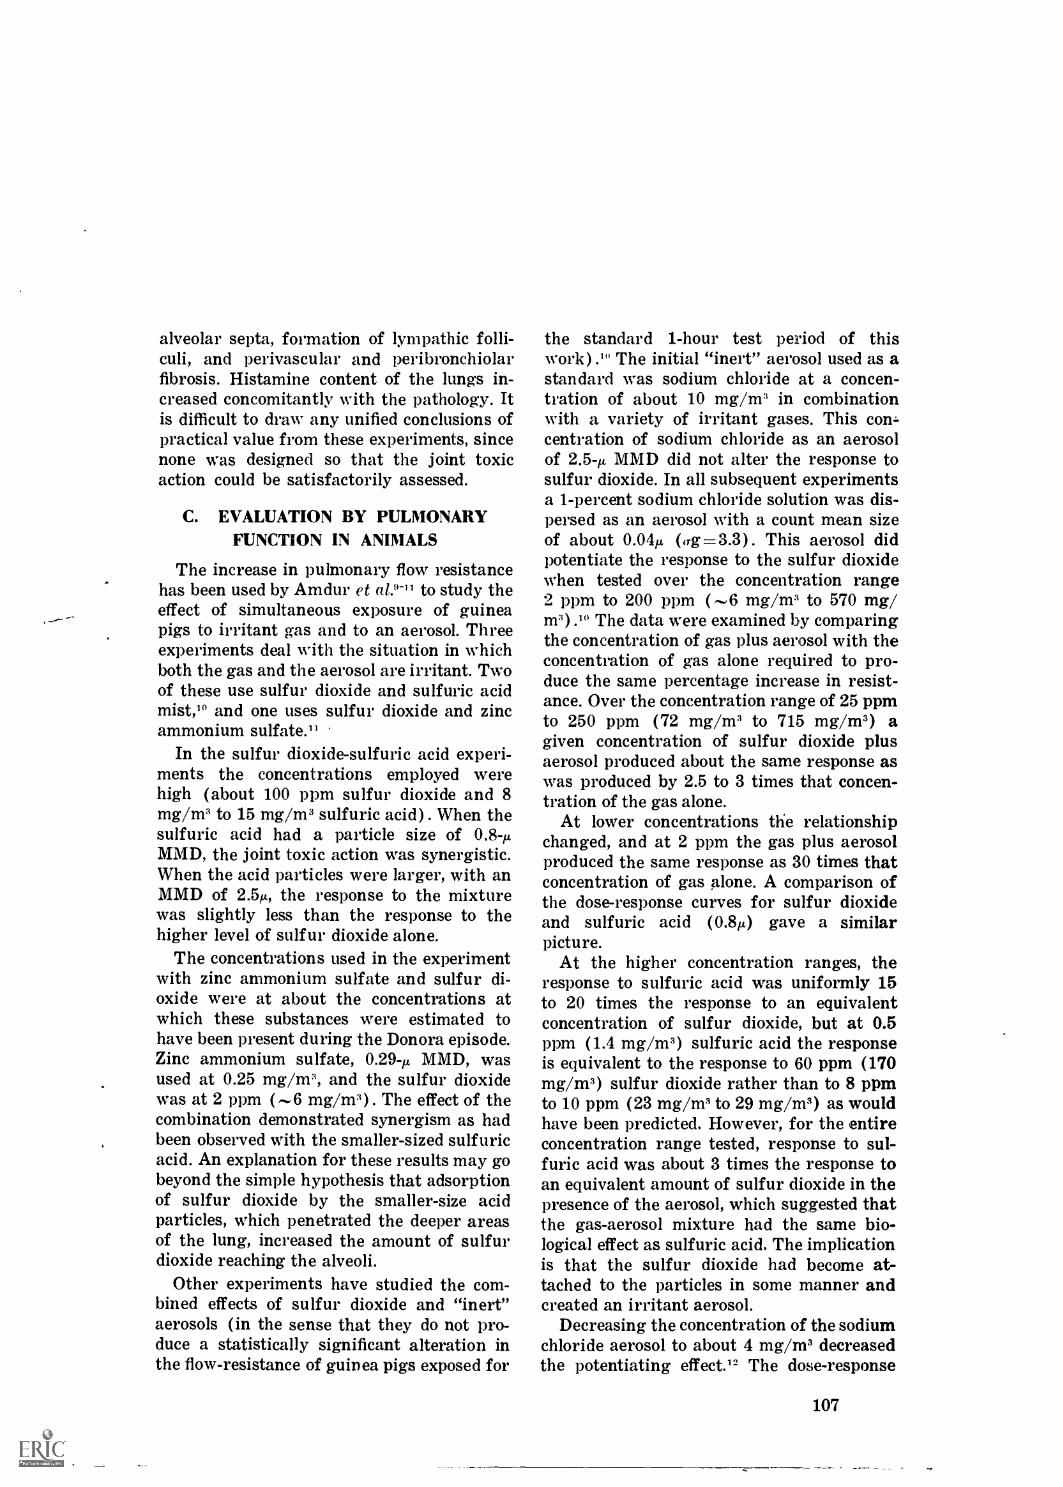
alveolar septa, formation of lympathic folli-culi, and perivascular and peribronchiolarfibrosis. Histamine content of the lungs in-creased concomitantly with the pathology. Itis difficult to draw any unified conclusions ofpractical value from these experiments, sincenone was designed so that the joint toxicaction could be satisfactorily assessed.
C. EVALUATION BY PULMONARYFUNCTION IN ANIMALS
The increase in pulmonary flow resistancehas been used by Amdur et al."-" to study theeffect of simultaneous exposure of guineapigs to irritant gas and to an aerosol. Threeexperiments deal with the situation in whichboth the gas and the aerosol are irritant. Twoof these use sulfur dioxide and sulfuric acidmist," and one uses sulfur dioxide and zincammonium sulfate."
In the sulfur dioxide-sulfuric acid experi-ments the concentrations employed werehigh (about 100 ppm sulfur dioxide and 8mg/m3 to 15 mg/m3 sulfuric acid) . When thesulfuric acid had a particle size of 0.8-p,MMD, the joint toxic action was synergistic.When the acid particles were larger, with anMMD of 2.5p., the response to the mixturewas slightly less than the response to thehigher level of sulfur dioxide alone.
The concentrations used in the experimentwith zinc ammonium sulfate and sulfur di-oxide were at about the concentrations atwhich these substances were estimated tohave been present during the Donora episode.Zinc ammonium sulfate, 0.29-p, MMD, wasused at 0.25 mg/m", and the sulfur dioxidewas at 2 ppm ( ,-- 6 mg/m3) . The effect of thecombination demonstrated synergism as hadbeen observed with the smaller-sized sulfuricacid. An explanation for these results may gobeyond the simple hypothesis that adsorptionof sulfur dioxide by the smaller-size acidparticles, which penetrated the deeper areasof the lung, increased the amount of sulfurdioxide reaching the alveoli.
Other experiments have studied the com-bined effects of sulfur dioxide and "inert"aerosols (in the sense that they do not pro-duce a statistically significant alteration inthe flow-resistance of guinea pigs exposed for
the standard 1-hour test period of thiswork) .1" The initial "inert" aerosol used as astandard was sodium chloride at a concen-tration of about 10 mg/m" in combinationwith a variety of irritant gases. This con,centration of sodium chloride as an aerosolof 2.5-p, MMD did not alter the response tosulfur dioxide. In all subsequent experimentsa 1-percent sodium chloride solution was dis-persed as an aerosol with a count mean sizeof about 0.04p, (ag= 3.3) . This aerosol didpotentiate the response to the sulfur dioxidewhen tested over the concentration range2 ppm to 200 ppm ( ,--,6 mg/m" to 570 mg/m3) .1" The data were examined by comparingthe concentration of gas plus aerosol with theconcentration of gas alone required to pro-duce the same percentage increase in resist-ance. Over the concentration range of 25 ppmto 250 ppm (72 mg/m3 to 715 mg/m3) agiven concentration of sulfur dioxide plusaerosol produced about the same response aswas produced by 2.5 to 3 times that concen-tration of the gas alone.
At lower concentrations the relationshipchanged, and at 2 ppm the gas plus aerosolproduced the same response as 30 times thatconcentration of gas alone. A comparison ofthe dose-response curves for sulfur dioxideand sulfuric acid (0.8p.) gave a similarpicture.
At the higher concentration ranges, theresponse to sulfuric acid was uniformly 15to 20 times the response to an equivalentconcentration of sulfur dioxide, but at 0.5ppm (1.4 mg/m3) sulfuric acid the responseis equivalent to the response to 60 ppm (170mg/m3) sulfur dioxide rather than to 8 ppmto 10 ppm (23 mg/m3 to 29 mg/m3) as wouldhave been predicted. However, for the entireconcentration range tested, response to sul-furic acid was about 3 times the response toan equivalent amount of sulfur dioxide in thepresence of the aerosol, which suggested thatthe gas-aerosol mixture had the same bio-logical effect as sulfuric acid. The implicationis that the sulfur dioxide had become at-tached to the particles in some manner andcreated an irritant aerosol.
Decreasing the concentration of the sodiumchloride aerosol to about 4 mg/m3 decreasedthe potentiating effect.12 The dose-response
107

curve is parallel to that obtained with thehigher concentration, but only 1 point, thatat 20 ppm (57 mg/m3) , is greater than thecorresponding point for sulfur dioxide alone.This decrease in potentiating effect withdecreased aerosol concentration again sug-gested that the response was mediatedthrough the formation of an irritant aerosol.It also suggested that the irritant aerosolformed by sodium chloride with sulfur di-oxide was not a very potent irritant, since theeffects had essentially vanished at an aerosollevel of 4 mg/m3.
Another factor suggesting the formationof an irritant aerosol comes from examina-tion of the postexposure data. After expo-sures to gas-aerosol combinations were ter-minated, the resistance values remainedabove control values rather than returning tothe preexposure level within an hour as hadoccurred after exposure to these levels of ir-ritant gas alone." As was pointed out at theend of Section D of Chapter 6, the return tocontrol values was much slower when theirritant had been particulate matter thanwhen it had been gaseous. The response to113 ppm (323 mg/m") sulfur dioxide aloneand to 26 ppm (74 mg/m3) sulfur dioxideplus 10 mg/m3 of NaC1 aerosol was similarduring the 1-hour exposure period. The ani-mals exposed to the higher level of sulfurdioxide alone had shown a complete returnto preexposure resistance values by 45 min-utes after the exposure ended. Those exposedto the lower concentration plus aerosol stillshowed elevated resistance values 2 hoursafter the end of the exposure.
There is also evidence that the level ofelevated resistance during the postexposureperiod is related to the concentration of theparticulate material present. First of all, thetime course of the response to various sulfurdioxide concentrations in the presence of afixed sodium chloride aerosol concentration(10 mg/m") was examined. At the end of theexposure period the resistance values werehigher at higher sulfur dioxide concentra-tions. One hour after the exposure ended theywere all above control values but were all ofthe same order of magnitude, regardless ofsulfur dioxide concentration. Two hours afterthe end of the exposure, the resistance values
108
of the animals exposed to sulfur dioxide con-centrations of 25 ppm (72 mg/m3) or abovehad increased slightly. The animals exposedto 2 ppm (,--,6 mg/m3) had returned to pre-exposure levels by 2 hours after the end ofexposure.
Next, the total amount of aerosol. was re-duced in 2 ways: by reducing the concentra-tion to 4 mg/m3 for 1 hour, and by exposinganimals for only half an hour to 10 mg/m3.9The sulfur dioxide concentration was fixedat about 20 ppm ( -.60 mg/m3). The resultswere entirely consistent with the hypothesisthat there was a residual effect from an ir-ritant aerosol which had been formed. An in-crease in resistance was observed betweenthe first and second postexposure hours whenthe exposure had been for half an hour, andthe resistance continued at about this levelfor the 5-hour postexposure observationperiod.
It has also been found that the potentiationof the response to sulfur dioxide by aerosolsof sodium chloride is slow to develop.912When the responses to gas alone, and to gasplus aerosol, are compared at 10 minutesthere is no apparent difference. In this aspectthe response is different from that producedby formaldehyde with sodium chloride 12 orthat produced by aerosols of soluble metalsalts known to catalyze the oxidation of sul-fur dioxide to sulfuric acid.9
The solubility of sulfur dioxide in a liquiddroplet appears to play some role in its po-tentiation by inert aerosols. This has beensuggested 9 by the way in which the potenti-ating ability of aerosols of soduim chloride,potassium chloride, and ammonium thiocyan-ate is related to the solubility of sulfur di-oxide in solutions of these salts. At the humi-dities prevailing in the exposure chamber,these substances would have been present assolid particles which, upon entering the moistrespiratory tract, would take up water andbecome droplets.
Most solid aerosols tested 1 have not poten-tiated the response to sulfur dioxide, whichsuggests a role of solubility in potentiation.Thus, spectrographic carbon, activated coco-nut charcoal, iron oxide fume, triphenylphos-phate, fly ash, and manganese dioxide atlevels of 8 mg/m3 or above, produced no de-

tectable effect on the resistance nor did theyPotentiate the response to levels of sulfur di-oxide ranging between 1 ppm and 100 ppm(3 ,--,mg/m3 and 290 mg/m"). In several ofthe 19 groups of animals exposed to sulfurdioxide plus solid aerosols, the response wasapparently less than that observed with a cor-responding concentration of sulfur dioxidealone. The attenuations were not statisticallysignificant for either group of animals ex-posed to what was termed only "fly ash froman oil-fired burner," one exposure beingabout 10 ppm ( -30 mg/m") and anotherbeing a.. about 20 ppm ( --60 mg/m") sulfurdioxide. When the response data from thetwo individual experiments were comparedwith those from response to 20 ppm sulfurdioxide alone, the attenuating effect was sta-tistically significant. It is also mentioned thatwhile triphenylphosphate aerosols of 0.3p, or1p, failed to alter the response to sulfur diox-ide even when present in concentrations o450 mg/m", aerosols of 2,u, had a striking at-tenuating effect when given with sulfur di-oxide, and they also protected against the gaswhen given prior to exposure to sulfurdioxide.
The aerosols which appeared to have im-portance in the potentiation of sulfur dioxidewere the aerosols of soluble salts which mightcatalyze the oxidation to sulfuric acid." Aero-sols of ferrous iron, manganese, or vanadium,when used at concentrations of 0.7 mg/m"to 1 mg/m" produced a potentiation of theresponse. A sulfur dioxide concentration of0.2 ppm ( -0.6 mg/m") produced a resistanceincrease of about 10 percent when givenalone and an increase of about 35 percentwhen given in the presence of these aerosols.The potentiation was already observable at10 minutes. It could be demonstrated by qual-itative tests for sulfate that there was sulfatePresent on the aerosol collected from thechamber, which was not the case with sodiumchloride aerosols.
These experiments suggest that the natureof the particulate material, as well as its sizerange are key factors. The aerosols of im-portance are those capable of dissolving sul-fur dioxide and possibly of oxidizing it tosulfuric acid mist.
D. EVALUATION BY PULMONARYFUNCTION IN MAN
Frank et al." examined the response ofhuman subjects to levels of sulfur diox-ide of about 1 ppm ( ,,,3 mg/m3) , 5 ppm( ,15 mg/m3) , and 15 ppm ( ,--43 mg/m3) ,
with and without the addition of sodiumchloride aerosol. In the initial experiments,the agents were administered for 10-minuteperiods in sequence with a 15 to 20 minuterecovery period between exposures. In a sec-ond series, the gas and gas plus aerosol ex-posures of each subject were made at leasta month apart and were extended to 30 min-utes. In the experiments in which the gas andthe gas plus aerosol were given in sequence,the response to the second exposure was con-sistently lower than the response to the firstexposure, no matter in which order the gasalone and gas plus aerosol were given. In thesecond series, when the exposures were amonth or more apart, no difference was de-tected between. the response to the gas aloneand the response to the gas plus aerosol.
When the data for the control values andthe resistance response for the same indi-vidual to the same level of sulfur dioxide ondifferent occasions are examined, it is seenthat a very dramatic potentiation would havebeen needed to yield positive results in thisstudy. On one subject studied on seven oc-casions, the control resistance values rangedfrom 0.65 to 1.48 cm 11.0/1-sec, a differenceof about 128 percent. The alterations pro-duced by exposure on 3 different occasions to15 ppm sulfur dioxide were 86 percent, 58percent, and 156 percent increases in resist-ance. Two exposures to 15 ppm sulfur diox-ide plus aerosol produced on one occasion anincrease of 220 percent and on the other oc-casion an increase of 42 percent. The subjectwho showed the most extreme variation onthree occasions had control resistance of 1.13cm, and 1.46 cm 1100/1-sec and correspondingresistance increases were 130 percent, 93percent, and 410 percent during exposures to15 ppm sulfur dioxide alone. The differencesin response on the various occasions were notrelated to absolute level of control resistance,to functional residual capacity, to time ofyear, or to the previous total number of ex-
109
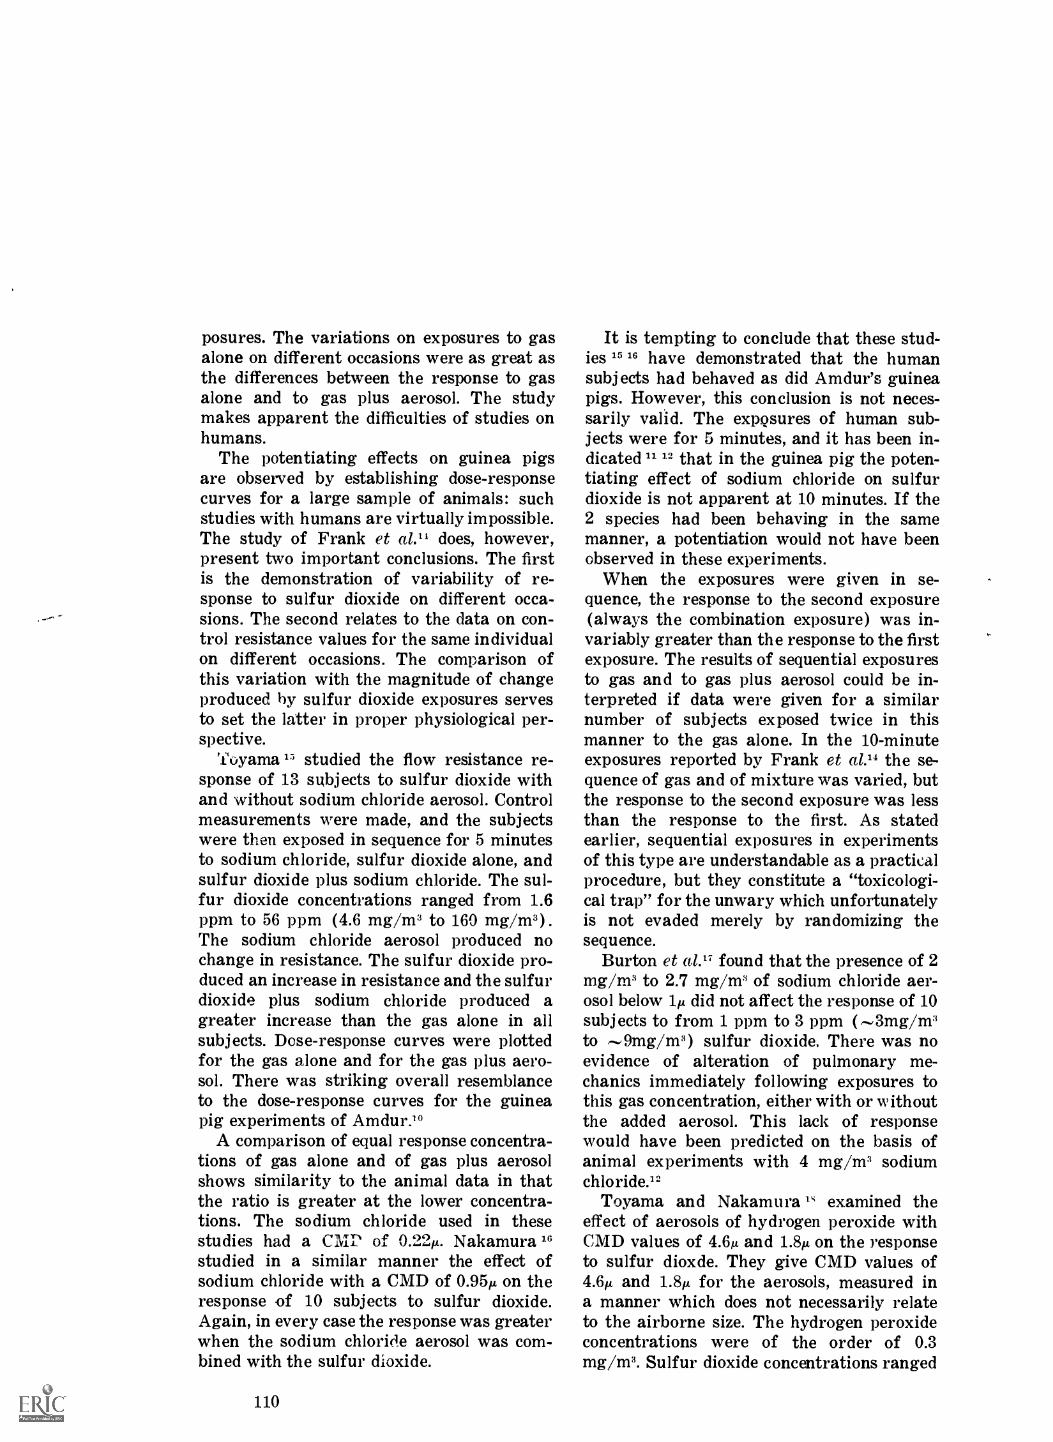
posures. The variations on exposures to gasalone on different occasions were as great asthe differences between the response to gasalone and to gas plus aerosol. The studymakes apparent the difficulties of studies onhumans.
The potentiating effects on guinea pigsare observed by establishing dose-responsecurves for a large sample of animals: suchstudies with humans are virtually impossible.The study of Frank et al." does, however,Present two important conclusions. The firstis the demonstration of variability of re-sponse to sulfur dioxide on different occa-sions. The second relates to the data on con-trol resistance values for the same individualon different occasions. The comparison ofthis variation with the magnitude of changeproduced by sulfur dioxide exposures servesto set the latter in proper physiological per-spective.
Toyama 15 studied the flow resistance re-sponse of 13 subjects to sulfur dioxide withand without sodium chloride aerosol. Controlmeasurements were made, and the subjectswere then exposed in sequence for 5 minutesto sodium chloride, sulfur dioxide alone, andsulfur dioxide plus sodium chloride. The sul-fur dioxide concentrations ranged from 1.6ppm to 56 ppm (4.6 mg/m3 to 160 mg/m3) .
The sodium chloride aerosol produced nochange in resistance. The sulfur dioxide pro-duced an increase in resistance and the sulfurdioxide plus sodium chloride produced agreater increase than the gas alone in allsubjects. Dose-response curves were plottedfor the gas alone and for the gas plus aero-sol. There was striking overall resemblanceto the dose-response curves for the guineapig experiments of Amdur."
A comparison of equal response concentra-tions of gas alone and of gas plus aerosolshows similarity to the animal data in thatthe ratio is greater at the lower concentra-tions. The sodium chloride used in thesestudies had a CAIP. of 0.22p. Nakamura 16studied in a similar manner the effect ofsodium chloride with a CMD of 0.95p, on theresponse of 10 subjects to sulfur dioxide.Again, in every case the response was greaterwhen the sodium chloride aerosol was com-bined with the sulfur dioxide.
110
It is tempting to conclude that these stud-ies 15 16 have demonstrated that the humansubjects had behaved as did Amdur's guineapigs. However, this conclusion is not neces-sarily valid. The exposures of human sub-jects were for 5 minutes, and it has been in-dicated 11 12 that in the guinea pig the poten-tiating effect of sodium chloride on sulfurdioxide is not apparent at 10 minutes. If the2 species had been behaving in the samemanner, a potentiation would not have beenobserved in these experiments.
When the exposures were given in se-quence, the response to the second exposure(always the combination exposure) was in-variably greater than the response to the firstexposure. The results of sequential exposuresto gas and to gas plus aerosol could be in-terpreted if data were given for a similarnumber of subjects exposed twice in thismanner to the gas alone. In the 10-minuteexposures reported by Frank et al.14 the se-quence of gas and of mixture was varied, butthe response to the second exposure was lessthan the response to the first. As statedearlier, sequential exposures in experimentsof this type are understandable as a practicalProcedure, but they constitute a "toxicologi-cal trap" for the unwary which unfortunatelyis not evaded merely by randomizing thesequence.
Burton et al.17 found that the presence of 2mg/m3 to 2.7 mg /m3 of sodium chloride aer-osol below 1µ did not affect the response of 10subjects to from 1 ppm to 3 ppm ( -,3mg/m"to --,9mg/m3) sulfur dioxide. There was noevidence of alteration of pulmonary me-chanics immediately following exposures tothis gas concentration, either with or withoutthe added aerosol. This lack of responsewould have been predicted on the basis ofanimal experiments with 4 mg/m3 sodiumchloride.'2
Toyama and Nakamura l' examined theeffect of aerosols of hydrogen peroxide withCMD values of 4.6a and 1.8p on the responseto sulfur dioxde. They give CMD values of4.6p. and 1.8p for the aerosols, measured ina manner which does not necessarily relateto the airborne size. The hydrogen peroxideconcentrations were of the order of 0.3mg/m3. Sulfur dioxide concentrations ranged
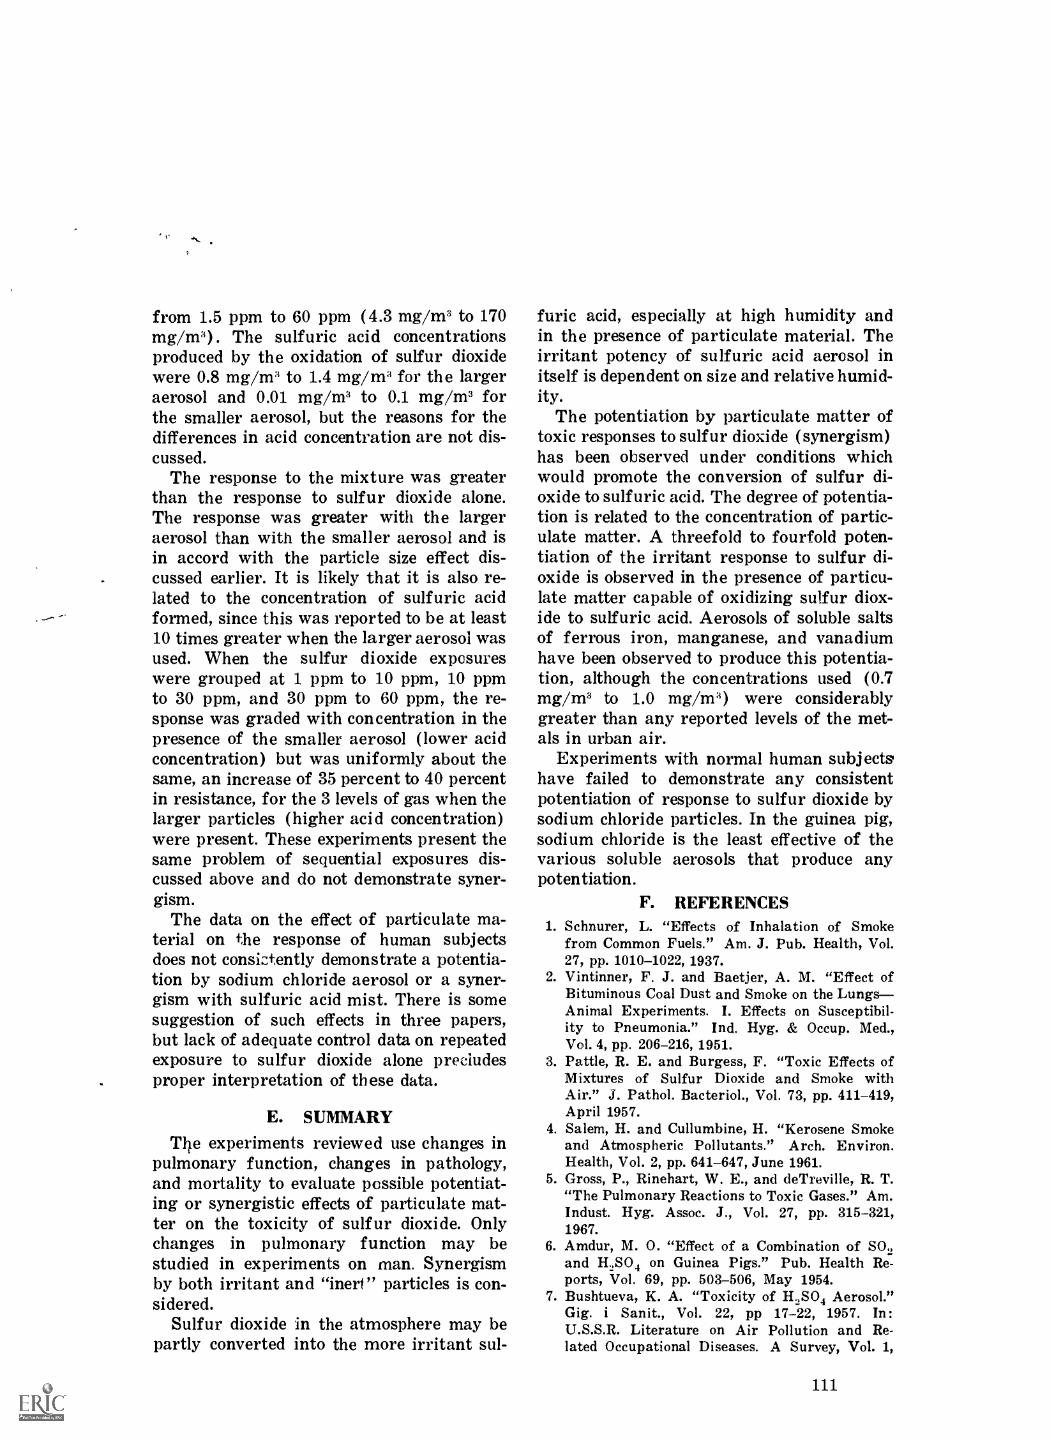
.,
from 1.5 ppm to 60 ppm (4.3 mg/m3 to 170mg/m"). The sulfuric acid concentrationsproduced by the oxidation of sulfur dioxidewere 0.8 mg/m3 to 1.4 mg/m3 for the largeraerosol and 0.01 mg/m3 to 0.1 mg /m3 forthe smaller aerosol, but the reasons for thedifferences in acid concentration are not dis-cussed.
The response to the mixture was greaterthan the response to sulfur dioxide alone.The response was greater with the largeraerosol than with the smaller aerosol and isin accord with the particle size effect dis-cussed earlier. It is likely that it is also re-lated to the concentration of sulfuric acidformed, since this was reported to be at least10 times greater when the larger aerosol wasused. When the sulfur dioxide exposureswere grouped at 1 ppm to 10 ppm, 10 ppmto 30 ppm, and 30 ppm to 60 ppm, the re-sponse was graded with concentration in thepresence of the smaller aerosol (lower acidconcentration) but was uniformly about thesame, an increase of 35 percent to 40 percentin resistance, for the 3 levels of gas when thelarger particles (higher acid concentration)were present. These experiments present thesame problem of sequential exposures dis-cussed above and do not demonstrate syner-gism.
The data on the effect of particulate ma-terial on the response of human subjectsdoes not consiztently demonstrate a potentia-tion by sodium chloride aerosol or a syner-gism with sulfuric acid mist. There is somesuggestion of such effects in three papers,but lack of adequate control data on repeatedexposure to sulfur dioxide alone precludesproper interpretation of these data.
E. SUMMARY
The experiments reviewed use changes inpulmonary function, changes in pathology,and mortality to evaluate possible potentiat-ing or synergistic effects of particulate mat-ter on the toxicity of sulfur dioxide. Onlychanges in pulmonary function may bestudied in experiments on man. Synergismby both irritant and "inert" particles is con-sidered.
Sulfur dioxide in the atmosphere may bepartly converted into the more irritant sul-
furic acid, especially at high humidity andin the presence of particulate material. Theirritant potency of sulfuric acid aerosol initself is dependent on size and relative humid-ity.
The potentiation by particulate matter oftoxic responses to sulfur dioxide (synergism)has been observed under conditions whichwould promote the conversion of sulfur di-oxide to sulfuric acid. The degree of potentia-tion is related to the concentration of partic-ulate matter. A threefold to fourfold poten-tiation of the irritant response to sulfur di-oxide is observed in the presence of particu-late matter capable of oxidizing sulfur diox-ide to sulfuric acid. Aerosols of soluble saltsof ferrous iron, manganese, and vanadiumhave been observed to produce this potentia-tion, although the concentrations used (0.7mg/m3 to 1.0 mg/m") were considerablygreater than any reported levels of the met-als in urban air.
Experiments with normal human subjectshave failed to demonstrate any consistentpotentiation of response to sulfur dioxide bysodium chloride particles. In the guinea pig,sodium chloride is the least effective of thevarious soluble aerosols that produce anypotentiation.
F. REFERENCES1. Schnurer, L. "Effects of Inhalation of Smoke
from Common Fuels." Am. J. Pub. Health, Vol.27, pp. 1010-1022,1937.
2. Vintinner, F. J. and Baetjer, A. M. "Effect ofBituminous Coal Dust and Smoke on the LungsAnimal Experiments. I. Effects on Susceptibil-ity to Pneumonia." Ind. Hyg. & Occup. Med.,Vol. 4, pp. 206-216,1951.
3. Pattle, R. E. and Burgess, F. "Toxic Effects ofMixtures of Sulfur Dioxide and Smoke withAir." J. Pathol. Bacteriol., Vol. 73, pp. 411-419,April 1957.
4. Salem, H. and Cullumbine, H. "Kerosene Smokeand Atmospheric Pollutants." Arch. Environ.Health, Vol. 2, pp. 641-647, June 1961.
5. Gross, P., Rinehart, W. E., and deTreville, R. T."The Pulmonary Reactions to Toxic Gases." Am.Indust. Hyg. Assoc. J., Vol. 27, pp. 315-321,1967.
6. Amdur, M. 0. "Effect of a Combination of SO2and 112504 on Guinea Pigs." Pub. Health Re-ports, Vol. 69, pp. 503-506, May 1954.
7. Bushtueva, K. A. "Toxicity of H2504 Aerosol."Gig. i Sanit., Vol. 22, pp 17-22, 1957. In:U.S.S.R. Literature on Air Pollution and Re-lated Occupational Diseases. A Survey, Vol. 1,
111

Translated by B. S. Levine, U.S. Dept. ofCommerce, Office of Technical Services, Wash-ington, D.C., Jan. 1960, pp. 63-66.
8. Bushtueva, K. A. "Experimental Studies on theEffect of Low Oxides of Sulfur Concentrationson the Animal Organism." In : Limits of Al-lowable Concentrations of Atmospheric Pollut-ants, Book 5, Translated by B. S. Levine, U.S.Dept. of Commerce, Office of Technical Ser-vices, Washington, D.C., March 1962, pp. 92-102.
9. Amdur, M. 0. and Underhill, D. "The Effect ofVarious Aerosols on the Response of Guinea Pigsto Sulfur Dioxide." Arch. Environ. Health, Vol.16, pp. 460-468, 1968.
10. Amdur, M. 0. "The influence of Aerosols Uponthe Respiratory Response of Guinea Pigs toSulfur Dioxide." Am. Ind. Hyg. Assoc. Quart.,Vol. 18, pp. 149-155, June 1957.
11. Amdur, M. 0. and Corn, M. "The Irritant Po-tency of Zinc Ammonium Sulfate of DifferentParticle Sizes." Am. Ind. Hyg. Assoc. J., Vol. 24,pp. 326-333, July-Aug. 1963.
12. Amdur, M. 0. "The Effect of Aerosols on theResponse to Irritant Gases." In: Inhaled Par-ticles and Vapors, C. N. Davies (ed.), Proc. In-tern. Symposium, Oxford, March 29-April 1,1960, Pergamon Press, Oxford, 1961, pp. 281-292.
112
13. Amdur, M. 0. "The Physiological Response ofGuinea Pigs to Atmospheric Pollutants." Intern.J. Air Pollution, Vol. 1, pp. 170-183, Jan. 1959.
14. Frank, N. R., Amdur, M. 0., and Wittenberger,J. L. "A Comparison of the Acute Effects ofSO2 Administered Alone or in Combination withNaC1 Particles on the Respiratory Mechanics ofHealthy Adults." Intern. J. Air Water Pollu-tion, Vol. 8, pp. 125-133, 1964.
15. Toyama, T. "Studies on Aerosol. I. SynergisticResponse of the Pulmonary Airway Resistanceon Inhaling Sodium Chloride Aerosols and SO2in Man." Japan J. Ind. Health, Vol. 4, pp. 86-92,1962.
16. Nakamura, K. "Response of Pulmonary AirwayResistance by Interaction of Aerosols and Gasesof Different Physical and Chemical Nature."Japan J. Hyg., Vol. 19, pp. 322-333, Dec. 1964.
17. Burton, G. G., Corn, M., Gee, J. B. L., Vassallo,C., and Thomas, A. "Absence of 'Synergistic Re-sponse' to Inhaled Low Concentration Gas-Aero-sol Mixtures in Healthy Adult Males." (Pre-sented at 9th Annual Air Pollution Medical Re-Search Conference.) Arch. Environ. Health, Vol.18, pp. 681-692, 1969.
18. Toyama, T. and Nakamura, K. "Synergistic Re-sponse of Hydrogen Peroxide Aerosols and Sul-fur Dioxide to Pulmonary Airway Resistance."Ind. Health, Vol. 2, pp. 34-45, March 1964.

Chapter 9
EPIDEMIOLOGICAL APPRAISAL OF SULFUR OXIDES

Table of Contents
Page
A. INTRODUCTION 117
B. APPLICATION OF EPIDEMIOLOGY TO AIR POLLUTIONSTUDIES . . ..... .. .. . . .... ...... . ... . 117
1. Indices 117
2. Cautions 118
C. INDICES OF HUMAN RESPONSE: THE EPIDEMIOLOGICSTUDIES 119
1. Acute Episodes . 119
a. Mortality . . , , , , .......... , .... 119
b. Morbidity 125
2. Chronic (Long-Term) Air Pollution 126
a. Day-to-Day Variations in Mortality and Morbidity 126
b. Geographical Variations in Mortality 127
1. Studies Based on Available Data . 127
2. Special Studies Involving the Collection of New Data . .... ....... 128
c. Geographical Variations in MorbiditySpecial Studies 130
d. MorbidityIncapacity for Work . .... .. .... .. ... ....... 135
3. Studies of Children . .. .. .. . . ...... . ...... .. .. 137
4. Studies of Pulmonary Function 139
5. Studies of Panels of Bronchitic Patients , , .... .. . ..... .... 140
6. Miscellaneous Studies 142
D. EFFECTS OF INDUSTRIAL EXPOSURE 142
E. SUMMARY .. . 444
F. REFERENCES . 147
List of FiguresFigure9-1 Mortality Figures for the January 1956 and December 1957 Smog
"Episodes" in London. 1219-2 Death Rate and Air Pollution Levels in Dublin, Ireland, for 1938-
1949. 1249-3 Age-Standardized Morbidity Rate per 1,000 for Three Diseases in
Japan. 1329-4 Incidence of Respiratory Disease Lasting More Than Seven Days in
Women Versus Concentration of Sulfates in the City Air at TestSites. 135
114

Page9-5 Effect on Bronchitic Patients of High Pollution Levels (January
1954) 140
9-6 Comparison of Person-Days of Acute Illness with Seven Levels ofSulfur Dioxide Exposure in Chicago for Patients With SevereChronic Bronchitis (Age 55 or More) for October-November 1967. 141
List of TablesTable
9-1 Survey of Selected Acute Air Pollution Episodes in Greater London. 125
9-2 Pollution Levels in Salford 1299-3 Industrial Exposures. 144
g
ti
115

Chapter 9
EPIDEMIOLOGICAL APPRAISAL OF SULFUR OXIDES
A. INTRODUCTION
Health effects produced by atmosphericsulfur oxides are discussed in this chapter interms of epidemiologic studies. Because sul-fur oxides tend to occur in the same kinds ofpolluted atmosphere as particulate matter,few epidemiologic studies have been ableadequately to differentiate the effects of thetwo pollutants. It follows, therefore, that thestudies presented in this chapter are fre-quently identical with those described in thecompanion document, Air Quality Criteriafor Particulate Matter.
Epidemiologic studies, as distinguishedfrom toxicologic or experimental studies,aAlalyze the effects of pollution from ambientexposure on groups of people living in acommunity. Such studies have the advantageof examining illness where it occurs natur-ally, rather than in a laboratory, but carrythe disadvantage of not being able to controlPrecisely all the factors of possible im-portance. Nevertheless, the preparation ofair quality criteria must rest on epidemio-logic studies because of the very severe limi-tations of toxicologic and industrial studiesfor this purpose. Other countries, notablythe Netherlands and Sweden, have basedtheir air quality criteria solely on epidemio-logic studies.
In deVermining w: tether or not an asso-ciation is causal, consideration must be givento several aspects of association which in-
:clude str:ngth, consiftency, specificity, tem-porality, 't)iological gradient, plausibility, co-herence, nd analogy.' A judgment of thevalue of sin epidemiologic study requires anunderst.vi ding of these aspects.
Many 16::;-ies of epidemiologic evidence sug-gest that' pollution may exert consider-able infitietce on the health, as well as on
the "satisfaction with life," of major seg-ments of the world population.
Several health indices are described in Sec-tion B-1; certain precautions which shouldbe observed in the application of epidemio-logic methods to air quality criteria are sug-gested in Section B-2. The studies them-selves are listed in Section C, according tothe index employed. Several industrial ex-posures to the oxides of sulfur are mentionedin Section D. discussing their relevance tothe epidemiologic studies.
B. APPLICATION OF EPIDEMIOLOGYTO AIR POLLUTION STUDIES
1. Indices
Various indices of health may be used forcorrelation with air pollution by the oxidesof sulfur. Among the possible indices are:
1. Mortality (greater than expected) :(i) Deaths from all causes(ii) Deaths from specific causes(iii) Deaths among the different age
and sex groups
2. Morbidity:(i) Incidence of disease chronic
bronchitis, TAmonary emphy-se4a, diffuse interstitial pneu-monitis, caner of respiratorytract, disease of remote organ
gastro-intestinal, ophthal-mic, and cardiovascular sys-tems)
(ii) Prevalence of diseasessameexamples as for "incidence"
(iii) Prevalence of-respiratory symp-toms (e.g., changes in qualityand/or quantity of sputum pro-duction)
117

(iv \ Exacerbation of diseasesrhi-norrhea, asthma, tracheobron-chitis, and chronic illness andenhancement of infection: pneu-monia, sinusitis, otitis, mas-toiditis
(v) Changes in clinical conditions(e.g., bronchitic patients)
3. Changes in various aspects of lungfunction:(i) Ventilatory functiondecrease
in peak flow rate, decrease inspirometric volumes, impair-ment of flow-volume relation-ships, and increased airways re-sistance
(ii) Blood/gas distributionimpair-ment of lung-gas distribution
(iii) Blood/gas exchange impair-ment of pulmonary blood-gas ex-change
(is) ) Increased work of breathingDefinitions of the various disease states
are to be found in the glossary; most of thepulmonary function methods have been men-tioned in Chapters 9 and 10 of the compan-ion document, Air Quality Criteria for Par-ticulate Matter.
The manner of presentation of the stateof epidemiological knowledge of effects ofsulfur dioxide in the ambient atmospherewhen accompanied by particulate matter isoutlined in the Table of Contents.
2. Cautions
In the first place, as discussed in Chapter2, methods of measurement vary from coun-try to country and place to place. Resultsfrom the various methods of measurementare frequently very dissimilar.
Secondly, pollution and health indices arenot always measured over the same time pe-riods. It is to be hoped that the pollution lev-els cited bear some relation to those extantduring the time when the chronic diseasestates were developing. Further, acute ef-fects require frequent short-term pollutionmeasurements to enhance detection, whilelong-term chronic processes may be ade-quately related to long-term sampling inter-vals. Air pollution measurements useful in
118
studies of acute health effects are becomingavailable; a less satisfactory situation existsfor the long-term effects studied.
Thirdly, in many instances the possiblerole of cigarette smoking has not been con-sidered. It is expected that future epidemio-logic studies involving adults will routinelycollect data on smoking habits of the studygroup. Other factors are significantly relatedto respiratory disease. These include occu-pational and other past exposures; infections,past and present; and allergy and heredity.
Few or no epidemiologic studies have beenPossible where the pollution challenge hasbeen limited to oxides of sulfur, unaccom-panied by significant amounts of other pol-lutant substances. Indeed, most of the avail-able conclusions link sulfur dioxide levelswith those of concurrently measured particu-late matter; some studies attempt statisticalseparation of the culpability of one factorfrom the other in the effects cited.
In seeking the possible effects on popula-tions resident in areas of differing air pol-lution, factors such as smoking, type andconditions of employment, ethnic group, andmobility in response to experienced irrita-tion or disease have sometimes been consid-ered. There has, however, been a minimumof attention paid to the indoor or domesticenvironments and their potential contribu-tion. Measurement of such indoor exposuresmight be difficult, but omission of the infor-mation could well modify the appraisal ofthe importance of pollution by the oxides ofsulfur.
Toxicologic studies indicate a specific po-tential of some oxides of sulfur to producehuman responses. The levels used in tox-icologic studies are far higher than thosefound in the communities in the epidemio-logic studies under review. Thus the actualresponsibility of oxides of sulfur for the com-munity responses is uncertain, and it is some-times necessary to invoke additional con-cepts; for example, the idea of synergismwith other known or unknown ambient pol-lutants, or the idea that sulfur dioxide is butan index of availability of some other sub-stance (s) which are fully responsible for theeffects reported.
Over a short period of time, mortality flue-

tuates considerably, and only a systematic,long-term approach will allow a valid deter-mination of the real role of air pollution.Cassell et al.2 have reviewed the problem ofdetecting peaks in mortality and relatingthem to any single variable. The danger withepisodic studies is that short-term fluctua-tion in the death rate, when picked to coin-cide with an air pollution incident, may ap-pear to be causally related; in the long term,however, numerous other unassociated peaksare found in both the death rates and the airPollution levels.
The concept of "susceptible population"demands consideration. Human responses totoxicants, and to community air pollution,show wide variations, which contribute in nosmall way to the difficulty in assessing in ageneral manner the effects of pollutants.Since air quality criteria must, unless other-Wise specified, consider "all" populationrather than just major segments of it, stud-ies must consider especially the impact ofair pollution on the "most sensitive" respond-ers. Many factors seem to enhance suscepti-bility or sensitivity to air pollution. These in-clude being at the extremes of age, (i.e., in-fants and the very old) ; having pre-existingchronic respiratory disease (e.g., pulmonaryemphysema or chronic bronchitis) ; havingpreexisting cardiovascular disease (func-tional capacity not defined); regularly smok-ing cigarettes; or living in overcrowded ordepressed socioeconomic strata. Some ofthese factors have been singled out for atten-tion in the references to be cited, and thelevel of poll& ant said to have an "effect"may take cognizance of such special sensi-tivity.
The effects discussed are related insofaras possible to specific pollution over specifictime intervals; it must be emphasized thatlower values by no means imply a "no effect"level of the pollutants.
C. INDICES OF HUMAN RESPONSE:THE EPIDEMIOLOGIC STUDIES
1. Acute Episodesa. Mortality
The first well studied air pollution episodeoccurred between December 1 and 5, 1930,
in the Meuse Valley, Belgium, when a heavyfog covered the entire valley. Several hun-dred people were severely ill with respiratorysymptoms, and 63 died. Although no precisemeasurements were made during the epi-sode, Firket estimated that a number of pol-lutants rose to high levels and that sulfurdioxide and sulfuric acid, which may havereached a total of 25,000 µg /m3 or higher(-9 PPm), were probably the chief causeof the illness." .1
During late October 1948, Donora, Penn-sylvania was blanketed by a dense fog, and43 percent of the population was affected tosome degree. Twenty persons died duringor shortly after the smog, and 10 percent ofthe population was classified as severely af-fected. No measurements were taken dur-ing the episode, but a detailed study after-wards 1 concluded that no single agent wasresponsible, and that the observed effectsVere due to a chemical agent together withParticulate matter. Sulfur dioxide and itsoxidation products were undoubtedly signifi-cant contaminants. During subsequent in-version periods, presumably not as severe asthe one in October 1948, daily averages ofsulfur dioxide as high as 0.4 ppm (1140µg/m3) were recorded.
In writing about the Meuse Valley episodein 1936, Firket stated that if there were asimilar phenomenon in London, some 3200deaths might occur. Unfortunately he wasquite accurate in his estimate since, in De-cember 1952, the world's most disastroussmog incident occurred in London, causingabout 4000 excess deaths throughout theGreater London area. Marked increases werenoted in both respiratory and cardiovasculardeaths (and for almost every cause excepttraffic accidents; presumably the smog wastoo thick for people to drive) . Since someof the diseases such as lung cancer and tu-berculosis were obviously existent before thePollution episode, much of the effect of thefog was clearly to hasten the death of peoplewho were already ill. Detailed investigationswere made of 1,280 post-mortem reports ofpersons who had died before, during, orshortly after the episode. No fatalities werefound which could not have been explainedby previous respiratory or cardiovascular le-
119

sions. In this episode as in others, the elderlyand persons with pre-existing pulmonary andcardiac disease were most susceptible.
The maximum daily concentration of sul-fur dioxide recorded during the 1952 Lon-don smog was 1.34 ppm (about 4,000pg/m3)* which appeared on the third andfourth day of the fog. Corresponding smokelevels were 4.46 mg/m3 (4500 pg/m3) .
These figures are from County Hall, whereonly volumetric (hydrogen peroxide) meas-urements of SO2 were made."
Greater London has had several air pollu-tion episodes before and since the large oneof December 1952, but none has come closeto causing 4,000 excess deaths.
A number of investigations have analyzedand compared the various London episodes.The report by Brasser et al..' appears to coverall the episodes and to present a relativelydetailed analysis of each of these episodes,pointing out the importance of the durationof the maximum values. More recently,Joosting ` has examined the relationship be-tween the duration of maximum values ofsulfur dioxide and smoke during air pollu-tion episodes, as well as the differential re-lationship between sulfur dioxide and smokelevels and the resulting mortality.
In conurbations, such as London, NewYork, Chicago, and Detroit, it has been pos-sible to observe deviations from the movingaverages of deaths during various seasons,and to relate such deviations to the coinci-dent period levels of air pollutants."
Gore and Shaddick 1" and Burgess andShaddick " reviewed acute "fog" episodeswhich occurred in London in 1954, 1955, 1956(January and December) , and 1957 (Decem-ber) , in terms of excess mortality above amoving average, related to the mean of dailyreadings at seven stations for smoke and SO2.Figure 9-1 shows mortality figures for theJanuary 1956 and December 1957 episodes.Somewhat differing patterns of onset of mor-tality rise, of age of population sufferingmost heavily, of deaths related to bronchitis
* Unless otherwise sated, British measurements ofSO2 concentrations are obtianed by the hydrogenperoxide titrimetric method and may be higherthan the actual SO, concentration due to the nres-ence of other acidic gases (see Chapter 2).
120
and to other respiratory diseases, and of totaldeaths, were noted in these acute episodes.Common to them, however, were elevationsof mean daily levels of SO2 and smoke meas-ured at seven different stations from two tofour times the winter average levels; "ef-fects" were estimated at 2,000 p.g/m3 blacksuspended matter together with 1145 pg/m3(0.4 ppm) '" of sulfur dioxide (representingall acidic gases). Deaths ascribed to bron-chitis were materially affected, but deathsdue to other causes also increased. Deathsappeared to begin to increase before the on-set of the episodes; during the episodes, ofcourse, they increased substantially. Scott 12observed a similar relationship, for similarperiods of "fog," with "effective pollutant"levels at seven different stations in Londonof 2,000 pg/m" for smoke and 0.4 ppm forSO, (reported by Scott as 1,140 pg/m3) . *
There was a sharp impact on the elderly andthe greatest proportionate rise, for cause ofdeath, in bronchitics.
Martin and Bradley': correlated dailymortality (all, causes) and daily bronchitismortality with mean daily black suspendedmatter for the winter of 1958-1959, and alsofound a significant positive association be-tween mean daily sulfur dioxide levels anddeaths (all causes) . Bronchitis deathsshowed a lower correlation with the pollutionlevel, and the authors suggest the need forconsideration of effects of air pollution onpatients with cardiovascular disease. In ad-diton, excess deaths have been related to in-creases (on the day preceding death) ofmean daily black suspended matter by morethan 200 pg/m3, and rises in mean daily SO2of more than about 75 pg/m" (2.5 parts perhundred million).* In a later paper 14, dataare shown to suggest an increase in mortality
SO, values in this study were originally reportedin ppm.SO, is converted from ppm to p,g/m3 in Scott'sreport by using an equivalency 2,850 pg /ma=1ppm. This report uses 2,860 pg/m3=1 ppm, andfor consistency attempts to express the value(0°C, 760 mm Hg) in pg/m" first. Most of theAmerican SO2 values are measured at 25°C, 760mm Hg; the equivalency under these circum-stances is 2,610 pg/m"=-.-..1 ppm.
SO, values in this study were originally reportedin parts per billion (ppb).

from all causes, and of respiratory and car-diac morbidity, associated with levels ofsmoke about 1,000 µg /m3, and SO, concentra-tions of 715 µg /m3 (25 pphm) . This "effect"is properly related to abrupt rises in the con-centrations of smoke and/or SO2, with per-haps a continuum of effects at lower levels.Since these measurements were obtained ata single point in Central London, it shouldbe presumed that a relatively wide range of
1
JANUARY, 1956
160.-
12
1 .1 . wywwwwillwevyvvvvi
31 5 10 15 20 25
DEC. JAN.
values around these levels actually contrib-uted to the mortality statistics which werecorrelated. A re-analysis by Lawther 15 ofthese mortality studies places the mortality"effect" at about 750 µg /m3 for smoke and715 µg /m3 (0.25 ppm) for SO2. Joosting sstates that the maximum sulfur dioxide con-centration above which significant correla-tions occur with death and disease is 400µg /m3 to 500 µg /m3 (0.15 ppm to 0.19
ALL AGES
70+ YEARS
0 69 YEARS
i
DECEMBER, 1957
25 30 5 10 15
NOV. DEC.
Figure 9-1. Mortality Figures for this January 1956 and December 1957 Smog
"Episodes" in London.'
The figure shows the increase in numbers of deaths during smog "episodes"
(shaded periods), especially in the older age group.
121

Pim)** when there is a high soot content.The Dutch report on sulfur dioxide,' which
discusses in detail seven air pollution epi-sodes in London, states that in the December1956 episode, 400 excess deaths, or 25 per-cent above expected, were observed inGreater London at maximum 24-hour levelsof 1,200 µg /m" for smoke and 1,100 µg /m3for SO, (0.4 ppm) The report also notesthat in January 1959, 200 excess deaths wereobserved in Greater London, or 10 percentabove the expected mortality, at a level of1,200 µg /m" for smoke and 800 µg /m" (0.30Ppm)** for SO,.' The episodes all took placeduring winter; cold weather seems to be animportant factor in London air pollutionmortality.
In Martin's review " in 1964 of daily mor-tality in London during the winters of 1958-1959 and 1959-1960, he concluded: "Fromthe data it would be difficult to fix any thresh-old value below which levels of air pollu-tion might be regarded as safe." However,his review included data with sulfur dioxideconcentrations ranging upward from about400 p.g / m" (0.14 ppm), and accompanied bysmoke concentrations of 500 µg /m" andabove.
As a result of smoke control regulations,the particle content of London air has stead-ily decreased since the 1950's but the sulfurdioxide concentrations have not decreasedproportionately. At the same measuringsites as in 1952, sulfur dioxide was actuallyslightly higher in the 1962 episode than inthat of 1952, but smoke levels were consider-ably lower. Also, as Brasser et al. havenoted, there was only one day of maximumpollution values in 1962 as contrasted withthe two days of maximum pollution in De-cember 1952.' Since 1952, a great deal ofpublicity has been given to the harmful ef-fects of smog, and more susceptible individ-uals have been encouraged to use masks andfilters and stay indoors. In addition, whenepisodes come close together, a large num-ber of susceptible individuals might not ac-
SO2 is converted from ppm to µg /m3 in the Dutchreports by using the equivalency, 2700 µg /m" =1ppm. This report uses 2,86() µg /m' =1 ppm when-ever possible.
122
cumulate, since some are killed off each time.An effect as large as that seen in the firstincident would not, therefore, be expected.
The number of deaths in New York Citywas reviewed for excess mortality in rela-tion to the air pollution episode of Novem-ber 1953 by Greenburg et cd.'6 Excess deathswere related to elevations of concentrationsof sulfur dioxide and suspended particles.Average daily smoke shade measured in Cen-tral Park was in excess of 5.0 coh units,while the SO, rose from the New York Cityaverage ranges of 430 p.g / m" to 570 µg /m"(0.15 to 0.20 ppm) to a maximum level of2,460 µg /m3 (0.86 ppm), probably a half-hour value. For this episode, there was a"lag effect," and distribution of excess deathsamong all age groups was noted. The num-ber of deaths, although not showing themarked rise seen in some of the London epi-sodes, was above average for comparable pe-riods in other years during and immediatelyafter the incident. For the November 15 to24, 1953, period, the average number ofdeaths per day was 244, whereas during the3 years preceding and following 1953, theaverage was 224 deaths per day for the samecalendar period.
A later episode (1962) was studied, butGreenburg et al." did not discern an excessmortality. However, McCarroll and Brad-ley,'` reviewing episodes in New York Cityin November and December of 1962, Jan-uary and February of 1963, and Februaryand March of 1964, compared 24-hour aver-age levels of various pollutants with NewYork City mortality figures, employing dailydeviations from 15-day moving average; themeasurements were performed at a singlestation in lower Manhattan, and fluctuationsin the values at this station were known tocorrelate well with those at another station6.5 miles away. Excess deaths on December1, 1962, followed a daily average sulfur di-oxide concentration of 2,600 µg /m" (0.72ppm)* and smoke shade in excess of 6 cohunits, during a period of atmospheric inver-sion and low ground-wind speed. The in-creased death rates were shared by the 45
* SO2 values in this study were originally resortedin ppm.

to 64 age group, as well as by the age groupover 65. In a later episode, January 7, 1963,associated with an SO, concentration ofabout 1,715 p g/m3 (0.6 ppm) * and a smokeshade value of 6 coh units, there was a peakdeath rate apparently superimposed uponan elevated death rate average due to thepresence of influenza virus in the community.
Another severe episode of air pollution en-compassed the New York City area duringthe Thanksgiving weekend, November 23 to25, 1966. The maximum 24-hour average ofhourly SO, values was 1,460 µg /m3 (0.51ppm) * (electroconductivity) on November23, and 1,344 and 1,175 p g/m3 (0.47 and 0.41ppm) on the 24th and 25th. The maximumhourly concentration was 2,915 p g/m3 (1.02ppm). Smoke shade values were above 5cohs on the 3 days. The average number ofdaily deaths during the 7 days of the airpollution episode was 261 compared to theexpected value of 237 for control periods in6 surrounding years."
An example of the inherent danger of re-lating mortality peaks to air pollution isshown by Leonard et al.2° in the Dublinstudies. During the war and post-war yearsof 1941 to 1947, peat was burned as the mainfuel rather than coal, and air pollution (asmeasured by particle concentrations) wasmarkedly decreased. Sulfur dioxide levelsvaried in a manner similar to those of sus-pended particulate matter. The winter peaksin death, however, were unaffected, and thusdo not seem to be related to air pollution.When coal again became available in 1948,the air pollution levels rose with no apparenteffect on the death rate (see Figure 9-2).Unfortunately, it is not possible to assess theeffect of changing medical practices and theadvent of antibiotics for use in treating res-piratory diseases on these data.
In Detroit 21 a rise in infant mortality anddeaths in cancer patients occurred over a 3-day period accompanied by a rise in the 3-daymean suspended particulate matter for thesame period above 200 p g/m3 and accom-panied by an instantaneous SO, maximumof 2,860 p g/m3 (1.0 ppm) * (September1952) . This is not believed to be related tothe cold temperatures which have character-ized the London episodes.
In Osaka, Japan, Watanabe 22 reported onexcess deaths in a December 1962 smog epi-sode. There were 60 excess deaths relatedto mean daily concentrations of suspendedmatter greater than 1,000 p g/m3, with ac-companying sulfur dioxide greater than 285p g/m3 (0.1 ppm) the measurements weremade at a single station in the central com-mercial area of the city.
In an effort to include all the availablerelevant data, we must mention the discus-sion by Brasser et al."', calling attention to theavailability of data for Rotterdam. He says:
"From investigations at Rotterdam in-dications have been obtained that thereexists a positive association with thetotal mortality if the value of 500 p g/m3[0.19 pprn]* per 24 hours is surpassedfor a few days. Perhaps this effect be-gins to be active at lower concentrationsalready present. There is a faint indi-cation that this will happen somewherebetween 300 and 500 pg SO, per m3[0.11 to 0.19] per 24 hours."
The Rotterdam episodes of JanuaryFeb-ruary 1959 and December 1962 have alsobeen discussed by Joosting.`' What is espe-cially significant is that particulate levels aregenerally low in Rotterdam. On comparingparticulate and SO, concentrations, Joostinghas characterized the ratio of particulates toSO, as 1:1, 1:1.5 to 1: 2, and 1:3 to 1:4. Rot-terdam is in the last category, whereas Lon-don is in the first. Measurements in Rotter-dam are made with the hydrogen peroxidetitrimetric method.
When a marked increase in air pollutionis associated with a sudden dramatic rise inthe death rate or illness rate lasting for afew days and both return to normal shortlythereafter, a causal relationship is stronglysuggested. Sudden changes in weather, how-ever, which may have caused the air pollu-tion incident, must be considered as anotherPossible cause of the death rate increase.Over the years, a number of such acute epi-
* SO2 values in this study were originally reportedin ppm.
* The numbers in brackets are the editor's; an equiv-alency of 2,700 p,g /m3 =1 ppm SO2 was used toassure consistency with any conversions made bythe authors.
123
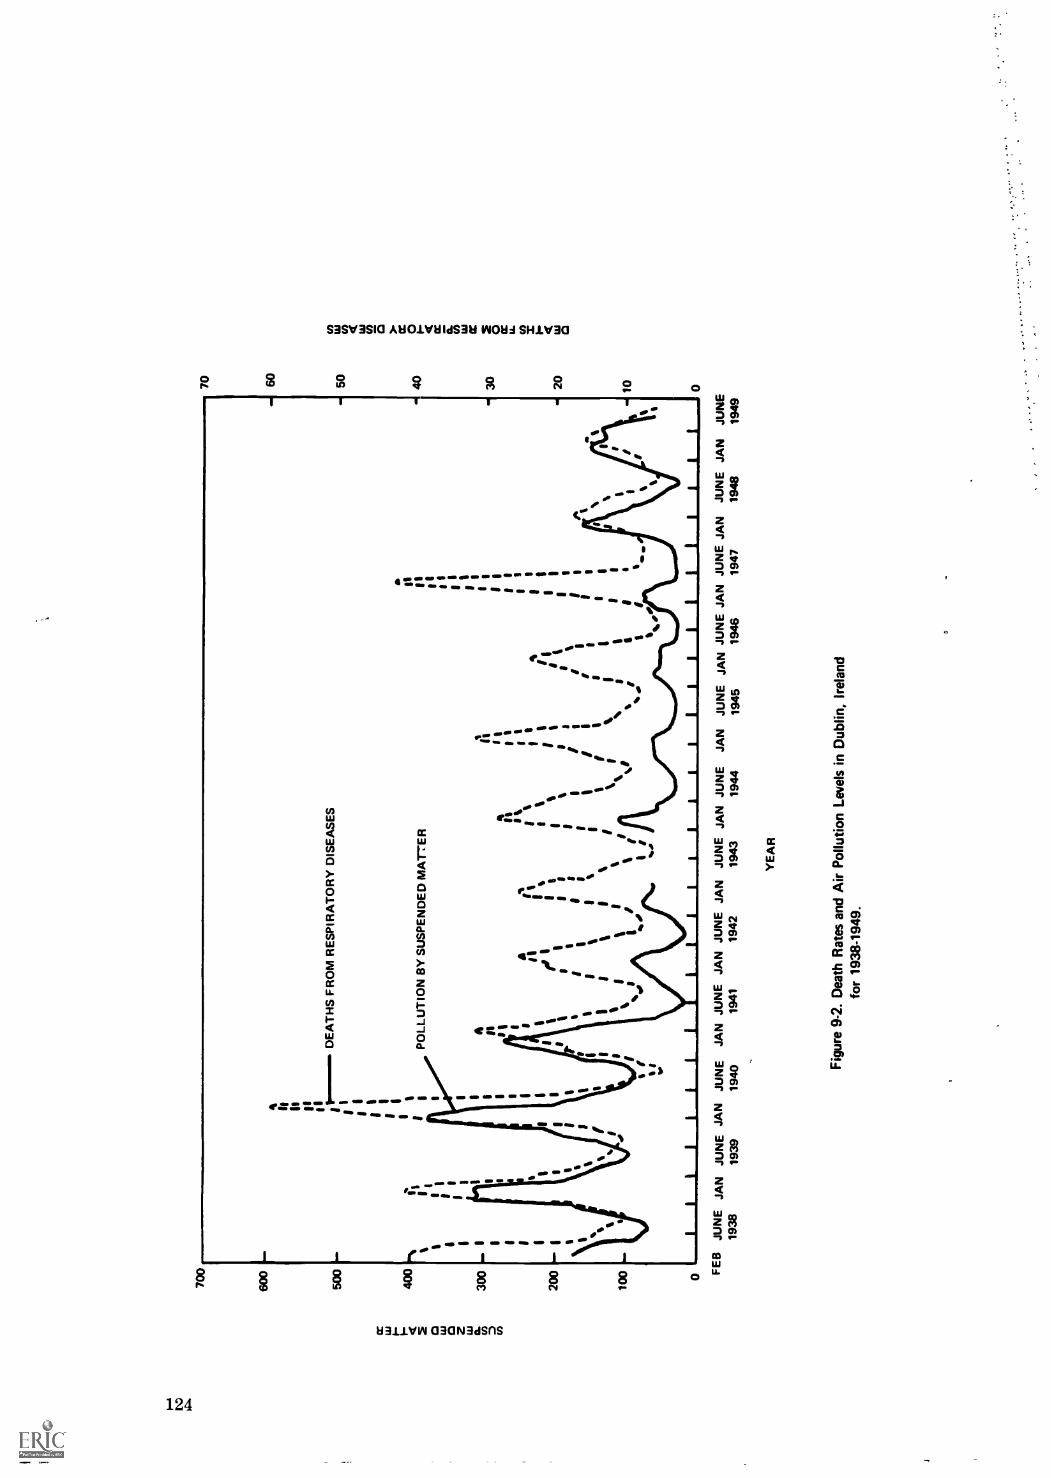
700
600
500
400
300
200
100 0
IDEATHS FROM RESPIRATORY DISEASES
11
II
I1 I I
II
ilI
IPOLLUTION BY SUSPENDED MATER
II
II
sIS
ii
' sIS i
Ii
tIII
II
iI
I4
11
II
1
1%
I1
11
/1I
1e
Ide
is
1 II
1
1 I
1a
s
I
II1 5
1 I
1 I 1
A
11
s1
11
e
II
II
11
Ii ,
1
%I
I1 1
11I
II
II
1I
iI
11I
I IIt 1
I1
II
/1
11
1I
II
I1
i1
,1
%1
1
%iI
II
lI1
I%
II
II
I1
I%
`I
tt
II
Ie
Ia
%'
i, I
\g
II
ii
iI
% I
rI
I . .
a 0
I Si i
s f
vb.,
vs
FEB JUNE JAN JUNE JAN JUNE JAN JUNE JAN JUNE JAN JUNE JAN JUNE JAN
JUNE JAN JUNE JAN JUNE JAN JUNE JAN JUNE
1938
1939
1940
1941
1942
1943
1944
1945
1946
1947
1948
1949
YEAR
Fig
ure
9-2.
Dea
th R
ates
and
Air
Pol
lutio
n Le
vels
in D
ublin
, Ire
land
for
1938
-194
9.
70 60
50
40
30 20
10 0

sodes have been reported, and there seemslittle doubt that air pollution was the cause.
Table 9-1 is an attempt by Brasser 'et al.7to summarize some of the recent major airpollution episodes in Greater London.
The British studies presented in this sec-tion suggest that excess mortality, a smallrise in the daily death rate, is detectable inlarge populations if the concentrations ofsulfur dioxide rise abruptly to levels at orabout 715 µg /m' (about 0.25 ppm) in thepresence of smoke at 750 p.g / m" . The majortargets are the aged population, patientswith chronic obstructive pulmonary disease,and patients with cardiac disease. A moredistinct rise in deaths is noted generally whensulfur dioxide exceeds 1,000 µg /m3 (about0.35 ppm) for 1 day and particulate matterreaches about 1,200 µg /m3. Daily concen-trations of sulfur dioxide in excess of 1,500µg /m3 for 1 day ( 0.5 ppm) in conjunctionwith levels of suspended particles exceeding2,000 µg /m3 appear to be associated with anincrease in the death rate of 20 percent ormore over base line levels. This same effectis observed at lower sulfur dioxide levels ifthe maximum pollution levels last for alonger period.
b. MorbidityThe acute episodes have resulted in sub-
stantial increases in illness. Thus a survey "of emergency clinics at major New YorkCity hospitals in November 1953 indicated arise in visits for upper respiratory infectionsand cardiac diseases in both children andadults in all of the four hospitals studied.Sulfur dioxide ranged between 200 µg /m3and 2,460 µg /m' (0.07 ppm to 0.86 ppm) *during the period from November 12 to 24,and hospital admissions were clearly ele-vated by November 16, at which time con-centrations had not yet exceeded 715 p. g/m3(0.25 ppm) ; "smoke shade" at this time wasclose to 3 coh units.
Again, the number of emergency clinicvisits for bronchitis and asthma at sevenlarge New York City hospitals was examinedduring the Thanksgiving 1966 air pollutionepisode.'24 There was a rise in the numberof such visits on the third day of the episode,among the patients age 45 and over, at threeof the seven hospitals investigated. Unfor-tunately, the Thanksgiving holiday greatly
* SO2 values in this study were originally reportedin ppm.
Table 9-1.SURVEY OF SELECTED ACUTE AIR POLLUTIONEPISODES IN GREATER LONDON.'
Dec. 1952 Jan. 1956 Dec. 1962 Dec. 1957 Dec. 1956 Jan. 1955 Jan. 1959
Duration of the cumulationperiod in days .... . ..... 5 5 5 r0 10 11 5
Number of days with maxi-mum pollution 2 2 1 1 5 lx3 a 1
SO2 level preceding episode . 500 300 400 300 300 300 300SO2 maximum 4000 1500 3300 1600 1100 1200 800SO, increase per day . .. 1200 500 1000 325 400 450 250Soot level preceding episode . 400 500 200 400 400 500 400Soot maximum . .. . ..... 4000 3250 2000 2300 1200 1750 1200Soot increase per day . . . . 1200 1300 600 500 400 600 400Number of excess deaths 3900 1000 850 800 400 240 200Number of days with excess
mortality 18 10 13 10 6 6 6Daily mortality expected un-
der normal circumstances 300 330 310 300 270 320 325Average daily mortality in
the period (excess mortal-ity as a percent of nor-mal) 170 130 120 125 125 112 110
Remark : The SO: and soot concentrations mentioned are average values over 24 hours expressed in pg/m5.a Maximum pollution values of one day's duration occurred three times.
125

complicated evaluation of the emergencyclinic visits over the holiday period.
In the investigation of the London episodeof December 1952, information on illness wascollected from as many sources as possibleincluding sickness claims, applications forhospital admission, pneumonia notifications,and records of physicians. The analysis dem-onstrated a real and important increase inmorbidity, though there was some indicationthat the increase in illness was not as largeproportionately as the increase in deaths andthe effects were not so sudden in producinga marked rise in the early days of the epi-sode. In a number of other severe Londonepisodes the increase in morbidity put a con-siderable strain on the health services.
These episodes reflect results which fallinto Level IV of the World Health Organi-zation's "guides to air quality." 2 5 These"guides," equivalent in usage to our term"criteria," cover sets of concentrations andexposure times at which specified types ofeffects are noted or at which no effect isnoted. Level IV includes "concentrations andexposure times at and above which there islikely to be acute illness or death in sus-ceptible groups of the population."
2. Chronic (Long-Term) Air PollutionKurland 2" has called to our attention the
fact that the air pollution episodes represent,by definition, episodes of massive, over-whelming, and unusual exposure, and thusthe most significant pathologic effects. Thereis an "iceberg" effect in that such data repre-sent the obvious, while the greater share ofthe problem remains submerged. We aredealing with an essential dose-response sit-uation, the upper limits of which are repre-sented by these episodes.a. Day-to-Day Variations in Mortality and
MorbidityIn a systematic approach to analyzing res-
piratory and cardiac morbidity daily in Lon-don, Martin i.' examined deviations in mor-bidity from a 15-day moving average in Lon-don during the winters of 1958-1959 and1959-1960. Both smoke and sulfur dioxideconcentrations appear to be about equallyrelated to morbidity rates, and a definite ex-cess in morbidity seemed to exist as it did
126
for mortality, though there was a somewhatgreater degree of irregularity.
An approach similar to Martin's, but lim-ited to observations on mortality, was usedby McCarroll and Bradley 18 in New YorkCity. Covering a 3-year period (1962-1964)they examined a number of peaks in NewYork City mortality associated with periodsof high air pollution. There are examplesgiven where sulfur dioxide and smoke shadeappear to be related to mortality. The au-thors present other episodes, however, wherethe relationship to air pollution is not nearlyas clear, although the death rate fluctuatesto even higher peaks. Reference to thisanalysis has already been made in our dis-cussion of the data on episodes in SectionB-1.
The rate of hospital admissions, obtainedfrom data collected by a medical insurancegroup, was used by Sterling et al." to studythe effects of air pollution on hospitalizationof about 10,000 individuals in Los Angeles.Certain diseases considered to be relevant toair pollution, such as allergic disorders, in-flammatory disease of the eye, acute upperrespiratory infections, influenza, and bron-chitis, were found to be related to daily con-centrations (measured as daily average mini-mum and maximum values) of oxidants, car-bon monoxide, sulfur dioxide, oxides ofnitrogen, ozone, oxidant precursor, and par-ticulate matter. Measurements were takenat eight different stations five to ten milesapart from March to October. The analysesshowed significantly larger admission rateson those days among the highest third of sul-fur dioxide pollution than on those daysamong the lowest third. Sulfur dioxide con-centrations during the period of the studyaveraged less than 0.015 ppm (,--,45 p.g / m" ) .
Concentrations on days of highest pollutionwere not reported. The method of analysisgenerally is new and complex, and the authornoted the need for additional time periodsto be studied to take into account the pos-sibility of seasonal variations. The analysismust also be extended to other cities.
McCarroll et al." studied residents of aNew York City housing project, using week-ly questionnaires. Exact levels of sulfur di-oxide which could be used for establishment

of air quality criteria were not given; how-ever, the data indicate that sulfur dioxiderather than particulate matter was associ-ated with eye irritation. Symptoms of coughwere also shown to be related to air pollu-tion but were not well differentiated betweenassociation with particles and sulfur dioxide.The particular time-series analysis used withthese data is not well known, and the biasesinherent in its use have not been fully de-termined.
Results also obtained at Rotterdam haveshown that when the SO2 concentration rosefor 3 to 4 days from about 300 µg /m3 to 500µg /m3 (0.11 ppm to 0.19 ppm) ,* the numberof admissions into hospitals for respiratorytract "irritation" rose, especially in olderindividuals.'
b. Geographical Variations in Mortality1. Studies Based on Available Data.
Mortality and morbidity statistics each haveadvantages as well as disadvantages. Rec-ords of illness should be more fruitful indefining subtle effects, since illness precedesdeath and since all illness does not result indeath. Mortality statistics are collected inevery country and are available for quicktabulation. Unfortunately, the quality ofmortality statistics varies. One of the prob-lems is that, with the present system of tabu-lating mortality data, a single cause of deathmust be selected and coded, even though morethan one cause may be involved in the death.The single cause of death designated (e.g.,specific chronic respiratory disease) dependslargely on the judgment of the attendingphysician and has little, if any, relation toepidemiologic use. While contributing causesof death appear on the death certificate, theyare not reflected in summary tabulations.The coding of only the "underlying" causeof death minimizes the importance of suchdiseases as emphysema which often appearon the death certificate as contributory orassociated causes of death.zs
Almost all studies of the effects of long-term exposure on death rates compare the
* SO: is converted from ppm to aug/m3 in the Dutchreports by using the equivalency, 2,700 ',g /m3 =1ppm. This report uses 2,860 pg /m3 =1 ppm when-ever possible.
rate in one area with that in another. Mor-tality as well as morbidity studies are ham-pered by the possibility of differences otherthan air pollution existing between the areas,such as social class, occupation, age, and sexcomposition of the population, and cigarettesmoking. Assuming that almost all deathsare recorded and tabulated, comparison oftotal mortality rates (i.e., deaths from allcauses) obviates the bias of diagnostic selec-tion, but does not lessen the chances of otherassociated factors having caused the dif-ference.
Buck and Brown 29 reported in 1964 therelation of standardized mortality ratios forthe 5-year period 1955-1959 to four vari-ables: daily smoke and SO2 concentrationsfor March 1962 (presumed representative ofthe study period), population density in 1961,and a social index of 1951. The studies in-volved populations in 214 areas of the UnitedKingdom (19 London boroughs, 40 countyboroughs, 70 other boroughs, 61 urban dis-tricts, and 15 rural districts) .
Statistical analysis indicated that bron-chitis mortality had a significant positive as-sociation with both the smoke and SO, con-centrations encountered in these residentialareas, and also with social index. The stand-ardized mortality rates for lung cancer werenot, in general, significantly associated withsmoke or SO, concentrations in the residen-tial areas. Examination of the tables givenby Buck and Brown suggests that the excessof bronchitis mortality occurred for classesof area where the average daily smoke andSO, concentrations both exceeded 200p,g / m" .* Although smoking habits were re-viewed and were apparently uniform fromarea to area, occupational and domestic in-door environmental exposures were not con-sidered. The pollutant values selected forthe correlations did not cover the same timeperiods as the mortality figures. The asso-ciations of bronchitis mortality with smokeand sulfur dioxide were about equal, and theeffects of the two pollutants cannot be sepa-rated. Variations in smoking habits did notseem to account for much of the mortalityvariation.
* 200 p,g/m3 of SO: is equivalent to 0.070 ppm.
127

In addition to studies of acute variationsin mortality in relation to air pollution in-dices, Burgess and Shaddick" studied mor-tality rates in London and their relationshipto smoke, sulfur dioxide, social class, andplace of birth (in or out of London). Aver-age levels of sulfur dioxide did not varymuch among the areas, ranging from 190µg /m3 to 315 µg /m3 (0.07 ppm to 0.11 ppm) ;sampling was performed at seven widelyscattered points every 24 hours during nor-mal winter weather and every 4 hours dur-ing fog periods. A significant relationshipbetween lung cancer or bronchitis mortalityand smoke or sulfur dioxide was not dem-onstrated. Births in London and low socialclass (occupational stratification) were bothassociated with higher rates. The differencesin sulfur dioxide levels are small among thedifferent areas, and it is difficult to believethat, even if sulfur dioxide were a fairlystrong causal factor, any significant differ-ences could be shown by this method. Whatappear to be the same data, slightly rear-ranged, are reported by Gore and Shaddick 9with the same basic conclusions.
In a similar study carried out a few yearsprior to the above, Pemberton and Gold-berg " compared bronchitis death rates inpersons over age 45 in 33 county boroughsof England and Wales for which air pollu-tion data were available. Two indices of so-cial conditions were used: (1) the numberof persons per room, and (2) an estimatedpercentage of households with income ex-ceeding a certain level. Counties from urbanand industrial -reas were included. Signifi-cant correlations were found with bronchitisdeath rates and sulfur dioxide pollution, butnot with "total solids." The association wastrue for male but not for female bronchitisrates. No significant correlation was foundbetween the two indices of social class andsulfur dioxide pollution. No evidence wasgiven for smoking differences, and no spe-cific sulfur dioxide levels were given thatwould allow establishment of ambient airquality.
Gorham 3' found a correlation between thecrude pneumonia death rate and atmosphericsulfate deposits in the 53 counties of Eng-land and Wales. The original data were not
128
given, and the rates were not corrected forage differences or social class; the study cantherefore only be suggested until confirmedby more accurate methods.
Other studies 32 "3 have confirmed an asso-ciation in Great Britain of bronchitis deathrates with general indices of air pollution,and an equally strong association in generalholds up when various measures of socialclass are held constant by statistical means.Lung cancer mortality is consistently asso-ciated with measures of population densityand cigarette smoking, but not with generalindices of air pollution.
2. Special Studies Involving the Collec-tion of New Data.In 1964, also, Wickenand Buck " reported on a study of bronchitisand lung cancer mortality in six areas ofNortheast England, one in Eston, anotherin Stockton and four in rural districts. Thedeaths covered the period 1952 to 1962. Thesurvey of decedents with cause of death frombronchitis or lung cancer was matchedagainst the survey of decedents with causeof death from nonrespiratory disease con-trolled for age and sex; the basis for thediagnostic classifications was not stated inthe report. Personal interviews were carriedout with next of kin. Personal interviewsof a random sample of households were alsoconducted to obtain sex, age, smoking habitsand occupation of the population at risk, theliving population. The survey of decedentswas carried out between January and Oc-tober 1963; the survey of the living popula-tion was carried out between December 1963and March 1964. Smoke and sulfur dioxideconcentrations were measured in the Estonurban district. One year's aerometric datawere obtained. The study was excellent inprinciple though, unfortunately, sulfur di-oxide and particulate values were availableonly for the Eston urban district.
Eston, itself, as a sub-study, was subdi-vided into North Eston and South Eston.North Eston contains or lies near heavy in-dustrial plants, whereas South Eston is aresidential area. During the period May1963 to April 1964, mean weekly observa-tions of the sulfur dioxide and smoke con-centrations were carried out in two sites inNorth Eston and one station in South Eston.

The sulfur dioxide value in North Eston onthe yearly average was 115 µg /m3 (0.040ppm) and for South Eston it was 74 µg /m3(0.026 ppm). Smoke values were 160 pg/m3and 80 µg /m3 for North and South Eston re-spectively. The deaths studied occurred be-tween 1952 and 1962. Adjustments weremade for differences in age composition,smoking habits and social class, and thesewere insufficient to explain the differencesin lung cancer and bronchitis mortality ratesbetween the two localities. Occupational ex-posure to pollution was then taken into ac-count in the analysis. The conclusion wasthat there is an association between the de-gree of air pollution and the incidence oflung cancer and bronchitis mortality in thetwo areas of the Eston urban district.Though both sulfur dioxide and smoke valuesand concentrations are furnished in the re-port and the effects apparently cannot beseparated, Brasser et al.7 apparently haveused the sulfur dioxide concentration as themore relevant measure of this study.
In a later study by Burn and Pemberton 35the community of Salford was classified intothree pollution areas according to Table 9-2.Five sampling stations in the area were em-ployed. Despite the closeness of the rangesof values, a high rate of bronchitis mortality,of lung cancer mortality, and of deaths fromall causes, was observed in the high, com-pared to the lower pollution wards. It ap-pears (see Section C-4) that there was also
an increased rate of bronchitis morbidity inthe highly polluted wards.
Winkelstein et al.36 -3ti divided the city ofBuffalo into three zones based on a networkof 21 air sampling stations operated for a2-year period. The city was also divided bycensus tracts into five economic levels basedon median family income reported from theU.S. Census. Although the method by whichthe air pollution zones were determined isnot clearly described, in the high zone sul-fation levels were greater than approxi-mately 0.45, in the intermediate zone, 0.30 to0.45, and the low zone less than 0.30 (allunits mg/cm2/30 days) . Total mortalityfrom all causes for men aged 50 and overshowed no association with sulfation withineach economic stratum. Deaths from chronicrespiratory diseases, including asthma, bron-chitis, chronic interstitial pneumonia, bron-chiectasis, and emphysema, could be exam-ined only for white males aged 50 to 69 be-cause of insufficient numbers. Only in thesecond economic level (income $5,175 to$6,004) were there more than five deathsin each air pollution level. Within this in-come group a clear gradient in mortalityfor chronic respiratory disease was seenfrom low to high air pollution, with the big-gest difference being that between the mod-erate and high pollution areas. In the first(i.e., lowest) economic level (income $3,005to $5,007), mortality for chronic respiratorydisease was higher in the "high" oxides of
Table 9-2. POLLUTION LEVELS IN SALFORD.(SEASONAL DAILY AVERAGES)'`'
Pollution areaclassification
Smoke, 14g/m3
SO2, pg/m"
(ppm in parentheses)
Deathsobserved
x 100expected
Winter Summer Winter SummerAll
Causes BronchitisLung
Cancer
High 680 270 715 255o..,ot) 106 128 124
(0.25) (0.09)
Intermediate 490 170 460 200 100 97 84
(0.16) (0.07)
Low .. 450 170 340 145 90 52 79
(0.12) (0.05)
Note: The data in the original report show' SO2 concentrations in parts per hundred million (pphm).
129

sulfur area than in the "intermediate" pol-lution area. No consistent gradient wasfound for lung cancer deaths.
As the authors point out, since the onlyassociation between sulfation and respira-tory disease mortality was in the lowest eco-nomic classes (first and second classes), andthese classes were likely to have increasedoccupational exposures to air pollution, therelationship might be due to an interveningoccupational variable. However, Reid hascalled attention to the likelihood of air pol-lution affecting the lowest socioeconomicgroup most."9 This may be ascertained bya study which can measure effects on thelowest socioeconomic group in low, moder-ate, and high pollution areas. As in mostcommunity studies the effect of differencesin smoking habits was not known in theBuffalo study. Also, the study did not takeaccount of the ethnic background of thedecedents, although Winkelstein's analysisof mortality from gastric cancer as relatedto particulate levels attempted to do this.
From an aerometric standpoint, one ofthe most extensive studies of variations inmortality and morbidity within a city wasthe work of Zeidberg et al. in Nashville, Ten-nessee.4"..n Aerometric data were collectedat 123 sampling stations in a grid across thecity. An area of "high" SO., concentrationswas defined which had a geometric mean an-nual 24-hour level of 0.01 ppm (-30 ,ug/m3)or more. The "low" SO area had 0.005 ppm( 15 ,ug/m") or less. The high sulfationarea had 0.351 mg S03/100 cm' -day or moreas an annual geometric mean. Areas of high,moderate, and low pollution were also de-fined by soiling index, annual dustfall, andsuspended particulate matter. All codabledeaths registered between 1949 and 1960(32,067) were then distributed among cen-sus tracts rated according to high, moderate,and low pollution levels, and upper, middle,and lower economic classes, and then furthercoded by age, sex, race, and underlyingcause of death. In the study, account wasnot taken of smoking habits of the deceased;also, the "middle class" group covered a rela-tively large segment of the decedents. Stand-ardized mortality ratios (for total respira-tory disease, and for pneumonia, influenza,
130
bronchitis, emphysema, tuberculosis, andlung and bronchial cancer) were then re-lated to the pollution indices obtained dur-ing 1959. The statistically significant mor-tality increases were those for all respiratorydiseases related to sulfation and soiling; lungand bronchial cancer mortality, and bron-chitis and emphysema mortality were notclearly related. "High" pollution in thesestudies for soiling referred to more than 1.1coh unit/1,000 linear feet. A later paper 42derived from the same study period analyzedinfant and fetal death rates between 1955and 1960. For white infant mortality, sig-nificant regressions were obtained for sul-fation; dustfall (alone, or as an interactionvariable) was the most frequently relatedvariable.
In summary, the results of this analysisof long-term exposure studies indicate ef-fects which would coincide with Level IIIof the World Health Organization's "guidesto air quality." 25 Level III 'is defined as"concentrations and exposure times at andabove which there is likely to be impairmentof vital physiologic functions or changes thatmay lead to chronic diseases or shorteningof life."
c. Geographic Variations in MorbiditySpe-cial Studies
It has been postulated that the study ofrecords of illness rather than mortalityshould be more fruitful in defining subtleeffects, since morbidity is an earlier andmore sensitive index of deviation from nor-mal health. A much larger insult must pre-sumably be given to the body to cause deaththan to cause illness. Routinely collectedmorbidity data are, however, not generallyavailable. Data may occasionally be obtainedfrom group insurance plans, hospital ad-mission records, or existing school records.Since such data are usually not collected ina uniform, precise manner, most morbiditystudies require expensive and time-consum-ing field surveys with questionnaires oractual medical examinations of the subjects.
Morbidity studies of adults involving long-term exposures are frequently not as usefulas desired, due to the presence of compli-cating factors such as occupation and smok-

ing. Accordingly, Anderson has recom-mended 4" that children and housewives beused to determine the health effects of airpollution.
A study was conducted by Petrilli et al.44in Genoa, Italy, which followed Anderson'srecommendation. This intensive survey ofcommunity respiratory morbidity was actu-ally a set of epidemiologic studies to deter-mine the air pollution effects in Genoa. Thesubjects studied in one of the research proj-ects were women of 65 years of age, non-smokers who lived for a long period in thesame area and who had no industrial ex-perience. Economic and social conditions inthe areas of residence were considered aswell as the levels of pollution in these areasof residence. Air pollution was monitoredin Genoa for 10 years (1954-1964) at 19sites covering the suburban area, the resi-dential center, and the industrialized area.Sulfur dioxide was measured by a techniqueanalogous to the volumetric method of theEnglish Department of Scientific and Indus-trial Research. Carbon monoxide was alsomonitored. A retrospective survey was car-ried out using the M.R.C. questionnaire withslight modifications. As has been noted, sev-eral different epidemiologic studies appearedto have been conducted. Consideration wastaken in the sample selection of age, lengthof residence in the same area, presence ofcardiovascular disease, living habits, pre-vious working habits, etc., in the design ofthe study. Morbidity indices were calculatedfor 1961 and 1962 for the population whichreceived free medical care from the munic-ipality and therefore was under continuousmedical observation. Prevalence and inci-dence rates were calculated for symptomssuch as cough, sputum, dyspnea, rhinitis, andrecent and past respiratory diseases. Thefrequency of these respiratory symptoms wasmuch greater in the central residential areathan in the suburban residential area, eventhough the annual means of sulfur dioxidein the two areas were relatively close; thepattern for rhinitis was somewhat erratic.
Sulfur dioxide measurement in the clean-
* SO2 values in this study were originally reported inPPIn
est area, that is, the suburban residential dis-trict, was 80 p.g/m" (0.028 ppm) * with thewinter value being 85 µg /m3 (0.030 ppm)and the summer value 55 µg /m3 (0.019 ppm).The residential center area had an annualaverage value of 105 µg /m3 (0.037 ppm) ,with a winter average of 115 µg /m3 (0.040ppm) and a summer average of 85 µg /m3(0.030 ppm). The industrial area averaged265 µg /m3 (0.093 ppm) for its annual meanwith a winter average of 315 µg /m3 (0.11ppm) and a summer average of 230 p,g / m"(0.080 ppm) .
The study showed a striking correlation be-tween frequency of symptoms and the dis-eases of the respiratory tract and air pollu-tion levels. In the suburban residential area,the indices were almost always significantlylower for the data collected and particularlyfor the frequency of cough, sputum, dyspnea,rhinitis, and recent respiratory disease, es-pecially bronchitis. There was usually agradient between the suburban area and theindustrial area. What was especially sig-nificant was the finding of differences gen-erally in the prevalence of respiratory dis-eases during the summer in the industrialarea as compared with the moderate and lowpollution areas. This should contribute toour knowledge regarding the relationship be-tween different climatic conditions and thehealth effects of air pollution. It has beenpostulated that it is usually in the winterthat air pollution of the reducing type exertsthe most deleterious effects.
The study also examined a number of areasin the city. Data for the seven districts inthe town of Genoa showed a very significantcorrelation (r = 0.98) between the frequencyof bronchitis and the annual mean of sul-fur dioxide levels. A nonsignificant correla-tion between the frequency of bronchitis andsuspended matter and dustfall was observedin the study. There was a suggested rela-tionship between winter temperature andbronchitis, but this was further reducedwhen adjustment was made for air pollution.
What is particularly significant about thisstudy is that the differences in respiratorydisease were found between areas with anannual mean of 105 µg /m3 (0.037 ppm) andone of 80 p,g / m" (about 0.028 ppm). Also
131

highly significant was the observation thateffects of air pollution were found in thesummer prevalence of respiratory disease.Very sharp differences were found withina communil,y* which is characterized by maxi-mum sulfur dioxide levels below an annualaverage of 300 µg /m' (0.10 ppm). Finally,the very striking differences between thearea with low levels of pollution and the in-dustrialized areas were noted and shouldlend support to the results of studies in otherareas.
Toyama, 45 in a comprehensive study of airpollution and its health effects in Japan,charted the age-standardized morbidity rates(per thousand) secured by interview sur-vey in 1961, and described a gradient of res-piratory disease morbidity from the highlyindustrialized (and presumably polluted)areas to the rural areas of Japan. Further,the pulmonary disease morbidity ratio washigher in the industrialized, polluted areasthan were the ratios for other disease group-ings. This gradient was not noted for cardio-vascular diseases nor for gastrointestinaldiseases. Unfortunately, specific pollutantconcentrations were not clearly indicated toaccompany these data on morbidity. Theage-standardized morbidity rates per thou-sand for several cities in Japan are shownin Figure 9-3.45
Pulmonary function and respiratory symp-toms were compared in population areas ofhigh (95 µg/m3) and low (25 µg /m3) SO2
pollution (annual means of 0.034 ppm and0.009 ppm respectively) (measured by H202absorption, 11.,SO4 titration) in Port Kem-bla, Australia. "' Coh values in the more pol-luted and in the cleaner area, averaged overone year, were 2.7 and 1.3 respectively. Sincethe pollution in this area was die to a singlelarge source, pollutant levels fluctuated wide-ly. One peak reading of over 13 ppm wasobserved, and daily averages ranged up to17 times the annual mean. Chronic bron-chitis rates for men over 55 were higherin the polluted area, but rate differences forother age groups and for women were notstatistically significant between the areas.A higher incidence in the polluted area wasalso found for a variety of respiratory symp-toms such as head colds, wheezing, andchronic cough. The effects were said to havedisappeared when pollution was reduced byusing a higher stack at a smelter." Adjust-ments were not made for differences, whichwere known to exist, in age and smokingbetween the two areas. In addition, theheavily polluted area was of lower socio-economic class: only 3.2 percent of its popu-lation was in professional and administrativeoccupations, and 10.2 percent were laborersas compared to 10.2 percent professionalsand 2.4. percent laborers in the clean area.A difference of over one inch in average
* SO, values in this study were originally reported inppm.
RESPIRATOR Y CARDIOVASCULAR GASTROINTESTINAL
I I I I
10 20 30 0 10 0
RATE PER THOUSAND
10 20
KAWASAKI
YOKOHAMA
FUJI NO
KAINAN
DAITO
30
Figure 9-3. Age-Standardized Morbidity Rate per 1,000 for Three Diseases in Japan.43
The mortality rate for respiratory diseases shows a clear correlation with pollution levels. There is no such clearcorrelation for cardiovascular or gastrointestinal disorders.
132

height of the population in the two areasalso indicates the two populations were notcompletely comparable. No significant dif-ferences that could be related to air pollu-tion were found in respiratory functionmeasured as FEVI.o. In Port Kembla, SOconcentrations are highest during the sum-mer, rather than winter, so that this studyis not biased by the question of whether theeffects are due to pollution or low temper-ature, as has been the case in many of theBritish and American epidemiologic studies.Notwithstanding the stated deficiencies of thestudy, the finding that respiratory symptomsdisappeared when pollution was reducedwould appear to confirm an effect of sulfurdioxide at the level found originally in theold high pollution area of Port Kembla, ifno other change took place which could ac-count for the reduction.
In 1965, Holland et al.'', '" reported on theirstudy of the prevalence of chronic respira-tory disease symptoms and performance ofpulmonary function tests of outdoor tele-.phone workmen in London, in rural England,and on the east and west coasts of the UnitedStates. Types of occupational exposure, useof cigarettes, and socioeconomic matchingwere considered. The annual mean concen-tration of suspended particulate matter inthe British exposures, both rural and in Lon-don, was approximately 200 p, g/m3. For sul-fur dioxide, the mean concentrations were:285 µg /m3 (0.1 ppm) * in London and inrural areas of England, 55 µg /m3 (0.02ppm) . Persistent cough and phlegm andchest illness episodes were 1.4 times as fre-quent in men aged 40 to 49, and 2.2 timesas frequent in men aged 50 to 59, in the Lon-don area as in rural England. Increasedsputum volume was more frequent and pul-monary function was poorer in London thanin the rural areas. These differences held,even when the data were standardized forsmoking.
In an earlier study, conducted in 1960 and1961 following a number of related studiesyielding consistent results, Holland andReid 5° reviewed respiratory symptoms, spu-
* SO2 values in this study were originally reportedin ppm.
tum production, and lung function levels inmail van drivers and vehicle maintenancemen in central London and mail van driversand engineering workers also driving vansin and around three county towns in South-ern England. The conduct of the study wasexemplary. A standardized questionnairewas used as were trained interviewers. Be-cause of the design of the study, socioeco-nomic factors were the same, the occupa-tional exposures were homogeneous, and cor-rections were applied for smoking. Therewere some physique differences in the ruralareas, and allowances were made for thesein the statistical evaluation. Unfortunately,no comprehensive indices of air pollutionwere available for the three towns. How-ever, mean sulfur dioxide readings expressedas sulfate per 100 cm2 lead oxide were avail-able for two stations in St. Pancras near theLondon survey center and two stations inGloucester, one of the three towns. Brasseret al.' have furnished the following SO2 val-ues: London (St. Pancras) summer average100 Ltg/m3 (0.035 ppm), winter average 500µg /m' (0.17 ppm) and Gloucester, Peter-borough and Norwich 75 µg /m3 (0.026 ppm)and 200 pg/m3 (0.070 ppm) respectively forsummer and winter averages.
Between the age of 50 and 59, the Londonmen had more frequent and more severerespiratory symptoms, produced more spu-tum, and had significantly poorer perform-ance on lung function tests. Dyspnea ofgrade 3* or more was more than four timesas frequent in London as in the county townsamong men 50 to 59 years of age; this is ahighly significant difference. The authorsconcluded that the relatively high level ofpollution in London was the major reasonfor the excessive frequency or severity ofchronic bronchitis in London.
In a group of Canadian veterans studiesby Bates et al.,''' a relationship between airpollution and both bronchitis and pulmonaryfunction measurements has been reported.There are, unfortunately, inadequate data
* The author grades dyspnea " according to fivelevels; grade 3 represents dyspnea when walkingeven at a slow pace on level ground, but not tothe extent that it is necessary to stop for breath.
133

on the levels of smoke, sulfur dioxide, andother pollutants, in the four Canadian citiescompared, to derive specific relationships be-tween the levels of these pollutants and theprevalence or exacerbation of disease or thedeterioration of pulmonary function. How-ever, there is an association in the "dirty"cities (Montreal and Toronto) versus the"clean" cities (Halifax and Winnipeg) of in-creased prevalence and severity of bronchitis,and poorer pulmonary function performance.
One of the most detailed and carefully de-signed American studies was carried out byAnderson and Ferris in Berlin, New Hamp-shire, and Chilliwack, British Columbia.52-54In each town a carefully drawn, random sam-ple of the population was given standard pul-monary function tests and a standard ques-tionnaire for respiratory symptoms. InBerlin, the sulfation rate for August andSeptember 1960 averaged 426.0 pg/ 100 cm2-day while in Chilliwack the sulfation con-centration for August and September 1963averaged 50.3 pg/100 cm2-day. This was con-verted to an equivalent sulfur dioxide valuefor Berlin of 35 µg /m3 (0.012 ppm) * basedon readings for one station. No informationis provided to show how the Chilliwack sul-fation values were converted to an SO2equivalent of 2.85 pg / m" (0.001) .* Soilingvalues were virtually identical; coh valuesaveraged 0.5 for Berlin and greater than0.5 for Chilliwack. The prevalence of chronicrespiratory disease was initially greater inBerlin, but adjustments for differences inage and in cigarette smoking eliminated allthe differences in prevalence. However, evenafter correction for age, height, sex, andsmoking habits, the Berlin residents hadslightly lower results on pulmonary func-tion tests (FEV1.0 and Peak Expiratory FlowRate) . This difference might be due to thedifferent climates, or to a slightly lower so-cioeconomic class in Berlin, or to ethnic dif-ferences between the two towns, or to occu-pational exposures. There were also studiescomparing areas within Berlin, and no dif-ference in respiratory symptoms or pulmo-nary function could be found between an
area where the sulfation rate averaged 610pg/ 100 cm2-day (2-month period) and an-other area of the town averaging 255 14/100cm2-day for the same period.52, 53, 55. As inthe two-town study, the disease rates in thetwo areas of the town were strongly affectedby differences in the proportions of the popu-lations who were cigarette smokers. Theauthors correctly note the limited possibilityof ascertaining effects, due to the very lowpollution values and the movement of peoplewith respiratory disease to the even less pol-luted areas of Berlin.
A study 56 comparing two areas exposedto pollution from a single source was under-taken in the Seward-New Florence area ofPennsylvania. The sulfation rate was 6.2times greater in Seward (3.7 mg S03/100cm2-day) than in neighboring New Florence,while suspended particulate matter concen-trations were 1.4 times greater. These were151 pg / m" and 109 pg / m" respectively. Dur-ing the study period from October 1959 toApril 1960, the average 24-hour SO2 meas-urement was 255 pg / m" (0.09 ppm) * inSeward, compared to less than 30 µg /m3(0.01 ppm) in New Florence, both by theWest-Gaeke method. Slightly higher valuesfor airway resistance were found in Sewardeven after correcting for differences inheight and age. No adjustment was madefor other factors which may have affectedairway resistance, such as smoking and oc-cupation. The difference in body height isalso difficult to interpret.
The Nashville air pollution study reviewedtotal morbidity in relation to air pollution."The morbidity data were obtained by trainedinterviewers in a questionnaire survey ofsample households in the city. The aerometricdata used for the survey were the same asthose used for the morbidity study. An areaof "high" SO. concentration was defined asone which had a geometric mean annual 24-hour level of 30 pg / m" (0.01 ppm) or more.The "low" SO2 area had 15 µg /m3 (0.005ppm) or less. The high sulfation area had0.351 mg S03/100 cm2-day or more as anannual geometric mean. Areas of high, mod-
** SO2 values in this study were originally reported * SO2 values in this study were originally reportedin parts per billion (ppb). in ppm.
134

erate, and low pollution were also defifined bysoiling index, annual dustfall, and suspendedparticulate matter. As expected, when thedata were analyzed by socioeconomic class,higher illness rates were reported from thelower class households, and there was astrong tendency for persons of lower socialclass to be resident in areas of high air pollu-tion.
Since only the large middle class werepresent in all pollution zones, analyses con-trolled for socioeconomic status were limitedto it. A direct correlation between illnessrates from all causes and pollution could notbe shown with any consistency except forpersons 55 years and older (both sexes). Adecline in morbidity rates from high to lowpollution areas could be shown for this groupwith the soiling index and SO2 concentrationsas pollutant variables, but no consistent de-cline with sulfation, dustfall, or suspendedparticle concentrations was seen. There wasno correlation between pollution indices andmorbidity rates for cancer, respiratory, orgastrointestinal diseases. Attempts weremade to minimize the effect of occupationalexposure by studying females keeping house.In this group, a small but consistent gradientin illness from all causes correlated with airpollution indices. No consistent findings couldbe found for working females from all socialclasses combined. Because of the possiblewide variations within the large group called"middle class," the study may not have takensocioeconomic status wholly into account. Thelack of information on cigarette smoking isanother deficiency. The morbidity differencesthat are shown are most striking between the"high" pollution group versus the "moderate"and "low."
d. MorbidityIncapacity for WorkDohan 57 5' compared respiratory morbid-
ity in hourly employees in five United Statescities by use of insurance and personnel sta-tistics of a large electronics company. Hourlyemployees received insurance payments afterthe seventh day of illness provided that aphysician's certificate was received. For the 3study years, the respiratory absentee ratesshowed a direct relationship to suspendedparticulate sulfates. The latter concentra-tions ranged from a low of 7 p.g/m3 in Cin-
cinnati to about 14 µg /m3 in Camden andWoodbridge, New Jersey, and in Indianapo-lis, to a high of 20 p,g/m3 it.' Harrison, NewJersey. A breakdown by type of respiratorydisease showed miscellaneous respiratory in-fections, influenza, and bronchitis to be mostdirectly related to the sulfate levels ( see Fig-ure 9-4). Pneumonia, asthma, and sinus dis-ease were not significantly correlated. Theincidences of gynecologic problems, urinarytract disease, and appendicitis were not re-lated to several indices of air pollution, in-cluding sulfate; nonoccupational accidentsdid, however, increase progressively withsulfate, as did, the respiratory diseases. Inaddition, neuropsychiatric diseases werehighest in the three cities with highest pollu-tion indices. The correlation between all in-dices of air pollution and accidents and men-tal illness may indicate that secondary ef-
90cc<w>" 80
W..1
< 702WLL
p, 605.
sj 50
<ci)
c.)1 40
wU)<w 30U)
020
cc0I<cc 10F.ci)
w 0cc0 5 10 15
SULFATES pg / m3
20
Figure 9-4. Incidence of Respiratory Disease LastingMore than Seven Days in Women VersusConcentration of Sulfates in the City Airat Test Sites.54
The incidence of respiratory disease lasting more thanseven days in this group is directly related to concen-trations of suspended sulfates in the cities shown.
135
25

fects of air pollution, such as reduced visibil-ity and gloomy weather, have a measurableeffect on health and welfare, or that the re-sults are too nonspecific to attach causalsignificance.
Age differences were rather marked amongthe cities, yet age standardized rates were notcalculated. Without detailed calculations it isnot possible to state whether differences suchas only 0.2 percent of the Cincinnati womenbeing over age 45 compared to 35 percent ofCamden, New Jersey, women would signifi-cantly affect the rates. Differences in socialclass and standard of living were probablynot great, since all subjects were hourly em-ployees of the same company. Differences inpatterns of illness reporting and acceptabil-ity of different diagnoses within each city aredifficult to assess, but presumably were mini-mized by limiting the study to absences of 8days and more. Other possible differences,such as weather and climate in the cities,exposure to toxic materials, plant morale, andair conditioning were discussed by the au-thors and judged by them not to be of majorimportance. No data are available on differ-ences in cigarette smoking, or plant rules re-garding smoking at work, in the differentlocations. A unique and strong factor of thisstudy is that other pollutants such as totalsuspended particlate matter, benzene-solubleorganics, and certain trace metal concentra-tions did not correlate with the respiratorydisease rates. The findings of this study needto be confirmed.
During 1961-1962 a study of the incidenceof incapacity for work was conducted by theBritish Ministry of Pensions and NationalInsurance.59 The population covered was rep-resentative of the working population ofEngland and Wales. Rates of sickness ab-sence for bronchitis, influenza, arthritis, andrheumatism were related to indices of pollu-tion. There was a significant correlation be-tween bronchitis incapacity in middle-agedmen (35 to 54) and the average seasonal (Oc-tober through March) levels of smoke andsulfur dioxide in high-density residential dis-tricts, based on 24-hour measurements. ForGreater London, there was a significant cor-relation between bronchitis incapacity andboth smoke and sulfur dioxide for all ago
136
groups taken together, and for men aged 35to 54 and.55 to 59. It is interesting that therewas also more incapacity from arthritis andrheumatism in areas having heavy smoke pol-lution. Influenza incapacity was greater inthose areas with higher pollution levels overGreat Britain as a whole but not within theGreater London conurbation, nor was therein this latter area any association betweenpollution and psychosis or psychoneurosis.The lowest bronchitis inception rates relatedto smoke levels between 100 µg /m3 and 200µg /m3 and to sulfur dioxide concentrationsbetween 150 µg /m3 and 250 µg /m3 (0.053ppm and 0.081 ppm). The highest values re-lated to concentrations of 400 µg /m3 smokeand 400 µg /m3 (0.14 ppm) sulfur dioxide.
Burn and Pemberton 35 compared areas ofhigh and low pollution in Salford, England.Pollution data were obtained from five stand-ard D.S.I.R. instruments operating for 2years, 1958 and 1959. The aerometric datawere obtained for 24-hour periods. Averagedaily sulfur dioxide concentrations during thewinter months in the more polluted areaswere approximately 715 p. g/m3 (0.25 ppm) *compared to 285 p.g/m" (0.10 ppm) in thecleaner areas (measurement method notclear). Smoke pollution was also considerablyhigher in the polluted areas. Bronchitis mor-bidity, as measured by incapacity certificatesfrom the Ministry of National Insurance,was higher for the study group (men aged45 to 64) in the polluted areas.
Brasser et al.7 have reanalyzed the Salforddata without indicating why this reanalysiswas necessary. They prepared new isoplethsand concluded that the correlations betweenabsenteeism for bronchitis and pollutionlevels are considerably higher than originallywas presumed by the investigators them-selves. The population 45 to 64 used for de-nominators of the rates had to be estimatedby assuming that each district had the sameproportion in that age group as the town asa whole. In addition, large differences insocioeconomic class probably existed betweenthe areas, but no adjustments were possible.Differences in occupation may also have af-
* SO2 values in this study were originally reportedin pphm.

fected incapacity rates. No data on cigarettesmoking were available.
.lesults obtained in The Netherlands haveals0 shown that when the SO, concentrationrose for 3 to 4 days from about 300 yg/m3 to500 .ug/m3 [0.11 ppm to 0.19 ppm]'`, absen-teeisn at both Rotterdam and Vlaardingenincrosed by at least 30 percent; in certaingrours (e.g., those over 45 years of age) theincrease was as large as 50 percent to 100percel',t.7
Ver:;.na et al." presented information on ill-ness absences in relation to air pollution. Ill-ness Eta for the employees (males and fe-males, 4ges 16 through 64) of a metropolitanNew York insurance company were obtainedthroug1 the records of the personnel depart-ment. They included medical history, X-rayinformation, and laboratory results obtainedby the 11,,edical department of the company,and were classified by absences due to respi-ratory ill qess and to nonrespiratory illness.Mean daDy concentrations of air pollutantsand meteciTologic data were secured from themonitoring system of metropolitan NewYork: smoke shade, sulfur dioxide, and car-bon monoxide content were reported. Thedata for the 2 years, 1965 and 1966, wereexamined Aatistically and several conclu-sions were Leached. There was a strong timedependence 'and a yearly cyclical behavior;when these ''.actors were removed there re-mained wo trong positive relationship be-tween respiratory absence and the pollutionvariables studied. Respiratory illness absencerates were at their highest level when sulfurdioxide and ..,rnoke shade levels were bothhigh on cool dPys; and a lag effect for respira-tory absences was not noted.
3. studies of ChildrenComparisons ;of the prevalence of respira-
tory disease in areas of varying pollutionlevels have been made to delineate the roll ofair pollution and specific pollutants. A prob-lem common to a11 the studies is the difficultyin guaranteeing that the areas are similar
* The numbers in bnIckets are the editor's; an equiv-alency of 2,700 4 /m3=1 ppm SO2 was used toassure consistency ;with any conversions made bythe authors.
(except for air pollution) in all factors thatmight affect the prevalence of disease.
Because studies on adults tend to be com-plicated by smoking habits, changes of oc-cupation, and changes in address over a per-iod of years, several studies have been di-rected at effects of air pollution on schoolchildren. The advantages of using childrenfor research on the primary etiologic effectsof air pollution was first noted several yearsago;"' Anderson has most recently reaffirmedthis view." A major element of concern isthat deleterious effects on the respiratorysystem of very young children may have aneffect on the subsequent evolution of thechronic bronchitis syndrome in the adultPopulation.
The relationships of respiratory infectionsin children to long-term residence in specificlocalities have been studied in England byDouglas and Waller. "_ Levels of air pollution,in terms of domestic coal consumption rec-ords, were used to classify four groups; theauthors include an evaluation of the validityof this method at the end of their report. Thehistories of 3,866 children born during thefirst week of March 1946 were followed until1961, when the children were 15 years of age.Social class composition of these children didnot differ significantly from area to area.Measured concentrations for smoke and forSO, in 1962 and 1963 were compared withthe earlier prediction of pollution intensitybased on the coal consumption data, and in-dicated an overlap for greater London areaof low and moderate groupings; for otherareas, the predicted gradient of concentra-tions was affirmed. Sulfur dioxide variedfrom about 90 µg /m3 (0.031 ppm) in the"very low" group to about 250 IA g/m" (0.087ppm) in the "high" pollution group. Becauseof the age of the subjects, smoking was ap-parently not considered in this evaluation.In 1965, 19 percent of the boys and 5 percentof the girls, aged 11 to 13, smoked at leastone cigarette a week regularly."3
In the Douglas and Waller study, the gen-eration of pollutants in the indoor home en-vironment (e.g., by heating and cooking) wasnot considered. Interviews were conductedwith the mothers when the children were 2and 4 years of age; information was obtained
137

about upper and lower respiratory illness andrecorded hospital admissions for these andother causes. Data about colds, coughs, andhospital admissions were also gathered byschool doctors at medical examinations whenthe children were 6, 7, 11 and 15 years of age.Between the ages of 6-1/4 and 10-1/4, specialrecords for causes of school absence exceed-ing one week were reviewed with the moth-ers. Families numbering 3,131 remained inthe same pollution area throughout the first11 years of this study. The conclusions of thestudy were that upper respiratory tract in-fections were not related to the amount ofair pollution, but that lower respiratory tractinfections were. Frequency and severity oflower respiratory tract infections increasedwith the amount of air pollution exposure,affecting both boys and girls, and with no dif-ferences detectable between children of mid-dle class and working class families. This as-sociation was found at each of the examina-tion ages, including age 15. At age 15, per-sistence of rales and rhonchi (chest noise) ,
possibly the prodrome of adult chronic respir-atory disease, was some 10-fold less in thevery low pollution area, and a factor of 2 lessin the low pollution area than that in thehigh pollution area. If the 1962-1963 meas-ured concentrations for smoke and SO., cantruly be extrapolated to the 15-year respira-tory illness survey, then these British schoolchildren experienced increased frequency andseverity of lower respiratory diseases in as-sociation with annual mean smoke concentra-tions ranging above 130 µg /m3 and SO2above 130 µg /m3 (0.046 ppm) .
The lower respiratory tract findings ofDouglas and Waller were confirmed in astudy by Lunn et al." The patterns of respi-ratory illness in school children of the agegroup 5 to 6 were studied by them with refer-ence to residence in four areas of Sheffield.The data were collected during the summersof 1963, 1964, and 1965 in order to minimizeeffects of winter respiratory illness upon thepulmonary function tests. Mean daily smokelevels measured in each of four areas rangedfrom 97 µg /m3 in the "low" area to 301 µg /m3in the "high" area. SO2 concentrations wererespectively 123 jug / m" (0.043 ppm) , 181µg /m3 (0.063 ppm) , 219 µg /m3 (0.077 ppm) ,
138
and 275 p.g / m" (0.096 ppm) in the four areas,during 1963-1964. Somewhat lower smokelevels were noted the following year, al-though the gradient between the districtswas preserved. However, the sulfur dioxidevalues were obtained at five schools betweenOctober 1965 and May 1966 inclusive. Thevalues were 109 µg /m3 (0.038 ppm) and 134µg /m3 (0.047 ppm) corresponding to the"low" pollution area, and then 194 µg /m3(0.068 ppm) , 241 µg /m3 (0.085 ppm) , and304 µg /m3 (0.11 ppm) respectively. Question-naire of the parents, physical examination,observation for the presence of nasal dis-charge, examination of the eardrums, andrecording of both the forced expiratory vol-ume in 0.75 seconds (FEV.75) and the forcedvital capacity (FVC) , were completed duringeach of the summer terms of 1963, 1964, and1965. Several socioeconomic factors werecompared for the various districts; smokingwas appropriately disregarded for this agegroup; internal home environments, or differ-ences in home heating systems, were not re:ported. The authors conclude that there is anassociation between the levels of atmosphericpollution and chronic upper respiratory infec-tions (as indicated by mucopurulent nasal dis-charge, history of three or more colds yearly,or scarred or perforated eardrum) . Further,lower respiratory tract illness (measured byhistory of frequent chest colds or episodes ofbronchitis or pneumonia) was similarly as-sociated. Functional changes, in the form ofreduced FEV0.7, ratios emerged where therewas a past history of pneumonia or bron-chitis, of persistent or frequent coughs, or ofcolds going to the chest. There appeared,therefore, to be a persistence of respiratorydysfunction, even in the absence of high-pollution extant at the time of the functiontesting. This study clearly demonstrated theassociation between respiratory illness in in-fant school children and atmospheric pollu-tion. The lowest "effect" level for smoke andSO., was not clearly indicated by this study,but the increased association of "respiratoryinfections" in school children was detectedin areas whose mean daily figures exceededabout 100 µg /m3 for smoke and 120 µg /m3(0.042 ppm) for SO2.
A study for Manzhenko 65 of upper respi-

ratory tract conditions in school children inIrkutsk is difficult to relate to the Sheffieldstudy. However, the higher incidence of res-piratory tract conditions and the undefinedabnormal X-ray findings in these children'slungs are disturbing evidence of the possi-bility of an association between serious res-piratory disease and residence in a pollutedcommunity.
Toyama 45 studied two groups of schoolchildren, 10 to 11 years old, in Kawasaki,Japan. Sulfation rates at the school in themore polluted area varied from 0.5 to 1.9and averaged 0.9 mg/100 cm2-day Pb02; nosulfation rates were given for area of lowerpollution. The children from the more pol-luted area had a higher frequency of non-productive cough, irritation of the upper res-piratory tract, and increased mucus secre-tion. The dustfall rate was considerablylower in the less polluted area except for anoccasional month when the dustfall in thetwo areas was almost equal. Whether theeffect was due to oxides of sulfur or particu-late matter cannot be determined from thisstudy.
4. Studies of Pulmonary Function
Spicer et al."" studied a group of patientswith chronic obstructive airway disease whoresided in a small area of downtown Balti-more. Air samplers were placed at the resi-dential area and at the University, whereextensive pulmonary function tests were per-formed. The patients became better or worsein their pulmonary function as a group, sug-gesting that they were influenced by a fac-tor in their common environment. It wasnot, however, possible to determine a simplecause and effect relationship with any onepollutant. Subtle changes in the pollutantconcentrations and weather conditions mayhave been responsible.
Shephard et al."' studied a group of 10cardiac cripples who were confined to theirhomes. Air pollution measurements werecarried out by sampling equipment placedinside the homes. Pulmonary function testswere repeated at the same hour of the day,3 times weekly, for 2 months. Althougha response to suspended particulate pollutionwas demonstrated, no consistent changes in
pulmonary function were noted with sulfurdioxide levels, measured as total gaseousacid (sic). During one inversion period, a6-hour average of sulfur dioxide concentra-tions (hydrogen peroxide titremetric meth-od) reached 460 µg /m3 (0.16 ppm)*. Theindoor readings were considerably lower, thehighest indoor concentration being sustainedfor 6 hours.
Holland et al." report decreased perform-ance of the FEV,.,, test in London and Britishrural outside telephone workers comparedwith their American counterparts. For bothgroups the FEV was further decreased inrelation to smoking intensity. FEV differ-ences within the United Kingdom workers(i.e., London versus rural) , may be relatedto an appreciable extent to the sulfur di-oxide concentrations accompanying the par-ticulate levels. A more detailed discussionof the study appears in Section C.
Toyama 45 reported measurements of peakflow rate and total vital capacity perform-ance in Japanese school children in areasof differing air pollution measured monthly;fluctuations. were observed in the mean peakflow rates of children attending schools andliving in polluted industrial areas, and thevariations were smaller for children incleaner areas. Total vital capacity was notsignificantly different among pupils of thevarious schools. There was a substantial dif-ference in peak flow rates between the twoschool districts at times of highest pollution.When pollution values were lowest, the dif-ferences were less. Monthly dustfall was15 to 70 tons/km2-mo* in the more pollutedareas; lead peroxide candle sulfation ratesfrom month to month ranged from 0.5 to 2mg S03/100 cm= -day in the higher pollutedarea.
In Osaka, Watanabe 22 studied the peakflow rate and vital capacity performances ofchildren in schools enduring differing airpollutant concentrations. It was noted thatindividual peak flow rates were more mark-edly decreased in the winter months (Sep-tember to December 1963) for the school
* SO, values in this study were originally reportedin ppm.In the United States, dustfall is measured intons/mi2-mo.
139

in the highly polluted area than for the schoolin the low pollution area. Daily mean con-centrations of both dustfall and sulfur di-oxide concentrations were twice as great inthe polluted area as in the unpolluted area.
In the paper by Lunn et a/.64 Sheffieldschool children were shown to have reducedFEV 0.75 and FVC ratios in the area of high-est pollution. The measurements were madeduring the summer, when pollution levelswere low and apparent incidence of acuterespiratory infection was diminished, sug-gesting, in contrast to the Japanese studiesreferred to above, that there may be per-sistence of the respiratory function deterio-ration in relation to residence in the areaof high pollution. Mean daily averages meas-ured at a single station were: smoke, 300pg/m3; SO2, 275 pg/m3 (0.096 ppm) . In thePort Kembla study 46 mentioned in SectionC-2c of this chapter, no significant differ-ences in pulmonary function were notedwhich could be attributed to air pollution.
The studies relating morbidity and deteri-oration in pulmonary function to particulatelevels cover effects which are also includedin Level III of the World Health Organiza-tion's "guides to air quality."25
5. Studies of Panels of Bronchitic PatientsLawther " related several episodes of acute
urban pollution to a worsening of conditionin a group of bronchitic patients, well studiedin a registry at St. Bartholomew's hospitalin London. Changes in their symptomatologywere recorded in a daily diary, and acuteworsening in significant numbers of thegroup was associated with daily rises in airpollution above 300 pg/m3 of smoke and 600pg/m3 (0.21 ppm) of sulfur dioxide. Fig-ure 9-5 shows graphically the effects ob-served on 29 bronchitic patients of high pol-lution levels in January 1954.
Angel et al." reviewed the occurrence ofnew respiratory symptoms in men workingin factories and in offices, most of whomhad prior evidence of chronic bronchitis.The study group of 85 men, observed throughthe winter of 1962-1963, was selected froma group of 1,000 men, age 30 through 59,without apparent classification of eithersmoking patterns or possible occupational or
140
MEAN5045
TEMP °F 4035
2.01.8
SMOKE 11:6
1.21.00.80.60.4
NUMBEROF 8
PATIENTS 4WORSE 0
4BETTER 8
16 17 18 19 20 21 22
RH
JANUARY 1954
10090 RH80 PERCENT7060
0.60.50.40.30.20.1
Figure 9-5. Effect on Bronchitic Patients of HighPollution Levels (January 1954).65,68
SO2ppm
The figure represents the effect on bronchitic patients ofincreased pollution levels; patients stated whether theyregarded their condition as "worse" or "better".
residential exposure differences. Increasedsputum production, deterioration of pulmo-nary function performance (FEV1.(,) , andthe more frequent occurrence of respiratorysymptoms classified as "upper" (coryza, in-fluenza, and acute respiratory disease) , and"lower" (chest colds, bronchitis, wheezy at-tacks, pneumonia) , were all associated withincreases in both smoke and sulfur dioxideconcentrations. There was frequently diffi-culty in defining an exacerbation of diseasein those individuals already experiencingchronic bronchitis. During this period, ill-ness peaks (attack rate) may have occurredwith weekly mean concentrations of smokeexceeding 400 pg/m3 and of sulfur dioxideexceeding 460 µg /m3 (0.16 ppm )*; weeklymean concentrations were calculated usingthe highest daily mean occurring each weekat each of 13 locations in the area.
Carnow et al." studied over 500 patientswith respiratory disease in Chicago during
* SO: values in this study were originally reportedin ppm.

25
5
0
697 I 970 I 908 I 607 I 360, I 158 I 98TOTAL PERSON DAYS
13.6% 17.1% 18,7% 18.2% 18.6% 22.1% 26.5%
1
0.05 0.10 0.15 0.20 0.25 0.30 0.30 +CONCENTRATION, ppm
Figure 9-6. Comparison of Person-Days of Acute Illnesswith Seven Levels of Sulfur Dioxide Exposurein Chicago, in Patients with Severe ChronicBronchitis (Age 55 or More), for October-November, 1967.
There is an increase in illness for bronchitics over age 55with increase in sulfur dioxide concentrations. The re-lationship is with 24-hour SO2 levels on the day priorto illness.
the winter of 1966-1967. Semidaily aver-ages of sulfur dioxide (West-Gaeke Method)were computed from eight continuous moni-toring stations in Chicago for the hours of6 a.m. to 6 p.m., and for 6 p.m. to 6 a.m.Pollution by particulate matter was alsopresent but not analyzed in this report; thegeometric mean for particulates in Chicagoduring 1964-1965 was 148 pg/m3, accordingto the National Air Surveillance Network(NASN) data." The semidaily averageswere used to estimate the 24-hour averageconcentrations of sulfur dioxide to whichthe patient was exposed at work and at home.The chronic bronchitics were divided intotwo groups according to the severity of theirdisease, and the analyses were kept separate
for the two groups. For patients age 55 andover with severe bronchitis, a significantassociation was demonstrable between thelevel of sulfur dioxide and person-days ofillness. The differences in illness rates inthis group for different levels of exposurewas most marked for disease on the dayfollowing exposure. A marked rise in illnessrate was noted for patients exposed to 715µg /m3 (0.25 ppm) * of sulfur dioxide ormore. (See Figure 9-6.)
For patients under 55, no differences inillness were noted with exposure, except forthe group exposed to 860 µg /m3 (0.30 ppm)or more of sulfur dioxide.
For the patients with mild bronchitis, ill-ness was not related to air pollution in thoseage 55 or more, while those under age 55seem to be worse when exposed to more than860 µg /m3 (0.30 ppm) SO2. These analysesindicate that groups of persons exposed tohigher levels of sulfur dioxide tend to experi-ence higher rates of acute respiratory dis-eases. However, the group with higher res-piratory illness rates could merely happen tolive in the more polluted areas. The situa-tion is similar to the findings of most epi-demiologic studies which indicate that per-sons of low social class tend to have highillness rates and also tend to live in morepolluted areas. In an attempt to eliminatethis class-site factor, further analyses weretherefore carried out for the same groupsof patients, but this time for single months,using each patient as a control against him-self. For each patient, the difference betweenhis mean exposure to SO2 on days of illnessand on days of no illness was computed. Theonly significant differences were for thoseage 55 and over with severe bronchitis; nostatistically significant differences were de-monstrable for the other groups. This tendsto show that the association for mild bron-chitic in the younger age group mentionedabove was more likely due to another factor.
An association between sulfur dioxide con-centration and illness ratio in only one agegroup could be regarded as a chance happen-ing. Yet the elderly patient with severe
* SO2 values in this study were originally reportedin ppm.
141

chronic bronchitis would appear to be espe-cially susceptible, since this group is alsoheavily involved in the excess deaths of acutepollution episodes in London and New York.Accordingly, it seems reasonable to infer, asthe author did, that there is in all likelihoodan effect of high daily levels of sulfur diox-ide on older patients with advanced bron-chitis; this effect is one of precipitating ill-ness and of exacerbating symptoms. Thetechnique used in this study of developing apersonal pollution index estimated for eachpatient with regard to his place of employ-ment and residence adds confidence to theauthors' analysis.
An increase in respiratory symptoms wasnoted among elderly emphysematous indi-viduals in a rest home in the Ruhr area dur-ing December 9-13, 1959. The complaintsincluded breathlessness, throat and eye irri-tation, and depression and apathy (withoutfurther specification) . The estimated meanindoor sulfur dioxide concentration was 540µg /m3 [0.20 ppm] * for 24 hours. Althoughthe method of measurement was not speci-fied, it probably was the Woesthoff method.For the same period, at an estimated 24-hourindoor sulfur dioxide concentration of 270pg/m3 [0.10 ppm]* for 4 days, there was anincrease in functional disturbance.7. 8, 73
Patients with preexisting chronic respira-tory disease in general seem to have an exa-cerbation of their symptoms when the sulfurdioxide level exceeds 600 pg / M3 (approxi-mately 0.2 ppm) for 24 hours or more in thepresence of a substantial amount of unmeas-ured particulate pollution.
6. Miscellaneous StudiesAlthough the major action of sulfur ox-
ides has been assumed to be by surface con-tact on the mucous membranes of the res-piratory system, the possibility of effects onthe total body system (systemic effects)must be considered. Sulfur dioxide is ab-sorbed into the blood stream and may pro-duce subtle effects on other organs. A fewof the studies mentioned previously have sug-
* The numbers in brackets are the editor's; an equiv-alency of 2,700 pg/m3= 1 ppm SO2 was used to as-sure consistency with any conversions made by theauthors.
142
gested that sulfur oxides are a cause of sev-eral kinds of illness, rather than respiratoryillnesses alone. Even if it is assumed thatsulfur oxides are a cause of these results,the effect observed may be secondary to res-piratory tract irritation, or indeed, to er-rors in diagnostic classifications.
Reports from Czechoslovakia 74 75 suggestthat sulfur oxides may have an influenceon blood formation in children. However, nodetails or supporting data for their conclu-sions are given.
Elfimova et a1.76 " compared "biochemicalblood tests" in areas enduring an averageof 2,000 µg /m3 (0.70 ppm) SO2 with an areahaving an average of 830 µg /m3 (0.29 ppm) .
Sulfur dioxide could be detected in a muchlarger proportion of blood samples from sub-jects in the polluted districts than in thosefrom subjects in the clean district. Ascorbicacid levels were also measured and presum-ably were lower in the polluted area, but thetwo published versions seem to have con-flicting values. At best, these studies indicatea need for further research, probably in thelaboratory, and are not yet sufficiently de-scribed to warrant their utilization in airquality criteria.
Yanysheva 78 found an excess of respira-tory disease, anemia, and rickets among Rus-sian children living in a highly polluted area(13,300 µg /m3 to 33,000 p, g/m3, or 4.6 ppmto 11.5 ppm) * compared to a control area.Epidemiologic methods and bias factors suchas social class are not well described, al-though the types of anemia reported are thesame as mentioned above. Sulfur dioxidelevels in these three studies are extremelyhigh even in the "clean" areas, and possiblysome error has been made in reporting (oranalysis of SO2) , although Yanysheva de-scribes symptoms of respiratory disturb-ances and material damage that would, infact, indicate very high levels.
D. EFFECTS OF INDUSTRIALEXPOSURE
Studies of workers occupationally exposedto pollutants provide a unique opportunity to
* SO2 values in this study were originally reportedin mg/m8.
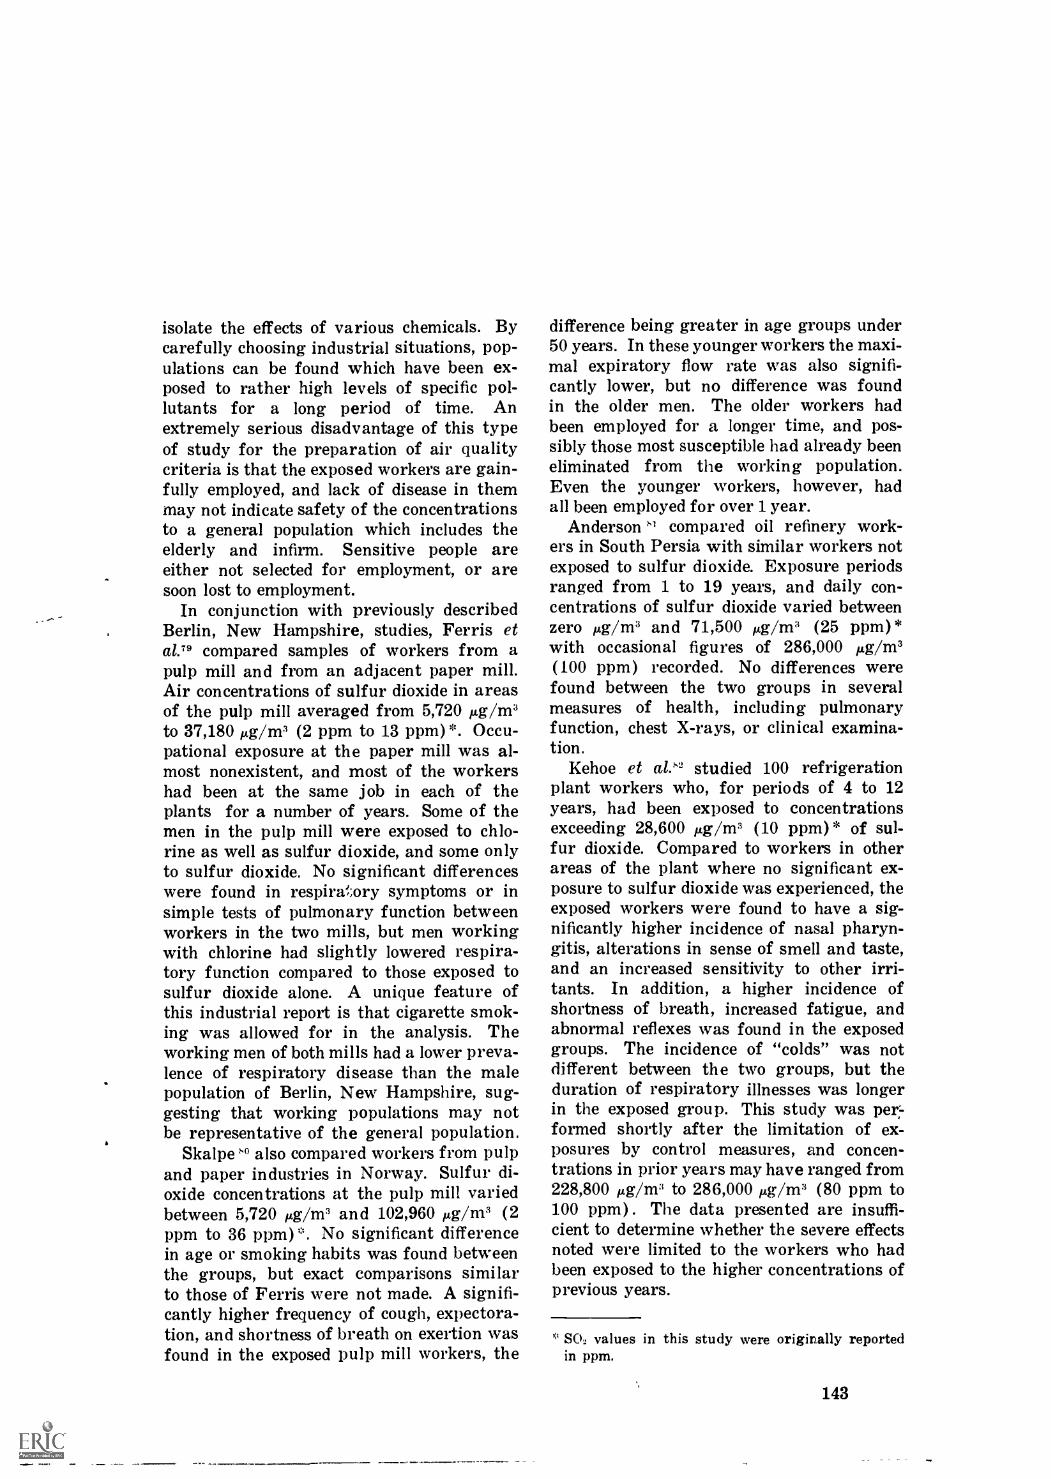
isolate the effects of various chemicals. Bycarefully choosing industrial situations, pop-ulations can be found which have been ex-posed to rather high levels of specific pol-lutants for a long period of time. Anextremely serious disadvantage of this typeof study for the preparation of air qualitycriteria is that the exposed workers are gain-fully employed, and lack of disease in themmay not indicate safety of the concentrationsto a general population which includes theelderly and infirm. Sensitive people areeither not selected for employment, or aresoon lost to employment.
In conjunction with previously describedBerlin, New Hampshire, studies, Ferris eta1.79 compared samples of workers from apulp mill and from an adjacent paper mill.Air concentrations of sulfur dioxide in areasof the pulp mill averaged from 5,720 µg /m3to 37,180 µg /m3 (2 ppm to 13 ppm) *. Occu-pational exposure at the paper mill was al-most nonexistent, and most of the workershad been at the same job in each of theplants for a number of years. Some of themen in the pulp mill were exposed to chlo-rine as well as sulfur dioxide, and some onlyto sulfur dioxide. No significant differenceswere found in respiratory symptoms or insimple tests of pulmonary function betweenworkers in the two mills, but men workingwith chlorine had slightly lowered respira-tory function compared to those exposed tosulfur dioxide alone. A unique feature ofthis industrial report is that cigarette smok-ing was allowed for in the analysis. Theworking men of both mills had a lower preva-lence of respiratory disease than the malepopulation of Berlin, New Hampshire, sug-gesting that working populations may notbe representative of the general population.
Skalpe ''() also compared workers from pulpand paper industries in Norway. Sulfur di-oxide concentrations at the pulp mill variedbetween 5,720 µg /m3 and 102,960 µg /m3 (2ppm to 36 ppm)*. No significant differencein age or smoking habits was found betweenthe groups, but exact comparisons similarto those of Ferris were not made. A signifi-cantly higher frequency of cough, expectora-tion, and shortness of breath on exertion wasfound in the exposed pulp mill workers, the
difference being greater in age groups under50 years. In these younger workers the maxi-mal expiratory flow rate was also signifi-cantly lower, but no difference was foundin the older men. The older workers hadbeen employed for a longer time, and pos-sibly those most susceptible had already beeneliminated from the working population.Even the younger workers, however, hadall been employed for over 1 year.
Anderson " compared oil refinery work-ers in South Persia with similar workers notexposed to sulfur dioxide. Exposure periodsranged from 1 to 19 years, and daily con-centrations of sulfur dioxide varied betweenzero µg /m3 and 71,500 µg /m3 (25 ppm)*with occasional figures of 286,000 µg /m3(100 ppm) recorded. No differences werefound between the two groups in severalmeasures of health, including pulmonaryfunction, chest X-rays, or clinical examina-tion.
Kehoe et a/2.2 studied 100 refrigerationplant workers who, for periods of 4 to 12years, had been exposed to concentrationsexceeding 28,600 µg /m3 (10 ppm) * of sul-fur dioxide. Compared to workers in otherareas of the plant where no significant ex-posure to sulfur dioxide was experienced, theexposed workers were found to have a sig-nificantly higher incidence of nasal pharyn-gitis, alterations in sense of smell and taste,and an increased sensitivity to other irri-tants. In addition, a higher incidence ofshortness of breath, increased fatigue, andabnormal reflexes was found in the exposedgroups. The incidence of "colds" was notdifferent between the two groups, but theduration of respiratory illnesses was longerin the exposed group. This study was per'-formed shortly after the limitation of ex-posures by control measures, and concen-trations in prior years may have ranged from228,800 µg /m" to 286,000 µg /m3 (80 ppm to100 ppm) . The data presented are insuffi-cient to determine whether the severe effectsnoted were limited to the workers who hadbeen exposed to the higher concentrations ofprevious years.
* SO2 values in this study were originally reportedin ppm.
143

Thus the industrial exposures suggest thatno significant effect on health or pulmonaryfunction can be noted at exposures up toabout 5,700 µg /m3 (2 ppm) for the workinghours of the day over a period of severalyears. In these situations there is a lack ofa demonstrable effect of exposure to rela-tively pure sulfur dioxide at concentrationsthat are well above those implicated in am-bient exposures. However, as noted previ-ously, studies of occupational exposure haveseverely limited value for the preparationof ambient air quality criteria.
The effects on both morbidity and mortal-ity demonstrated for community exposuresare probably a result of the synergism of thesulfur dioxide and the suspended particulatesfound in the ambient atmosphere rather thanthe effects of either pollutant alone. The dataregarding the industrial exposures are sum-marized in Table 9-3.
E. SUMMARY
This chapter reviews epidemiologic studiesof the relationship between pollutant con-centrations and their effects on health. In-dices varying from disturbance of lung func-tion to death are considered. .
In considering levels of pollution at which
health effects occur, concentrations are givenin the original units employed since conver-sion from one method to another is not recom-mended. Attention must also be given to theaveraging time employed in the original ob-servation; because of the typical log-normaldistribution of sulfur oxide concentrations,long-term averages are considerably lowerthan short-term averages in the same lo-cations.
Short-term exposure to sulfur oxides mayproduce symptoms and illness in otherwisehealthy people, but the magnitude of the ef-fects and concentrations necessary to pro-duce the effects is not well defined, and ex-posures are generally substantially higherthan the levels cited in the epidemiologicstudies.
Over the years, a number of acute airpollution episodes have been reported inthe United States and abroad. Both oxidesof sulfur and particulate matter have con-tributed significantly to the health effectsassociated with these episodes.
In London, a rise in the daily death ratehas been detected when the concentrationsof sulfur dioxide rose abruptly to levels ator about 715 µg /m3 (0.25 ppm) as meas-ured by the hydrogen peroxide titrimetric
Table 9-3.INDUSTRIAL EXPOSURES
Corn parison Level of Exposure,µg /m` SO2 Effects
Reference
No. Author
Pulp versus paper mill workers 5,700 to 37,000Berlin, New Hampshire
No difference in pulmonary 79 Ferrisfunction or respiratory disease et al.prevalence rates after controlfor cigarette smoking
Pulp versus paper mill workers 5,700 to 103,000;Norway many over 30,000
Excess cough, sputum, andexpectoration under age 50.No effect over age 50.
80 Skalpe
Exposed versus non-exposed oil 0 to 71,500; over No effect on pulmonary function,refinery workers, South Persia 286,000 occasionally chest X-ray or clinical examina-
tion
81 Anderson
Exposed versus non-exposedrefrigeration plant workers,United States
over 28,000;286,000 at times
Increased shortness of breath 82 Kehoeand fatigue and abnormal re- et al.flexes. Longer duration of"colds." No effect on respiratorydisease incidence.
144

method) in the presence of smoke at 750teg/m3. The elderly and patients with heartor lung diseas,? were predominantly affected,but others have also been involved, particu-larly when pollution reached higher levels.Daily concentrations of sulfur dioxide in ex-cess of 1,500 µg /m3 for 1 day (0.52 ppm)in conjunction with levels of suspended par-ticles exceeding 2,000 µg /m3 have resultedin an increase in the death rate of 20 per-cent or more over base line levels.
In New York City, sulfur dioxide concen-trations of 1,500 µg /m3 (0.52 ppm) (asmeasured by the hydrogen peroxide titri-metric method) and suspended particulatematter, measured as a soiling index of 6cohs or greater, have led to increased mor-tality.
In Rotterdam, a 24-hour mean concentra-tion of 500 µg /m3 SO2 (0.19 ppm) (hydro-gen peroxide titrimetric method) lasting for3 to 4 days has led to an increased mortalityrate. This observation is especially signifi-cant because particulate levels are very lowin Rotterdam. Even lower levels of pollu-tion from 300 µg /m3 to 500 µg /m3 SO, (0.11ppm to 0.19 ppm) for 24 hours, are thoughtpossibly to increase mortality.
Morbidity rates have been increased in allepisodes which have resulted in an increasedmortality. Thus, in London, an increase inemergency admissions to hospitals, calls togeneral practitioners, and certified sicknessabsence from work has been noted. In Rot-terdam increased hospital admissions for res-piratory disease, particularly in older per-sons, has occurred when SO, levels have risento 300 µg /m3 to 500 µg /m3 (0.11 ppm to 0.19ppm) ; there has also been an increase inabsenteeism from work which reached 30percent for all ages and 50 percent to 100percent in persons age 45 and ovei.
A survey of emergency clinic visits to ma-jor New York City hospitals in November1953 revealed an increase in visits for upperrespiratory infections and cardiac diseasesin both children and adults in all of the fourhospitals studied. Sulfur dioxide levelsranged between 200 µg /m3 and 2,460 µg /m3(0.07 ppm to 0.86 ppm) during the periodfrom November 12 to 24, and hospital ad-missions had clearly increased by November
16, at which time concentrations had not yetexceeded 715 µg /m3 (0.25 ppm) ; smoke shadeat this time was close to 3 coh units.
The most striking effects have been ob-served in association with exceptional epi-sodes of air pollution. However, lower andmore persistent concentrations are also cor-related with mortality and morbidity. Britishstudies have indicated an association of bron-chitis death rates with air pollution concen-trations that is apparently independent ofsocial class differences, but which also donot specify the role played by sulfur oxides.Instead, these studies treat of a combinationof sulfur oxides and particulates. In onemajor study of Eston, sulfur dioxide valuesfor a year averaged 115 µg /m3 (0.040 ppm)in the dirty area and 74 µg /m3 (0.026 ppm)in the cleaner area. Smoke values were 160µg /m3 and 80 µg /m3 respectively.
In the United States, the Buffalo study in-dicated an effect on chronic bronchitis diseasemortality for men aged 50 to 59 in the lowsocial classes. This finding of air pollutionexerting a special effect on the low socialclasses appears to be consistent with theBritish findings.
A study in Genoa, Italy, made use of house-wives. One of the groups surveyed includedwomen all 65 or more years of age who werenonsmokers, who had lived for a long periodin the same area and who had no industrialexposure.
There was a finding of increased frequencyof cough, sputum, dyspnea, and bronchitisin the moderate-pollution area over the clean-est area. A much sharper difference in fre-quency between the cleanest and the dirtiestarea was found. The cleanest area had anannual mean of 80 µg /m3 (0.028 ppm) ofsulfur dioxide, the mean of the moderatelyclean area was 105 p,g/m3 (0.037 ppm), andthe dirty area averaged 265 µg /m3 (0.093ppm). The measurement of sulfur dioxidewas recorded by a technique analogous to thevolumetric method of the British.
This study also showed a correlation be-tween the frequency of bronchitis and theannual mean of sulfur dioxide levels for theseven districts of Genoa whereas the corre-lation between the frequency of bronchitis
145

and suspended matter and dustfall was notstatistically significant.
In Berlin, New Hampshire, no effect wasobserved for long-term exposure in areaswith sulfation levels averaging 610 /4/100cm2-day. The authors recognized that thelack of results may have been influenced bythe narrow differences in air quality betweenthe areas compared, and they also noted thatthere probably had been a selected migrationof diseased persons to the less polluted areas,which could have affected the results.
Another morbidity study which includedhousewives was that conducted in Nashville.This showed a direct correlation betweenillnesses for all causes for housekeepingwhite females, 15 to 64 years of age, andsulfur dioxide levels. It also showed thatmorbidity from cardiovascular disease in the55 and older age group, for both sexes, wastwice as high in the most polluted area ascompared with the least. However, cigarettesmoking was not taken into account and theadjustment made for socioeconomic statusmay not have been adequate.
The study of Port Kembla, Australia, hadshown differences in respiratory symptomsfor areas which had long-term values of 95pg / in' SO2 (0.034 ppm) and 25 µg /m3 (0.009ppm) measured by absorption in a sulfuricacid solution containing hydrogen peroxide.The study is unusual in that the source ofPollution was the single stack of a smelterand daily averages were up to 17 times theannual mean. However, the findings thatrespiratory symptoms disappeared when pol-lution was reduced through installation of ahigher stack, would appear to confirm aneffect of sulfur dioxide at the concentrationsoriginally measured, provided that no otherchange took place which could account forthe disappearance of symptoms.
The study of school children in Great Brit-ain indicated that they experienced increasedfrequency and severity of respiratory dis-eases when the long-term levels exceededabout 120 µg /m3 (0.046 ppm) and 100µg /m3 for smoke.
Several studies have been noted relatingdaily variations in air pollution with changesin the clinical condition of patients withchronic lung disease. A good deal of infor-
146
mation exists on the effects of exposure tomoderately elevated levels of SO2 lasting aday to 3 or 4 days. A daily average level ofabout 600 µg /m3 of SO2 (0.21 ppm) hascaused accentuation of symptoms in personswith chronic respiratory disease on the dayfollowing the high SO2 level if particulatematter at a similar concentration was alsopresent.
This finding by Lawther was also observedby Carnow in Chicago. He too noticed a sharprise in illness rates on the day following expo-sure to 715 µg /m3 (0.25 ppm) of sulfur diox-ide (West-Gaeke method) or more for pa-tients 55 and over with severe bronchitis.Particulate matter was also present in theatmosphere.
The study of an elderly emphysematouspopulation in a rest home in the Ruhr area ofGermany demonstrated that complaints in-cluding breathlessness, throat and eye irrita-tion, and "depression and apathy withoutfurther specification" increased at estimatedindoor sulfur dioxide concentrations of 540p,g/m3 (0.20 ppm) for 24 hours. There was anincrease in functional disturbance at an aver-age daily level of 270 µg /m3 (0.10 ppm) for4 days, again an estimated indoor level, mea-surement presumably being made by theWoesthoff method.
The analyses of the numerous epidemio-logical studies discussed clearly indicate anassociation between air pollution, as measur-ed by particulate matter accompanied by sul-fur dioxide, and health effects of varying se-verity. This association is most "firm for theshort-term air pollution episodes.
There are probably no communities whichdo not contain a reservoir of individuals withimpaired health who are prime targets forthe effects of elevated levels of particulatematter and sulfur oxides. However, to showsmall changes in deaths associated with coin-cident higher levels of air pollutants requireextremely large populations. In small cities,these small changes cannot be detected sta-tistically.
The epidemiologic studies concerned withincreased mortality also show increased mor-bidity. Again, increases in morbidity as mea-sured, for example, by increases in hospitaladmissions or emergency clinic visits, are

most easily detected in major urban areas.It is believed that, for the large urban
communities which are routinely exposed torelatively high levels of pollution, sound sta-tistical analysis can detect with confidencethe small changes in daily mortality whichare associated with functions in pollutionconcentrations. Unfortunately, only limitedanalysis has thus far been made, and this hasbeen attempted only in London and in NewYork.
The association between longer-term com-munity exposures to particulate matter forrespiratory disease incidence and prevalencerates is conservatively believed to be inter-mediate in its reliability. Because of the re-enforcing nature of the studies conducted todate, the conclusions to be drawn from thistype of study can be characterized as prob-able.
The association between long-term resi-dence in a polluted area and chronic diseasemorbidity and mortality is somewhat moreconjectural. However, in the absence of otherexplanations, the findings of increased mor-bidity and of increased death rates for select-ed causes, independent of economic status,must still be considered consequential.
F. REFERENCES
1. Hill, A. B. "The Environment and Disease:Association or Causation." Proc. Royal Soc.Med., Vol. 58, pp. 295-300, 1965.
2. Cassell, E. G., Walter, E. W., Mountain, J. D.,Diamond, J. R., Mountain, I. M., and Mc Carroll,J. R. "Reconsiderations of Mortality as a Use-ful Index of the Relationship of EnvironmentalFactors to Health." Am. J. Pub. Health, Vol.58, pp. 1653-1657, 1968.
3. Firket, J. "Fog Along the Meuse Valley." Trans.Faraday Soc., Vol. 32, pp. 1102-1197, 1936.
4. Firket, J. "The Cause of the Symptoms Foundin the Meuse Valley During the Fog of Decem-ber 1930." Bull. Roy. Acad. Med. Belgium, Vol.11, pp. 683-739, 1931.
5. Schrenk, H. H., Heimann, H., Clayton, G. 0.,Gafafer, W. M., Wexler, H. "Air Pollution inDonora, Pennsylvania. Epidemiology of the Un-usual Smog Episode of October 1948." Pub.Health Bull. No. 306, Fed. Sec. Agency, Wash-ington, D.C., 1949.
6. Wilkins, E. T. "Air Pollution Aspects of the 22.London Fog of December 1952." Roy. Meteorol.Soc. J., Vol. 80, pp. 267-271, 1954.
7. Brasser, L. J., Joosting, P. E., and von Zuilen,D. "Sulfur DioxideTo What Level is it Ac-
8.
9.
10.
17.
18.
19.
20.
21.
ceptable?" Research Institute for Public HealthEngineering, Delft, Netherlands, Report G-300,July 1967. (Originally published in Dutch, Sep-tember 1966.)Joosting, P. E. 'Air Pollution PermissibilityStandards Approached from the Hygienic View-point." Ingenieur, 79 (50) :A739-A747, 1967.Anderson, D. 0. "The Effects of Air Contami-nation of Health, Part I." Canad. Med. Assoc.J., Vol. 97, pp. 528-536, 1967.Gore, A. T. and Shaddick, C. W. "AtmosphericPollution and Mortality in the County of Lon-don." Brit. J. Prey. Soc. Med., Vol. 12, pp. 104-113, 1958.Burgess, S. G. and Shaddick, C. W. "Bronchitisand Air Pollution." Roy. Soc. Hlth. J., Vol. 79,pp. 10-24, 1959.Scott, J. A. "The London Fog of December1962." Medical Officer, Vol. 109, pp. 250-252,1963.Martin, A. E. and Bradley, W. "Mortality, Fogand Atmospheric Pollution." Monthly Bull. Min-istry of Health, Vol. 19, pp. 56-59, 1960.Martin, A. E. "Mortality and Morbidity Sta-tistics and Air Pollution." Proc. Roy. Soc. Med.,Vol. 7, pp. 969-975, 1964.Lawther, P. J. "Compliance with the Clean AirAct: Medical Aspects." J. Inst. Fuels (London),Vol. 36, pp. 341-344, 1963.Greenburg, L., Jacobs, M. B., Drolette, B. M.,Field, F., and Braverman, M. M. "Report of anAir Pollution Incident in New York City, No-vember 1953." Pub. Health Reports, Vol. 77,pp. 7-16, 1962.Greenburg, L., Erhardt, C., Field, F., Reed, J.I., and Seriff, N. S. "Intermittent Air Pollu-tion Episodes in New York City, 1962." Pub.Health Rpts., 78, pp. 1061-1065, 1963.McCarroll, J. and Bradley, W. "Excess Mor-tality as an Indicator of Health Effects of AirPollution." Am. J. Public Health, Vol. 56, pp.1933-1942, 1966.Glasser, M., Greenburg, L., and Field, F. "Mor-tality and Morbidity During a Period of HighLevels of Air Pollution, New York, November23-25, 1966." Arch. Environ. Health, Vol. 15,pp. 684-694, 1967.Leonard, A. G., Crowley, D., and Belton, J. At-mospheric pollution in Dublin during the years1944 to 1950. Royal Dublin Soc. Sci. Proc.25:166-167, 1950."Report of the International Joint Commission,United States and Canada, on the Pollution ofthe Atmosphere in the Detroit River Area."International Joint Commission (United Statesand Canada), Washington/Ottawa, 1960, 115 pp.Watanabe, H. "Air Pollution and its HealthEffects in Osaka, Japan." Preprint. (Presentedat the 58th Annual Meeting of the Air PollutionControl Association, Toronto, Canada, June 20-24, 1965.)
147

23. Greenburg, L., Field, F., Reed, J. I., and Er-hardt, C. L. "Air Pollution and Morbidity inNew York City." J. Amer. Med. Assoc., Vol. 182,pp. 161-164, 1962.
24. Mc Carroll, J. R., Cassell, E. G., Walter, E. W.,Mountain, J. D., Diamond, J. R., and Mountain,I. R. "Health and the Urban Environment. V.Air Pollution and Illness in a Normal UrbanPopulation." Arch. Environ. Health, Vol. 14,pp. 178-184, 1967.
25. "Atmospheric Pollutants." World Health Or-ganization, Technical Report Series 271, Geneva,1964.
26. Kurland, Leonard T. Personal communication,Nov. 1, 1968.
27. Sterling, T. D., Phair, J. J., Pollack, S. V.,Schumsky, D. A., and deGrott, I. "Urban Mor-bidity and Air Pollution." Arch. Environ.Health, Vol. 13, pp. 158-170, 1966.
28. Markush, R. E. "National Chronic RespiratoryDisease Mortality Study. I. Prevalence and Se-verity at Death of Chronic Respiratory Diseasein the United States, 1963." J. Chron. Dis., Vol.21, pp. 129-141, 1968.
29. Buck, S. F. and Brown, D. A. "Mortality fromLung Cancer and Bronchitis in Relation toSmoke and Sulfur Dioxide Concentration, Popu-lation Density, and Social Index." Tobacco Re-search Council, London, Research Paper 7, 1964.
30. Pemberton, J. and Goldberg, C. "Air Pollutionand Bronchitis." Brit. Med. J., Vol. 2, pp. 567-570, 1954.
31. Gorham, E. "Pneumonia and Atmospheric Sul-phate Deposit." Lancet, Vol. 2, pp. 287-288,1959.
32. Fairbairn, A. S. and Reid, D. D. "Air Pollu-tion and Other Local Factors in RespiratoryDisease." Brit. J. Prey. Soc. Med., Vol. 12, pp.94-103, 1958.
33. Daly, C. "Air Pollution and Causes of Death."Brit. J. Prey. Soc. Med., Vol. 13, pp. 14-27, 1959.
34. Wicken, A. J. and Buck, S. F. "Report on aStudy of Environmental Factors Associated withLung Cancer and Bronchitis Mortality in Areasof North East England." Tobacco ResearchCouncil, London, Research Paper 8, 1964.
35. Burn, J. L. and Pemberton, J. "Air Pollution,Bronchitis, and Lung Cancer in Salford." Int.J. Air and Water Pollution, Vol. 7, p. 5, 1963.
36. Winkelstein, W., Kantor, S., Davis, E. W., Ma-neri, C. S., and Mosher, W. E. "The Relation-ship of Air Pollution and Economic Status toTotal Mortality and Selected Respiratory Sys-tem Mortality in Man." Arch. Environ. Health,Vol. 14, pp. 162-169, 1967.
37. Winkelstein, W., Kantor, S., Davis, E. W., Ma-neri, C. S., Mosher, W. E. "The Relationshipof Air Pollution and Economic Status to TotalMortality and Selected Respiratory System Mor-tality in Man (II. Oxides of Sulfur)." Arch.Environ. Health, Vol. 15, pp. 401-405, 1968.
148
38. Winkelstein, W. "The Relationship of Air Pol-lution to Cancer of the Stomach." (Presentedat the Air Pollution Medical Research Confer-ence, Denver, Colorado, July 22-24, 1968.)
39. Reid, Donald D. Personal communication, Nov.28, 1968.
40. Zeidberg, L. D. Prindle, R. A., and Landau, E."The Nashville Air Pollution Study. III. Mor-bidity in Relation to Air Pollution." Am. J. Pub.Health, Vol. 54, pp. 85-97, 1964.
41. Zeidberg, L. D., Horton, R. J. M., and Landau,E. "The Nashville Air Pollution Study. V. Mor-tality from Diseases of the Respiratory Systemin Relation to Air Pollution." Arch. Environ.Health, Vol. 15, pp. 214-224, 1967.
42. Sprague, H. A. and Hagstrom, R. M. "TheNashville Air Pollution Study: Mortality Mul-tiple Regression." (Presented at the Air Pol-lution Medical Research Conf., Denver, Colorado,July 22-24, 1968.) Arch. Environ. Health, Vol.18, pp. 503-507, 1969.
43. Anderson, D. 0. "The Effects of Air Contami-nation on Health: Part III." Canadian Med.Assoc. J., Vol. 97, pp. 802-806, Sept. 23, 1967.
44. Petrilli, R. L., Agnese, G., and Kanitz, S. "Epi-demiology Studies of Air Pollution Effects inGenoa, Italy." Arch. Environ. Health, Vol. 12,pp. 733-740, 1966.
45. Toyama, T. "Air Pollution and its Health Ef-fects in Japan." Arch. Environ. Health, Vol. 8,pp. 153-173, 1964.
46. Bell, A. "The Effects on the Health of Residentsof East Port Kembla. Part II." In: Air Pol-lution by Metallurgical Industries. Div. Occup.Health, New South Wales Dept. of Pub. Health,Sydney, Australia, Vol. 2, 1962, pp. 1-144.
47. Goldsmith, J. R. "Effects of Air Pollution onHuman Health." Academic Press, 1967.
48. Holland, W. W. and Stone, R. W. "RespiratoryDisorders in United States East Coast TelephoneMen." Amer. J. of Epidemiology, Vol. 82, p. 92,1965.
49. Holland, W. W., Reid, D. D., Seltser, R., andStone, R. W. "Respiratory Disease in Englandand the United States. Studies of ComparativePrevalence." Arch. Environ. Health, Vol. 10, pp.338-345, 1965.
50. Holland, W. W. and Reid, D. D. "The UrbanFactor in Chronic Bronchitis." Lancet, Vol. 1,pp. 445-448, 1965.
51. Bates, D. V. "Air Pollution and Chronic Bron-chitis." Arch. Environ. Health, Vol. 14, pp. 220-224, 1967.
52. Ferris, B. G., Jr. and Anderson, D. 0. "ThePrevalence of Chronic Respiratory Disease ina New Hampshire Town." Am. Rev. Resp. Dis.,Vol. 86, pp. 165-177, 1962.
53. Anderson, D. 0., Ferris, B. G., and Zickmantel,R. "Levels of Air Pollution and RespiratoryDisease in Berlin, New Hampshire." Am. Rev.Resp. Dis., Vol. 90, pp. 877-887, 1964.

54. Anderson, D. 0. and Ferris, B. G. "Air Pol-lution Levels and Chilnic Respiratory Disease."Arch. Environ. Health, Vol. 10, pp. 307-311,1965.
55. Kenline, P. A. "In Quest of Clean Air in Berlin,New Hampshire." U.S. Dept. of Health, Educa-tion, and Welfare, Public Health Service, Di-vision of Air Pollution, 1962.
56. Prindle, R. A., Wright, G. W., McCaldin, R. 0.,Marcus, S. C., Lloyd, 'll. C., and Bye, W. E."Comparison of Pulmonary Function and Other.Parameters in Two Communities with WidelyDifferent Air Pollution revels." Am. J. Pub.Health, Vol. 53, pp. 200-2' 8, 1963.
57. Dohan, F. C. "Air Pollutants and Incidence ofRespiratory Disease." Al..ch. Environ. Health,Vol. 3, pp. 387-395, Oct. 1431.
58. Dohan, F. C. and Taylor, lg. W. "Air Pollutionand Respiratory Disease, aPreliminary Report."Am. J. Med. Sci., Vol. 240, top. 337-339, 1960.
59. "Report on an Enquiry into the Incidence of In-capacity for Work : Part II. Incidence of Inca-pacity for Work in DifferOat Areas and Occu-pations." Ministry of Per3ions and NationalInsurance, Her Majesty's St'Ationer3,- Office, Lon-don, 1965.
60. Verma, M. P., Schilling, F. J.. and Becker, W. H."Epidemiological Study of Illness Absences inRelation to Air Pollution." (Presented at theAir Pollution Medical Research Conf., Denver,Colorado, July 22-24, 1968.) Arch. Environ.Health, Vol. 18, pp. 536-543, 1n69.
61. Reid, D. D. "Air Pollution anew Respiratory Dis-ease in Children." Second International Sym-posium on Bronchitis, The Netkerlands, 1964.
62. Douglas, J. W. B. and Waller, 7'R. E. "Air Pol-lution and Respiratory Infectit'Jm in Children."Brit. J. Prey. Soc. Med., Vol. 20,pp. 1-8, 1966.
63. Holland, W. W. and Elliott, A. "'cigarette Smok-ing, Respiratory Symptoms, arf,1 AntismokingPropaganda: An Experiment." Lancet, Vol. 1,pp. 41-43, 1968.
64. Lunn, J. E., Knowelden, J., and H.:tndyside, A. J."Patterns of Respiratory Illness iq Sheffield In-fant School Children." Brit. J. Pi'.e.v. Soc. Med.,Vol. 21, pp. 7-16, 1967.
65. Manzhenko, E. G. "The Effect of AtmosphericPollution on the Health of Childre ." Hyg. andSanit. (English translation), Vol. 31, pp. 126-128, 1966.
66. Spicer, W. S., Jr., Storey, P. B., ;INIorgan, W.K. C., Kerr, H. P., and Standiford, /i:. E. "Vari-ation in Respiratory Function in selected Pa-tients and its Relation to Air Polli,tion." Am.Rev. Resp. Dis., Vol. 86, pp. 705-712; 1962.
67. Shephard, R. J., Turner, M. E., Cares, G. C. R.,and Phair, J. J. "Correlation of ;?ulmonaryFunction and Domestic Microenvirontnent." J.Appl. Physiol., Vol. 15, pp. 70-76, 190.
,
,
1
68. Lawther, P. J. "Climate, Air Pollution, andChronic Bronchitis." Proc. Roy. Soc. Med., Vol.51, pp. 262-264, 1958.
69. Waller, R. E. and Lawther, P. J. "Some Obser-vations on London Fog." Brit. Med. J., p. 1356,Dec. 3, 1955.
70. Angel, J. H., Fletcher, C. M., Hill, J. D., andTinker, C. M. "Respiratory Illness in Factoryand Office Workers." Brit. J. Dis. Chest, Vol.59, pp. 66-79, 1965.
71. Carnow, B. W., Lepper, M. H., Shekelle, R. B.,and Stamler, J. "The Chicago Air PollutionStudy: Acute illness and SO, Levels in Patientswith Chronic Bronchopulmonary Disease." (Pre-sented at National Air Pollution Control Asso-ciation Meeting, Minneapolis, June 24, 1968.)
72. "Air Quality Data (1964-1965)." U.S. Dept. ofHealth, Education, and Welfare, Public HealthService, 1966.
73. Joosting, P. E.16, 1968.
74. Kapalin, V. "The Red Blood Picture in Chil-dren from Different Environments." Rev. Czech.Med., Vol. 9, pp. 65-87, 1963.
75. Petr, B. and Schmidt, P. "The Influence of anAtmosphere Contaminated with Sulfur Dioxideand Nitrous Gases on the Health of Children."Zeit. Gesamt. Hyg. Grenzgeb., Vol. 13, pp. 34-48,Jan. 1967.
76. Eltimova, E. V. and Shashkov, V. S. "The Effectof Sulfur Dioxide Gas in the Atmospheric Air onSome Biochemical Indexes of the Blood in Man."Gig. i Sanit., Vol. 25, pp. 18-22, 1960.
77. Elnmova, E. V. and l'usnkina, N. N. "AscorbicAcid Excretion in the Urine as an Indicator ofthe Harmful Effects of Atmospheric Pollution."Hyg. Sanit. (English translation), Vol. 31, pp.255-257, 1966.
78. Yanysheva, N. Ya. "The Effect of AtmosphericAir Pollution by Discharges from Electric PowerPlants and Chemical Combines on the Healthof Nearby Inhabitants." Gig. i Sanit., Vol. 8,pp. 15-20, 1957. In: U.S.S.R. Literature on AirPollution and Related Occupational Diseases,Translated by B. S. Levine, Vol. 1, pp. 98-104,1960.
79. Ferris, B. J., Burgess, W. A., and Worcester, J."Prevalence of Chronic Respiratory Disease ina Pulp Mill and a Paper Mill in the UnitedStates." Brit. J. Ind. Med., Vol. 24, pp. 26-37,1967.
80. Skalpe, T. 0. "Long-Term Effects of SulphurDioxide Exposures in Pulp Mills." Brit. J. Ind.Med., Vol. 21, pp. 69-73, 1964.
81. Anderson, A. "Possible Long-Term Effects of Ex-posure to Sulfur Dioxide." Brit. J. Ind. Med.,Vol. 7, pp. 82-86, 1950.
82. Kehoe, R. A., Machle, W. F., Kitzmiller, K., andLeBlanc, T. J. "On the Effects of ProlongedExposure to Sulphur Dioxide." J. Ind. Hyg., Vol.14, pp. 159-173, 1932.
Personal communication, Dec.
149

Chapter 10
SUMMARY AND CONCLUSIONS

Tame of Contents
A. SUMMARY
Page
153
1. General 153
2. Relationship of Maximum Concentrations to Average Concentrations 1543. Effects on Health 155
4. Effects on Visibility 1585. Effects on Materials 159
6. Effects on Vegetation 160
B. CONCLUSIONS 161
1. Effects on Health 161
2. Effects on Visibility 162
3. Effects on Materials 162
4. Effects on Vegetation 162
C. RESUME 162
152

Chapter 10
SUMMARY AND CONCLUSIONS
A. SUMMARY
1. General
This document presents criteria of airquality in terms of the effects empirically ob-tained and published for various concentra-tions of one family of pollutants, the sulfuroxides, their acids and acid salts. These ef-fects do not, for the most part, derive solelyfrom the presence of sulfur oxides in the at-mosphere. They are the effects that have beenobserved when various concentrations of sul-fur oxides, along with other pollutants, havebeen present in the atmosphere. Many ofthese effects are produced by a combinationof sulfur oxides pollution and undifferentiat-ed particulate matter; the contributions ofeach class are difficult to distinguish. More-over, laboratory studies have shown that acombination of sulfur oxides and particulatesmay produce an effect that is greater thanthe sum of the effects caused by these pollu-tant classes individually. Because of the in-teractions between pollutants, and the reac-tions of pollutants with oxygen and with wa-ter in the atmosphere, and because of the in-fluence of sunlight and temperature on thesereactions, the criteria for sulfur oxides cannot be presented as exact expressions ofcause and effect that have been replicatedfrom laboratory to laboratory. They are pre-sented as useful statements of the effects thatcan be predicted when sulfur oxides are pres-ent in the atmosphere; they are derived froma careful evaluation of what has so far beenreported.
The sulfur oxides are common atmosphericpollutants which arise mainly from the com-bustion of fuels. Solid and liquid fossil fuelscontain sulfur, usually in the form of inor-ganic sulfides or sulfur-containing organiccompounds. Combustion of the fuel forms
about 25 to 30 parts of sulfur dioxide to 1part of sulfur trioxide.
Sulfur dioxide is a non-flammable, non-explosive colorless gas that most people cantaste at concentrations from 0.3 ppm to 1ppm (about 0.9 mg /m3 to 3 mg/m3) in air.At concentrations above 3 ppm (about 8.6mg/m") , the gas has a pungent, irritatingodor. In the atmosphere, sulfur dioxide isPartly converted to sulfur trioxide or to sul-furic acid and its salts by photochemical orcatalytic processes. Sulfur trioxide is imme-diately converted to sulfuric acid in the pres-ence of moisture. The degree of oxidation ofsulfur dioxide in the atmosphere is depend-ent on a number of factors, including resi-dence time, amount of moisture present, andthe intensity and duration of sunlight and itsspectral distribution. The amounts of cata-lytic material, hydrocarbons and nitrogenoxides, and the amounts of sorptive and alka-line materials present, also affect the oxida-tion process.
In the United States, sulfur dioxide is mostcommonly measured by the colorimetricWest-Gaeke (pararosaniline) and the con-ductometric methods. The West-Gaeke meth-od is specific for siliiur dioxide and sulfitesalts. The method has been modified to com-pensate for interferences produced by thepresence of nitrogen oxides, ozone, or heavymetal salts in the sample, and the modifiedmethod is the method of choice of the Na-tional Air Pollution Control Administration.Conductometric methods measure sulfur di-oxide concentrations as a function of changein the electroconductivity of a solution. Thesemethods are general, in that they react tochanges in electroconductivity brought on byother soluble gases, as well as by sulfur di-oxide, and the indicated values for sulfur aresometimes very approximate.
153

The technique most frequently used in Eu-rope to measure sulfur dioxide is the hydro-gen peroxide acid titration method, or anautomated conductometric version of thesame technique. The presence of other acidicor alkaline gases in the sample may affect theresults.
The lead peroxide candle is a widely usedtechnique which determines a "sulfationrate." The method gives integrated values forrelatively long periods, but provides no indi-cation of short-term fluctuations. It providesonly a rough indication of sulfur dioxideconcentrations.
....- Recently, two long-path spectroscopic tech-niques have been introduced that sense sulfurdioxide concentrations remotely. Althoughthese techniques are complex and expensive,they may eventually be developed to providea sulfur dioxide "pollution contour" for largeareas of a city, as well as pollution concen-trations at different elevations.
Sulfuric acid aerosol in suspended particu-late material may be measured by titrationor by controlled decomposition to sulfur di-oxide. The sulfur dioxide can be measured bya number of methods, including spectropho-tometry, coulometry, and flame photometry.Particulate sulfate may be analyzed by spec-trophotometric or turbidimetric methods.
Each method of measuring sulfur oxidespollution is unique in terms of measuringtime resolution, operating costs and skills,time required for analysis, and the specificityof the technique. A single program may makeuse of both general and specific methods. Inselecting the methods to be used in a samplingprogram, it is especially important to con-sider the degree to which data obtained fromone method can be compared to data obtainedfrom another.
An estimated 28.6 million tons of sulfurdioxide were emitted to the atmosphere ofthe United States in 1966, as compared withan estimated 23.4 million tons emitted in1963. The principal share, 58.2 percent, ofthe 1966 tonnage came from the combustionof coal, primarily for the generation of elec-tric power and for space heating. The com-bustion of residual fuel oil and other petro-leum products, also primarily for power gen-eration and space heating, accounted for 19.6
154
percent of the total, while the remaindercame from the refining of petroleum (5.5percent), the smelting of sulfur-containingores (12.2 percent), the manufacturing ofsulfuric acid (1.9 percent), the burning ofrefuse (0.4 percent) , and the burning of coalrefuse banks (0.4 percent) . Paper-makingand other industrial operations also contrib-uted minor amounts to the total.
The National Air Pollution Control Admin-istration operates two nationwide programsfor surveying sulfur oxides pollution levelsin the United States. The National Air Sur-veillance Network (NASN) takes 24-hoursamples of sulfur dioxide from about 100sites 26 times a year, and the Continuous AirMonitoring Project (CAMP) records 5-min-ute average concentrations of sulfur dioxidecontinuously in six large citiesWashington,Philadelphia, Cincinnati, Chicago, St. Louis,and Denver. The NASN program employs thecolorimetric, West-Gaeke method of analysis,while the CAMP program uses the electro-conductivity technique. Recently, continuous,colorimetric West-Gaeke monitoring deviceswere installed at the six CAMP locations.
Levels recorded in the CAMP cities over a6-year period show mean annual concentra-tions ranging from 0.01 ppm, in San Fran-cisco, to 0.18 ppm, in Chicago, with the ave-rages exceeding, for 1 percent of the time, aconcentration between 0.09 ppm and 0.68ppm. The NASN annual average concentra-tions ranged from 0.002 ppm, in Kansas City,Missouri, to 0.17 ppm, in New York City.The highest 24-hour average concentrationwas 0.38 ppm, also in New York City, whilethe lowest 24-hour averages were below theminimum detectable range of the instru-mentsbelow approximately 0.001 ppm.Geographically, the highest values were re-corded in the northeastern part of the UnitedStates, especially east of the Mississippi Riv-er and north of the Ohio River, where largequantities of sulfur-bearing fossil fuels areburned.
2. Relationship of Maximum Concentrationsto Average Concentrations
Although it is convenient to discuss thevarious effects of sulfur dioxide in connec-

tion with the average concentrations of thegas over a long period, such as a year, someeffects are thought to be associated with thepeak concentrations that may occur duringthe period and to better define the kind andextent of effects that may be occurring in agiven community, it is useful to know whatthese peak values may be.
For a given averaging time, measurementsof sulfur dioxide concentrations follow a log-normal frequency distribution. The two sta-tistical parameters used to describe this dis-tribution are the geometric mean and thestandard geometric deviation, which is anindex of the deviation of the samples fromthe mean.
Once sufficient sampling data have beengathered, the geometric mean and the stand-ard geometric deviation can be used to calcu-late the expected maximum concentration,the minimum concentration, and the concen-tration at any percentile, provided that theaveraging time is 1 hour or greater. Further,it is possible to calculate expected maximafor one averaging time from data obtainedat another averaging time.
For a given typical, multiple source urbanarea, a fairly good approximation of thefrequency distribution of hourly averageconcentrations for a year at a given stationcan be obtained from measurements takenfor 24-hour periods on about 26 randomlyselected days. The accuracy of the approxi-mation will depend on the number of samplestaken, compared to the total number of sam-ples that could have been taken if air sam-pling had been continuous.
The CAMP data for various years in theperiod 1962 to 1967 appear to be fairly rep-resentative of the distribution of sulfur di-oxide concentrations for large U.S. metro-politan areas. The range of standard geo-metric deviations for the CAMP cities isroughly from 2 to 2.5. These values corre-spond to hourly maxima that range from 10to 20 times the annual mean, respectively.Similarly, the 8-hour maximum ranges fromabout 6 to 10 times the annual mean, andthe 1-day maximum is between 4 and 7 timesthe annual mean.
The ratio of the maximum sulfur dioxideconcentration to the average values may be
greater for measurements made near a sin-gle point source than for a city as a whole.For averaging periods from 4 to 54 minutes,for example, the maximum concentrationsencountered near a point source were, re-spectively, 30 to 160 times the 6-month aver-age value.
3. Effects on Health
The current scientific literature indicatesthat, for the most part, the effects of the ox-ides of sulfur on health are related to irri-tation of the respiratory system. Such in-jury may be temporary or permanent.
Laboratory studies show that sulfur di-oxide can produce bronchoconstriction in ex-perimental animals such as the guinea pig,the dog, and the cat. Dose-response curveshave been established for the guinea pig, themost susceptible laboratory animal studiedto date. They relate the concentration ofsulfur dioxide to the observed increase inpulmonary flow resistance produced by 1-hour exposures. Slight increases in resist-ance are detectable at 0.16 ppm (460 µg/m3)and the changes are readily reversible.
Sulfuric acid and some, but not all, par-ticulate sulfates also produce bronchocon-striction in the guinea pig. The response ishighly dependent on particle size, with thesmallest particles showing the greatest ir-ritant potency. In this animal, as in man,sulfuric acid and irritant particulate sulfateshave a greater irritant potency at a givenconcentration than does sulfur dioxide alone.
The potentiation by particulate matter oftoxic responses to sulfur dioxide (synergism)has been observed under conditions whichwould promote the conversion of sulfur di-oxide to sulfuric acid. The degree of po-tentiation is related to the concentration ofparticulate matter. A threefold to fourfoldpotentiation of the irritant response to sul-fur dioxide is observed in the presence ofparticulate matter capable of oxidizing sul-fur dioxide to sulfuric acid. Aerosols of solu-ble salts of ferrous iron, manganese, andvanadium have been observed to produce thispotentiation, although the concentrationsused (0.7 mg/m3 to 1.0 mg/m3) were con-siderably greater than any levels of the met-als reported in urban air.
Generally speaking, the laboratory work
155

that has been performed to date with ani-mals has only partial relevance for air qual-ity criteria. In most of the studies, the lab-oratory environment has not simulated veryclosely the actual environment. Exposureshave been to high and constant concentra-tions, rather than to the low and fluctuatinglevels commonly found in the atmosphere.Other normally occurring stresses, such asfluctuating temperature, have not, in gen-eral, been applied. These studies do, how-ever, provide valuable information on someof the bioenvironmental relationships thatmay be involved in the effects of the sulfuroxides on health. The data they provide onsynergistic effects show very clearly that in-formation derived from single substance ex-posures should be applied to ambient air sit-uations only with great caution.
The response of bronchoconstriction inman may be assessed in terms of a slightincrease in airway resistance. Normal in-dividuals, exposed to sulfur dioxide via themouth, exhibit small changes in airway re-sistance, which are often insufficient to pro-duce any respiratory symptoms. The effectsmay be even smaller when the subjectbreathes through his nose. As in animals,sulfuric acid is a much more potent irritantin man than is sulfur dioxide. Again, theirritant effect is highly dependent on particlesize.
Laboratory observations of respiratory ir-ritations suggest that most individuals willshow a response to sulfur dioxide when ex-posed for 30 minutes to concentrations of 5ppm (about 14 mg/m3) and above. Exposureof certain sensitive individuals to 1 ppm(about 3 mg/m3) can produce detectablechanges in pulmonary function. Similar ex-posure of these same individuals has, in someinstances, produced severe bronchospasm.In most of the studies discussed, an increasein pulmonary flow resistance was the indi-cator of response employed.
Epidemiologic studies do not have the pre-cision of laboratory studies, but they havethe advantage of being carried out underambient air conditions. In most epidemio-logic studies, indices of air pollution level areobtained by measuring selected pollutants,most commonly particulates and sulfur corn-
156
pounds. To use these same studies to estab-lish criteria for individual pollutants is jus-tified by the experimental data on interactionof pollutants. However, in reviewing the re-sults of epidemiologic investigations it shouldalways be remembered that the specific pol-lutant under discussion is being used as anindex of pollution, not as a physicochemicalentity.
It has been suggested that industrial ex-perience with sulfur oxides exposures maybe relevant to ambient air quality criteria.In the absence of epidemiologic evidence, onemight, as a rough approximation, select somefraction of the concentrations reported forindustrial exposures. In selecting such afraction, several factors should be taken intoconsideration. Industrial exposure, for ex-ample, is not continuous, and it may notinclude the synergistic effects which resultfrom the presence of more than one class ofpollutant. Further, the exposed populationmay not include the segments most suscepti-ble to the effects.
From the epidemiologic studies available,it is easy to conclude that there is an effectof the oxides of sulfur in the ambient at-mosphere on the health of the population,and that the degree of effect is related to thedegree of pollution. Episodes of acute ele-vation of oxides of sulfur and other pollutantconcentrations have been associated with alarger number of deaths than expected.Those predominantly affected were individ-uals with chronic pulmonary disease or car-diac disorders, or very young or old individ-uals. However, the general population hasalso been involved.
Studies of episodes occurring in Londonsuggest that a rise in the daily death rateoccurred when the concentrations of sulfurdioxide rose abruptly to levels at or about715 µg /m3 (0.25 ppm) (as measured by thehydrogen peroxide titrimetric method) inthe presence of smoke at 750 µg /m3. A moredistinct rise in deaths has been noted gen-erally when sulfur dioxide exceeded 1000µg /m3 (0.35 ppm) for one day, and particu-late matter reached about 1200 µg /m3 (meas-ured by the British reflectometer method) .Daily concentrations of sulfur dioxide in ex-cess of 1500 µg /m3 for one day (0.52 ppm)

in conjunction with levels of suspended par-ticles exceeding 2000 µg /m3 appear to havebeen associated with an increase in the deathrate of 20 percent or more over base linelevels. This same effect has been observedat lower sulfur dioxide levels when the maxi-mum pollution levels lasted for a longerperiod.
Air pollution episodes in New York Cityhave been associated with exposures simi-lar to those of the London episodes. In onecase, for example, excess deaths were de-tected in New York following a 24-hour pe-riod during which sulfur dioxide concentra-tions exceeded 1500 µg /m3 (>0.5 ppm) (asmeasured by the hydrogen peroxide titri-metric method) and suspended particulatematter was measured as a soiling index of6 cohs or greater.
For Rotterdam, there have been indica-tions of a positive association between totalmortality and exposure for a few days to 24-hour mean concentrations of 500 µg /m3 (0.19ppm) sulfur dioxide. Further, it has beenreported that: "There is a faint indicationthat this will happen somewhere between300 and 500 lig SO, per m3 per 24 hours"(0.11.ppm and 0.19 ppm).
A survey of emergency clinics at majorNew York City hospitals revealed a rise invisits for upper respiratory infections andcardiac diseases in both children and adultsin all 4 hospital studies during a 10-day pe-riod of elevated pollution levels. Sulfur di-oxide ranged between 200 µg /m° and 2460µg /m3 (0.07 ppm to 0.86 ppm) during the pe-riod studied; hospital admissions were clear-ly elevated at a time when concentrationshad not yet exceeded 715 µg /m3 (0.25 ppm).Smoke shade was close to 3 coh units.
In London, a one-day exposure to a dailyaverage level of 600 µg /m3 of sulfur dioxide(0.20 ppm) caused accentuation of symptomsin persons with chronic respiratory diseaseon the day following the high sulfur dioxidelevel if particulate matter at a substantialconcentration was also a pollutant.
This finding in London was also observedin a Chicago study. The Chicago study noteda sharp rise in illness rates on the day fol-lowing a one-day exposure to 715 µg /m3(0.25 ppm) of sulfur dioxide or more for
patients 55 years of age and over with se-vere bronchitis. Particulate matter was alsopresent.
Effects at lower levels of sulfur dioxideshave also been noted. In Rotterdam, duringa few days in which sulfur dioxide concen-trations rose from about 300 to 500 µg /m3(0.11 ppm to 0.19 ppm) , the number of hos-pital admissions for irritations of the respi-ratory system rose, particularly for olderpersons. Absenteeism from work under suchconditions increased substantially, especiallyfor those 45 years old and over.
The lowest levels at which effects are re-ported for short-time periods are those re-ported for the Ruhr area. An effect wasnoted on "functional disturbance" at an esti-mated daily indoor mean of 270 µg /m3 (0.10ppm) for 4 days and an increase in "symp-toms, illnesses, or diseases" (breathlessness,throat and eye irritation, and "depressionand apathy without further specification")was noted at a daily indoor mean of about540 µg /m3 (0.20 ppm).
Longer term exposure to lower levels thanthose found during an air pollution episodehas also been associated with demonstrablehealth effects. It is for this reason that itmust be emphasized that the levels of a pol-lutant at which effects are detected are notthe concentrations at which the pollutantmay begin to have an effect on health. Theinitiation of the deleterious effects presum-ably must take place before, and at a lowerconcentration, than that at which the exist-ence of a strong association is accepted forstatistical reasons. Repeated respiratory in-fections in early childhood, for example,which in one study appeared to be related toair pollution, may have contributed to thelater development of the chronic bronchitissyndrome in the adult.
A major British study has found an asso-ciation between mortality from bronchitisand lung cancer and levels of air pollution,after taking into consideration differencesin age, smoking habits, social class, and oc-cupational exposure. The sulfur dioxide val-ues for a year averaged 116 µg /m3 (0.040ppm) for the polluted area, and 75 µg /m3(0.026 ppm) for the cleaner area. Corre-sponding smoke values were 160 µg /m3 and
157

80 µg /m3, respectively. It was not possibleto separate the effects of sulfur dioxide fromthe effects of comparable amounts of smokewhich were present. This is consistent withother British studies, which indicate an asso-ciation of bronchitis death rates with airpollution concentrations that is apparentlyindependent of social class differences, butwhich can not specify the specific role playedby sulfur oxides.
Children and housewives appear to repre-sent the most suitable subjects for determin-ing the health effects of long-term exposuresto routine levels of air pollution. A study inGenoa, Italy, included housewives 65 or moreyears of age, who were non-smokers, andwho had lived for a long period in the samearea without having any industrial experi-ence. Sulfur dioxide was monitored for 10years at 19 sites by a technique analagousto the volumetric method of the British. Anincreased frequency of cough, sputum, dysp-nea, and bronchitis was noted in the mod-erately polluted area as compared to the rela-tively clean area. Differences were noted inthe summer prevalence of respiratory dis-eases in the industrial area, with an annualmean of 265 µg /m3 SO2 (0.093 ppm) whencompared to the middle [annual mean of 105µg /m3 SO2 (0.037 ppm) ] and low [annualmean of 80 µg /m3 SO2 (0.028 P13111)] pollu-tion areas. The study also showed a verysignificant correlation between the frequencyof bronchitis and the annual mean of sulfurdioxide levels for the seven districts of thecity, whereas the correlation between thefrequency of bronchitis and suspended mat-ter and dustfall was not significant.
Another morbidity study which has in-cluded housewives is that conducted in Nash-ville. This showed a direct correlation be-tween illnesses for all causes for housekeep-ing white females, 15 to 64 years of age, andsulfur dioxide levels. It also showed thatthe cardiovascular morbidity in the 55 andolder age group, for both sexes, was twiceas high in the most polluted area as comparedwith the least. Cigarette smoking was nottaken into account, and the adjustment madefor socioeconomic status may not have beenwholly adequate.
Differences in respiratory symptoms have
158
also been found in areas which had long-term values of 95 µg /m3 sulfur dioxide (0.034ppm) and 25 µg /m3 (0.009 ppm) measuredby hydrogen peroxide absorption, sulfuricacid titrations. The study is unusual in thatthe source of pollution was the single stackof a smelter, and daily averages were up to17 times the annual mean. However, thefindings that respiratory symptoms disap-peared when pollution was locally reducedthrough installation of a higher stack, wouldappear to confirm an effect of sulfur dioxideat the concentrations originally measured,provided that no other change took placewhich could account for the disappearanceof symptoms.
Studies of schoolchildren in Great Britainhave indicated that increased frequency andseverity of respiratory diseases occurredwhen long-term pollution levels exceededaverages of about 120 µg /m3 (0.046 ppm)sulfur dioxide and 100 µg /m3 for smoke.
4. Effects on Visibility
Particles suspended in the air reduce visi-bility, or visual range, by scattering and ab-sorbing light coming from both an objectand its background, thereby reducing thecontrast between them. Moreover, suspendedparticles scatter light into the line of sight,illuminating the air between, to further de-grade the contrast between an object andits background. This phenomenon is de-scribed in detail in a companion documentAir Quality Criteria for Particulate Matter.
The scattering of light into and out of theline of viewing by particles in the narrowrange of 0.1 p to 1 p in radius has the greatesteffect on visibility. Of the total suspendedparticulate matter in urban air, commonlyfrom 5 percent to 20 percent consists of sul-furic acid and other sulfates, and of these,80 percent or more by weight are smallerthan 1 p in radius. Consequently, suspendedsulfates in the air can contribute signifi-cantly to reduction in visibility.
Characteristic behavior of suspended par-ticles in the size range mentioned makes itpossible to relate visual range to concentra-tions of overall particulate matter. Sincesulfur dioxide levels, in general, correlatewith levels of overall suspended particulate

matter, and since the ratio of sulfur dioxideto suspended sulfate can be estimated, giventhe relative humidity, it is possible to esti-mate visibility for various relative humiditiesfrom sulfur dioxide concentration. Usingsuch data as appear in Chapter 1, Figure1-5, we can estimate that at a concentrationof 285 µg /m3 (0.10 ppm) of sulfur dioxideand with a relative humidity of 50 per-cent, visibility in New York City would typi-cally be reduced to about 5 miles. At a visualrange of less than 5 miles, operations areslowed at airports because of the need tomaintain larger distances between aircraft.Federal Aviation Administration restrictionson aircraft operations become increasinglysevere as the visual range decreases below5 miles.
5. Effects on Materials
Laboratory and field studies underscorethe importance of the combination of ar-ticulate and sulfur oxides pollution in a widerange of damage to materials. On the basisof present knowledge, it is difficult to evalu-ate precisely the relative contribution of eachof the two classes of pollution; however, somegeneral conclusions may be drawn.
Steel test panels, dusted with a number ofactive hygroscopic particles commonly foundin polluted atmospheres, corroded at a lowrate in clean air at relative humidities below70 percent. The corrosion rate was higherat relative humidities above 70 percent. Itgreatly increased when traces of sulfur di-oxide were added to the laboratory air.
It is apparent that corrosion rates of vari-ous metals are higher in urban and indus-trial atmospheres with relatively high levelsof both particulate and sulfur oxides thanthey are in rural and other areas of low pol-lution. High humidity and temperature alsoplay an important synergistic part in thiscorrosion reaction. Studies show increasedcorrosion rates in industrial areas where airpollution levels, including sulfur oxides andparticulates, are higher. Further, corrosionrates are higher during the fall and winterseasons when particulate and sulfur oxidespollution is more severe, due to a greater con-sumption of fuel for heating. Depending onthe kind of metal exposed as well as loca-
tion and duration of exposure, corrosionrates were 11/2 to 5 times greater in pollutedatmospheres than in rural environments.
In Chicago and St. Louis, where steel pan-els were exposed at a number of sites, highcorrelations were found in each city betweencorrosion rates, as measured by weight loss,and sulfur dioxide concentrations, as meas-ured by the West-Gaeke method. In St.Louis, except for one exceptionally pollutedsite, corrosion losses were 30 percent to 80percent higher than losses measured in non-urban locations. Sulfation rates in St.Louis, measured by lead peroxide candle, alsocorrelated well with weight loss due to cor-rosion. Measurements of dustfall in St.Louis, however, did not correlate signifi-cantly with corrosion rates. Over a 12-monthperiod in Chicago, the corrosion rate at themost corrosive site (mean SO., level of 0.12ppm) was about 50 percent higher than atthe least corrosive site (mean SO2 level of0.03 ppm) . Although suspended particulatelevels measured in Chicago with high-volumesamplers also correlated with corrosion rates,a co-variance analysis indicated that sulfurdioxide concentrations were the dominantinfluence on corrosion. Based on these data,it appears that considerable corrosion maytake place (i.e., from 11 percent to 17 per-cent weight loss in steel panels) at annualaverage sulfur dioxide concentrations in therange of 0.03 ppm to 0.12 ppm, and althoughhigh particulate levels tend to accompanyhigh sulfur dioxide levels, the sulfur dioxideconcentration appears to have the more im-portant influence.
Sulfur oxides pollution contributes to thedamage of electrical equipment of all kinds.Studies have reported a one-third reductionin the life of overhead power line hardwareand guy wires in heavily polluted areas. In.some areas it has been found necessary touse more expensive, less corrodible metals,such as gold, for electrical contacts.
Sulfur oxides pollution attacks a wide va-riety of building materialslimestone, mar-ble, roofing slate, and mortaras well asstatuary and other works of art, causing dis-coloration and deterioration. Certain textilefiberssuch as cotton, rayon, and nylonare harmed by atmospheric sulfur oxides.
159

Dyed fabrics may fade in atmospheres con-taining sulfur oxides and other pollutants.Severe fading was noted for some dyes infabrics exposed in Chicago, where annualaverage sulfur dioxide levels were 0.09 ppm.Leather exposed to sulfur oxides may losemuch of its strength, and paper may becomediscolored and brittle.
Concentrations of 1 ppm sulfur dioxidecan increase the drying time of some oil-based paints by 50 percent to 100 percent.Some films become softer and others morebrittle, both developments adversely affect-ing durability. Sulfur dioxide also appearsto render some paint films water sensitive,consequently reducing the film gloss. Undercertain conditions sulfur dioxide levels of0.1 ppm to 0.2 ppm cause the blueing ofBrunswick green, and in the presence of am-monia produce a troublesome defect calledcrystalline bloom brought about by the for-mation of very small ammonium sulfatecrystals.
6. Effects on VegetationSulfur dioxide may cause acute or chronic
leaf injury to plants. Acute injury, pro-duced by high concentrations for relativelyshort periods, usually results in injured tis-sue drying to an ivory color; it sometimesresults in a darkening of the tissue to areddish-brown. Chronic injury, which re-sults from lower concentrations over a num-ber of days or weeks, leads to pigmentationof leaf tissue, or leads to a gradual yellowing,or chlorosis, in which the chlorophyll-makingmechanism is impeded. Both acute andchronic injury may be accompanied by thesuppression of growth and yield.
Acute injury apparently affects the plant'sability to transform absorbed sulfur dioxideinto sulfuric acid, and then into sulfates.At high rates of absorption, sulfite is thoughtto accumulate, resulting in the formation ofsulfurous acid, which attacks the cells. Theamount of acute injury depends on the ab-sorption rate, which is a function of the con-centration. A given amount of gas at a highconcentration will be absorbed in a shorterperiod and will cause more leaf destructionthan the same amount of gas at a lower con-centration. Mathematical expressions havebeen worked out which, for some plant spe-
160
cies, relate concentration, time of exposure,and amount of damage.
Different varieties of plants vary widelyin their susceptibility to acute sulfur dioxideinjury. The threshold response of alfalfa toacute injury is 1.25 ppm over 1 hour, where-as privet requires 15 times this concentra-tion for the same amount of injury to de-velop. Some species of trees and shrubs haveshown injury at exposures of 0.5 ppm for7 hours, while injury has been produced inother species at 3-hour sulfur dioxide ex-posures of 0.54 ppm and, in still others, at8-hour exposures of 0.3 ppm. From suchstudies, it appears that acute symptoms willnot occur if the 8-hour average concentra-tion does not exceed 0.3 ppm. (From thedata on the CAMP cities, a maximum 8-hourconcentration of 0.3 ppm would correspondto a yearly average concentration of between0.03 ppm and 0.05 ppm). However, sulfurdioxide concentrations from 0.05 to 0.25 ppmmay react synergistically with either ozoneor nitrogen dioxide in short-term exposures(e.g., 4 hours) to produce moderate-to-severeinjury to certain sensitive plants.
Chronic plant injury results from thegradual accumulation of excessive amountsof sulfate in leaf tissue. Sulfate formed inthe leaf is additive to sulfate absorbedthrough the roots, and when sufficiently highlevels accumulate, chronic symptoms, accom-panied by leaf drop, may occur. Chronicsymptoms and excessive leaf drop have beenreported in locations where the mean an-nual concentration is below approximately0.03 ppm.
It has been suggested that sulfur dioxidemight suppress growth and yield withoutcausing visible injury. One investigator re-ported that yields of rye grass grown in un-filtered air were significantly lower thansimilar yields of plants grown in filtered air.No visible symptoms of injury were ob-served. Sulfur dioxide levels in the unfil-tered air ranged from 0.01 ppm to 0.06 ppm,with exposure periods ranging from 46 to81 days; other gaseous pollutants may havealso been present. Usually, the suppressionof growth and yield is accompanied by visiblesymptoms of injurya linear relationshiphas been derived, for example, between the
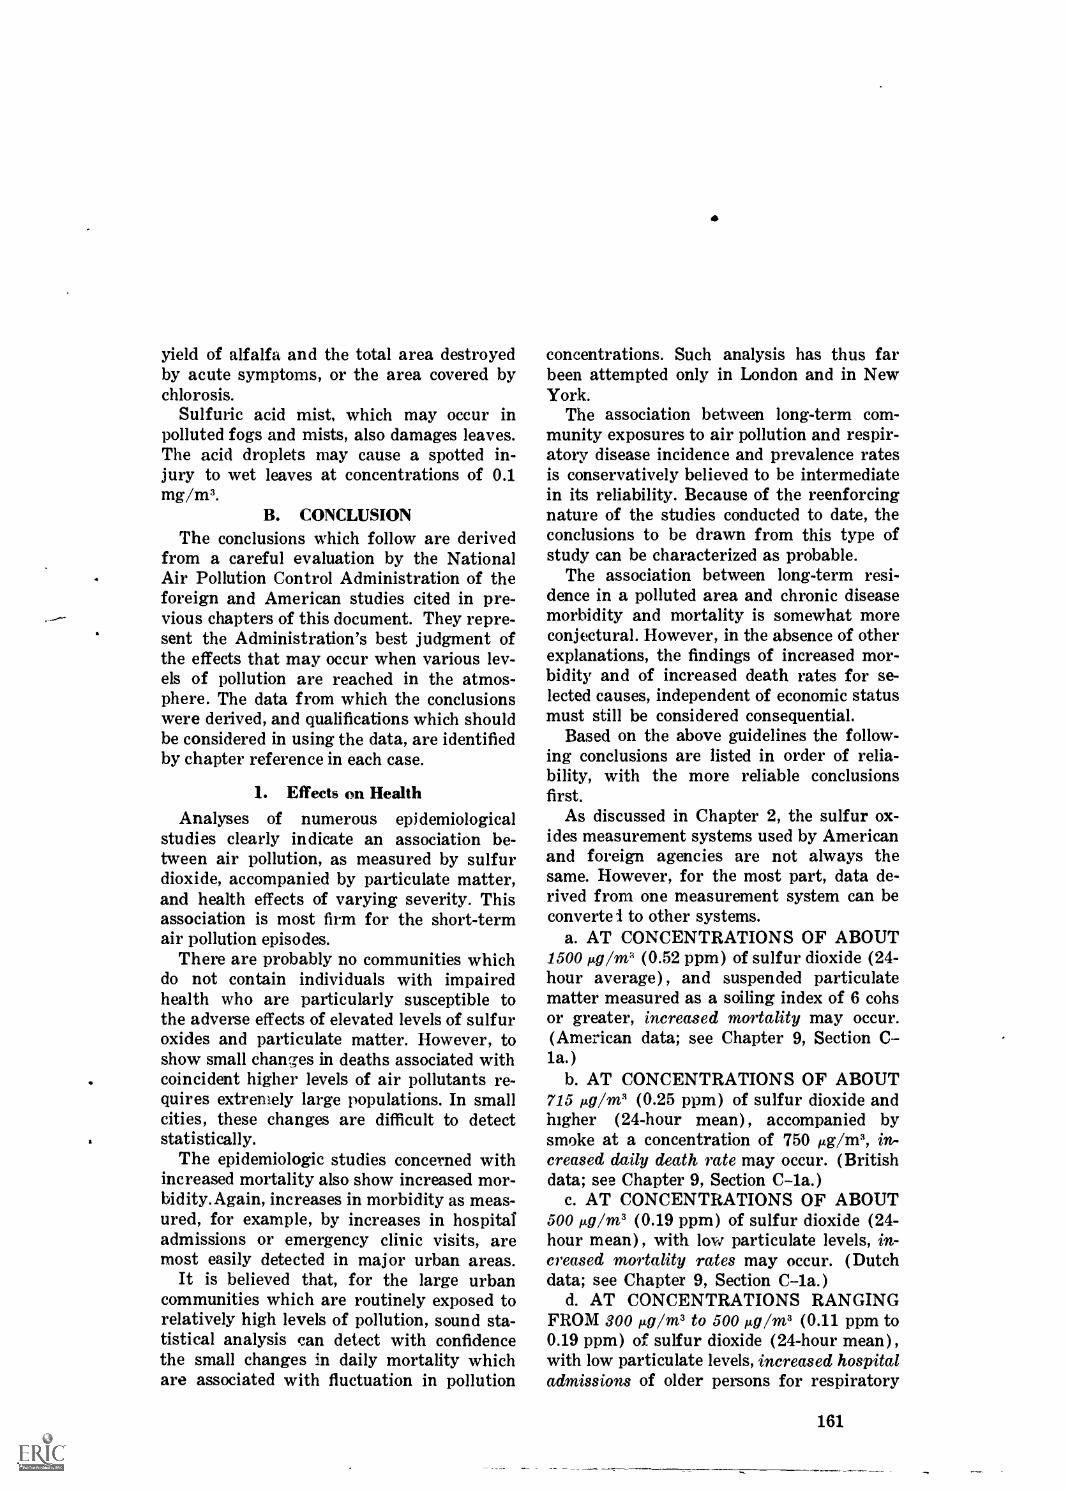
yield of alfalfa and the total area destroyedby acute symptoms, or the area covered bychlorosis.
Sulfuric acid mist, which may occur inpolluted fogs and mists, also damages leaves.The acid droplets may cause a spotted in-jury to wet leaves at concentrations of 0.1mg/m3.
B. CONCLUSIONThe conclusions which follow are derived
from a careful evaluation by the NationalAir Pollution Control Administration of theforeign and American studies cited in pre-vious chapters of this document. They repre-sent the Administration's best judgment ofthe effects that may occur when various lev-els of pollution are reached in the atmos-phere. The data from which the conclusionswere derived, and qualifications which shouldbe considered in using the data, are identifiedby chapter reference in each case.
1. Effects on HealthAnalyses of numerous epidemiological
studies clearly indicate an association be-tween air pollution, as measured by sulfurdioxide, accompanied by particulate matter,and health effects of varying severity. Thisassociation is most firm for the short-termair pollution episodes.
There are probably no communities whichdo not contain individuals with impairedhealth who are particularly susceptible tothe adverse effects of elevated levels of sulfuroxides and particulate matter. However, toshow small changes in deaths associated withcoincident higher levels of air pollutants re-quires extremely large populations. In smallcities, these changes are difficult to detectstatistically.
The epidemiologic studies concerned withincreased mortality also show increased mor-bidity. Again, increases in morbidity as meas-ured, for example, by increases in hospitaladmissions or emergency clinic visits, aremost easily detected in major urban areas.
It is believed that, for the large urbancommunities which are routinely exposed torelatively high levels of pollution, sound sta-tistical analysis can detect with confidencethe small changes in daily mortality whichare associated with fluctuation in pollution
concentrations. Such analysis has thus farbeen attempted only in London and in NewYork.
The association between long-term com-munity exposures to air pollution and respir-atory disease incidence and prevalence ratesis conservatively believed to be intermediatein its reliability. Because of the reenforcingnature of the studies conducted to date, theconclusions to be drawn from this type ofstudy can be characterized as probable.
The association between long-term resi-dence in a polluted area and chronic diseasemorbidity and mortality is somewhat moreconjectural. However, in the absence of otherexplanations, the findings of increased mor-bidity and of increased death rates for se-lected causes, independent of economic statusmust still be considered consequential.
Based on the above guidelines the follow-ing conclusions are listed in order of relia-bility, with the more reliable conclusionsfirst.
As discussed in Chapter 2, the sulfur ox-ides measurement systems used by Americanand foreign agencies are not always thesame. However, for the most part, data de-rived from one measurement system can beconverte 1 to other systems.
a. AT CONCENTRATIONS OF ABOUT1500 µg /m3 (0.52 ppm) of sulfur dioxide (24-hour average) , and suspended particulatematter measured as a soiling index of 6 cohsor greater, increased mortality may occur.(American data; see Chapter 9, Section C-la.)
b. AT CONCENTRATIONS OF ABOUT715 µg /m3 (0.25 ppm) of sulfur dioxide andhigher (24-hour mean), accompanied bysmoke at a concentration of 750 µg /m3, in-creased daily death rate may occur. (Britishdata; see Chapter 9, Section C-la.)
c. AT CONCENTRATIONS OF ABOUT500 µg /m3 (0.19 ppm) of sulfur dioxide (24-hour mean) , with low particulate levels, in-creased mortality rates may occur. (Dutchdata; see Chapter 9, Section C-la.)
d. AT CONCENTRATIONS RANGINGFROM 300 µg /m3 to 500 µg /m3 (0.11 ppm to0.19 ppm) of sulfur dioxide (24-hour mean),with low particulate levels, increased hospitaladmissions of older persons for respiratory
161
disease may occur; absenteeism from work,particularly with older persons, may also oc-cur. (Dutch data; see Chapter 9, Section C-lb. )
e. AT CONCENTRATIONS OF ABOUT715 µg /m3 (0.25 ppm) of sulfur dioxide (24-hour mean), accompanied by particulatematter, a sharp rise in illness rates for pa-tients over age 54 with severe bronchitis mayoccur. (American data; see Chapter 9, Sec-tion C-5.)
f. AT CONCENTRATIONS OF ABOUT600 µg /m3 (about 0.21 ppm) of sulfur diox-ide (24-hour mean), with smoke concentra-tions of about 300 µg /m3, patients withchronic lung disease may experience accen-tuation of symptoms. (British data; seeChapter 9, Section C-5.)
g. AT CONCENTRATIONS RANGINGFROM 105 µg /r3 to 265 µg /m3 (0.037 ppmto 0.092 ppm) of sulfur dioxide (annualmean) , accompanied by smoke concentra-tions of about 185 p, g/m3, increased frequen-cy of respiratory symptoms and lung diseasemay occur. (Italian data; see Chapter 9, Sec-tion C-2.)
h. AT CONCENTRATIONS OF ABOUT120 µg /m3 (0.046 ppm) of sulfur dioxide(annual mean) , accompanied by smoke con-centrations of about 100 µg /m3, increasedfrequency and severity of respiratory dis-eases in schoolchildren may occur. (Britishdata; see Chapter 9, Section C-3.)
i. AT CONCENTRATIONS OF ABOUT115 µg /m3 (0.040 ppm) of sulfur dioxide(annual mean) , accompanied by smoke con-centrations of about 160 p,g/m", increase inmortality from bronchitis and from lung can-cer may occur. (British data; see Chapter 9,Section C-2.)
2. Effects on Visibility
AT A CONCENTRATION OF 285 µg /m3(0.10 ppm) of sulfur dioxide, with compara-ble concentration of particulate matter andrelative humidity of 50 percent, visibilitymay be reduced to about five miles. (Ameri-can data; see Chapter 1, Figure 1-3.)
3. Effects on MaterialsAT A MEAN SULFUR DIOXIDE LEVEL
OF 345 µg /m3 (0.12 ppm), accompanied by
162
high particulate levels, the corrosion rate forsteel panels may be increased by 50 percent.(American data; see Chapter 4, Section C.)
4. Effects on Vegetation
a. AT A CONCENTRATION OF ABOUT85 µg /m3 (0.03 ppm) of sulfur dioxide (an-nual mean), chronic plant injury and exces-sive leaf drop may occur. (Canadian data;see Chapter 5, Section C.)
b. AFTER EXPOSURE TO ABOUT 8600 / m" (0.3 ppm) of sulfur dioxide for 8hours, some species of trees and shrubs showinjury. (American data; see Chapter 5, Sec-tion C.)
c AT CONCENTRATIONS OF ABOUT145 µg /m3 to 715 µg /m3 (0.05 ppm to 0.25ppm) , sulfur dioxide may react synergisti-cally with either ozone or nitrogen dioxidein short-term exposures (e.g., 4 hours) toproduce moderate to severe injury to sensi-tive plants. (American data; see Chapter 5,Section E.)
C. RESUME
In addition to health considerations, theeconomic and aesthetic benefits to be obtain-ed from low ambient concentrations of sulfuroxides as related to visibility, soiling, corro-sion, and other effects should be consideredby organizations responsible for promulgat-ing ambient air quality standards. Under theconditions prevailing in areas where thestudies were conducted, adverse health ef-fects were noted when 24-hour average levelsof sulfur dioxide exceeded 300 µg /m3 (0.11ppm) for 3 to 4 days. Adverse health^ effectswere also noted when the annual mean levelof sulfur dioxide exceeded 115 µg /m3 (0.04PPm). Visibility reduction to about 5 mileswas observed at 285 µg /m3 (0.10 ppm); ad-verse effects on materials were observed atan annual mean of 345 p,g/3 (0.12 ppm) ; andadverse effects on vegetation were observedat an annual mean of 85 µg /m3 (0.03 ppm).It is reasonable and prudent to conclude that,when promulgating ambient air qualitystandards, consideration should be given torequirements for margins of safety whichtake into account long-term effects on health,vegetation, and materials occurring belowthe above levels.

APPENDICES

A
Au
C
co
E
Eij
K
LMg
N
Nii
P
S35
a
d
e
f
APPENDIX A
the cross sectional area of a particle forlight attenuation
the cross sectional area of an i particle(see i and j, below)
the sulfur dioxide concentration (ppmor µg /m3) in air or the weight (per-cent) H2SO4 in acid droplets
the minimum concentration which willdamage a particular plant in a giventime
the particle-scattering ratio
the scattering ratio of an i particle
a constant
visual range
geometric mean. For sample values x1,x2, . . . x, the geometric mean is
1
{
n )17
II Xi 1j=1
-1/- XI, X2, . . . Xn or
the number of particles per unit volumeof atmosphere
the number of ij particles per unit vol-ume
probability
the radioactive isotope of sulfur havinga mass number 35
a constant related to damage to a par-ticular plant species by sulfur dioxide
the diameter of a spherical particle
Napierian log base ( = 2.718281)
the fraction of pollutant gases replacedper unit time with diluting air
164
SYMBOLS
g
i
i
k
n
P
r
r
t
z
A
P
a
a.,1,
X
the acceleration of gravity, cm /sect
(subscript) identifies a particle of agiven diameter and a given index ofrefraction
identifies a particle of a given refractiveindex
the fraction of SO2 loss per unit timedue to oxidation to SO3
the index of refraction
the coefficient for converting 1,, to de-sired units
a constant related to the minimum SO2concentration that damages a particu-lar species of plant
correlation coefficient
the exposure time
"standard normal exceedance deviate".The number of standard deviationsan observed value is from the medianwhen the underlying distribution isnormal.
the wavelength of light in Angstroms,microns, or nanometers
the density of a particle or droplet
the attenuation coefficient per unit pathlength
standard geometric deviation
probability function, usually expressedas x2 ("CHI SQUARE")
summation, or sum of a series

APPENDIX B
A Angstrom, 1 A =10-s cmCAMP Continuous Air Monitoring Projectcoh coefficient of hazecm centimeter, 1 cm =10-2 mCMD count median diametercm2 square centimeterDSIR Department of Scientific and Indus-
trial Research (England)FEV forced expiratory volumeFVC forced vital capacityg mass, gramshr hourLC50 concentration of toxicant lethal to
50% of subjects1 volume, litersMMD mass median diameterm length, metersm3 cubic meter
ABBREVIATIONS
miMi2
min
A
tigmgMRC
miL
NASNnmmo
ppbppmpphmRHsecyr
milesquare mileminutesmicron, 114=10-4 cm =10-6 mmicrogram, 1 fig= 10-6 gmilligram, 1 mg= 10-3 gMedical Research Councilmillimicron, 1 mp.= 10-6 m = thmNational Air Surveillance Networknanometer, 1nm =10-6 m =1mizmonthsparts per billionparts per millionparts per hundred millionrelative humiditysecondsyear
165

APPENDIX C--CONVERSION FACTORS
To Convert
mg/m3mg/100m"pg SO,/m3 (0° C, 760mm Hg)pg S02/m3 (0° C, 760mm Hg)ppm SO, (vol)ppm SO2 (wgt)p, or tan
A
A
III
lb
166
To Multiply Ey
µg /m3 1000
µg /m3 10
ppm SO2 (vol) 3.5 x 10⁻⁴
ppm SO, (wgt) 7.7 x 10⁻⁴
pg SO2 /m3 (0° C, 760 mm Hg) 2860ttg S02/m3 (0° C, 760 mm Hg) 1290
cm 10-8
cm 10-4
ft 3.28
g 453.6m 10-6
A. 10"

APPENDIX D
Abscissionthe natural separation of flow-ers, fruit, and leaves from plants by thedevelopment and subsequent disorganiza-tion of a separation layer
Aerosola cloud of solid particles and/orliquid droplets smaller than 100µ in di-ameter, suspended in a gas
Airway any part of the respiratory tractthrough which air passes during breathing
Airway 'resistance resistance to the flow ofair in the passages to the lungs
Ala (pl. alae) nasithe outer part of thenostril
Alpha rhythma uniform set of electroen-cephalographic waves with a frequency ofapproximately ten per second
Alveolus (pl. alveoli)a small, sac-like dila-tion at the inner most end of the airway,through whose walls gaseous exchangetakes place
Anemiaa condition in which the numberof red blood cells per cubic centimeter ofblood is below normal; can be furthercharacterized by descriptions of the alter-ations in the red blood cells (e.g., hypo-chomic, microcytic) or of the clinicalstate it is associated with
Anhydridea chemical compound derivedby the extraction of a molecule of waterfrom the original molecule
Anoxiaa deficiency of the amount of oxy-gen reaching the body tissues
Arrest, cardiacthe cessation of heartbeatAtelectasisthe collapse of all or part of
a lung, with resultant loss of functioningtissue
Atropinea parasympatholytic drug whichin general tends to relax smooth muscle,slow the heart rate, and dilate the pupils
Attenuationia physics, any process inwhich the flux density (or power, ampli-tude, intensity, illuminance, etc.) of a"parallel beam" of energy decreases withincreasing distance from the energysource. A more general usage of this wordis also found in this publication: any re-
GLOSSARY
duction in strength, density, effect, oramplitude.
Auscultation (adj. auscultatory)the act oflistening for sounds within the body, usu-ally with the use of a stethoscope
Bloom, crystallinethe formation of verysmall crystals on the surface of organicfilms, resulting in noticeable bloom causedby the efficient scattering of light
Bradycardiaan abnormal slowness of theheartbeat
Bronchiectasisa chronic dilatation of abronchial passage
Bronchioleone of the finer subdivisions ofthe bronchial tree
Bronchitisan inflammation of the bronchi,usually manifested clinically by cough andthe production of sputum
Bronchitis, chronica long-standing inflam-mation of the bronchi characterized byexcessive mucus secretion in the bronchialtree and manifested by a persistent orrecurrent productive cough. For the pur-poses of definition, these symptoms mustbe present on most days for a minimumof 3 months of the year for at least 2successive years (American Thoracic So-ciety)
Bronchoconstrictiona diminution in thesize of the lumen of a bronchus
Bonchodilatationan increase in the sizeof the lumen of a bronchus
Bronchus (pl. bronchi)one of the largerair passages in the lung
Buff era substance capable of enabling asystem to resist changes in condition; asolution whose pH is changed only slightlyby the addition, within limits, of an acidor a base
Cannulaa small tube for insertion into abody cavity or into a duct or vessel
Capacity, forced vital (FVC)the largestamount of gas which can be forcibly ex-pired from the lungs following a maximalinspiration
167

Capacity, functional residual (FRC )thevolume of gas remaining in the lungs asthe resting end-expiratory level
Capacity, vitalthe maximum volume of gaswhich can be expired from the lungs fol-lowing a maximum inspiration
Carcinogenes isthe production of cancerCarinaa ridgelike structure; in anatomy
of the respiratory tract, it is a prominenceon the lowest tracheal cartilage and is sit-uated between the orifices of the two main-stem bronchi
Catalyst (adj. catalytic) a substance capa-ble of increasing the velocity of a reactionwithout chemically or physically chang-ing itself
Cathetera tubular device inserted into acanal, vessel, or body cavity for either theintroduction or extraction of some ma-terial
Chloroplasta specialized body (a plastid)containing chlorophyll in the cytoplasm ofplants; the site of photosynthesis andstarch formation in plants
Chlorosisa disease condition in greenplants, marked by yellowing or blanching
Chronaxie (chronaxy)the minimum timerequired for the excitation of a nervouselement by a specified stimulus
Cilium (pl. cilia) small, hairlike process at-tached to a free surface of a cell, capableof rhythmic movement
Clearancethe removal of material from thebody or from an organ
Concentration the total mass (usually inmicrograms) of the suspended particlescontained in a unit volume (usually onecubic meter) at a given temperature andpressure; sometimes, the concentrationmay be expressed in terms of total numberof particles in a unit volume (e.g., partsper million) ; concentration may also becalled the "loading" or the "level" of asubstance; concentration may also pertainto the strength of a solution
Conductometrica method of analysis basedon the conductivity of a sample
Conif erbelonging to the coniferales or-der, consisting primarily of evergreentrees and shrubs
Conjunctivathe delicate membrane lining
168
the eyelids and covering the exposed sur-face of the eyeball
Conjunctivitisan inflammation of the con -j unctiva
Consolidationthe process by which a dis-eased lung passes from an aerated col-lapsible state to one of an airless solid con-sistency because of accumulation of exu-date
Criteria, air qualitya compilation of thescientific knowledge of the relationship be-tween various concentrations of pollutantsin the air and their adverse effects
Deciduousfalling off or shed at the endof a growing period or season
Deliquesce--to dissolve gradually and be-come liquid by absorbing moisture fromthe air
Desorptionthe release of a substance whichhas been taken into another substance bya physical process or held in concentrated
form upon the surface of another sub-stance; the reverse of absorption or ad-
sorptionDesquamateto cast off epidermis in shreds
or scales; to peel off in sheets or scalesDiameter, count median (CMD)the geo-
metric median size of a distribution ofparticles, based on a numerical count
Diameter, mass median (MMD)the geo-metric median size of a distribution ofparticles, based upon a weight (usuallyderived from a Stokes' Diameter)
Dichotomousdividing in succession intopairs; showing a dual arrangement
Distalfurthest or most remote from themedian line of the body, from the pointof attachment, or from the origin; periph-eral (cf. proximal)
Dolomitea limestone or marble rich inmagnesium carbonate
Dyspneadifficult or labored breathingEdemaa condition due to the presence of
abnormally large amounts of fluid in theintercellular tissue spaces of the body
Effusionthe escape of fluid into a tissue orpart, usually by the rupture of a vesselor extravasation through its walls
Electroencephalogram (EEG)a graphicrecording of electric currents developedin the brain, obtained with the use of elec-

trodes which are usually applied to thescalp
Emphysemaa swelling due to the presenceof air, usually excess or additional air.The term is usually used to refer to pul-monary emphysema
Emphysema, pulmonarya condition inwhich there is overdistension of air spacesand resultant destruction of alveoli andloss of functioning lung tissue
Epidemiologya science dealing with thefactors involved in the distribution andfrequency of a disease process in a popu-lation
Epidermisthe outermost layer of skin inanimals; any integument
Epitheliuma closely packed sheet of cellsarranged in one or more layers, coveringthe surface of the body and lining holloworgans
Exacerbationan increase in the severity ofany symptoms or of a disease
Exteroceptiveactivated by or relating toany stimulus impinging on an organismfrom the outside
Fibrosisthe development of fibrous tissue;sclerosis
Filiformhaving the shape of a thread orfilament
Follicle (follicule)a very small excretoryor secretory sac or a small gland
Gallaminea drug used to relax skeletalmuscles
Gneissa laminated or foliated metamor-phic rock
Goblet cella type of epithelial cell contain-ing mucus and having the shape of a flaskor goblet
Halideany binary compound of a halogenHalogen--any one of the chemically related
elements fluorine, chlorine, bromine, io-dine, and astatine
Hemoglobina protein found in red bloodcells, responsible for oxygen transport toall parts of the body
Hi lum (hilus)a depression or pit at thatpart of an organ where the vessels andnerves enter
Histaminea substance which produces dila-tation of capillaries and stimulates gastricecretion, occurring in both animal and
vegetable tissues; ft-imidazol-ethylamine
Histologythe study of the anatomy of tis-sues and their microscopic cellular struc-ture
Hydrocarbona compound containing onlyhydrogen and carbon. This group is sub-divided into alicyclic, aliphatic, and aro-matic hydrocarbons according to the ar-rangement of the atoms and the chemicalproperties of the compounds
Hygroscopicreadily absorbing and retain-ing moisture
Hypertrophyan enlargement or over-growth of an organ or tissue due to anincrease in the size of its constituent cells
Impactor, cascadean instrument whichemploys several impactions in series tocollect successively smaller sizes of par-ticles
Incidencethe rate at which a certain eventor disease occurs
Intercostalsituated between ribsInteroceptiveof or relating to any stimulus
arising from within the bodyInterstitialpertaining to or situated in the
space between cellsIsopletha line on a map connecting points
at which a given variable has a specifiedconstant value
Isoproterenola sympathomimetic drugwhich is used to relieve bronchoconstric-tion and which also can function as a car-diac stimulant
Lacrimation (lachrymation)tear forma-tion, especially in excess
Lamina propriaa connective tissue layerlocated just beneath the epithelial cells andbasement membrane of many organs
Larcha tree of the genus Larix or of thefamily Pinaceae
Larynxthe organ concerned with the pro-duction of the voice, situated at the upperend of the trachea
Leachto dissolve out by the action of apercolating liquid
Lesionan injury or other circumscribedpathologic change in a tissue
Lumenthe inner space of a hollow organor tube
Lymphocytea variety of white blood cellswhich arises in the reticular tissue oflymph glands
169

Lymphoid cella mononuclear cell foundin lymphoid tissue (such as the spleen,tonsil, lymph nodes) , ultimately concernedwith immunologic function
Mean, geometric (Mg)a measure of cen-tral tendency for a log-normal distribu-tion; the value of a given set of samplesabove which 50 percent of the values lie
Monochromatic lighta beam of light hav-ing some desired, narrow range of wave-lengths
Monodispersecharacterized by particles ofuniform size in a dispersed phase
Morbiditythe occurrence of a disease stateMorphologya branch of biology dealing
with the structure and form of livingorganisms
Mortoiy thc ratio of the total number ofdeath: Lo the total population, or the ratioof the .-.,;tuber of deaths from a given dis-ease to the total number of people havingthat disease
Mucosaa mucous membraneMucus (adj. mucous) the clear viscid se-
cretion of a mucous membraneMuralpertaining to the wall of a cavityNasopharynxthe part of the pharynx
(throat) lying above the level of the softpalate
Nebulizeto reduce to a fine sprayNecrosislocalized death of cellsNembutala barbiturate drug used as a hyp-
notic and a sedative; pentobarbitalNodea circumscribed swellingNode, lymphone of many accumulations of
lymphatic tissue situated throughout thebody
Nucleus (condensation nucleus)a particlein the size range from OAF, to 11), whichserves as a nidus on which water or othervapors in the air can condense to formliquid droplets
Olefina class of unsaturated hydrocarbonsof the general formula C 11.
Olfactorypertaining to the sense of smellOpticalpertaining to visionOropharynxthat part of the pharynx
(throat) lying between the level of thesoft palate and the epiglottis
Paraffin ----a purified mixture of solid hydro-carbons obtained from petroleum, occur-
170
ring as an odorless, tasteless, colorless orwhite, relatively translucent mass
Parenchyma the specific or functional tis-sue of a gland or organ, as opposed to itssupporting framework
Pathogenany disease-producing organismor material
Pathogenesisthe production or the modeof origin and development of a diseasecondition
Pathologythe study of the essential natureof disease, particularly with respect tothe structural and functional changes inorgans and tissues
Pharynxthe upper expanded portion of thealimentary canal lying between the mouth,the nasal cavities, and the beginning ofthe esophagus; the throat
Photochemistrya branch of chemistry deal-ing with the effect of radiant energy (aslight) in producing chemical changes
Photosynthesisthe formation of carbohy-drate from carbon dioxide and water inthe presence of chlorophyll and light, inplant tissues
Physiologya science which studies thefunction of a living organism or its parts
Phytotoxicharmful to plant materialsPlethysmographan apparatus for the de-
termination and recording of a changein the size of an organ or limb or body
Pneumonitisa general term for inflamma-tion of the lung
Pneumotachygraphan instrument used todetermine the force and velocity of re-spired air
Potentiationsynergism, as between twoagents which together have a greater ef-fect than the sum of their effects whenacting separately
Prevalencethe number of cases of a dis-ease at a given time
Privetany one of various plants of thegenus Ligustrum, used extentively as or-namental shrubs
Procainea drug which is used primarilyas a local anesthetic
Proximalnearest to the center of the bodyor the point of origin (cf. distal)
Ralean abnormal respiratory sound heardin auscultation of the chest

Ratio, standardized mortalitythe ratio ofthe number of deaths observed in a givenpopulation over a given period of time tothe number of deaths expected to occur inthe given population over the same periodof time if the given population behaved asany other group of similar compositionwould during that same period
Rhinitisan inflammation of the nasal mu-cous membrane
Rhinorrhea"runny nose"Rhonchus (pl. rhonchi) a dry, coarse sound
usually originating from partial obstruc-tion in a bronchial tube
Spasman involuntary and abnormal mus-cular contraction, usually sudden andforceful, and often accompanied by painand/or loss of function
Spectroscopythe branch of physical sci-ence dealing with the theory and interpre-tation of bands of light
Spirometeran instrument for the measure-ment of the volume of gas respired by thelungs
Squamousresembling or covered withscales
Standards, air qualitylevels of air pollut-ants which can not legally be exceededduring a specific time in a specific geo-graphical area
Subcutaneousbeneath the skinSympatheticreferring to the sympathetic
trunk or the entire sympathetic nervoussystem, concerned with the involuntaryregulation of cardiac muscle, smooth mus-cles, and glands
Synergisma situation in which the com-bined action of two or more agents act-ing together is greater than the sum ofthe action of these agents separately
Systemicrelating to the body as a whole,rather than to its individual parts
Toxicologythe study of poisons, including
their preparation, identification, physio-logic action, and antidotes
Tracheawindpipe; the airway extendingfrom the larynx to the origin of the twomainstem bronchi
Tracheotomya surgical opening throughthe skin and muscles of the neck into thetrachea
Transpirationthe emission of water vaporfrom the surface of plant leaves
Vagosympatheticreferring to the parts ofthe nervous system with innervation bythe vagus nerve and innervation throughthe sympathetic nervous system
Vaguspertaining to either of the pair oftenth (X) cranial nerves, which supplyparasympathetic, visceral afferent, motor,and general sensory innervation
Valencean integer representing the num-ber of hydrogen or chlorine atoms whichone atom of an element is capable of com-bining with
Ventilation, minute--the total volume of gasrespired in one minute, i.e., the tidal vol-ume multiplied by breaths per minute.
V iscus (pl. viscera)any internal organwithin a body cavity
Visual 9 angethe distance, under daylightconditions, at which the apparent contrastbetween the specified type of target andits background becomes just equal to thethreshold contrast of an observer, i.e., thedistance at which it is just possible to seea dark object against the sky near thehorizon
Volume, forced expiratory (FEV)the vol-ume of gas forcibly exhaled over a giventime interval (usually measured in sec-onds) after maximum inspiration, e.g.,FEV,.0 for this measurement over a onesecond period
Volume, minutesame as minute ventilationVolume, tidalthe volume of gas inspired or
expired during each respiratory cycle
171

Adams, D. F., 61, 66Agnese, G., 129Ahlquist, N. C., 13Ajax, R. J., 55Alekseeva, M. V., 23Altman, P. L., 61Alshuller, A. P., 8Amdur, M. 0., 5, 75, 76, 77, 78, 79,
80, 81, 83, 91, 92, 93, 94, 107, 108,109, 110
Andelman S. L., 91Anderson, A., 143, 144Anderson, D. M., 25, 52, 53Anderson, D. 0., 91, 120, 131, 134,
137Anderson, R. J. 91Angel, J. H., 140Ascher, L., 91Aviado, D. M., 78Axt, C. J., 9
Baetjer, A. M., 107Ball, C. 0. T., 82Barber, F. R., 42Baines, F.., 53, 54Balchum, 0. J., 78, 82Barkley, J. F., 51, 53, 55Barnes, J. M., 91Barrett, C. F., 19Barringer, A. R., 22Bates, D. V., 134Battista, S. P., 77Becker, W. H., 137Bell, A., 91, 132, 140Be llin, A., 24, 25 43Belton, J., 122, 123Benner, R. C., 53Benson, F. B., 23Benson, H. E., 5Berry, C. R., 65Bertramson, B. R., 45Bhardwar, D. V., 51Bienstock, D., 5Bleasdale, J. K. A., 62, 65Bokhoven, C., 22Boone, R. E., 25Booras, S. G., 24Bracewell, J. M., 7Bradley, W., 120, 122Brady, N. 0., 45Brandt, C. S., 61, 62, 63
172
AUTHOR INDEX
Brasser, L. J., 33, 40, 120, 122, 123,125, 127, 129, 133, 136, 137, 139
Brasted, R. C., 5Braverman, M. M., 125Brennan, L., 61Brewer, R. F., 61, 66Brice, R. M., 25Brooks, A. G. F., 11Brown, D. A., 127Brunn, L. W., 5Buck, S. F., 127, 128Buckman, H. 0., 45Buffalini, J. J., 8Burdick, L. R., 51, 53, 55Burgess, F. 75, 76, 106Burgess S. G., 120, 128Burgess, W. A., 143, 144Burn, J. L., 129, 144, 136Burton, G. G., 94, 110Bushtueva K. A., 13, 23, 43, 76, 96,
97, 98, 99, 107Bye, W. E., 19, 23, 42Bystrova, T. A., 82
Calvert, J. G., x, 8Cappel, J., 75Carey, G. C. R., 139Carnow, B. W., 140Carpenter, S. B., 8, 9Cartwright, J., 11Cassell, E. G., 119, 125, 126Catcott, E. J., 91Catteral, M., 91Chaney, A. L., 25, 43, 45Charlson, R. J., 13Cherkasov, YE. F., 96Clancy, F. K., 22Coffin, D. L., 91Collier, C., 78Comichi, S., 23Commins, B. T., 9, 11, 24, 38, 43Comroe, J. H., 94Conlee, C. J., 55Cooper, P., 74Cooper, W. C, 91Corn, M., 77, 80, 81, 94, 107, 110Coste, J. H., 13, 42Coughanowr, D. R., 7Could, R. A., 61, 63Courtier, G. B., 13, 42Couy, C. J., 53
Cralley, L. V., 81, 96Critchlow, J., 76Crowley, D. 122, 123Cuffe, S. T., 19Cullumbine, H., 75, 76, 106
Daines, R. H., 61, 63Dainton, F. S., 8Dalhamn, T., 75, 81, 83Daly, C., 128Darley, E. F., 61, 66Davis, T. R. A., 77De Groot, I., 126De Treville, R. T., 106Devitofrancesco, G., 7Dev Jain, K., 8Diamond, J. R., 119, 125, 126Dickerson, R. C., 23Dittner, D. S., 61Dohan, F. C., 135Dorries, W., 63Douglas, J. W. B., 137Doyle, G. J., 7, 8Drinker, P., 75, 76, 91, 94Drolette, B. M., 125Dubrovskaya, F. I., 96, 97Dutra, F. R., 75Dybicki, J., 78, 82
Elfers, L. A., 22Elfimova, E. V., 142Elliott, A., 138Elliott, G. 0., 82Endow, N., 8Engdahl, R. B., 19Erhardt, C. L., 125
Fairbairn, A. S., 128Farber, S. M., 91Farmer, J. R., 23Ferris, B. G., Jr., 134, 143, 144Fesch, J., 81Field, F., 123, 125Firket, J., 119Fish, B. R., 7Fletcher, C. M., 140Foran, M. R., 52Forker, G. M., 10Frank, N. R., 78, 82, 83, 92, 93,
95, 109, 110Franklin, E. C., 61, 63
Frey, S. A., 21Fried, M., 45
Gall, D., 7Gartrell, F. E., 8, 9Gee, J. B. L., 94, 110Gerhard, E. R., 7Gerstle, R. W., 19Gibbons, E. V., 52Gilbert, E. E., 7Gilbert, P. T., 53Glasser, M., 123, 125Goetz, A., 8Goldberg, C., 128Goldring, I. P., 74Golden, C. C., 23Goldsmith, J. R., 82, 91, 133Gore, A. T., 120, 128Gorham E., 23, 45, 128Graesser, F. E., 74Graf, P., 81Greenburg, L., 23, 74, 122, 125Greenblatt J. H., 51Greenwald, I., 91Grollman, A., 98Gross, P., 106Gruber, C. W., 19Gunn, F. D., 76
Hagstrom, R. M., 130Hamming, W. J., 24, 25, 43Handyside, A. J., 138, 139Hangebrauck, R. P., 19Hartzell, A., 73, 74Haselhoff, E., 63Heck, W. W., 61, 62, 63, 66Hedgcock, G. G., 61 64Heggestad, H. E., 66Heimann, H., 91Hemeon, W. C. L., 80Hendricks, R. H., 61, 62, 63, 66,Hendrickson, E. R., 19Hepting, G. H., 65Heyssel, R. M., 82High, M. D., 19Hill, A. B., 117Hill, G. R., 61, 62, 63, 64, 66Hill, J. D., 140Hindawi, I. J., 66Hochheiser, S., 23Hodgman, C. D., 10Holbrow, G. L., 51Holland, W. W., 133, 138, 139Holmes, J. A., 61, 62, 53Horada, M., 62, 65Horton, R. J. M., 130Horvath, H., 13Huey, N. A., 24Huschke, R. E., 10
Ishikawa, K., 78Ivin, K. J., 8
Jacobs, M. B., 5, 23, 125Johnson, A. B., 62Johnston, H. S., 8Johnstone, G. F., 7Johnstone, H. F., 7Jones, J. L., 8Joosting, P. E., 33, 40, 120, 122;
123, 125, 127, 129, 133, 136, 137,142,
Junge C. E., 7, 45
Kanitz, S., 129Kapalin, V., 142Katz, M., 8, 19, 23, 42, 45, 61, 64,
65Kopezynski, S. L., 8Kramer, G. D., 23Kuczynski, E. R., 22Kurland, L. T., 126Kehoe, R. A., 143, 144Kenline, Pa. A., 25Kensler, C. J. 77Kent, D. C., 79Kerr, H. P., 139Kitzmiller, K., 143, 144Knowelden, J., 138, 140
Liadlaw, S. A., 91Landeau, E., 91, 130Lange, N. A., 10Larsen, R. I., 33, 38, 40, 46Lawther, P. J., 91, 95, 122, 140Leblanc, T. J., 143, 144Lee, R. E., Jr., 9Leighton, P. A., 8, 10Leonard, A. G., 122, 123Leong, K. J., 74, 75Lepper, M. H., 140Liberti, A., 7Lieben, J., 25, 52, 53
76 Lindau, G., 63Linzon, S. N., 42, 65Lobova, E. K., 84Law, M. J. D., 23Lucas, D. H., 19Ludman, W. F., 23Ludwig, F. L., 9Ludwig, J. H., 19, 20Lunn, J. E., 138, 140Lutsep, H., 7Lyon, T. L., 45Lyons C. J., 91Lyubimov, N. A., 23
MacFarland, H. A., 74, 75Machle, W. F., 143, 144Mader, P. P., 24, 25, 43Maeller T., 5Manzhenko, E. G., 138Markush, R. E., 127Martin, A., 42Martin, A. E., 91, 120, 1`22, 126
Mason, B. J., 7Massey, L. M., 61Mathur, K., 75Matushima, J., 62, 65McBurney, J. W., 53McCaldin, R. 0., 23, 42, 51McCallan, W. E., 74McCallum, A. W., 61, 62, 64McCarroll, J. R., 119, 122, 125, 126McCord, C. P., 5McPhee, R. D., 23Mead, J., 77, 78Meeker, J. E., 19Meneely, G. R., 78, 82Menser, H. A., 66Middleton, J. T., 61, 66Middleton, W. E. K., 9Moore, D. J., 19Morgan, W. K. C., 139Morgenson, A., 65Mountain, I. M., 119, 125, 126Mountain, J. D., 119, 125, 126Murphy, E. M., 5Murphy, S. D., 77
Nadel, J. A., 79, 81, 94Nader, J. S., 9Nakamura, K., 110Navrotskii, V. K., 84Negherbon, W. 0., 73Nelson, H. W., 91Newberry, B. C., 22Newill, V. A., 23Newstein, H., 20Niessen, H. G. L., 22Noack, K., 63, 64Norris, C. H., 22Noyes, C. M., 7
O'Donoghue, J. G., 74O'Gara, P. J., 63O'Keeffe, A. E., 23Olmstead, P., 75Orning, A. A., 19Ortman, G. C., 23Oswald, N. C., 91
Pace, D. M., 84Palmer, H. F., 22Parcher, J. F., 7Parker, A. 53, 54, 55Pattle, R. E., 75, 76Patty, F. A., 5Perlman, R., 51Pemberton, J., 128, 129, 136Perry, W. H., 45Petr, B., 142Petrie, T. C., 54Petrilli, R. L., 131Phair, J. J., 91, 126, 139Phillips, P. H., 91Pitts, J. N., Jr., 8
173
Polezhaev, E. F., 98Pollack, S. V., 126Popov, I. N., 96Prager, M. J., 8Preston, R. St. J., 52Prindle, R. A., 91, 130, 134Prokhorov, Yu. D., 84Pueschel, R. F., 8Pushkina, N. N., 142
Ratner, I. M., 74Reed, J. I., 125Regan, C. J., 54Rehme, K. A., 24Reid, D. D., 128, 130, 132, 133, 137,
139Reid, L., 74, 76Renzetti, N. A., 7, 8Rinehart, W. E., 106Roberts, A , 91Robinson, E., 9, 10, 12Rodes, C. F., 22Roesler, J. F., 9Rogov, A. A., 84Rohdin, J., 81Rohrman, F. A., 19, 20Ryan, T., 7Ryazanov, V. A., 96, 97, 98
Salem, H., 78, 79, 94, 106Saltzman, B. E., 21Salvin, V. S., 55Samorodiva, R. Ya. S., 23Santner, J. T., 23Sanyal, B., 51, 52Scaringelli, F. P., 21, 24Schikorr, G., 52Schilling, F. J., 137Schmidt, P., 142Schnurer, L., 105, 108Schueneman, J. J., 19Schulz, R. Z., 75, 76Schulze, F., 23Schumsky, D. A., 126Schwartz, C. H., 19Scorer, R. S., 19Scott, J. A., 120Scott, W. E., 8Selby, S. M., 10Sellers, E. A., 74, 76Seltser, R., 139Semenenko, A. D., 98Sereda, P. J., 51Setterstrom, C., 62, 65, 66, 73, 74Sha1dick, C. W., 120, 128Shashkov, V. S., 142
174
Sheffer, T. C., 61, 64, 65Shekelle, R. B., 140Shephard, R. J., 139Shikiya, J. M., 24Shock, J. M., 22Shuck, E. A., 8Sigmon, H., 75Silverman, L., 94Sim, V. M., 91, 95Sjoholm, J., 81, 82Skalpe, T. 0., 143, 144Smith, B. M., 7Smith, W. S., 19Solberg, R. A., 61, 66Speizer, F. E., 28, 82, 83, 92, 93, 9ESpicer, W. S., Jr., 139Spierings, F., 64Sprague, H. A., 129Spurr, G., 19Stahl, R. W., 19Stalker, W. W., 23Stamler, J., 140Standiford, N. E., 139Steffens, C., 9Sterling, T. D., 126Stern, A. C., 8, 91Stevens, E. R., 8Stevens, R. K., 23Stevens, W., 20Stevenson, H. J. R., 9Stokinger, H. E., 91Stoklasa, J., 62Stone, R. W., 133, 139Storey, P. B., 139Standberg, L. G., 77, 81, 82Sullivan, J. L., 42, 65Sussman V. H., 25, 52, 53Swain, R. E., 62, 65
Tabor, E. C., 23, 27Tainplin, B., 79, 94Taylor, E. W., 139Tendorf, R. B., 11Terabe, M., 23Thomas, A., 94, 110Thomas, F. W., 8, 9Thomas, M. D., 13, 25, 44, 45, 61,
62, 63, 64, 66, 76Thompson, J. E., 24Thompson, J. R., 84Tice, E. H., 52Tierney, D. F., 94Tinker, C. M., 140Tisdale, S L., 45Tomono, Y., 94Toyama, T., 132, 139
Trakhtman, 0. L., 96Treon, J. F., 75Trieff, N. M,, 20Turner, M. E., 139Turner, T. H., 53Tyler, R. G., 25
Underhill, D., 81, 107, 108, 109Upham, J. B., 52, 55Urone, P., 7
Van Den Heuvel, A. P., 7Van Zuilen, D., 120, 122, 123, 125,
127, 129, 133, 136, 137, 142Vassallo, C., 94, 110Verma, M. P., 137Vernon, W. H. J., 51, 52Vintinner, F. J., 105Von Lehmden, D. J., 19
Wagman, J., 7, 9Wallace, A. S., 91Waller, R. E., 11, 38, 54, 137Walter, E. W., 119, 125, 126Watanabe, H., 123, 126, 139Weast, R. C., 10Weaver, J. E., 61, 62, 65Weedon, F. R., 73, 74Wellington, J. R., 52Wells, A. E., 61, 62, 63, 65, 66Whitby, G. S., 61, 62Whittenberger, J. L., 92, 93, 109,
110Wicken, A. J., 128Widdicombe, J. G., 79Wilkins, E. T., 91, 120Williams, J. D., 23Wilson, R. H. L., 91Winkelstein, W., 129Witheridge, W. M., 5Wohlers, H. C., 20Wood, F. A., 61Worcester, J., 92, 143, 144
Yanysheva, N. Ya., 142Yocum, J. E., 51, 53Yoder, R. E., 82Yokiwa, Y., 79, 94Yokoyama, E., 78, 82Younker, W., 75
Zeidberg, L. D., 130, 134Zickmartel, R., 134Zimmer, C. E., 23, 33, 40Zimmerman, P. W., 62, 66, 73Zwi, S., 80

AAbsorption
of SO2 in animals, 82-83nasal, 95
Acid titration method, 22, 23-24,26-27
Acidityof rainfall and dustfall, 45
Ageeffect on animal exposure to
H,SO4 mist, 75-76, 80-81effect on plant resistance to
SO2, 66Air pollution episodes
mortality figures during, 119-125Air quality data
SO2, 33-47Alfalfa
effect of SO, on, 53-64, 67Alpha rhythm, 96, 98Aluminum
effect of SON on, 52Anemia
Occurrence in highly pollutedareas, 142
Asthmaduring air pollution episodes, 125
Atmospheric reactions of SON, 7-9Australia
concentrations of SO2, 42effects of SO2 on vegetation, 65morbidity studies, 132
B
Baltimore, Marylandmorbidity study, 139
Barleyeffect of SO: on, 61
Blood formationeffect of SO, on, 142
Bloc I pressureeffect of SO, on, 92
Bronchitiscorrelation with SO2 levels, 119-
139, 140-142during air pollution episodes,
119-126mortality, 119-130
Bronchoconstrictioneffect of SO, on, 94mechanism in cats caused by
SO2, 79, 84, 85
SUBJECT INDEX
Buffalo, New Yorkmortality study, 129
Building materialseffects of SON on, 54-56
C
CAMP (Continuous Air Monitor-ing Program) data, 33-47
Canadamorbidity study, 134
Cancermortality, 130
Catalytic oxidation of SO,, 7Chicago, Illinois
effect of SO, on materials, 53-56morbidity study, 140, 141
Childrenepidemiologic studies of, 137-139
Chilliwack, British Columbiamorbidity study, 134
Ciliary actioneffect of SO, on, 81-82
Citrus treeseffect of SO: on, 62
Clinical visits during episodes, 125Coal combustion gases
mortality of animals frominhalation of, 105-106
Coal refuse burningemissions of SO, from, 19-20, 25
Coke processingemissions of SO2 from, 20
Colorimetric (West-Gaeke)method, 21, 24-26, 33
Combined effects of SO2 and11,504, 105-107
Combustion sources of SON, 5, 19-20, 25
Compliance (lung)effect of SO, on, 93
Conductometric methods, 21-22, 23-24, 25-26
Coppereffect of SON on, 52
Corrosion of metalseffect of SO: on, 51-53, 55-56
Corrosion rate, 51-53, 55-56Cough reflex, 79-80Coulometry, 23-24, 26Czechoslovakia
morbidity studies, 142
D
Detroit, Michiganmortality study, 123
Distribution of SO, in animals, 82-84
Dolomiteseffect of SO: on, 53-54, 56
Donora, Pennsylvaniamortality study, 119
Dose-response curve, 83, 84-85, 110Dublin, Ireland
mortality study, 123Dyed fabrics
effect of sulfur compounds on,55, 56
E
Economic Lossmetal corrosion, 53
Electroconductivitymeasurement of SO2, 33
England (see United Kingdom)Epidemiologic studies, 119-142Eston, England
mortality study, 128, 129
F
Fading of fabricseffect of SO, on, 54, 56
Flame photometry measurement ofsulfur compounds, 24, 26
Fog episodesmortality figures during, 119
Fuchsin-formaldehyde method, 23Fumigation experiments, 63, 65
GGenoa, Italy
morbidity study, 131Grasses
effect of SO2 on, 61, 62
H
Hospital admissions duringepisodes, 125
Humidityeffect on irritant potency of
H2504, 95effect on plant resistance
to SO:, 65
175

Humidity effect on atmosphericH:SO, formation, 43-45
Hydrogen peroxide measurementmethod of SO:, 21-22, 23, 26
I;
Industrial exposure studies, 142-144
Irradiation of SO:, 7
JJapan
mortality study, 123morbidity studies, 132, 139-140
K
Kerosene smoke, 106
L
Laboratory animalseffect of SO. on, 73-75, 76-80,
81-85effect of H:SO4 mist on, 75-76,
80-81, 84-85effect of zinc ammonium
sulfate on, 81Lead peroxide candles, 24-25, 26Leaf tissue
effect of SO: on, 61-65, 66-68Leather
effect of SO: up, 55, 56Lifetime exposure of animals
to SO2, 82Light intensity
effect on plant resistance to SO:,66
Light scatteringby H2504 particles, 9-10by sulfate particles, 9-10
Limestoneeffect of SO: on, 53-54, 56
London, Englandmortality studies, 119-125morbidity studies, 125-126
Los Angeles, Californiamorbidity study, 126
Lungsreaction to SO2, 76-80reaction to H:SO4 mist, 80-81
Lung resistanceeffect of SO: on, 91-94effect of HMSO, mist on, 94-95
MMarble
effect of SO2 on, 56Measurement methods
of SO2, 20-23, 24-25, 25-26of 112504, 24, 25, 26of sulfates, 24, 25, 26
Mechanism of SO: injury tovegetation, 63
176
Meuse Valley, Belgiummortality studies, 119, 120
Minute volumeeffect of H2504 mist on, 94-95
Monitoring programs, 33-47Morbidity
as an index of health, 117during air pollution episodes,
125-126Morbidity studies, 130-142Mortality
index of health, 117due to combined effect of SO2,
11:SO4, and particles, 105-107due to SO2 exposure, 73-75
Mortareffect of SO2 on, 53-54, 56
Mucuseffect of SO: on removal of, 95
N
Nasal resistanceeffect of SO: on, 94
Nashville, Tennesseemortality studies, 130morbidity studies, 134
National Air SurveillanceNetwork (NASN), 33-47
New Hampshire (Berlin)morbidity studies, 134, 143
New York Citymortality studies, 122, 123morbidity studies, 125-127, 137
Norwaymorbidity study, 143
Nutrient supplyeffect on plant resistance to
SO:, 66
0
Occurrence of SO. in theatmosphere, 5
Oil refineriesmorbidity studies in the
vicinity of, 143Optical chronaxie, 98-99Oxidation of SO:
in power plant plumes, 8in nickel-smelting plumes, 8-9
P
Painted surfaceseffect of SO: on drying time,
51, 56effect of SO: on glossiness, 51, 56general effect of SO: on, 51, 56
Papereffect of SO: on, 55, 56
Particle sizeeffects on animal response to
pollutants, 79-81distribution of sulfates, 9
Pennsylvania (Seward-NewFlorence)
morbidity study, 134Persia (southern)
morbidity study, 143Petroleum refineries
emissions of SO2 from thevicinity of, 19-20, 25, 42, 47
pH (see acidity)Photochemical oxidation of SO:, 7-
8Photooxidation rate of SO. 7Pine trees
effect of SO. on, 61, 62, 64-65,67-68
Pittsburgh, Pennsylvaniaeffect of SO: on materials, 52
Plantseffect of SO: on, 61-65, 66, 68effect of H2504 mist on, 67-68
Pneumonia death rate, 128Potentiation of SO:, 108, 109Power plants
SO: in the vicinity of, 42, 47Pulmonary function
as an index of health, 117-118effect of simultaneous
exposure to SO2 and NaC1, 108,110
effect of simultaneousexposure to SO2 and H2504,
107-108effect of SO: and H2504 mist on,
91-95Pulp mills
morbidity studies in the vicinityof, 143
Pulse rateeffect of SO: exposure on, 92
R
Refuse Incinerationemissions of SO: from, 19-20, 25
Respiratory rateeffect of SO: exposure on, 92effect of 112504 mist on, 94-95
Respiratory response, 76-79Rotterdam, The Netherlands
mortality studies, 123morbidity studies, 127, 137
S
St. Louis, Missourieffect of SO: on materials, 52-54
Salford, Englandmortality study, 129morbidity study, 136

Sampling techniques for SO:, 20-27Slate
effect of SO: on, 56Smelters
emissions of SO: from thevicinity of, 19-20, 25, 42
Soil moistureeffect on plant resistance to SO:,
66Soiling index relationship to
morbidity, 145Sources of atmospheric SO., 19-20,
25Spectroscopic measurement
methods of SO,, 22, 24, 26Steel
effect of SO. on, 51-54, 55-56Sulfation plate, 24Sulfation rates, 20-27, 55-56, 144-
147Sulfur oxides
effect of sunlight on, 9-14Sulfuric acid
relationship to SO:, 42-45formation during photo chemical
reactions, 7emissions of SO:
manufacture of, 19-20, 25Sulfuric acid mist
effect on laboratory animals, 75-76, 80-81
effect on man, 94-95effect on materials, 55-56effect on plants, 66, 68measurements of, 25, 27
41 A
Susceptibility of vegetation to SO2,61-68
"Susceptible population," 11)Suspended sulfates
concentrations, distribution, andmeasurement of, 25, 26
Synergism of SO: and NaC1, 111Synergistic effects
SO, and 03 effects on tobacco, 66NO2 and SO: effects on tobacco,
66
T
Temperatureeffect on plant resistance to SO:,
65Tennessee (eastern)
effect of SO: on vegetation, 64Textiles
effect of sulfur compounds on,55-56
Threshold concentrations of sulfurcompounds brain sensitivity, 96,
98, 99eye sensitivity, 96, 97, 98-99odor perception, 96-97, 99
Tidal volumeeffect on H:504 mist on, 94
Tobacco plantseffects of SO2 and 03 on, 66effects of NO: and SO: on, 66
Trail, British Columbiaconcentrations of SO2, 42effects of SO: on vegetation, 64
Trees (see also Pine and Citrustrees)
susceptibility to SO2, 63-65
UU.S.S.R.
morbidity studies, 138, 139, 142United Kingdom
mortality studies, 127, 128morbidity studies, 136, 137, 138
V
Visibility reductionby SO. and H2504 mist, 9-14
Vital capacityeffect of SO: on, 91, 99
W
West-Gaeke method (see alsoColorimetric method), 21, 22, 24-
25, 25-26Wind speed effect on atmospheric
H:504 formation, 43
Z
Zinceffect of SO2 on, 52
Zinc ammonium sulfateeffect on laboratory animals, 81
177

ACKNOWLEDGEMENTS
The following sources, in most instances the copyright holders, have granted permissionto the National Air Pollution Control Administration to include the following figures andtables in Air Quality Criteria for Sulfur Oxides:
Table 1-2.McGraw Hill, Inc., New Yorkand Chemical Rubber Company
Page 20American Institute of ChemicalEngineering, New York; and ElectricalWorld Copyright 1967, all rights reservedby McGraw Hill, Inc.
Page 42National Research Council Ottawa,Canada
Table 3-4.Pergamon Press, Inc., New YorkCity
Table 9-1.Research Institute for PublicHealth Engineering. Delft, The Nether-lands
178
Figure 5-1.American Society of Plant Phy-siologists, Washington, D. C.
Figure 9-1.Royal Society of HealthFigure 9-2.Royal Dublin Society, Dublin,
IrelandFigure 9-3.American Medical Association,
Chicago, Ill.
Figure 9-4.Lea and Febiger, Philadelphia,Pa.
Figure 9-5.British Medical Journal, Lon-don
Figure 9-6.Air Pollution Control Associa-tion, Pittsburgh, Pa.
* U. S. GOVERNMENT PRINTING OFFICE : 1969-347-411/31