Embed Size (px)
Citation preview

National Aeronautics and Space Administration
Engine Component Characterization Based on Experimental Data and Modeling for Flow Distortion and Rotating Stallg g
Ri h d A Bl h
Fundamental Aeronautics – Supersonics ProjectAeroPropulsoServoElasticity Task
Richard A. Blech
NASA Glenn Research CenterCleveland, Ohio
www.nasa.gov 11
Propulsion Controls and Diagnostics (PCD) WorkshopCleveland OH, Dec. 8-10, 2009

National Aeronautics and Space Administration
Engine Modeling Based on Experimental Data
Outline
BackgroundBackground
Engine Model Test Case
-- Compressor-- Turbine-- Distortion response, surge, stall modelingp g g
Status and plans
www.nasa.gov 22

National Aeronautics and Space Administration
Engine Modeling Based on Experimental DataB k d
• A general purpose engine modeling technique has been developed to support controls development for the APSE project
Th h ll d l t b d l d h th i b
Background
• The approach allows models to be developed where the engine may be conceptual in nature
• Engine component characteristic data is generated using preliminary design tools or best available data from similar enginesdesign tools or best available data from similar engines
• Initial demonstration case was a J85-13 turbojet engine•Compressor, turbine, and other component performance data generated using data from in-house cycle codes, design toolsgenerated using data from in house cycle codes, design tools
• An additional effort was initiated to utilize data from a 1D dynamic engine code developed for NASA
• Component data was obtained from experimental datap p• Serves as a tool to compare compressor distortion/surge/stall model against prior experimental data• Provides validation of general purpose engine modeling approach
www.nasa.gov 3

National Aeronautics and Space Administration
Engine Modeling Based on Experimental Data
Source of Data
• Aerodynamic Turbine Engine Code (ATEC) J85-13 simulation originally developed by AEDC for NASA
• Component performance maps generated from engine f ’ l d kmanufacturer’s cycle deck
• Capability to run surge, stall, post stall and recovery transients• Maps were modified to account for modifications to baseline engine configuration to account for modifications made during test programsconfiguration to account for modifications made during test programs
• Test data available from prior NASA programs• Engine distortion response modeling and test data (GE contractor report NASA CR-134978)report NASA CR 134978)•Inlet-engine controls studies (NATO RTO-MP-8 report )
www.nasa.gov 4

National Aeronautics and Space Administration
Compressor Maps
ATEC Compressor Map
Data FileATEC to Excel Excel to
MATLAB MATLAB S-
Function
Procedure
•Organized by speed,stage• Speed lines definedby polynomial coefs./breakpoints data
• Fortran utility to read map and generate file for import to Excel
• MATLAB m-file • Reads Excel file •Generates MATLAB input file
• MATLAB m-file to generate pressure, temperature coef. speed lines from polynomials• Interpolationbreakpoints data
•Calculations of pressure/ temp. coefs at breakpoints
Interpolation between speed lines•Extrapolation for speeds beyond 102%
Stage 1 Characteristics
Resulting Pressure, Temperature Coefficient Maps Combined with Volume Dynamics
Stage 2 Characteristics Stage N Characteristics
Stage 1 Stage 2 Stage N
Volume Dynamics Volume Dynamics Volume Dynamics…
www.nasa.gov 5
Stage 1 Stage 2 Stage N

National Aeronautics and Space Administration
Compressor Model
St b t d l d l d• Stage-by-stage compressor model developed• Compressor element calculates pressure and temperature characteristics•Volume dynamics elements between compressor elements through•Volume dynamics elements between compressor elements through conservation equations.•Efficiency is computed for reference purposes
1⎞⎛
( ) ( )PRTRcp lnln
1⎟⎟⎠
⎞⎜⎜⎝
⎛ −
=γ
γ
ηTR = Stage Temperature ratioPR= Stage Pressure Ratio
•Bleed is implemented as a percentage of engine mass flow only for stages 3-5 as in the actual engine. Bleed schedules taken from GE report•Inlet Guide Vanes not modeled, but vanes are full open at ~ 90% design corrected speed and beyond
www.nasa.gov6

National Aeronautics and Space Administration
Compressor Results
The new compressor model was integrated with the Tecdyn7 engine model, replacing the original single-lump compressor. The steady state results are shown below.s a e esu s a e s ow be ow.
Source
N% design corr. speed
Pt3kN/m2
Tt3ºK
Air flowKg/sec
E i t 100 703 8 544 19 9Experiment 100 703.8 544 19.9Seldner 100 709.6 550 20.0ATECdyn 100 659 539 19.8
www.nasa.gov 7

National Aeronautics and Space Administration
Stage 1 Pressure and Temperature Coefficient Maps
www.nasa.gov 8

National Aeronautics and Space Administration
Overall Compressor Map
ATECdyn : Tecdyn7 with stage-by-stage compressor model based on ATEC dataTecdyn7 : Original code with single lump compressor model
www.nasa.gov 9

National Aeronautics and Space Administration
Compressor Model Results
Transient Response
ATECdyn Tecdyn7
www.nasa.gov 10

National Aeronautics and Space Administration
Turbine Model
•ATEC turbine model based on the following parameters NXNFFTSpeedCorrectedTurbine ==
hhP
TWTFFFunctionFlowTurbine
TXNFFTSpeedCorrectedTurbine
t
t
t
544
45
4
==&
( )
TTTRRatioeTemperaturTurbine
XNFFTTFFfT
hhDHQDoneWorkTurbine
t
t
t
,54
5
45
4
==
=−
==
( )XNFFTTRfPPPRRatioessureTurbine
t
t ,Pr 55
45 ===
•Corrected speed and TFF are computed and used to determine DHQ•Corrected speed and TFF are computed and used to determine DHQ•Enthalpy drop is computed and used to determine temperature•Turbine temperature is computed and used to determine PR•Volume dynamics based on conservation equations
www.nasa.gov 11

National Aeronautics and Space Administration
Turbine Model
• ATEC code contains turbine maps using data from engine company cycle deck (based on experimental data)cycle deck (based on experimental data)•Maps contained abrupt changes, requiring smoothing
www.nasa.gov 12

National Aeronautics and Space Administration
Turbine Model
• A turbine model has been developed using the maps from the ATEC code• Steady state solutions have been obtained but at speeds greater than• Steady state solutions have been obtained, but at speeds greater than design speed• Map scaling is currently being investigated.
www.nasa.gov 13

National Aeronautics and Space Administration
Compressor Distortion Response and Surge/Stall Models
• Response to distortion is a key element of APSE controls development• Distortion can result in engine surge and stall
i d l l di d i i i f• Engine model must at least predict reduction in surge margin for inlet distortion conditions•A full surge/stall initiation, in-stall operation, and stall recovery capability is a long term objectivecapab ty s a o g te object ve
• Modeling Techniques (increasing order of complexity)•Braithwaite algebraic stall pressure ratio loss modelP ll l C M d l•Parallel Compressor Model
•No circumferential interaction•Inclusion of circumferential terms
• 2D and 3D models• Expensive and impractical due to computer time requirements
www.nasa.gov 14
National Aeronautics and Space Administration
Parallel Compressor Model
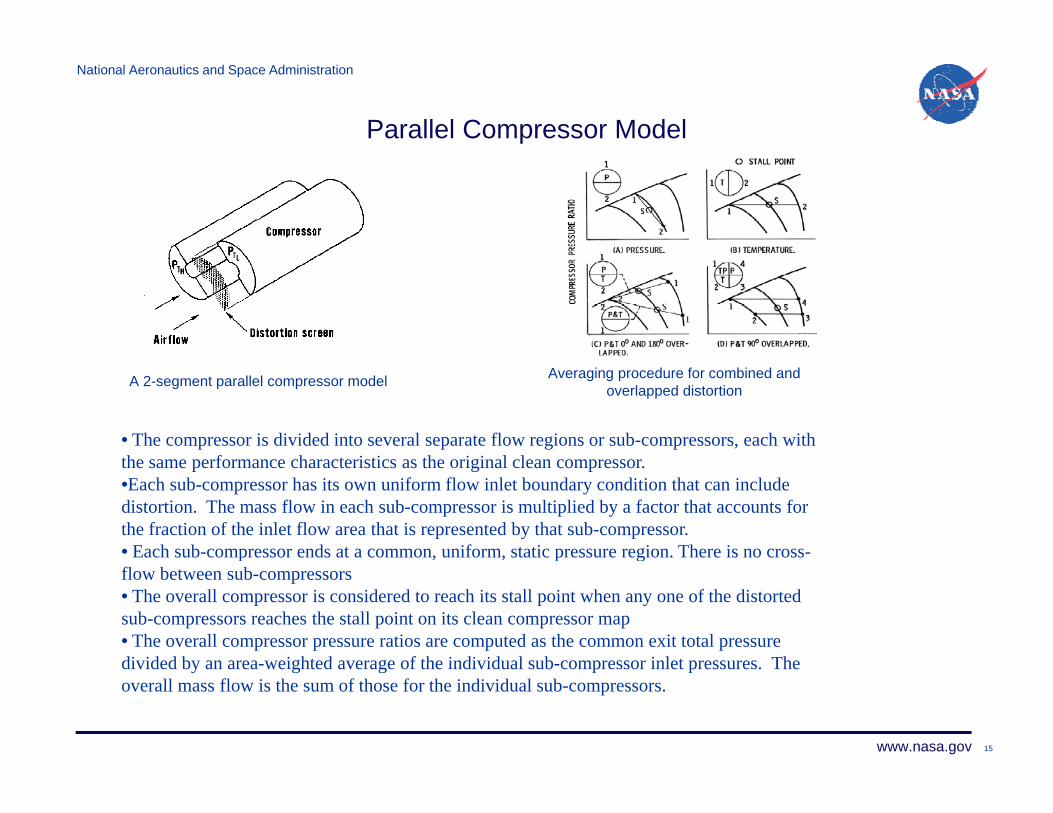
• The compressor is divided into several separate flow regions or sub-compressors, each with th f h t i ti th i i l l
A 2-segment parallel compressor model Averaging procedure for combined and overlapped distortion
the same performance characteristics as the original clean compressor.•Each sub-compressor has its own uniform flow inlet boundary condition that can include distortion. The mass flow in each sub-compressor is multiplied by a factor that accounts for the fraction of the inlet flow area that is represented by that sub-compressor.• Each sub-compressor ends at a common, uniform, static pressure region. There is no cross-p p gflow between sub-compressors• The overall compressor is considered to reach its stall point when any one of the distorted sub-compressors reaches the stall point on its clean compressor map• The overall compressor pressure ratios are computed as the common exit total pressure divided by an area weighted average of the individual sub compressor inlet pressures The
www.nasa.gov 15
divided by an area-weighted average of the individual sub-compressor inlet pressures. The overall mass flow is the sum of those for the individual sub-compressors.
National Aeronautics and Space Administration
Initial Compressor Model for Stability, Surge Line Development
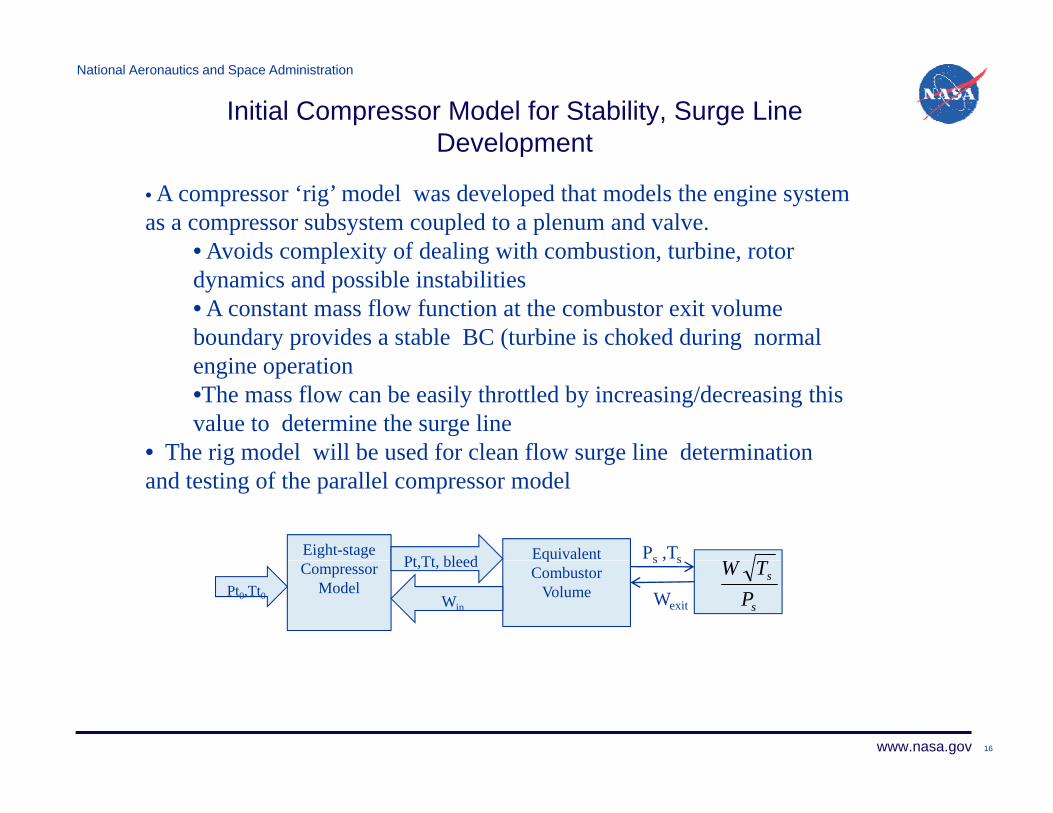
• A compressor ‘rig’ model was developed that models the engine system as a compressor subsystem coupled to a plenum and valve.
• Avoids complexity of dealing with combustion turbine rotor
Development
• Avoids complexity of dealing with combustion, turbine, rotor dynamics and possible instabilities• A constant mass flow function at the combustor exit volume boundary provides a stable BC (turbine is choked during normal engine operation•The mass flow can be easily throttled by increasing/decreasing this value to determine the surge line
• The rig model will be used for clean flow surge line determinationThe rig model will be used for clean flow surge line determination and testing of the parallel compressor model
Equivalent Eight-stage Pt Tt bleed Ps ,Tsq
Combustor Volume
Compressor ModelPt0,Tt0
Pt,Tt, bleed
Win s
s
PTW
Wexit
s , s
www.nasa.gov 16

National Aeronautics and Space Administration
Compressor Rig SimulationPropagation of a 25 psf Pressure Pulse Through the Compressor
100% Design Corrected Speed
www.nasa.gov 17

National Aeronautics and Space Administration
Compressor Rig SimulationPropagation of a 25 psf Pressure Pulse Through the Compressor
Rising edge detail
www.nasa.gov 18

National Aeronautics and Space Administration
Conclusions and Future Plans
R lt f d l b d i t l d t f th ATEC d if th• Results from models based on experimental data from the ATEC code verify the generic modeling approach used is accurate• Current stage-by-stage compressor modeling tools provide a necessary and solid foundation for future distortion response/surge/stall model development.p g p• Data from ATEC code will continue to be useful for extending distortion, surge, stall models
Future plans:Future plans:•Complete incorporation of algebraic and static compressor distortion response models
•Calculate reduced compressor surge line• Determine and implement interfaces to atmospheric models and NASA LaRC aeroelastic codes to provide flowfield perturbation boundary conditions. • Add capability to model turbofan engines•Revisit compressor distortion response model to account for circumferentialRevisit compressor distortion response model to account for circumferential interactions
www.nasa.gov 19