Embed Size (px)
Citation preview

GOVT.DOC.
NATIONAL ADVISORY COMMITTEE
FOR AERONAUTICS
@
TECHNICAL NOTE
No. 1330
EFFECT OF CRITICAL MACH NUMBER AND FLUTTER ON
MAXIMUM PO_ER LOADING OF DUCTED FANS
By Arthur A. Regier, John G. Barmby, and Harvey H. Hubbard
Langley Memorial Aeronautical Laboratory
Langley Field, Va.
Washington
June 1947
=
7
=
,--.-_7=_ -:_. -.%7
• =
BusINESS, sCIENCE
; & TECHNOLOGY DEP'T.
https://ntrs.nasa.gov/search.jsp?R=19930081955 2020-03-29T06:03:35+00:00Z


_ATIO_L ADVISORY O0_,_4ITI_EFOR AEI_0NADTICS
TEC_C_J_ I_OTE NO. 1230
EFFECT OF CRITICAL MACH I,[t_SERAND FLI_2_ ON
MAIq_E_4 POWER LOADING OF DUCTE_D FANS
By Arthur A. P,egier, J_hn O. Ba_nnby, _%nd Harvey _. Hubbo_'d
_%RY
Flutter tests were made of two wind-tunnel-f_n n_odels, one ofwhich had conventio1_l Clark Y airfoil sections and the other of
which had high-coalber blade sections. The results of the tests
confirm the stall-flutter theory which predicts nuch hi@%or flatter
sl_eds at the high lift coefficients for the hi_-c_ber blades.
The llig/_-camber blades could, therefol-e, be operated at muchhi_/ler power loading than could the low-c,_m_berblades. Aerodyna_ic
data of these tests indicated little difforence inefficiency for
the two fans but soz_what higher _ximum lift coefficient for the
high-cs_Iber fan. The efficiency of the fans deoremsed after the
velocit_ _,as calculated by two-dimensional theory, oxceede¢_ th_ spoed"of sound on the upper blade mufface.
An analysis is ]_mde of the factors tliat determlno the power
loading of a fan blade section. Graphs are presented which give
the maximtnn p_wer loadin6 for idealized, sections of variousthiclniess i'atios operating at the critical Mash nt_uber.
Exeinples show t_at the ideal oi_ desi_ lift coefficient of
an airfoil is almost the s_e as the lift coofficient giving themeximt_i flutter speod. It is _&ierefore desirable tiiat a soctlon
be operated at the ideal lift in order to obtain high critical speeds
as well as the n_%ximum margin of safety with respect to flutter.
INI_ODUCTION
An important problem in the design of dusted fans, such as
wind-ttmnel fans _nd axial comprossors, is the absorption of maxinumpower at high efficiency without blade failure. _ie present paper
is concerned with two of the factors whichmay limit the power
loading of fans. These factors are th_ flutter speed and thecritical Mach nu_ber of the blade section.
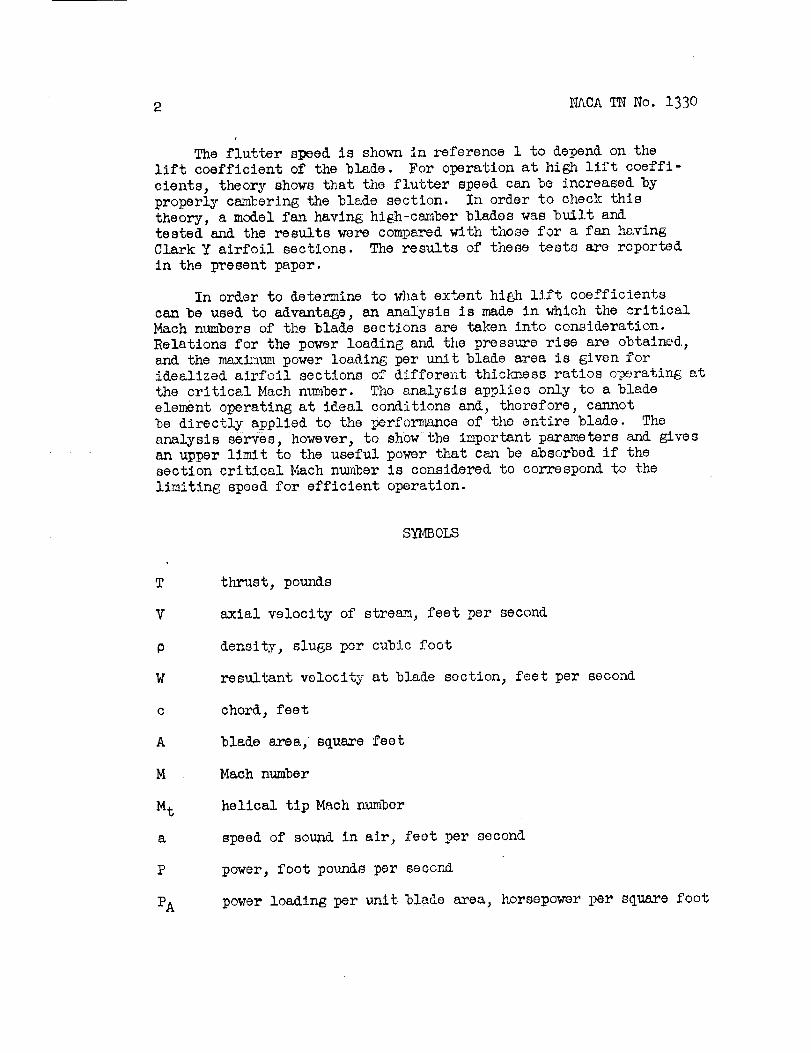
2 _CA TNNo. 133o
The flutter speed is shownin reference 1 to depend on thellft coefficient of the blade. For operation at high lift coeffi-cients, theory shows that the flutter speed can be increased byproperly cambering the blade section. In order to check thistheory, a model fan having hi_h-camber blades was built andtested and the results were comparedwith those for a fan havingClark Y airfoil sections. The results of these tests are reportedin the present paper.
In order to determine to what extent high lift coefficientscan be used to advantage, an analysis is madeIn which the criticalMachnumbers of the blade sections are taken into consideration.Relations for the power loading and the pressure rise are obtained,and the maximumpower loading per unit blade area is 6iven foridealized airfoil sections of different thic_ess ratios operating atthe critical Machn_slber. The analysis applies only to a bladeelement operating at ideal conditions and, therefore, cannotbe directly applied to the perfor_mnce of the entire blade. Theanalysis serves, however, to show the important parameters and givesan upper limit to the useful power that can be absorbed if thesection critical Machnumber is considered to correspond to thelimiting speed for efficient operation.
SYMBOLS
T
V
P
W
C
A
M
Mt
a
P
PA
thrust, pounds
axial velocity of stream, feet per second
density, slu6s per cubic foot
resultant velocity at blade section, feet per second
chord, feet
blade area, square feet
Mach number
helical tlp Mach number
speed of sound in air, feet per second
power, foot pounds per second
power loading per unit blade area, horsepower l_r square foot
NACATN i{o, 1330
CL
¢
r
R
B
Cp
d_
c%t4
X
Y
Xc.g.
Csa
q
K
G
J
t
L
Q
ap
Mfca I
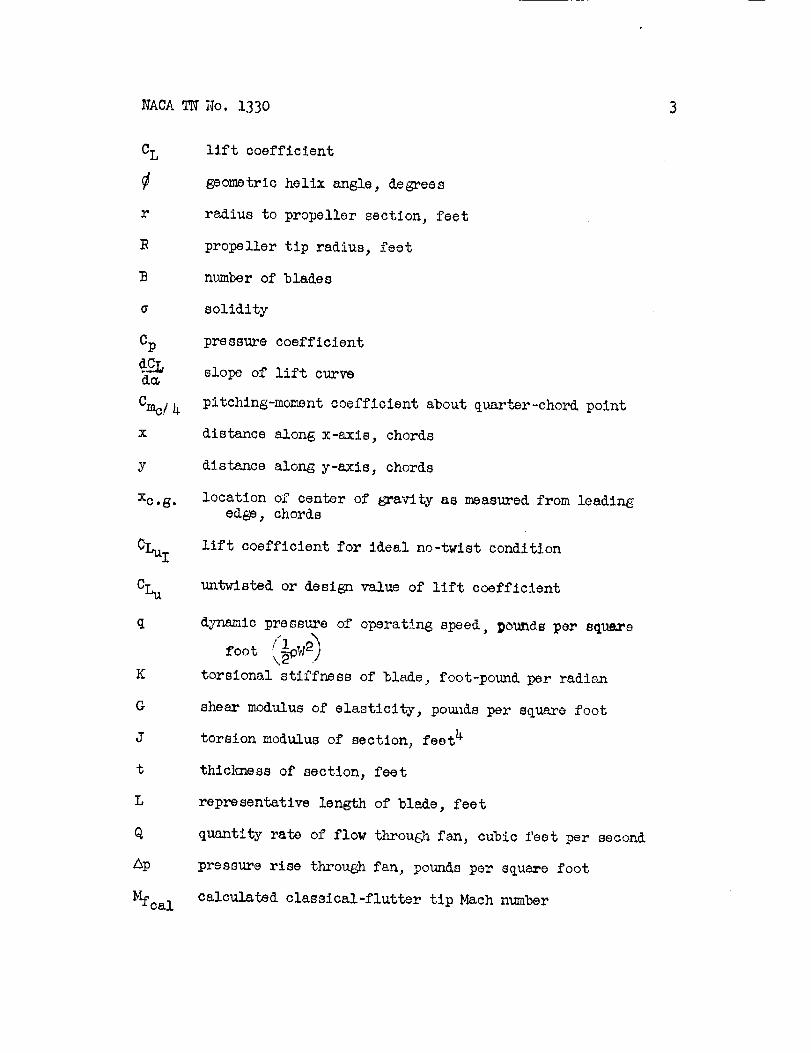
lift coefficient
geometric helix angle, degrees
ra_lius to propeller section, feet
propeller tip radius, feet
mmber of blades
solidity
pressure coefficient
slope of lift curve
pitching-moment coefficient about quarter-chord point
distance along x-axis, chords
distance along y-axis, chords
location of center of gravity as measured from leading
edge, chords
lift coefficient for ideal no-twist condition
untwisted or design value of lift coefficient
dynamic pressure of operating speed, _ounds per square
torsional stiffness of blade, foot-pound per radian
shear modulus of elasticity, pou/_is per square foot
torsion modulus of section, feet 4
thic]a%ess of section, feet
representative length of bla&e, feet
quantity rate of flow througJq fan, cubic feet per second
pressure rise through fan, pounds per square foot
calculated classical-flutter tip Mach number
3
4 NACA TN No, 1330
Mfma x
Mfmi n
a 7
ma.xiinulumeasured flutter tip Mach n_nber
minlm1_a Lmasurod stall-flutter tip Mach n_,ibor
section angle of attack, degrees
blade angle at radius r, de,%'ees
angtular velocity of propeller, radians per second
efficiency
rotatlonal-velocity interference factor
Subscripts :
U
cr
I
div
f
i
M
Dlax
0
untwisted or desi_
critical
ideal
divergence speed
flutter speed
incompressible
conditions at critical Math n_m_er
standard conditions
T._OP$]TICAL _d_ALYSiS
Relations for Po_er Loading and Pressure Rise
The following analysis is based on simple blade-element bheo_:
and neglects the drag forces and the chan6o of density of the fluid
passing throu_ the fan. The qtm_ntities considere& are shown infigure 1. _ie useful power Js given by the product of the thrust T
and the axial velocity V.
NASATNNo. 1330 5
For sn ele_nt cf blade radius dr the relations for thepower are as follows:
dP = V dT = V dL cos
where
dL = __p_,,r2C_c dr
V = ;,r sin.
Therefore,
Since
end
dP = 1DW3CL cos _ sin _ c dr
c _r = dA
cos_ _n ¢. _ s!_ 2¢-
_---_3c L _._.n2_dA
(I)
The quantity dP/dA is the power loading per unit blade area.
When the resultant blade-elei_nt velocity W is expressed in
terms of Mach nlmlber _ and spee! of so_nd a, equation (i) 1_'._ybe _Titten
dA(_)
If the geometric helix angl_ _ is 45°, the po_,:_rloading per unit
blade ares, is a maxiJ_1; that is,

6 HACATN No. 1330
A convenient expression for the maximum po_er loading per unit
blade area PAm_x expressed in horsepower per square foot for air
at standard conditions is
o 2378x i!6%
= 15oo cT2_3 (_)
Equation (4) may be writtan in a more _Bneral form for any densityand speed of sound as
PAmax = lSO0 _0 CLM3(5)
where PO refers to density of air at stando_d conditions and
ao, to speed of sound in air at standard conditions.
An expression for the prossur_ rise may be obtained by equating
the t_n_ust Of th_ fan blade olez'aontsto the product of the pressure
rise Ap times the area throu_/_ which the blade element_ _.zeep.
Thus, for a fan having a given nt_nbor of blades B and a blado-element radius dr
B dT =&p2_ dr
B dT
2_r dr
i . t)
RO_,'--CLBear cos
2_r dr
NACATNNo. 1330 7
Since
Bc-- = G
_r
- cos
Or, in terms of M and a,
Ap - pc M%2 co8 (7)
It may be noted that the _imum value of Ap occurs when
is O°; whereas the maximum value of PA occurs when _ is 45 °.
Maximum Power Loading as Limited
by Critical Mach Number
E_uation (3) shows that the power loading is proportional
to CLMJ. Increasing the lift coefficient generally decreases the
critical Mach number. The problem is therefore to find the value
of CLM and the associated section critical Mach number Mcr such
that the product of CIMMcr 3 is a maximum. In the present analysis
the critical Mach number of the blade section is assumed to be the
upper limit of efficient operation.i
Idealized sections.-Max. A. Heaslet of the Ames Aelonautical
Laboratory of the NACA has sho_ the relation between critical Mach
number and llft coefficient for various airfoils. As a limiting
caso an idealizedsection with elliptical thickness distribution
was used; this section carried lift with a fla_>-top lift distributionin which one-half of the lift was considered to act on the lower
surface and one-half, on the upper surface. Such an idealized section
has been used in the present paper to evaluate the _mntity C_Mcr3
for various thickness ratios.
8 NACATNNo. 1330
The method used for calctdatlng the critical speed of anairfoil at a given llft coefficient consist_ of first calculatingthe potential two-dlmensional pressure, distribution. (See references 2to 4.) The peak negative pressure is then corrected for compressi-bility, and the stresm Machn_nber is found at which the local Machnumber is unity. The lift coefficient for inco_presslble flow isthen corrected, for compressibility to this stream Machnumber. Thislift coefficient is desi_g9%atedCI_i end the corresDonding streamMachnumber is desi_znated Mcr. For s!mpllci_r and consistencyboth the peak pressure coefficient and the lift coefficient havebeen corrected in the present paper by n_ns of the Prandtl-Glauertfactor as follows:
CLiC4_
,_l - Mcr 2
and
CPM= ___c_?l__.
J
i/l - _r 2
In fi_,_re 2 the values of CL_IMcr3 " and n_ximt_¢ po_mr loading
P% x lotted ainst for ofhypothetical idealized airfoil sections, Lines of constant criticalMach nu_ber are also sho_. The figure shews bhat for those
idealized airfoil sections, the power leading becomes greater forthe higher lift coefficients. For exmrple, a 9-percent-thick airfoil
s8ction operating at CI¢4 = 0.3 has a critical Mach nt_ber of 0._)
and a power loading of 225 horsepower per square foot. A section
of the sam_ thicl_ess operating at Ci_,,i= 1.05 has a critical
Mach number of 0.7 a_d a power losAing of 540 horse p0w_r persquare foot. The maximum power loading occurs at the highest lift
coefficient at which the section operates. If the ct_ves__,,were_extended far enou_÷_'_they would have m_ximum value s o_ Ci_cr 5, but
the cumves were calculated only to a value of 1.6 for C_ since
this value already is hi_er th_u that norT:lallyobtained in practice.
Fig_rs 2 also shows the advantage of using thin airfoil sections
to absorb higher power. The power loading at CLM = 0.8 is 516 horse-
NACATNNo. 1330 9
power per square foot for a 6-_ercen_-thlck a_rfcll section and390 horsepower per square foot for a 15-p_rcent-thick airfoilsection. Thls conclusion regarding the effect of thlcknoss appliesonly for airfoils operating at the design lift coefficient.Because of hlgh peak pressures at other than the desi_ llft coeffi-cient, the thin airfoil sections maynot have the advantage shownby flgtu_e 2.
Conventicnal airfoil sections.- As pointed out by Heaslet theidealized sections are not practical airfoils, chiefly bec_Ise theelliptical thickness distribution would cause flow separation onthe afterbody; thus_ high drag would result. _e idealized sectionof a given thic!muess ratio, furthermore, represents a different shapeairfoil for each lift coefficient. Thus, the cttrvesin figure 2for 6-percent thickness represent not one airfoil shape but aninfinite numberof airfoil shapes of g_-psrcent thickness. In orderto determine how near conventional airfoils approach the idealizedsection in critical Machnumber and power loadingj tkree conventionalairfoils are comparedwith the idealized sections of the same thickness.
The three conventional airfoils are a Clark Y airfoil sectionhaving ll.7-percent thickness and 3.%_ercent camber, a Clark YMairfoil section with the s8methlclm_ess dSstribution but with9--percent camber, and an NACAl(_-seri_s airfoil of 12-percentthickness_ 5.5-percent camber_and a design lift of 1.0. E_e airfoilshapes are shownin figure 3. The coordinates of the first and secondairfoils are given _n reference 3 and the coordinates of the lastairfoil are in reference 4.
The critical Machnumber as determined theoretically is plottedin fig_me 4 for the conventional airfoils and the 12-percent-thickidealized airfoil. The crih_cal Machnumber for the idealized-airfoilcurve decreases with an increase in lift coefficient. Each conventionalairfoil is seen to approach the ctu,veof the idealized airfoil overa certain range of CLM. This favorable rar_e coincides approximatelywith the design or ideal lift of the particular airfoil. At lowvalues of the lift coefficient the critical _ch numbersmaybe lowbecause of the high velocity at the front lower stuTace of theairfoil.
Fi__are 5 gives the maximisnpowerloading fol _ the sameairfoils.The power loadings for the high-camber airfoils becomefavorableonly at the higher lift coefficients. At the high lift coefficients

i0 NACATNNo. 1330
the hig_h-c_mbersections have higher power loa_ings_an _o low-camber section. Somedoubt exists_ how_ver_ as to the _xi_luz liftcoefficient that can be used in practice without separation of flowresulting in low efficiency.
The design of the whole blade for a given operating condition isbeyond the scope of the present paper. If the entire area of apropeller or fan blade is considered, the average power loading ismuch lower than the _ximumpower loadingwhich refers only to theloading of _ isolated blade section operating at its criticalspeed. This difference occurs because the inboard sections areoperating at much lower streamMach n_bers and because the helixangle varies along the blade. The average power loading is probablyincreased by reducing the tip llft coefficient and increasing thetlp Machnumber; thereby, the power loading of the inboard sectionsis increased.
MaximumPower Loading as Limited by Flutter Speed
Flutter is a self-excited oscillation of a body caused by energyabsorbed from the air stre_u. This oscillation is usually vBry violentand destructive. The two principal types of flutter are classicalflutter and stall flutter. Classical flutter is an oscillatory_nstability of an airfoil operating in a potential flow. In goneral_such flutter requires at least two coupled ded_ees of freedom, suchas bending and torsion. Stall flutter is caused by separation offlow and occurs on airfoils operating near or in the stall conditionof flow. This type of flutter requires only or_ degree of freedom,usually torsion, and is generally attributed to the hysteresis inthe lift curve near stall.
In reference 1 the classical flutter speed and the divergencespeed are shownto be almost dle sm_ for propellers an¢l fans. Adesign sufficiently rigid to preclude divergence is usually safeagainst classical flutter. The aerodynamic moment_y howeverappreciably twist the blade at much lo_¢er speeds. This twistingmaychange the angle of attack sufficiently to cause stall flutter.
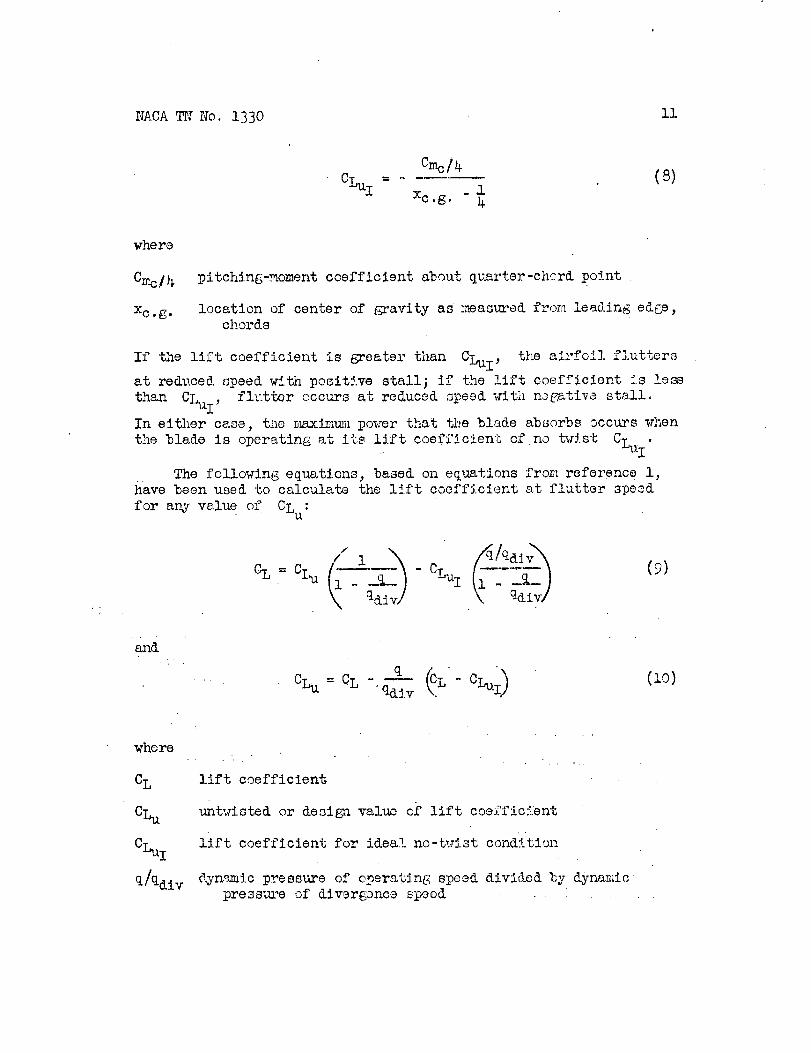
In reference 1 the stall flutter was seen to occur on a conventionalClark Y airfoil section when the blade twisted sufficiently toincrease the llft coefficient to about CL = 1.O. This value cannotbe ta_n as an absolute limit since the stall characteristic dependson Reynolds n_ber, Machnu_ber, and type of airfoil. No aerodynazdctwisting _ml_nt would be present on the blade if the aerodyn_u_ccenter of pressure of the blade section coincided with the center ofgravity of the section (reference 1). For this condition the bladedoes not twist until the divere_nce speed is reached. The relationfor this llft coefficient of no twist is given in reference 1 as
NACATN NO. 1330 ii
c /4 (8)Cu.i-r.. = Xc .g. . 1
k
where
pitching-moment coefficient about quarter-ci_ord point
location of center of gravity as measured from lea(ling edge,chords
If the llft coefficient is greatei" than CLul, the airfoil flutters
at reduced speed with posltlve stall; if the lift coefficient is l_ss
than CLuI , flutter occurs at reduced speed _¢ith n_gati_a stall.
In either case, the _mxlmuz_ipo_..'erthat the blade absorbs occurs when
the blade is operating at its lift coefficient of no twist CLu I.
The following equations, based on equations from reference l,have been used to calculate the l!ft coefficient at flutter speed
for a_j wlue of CLu:
-'_C - CLuT (9)
and
CLu CL q
where
CL
u
CLuI
q/qdlv
lift coefficient
untwisted or deslgnvaluo of lift coefficient
lift coefficient for ideal no-_ist condition
_.yn_mic pressure Of operating speed divided by dynamic
pressua_ of _iv._rganca speed
12 NACATN No. 1330
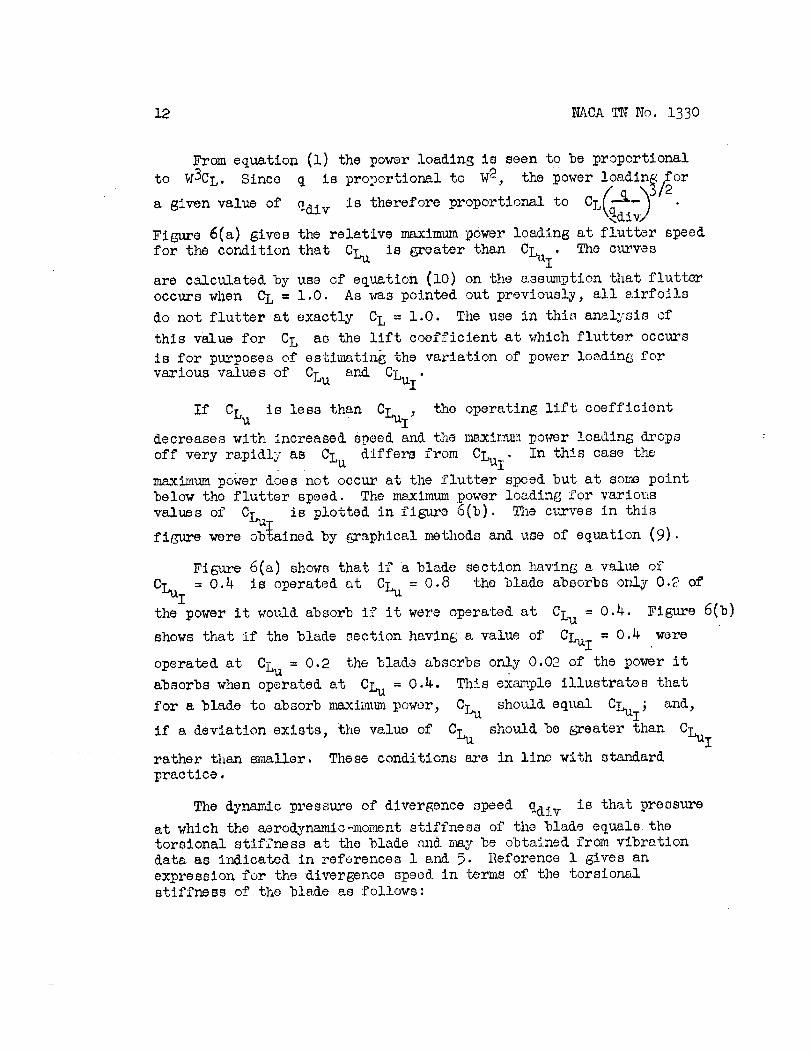
From equation (i) the power loading is seen to be proportionalto W3CL. Since q is proportional to W2, the power loading_or
a given value of qdiv is therefore proportional to CL_.___Bj/21_ q iv/ "
Figure 6(a) gives the relative maximum power loading at flutter speed
for the condition that CLu is greater than CLu I. The curves
are calculated by use of equation (lO) on the assumption that flutter
occurs when CL = 1.O. As vas pointed out previously, all airfoils
do not flutter at exactly CL = 1.O. The use in this analysis of
this value for CL as the lift coefficient at which flutter occurs
is for purposes of estimatin_ the variation of po_.Terloadin_ for
various values of CLu and CLu !.
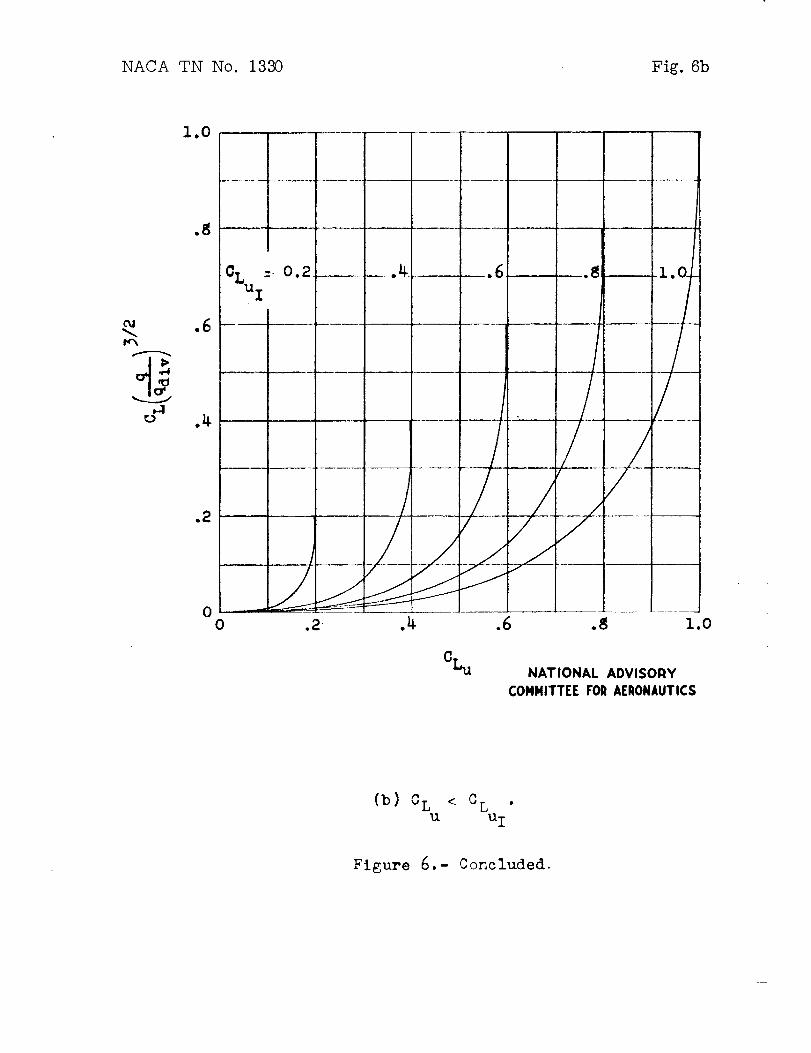
If CLu is less than CLuI, the operating lift coefficient
decreases with increased speed and the maxin_u_ power loading drops
off very rapidly as CLu differs from CLu I. In this case tl_e
maximum power does not occur at the flutter speed but at some point
below the flutter speed. The maximtun power loading for various
values of CLu is plotted in figure 6(b). The curves in this
figure were ob{ained by graphical methods and use of equation (9).
Figure 6(a) shows that if a blade section having a value of
CLu I = 0.4 is operated at CLu = 0.8 the blade absorbs only 0.2 of
the power it wo_uld absorb if it were operated at CLu = 0.4. Figure 6(b)
shows that if the blade section having a value of CLu I = 0.4 were
operated at CLu = 0.2 the blade absorbs only 0.02 of the power it
absorbs when operated at CLu = 0.4. This ex_:ple illustrates that
for a blade to absorb n_ximlun power, CLu should equal C!_I; and,
if a deviation exists, the value of CLu should be greater than CLu I
rather than smaller. These conditions are in line with standard
practice.
The dynamic pressure of divergence speed qdiv is that pressure
at which the aerodynamlc-mo_nent stiffness of the blade equals the
torsional stiffness at the blade nnd n_y be obtained from vibrationdata as indicated in references 1 and 5. Reference 1 gives an
expression for the divergence speed in terms of the torsionalstiffness of the blade as follo_,s:

NACATNNo. 1330 13
if
dm e.g. " %.(ll)
whe re
L representative length of blade, feot
c chord, feet
Xc. g. location of center of gravity as r_asured fron leading
edge, chords
K torsional stiffness of blade, foot-pound per radian
The torsional stiffness K is proportional to L_ where G is
the shear modulus of elasticity of the material and J is the torsion
modulus of the section. For thin sections, J is a_proximately
proportional to t3c where t is the thicl_qess of the section.
Equation (ll) may be written
(12)C_
Equation (12) shows that qdiv varies directly as the shear
modulus of the _._tei-ial,as the cube of the thickness ratio, and as
the square of the chord-length ratio and varies inversely as the
distance of the section center of gravity from the quarter-chordposition. For example, if the blade thickness is increased from
percent to 15 percent, qdiv is increased by a factor of "-"(1_)36
or 15.6. If a blade ismade with a sufficiently large thic]aqess
ratio or sufficiently large chord-len6_ch ratio, the flutter problem
can be eliminated entirely; This increase of ratios, however, isdone at the expense of more weight or of poor aorodynaz_.ic character-
istics and lower critical spceds.
The stall-flutter speed expressed in terms of dyna_d.c pressure
may be obtained from equation (lO) on the assuz_l_tion that flutter
occurs at a given lift coefficient CL. The equation is
14 HACATN No. 1330
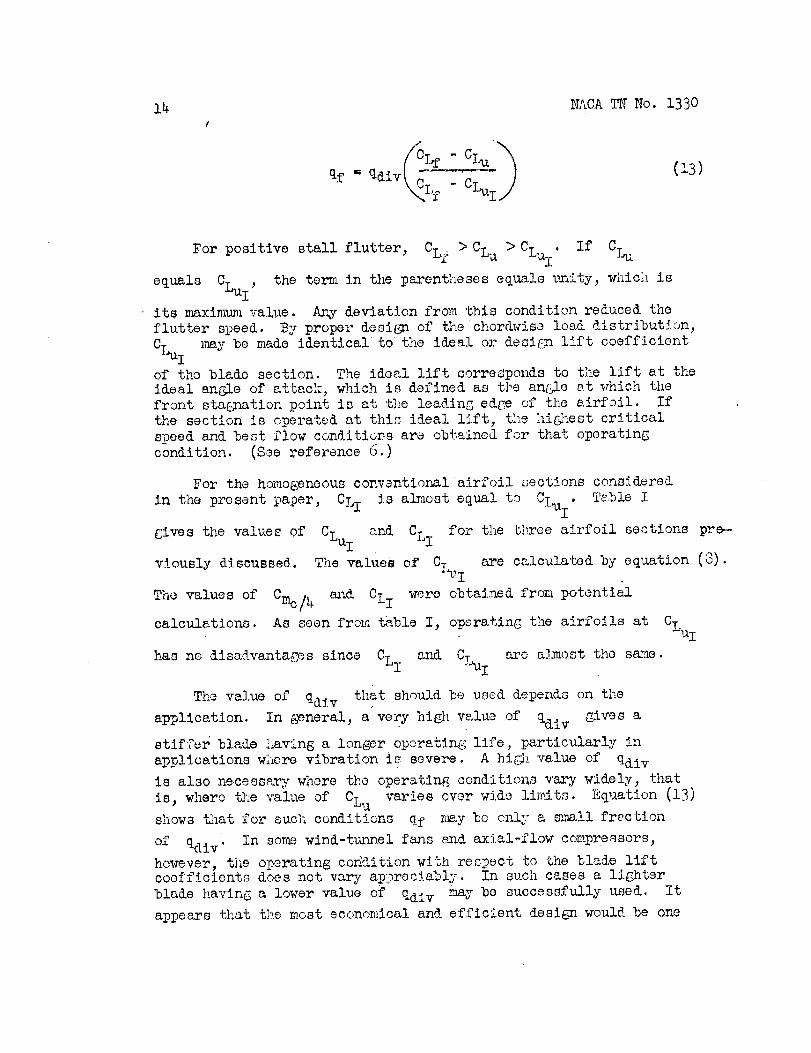
(13)
For positive stall flutter, CLf > CLu > CT_uI. If CLu
equals CLuI, the term in the parentheses equals pnity, which isits maximumvalue. AakVdeviation from this condition reduced theflutter speed. By proper doslgn of the chordwiso load distribution,CLu _mybe madeidentical to the ideal or desi6_ lift coefficientIof the blade section. The ideal lift correzponds to the lift at theideal angle of attack_ which is defined as tDe angle at _ich _efront stat_ation point is at _e leading edge of the airfoil. Ifthe section is operated at this ideal llft, the hi,lest criticalspeed and best flow conditions ar_ obtained for that operatingcondition. (S_e reference 6.)
For the homogeneousconwntio_zl airfoil sections considered
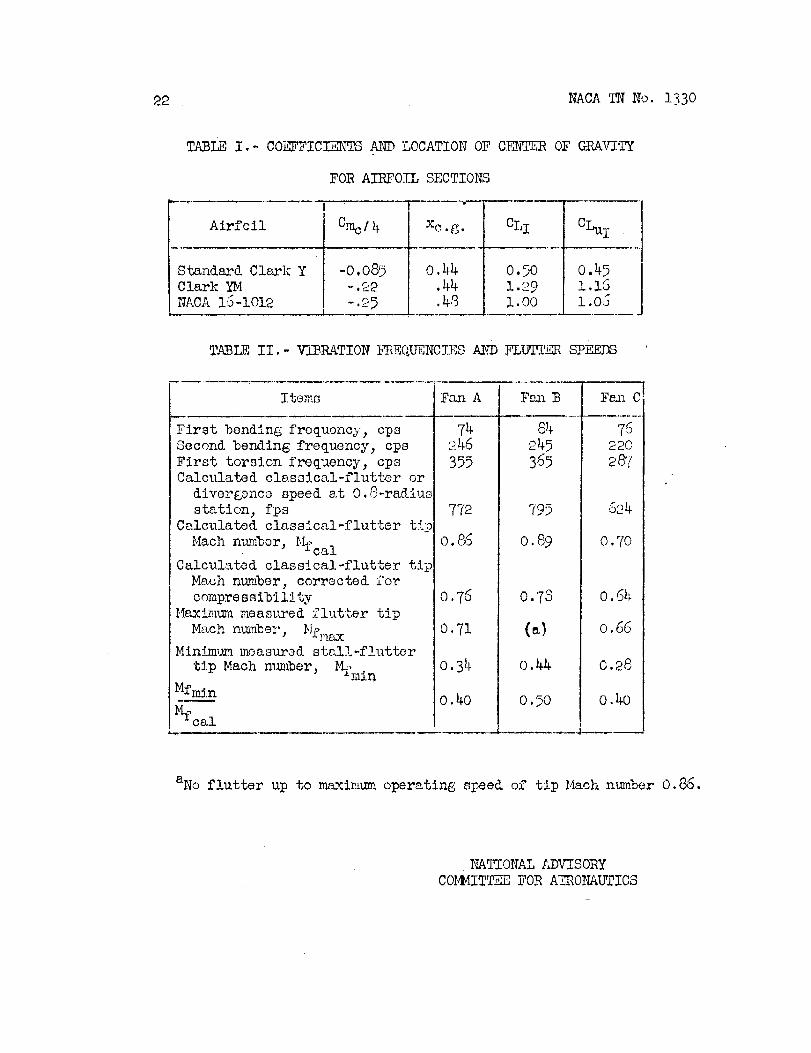
in the present paper, C!q is almost equal to CLuI Table i
gives the values of CLuI and CLI for the bhree airfoil sections pre-
viously dlscuBse_. The values of C!h_I are calculated by equation (8).
The values of Cmc/4 _]d CLI were obtained from potential
calculations. As seen from _%blo I, operating the airfoils at CLuI
has ne disadvantages since CLI and CLuI are agmost the s_e.
Th_ value of qd!v that should be used depends on theapplication. In generalj a very high value of qdiv giws astiffer blade having a longer oporatlng life, particularly inapplications where vibration is severe. A hi_ value of qdivis also necess_ry whore the operating conditions vary widely_ thatis, where _'_evalue of CLu varies owr wide limits. Equation (13)shows t_at for such conditions qf maybe only a small fr_ction
of qdiv' In somewind-tunnel fans sa_daxial-flow compressors,however, the operating co_ition with respect to the blade liftcoefficients does not vary appreciably. In such cases a lighterblade having a lower valu_ of qdiv maybe successfully used. itappears that the most economical and efficient design would be one
NACATN No. 1330 15
in which CLui of the blade wezBeq_m_lto the minimumoperatinglift coefficient for maximums,speed. In general, such a design givesthe highest critical speed as well as the 6re.atest flutber safety_a'gin for a given value of qdiv"
EX_?/_I}_fAL STUDIESOFFA_[FLUTTERAT HIGHLOADING
Equivalent and Test Procedure
Wind-turmel-fan models were tested _n the sa2,Dopen-returnt_mnel used for the tests of reference I. A dia_'_r_tic sketch ofthe test setup is sho_u%in fig_u'e 7. The blad_ tips w_re illuminat_dby stroboscopic light and obse_ed in o_ration by _ens of awindow in the tunnel vail. The b!adc load and CLu of the bladewere varied by _ans of Slats in the turmel exit. These sl_tschange the turn%elvelocity and ther_b} chsngo the ang]3 of attackof the fan blades.
The fans are msde ,_ laminated Sitka spruce an& have a s??eclfieg_avity of about 0.5 and a diameter of 45 inc1_es. B3ado-form c_esfor the fans tested are shownin figure 8. The fsms are a:J follows:
Fan A is a six-blade fan having conventional Clark Y airfoilsections. This fa_ is the s_ue as the fan designated in reference ias propeller A.
Fm_B is a fo_r-bl_Ae f;.unha'_ng Clark _ airfoil sections of9-percent c_bor. This f_ has the s_ne blade dimensions and llftdistribution along the blade as fea%A. Fan B is also operat,_d asa six-blade fan to obtain s<m_e_l,:_tt_r points at low lift coefficients,All data reported are tel[on f_or the four.-bl_,de f_uqexcept one dat_npoint at CLu = 0.4 in fi_e 9.
Fan C is the sa_e four-blade hig¢_-cam._berfan as f_ B but Withthe difference that one blade was weakenedby cutting out p_rt of thespruce and inlaying a balsa insert. The cut-out was necess_ry toweaken the blade in order to obtain flutter over a wide rea_geof CLu.The flutter speeds of fan C refer onl2 to the flutter of the voahenedblade. Cutting and inlaying the blad_ warped th_ blade sufficientlyto give it _about !!-percent camber. Th_ wd.ue o[_ CLUI for thissection is therefore not the s_uneas that giv,_n in table I for the9-percent-c_r_ber Clark I_4airfoil ssction.
16 NACATNNo. 1330
Results
Comparative measurementswere _de with the six-blade fan Aand the four-blade fan B to determine the flutter characteristicsjmaxlmumpowerloading, maxlmu_1llft coefficient, and efficiency ofthe two fans. The power loading is expressed in ter_s of horse-power per square foot. Each blade has an area of about 1/4 squarefoot.
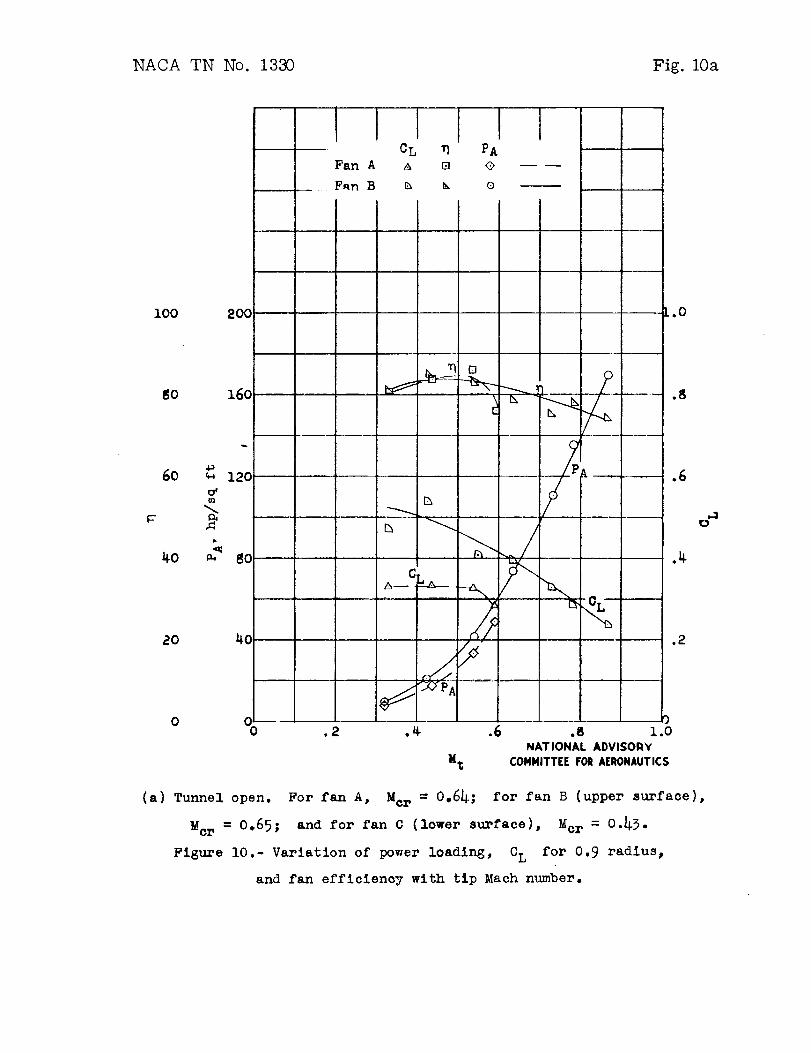
The results of these tests are given in figures lO(a) to lO(e).The efficiency is defined as the useful power _ivided by tho motoroutput as measuredby a strain-ga_e dyn_Llometer. The power is thointegral of dQAp_ where Q is the quantity rate of air flow throu_the fan and Ap is the pressure riso throu6_ the f_n. The absolutevalues of these measurementsare not vez7 good, but tho s_mesystematic errors apply to both fans; consequentl_T, the efficienciesshould be useful only for co_parlson purposes. The fan losses aredue to the drag of the airfoil sections and the rotational energvloss. Since the airfoil sections were s_mll and rough (_xlmumReynolds numberof 1,O00,O00), the section drag losses were probablyhigher then for full-scale fans. From the consideration of efficiency,there see_s to be little choice between the two fans.
The lift coefficients are given for the 0.9 radius. The liftu_e ncoefficients are obtained from total-pressure z_asvA_er_ents _ _"
behind the fans and by use of equation (6). The rotational-
velocity interference factor a' is low for the tip section ofthe fans tested. This factor was therefore neglected in the
determination of W for th_ calculation of the llft coefficient
(a' = o).
Since the model Reynolds nu_bers were small and the models were
rough, the r_zximtmllift coefficients are probably less than would beobtained with larger Reynolds n_.abers and s;;_oothermodels. Fan A,
having a conventional Clark Y airfoil section_ gave z_xlm_ liftcoefficients of 0.8 at the 0.9 radius aald of 0.9 on some of the
inboard sections. Fan B, having the 9-percent-c_uber Clark Y14
airfoil sections, gave _xi_.._amlift coefficients of about 1.O attlne 0.9 radius and of 1.4 at so_ of the inboard sections. Although
the hifgher-camber fan does give somewhat highor maxlnum lifts,these high lifts are obtained at some losses in efficiency. The
prediction of how much lift would be carried by fans oporating at
high Reynolds n_mbers_ without separation of flow occurring with
a resulting loss of efficiency, is dlffict,_t bgcause of some uncertainty
of the effect of Roynolds number on the ._x!mum llft.
The blade-tip twisting as a function of the llft coefficient
for constant fan speed is glwn for fan B in figure ll. The lift
NAOATN No. 1330 17
coefficient is given for the 0.9 radius and is calc_lated from totalpressure z_asurements as previously discussed. Tb twist at +hetip was observed by meansof' a stroboscope _zd was meam_edw_tha protractor on a telescope. Figmtre ii shows that for constantoperating speed the blade twisting defo_lation increases the _un;51eof attack at the high lift coefficients scuddecreases the angle ofattack at the low lift c_ef_,ic_,ents Note that a llft co_ffici3ntexists for which the blade twist is zero. This val_e of CL is by
definition the exl_erimental lift coefficient of no twist CIuI.
The value of CLuI for fan B is approximately 0.8 (fig. ii). Thisvalue is less than the theoretical value, l.16, for the Clark _4airfoil section given in table I .................... is believed tobe due to soctlon bo_.n_dary-layereffects. The experir_nta], vslue of
CLuI for fan A is giv'e:_ in reference 1 as 0.3]'. Although f_ B
has an experimental w_lue of CI_I less th_a%t_at predic+_& from
theory, the experimental value of CLuI is about tw/co that forfan A. A fan with the sam_section as fan _ can be employed at highllft coefficients with a greater margin of safety th_n can a low-ca_iber fan section.
The decrease of CL with tip Math n_¢ber as shownin figua_es 10(a)and 10(b) for fan B is _>bviously caused by the blade twisting lenddecreasing the angle of attack because the fan is operated at a i_ftcoefficient below the ezi_or!menta!!y determined value CL = 0.8.
t_IThe decreas_ of CL at h:t_l Mach numbers shown for fan B in
fig1_e 10(c) is prJI_mrily a compressibi!._ty effect au@nentod by the
blad_ twist_.ng in a ne_,ative direction because the center of pr-_sstu_e
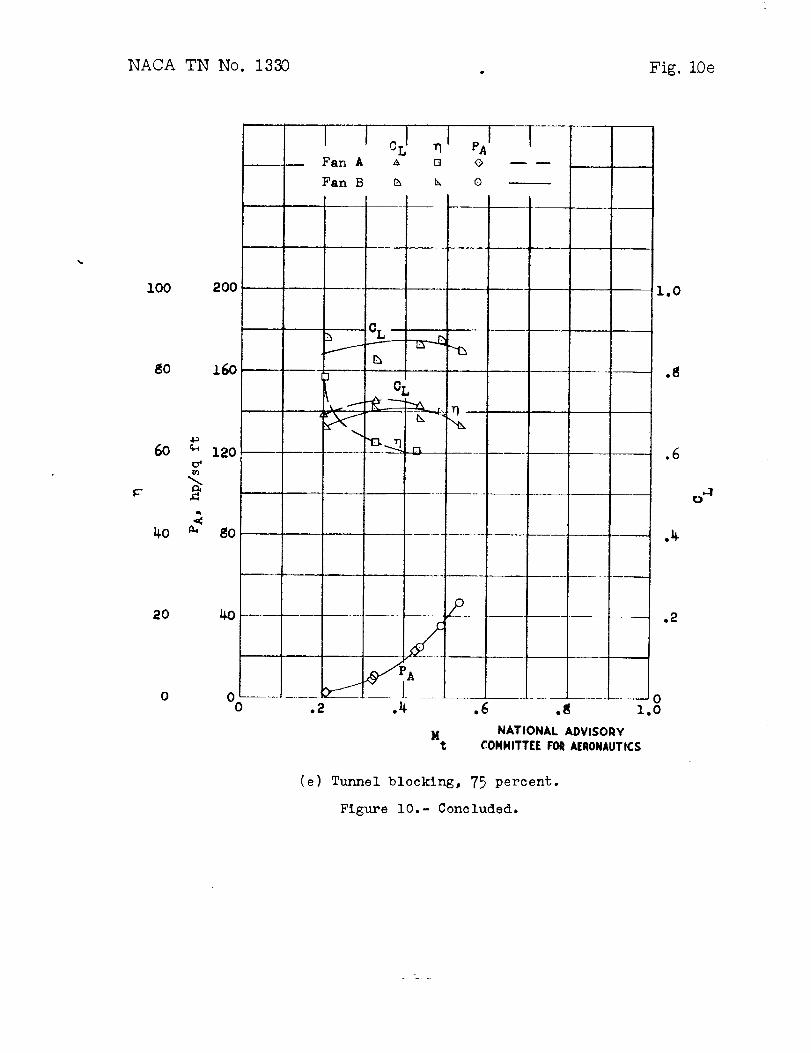
has _ov_d back at the }]ig/qMath n_nbers. Figures lO(d) and lO(e)
_ive results for both fans )partly sta!lod with restulting loweffic ie'ncy.
• ..
The power loading of the fans a;_ given in figvro i0 is expressed
in term_.sqf hprsepowe r .Dersquare foot. The _,_xim_u values obtained
in thes_ "bests are much below those shcwn in zi&ure_ 2 and 5 which
give thepr_tic_.l/va]:ues calculated on a basis of s.45° helix _gleand the critical Mach _-_er"0f an isolated section. For a f:_-:nof
which theM_ch number and helix angle va_:T treatl2 _rlth the r_(dius,the maximttm values given in figures 2 and 5 cannot be attained. For
9_n 8_ial-flow cempressor, however, of which the blades are short
and :_e to operate" a_:esSentially a co_Istainthelix s:nglb and Math
number., it_y be possible to attain a :9ower loading appr.oe,ching
that Given in figures 2 end 5. .........

18 NAOATNNo. 1330
The critical Machnumbers obtained from figure 4 are _ven infigure i0. The values of CL used for obtaining Mcr are takenat Mt = 0.4. Since CL changedwith tunnel conditions, thecritical Machnumbers are different. The critical Machnumbers ofboth the upper and lower surfaces Qf fan B are also indicated. Forfan B at low lift coefficients a high velocity peak occurs on thelower leading-edge surface; thus, a low critical Machnumberresults.This localized supersonic region does not seemto have muchsignificance. The conclusion is in agreement with the conclusionin reference 4, which states that the Machnumbersat which largechanges in airfoil c]mracteristics occur are difficult to predictespecially when s]_arppressure peaks exist at the leading edge. Infigure lO(b) no significant changes in the lift coefficient or theefficiency are seen to occur until the critical speed on the uppersurface has been exceeded. This drop in efficiency is probably dueto flow separation caused by shock, as pointed out in reference 7.These tests indicate that the critical speed of the upper surfaceas calculated by two-<L_mensional theory ls essentially a limitingspeed for efficient operation of ducted fans.
Oneof the most significant results of the investigation isgiven in figure 9. This figure gives the maximumpower absorbed interms of horsepower per square foot for fans A and B as a functionof the lift coefficient CLu at 0.9 radius. The curve for fan Arepresents the power absorbed as limited by flutter. The maximumpower loading is about lO0 horsepower per square foot of blade areaand occurs at a value of C_I of about 0.47. This result is infair agreement with the theory which shows that the maximumpower
loading should occur at CLuI of about 0.37 for fan A. Fan B did
not flutter at values of CLu between 0.5 to 0.85; consequently,this part of the curve is shownas a short-dash line. In thisrange the power is limitedby the maximumspeed of the motor. Thismaximumpower loading for fan B is beyond the limits of efficientoperation because the fan is operating in the supercritical speedregion. The flutter points were obtained at values of CLu of 0.4,0.88, and 0.92 and this part of the curve is shownas a solid line.The long-dash curve gives the po_r loading at the point where thefan efficiency has dropped to 80 percent. The power loading offan B reaches a maximumvalue of 150 horsepower per square footwhich is considerably greater t_hanthat reached for fan A.
The flutter point for fan B at CLu = 0.4 was obtained with
a six-b].ade fan; the points at CLu = 0.88 and CLu = 0.91 were
obtalnedwith the four-blade fan B. The steep slope of the power-
loading curve for fan B at the high and low lift coefficients

NACA _ _[o.i330 19
indicates that a fan having high-camber sections ca_ be used
successfully to absorb a large amount of power over a certain rangDof higj_ lift coefficients but that such blades have undesirable
flutter characteristics at the low lift coefficients.
The vibration frequencies and flutter speeds are given in
table II. The flutter speeds are calculated by the method ofreference 1 when the 0.8-radius station is used as the reference
station. The maxim_n and minimum _eastu_d flutter speeds _re sh_o
t_bulated. The minimum speeds are those obtained with the bl_zles
co_upletely stalled.
The _mximum_ flutter speed for fan A is somewhat loss than the
calculated classical-flutter spee(l corrected for compressibility.Finn C checks the calculations quite closely. Fan B had some
incipient flutter at a tip Mach number of 0.67 when_operating withthe tunnel open. This _ch number corresponds to t£e approxinmto
critical Mach n_ber of the upper blade surface for turn,el--opencondition. As the speed was increased into the .'_upercritical
region, this flutter disappeared and the blades operated Very
smoothly to the top speed of the zotor which corresponds to a tip
Mach number of 0.86. At these top speeds the blade lost most of
the lift necr the tip and, also, tw;isted in a negat!w direction.
Althou_ the ducted fan operated smoothly in the superc,ritical
region at speeds above the classical-flutter speed, it does notnecessarily follow that such will be the case for t}n_ee-dimenslonalbodie s.
The last row of table II gives the minimum measured stall-flutter
tip Mach nun_ber divided by the calculated classical-flutter tip
Mf1_LnMach nun_ber --. • This number is of particular interest when
_cal
fans are considered which n_y be required to operate in the
completely stalled condition. No re].iablo theory is available,
unfortunately, for predicting this minimunl flutter speed, which
varies for different blade-section shapes, blade plan form, bladen_.terials, and so forth. At present _kY design _hich is intended
to operate in the stalled condition should be tested b_ overspeedwhirl tests.
CONCLUSIONS
The results of the analysis and of tests made of t_o wind-ttum_el-
fan models to determine the effect of flutter speed and critical

20 NAOATNNo. 1330
Machn1_nberon the pover lo_dlng of the blade sections indicatedthe following results:
i. In spite of the fact that hi_:er lift coefficients result inlower critical speeds, the power that a blade section absoz'bs atthe critical speed is a 1:,mxi_umat the highest lift coefficient theblade section can develop. This fact applies to idealized sectionsand to conventional soctiona opermting near the ideal llft.
2. If flutter limits the operating speed, the fan absorbs themaxim_npo_Br when the blade is _esigned to operate at the llftcoefficient of no twist. _hen this lift coefficient and theideal or ¢lesi_ lift coefficient are identical, a blade operatingclose to its ideal lift has a n_xim_;1critical speed as well as an_.aximumflutter speed. An_r1_aberls.1deviation from the ideal llftcoefficient results in a _reatly reduced maxj_tnnpow6,rloading.
g
3. The anticipated increase of _gcwer !cading of the high-camber blade was obtained in t_.:etests. There was little difference
in the efficiency bet_en the Clark Y and the ]:,i$.'.-ca_oberClark _'_i
fans, but the hi_-c_uber blades developed so_what higher _'._imvz_llift coefficients. The hig_h-camber blades, however, were found to
have very poor flutter characteristics at the low lift coe_ _clents.
4. The fan efficiency decreased rapidly after the sonic velocity
on the upper blade surface of thefan sections was exceeded.
Langley Memorial Aeronautical LaboratoryNational Advisory Comn_Ittee for Aeronautics
Langley Field, Va. _ Apr_l 16, 1947
NAaATNNo. 1330 21
RgI_fERENCES
i. Theodorsen, Theodore, end Regior, _mthur A.: Effect of theLift Coefficient on Propeller Flutter. NACAACRNo. L5F30,1945.
2. Theodorsen, Theodore: Theory of Wing Sections of ArbitraryShape. NACARep. No. 411, 1931.
3. Theodorsen, Th,eodore, and Naiman, Irven: l_resstroeDistributionsfor Representative Airfoils and Related Profiles. NACATNNo. lO16, 1946.
4. Abbott, Ira ]{., yon DeeP,off, Albert E., and Stivers, Louis S._Jr.:Surmuaryof Airfoil Data. NACAACRNo. L5C05, ].945.
5. Theodorsen, Theodore, and Garrick, I. E,: Machanlsmof Flutter -A Theoretical and Experimental Investigation of the FlutterProblem. NACARep. No. 685 1940.
6. Theodorsen, Theodore, end Stickle, Gec_r6_W.: Effect of aTrailing-Edg_ Extension on the Ch_acteristics of a 2roDe].ler
Section, NACA AC_q No. L4121, 1944.
7. Stack, JohD: Ct]_rpressibleFlows in Aeronautics. Jcur. Aero. Scl.
vol. 12, no. 2, April 1945, pp. 127-148.
_2 NACATNNo. 1330
TABLEI.- COK_FICL-T_TSANDLOCATIONOFCENTEROFGRAVITY
FORAIRFOILSECTIONS
Airfcil
Standard Clark YClark YMNACAi_-1012
Cmc/4
-0,085-.22
i ....-.25
xc. g. CLI
O. 44 O.5O
.44 1._9
.43 i.o0
0.451.16
i .0_3
TABLE II.- V-JgRATION _EQUENCIED A_ FLUTTEqR SPEEDS
!toms Fan A Fan B Fm_ C!
First bending frequency, cps
Second bending frequency, cps
First torsion frequency, cpsCalculated classical-flutter or
dlverg_nco speed at O.@-radlus
station, fpsCalculated classical-flutter ti_
Mach n_mber, _'_cal
Calculated classical-flutter tip
Math number, corrected i'or
compressibility
Maxim_ meast_ed flutter tip
Mach n_uber, Mfmax
Minim'ammeasur.ad stall-flutter
tip Mach nun_er, Mfmin
Mfmin
Mfca I
74246
355
0.76
0.71
0.34
o.4o
84
_45
365
795
O. 89
0.78
o.44
0.50
76220
287
624
0.70
0.64
0.66
o.e8
o.4o
aNo flutter up to maximum operating speed of tip Mach number 0.86.
NATIONAL }_DVISORY
C0}4MiTTEE FOR A._RONADTICS

NACA TN No. 1330 Fig. i
&trY?
rfl
V
NATIONAL ADVISORY
COMMITTEE FOR AERONAUTICS
Pigure i.- Diagram of velocities and forces considered in
analysis.
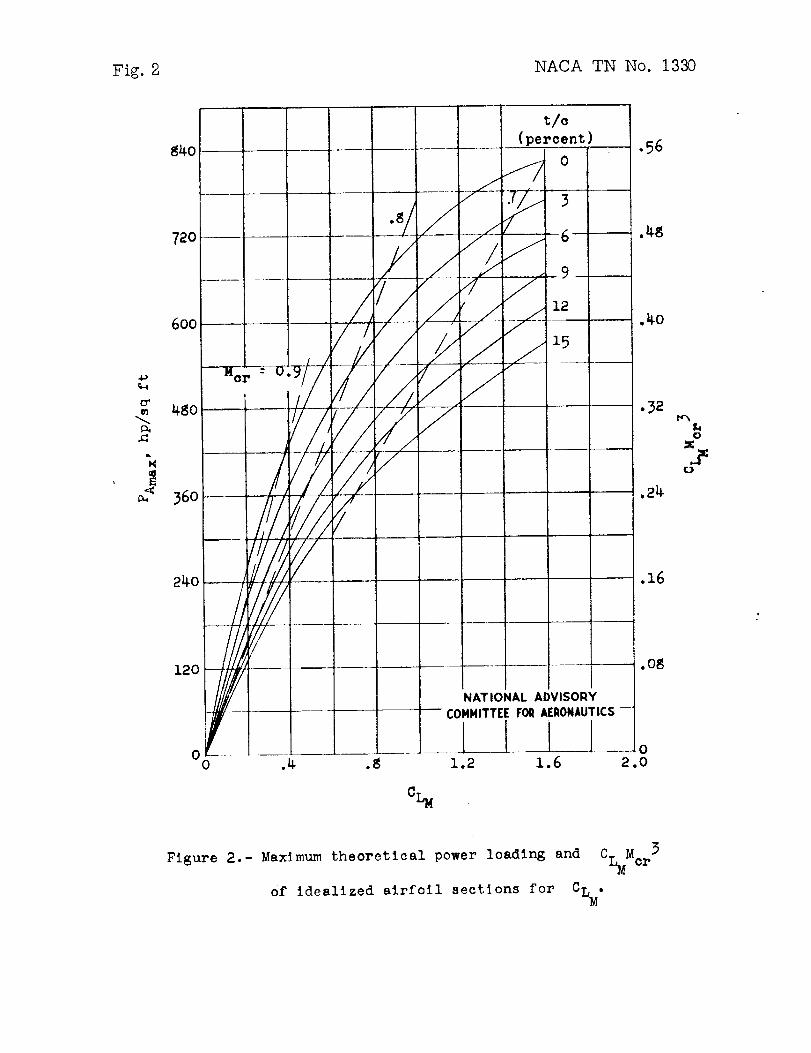
Fig. 2 NACA TN No. 1330
c_
600
360
120
!
NATIONAL ADVISORY
COMMITTEE FOR AERONAUTICS-
......L_I I l__o1.2 1.6 2.0
CL_
0
Figure 2.- Maximum theoretical power loading and CLMMcr3
of idealized airfoil sections for CLM.

NACA TN No. 1330 Fig. 3
.2o
-2O
Clark Y
I i I J I
.20
O
O
-2O
Clark YM
l t t l J
.2o
NACA 16-I012
rl ! I-2-0 .20 .40 .60
x, chords
NATIONAL ADVISORY
COMMITTEE FORAERONAUTICS
I J.80 1.00
F_gure _.- Shape of airfoil seclions.

Fig. 4 NACA TN No. 1330
!
I.I
v
r-4 ,-4 r-_
O
o,.o_,o a
,M O.M
I
t '-'-'-'TI
I I_ I
1 'If
I!
II
!I!
II
i
II_.IJID o_ .-..
)_0
4
--- t
.... IZI .. /
KI /e i
--44-- I /
/' '/
.1 I
/ \
\
\i
•\ t
. .
0
: _,4 "
)
--d- _
X
_- o
0 _
_ o._Z _,-I
,,,4
0
r4I ,,-t
r_
0
0

NACA TN No. 1330 Fig. 5
0
0o
0.,.40
O®_,_
m
0,,-_
I

Fig. 6a NACA TN No. 1333
CL u NATIONAL ADVISORYCOMMITTEEFO_AERONAUTICS
(a) CL > CL •
u u I
Figure 6.- Relative power loading at flutter speed as function
CL and CL . Flutter assumed at CL = i.O.
u uI
of
NACA TN No. 1330 Fig. 6b
1.O
.6
.4
.2
00
:. 0.2
.2
/ /
¢-J.4 .6 ._ 1.o
CLuNATIONAL ADVISORY
COMMITTEE FOR AERONAUTICS
(b) C L < CL
u u I
Figure 6.- Concluded.

Fig. 7 . NACA TN No. 1330
,0_
b ,_1
J"l
o
,lJ
ul
,,-4
A
o
Q
o
I .1_
o
0
I

NACA TN No. 1330 Fig. 8
.56
.4o
.32O
g
o._ .21t .4_
.16
.o_
\\
\
\\
\\
Fan_ran A
L
56
4_
4o
32
21,
16
0o .2 ._ .6
01.0
NATIONAL ADVISORYCOMMITTEE FORAERONAUTICS
Figure 8.- Blade-form curves.
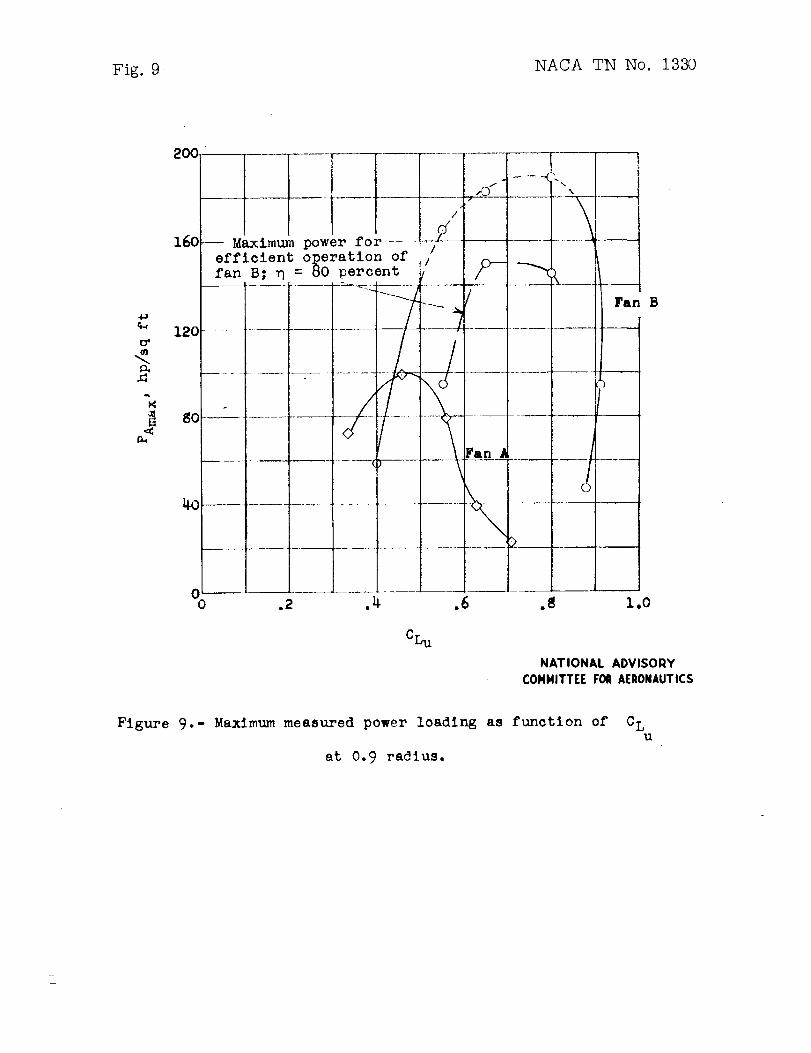
Fig. 9 NACA TN No. 1330
4_
c_
200
z6o
120
80
4O
00
i
-- Maximum power for ..... ,_-
efficient operation of _//fan B, _ = 80 percent /
I L '
I
I '.2 .4
i
!
E
rL
.6
CL u
, .0.-- 1| "-. I :'
I
/Fan
I
l I
f I
t.... t ....... _ _ -...,...-......,..__
\1
i i
i.... ]__ ! i
B
1.0
NATIONAL ADVISORY
COMMITTEE FOIl AERONAUTICS
Figure 9. - Maximum measured power loading
at 0.9 radius.
as function of cLu
NACA TN No. 1330 Fig. 10a
CL _ PA
Fan A _ D
F_n B _ _, o
i00 200 L.0
0 0o .2 ._ .6
M_
.8 1.0NATIONAL ADVISORY
COMMITTEE FOIl AERONAUTICS
,-3T.)
(a) Tunnel open. For fan A, Mcr = 0.64; for fan B (upper surface),
Ncr = 0.65; and for fan C (lower surface), Kcr = 0.43.
Figure I0.- Variation of power loading, CL for 0.9 radius,
and fan efficiency with tip Mach number.
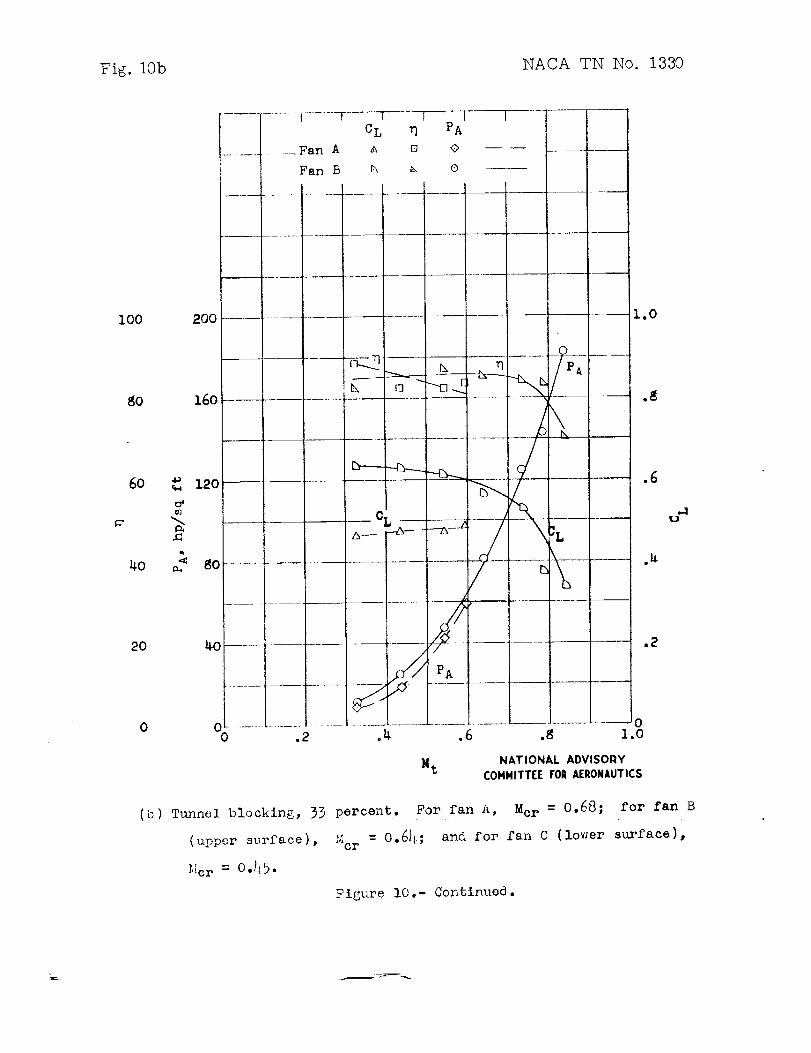
Fig. 10b NACA TN No. 1330
IO0
_O
6O
4o
2O
200
16o
120
t_
_ 8o
4oI
0
0
F........... [ ...... -r---7 .....I
.... Fan A
Fan B
,2
CL
D
r--_-qPA
[] <>
G
i I
.... _ __r___
M t
i
OL
----t ..... ]
I
I
I
/
.4
I!
/PA
q
I ............
PA
0.6 .g 1.o
NATIONAL ADVISORY
COMMITTEE FORAERONAUTICS
1.O
.8
.6
.n
.2
u
Tunnel blocking, 33 percent. For fan A, Ncr = 0.68; for fan B
•' = 0.6_; and for fan C (lower surface),(upper surface), _'_cr
Ncr = 0._5.
Figure I0.- Contlnued.

NACA TN No. 1330 Fig. 10c
l I I SCL _ PA
Fan A a Q _>
Fan B _ _ O
i00 200 I,0
i/o
8o 16o .8
60 _ 12o _ _ .6
/
20 40 • .2
o o0
o .2 .4 .6 ._ 1.o
MtNATIONAL ADVISORY
COMMITTEE FOItAERONAUTICS
(c) Tunnel blocking, _9 percent. For fan A, Mcr = 0.66; for fan B
(upper surface), Mcr = 0.611 and for fan C (lower surface),
Mcr = 0.50.
Figure i0.- Continued.
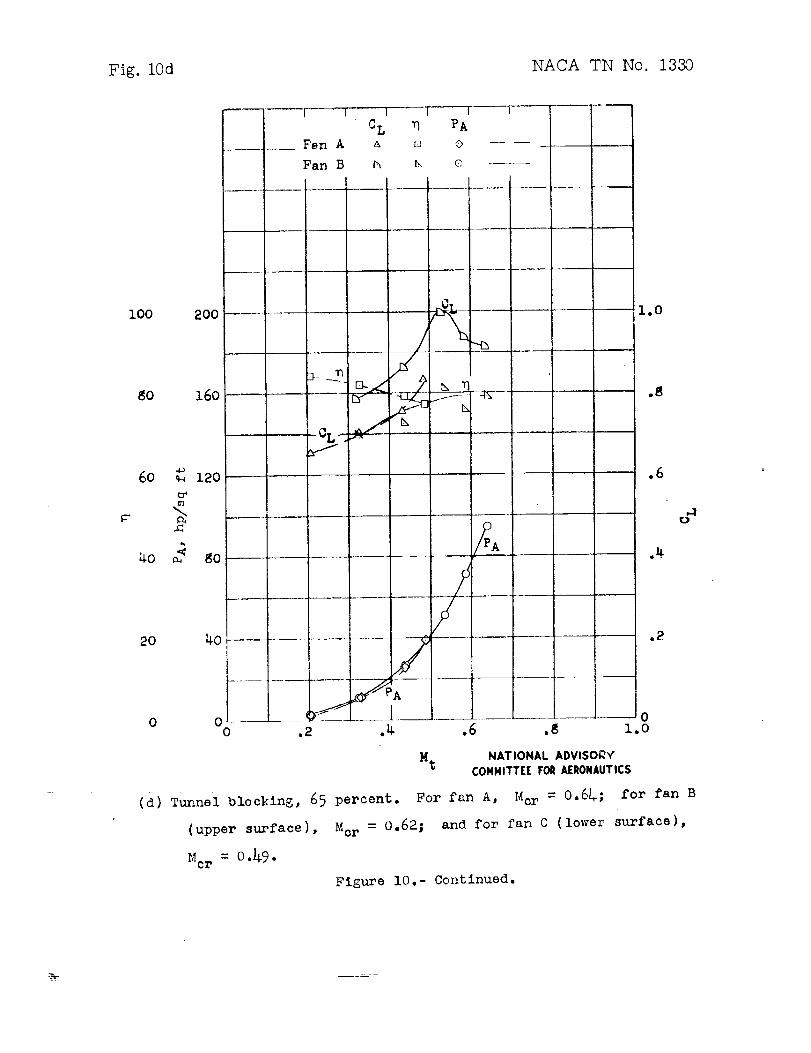
Fig. 10d NACA TN No. 1380
i00 200 1.O
80 160 .8
,-1
2O 40 .2
0 00 .2
0.4 .6 .8 z.o
N t NATIONAl- ADVISOI_Y'COICNITTEE FORAERONAUTICS
For fan A, Mot = 0.64; for fan B
_'cr = 0.62; and for fan C (lower surface),
(d) Tunnel blocking, 65 percent.
(upper surface),
Mot = 0.49.
Figure I0.- Continued.
NACA TN No. 1330 Fig. 10e
Fan A
Fan B
cLA
l[]
IP%o
iO0 200 1.0
p-
8O 160
60 _ 120
40 _ _o
%j I
pc"
cLf -a--_[a
"fh
"a
.8
.6
20 4o .E
o oo .2
(e)
.4
Mt
0.6 .8 l.O
NATIONAL ADVISORY
CONNITT£E FOltAERONAUTICS
Tunnel blocking, 75 percent.
Figure i0.- Concluded.
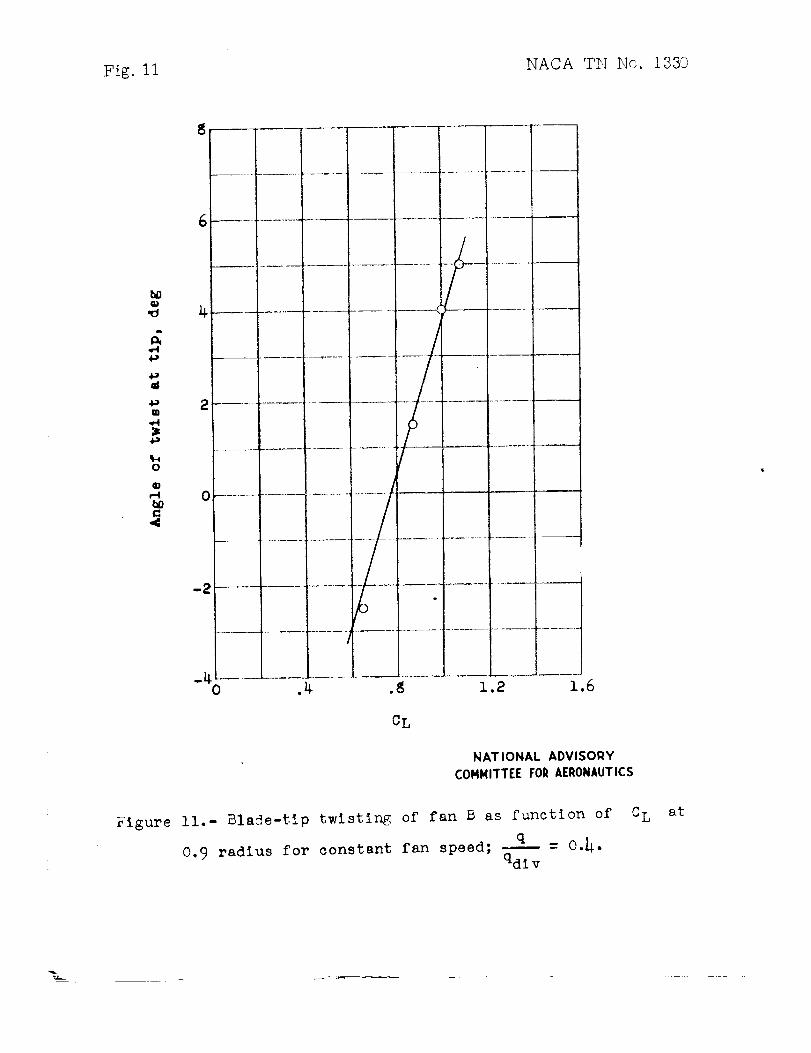
Fig. II NACA T[,I ]'<[c. 1330
ql
M
o
0
-2
-4
w
I
I6
i
!
4
!
I
0 .4
........ l-----ll
I
I
Ii
i
i
4...... _I_____4,
/
i !
r" iI
................T---<
-- -_]},.-. ...........
!
I.S 1.2 1.6
CL
NAT IONAL ADVISORY
CONNITTEE FOR AERONAUTICS
Figure II.- Blade-tip twisting of fan B as function of
0. 9 radius for constant fan speed; q - O.h.qdiv
C L at