Embed Size (px)
Citation preview
National Acoustic LaboratoriesNational Acoustic LaboratoriesCooperative Research Centre for HearingCooperative Research Centre for Hearing
*Speech Science, The University of Auckland, New Zealand*Speech Science, The University of Auckland, New Zealand** Audiology, Macquarie University** Audiology, Macquarie University
The application of cortical auditory The application of cortical auditory evoked potential recordings in infant evoked potential recordings in infant
hearing aid fittinghearing aid fitting
Maryanne Golding, Harvey Dillon, Suzanne C Purdy*,Maryanne Golding, Harvey Dillon, Suzanne C Purdy*,
John Seymour, Wendy Pearce, Lyndal Carter, Richard Katsch,John Seymour, Wendy Pearce, Lyndal Carter, Richard Katsch,
Mridula Sharma*Mridula Sharma***, Katrina Agung, Kirsty Gardner-Berry , Katrina Agung, Kirsty Gardner-Berry

Evaluation of aided functioning in infantsEvaluation of aided functioning in infants
Universal new born screeningUniversal new born screening
Early fitting of hearing aidsEarly fitting of hearing aids
Need for an evaluation methodNeed for an evaluation method
Confirmation Confirmation of fittingof fitting
Fine-tuning Fine-tuning neededneeded
Cochlear implant Cochlear implant neededneeded

So baby, how does it sound?So baby, how does it sound?
Objective hearing aid Objective hearing aid evaluation for: evaluation for:
• young infantsyoung infants• difficult-to-test difficult-to-test
peoplepeople

Language at 6 m onths after im plantat ionW ilks lambda=.71507, F(2, 28)=5.5785, p=.00914
< 12m 12m +
Im plant age c ategory
40
50
60
70
80
90
100
110
120
PLS
-4 standard scores
Cov ar iate means :MonFit: 10.97917
CA 6P_A C CA 6P_EC
Why the rush?Why the rush?Language ability 6 months after implantationLanguage ability 6 months after implantation
Why use Why use corticalcortical responses? responses?

Why cortical responses to evaluate hearing Why cortical responses to evaluate hearing aid fitting in infants?aid fitting in infants?
• Reliably present in awake young infants Reliably present in awake young infants
• More likely to correlate well with perceptionMore likely to correlate well with perception
• Can be elicited by a range of speech Can be elicited by a range of speech phonemes – close to desired outcomesphonemes – close to desired outcomes
• Stimuli handled reasonably by hearing aidsStimuli handled reasonably by hearing aids
• Can be very frequency specific if neededCan be very frequency specific if needed

Where do cortical responses Where do cortical responses come from?come from?

The end of the roadThe end of the road

Auditory cortex and current sourcesAuditory cortex and current sources
Sussman et al (2008)

Cortical responses in adults with Cortical responses in adults with normal hearingnormal hearing

AdultAdult
2.5
5.0
300.0 400.0
µV
0.0 100.0 200.0 500.0 600.0
0.0
-2.5
P2P2
N1N1P1P1

Adult grand mean waveforms at CzAdult grand mean waveforms at Cz
Tones
Speech

Cortical responses in infantsCortical responses in infants

InfantsInfants
ms
500.0 600.0300.0 400.0100.0 200.0-100.0 0.0
µV
0.0
5.0
10.0
15.0
-5.0
PP
NN

Maturational Maturational effects on effects on
cortical evoked cortical evoked response response
morphologymorphology
Ponton et al (2000)Ponton et al (2000)
• N=8-16 per grand meanN=8-16 per grand mean• Cz siteCz site• stimulus = 10 click train, stimulus = 10 click train,
2 ms ISI @ 65 dB SL2 ms ISI @ 65 dB SL• rate = 1.3/srate = 1.3/s
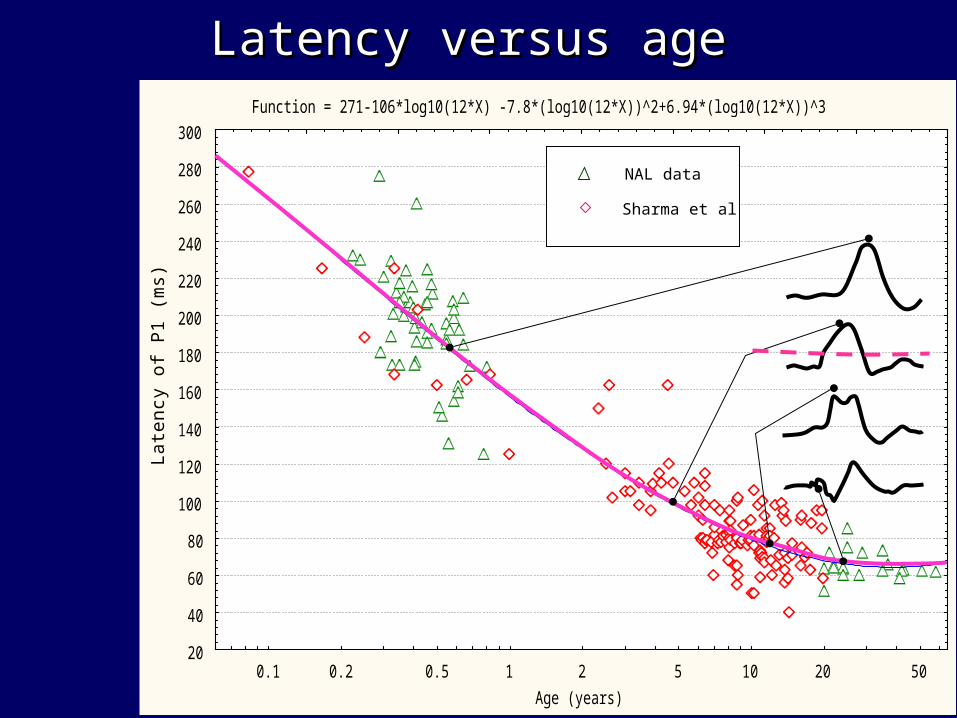
Latency versus ageLatency versus ageFunction = 271-106*log10(12*X) -7.8*(log10(12*X))^2+6.94*(log10(12*X))^3
0.1 0.2 0.5 1 2 5 10 20 50
Age (years)
20
40
60
80
100
120
140
160
180
200
220
240
260
280
300
La
ten
cy o
f P1
(m
s)
Sharma et al
NAL data
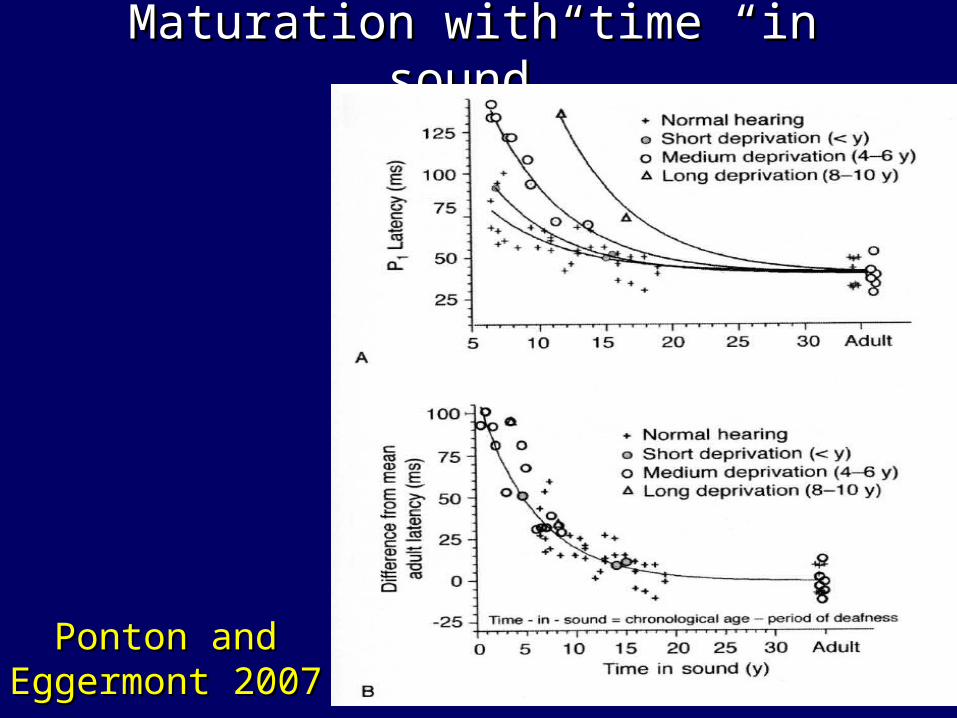
Maturation with time “in sound”Maturation with time “in sound”
Ponton and Ponton and Eggermont 2007Eggermont 2007

Auditory system maturityAuditory system maturity
Ponton and Eggermont (2007): Ponton and Eggermont (2007): Latency matures consistent with the time “in Latency matures consistent with the time “in
sound”sound”
Sharma (2002):Sharma (2002):Provided implantation occurs by 4 years of ageProvided implantation occurs by 4 years of age
Cortical responses in infants to Cortical responses in infants to different speech soundsdifferent speech sounds

Grand Average n = 16 infantsGrand Average n = 16 infants
+
MM
OO
OR
UU
AH
EE
SH
SS
ms
0.00 200.00 400.00 600.00-

ahah eeee mmmm oooo oror shsh ssss uuuu
ahah 77 44 77 77 1212 1212 1313
eeee 77 66 88 1111 1212 1010 99
mmmm 44 66 88 88 1010 1010 77
oooo 77 88 88 77 1313 1010 1313
oror 77 1111 88 77 1212 1010 77
shsh 1212 1212 1010 1313 1212 33 1414
ssss 1212 1010 1010 1010 1010 33 1111
uuuu 1313 99 77 1313 77 1414 1111
Number of subjects (out of 20) with Number of subjects (out of 20) with significant differences between responsessignificant differences between responses

Number of infants (N=20) with significantly different Number of infants (N=20) with significantly different cortical responses to pairs of stimulicortical responses to pairs of stimuli
Based on MANOVA at Cz, 101 to 500 ms post-onset, in eight bins each 50 ms
m vs t m vs g t vs g

Three stimuliThree stimulim g t
-20.0
-10.0
0.0
10.0
20.0
30.0
40.0
50.0
60.0
70.0
100 1000 10000
Frequency
1/3
oct
ave
SP
L
GAETAEMAEILTASS @ 65

Why Why notnot obligatory cortical responses? obligatory cortical responses?
• variable shape across agesvariable shape across ages• variable shape with auditory experiencevariable shape with auditory experience• variable shape from person to personvariable shape from person to person• variable shape from time to time (state of person, especially sleepiness)variable shape from time to time (state of person, especially sleepiness)• stimulusstimulus• Inter-stimulus intervalInter-stimulus interval
high skill level needed to read responses
An automated method of response
detection and response differentiation
Automatic detection of cortical Automatic detection of cortical responsesresponses

Desirable characteristicsDesirable characteristics
• No reliance on a templateNo reliance on a template
• Able to use information from Able to use information from contributing portions of waveformcontributing portions of waveform
• Able to discount non-contributing Able to discount non-contributing portions of waveform portions of waveform
Hotellings T2
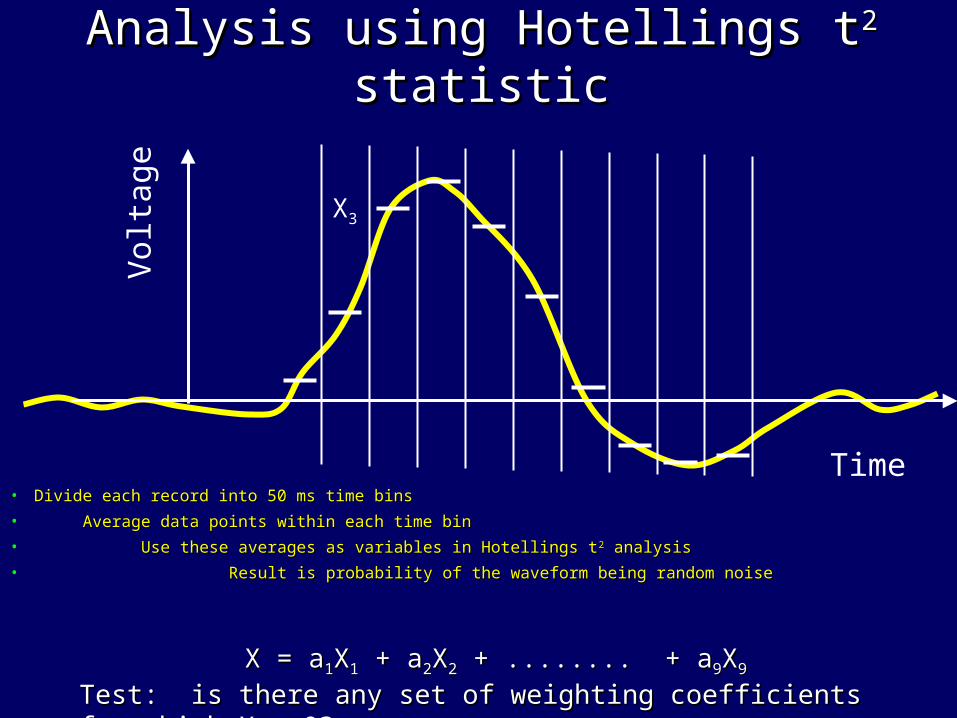
Analysis using Hotellings tAnalysis using Hotellings t22 statistic statistic
• Divide each record into 50 ms time binsDivide each record into 50 ms time bins
• Average data points within each time binAverage data points within each time bin
• Use these averages as variables in Hotellings tUse these averages as variables in Hotellings t22 analysis analysis
• Result is probability of the waveform being random noiseResult is probability of the waveform being random noise
Time
Vol
tage
X = aX = a11XX11 + a + a22XX22 + ........ + a + ........ + a99XX99
Test: is there any set of weighting coefficients for which X ≠ 0?Test: is there any set of weighting coefficients for which X ≠ 0?
X3
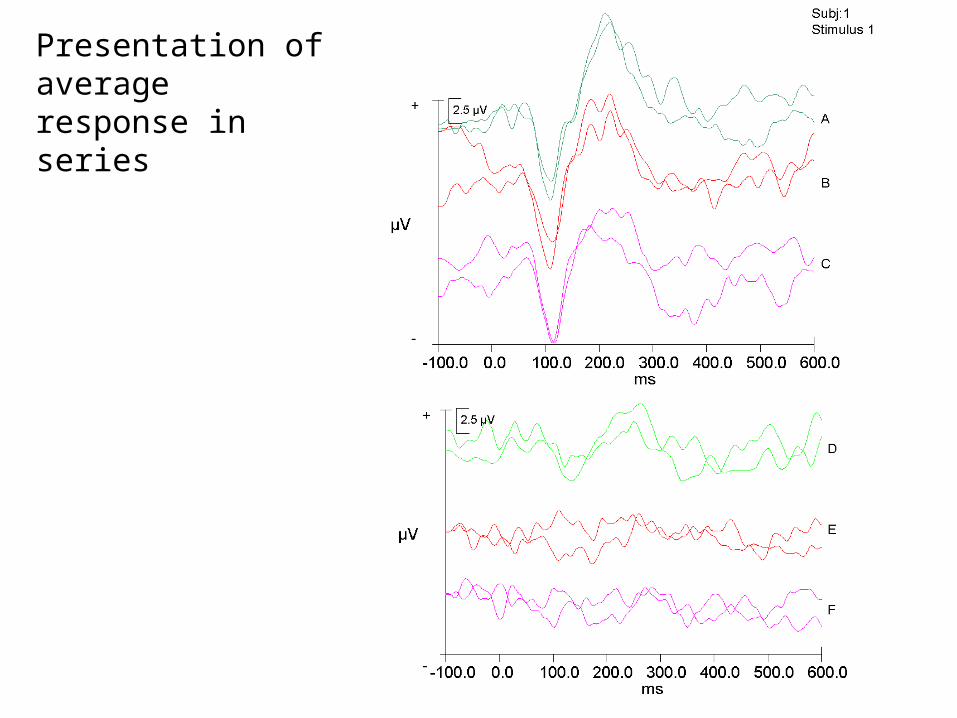
Presentation of average response in series

Receiver Operating Characteristics – Receiver Operating Characteristics – Expert judgesExpert judges
In-series - 60 presentations
0.00
0.20
0.40
0.60
0.80
1.00
0.00 0.20 0.40 0.60 0.80 1.00
Probability (response|no stimulus)
Prob
abili
ty
(res
pons
e|st
imul
us)
-10 dB
-10 dB
0 dB
0 dB
10 dB
10 dB
20 dB
20 dB
30 dB
30 dB1 - Specificity
Sen
siti
vity
d’

d’ results - for 60 stimulid’ results - for 60 stimuli
-1
0
1
2
3
4
-10 0 10 20 30
Sensation level (dB)
d'
HotellingsExperts - seriesExperts- isolation
For hit rate of 80% and false alarm rate of 5%,
d’=2.5

d’ results - for 200 stimulid’ results - for 200 stimuli
-1
0
1
2
3
4
-10 0 10 20 30
Sensation level (dB)
d'
HotellingsExperts - seriesExperts- isolation
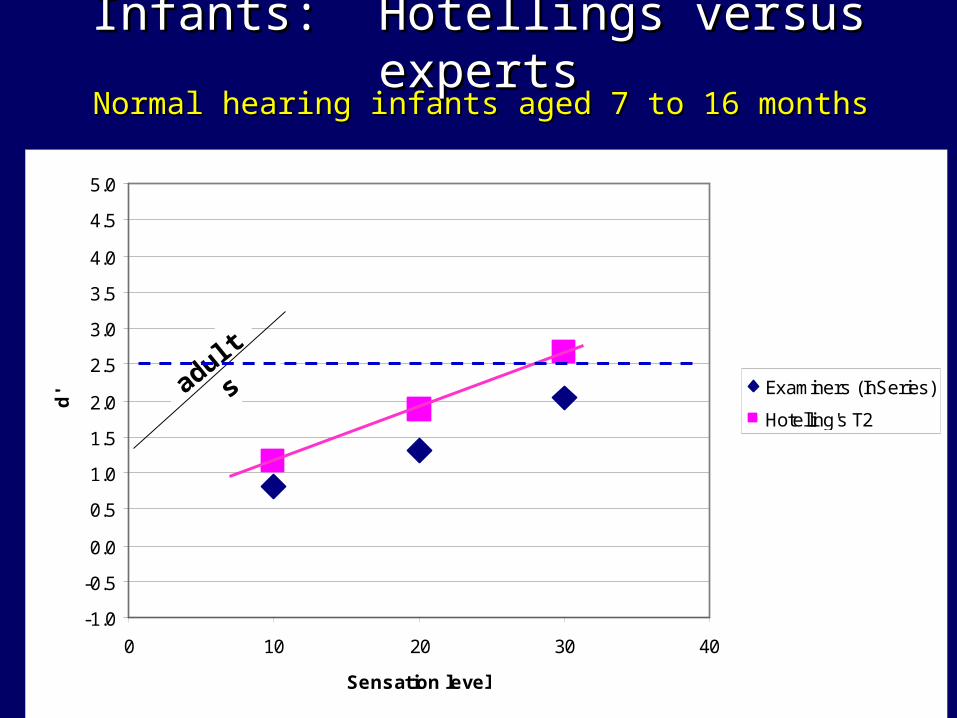
Infants: Hotellings versus expertsInfants: Hotellings versus expertsNormal hearing infants aged 7 to 16 months Normal hearing infants aged 7 to 16 months
-1.0
-0.5
0.0
0.5
1.0
1.5
2.0
2.5
3.0
3.5
4.0
4.5
5.0
0 10 20 30 40
Sensation level
d' Examiners (InSeries)
Hotelling's T2
adults

Growth of amplitude with SLGrowth of amplitude with SLadults; tonal stimuliadults; tonal stimuli
10 20 30
Sensation level (dB)
-1
0
1
2
3
4
5
6
7
N1 to P
2 amplitude (uV
)
Normal hear ing Hearing impaired

Loudness growth above thresholdLoudness growth above threshold
Hellman & Meiselman, 1990

Detectability Detectability (adults; tonal stimuli)(adults; tonal stimuli)
10 20 30
S ens ation level (dB )
-6
-5
-4
-3
-2
-1
0
z score
-6
-5
-4
-3
-2
-1
0
Norm al hearing Hearing im paired
P=0.05
P=0.01
P=0.001

………….. but infants move around !.. but infants move around !

Residual noise levels (for 100 epochs)Residual noise levels (for 100 epochs)
0.60.8
1.01.2
1.41.6
1.82.0
2.22.4
2.6
Residual noise level (uV)
0
10
20
30
40
50
60
70
80
90
100
No
of
ob
s
0 5
Adults
2.22.4
2.62.8
3.03.2
3.43.6
3.84.0
4.24.4
4.64.8
Residual noise level
0
2
4
6
8
10
12
14
16
18
20
22
24
26
28
30
No
of
ob
s
Awake infants

Proportion with responses present (p<0.05) Proportion with responses present (p<0.05) – normal hearing infants; 100 epochs– normal hearing infants; 100 epochs
0%10%20%30%40%50%60%70%80%90%
10 20 30
Sensation level (dB)
Noise <3.4 uVNoise >3.4 uV

Cortical responses and Cortical responses and functional performancefunctional performance
Do cortical responses tell us about Do cortical responses tell us about real-life auditory performance?real-life auditory performance?

• Parents are asked to describe their baby’s aural/oral
skills based on real-life experiences (listening in quiet
and in noise and alertness to environmental sound)
• Scores are assigned based on the number of observed
behaviors and how frequently these occur.
• Final overall score of 0 – 40 can be calculated (and
reported as a percentage).
Parent’s Evaluation of Aural/oral performance in Children (PEACH) Questionnaire

Functional deficit versus cortical score
* All aided childrenrs =0.60; n=24; p = 0.001
* SN onlyrs=0.61; n=12; p = 0.02
* MD onlyrs=0.82, n=5; p = 0.04
* AN onlyrs=0.36; N=7; p = 0.22
Reducing measurement variability Reducing measurement variability (random electrical signals) (random electrical signals)
Speeding up measurements Speeding up measurements Increasing validity of interpretation Increasing validity of interpretation

Active electrodesActive electrodes

Capacitive Coupling 50 Hz
Passive Electrodes
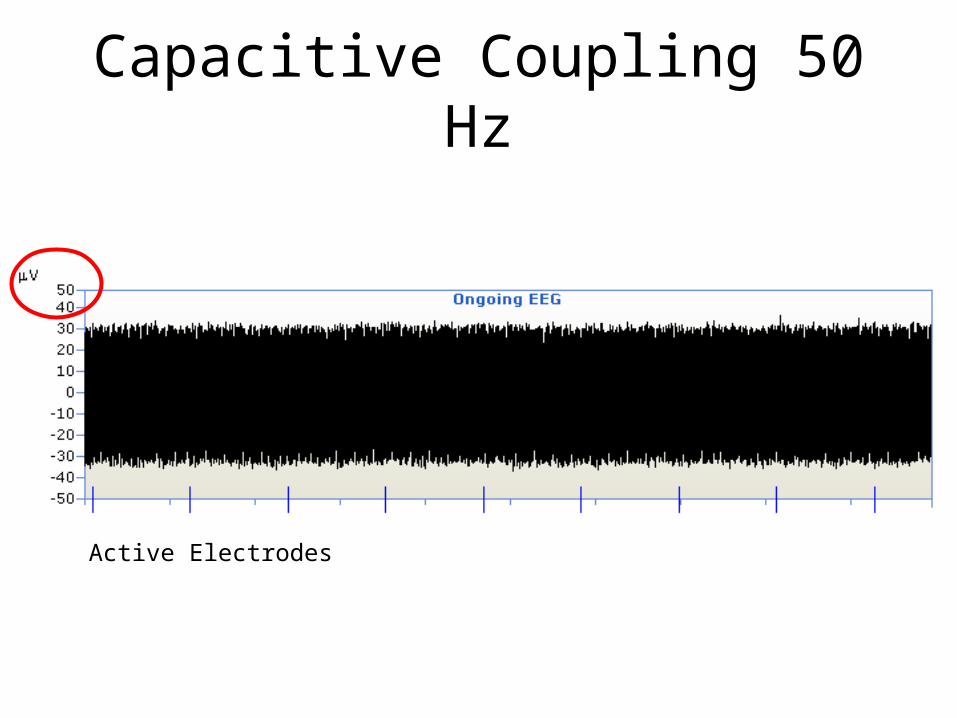
Capacitive Coupling 50 Hz
Active Electrodes
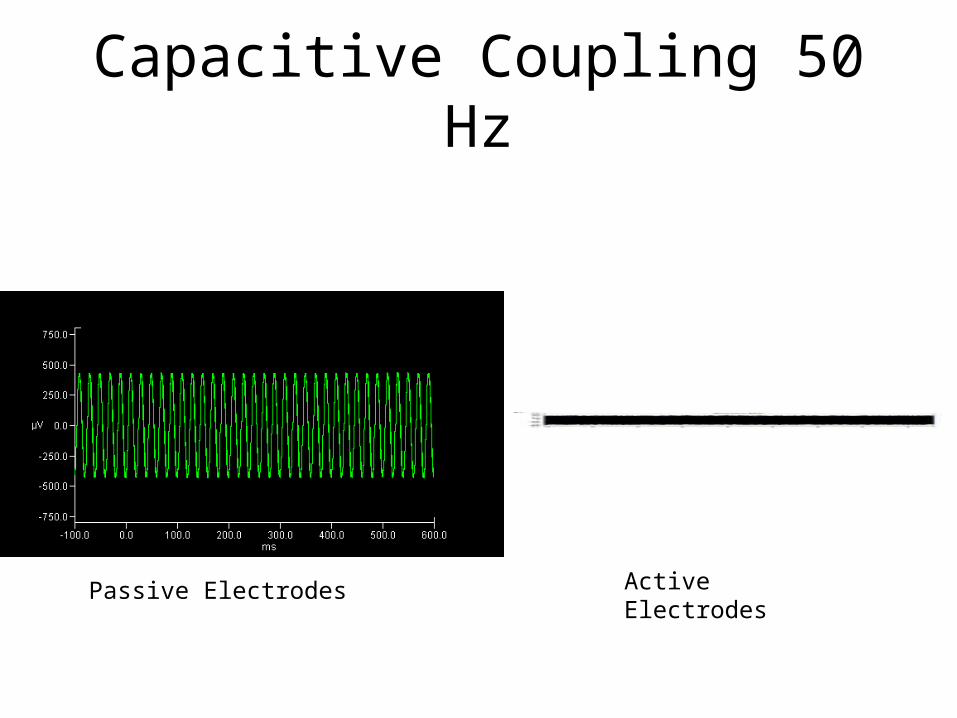
Capacitive Coupling 50 Hz
Passive Electrodes Active Electrodes

Finding thresholds with cortical Finding thresholds with cortical responsesresponses
What does an absent cortical What does an absent cortical response mean?response mean?

Cortical auditory evoked Cortical auditory evoked responses traditionally used for responses traditionally used for objective assessment of hearing objective assessment of hearing
thresholds in adultsthresholds in adults
• In 1965 Hallowell Davis showed good In 1965 Hallowell Davis showed good agreement between cortical and pure tone agreement between cortical and pure tone thresholds in childrenthresholds in children
• For many years cortical response audiometry For many years cortical response audiometry has been regarded as the “gold standard” for has been regarded as the “gold standard” for objective electrophysiological hearing objective electrophysiological hearing assessmentassessment

Davis (1965) Cortical evoked potential Davis (1965) Cortical evoked potential versus behavioural thresholdsversus behavioural thresholds

From: Rickards, F. et al (1996) Cortical Evoked Response Audiometry in noise induced hearing loss claims. Aust. J. Otol. 2 (3)

Clinical applications and Clinical applications and implicationsimplications
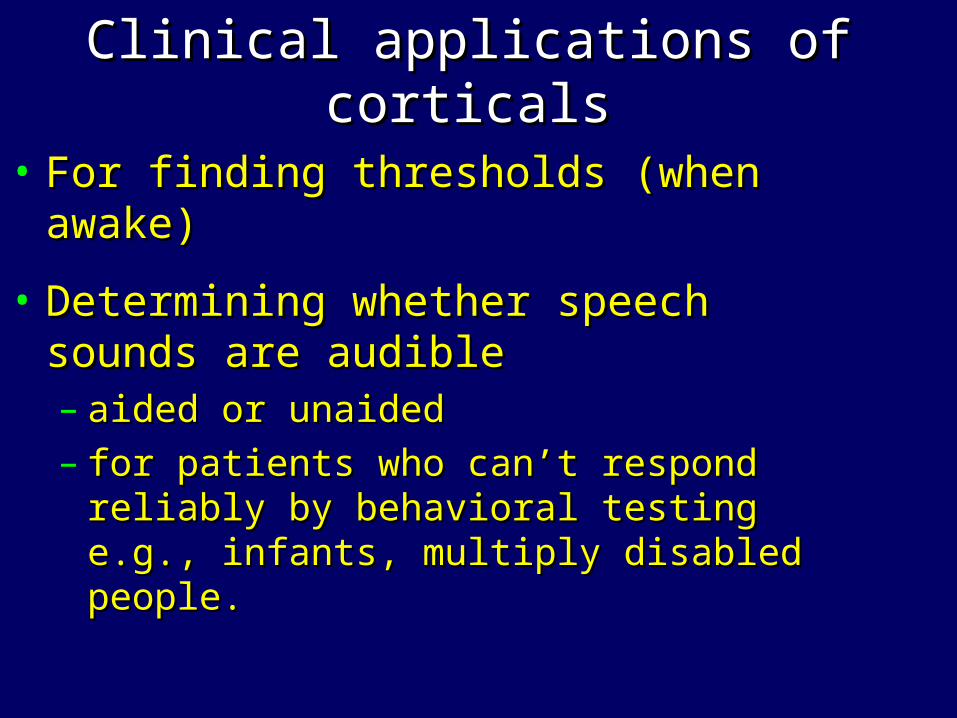
Clinical applications of corticalsClinical applications of corticals
• For finding thresholds (when awake)For finding thresholds (when awake)
• Determining whether speech sounds are Determining whether speech sounds are audibleaudible– aided or unaidedaided or unaided– for patients who can’t respond reliably by for patients who can’t respond reliably by
behavioral testing e.g., infants, multiply behavioral testing e.g., infants, multiply disabled people.disabled people.
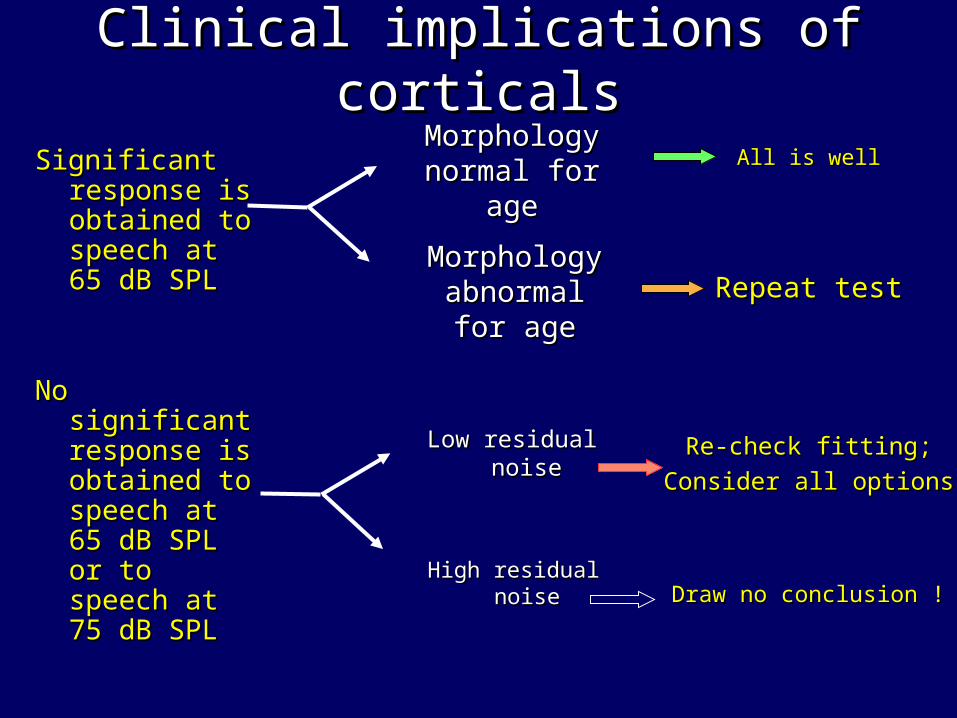
Clinical implications of corticalsClinical implications of corticals
Significant Significant response is response is obtained to obtained to speech at 65 speech at 65 dB SPLdB SPL
No significant No significant response is response is obtained to obtained to speech at 65 speech at 65 dB SPL or to dB SPL or to speech at 75 speech at 75 dB SPLdB SPL
Morphology Morphology normal for agenormal for age
Morphology Morphology abnormal for abnormal for
ageage
Low residual Low residual noisenoise
High residual High residual noisenoise
All is wellAll is well
Repeat testRepeat test
Re-check fitting;Re-check fitting;
Consider all optionsConsider all options
Draw no conclusion !Draw no conclusion !

Clinical implications of corticals (cont)Clinical implications of corticals (cont)
No /t/ No /t/ responseresponse
Draw no conclusions from missing Draw no conclusions from missing response !response !
Mixed results Mixed results (and noise is (and noise is
low)low)
No /g/ No /g/ responseresponse
No /m/ No /m/ responseresponse
Review HF gain Review HF gain or loss estimateor loss estimate
Review mid-freq Review mid-freq gain or loss gain or loss
estimateestimate
Mixed results Mixed results (and noise is (and noise is
high)high)
Review LF gain or loss Review LF gain or loss estimateestimate

Corticals for more advanced Corticals for more advanced measurementsmeasurements
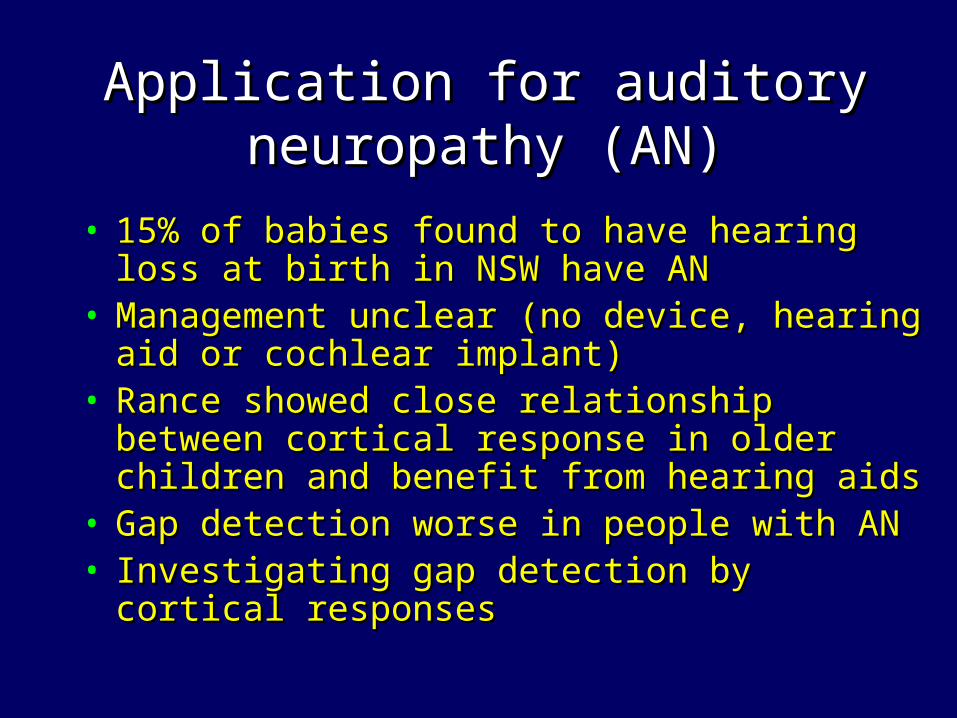
Application for auditory neuropathy Application for auditory neuropathy (AN)(AN)
• 15% of babies found to have hearing loss at birth 15% of babies found to have hearing loss at birth in NSW have ANin NSW have AN
• Management unclear (no device, hearing aid or Management unclear (no device, hearing aid or cochlear implant)cochlear implant)
• Rance showed close relationship between Rance showed close relationship between cortical response in older children and benefit cortical response in older children and benefit from hearing aidsfrom hearing aids
• Gap detection worse in people with ANGap detection worse in people with AN• Investigating gap detection by cortical responsesInvestigating gap detection by cortical responses

/Ah/ 2 second duration/Ah/ 2 second duration
ms-350.0 150.0 650.0 1150.0 1650.0 2150.0 2650.0
µV0.0
2.5
5.0
-2.5
-5.0
-7.5
OnsetGap
Offset
0msG.avg
50msG.avg
10msG.avg
20msG.avg
5msG.avg
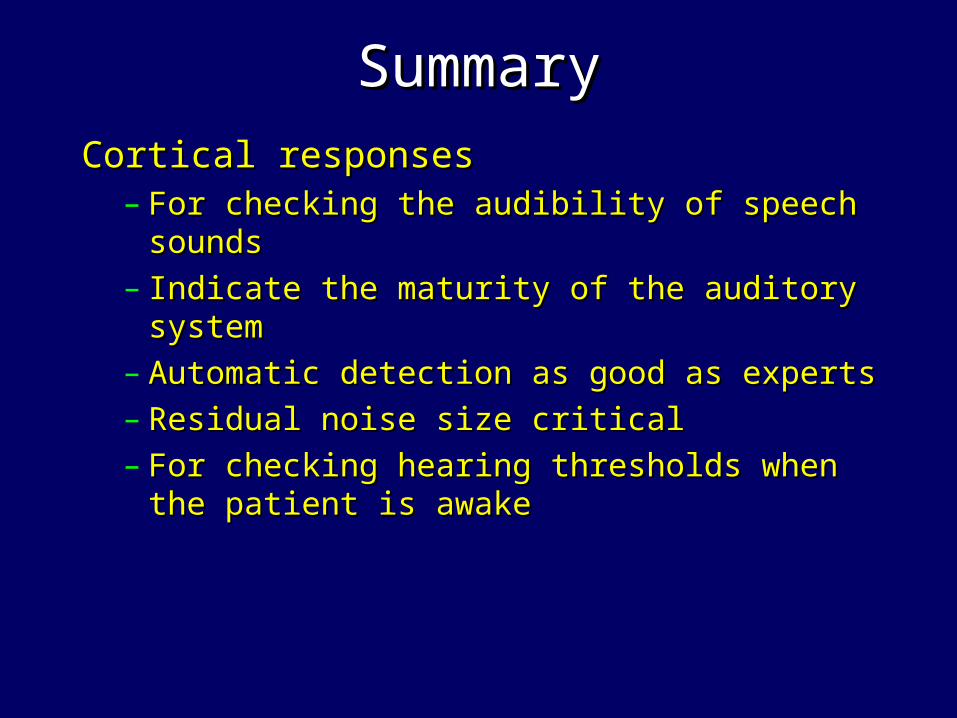
SummarySummary
Cortical responses Cortical responses – For checking the audibility of speech For checking the audibility of speech
soundssounds– Indicate the maturity of the auditory systemIndicate the maturity of the auditory system– Automatic detection as good as expertsAutomatic detection as good as experts– Residual noise size criticalResidual noise size critical– For checking hearing thresholds when the For checking hearing thresholds when the
patient is awakepatient is awake

Thanks for listeningThanks for listening
www.nal.gov.auwww.nal.gov.au