Embed Size (px)
Citation preview

Joseph L. Donaldson, Ph.D.
Assistant Professor
Mitch Naylor
Student Staff Assistant
University of Tennessee
June 24, 2015
NATIONAL 4-H HEALTHY LIVING: SUMMARY OF WALMART-FUNDED
PROJECTS
PRESENTED TO NATIONAL 4-H COUNCIL

2
National 4-H Healthy Living:
Summary of Walmart-Funded Projects
Contents
Executive Summary .............................................................................................................................. 3
Introduction ........................................................................................................................................... 6
Research Questions ............................................................................................................................... 6
Methods................................................................................................................................................. 6
Results ................................................................................................................................................... 7
Research Question One – What was the demographic composition and 4-H experience of
participants nationally? ..................................................................................................................... 7
Research Question Two – How were 4th – 7th grade participants influenced by the program, if at
all, in regards to their nutrition and physical activity? .................................................................... 13
Nutrition (4th – 7th grade participants) ........................................................................................ 13
Physical Activity (4th – 7th grade participants)............................................................................ 17
Research Question Three – How were 8th – 12th grade participants influenced by the program, if at
all, in regards to their nutrition, physical activity, and civic engagement? .................................... 19
Nutrition (8th – 12th grade participants)....................................................................................... 19
Physical Activity (8th – 12th grade participants) ......................................................................... 23
Civic Engagement (8th – 12th grade participants) ....................................................................... 24
Summary ............................................................................................................................................. 29
Conclusions ..................................................................................................................................... 29
Recommendations ........................................................................................................................... 31
References ........................................................................................................................................... 32
Acknowledgements ............................................................................................................................. 32
Appendices .......................................................................................................................................... 33
Appendix A – 4th – 7th Grade Healthy Living Instrument .............................................................. 33
Appendix B – 8th – 12th Grade Healthy Living Instrument ............................................................ 37
Appendix C – State Summary Information .................................................................................... 43
Data Analysis Team ............................................................................................................................ 44
Contact Information ............................................................................................................................ 44

3
National 4-H Healthy Living:
Summary of Walmart-Funded Projects
Executive Summary
Overview – Through the generous support of Walmart, National 4-H Council has engaged
Cooperative Extension 4-H programs throughout the country in local efforts aimed to improve the
nutrition knowledge, food choices, and physical activity of young people. Grantees are
implementing programs to improve specific behaviors (e.g., eating vegetables for a snack, reducing
consumption of high-fat foods, and balancing calories with physical activity) that lead to a healthy
lifestyle.
The grantees are required to use the 4-H Common Measures software and instruments for data
collection. The data collection includes two instruments completed by youth participants, one for
grades 4-7 and another for grades 8-12. Both instruments cover nutrition knowledge, physical
activity, and food choices; the instrument for grades 8-12 also includes awareness of community,
culture, and engagement and understanding.
Purpose – The purpose of this project was to analyze data files from participating states and create a
national picture of the 4-H Healthy Living programs funded by Walmart.
Methodology – Evaluation data was entered by state grantees in the 4-H Common Measures
software. National 4-H Council transmitted Statistical Package for the Social Sciences (IBM SPSS
Statistics) files to the University of Tennessee for analysis. SPSS version 21.0 was used for the data
analysis. The 4-7th grade instrument had 14 items, and the 8th-12th grade instrument had 20 items.
Not all states used all questions, and some states used additional questions. Missing values were
ignored through pairwise deletion; deleting only those missing values for a case rather than
excluding the case from the entire data set. Only descriptive statistics were used, for example, mean
and percentage.
Findings/Conclusion – The data file held 23,335 cases. The majority of students (66.1%) reported
that they were in grades 4-7 with a mean of sixth grade. Among 4th – 7th graders, seven in ten
(70.2%) were in their first year of 4-H participation. Among 8th – 12th grade respondents, half
(50.8%) were in their first year of 4-H participation. The majority of the 4th – 7th grade participants
were female (53.8%; n=10341), and the majority of the 8th – 12th grade participants were female
(59.7%; n=1829). The mean age of 4th – 7th grade participants was 11.30 years, and the mean age of
8th – 12th grade participants was 14.44 years. In regards to race, the majority of participants were
white for both the 4th – 7th graders (61.0%) and the 8th – 12th graders (53.0%). The majority of both
4th – 7th graders (72.2%) and 8th – 12th graders (86.5%) were not Hispanic or Latino.

4
The project produced many positive outcomes for young people. The youth responses to the
project’s outcome indicators indicate a progression from learning (knowledge and attitudes) to action
(choices and behaviors). Among the 20,061 participants in grades 4 – 7, the outcomes included:
Nutrition Knowledge
89.9% learned how to make healthy food choices.
89.4% learned why it is important for to eat a healthy diet.
Nutrition Choices/Behaviors
93.4% encourage their family to eat meals together.
86.2% drink more water.
82.4% eat more fruits and vegetables.
Physical Activity Attitudes
91.9% reported “being active is good for me.”
90.7% reported “physical activity will help me stay fit.”
Physical Activity Behaviors
80.0% report they “always” or “usually” do moderate physical activities like walking,
helping out around the house, raking leaves, or using the stairs.
65.6% report they “always” or “usually” exercise every day.
Among the project’s 3,274 participants in grades 8 – 12, the following outcomes were reported:
Nutrition Knowledge
85.6% learned the foods they should eat every day.
85.3% learned why it is important for to eat a healthy diet.
Nutrition Choices/Behaviors
78.2% make healthy food choices whenever they can.
76.0% think about what their body needs during the day.
Civic Engagement Knowledge and Skills
95.3% respect people from other cultures.
89.5% really care about their community.
Civic Engagement Intentions
59.3% are encouraged to volunteer more.
59.3% are interested in a career that helps others.
Participants in grades 8 – 12 were specifically asked about the amount of time they spend playing
video games, looking at a computer, smartphone, or tablet (for something that is not for school) on a
school day. The mean number was 2.51 (S.D.=1.692). However, more than one in five respondents

5
(21.1%, n=602) spent five or more hours playing video games, looking at a computer, smartphone,
or tablet (for something that is not for school) on an average school day.
Recommendations – The extent to which the outcomes were achieved indicate that the program was
successfully implemented. Given the positive youth outcomes produced for nutrition, physical
activity, and civic engagement, these programs should continue. The size and scope of this data file
(23,335 individual records) suggests that the 4-H Common Measures approach is a valuable
evaluation and reporting solution for projects funded by National 4-H Council and for the
Cooperative Extension System in general. All of the institutions made a uniform use of the 4-H
Common Measures instruments, and it is recommended that this consistency continue for future
projects. Youth programs must consider how youth spend their time using technology. It is
recommended that state and local 4-H professionals and volunteers discuss approaches to mediate
this phenomenon and its potential influences on youth health.

6
Introduction
National 4-H Council, through the generous support of Walmart, funded 24 grantees in the 4-H
Healthy Living initiative. These grantees were requested to use the same 4-H Common Measures
instruments (Le Menestrel & Walahoski, 2013) for program evaluation purposes. One tool was
provided for participants in grades 4-7 and a different tool for participants in grades 8-12.
The tool for grades 8-12 includes sections of the Citizenship Common Measures survey to assess
leadership development by the teens engaged with program planning and delivery. The goal was
84,000 youth participating in Walmart programming at the elementary and middle school levels and
1,500 teens engaged as leaders. For program evaluation purposes, the goal was at least 20%
participation in the evaluation. Program dosage was set at six hours for youth participants to have
their impact assessed. Evaluation data was entered by state grantees in the 4-H Common Measures
software.
Research Questions The following questions guided this study:
1. What was the demographic composition and 4-H experience of participants?
2. How were 4th – 7th grade participants influenced by the program, if at all, in regards to their
nutrition and physical activity?
3. How were 8th – 12th grade participants influenced by the program, if at all, in regards to their
nutrition, physical activity, and civic engagement?
Methods As previously stated, the project goal was 84,000 youth participating in Walmart programming at the
elementary and middle school levels and 1,500 teens engaged as leaders. For program evaluation
purposes, the goal was at least 20% participation in the evaluation. Program dosage was set at six
hours for youth participants to have their impact assessed. Evaluation data was entered by state
grantees in the 4-H Common Measures software. National 4-H Council transmitted Statistical
Package for the Social Sciences (IBM SPSS Statistics) files to the University of Tennessee for
analysis. SPSS version 22.0 was used for the data analysis.
The 4-7th grade instrument had 14 items (Appendix A), and the 8th-12th grade instrument had 20
items (Appendix B). Not all states used all questions, and some states used additional questions. Any
additional questions were not considered in this analysis. It should be noted that the total number of
respondents per question varies as not all respondents answered all questions. Percentages listed
throughout this report describe the total number of respondents who answered the question rather
than the total group of students participating in the survey.
Missing values were ignored through pairwise deletion; deleting only those missing values for a case
rather than excluding the case from the entire data set. Only descriptive statistics were used, for
example, mean, mode, and percentage; inferential statistics were not reported. The summary
provided here uses text, tables, and graphs to address the research questions. In some cases, the
7
strongly disagree and disagree responses were collapsed to show disagreement, and agree and
strongly agree responses were collapsed to show agreement which is a common method for
simplifying and describing responses (Donaldson, 2014).
Results
Research Question One – What was the demographic composition and 4-H experience of participants nationally?
Of the 22,154 youth surveyed who answered the question regarding grade, the majority of students
(66.1%) were in grades 4-7 with a mean of sixth grade (μ: 6.05; S.D.: 2.358). The largest single
grade of participants was the 5th grade (n=4540; 20.5%), followed by the 4th grade (n=4474; 20.2%),
and 6th grade (n=3007; 13.6%). The smallest group of respondents by grade were 12th graders
(n=406; 1.8%). See Table 1 for program participants’ grades in school.
Table 1
Grades in School of Program Participants
Grade N (22,154) % (100%) μ (S.D.)
4th grade 4474 20.2 6.05 (2.358)
5th grade 4540 20.5
6th grade 3007 13.6
7th grade 2623 11.8
8th grade 2500 11.3
9th grade 948 4.3
10th grade 844 3.8
11th grade 648 2.9
12th grade 406 1.8
Othera 2164 9.8 a Includes all other answers provided.
Note. The above chart reflects students’ self-identified grades, and may not reflect their true grades.
Among 4th – 7th graders, seven in ten (n=12818; 70.2%) were in their first year of 4-H participation.
Less than two in ten (n=3245; 17.8%) were in the second year of 4-H and more than one in ten
(n=2202; 12.1%) had been in 4-H three or more years. The mean was 1.42 years of 4-H
participation.
Among 8th – 12th grade respondents, the mean was 1.83 years of 4-H participation. Half of the
participants (n=1380; 50.8%) were in their first year of 4-H participation, followed by participants
with three or more years of experience (n=921; 33.9%) and second year participants (n=418; 15.4%).

8
Regarding weekly hours spent in 4-H, the 8th – 12th graders (μ=1.83; S.D.=.795) tended to spend
slightly more time than the 4th-7th graders (μ=1.65; S.D.=.741). The highest percentage of both 4th –
7th graders (n=9286; 50.9%) and 8th – 12th graders (n=1244; 41.2%) reported spending less than one
hour per week in 4-H. The highest percentage of 4th – 7th graders were involved in in-school 4-H
programs (n=10954; 54.6%), followed by clubs (n=4449; 22.2%), after-school programs (n=3602;
18.0%), and community service projects (n=2144; 10.7%). The highest percentage of 8th – 12th
graders were involved in in-school programs (n=1397; 42.7%), followed by clubs (n=1264; 38.6%),
and camps (n=865; 26.4%). Interestingly, 18.4% of 8th – 12th graders (n=604) reported working on
projects at home compared to 7.8% of 4th – 7th graders (n=1573). See Table 2.
Table 2
4-H Experiences of Program Participants
4-H Experiences
4th – 7th grade
participants
8th – 12th grade
participants
N % μ (S.D.) N % μ (S.D.)
Years Participating in 4-H 18265 100 1.42(.696) 2719 100 1.83(.904)
First Year 12818 70.2
1380 50.8
Second Year 3245 17.8 418 15.4
Three or More Years 2202 12.1 921 33.9
Weekly Hours Spent in 4-H 18259 100 1.65(.741) 3017 100 1.83(.795)
Less than one hour 9286 50.9
1244 41.2
Between one and three hours 6033 33.0 1029 34.1
More than three hours 2940 16.1 744 24.7
4-H Involvement a
Clubs 4449 22.2 1264 38.6
Camps 1892 9.4 865 26.4
After-school programs 3602 18.0 784 23.9
In-school programs 10954 54.6 1397 42.7
Local fairs/events 1728 8.6 807 24.6
Community service projects 2144 10.7 636 19.4
Working on projects at home 1573 7.8 604 18.4
Other 1794 8.9 649 19.8
a4-H Involvement does not equal 100% as respondents were asked to indicate each method that
applied to them.

9
The mean age of 4th – 7th grade participants was 11.30 years (S.D.=2.193), and the mean age of 8th –
12th grade participants was 14.44 years (S.D.=1.834). The majority of the 4th – 7th grade participants
were female (53.8%; n=10341), and the majority of the 8th – 12th grade participants were female
(59.7%; n=1829). The largest percentage of 4th – 7th grade participants were white (n=9072; 61.0%)
followed by black or African-American (n=4277; 28.8%). Similarly, the largest percentage of 8th –
12th grade participants were white (n=1440; 53.0%) followed by black or African-American
(n=1015; 37.4%). The majority of both 4th – 7th graders (n=13390; 72.2%) and 8th – 12th graders
(n=2514; 86.5%) were not Hispanic or Latino. Table 3 shows the number of respondents by age,
gender, race, and ethnicity.

10
Table 3
Age, Gender, Race, and Ethnicity of Program Participants
4th – 7th grade participants 8th – 12th grade participants
N % μ (S.D.) N % μ (S.D.)
Age 19099 100 11.30(2.193) 3143 100 14.44(1.834)
≤9 3409 17.9 27 <1
10 4002 21.0 69 2.1
11 4197 22.0 37 1.1
12 2944 15.4 105 3.2
13 2039 10.7 745 23.7
14 831 4.4 778 24.8
15 620 3.2 509 16.2
16 508 2.7 425 13.5
17 283 1.5 276 8.8
18 109 <1 150 4.8
Other
157 <1 22 <1
Gender 19227 100 3064 100
Female 10341 53.8 1829 59.7
Male 8886 46.2 1235 40.3
Ethnicity 18541 100 2905 100
Hispanic or Latino 5151 27.8 391 13.5
Not Hispanic or Latino 13390 72.2 2514 86.5
Race 14866 100 2715 100
American Indian or
Alaskan Native 1066 7.2 199 7.3
Asian 269 1.8 38 1.4
Black or African
American 4277 28.8 1015 37.4
Native Hawaiian or
Other Pacific Islander 182 1.2 23 <1
White 9072 61.0 1440 53.0
Note. Row percentages may not total 100.0 due to rounding.
Note. Age totals represent students’ self-identified ages.

11
Regarding residence of 4th – 7th graders, the highest percentage (n=8524; 44.8%) reported residence
in a town or city with a population 10,000 – 50,000, followed by rural non-farm with a population
less than 10,000 (n=5201; 27.3%). Regarding residence of 8th – 12th graders, the highest percentage
(n=1123; 37.7%) reported town or city with a population 10,000 – 50,000 followed by rural non-
farm residence, population less than 10,000 (n=1020; 34.2%). Table 4 shows residence of program
participants.
Table 4
Residence of Program Participants
Residence
4th – 7th grade
participants
8th – 12th grade
participants
N % N %
19044 100 2981 100
Farm 2437 12.8 414 13.9
Rural (non-farm residence, pop. <10,000) 5201 27.3 1020 34.2
Town or City (pop. 10,000 – 50,000) 8524 44.8 1123 37.7
Suburb of a City (pop. > 50,000) 886 4.7 151 5.1
City (pop. >50,000) 1996 10.5 273 9.2
Note. Row percentages may not total 100.0 due to rounding.
The following 24 Land Grant Universities provided 4th-7th grade data for this project: Alcorn State
University, Clemson University, Cornell University, Delaware State University, Fort Valley State
University, Kentucky State University, Louisiana State University, Oklahoma State University,
Prairie View A&M University, University of Puerto Rico, Rutgers University, Southern University,
Tuskegee University, University of Arkansas, University of Arizona, University of Connecticut,
University of Delaware, University of Idaho, University of Illinois, University of Maine, University
of Maryland, University of Tennessee, Virginia Tech, and West Virginia State University.
The following 20 Land Grant Universities provided 8th-12th grade data for this project: Alcorn State
University, Clemson University, Cornell University, Delaware State University, Fort Valley State
University, Louisiana State University, Oklahoma State University, University of Puerto Rico,
Rutgers University, Southern University, Tuskegee University, University of Arkansas, University
of Arizona, University of Connecticut, University of Idaho, University of Maine, University of
Maryland, University of Tennessee, Virginia Tech, and West Virginia State University.
Table 5 shows participation by Land Grant University.

12
Table 5
Participation by Land Grant University
4th – 7th grade participants 8th – 12th grade participants
LGU N % N %
Alcorn State University 304 1.5 112 3.4
Clemson University 1987 9.9 315 9.6
Cornell University 1625 8.1 83 2.5
Delaware State
University 201 1.0 76 2.3
Fort Valley State
University 1164 5.8 148 4.5
Kentucky State
University 250 1.2 - -
Louisiana State
University 783 3.9 117 3.6
Oklahoma State
University 1978 9.9 399 12.2
Prairie View A&M
University 2532 12.6 - -
Puerto Rico 1491 7.4 51 1.6
Rutgers University 211 1.1 33 1.0
Southern University 329 1.6 756 23.1
Tuskegee University 597 3.0 363 11.1
University of Arkansas 660 3.3 91 2.8
University of Arizona 472 2.4 178 5.4
University of
Connecticut 668 3.3 87 2.7
University of Delaware 1266 6.3 - -
University of Idaho 663 3.3 8 <1
University of Illinois 991 4.9 - -
University of Maine 139 <1 52 1.6
University of Maryland 233 1.2 16 <1
University of
Tennessee 462 2.3 1 <1
Virginia Tech 432 2.2 310 9.5
West Virginia State
University 623 3.1 78 2.4
Total 20061 100 3274 100

13
Research Question Two – How were 4th – 7th grade participants influenced by the program, if at all, in regards to their nutrition and physical activity?
This section describes responses to the 4th – 7th grade instrument which focused on two constructs:
healthy nutrition choices (i.e., eating fruit for a snack) and physical activity (i.e., exercising 60
minutes every day).
Nutrition (4th – 7th grade participants)
Participants were asked how hard it was to make a given nutrition choice because of the 4-H Healthy
Living Program. Answer choices were “not hard at all,” “a little hard,” and “very hard”. The
following percentages of participants surveyed indicated that as a result of the 4-H Healthy Living
program, the following nutrition choices were “not hard at all” –
79.2% eat fruit for a snack.
64.1% eat a low-fat snack like pretzels instead of chips.
59.4% drink less Kool-Aid
57.8% choose a small instead of a larger order of French fries.
57.0% choose water instead of soda pop or Kool-Aid when thirsty.
53.5% drink less soda pop.
Regarding future program planning, one in five participants surveyed reported it was “very hard”
drink less soda pop and eat smaller servings of high fat foods like French fries, chips, snack cakes,
cookies, or ice cream. Table 6 shows responses for nine different nutrition choices.

14
Table 6
Nutrition Choices of 4th – 7th Grade Participants
How hard would it be for you to Not hard at all A little hard Very hard
N % N % N %
Eat fruit for a snack (N: 19417) 15380 79.2 3118 16.1 919 4.7
Eat vegetables for a snack (N: 19154) 8881 46.4 7059 36.9 3214 16.8
Choose water instead of soda pop or Kool-
Aid when you are thirsty (N: 19596) 11176 57.0 5195 26.5 3225 16.5
Drink 1% or skim milk instead of 2% or
whole milk (N: 19088) 10558 55.3 4935 25.9 3595 18.8
Choose a small instead of a large order of
French fries (N: 19079) 11035 57.8 4677 24.5 3367 17.6
Eat smaller servings of high fat foods like
French fries, chips, snack cakes, cookies, or
ice cream
(N: 19257) 8946 46.5 6551 34.0 3760 19.5
Eat a low-fat snack like pretzels instead of
chips (N: 19054) 12209 64.1 4700 24.7 2145 11.3
Drink less soda pop (N: 19305) 10325 53.5 5113 26.5 3867 20.0
Drink less Kool-Aid (N: 19476) 11560 59.4 4613 23.7 3303 17.0
Note. Row percentages may not total 100.0 due to rounding.

15
Participants were asked to respond to four nutrition items that measured general learning that
resulted from participation in the 4-H Healthy Living program. The scale was 1=strongly agree,
2=agree, 3=disagree, 4=strongly disagree, and a separate answer choice was provided to indicate
“not applicable to my 4-H experience”. The following percentages of participants surveyed indicated
“strongly agree” or agree” to these statements:
90.4% learned the foods they should eat every day.
89.9% learned how to make healthy food choices.
89.4% learned why it is important for to eat a healthy diet.
86.8% learned what makes up a balanced diet.
See Table 7 for the nutrition knowledge items, responses, percentages, means, and standard
deviations.
Table 7
Nutrition Knowledge of 4th – 7th Grade Participants
Knowledge Itemsa
Strongly
Agree/Agree Strongly
Disagree/Disagree
Not
Applicable to
My 4-H
Experience
N % N % N % μ (S.D.)
I learned the foods I
should eat every day
(N: 19385) 17528 90.4 1231 6.4 626 3.2 1.57(.672)
I learned what makes up a
balanced diet (N: 19361) 16810 86.8 1829 9.4 722 3.7 1.62(.727)
I learned why it is
important for me to eat a
healthy diet (N: 19327) 17284 89.4 1431 7.4 612 3.2 1.51(.706)
I learned how to make
healthy food choices (N:
19330) 17383 89.9 1343 6.9 604 3.1 1.52(.700)
Note. Row percentages may not total 100.0 due to rounding. aCollapsed data; scale was 1=strongly agree, 2=agree, 3=disagree, and 4=strongly disagree.
16
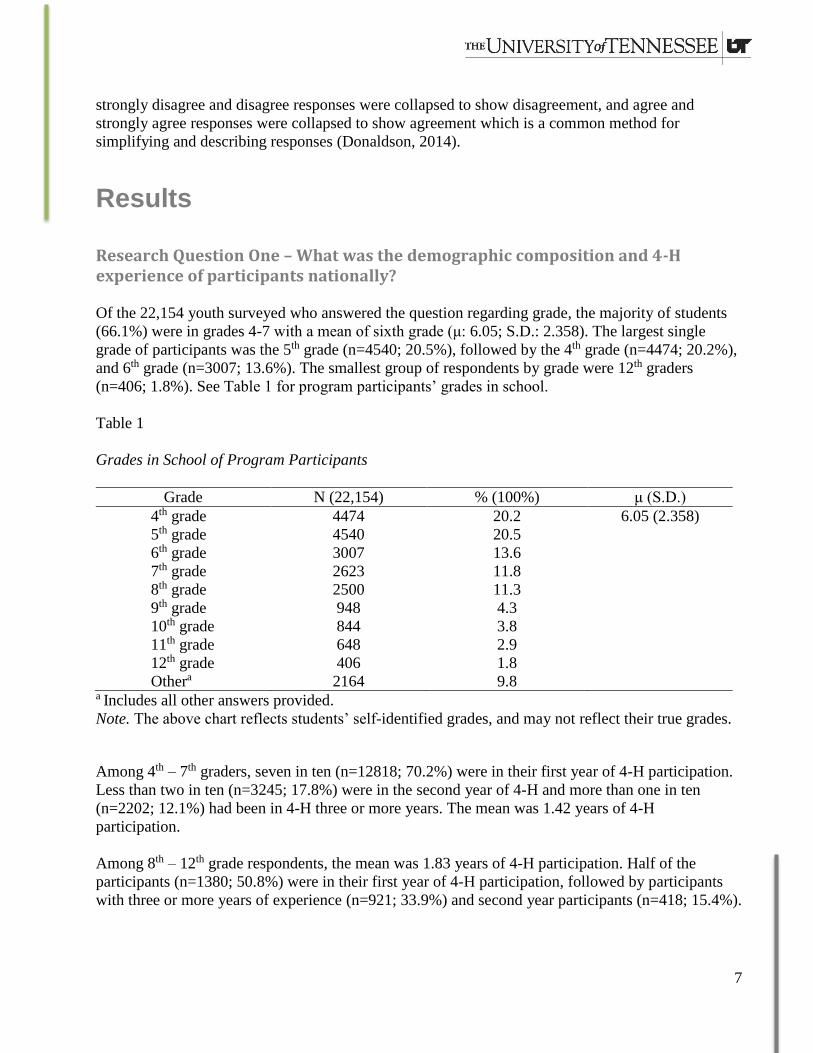
Participants were asked to respond to six nutrition behaviors that measured general change that
resulted from participation in the 4-H Healthy Living program. The scale was 1=strongly agree,
2=agree, 3=disagree, 4=strongly disagree, and a separate answer choice was provided to indicate
“not applicable to my 4-H experience”. The following percentages of participants surveyed indicated
“strongly agree” or agree” to these statements:
93.4% encourage their family to eat meals together.
86.2% drink more water.
82.4% eat more fruits and vegetables.
73.5% eat more whole grains.
68.9% eat less junk food.
Table 8 shows the nutrition behaviors, responses, percentages, means, and standard deviations.
Table 8
Nutrition Behaviors of 4th – 7th Grade Participants
Nutrition Behaviorsa
Strongly
Agree/Agree
Strongly
Disagree/Disagree
Not Applicable
to My 4-H
Experience
N % N % N % μ (S.D.)
I eat more fruits and
vegetables (N:19385) 15967 82.4 2903 15.0 515 2.7 1.75(.794)
I eat more whole grains
(N:19267) 14162 73.5 4423 23.0 682 3.5 1.95(.842)
I eat less junk food (N:19175) 13216 68.9 5352 27.9 607 3.2 2.05(.920)
I drink more water (N:19233) 16588 86.2 2175 11.3 470 2.4 1.61(.782)
I encourage my family to eat
meals together (N:19217) 14097 93.4 4154 21.6 966 5.0 1.88(.904)
Note. Row percentages may not total 100.0 due to rounding. aCollapsed data; scale was 1=strongly agree, 2=agree, 3=disagree, and 4=strongly disagree.

17
Physical Activity (4th – 7th grade participants)
Participants were asked to respond to two items that measured physical activity changes that resulted
from participation in the 4-H Healthy Living program. Response categories were always, usually,
sometimes, and never. Regarding moderate physical activities like walking, helping out around the
house, raking leaves, or using the stairs, the highest percentage indicated “always” (n=10788;
55.7%), followed by “usually” (n=4727; 24.4%), “sometimes” (n=3253; 16.8%) and “never” (616;
3.2%). For the item, “I exercise 60 minutes every day,” the highest percentage responded “always”
(n=8921; 43.2%) followed by “sometimes” (n=4709; 24.5%), “usually” (n=4292; 22.4%), and
“never” (n=1891, 9.9%); see Table 9.
Table 9
Physical Activity Behaviors of 4th – 7th Grade Participants
Always Usually Sometimes Never
N % N % N % N %
I do moderate
physical activities
like walking,
helping around the
house, raking
leaves, or using the
stairs (N:19384) 10788 55.7 4727 24.4 3253 16.8 616 3.2
I exercise 60
minutes every day
(N:19183) 8291 43.2 4292 22.4 4709 24.5 1891 9.9
Note. Row percentages may not total 100.0 due to rounding.

18
Participants were asked to respond to three physical activity items that measured general attitudes
toward physical activity. The following percentages of participants surveyed indicated that they
“agreed” to these statements:
91.6% reported “being active is good for me.”
90.7% reported “physical activity will help me stay fit.”
88.2% reported “being active is fun.”
See Table 10.
Table 10
Physical Activity Attitudes of 4th – 7th Grade Participants
I agree I’m not sure I do not agree
Items N % N % N %
Being active is fun (N:19342) 17055 88.2 1753 9.1 534 2.8
Being active is good for me
(N:19317) 17690 91.6 1226 6.3 401 2.1
Physical activity will help me stay fit
(N:19275) 17480 90.7 1323 6.9 472 2.4
Note. Row percentages may not total 100.0 due to rounding.

19
Research Question Three – How were 8th – 12th grade participants influenced by the program, if at all, in regards to their nutrition, physical activity, and civic engagement?
Nutrition (8th – 12th grade participants)
Participants were asked to respond to six nutrition items that measured general learning that resulted
from participation in the 4-H Healthy Living program. The scale was 1=strongly agree, 2=agree,
3=disagree, 4=strongly disagree, and a separate answer choice was provided to indicate “not
applicable to my 4-H experience”. The following percentages of participants surveyed indicated
“strongly agree” or agree” to these statements:
85.6% learned the foods they should eat every day.
85.3% learned why it is important for to eat a healthy diet.
85.0% learned how to make healthy food choices.
83.8% learned the importance of fruits and vegetables in their diet.
82.3% learned what makes up a balanced diet.
78.9% learned the importance of whole grains in their diet.
73.4% learned how many calories they need to eat each day.
Slightly less than one in five reported they did not learn how many calories they need to eat each day
(n=519; 17.0%). See Table 11 for the nutrition knowledge items, responses, percentages, means, and
standard deviations.

20
Table 11
Nutrition Knowledge of 8th – 12th Grade Participants
Knowledge Itemsa
Strongly
Agree/Agree
Strongly
Disagree/Disagree
Not Applicable to
My 4-H Experience
N % N % N % μ (S.D.)
I learned the foods I should eat
every day (N:3077) 2635 85.6 190 6.2 252 8.2 1.62(.660)
I learned what makes up a
balanced diet (N:3071) 2527 82.3 293 9.5 251 8.2 1.69(.710)
I learned why it is important for
me to eat a healthy diet (N:3064) 2613 85.3 204 6.7 247 8.1 1.57(.673)
I learned how to make healthy
food choices (N:3064) 2604 85.0 213 7.0 247 8.1 1.60(.673)
I learned how many calories I
need to eat each day (N:3044) 2234 73.4 519 17.0 296 9.7 1.82(.792)
I learned the importance of fruits
and vegetables in my diet
(N:3046) 2552 83.8 239 7.8 255 8.4 1.60(.702)
I learned the importance of whole
grains in my diet (N:3040) 2398 78.9 364 12.0 278 9.1 1.70(.750)
Note. Row percentages may not total 100.0 due to rounding. aCollapsed data; scale was 1=strongly agree, 2=agree, 3=disagree, and 4=strongly disagree.
Participants were asked to respond to seven food choices that measured general behaviors that
resulted from participation in the 4-H Healthy Living program. The scale was 1=strongly agree,
2=agree, 3=disagree, 4=strongly disagree, and a separate answer choice was provided to indicate
“not applicable to my 4-H experience”. The following percentages of participants surveyed indicated
“strongly agree” or agree” to these statements:
78.2% make healthy food choices whenever they can.
76.0% think about what their body needs during the day.
71.3% make food choices based on what they know their body needs.
70.5% encourage their family to eat meals together.
See Table 12 for the nutrition knowledge items, responses, percentages, means, and standard
deviations.

21
Table 12
Food Choices of 8th – 12th Grade Participants
Food Choicesa
Strongly
Agree/Agree
Strongly
Disagree/Disagree
Not Applicable
to My 4-H
Experience
N % N % N % μ (S.D.)
I think about what foods my body
needs during the day (N:3039) 2311 76.0 489 16.1 239 7.9 1.85(.756)
I make food choices based on what
I know my body needs (N:3032) 2163 71.3 629 20.7 240 7.9 1.94(.791)
I make healthy food choices
whenever I can (N:3044) 2380 78.2 437 14.4 227 7.5 1.80(.760)
I match my food intake to the
number of calories I need to eat
each day (N:3032) 1764 58.2 990 32.7 278 9.2 2.16(.922)
I encourage my family to eat meals
together (N:3030) 2135 70.5 620 20.5 275 9.1 1.90(.880)
Note. Row percentages may not total 100.0 due to rounding. aCollapsed data; scale was 1=strongly agree, 2=agree, 3=disagree, and 4=strongly disagree.

22
Participants were asked to respond to five nutrition behaviors that resulted from participation in the
4-H Healthy Living program. The scale was 1=strongly agree, 2=agree, 3=disagree, 4=strongly
disagree, and a separate answer choice was provided to indicate “not applicable to my 4-H
experience”. The following percentages of participants surveyed indicated “strongly agree” or agree”
to these statements:
83.5% eat more fruits and vegetables.
78.8% drink more water.
67.2% eat more whole grains.
64.6% drink less soda.
58.1% eat less junk food.
Table 13 shows the collapsed data for the nutrition behaviors of 8th-12th grade respondents.
Table 13
Nutrition Behaviors of 8th – 12th Grade Participants
Behaviorsa
Strongly
Agree/Agree
Strongly
Disagree/Disagree
Not Applicable
to My 4-H
Experience
N % N % N % μ (S.D.)
I eat more fruits and vegetables
(N:3040) 2538 83.5 458 15.1 224 7.4 1.77(.777)
I eat more whole grains (N:3030) 2035 67.2 772 25.5 223 7.4 2.01(.851)
I eat less junk foods (N:3017) 1753 58.1 1030 34.1 234 7.8 2.19(.957)
I drink less soda (N:3025) 1953 64.6 833 27.5 239 7.9 2.04(.947)
I drink more water (N:3047) 2402 78.8 387 12.7 258 8.5 1.68(.800)
Note. Row percentages may not total 100.0 due to rounding. aCollapsed data; scale was 1=strongly agree, 2=agree, 3=disagree, and 4=strongly disagree.
8th – 12th grade participants were asked if their family ate “at least one meal a day together,” and
68.8% (n=2060) responded yes (Table 14).
Table 14
Family Meals of 8th – 12th Grade Participants
Yes No
N % N %
My family eats at least one meal a day
together (N:2996) 2060 68.8 936 31.2

23
Physical Activity (8th – 12th grade participants)
22.5% of participants (n=645) are physically active, for a total of at least 60 minutes, seven days of
the week. The mean was 4.17 days (S.D.=2.208). The mean number of hours spent watching
television on a school day was 2.06 hours (S.D.=1.515). The mean number of hours spent playing
video games, looking at a computer, smartphone, or tablet (for something that is not for school) on
an average school day was 2.51 (S.D.=1.692). More than one in five respondents (21.1%, n=602)
spent five or more hours playing video games, looking at a computer, smartphone, or tablet (for
something that is not for school) on an average school day.
Table 15
Physical Activity Behaviors of 8th – 12th Grade Participants
Behaviors 8th – 12th grade participants
N % μ (S.D.)
Number of days in the past seven physically active for a total
of at least 60 minutes per day 2862 100 4.17(2.208)
0 days 240 8.4
1 day 175 6.1
2 days 270 9.4
3 days 368 12.9
4 days 427 14.9
5 days 529 18.5
6 days 208 7.3
7 days 645 22.5
Number of hours spent watching television on an average
school day 2859 100 2.06(1.515)
I do not watch TV on an average school day 450 15.7
Less than one hour per day 721 25.2
2 hours per day 721 25.2
3 hours per day 446 15.6
4 hours per day 217 7.6
5 or more hours per day 304 10.6
Number of hours spent playing video games, looking at a
computer, smartphone, or tablet (for something that is not for
school) on an average school day
2854 100 2.51(1.692)
I do not play video games or computer games or use a
computer for something that is not school work 389 13.6
Less than one hour per day 517 18.1
2 hours per day 644 22.6
3 hours per day 464 16.3
4 hours per day 238 8.3
5 or more hours per day 602 21.1

24
Civic Engagement (8th – 12th grade participants)
To measure community awareness, seven items were used. The scale was 1=strongly agree, 2=agree,
3=disagree, and 4=strongly disagree. The means ranged from 1.68 (“I really care about my
community”) to 1.91 (“I talk to my friends about issues affecting my community, state, or world”)
indicating agreement.
The following percentages of participants surveyed indicated “strongly agree” or “agree” to these
statements:
89.5% really care about their community.
87.1% listen to everyone’s views whether they agree or not.
85.1% tries to figure out if they are just hearing one side of the story on a given issue.
84.4% are aware of the important needs in my community.
83.5% pay attention to news events that affect their community.
81.0% are interested in others’ opinions about public issues.
76.3% talk to their friends about issues affecting their community, state, or world.
Table 16 shows the responds for the community awareness indicators.

25
Table 16
Community Awareness of 8th – 12th Grade Participants
Strongly
Agree Agree Disagree
Strongly
Disagree
N % N % N % N % μ (S.D.)
I pay attention to news
events that affect my
community (N:1742) 669 38.4 786 45.1 228 13.1 59 3.4 1.81(.785)
I am aware of the important
needs in my community
(N:1689) 641 38.0 784 46.4 224 13.3 40 2.4 1.80(.753)
I really care about my
community (N:1662) 739 44.5 748 45.0 140 8.4 35 2.1 1.68(.716)
I talk to my friends about
issues affecting my
community, state, or world
(N:1668) 619 37.1 654 39.2 317 19.0 78 4.7 1.91(.861)
I’m interested in others’
opinions about public issues
(N:1670) 664 39.8 688 41.2 245 14.7 73 4.4 1.84(.832)
I listen to everyone’s views
whether I agree or not
(N:1668) 726 43.5 727 43.6 166 10.0 49 2.9 1.72(.759)
When you hear about an
issue, I try to figure out if
they are just telling one side
of the story (N:1670) 751 45.0 670 40.1 188 11.3 61 3.7 1.74(.799)

26
To measure cultural awareness, four items were used. The scale was 1=strongly agree, 2=agree,
3=disagree, and 4=strongly disagree. The means ranged from 1.49 (“I respect people from different
cultures”) to 1.83 (“I explore cultural differences”) indicating strong agreement. The following
percentages of participants surveyed indicated “strongly agree” or “agree” to these statements:
95.3% respect people from other cultures.
93.5% have learned about people who are different from themselves.
87.5% value learning about other cultures.
81.8% explore cultural differences.
Table 17 shows the responds for the cultural awareness indicators.
Table 17
Cultural Awareness of 8th – 12th Grade Participants
Strongly Agree Agree Disagree
Strongly
Disagree
N % N % N % N % μ (S.D.)
I explore cultural
differences
(N:1654) 637 38.5 716 43.3 253 15.3 48 2.9 1.83(.790)
I value learning
about other cultures
(N:1662) 701 42.2 754 45.4 164 9.9 43 2.6 1.73(.742)
I respect people
from different
cultures (N:1661) 957 57.6 626 37.7 53 3.2 25 1.5 1.49(.636)
I have learned
about people who
are different from
me (N:1638) 867 52.9 664 40.5 74 4.5 33 2.0 1.56(.677)
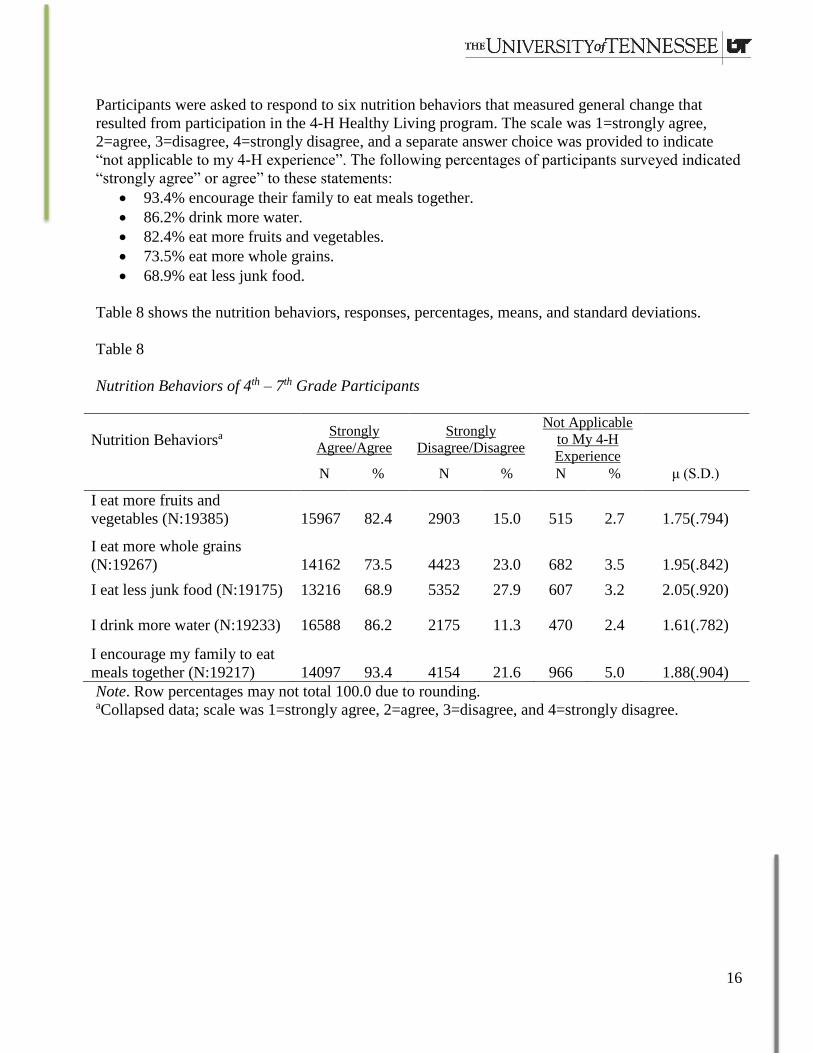
An additional measure of civic engagement was general engagement and understanding. Six items
were used to measure this construct. The scale was 1=strongly agree, 2=agree, 3=disagree, and
4=strongly disagree. The means ranged from 1.56 (“I help make sure everyone gets an opportunity
to say what they think”) to 1.65 (“I can apply knowledge in ways that solve ‘real-life’ problems
through community service”) indicating strong agreement. The following percentages of participants
surveyed indicated “strongly agree” or “agree” to these statements:
93.7% can help make sure everyone gets an opportunity to say what they think. 93.3% treat everyone fairly and equally when in charge of a group.
91.3% can make a difference in their communities through community service.
90.7% can apply knowledge in ways that solve “real-life” problems through community
service.
90.7% are able to lead a group in making a decision.
27
89.4% have gained skills through community service that will help them in the future.
Table 18 shows the responds for the civic engagement and understanding construct.
Table 18
Engagement and Understanding of 8th – 12th Grade Participants
Strongly
Agree Agree Disagree
Strongly
Disagree
N % N % N % N % μ (S.D.)
I can make a
difference in my
community through
community service
(N:1648) 835 50.7 670 40.7 113 6.9 30 1.8 1.60(.698)
I can apply
knowledge in ways
that solve “real-
life” problems
through community
service (N:1642) 758 46.2 731 44.5 125 7.6 28 1.7 1.65(.695)
I gained skills
through serving my
community that will
help me in the
future (N:1641) 796 48.5 671 40.9 138 8.4 36 2.2 1.64(.728)
I treat everyone
fairly and equally
when I am in
charge of a group
(N:1635) 841 51.4 685 41.9 71 4.3 38 2.3 1.58(.686)
I am able to lead a
group in making a
decision (N:1692) 877 51.8 657 38.8 112 6.6 46 2.7 1.60(.732)
I help make sure
everyone gets an
opportunity to say
what they think
(N:1711) 894 52.3 709 41.4 70 4.1 38 2.2 1.56(.679)

28
The civic engagement intentions were measured using seven items. The responses were “definitely,”
“maybe,” “probably not,” and “definitely not.” The following percentages represent the respondents
who answered “definitely” to the following civic engagement intentions:
59.3% are encouraged to volunteer more.
59.3% are interested in a career that helps others.
57.4% will continue to better their community after high school.
51.3% plan to work on projects to better their community.
51.1% would enjoy hosting someone from another culture.
42.7% can contact someone they have never met before to get their help with a problem.
37.5% are interested in working in government – such as school board, Director of parks and
rec, legislator, legislative aide, intern.
Table 19 shows the civic engagement intentions.
Table 19
Civic Engagement of 8th – 12th Grade Participants
Intentions
Definitely Maybe Probably
Not
Definitely
Not
N % N % N % N %
I would enjoy hosting
someone from another
culture (N:1684) 861 51.1 653 38.8 128 7.6 42 2.5
I can contact someone I’ve
never met before to get
their help with a problem
(N:1637) 699 42.7 606 37.0 250 15.3 82 5.0
I plan to work on projects
to better my community
(N:1629) 835 51.3 621 38.1 134 8.2 39 2.4
I am encouraged to
volunteer more (N:1633) 969 59.3 508 31.1 112 6.9 44 2.7
After high school I will
continually work to better
my community (N:1670) 958 57.4 557 33.4 114 6.8 41 2.5
I am interested in a career
that helps others (N:1626) 965 59.3 522 32.1 103 6.3 36 2.2
I am interested in working
in government – such as
school board, Director of
parks and rec, legislator,
legislative aide, intern.
(N:1708) 641 37.5 591 34.6 281 16.5 195 11.4

29
Summary This section discusses conclusions and recommendations for future programming.
Conclusions The data file held 23,335 cases. The majority of students (86.0%) were in grades 4-7 with a mean of
sixth grade. Among 4th – 7th graders, seven in ten (70.2%) were in their first year of 4-H
participation. Among 8th – 12th grade respondents, three in ten (33.9%) had been in 4-H three or
more years. The majority of the 4th – 7th grade participants were female (53.8%; n=10341), and the
majority of the 8th – 12th grade participants were female (59.7%; n=1829). The mean age of 4th – 7th
grade participants was 11.30 years, and the mean age of 8th – 12th grade participants was 14.44 years.
In regards to race, the majority of participants were white for both the 4th – 7th graders (61.0%) and
the 8th – 12th graders (53.0%). The majority of both 4th – 7th graders (72.2%) and 8th – 12th graders
(86.5%) were not Hispanic or Latino.
The project produced many positive outcomes for young. The youth responses to the project’s
outcome indicators indicate a progression from learning (knowledge and attitudes) to action (choices
and behaviors). Among the 20,061 participants in grades 4 – 7, the outcomes listed below were
achieved.
Nutrition Knowledge
90.4% learned the foods they should eat every day.
89.9% learned how to make healthy food choices.
89.4% learned why it is important for to eat a healthy diet.
86.8% learned what makes up a balanced diet.
Nutrition Choices/Behaviors
93.4% encourage their family to eat meals together.
86.2% drink more water.
82.4% eat more fruits and vegetables.
79.2% eat fruit for a snack.
73.5% eat more whole grains.
68.9% eat less junk food.
64.1% eat a low-fat snack like pretzels instead of chips.
59.4% drink less Kool-Aid
57.8% choose a small instead of a larger order of French fries.
57.0% choose water instead of soda pop or Kool-Aid when thirsty.
53.5% drink less soda pop.
Physical Activity Attitudes
91.6% reported “being active is good for me.”
90.7% reported “physical activity will help me stay fit.”
88.2% reported “being active is fun.”

30
Physical Activity Behaviors
80.0% report they “always” or “usually” do moderate physical activities like walking,
helping out around the house, raking leaves, or using the stairs.
65.6% % report they “always” or “usually” exercise every day.
Among the project’s 3,274 participants in grades 8 – 12, the following outcomes were reported.
Nutrition Knowledge
85.6% learned the foods they should eat every day.
85.3% learned why it is important for to eat a healthy diet.
85.0% learned how to make healthy food choices.
83.8% learned the importance of fruits and vegetables in their diet. 82.3% learned what
makes up a balanced diet.
78.9% learned the importance of whole grains in their diet.
73.4% learned how many calories they need to eat each day.
Nutrition Choices/Behaviors
83.5% eat more fruits and vegetables.
78.8% drink more water.
78.2% make healthy food choices whenever they can.
76.0% think about what their body needs during the day.
71.3% make food choices based on what they know their body needs.
70.5% encourage their family to eat meals together.
67.2% eat more whole grains.
64.6% drink less soda.
58.1% eat less junk food.
Civic Engagement Knowledge and Skills
95.3% respect people from other cultures.
93.7% can help make sure everyone gets an opportunity to say what they think.
93.5% have learned about people who are different from themselves.
93.3% treat everyone fairly and equally when in charge of a group.
91.3% can make a difference in their communities through community service.
90.7% are able to lead a group in making a decision.
90.7% can apply knowledge in ways that solve “real-life” problems through community
service.
89.5% really care about their community.
89.4% have gained skills through community service that will help them in the future.
87.5% value learning about other cultures.
85.1% tries to figure out if they are just hearing one side of the story on a given issue.
84.4% are aware of the important needs in my community.
83.5% pay attention to news events that affect their community.
81.0% are interested in others’ opinions about public issues.
81.8% explore cultural differences.

31
76.3% talk to their friends about issues affecting their community, state, or world.
Civic Engagement Intentions
59.3% are encouraged to volunteer more.
59.3% are interested in a career that helps others.
57.4% will continue to better their community after high school.
51.3% plan to work on projects to better their community.
Participants in grades 8 – 12 were specifically asked about the amount of time they spend watching
TV, playing video games, looking at a computer, smartphone, or tablet (for something that is not for
school) on a school day. In this study, the mean number of hours spent watching television on a
school day was 2.06 hours (S.D.=1.515). The mean number of hours spent playing video games,
looking at a computer, smartphone, or tablet (for something that is not for school) on an average
school day was 2.51 (S.D.=1.692). A group of super-users was noted. More than one in five
respondents (21.1%, n=602) spent five or more hours playing video games, looking at a computer,
smartphone, or tablet (for something that is not for school) on an average school day.
Recommendations
The Walmart-funded Healthy Living programs produced positive youth outcomes regarding
nutrition, physical activity, and civic engagement, and these programs should continue. It is
recommended that the 4-H Common Measures tools continue to be used to measure the results of 4-
H Healthy Living programs. The size and scope of this data file (23,335 individual records) suggests
that the 4-H Common Measures approach is a valuable evaluation and reporting solution for projects
funded by National 4-H Council and for the Cooperative Extension System in general. The
continued development of 4-H Common Measures is imperative. It provides collective impact, and it
is a high-quality tool for multi-site evaluation and reporting. Data collected for this report could be
used for benchmarking program outcomes, setting outcome targets, and comparing program
performance in subsequent years. All of the institutions consistently used the 4-H Common
Measures instruments, and it is recommended that this uniform use continue.
Youth programs must consider how youth spend their time using technology. More than 20% of the
8th – 12th graders reported spending five or more hours playing video games, looking at a computer,
smartphone, or tablet (for something that is not for school) on an average school day. A large
contributor to this number may be text messaging. Nonetheless, this is an alarming number. It is
recommended that state and local 4-H professionals and volunteers discuss and document
approaches to mediate this phenomenon and its potential influences on youth health.

32
References
Donaldson, J.L. (2014). Appraising the Appraiser: Extension Agents' and County Directors'
Perceptions of Their Appraisers. Journal of Extension (52) 2. Available:
http://www.joe.org/joe/2014april/rb2.php
Donaldson, J.L., Franck, K.L., Toman, J.J. & Moody, T. (2013). National 4-H healthy living
professional and volunteer development needs assessment: A delphi approach, final report.
Available: https://tiny.utk.edu/hlr2013
Le Menestrel, S. and Walahoski, J. (2013). An Introduction to the 4-H Common Measures and the
Online Data Collection System [Video File]. Retrieved from: http://www.4-
h.org/about/youth-development-research/
Acknowledgements
JoAnne Leatherman, Jill Walahoski, and Jessica Bauman are acknowledged for their valuable advice
and assistance with this project. We appreciate Walmart for their generous support of 4-H Healthy
Living programs, including this data analysis project, and we also acknowledge the contributions of
the National 4-H Healthy Living Mission Mandate Management Team, National 4-H Council, and 4-
H National Headquarters within the USDA’s National Institute of Food and Agriculture. We are
grateful for the state and local Extension professionals and volunteers who provided leadership for
this project.

33
Appendices
Appendix A – 4th – 7th Grade Healthy Living Instrument
4-H Common Measures 4th – 7th Grade Healthy Living Items
Dear Participant: You are being given this survey because you are part of a 4-H program or project, and we are surveying young people like you to learn about your experiences. This survey is voluntary. If you do not want to fill out the survey, you do not need to. However, we hope you will take a few minutes to fill it out because your answers are important.
This survey is private. No one at your school, home, or 4-H program or project will see your answers. Please answer all of the questions as honestly as you can. If you are uncomfortable answering a question, you may leave it blank. This is not a test. There are no right or wrong answers, and your answers will not affect your participation or place in the program in any way.
Thank you for your help!
Section I: Tell us about your 4-H Experience
Please select the responses that best describe you.
1. How many years have you been participating in 4-H? (Mark one box ☒.) ☐ This is my first year
☐ This is my second year
☐ Three or more years
2. Which one of the following best describes how many hours you typically spend in 4-H
programs/projects each week? (Mark one box ☒.) ☐ Less than one hour
☐ Between one and three hours
☐ More than three hours
3. Which of the following best describes how you are involved in 4-H? (Mark each box ☒that applies to you.)
☐ Clubs

34
☐ Camps
☐ After-school programs
☐ In-school programs
☐ Local fairs/events
☐ Community service projects
☐ Working on my projects at home
☐ Other
Section II: Healthy Choices
4. Please indicate how hard it would be to complete the following actions. (Select one response in each
row by marking the appropriate box ☒.)
How hard would it be for you to… Not hard at all
A little hard Very hard
Eat fruit for a snack ☐ ☐ ☐
Eat vegetables for a snack ☐ ☐ ☐
Choose water instead of soda pop or Kool-Aid when you are thirsty
☐ ☐ ☐
Drink 1% or skim milk instead of 2% or whole milk ☐ ☐ ☐
Choose a small instead of a large order of French fries
☐ ☐ ☐
Eat smaller servings of high fat foods like French fries, chips, snack cakes, cookies, or ice cream
☐ ☐ ☐
Eat a low-fat snack like pretzels instead of chips ☐ ☐ ☐
Drink less soda pop ☐ ☐ ☐
Drink less Kool-Aid ☐ ☐ ☐
5. Please indicate to what extent you agree or disagree that your experience in this 4-H program or project
has resulted in the following outcomes. (Select one response in each row by marking the appropriate box ☒.)
As a result of participating in a 4-H Healthy Living Program…
Strongly Agree
Agree Disagree Strongly Disagree
Not Applicable to my 4-H Experience
I learned the foods that I should eat every day
☐ ☐ ☐ ☐ ☐
I learned what makes up a balanced diet
☐ ☐ ☐ ☐ ☐

35
As a result of participating in a 4-H Healthy Living Program…
Strongly Agree
Agree Disagree Strongly Disagree
Not Applicable to my 4-H Experience
I learned why it is important for me to eat a healthy diet
☐ ☐ ☐ ☐ ☐
I learned how to make healthy food choices
☐ ☐ ☐ ☐ ☐
6. Please indicate to what extent you agree or disagree that your experience in this 4-H program or project
has resulted in the following outcomes. (Select one response in each row by marking the appropriate box ☒.)
As a result of participating in a 4-H Healthy Living Program I now take the following actions…
Strongly Agree
Agree Disagree Strongly Disagree
Not Applicable to my 4-H Experience
I eat more fruits and vegetables ☐ ☐ ☐ ☐ ☐
I eat more whole grains ☐ ☐ ☐ ☐ ☐
I eat less junk foods ☐ ☐ ☐ ☐ ☐
I drink more water ☐ ☐ ☐ ☐ ☐ I encourage my family to eat meals together
☐ ☐ ☐ ☐ ☐
Section III: Physical Activity
7. Please tell us how often you complete the following tasks. (Select one response in each row by marking
the appropriate box ☒.)
Tell us about you… Always Usually Sometimes Never
I do moderate physical activities like walking, helping around the house, raking leaves, or using the stairs
☐ ☐ ☐ ☐
I exercise 60 minutes every day ☐ ☐ ☐ ☐
8. Please indicate to what extent you agree or disagree that your experience in this 4-H program or project
has resulted in the following outcomes. (Select one response in each row by marking the appropriate box ☒.)
Tell us what you think… I agree I’m not sure I do not agree
Being active is fun ☐ ☐ ☐
Being active is good for me ☐ ☐ ☐
Physical activity will help me stay fit ☐ ☐ ☐

36
Section VI: Tell us about You Please select the responses that best describes you.
9. How old are you?
______ Age (in years)
10. What grade are you in?
______ Grade
11. Which of the following best describes your gender? (Mark one box ☒.) ☐ Female
☐ Male
12. Which of the following best describe your race? (Mark each box ☒that applies to you.) ☐ American Indian or Alaskan Native
☐ Asian
☐ Black or African American
☐ Native Hawaiian or Other Pacific Islander
☐ White
13. Which of the following best describe your ethnicity? (Mark one box ☒.) ☐ Hispanic or Latino
☐ Not Hispanic or Latino
14. Which of the following best describes the primary place where you live? (Mark one box ☒.) ☐ Farm
☐ Rural (non-farm residence, pop. < 10,000)
☐ Town or City (pop. 10,000 – 50,000)
☐ Suburb of a City (pop. > 50,000)
☐ City (pop. > 50,000)
THANK YOU!

37
Appendix B – 8th – 12th Grade Healthy Living Instrument
4-H Common Measures 8th – 12th Grade Healthy Living Items
Dear Participant: You are being given this survey because you are part of a 4-H program or project, and we are surveying young people like you to learn about your experiences. This survey is voluntary. If you do not want to fill out the survey, you do not need to. However, we hope you will take a few minutes to fill it out because your answers are important.
This survey is private. No one at your school, home, or 4-H program or project will see your answers. Please answer all of the questions as honestly as you can. If you are uncomfortable answering a question, you may leave it blank. This is not a test. There are no right or wrong answers, and your answers will not affect your participation or place in the program in any way.
Thank you for your help!
Section I: Tell us about your 4-H Experience Please select the responses that best describe you.
1. How many years have you been participating in 4-H? (Mark one box ☒.) ☐ This is my first year
☐ This is my second year
☐ Three or more years
2. Which one of the following best describes how many hours you typically spend in 4-H
programs/projects each week? (Mark one box ☒.) ☐ Less than one hour
☐ Between one and three hours
☐ More than three hours
3. Which of the following best describes how you are involved in 4-H? (Mark each box ☒that applies to you.)
☐ Clubs
☐ Camps
☐ After-school programs
☐ In-school programs
☐ Local fairs/events
☐ Community service projects
☐ Working on my projects at home
☐ Other
38
Section II: Nutrition Knowledge 4. Please indicate to what extent you agree or disagree that your experience in this 4-H program or project
has resulted in the following outcomes. (Select one response in each row by marking the appropriate box ☒.)
As a result of participating in a 4-H Healthy Living Program…
Strongly Agree
Agree Disagree Strongly Disagree
Not Applicable to my 4-H Experience
I learned the foods that I should eat every day
☐ ☐ ☐ ☐ ☐
I learned what makes up a balanced diet
☐ ☐ ☐ ☐ ☐
I learned why it is important for me to eat a healthy diet
☐ ☐ ☐ ☐ ☐
I learned how to make healthy food choices
☐ ☐ ☐ ☐ ☐
I learned how many calories I need to eat each day
☐ ☐ ☐ ☐ ☐
I learned the importance of fruits and vegetables in my diet
☐ ☐ ☐ ☐ ☐
I learned the importance of whole grains in my diet
☐ ☐ ☐ ☐ ☐
Section III: Food Choices
5. Please indicate to what extent you agree or disagree that your experience in this 4-H program or project
has resulted in the following outcomes. (Select one response in each row by marking the appropriate box ☒.)
As a result of participating in a 4-H Healthy Living Program I now take the following actions…
Strongly Agree
Agree Disagree Strongly Disagree
Not Applicable to my 4-H Experience
I think about what foods my body needs during the day
☐ ☐ ☐ ☐ ☐
I make food choices based on what I know my body needs
☐ ☐ ☐ ☐ ☐
I make healthy food choices whenever I can
☐ ☐ ☐ ☐ ☐
I match my food intake to the number of calories I need to eat each day
☐ ☐ ☐ ☐ ☐
I encourage my family to eat meals together
☐ ☐ ☐ ☐ ☐

39
6. Please indicate to what extent you agree or disagree that your experience in this 4-H program or project
has resulted in the following outcomes. (Select one response in each row by marking the appropriate box ☒.)
As a result of participating in a 4-H Healthy Living Program I now take the following actions…
Strongly Agree
Agree Disagree Strongly Disagree
Not Applicable to my 4-H Experience
I eat more fruits and vegetables ☐ ☐ ☐ ☐ ☐
I eat more whole grains ☐ ☐ ☐ ☐ ☐
I eat less junk foods ☐ ☐ ☐ ☐ ☐
I drink less soda ☐ ☐ ☐ ☐ ☐
I drink more water ☐ ☐ ☐ ☐ ☐
Please select the responses that best describe you.
7. My family eats at least one meal a day together.
☐ Yes
☐ No
Section IV: Physical Activity
Please select the responses that best describes you.
8. During the past 7 days, how many days were you physically active for a total of at least 60 minutes per day? (Add up all the time you spent in any kind of physical activity that increased
your heart rate and made you breathe hard some of the time) (Mark one box ☒.) ☐ 0 days
☐ 1 day
☐ 2 days
☐ 3 days
☐ 4 days
☐ 5 days
☐ 6 days
☐ 7 days
9. On an average school day, how many hours do you spend watching television? (Mark one box ☒.) ☐ I do not watch TV on an average school day
☐ Less than one hour per day
☐ 2 hours per day
☐ 3 hours per day
☐ 4 hours per day
☐ 5 or more hours per day

40
10. On an average school day, how many hours do you play video games, looking at a computer,
smartphone, or tablet for something that is not for school? (Mark one box ☒.) ☐ I do not play video games or computer games or use a computer for something that is not
school work ☐ Less than one hour per day ☐ 2 hours per day ☐ 3 hours per day ☐ 4 hours per day ☐ 5 or more hours per day
Section V: Awareness of Community
1. Please indicate to what extent you agree or disagree that your experience in this 4-H Healthy Living program that has resulted in the following outcomes. (Select one response in
each row by marking the appropriate box ☒.)
In this 4-H Healthy Living
program… Strongly Agree
Agree Disagree Strongly
Disagree
I pay attention to news events
that affect my community ☐ ☐ ☐ ☐
I am of aware of the important
needs in my community ☐ ☐ ☐ ☐
I really care about my community ☐ ☐ ☐ ☐
I talk to my friends about issues
affecting my community, state,
or world
☐ ☐ ☐ ☐
I’m interested in others’ opinions
about public issues ☐ ☐ ☐ ☐
I listen to everyone’s views
whether I agree or not ☐ ☐ ☐ ☐
When hear about an issue, I try
to figure out if they are just
telling one side of the story
☐ ☐ ☐ ☐
Section VI: Culture
2. Please indicate to what extent you agree or disagree that your experience in this 4-H Healthy Living program that has resulted in the following outcomes. (Select one response in
each row by marking the appropriate box ☒.)
In this 4-H Healthy Living
program… Strongly Agree
Agree Disagree Strongly
Disagree
I explore cultural differences ☐ ☐ ☐ ☐

41
I value learning about other
cultures ☐ ☐ ☐ ☐
I respect people from different
cultures ☐ ☐ ☐ ☐
I have learned about people who
are different from me ☐ ☐ ☐ ☐
Section VII: Engagement and Understanding
3. Please indicate to what extent you agree or disagree that your experience in this 4-H Healthy Living program that has resulted in the following outcomes. (Select one response in
each row by marking the appropriate box ☒.)
In this 4-H Healthy Living
program… Strongly Agree
Agree Disagree Strongly
Disagree
I can make a difference in my
community through community
service
☐ ☐ ☐ ☐
I can apply knowledge in ways
that solve “real-life” problems
though community service
☐ ☐ ☐ ☐
I gained skills though serving my
community that will help me in
the future
☐ ☐ ☐ ☐
I treat everyone fairly and equally
when I am in charge of a group ☐ ☐ ☐ ☐
I am able to lead a group in
making a decision. ☐ ☐ ☐ ☐
I help make sure everyone gets
an opportunity to say what they
think
☐ ☐ ☐ ☐
Section VIII: Engagement
4. Please indicate how likely you are to complete the following outcomes. (Select one
response in each row by marking the appropriate box ☒.)
As a result of my experience in
this 4-H H Healthy Living
program… Definitely Maybe
Probably Not
Definitely
Not

42
I would enjoy hosting someone
from another culture ☐ ☐ ☐ ☐
I can contact someone I’ve never
met before to get their help with
a problem
☐ ☐ ☐ ☐
I plan to work on projects to
better my community ☐ ☐ ☐ ☐
I am encouraged to volunteer
more ☐ ☐ ☐ ☐
After high school I will continue
to work to better my community ☐ ☐ ☐ ☐
I am interested in a career that
helps others ☐ ☐ ☐ ☐
I am interested in working in
government (such as school
board, Director of parks and rec,
legislator, legislative aide, intern)
☐ ☐ ☐ ☐
Section IX: Tell us about You Please select the responses that best describes you.
11. How old are you?
______ Age (in years)
Please select the responses that best describes you.
12. What grade are you in?
______ Grade
13. Which of the following best describes your gender? (Mark one box ☒.) ☐ Female
☐ Male
14. Which of the following best describe your race? (Mark each box ☒that applies to you.) ☐ American Indian or Alaskan Native
☐ Asian
☐ Black or African American
☐ Native Hawaiian or Other Pacific Islander
☐ White
15. Which of the following best describe your ethnicity? (Mark one box ☒.)

43
☐ Hispanic or Latino
☐ Not Hispanic or Latino
16. Which of the following best describes the primary place where you live? (Mark one box ☒.) ☐ Farm
☐ Rural (non-farm residence, pop. < 10,000)
☐ Town or City (pop. 10,000 – 50,000)
☐ Suburb of a City (pop. > 50,000)
☐ City (pop. > 50,000)
THANK YOU!
Appendix C – State Summary Information
State summary information was sent to Ms. JoAnne Leatherman on May 12, 2014. Due to large file
sizes, these summaries were not included in this document. Summary information included
frequencies, percentages, means, and standard deviations on all items for both the 4-7th grade and 8th
-12th grade instruments.

44
Data Analysis Team
The data analysis team was composed of Dr. Joseph L. Donaldson, Assistant Professor, and Mr.
Mitch Naylor, Student Staff Assistant, University of Tennessee Department of 4-H Youth
Development, Agricultural Leadership, Education and Communications.
Dr. Donaldson is an accomplished program evaluator, teacher and researcher. Dr. Donaldson is an
Assistant Professor for the University of Tennessee. He is the primary author of the Program
Evaluation Network, online software used by 700 Extension employees at the four universities. He
teaches the UT College of Agricultural Sciences and Natural Resources graduate course in program
planning and evaluation, an online course with 25 graduate students. He has developed numerous
staff development courses for Extension employees on needs assessment, program planning,
evaluation and accountability topics. His online Extension courses have had enrollments of 800
employees at one time. He has published his research in the Qualitative Report and the Journal of
Extension, among others. Donaldson has served as principal investigator for numerous projects
including the National 4-H Healthy Living Professional and Volunteer Development Needs
Assessment: A Delphi Approach (Donaldson, et. al, 2013). He is an active member of the National
Association of Extension 4-H Agents, and he received the organization’s Air Force Recruiting Salute
Award in 2012. As an Extension 4-H Agent, he provided healthy living programs for 2,000 youth
enrolled in 80 4-H clubs in Giles County, Tennessee.
Mr. Naylor is a senior at the University of Tennessee, Knoxville, majoring in Business Analytics in
the Haslam College of Business. He is a native of Finger, Tennessee, and a graduate of Chester
County High School.
Contact Information
Joseph L. Donaldson, Ph.D.
Assistant Professor
The University of Tennessee Extension
Department of 4-H Youth Development, Agricultural Leadership, Education and Communications
2621 Morgan Circle
212-D Morgan Hall
Knoxville, TN 37996-4525
Phone: 865-974-7245
Fax: 865-974-0882
Email: [email protected]