Embed Size (px)
Citation preview
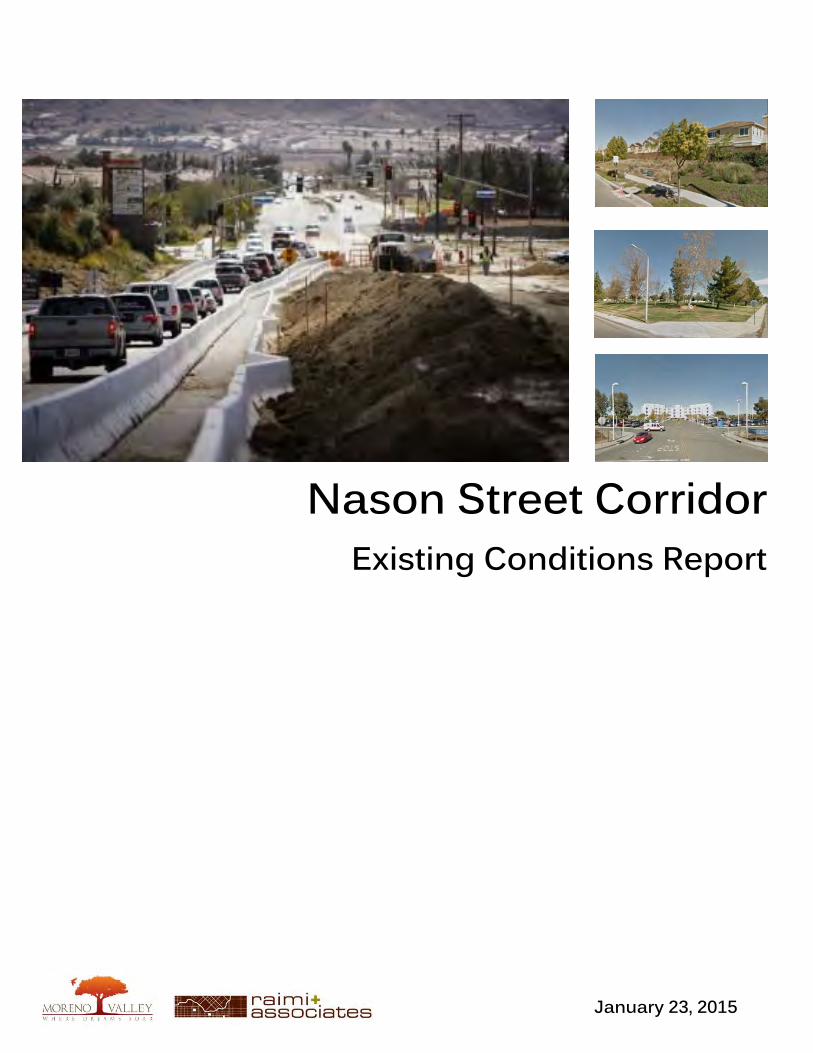
Nason Street Corridor Existing Conditions Report
Nov, 20
January 23, 2015

Page Intentionally Left Blank.

Table of Contents
1. Introduction 1.1 Plan Area . . . . . . . . . . . . . . . . . . . . . . . . . . . . . . . . . . . . . . . . . . . . . . . . . . . . . . . . 1-2
1.2 Site Context . . . . . . . . . . . . . . . . . . . . . . . . . . . . . . . . . . . . . . . . . . . . . . . . . . . . . 1-4
1.3 Project Description . . . . . . . . . . . . . . . . . . . . . . . . . . . . . . . . . . . . . . . . . . . . . . . 1-5
2. Land Use
2.1 Existing Land Use Context . . . . . . . . . . . . . . . . . . . . . . . . . . . . . . . . . . . . . . . . . . . 2-1
2.2 General Plan Land Use . . . . . . . . . . . . . . . . . . . . . . . . . . . . . . . . . . . . . . . . . . . . 2-12
2.3 Conclusions . . . . . . . . . . . . . . . . . . . . . . . . . . . . . . . . . . . . . . . . . . . . . . . . . . . . 2-17
3. Urban Design 3.1 Urban Context . . . . . . . . . . . . . . . . . . . . . . . . . . . . . . . . . . . . . . . . . . . . . . . . . . . 3-1
3.2 Navigating the Corridor . . . . . . . . . . . . . . . . . . . . . . . . . . . . . . . . . . . . . . . . . . . . 3-6
3.3 Pathway Design . . . . . . . . . . . . . . . . . . . . . . . . . . . . . . . . . . . . . . . . . . . . . . . . . 3-12
3.4 Conclusions . . . . . . . . . . . . . . . . . . . . . . . . . . . . . . . . . . . . . . . . . . . . . . . . . . . . . 3-14
4. Transportation 4.1 Transportation Network . . . . . . . . . . . . . . . . . . . . . . . . . . . . . . . . . . . . . . . . . . . 4-1
4.2 Regulatory Consideration . . . . . . . . . . . . . . . . . . . . . . . . . . . . . . . . . . . . . . . . . . 4-40
4.3 Conclusions . . . . . . . . . . . . . . . . . . . . . . . . . . . . . . . . . . . . . . . . . . . . . . . . . . . . . 4-47
5. Market Conditions 5.1 Market Context . . . . . . . . . . . . . . . . . . . . . . . . . . . . . . . . . . . . . . . . . . . . . . . . . . 5-1
5.2 Population . . . . . . . . . . . . . . . . . . . . . . . . . . . . . . . . . . . . . . . . . . . . . . . . . . . . . . . 5-4
5.3 Households . . . . . . . . . . . . . . . . . . . . . . . . . . . . . . . . . . . . . . . . . . . . . . . . . . . . . 5-10
5.4 Housing and Residential Real Estate . . . . . . . . . . . . . . . . . . . . . . . . . . . . . . . . . 5-13
5.5 Income and Employment . . . . . . . . . . . . . . . . . . . . . . . . . . . . . . . . . . . . . . . . . . 5-21
5.6 Real Estate Market . . . . . . . . . . . . . . . . . . . . . . . . . . . . . . . . . . . . . . . . . . . . . . . 5-25
5.7 Conclusions . . . . . . . . . . . . . . . . . . . . . . . . . . . . . . . . . . . . . . . . . . . . . . . . . . . . . . 5-34
6. Summary

Page Intentionally Left Blank.


The Nason Street Corridor Plan Existing Conditions Report | 1-1
1. Introduction This study of the Nason Street Corridor Plan Area (henceforth referred to as “the Corridor”) assesses the potential for new development with a priority on quality of life, mobility, wellness, and economic prosperity. This analysis of the Corridor’s current conditions provides the context needed to determine the potential and preferred uses for the site, and how those proposed uses can build upon the existing uses and character of the site. This assessment is organized by four key areas:
Land Use — describes existing development, General Plan land use designations and policies, Zoning designations, and identifies potential for new uses and development
Urban Design — describes the physical layout and urban design features of the existing area and assesses future potential
Transportation — identifies current and potential bicycle, pedestrian, and transit issues
Market Conditions — analyzes current and future housing, retail, and employment market
Within each of these topics, a comprehensive range of issues are evaluated including current General Plan policies, bicycle and pedestrian data, and economic conditions. Ultimately, the information and conclusions yielded from this study will not only improve understanding of current and future needs, but it will inform the planning process including a public workshop, community vision, and plan for the Corridor.

The Nason Street Corridor Plan Existing Conditions Report | 1-2
1.1 Plan Area The Corridor is centrally located in the City of Moreno Valley, south of State Route 60 (SR-60). The 2,133 acre site is bordered by Oliver Street to the east and Morrison Street to the west, and extends for three miles along Nason Street to the southern boundary line at Iris Avenue. (Figure 1.1)
Existing conditions on the Corridor include automobile-oriented commercial uses and low density, single family residential neighborhoods, parks, schools and hospitals. There also currently vacant parcels that are zoned for public facilities, office, and mixed-use.

The Nason Street Corridor Plan Existing Conditions Report | 1-3
FIGURE 1.1: THE NASON STREET CORRIDOR PLAN AREA

The Nason Street Corridor Plan Existing Conditions Report | 1-4
FIGURE 1.2: THE NASON STREET CORRIDOR
1.2 Site Context The Corridor is located in the core of Moreno Valley’s regional retail stretch which attracts regional traffic through SR-60. SR-60 connects west to Los Angeles, east to the Coachella Valley through Interstate-10, north along Interstate-215 linking Moreno Valley to the High Desert, and south to San Diego. The concentration of consumer goods along SR-60 near the Corridor draws shoppers, diners, and those in search of a one-stop shopping location. Another key connection with the Corridor is Interstate-215 which is located approximately 5 miles from Nason Street via Alessandro Boulevard and Cactus Avenue. I-215 is a key north-south connection in the Inland Empire. That connects Moreno Valley with cities to the south including Perris and Menifee. (Figure 1.2) The Corridor’s close proximity to two key Inland Empire freeways makes the Corridor well-positioned for drawing additional consumers from the Southern California region in addition to local residents and workers. Additionally, freeway connectivity makes the Corridor an attractive place for residential development for those that desire to reside in Moreno Valley while commuting outside for the City for work.
The Nason Street Corridor Plan Existing Conditions Report | 1-5
The natural setting of the area is visually attractive and striking with sweeping vistas of the surrounding mountains of the San Bernardino National Forest and small rock outcrops in and around the Corridor. The southern portion of the site is less than one-quarter mile from the Lake Perris State Recreation Area.
1.3 Project Description The Nason Street Corridor Plan will address key issues and opportunities to enhance mobility and quality of life for residents and businesses, associated service providers. The Corridor Plan will also build upon the regional and local transportation planning efforts to create a safe, active, and user-friendly environment. Initial phases of the Corridor Plan will explore existing strengths and potential areas for improvement in the context of the local and regional setting. Any needs, key issues, or opportunities in the initial assessment will better develop a relevant and effective plan that will attract and retain economic investment, increase employment; expand shopping and entertainment opportunities; improve transportation services; and create a safe, healthy, and active environment along this local and regional thoroughfare.

The Nason Street Corridor Plan Existing Conditions Report | 1-6
Page Intentionally Left Blank.

The Nason Street Corridor Plan Existing Conditions Report | 2-1
2. Land Use The section of the Existing Conditions Report analyzes the land patterns and policy context of the Nason Street Corridor with consideration for connectivity. This analysis examines current land uses and amenities, the existing land uses, the General Plan land uses and applicable policies, existing zoning, and parcel size and ownership patterns.
2.1 Existing Land Use Context Current Uses and Amenities Current uses along the Corridor include a variety of large shopping centers, schools, single family housing, and a regional hospital. Target, Kohl’s Department Store, and small franchise restaurants serve as regional and local amenities for the Corridor and are freeway adjacent along the northern border of the Corridor along Nason Street. Wal-Mart, various restaurants, and the Moreno Valley Auto-Mall located in the northeast corner of the Corridor also serve local and regional consumers. These developments are vehicle-dominant designed parcels that include freestanding structures sporadically placed in the parking lots of larger stores and allow ease of access for patrons arriving via motor vehicle. However, the extensive setback of the anchor stores, such as Target and Wal-Mart, does little for pedestrian connectivity, aesthetic urban form, and equitable ease of accessibility for patrons.
As the Corridor extends south, existing uses serve local residents with single family residential comprising a significant portion of the existing land use. These

The Nason Street Corridor Plan Existing Conditions Report | 2-2
residents are served by several community parks; Valley View High School and Moreno Elementary School along Nason Street; Landmark Middle School in the southeastern portion of the Corridor; and Vista Del Lago High School in the southwest portion. (Figure 2.1) There are also several places of worship along the Nason Street Corridor between Cottonwood Avenue and Alessandro Avenue.
The Riverside County Regional Medical Center (RCRMC) acts as a regional landmark and special facility in the southern portion of the Corridor. The RCRMC provides an extensive range of services, including an emergency room, and allows around-the-clock access to clientele through the connecting streets including Nason Street and Cactus Avenue. The needs and mobility requirements of the RCRMC will be an important factor in the Corridor Plan to ensure adequate accessibility is maintained.
South of Cactus Avenue is primarily vacant land with one single family residential neighborhood and park along Cactus Avenue and Olive Street and another single family residential neighborhood at the corner of Laselle Street and Iris Avenue. The majority (approximately 60 percent) of existing land use throughout the entire Corridor is vacant. These vacant parcels lack physical and environmental constraints and are developable. Large vacant parcels offer opportunity for developing land uses that are complimentary to existing development, attract economic growth, and foster high quality place to live and work.

The Nason Street Corridor Plan Existing Conditions Report | 2-3
FIGURE 2.1 EXISTING LAND USES

The Nason Street Corridor Plan Existing Conditions Report | 2-4
Existing Built Area/Units The Nason Street Corridor is not yet built-out. Currently, there are 337 vacant parcels equating to 1008 acres of vacant land, or 61.8% of the total 1,827 acre plan area. (Table 2.1) Residential housing is the highest use of the built environment. Of the 1,629 total units, 1,374 are single family residential (368 acres), with the remaining 255 units are multi-family residential (43 acres).
Commercial use in the Corridor represents 126 acres of land and roughly 1.8 million square feet of retail and services. The square footage is broken up by 57 various businesses, stores, and restaurants in the Corridor. Education facilities in the area include Moreno Elementary School on Cottonwood Avenue, Mountain View Middle School on Morrison Street, and Valley View High School on Nason Street. These schools have an enrollment of 690; 1,811; and 2,976 students, respectfully, and all are at or near capacity. Additional schools directly adjacent to the Corridor area include La Jolla Elementary, Butterfield Elementary, Landmark Middle School, and Vista Del Lago High School. The remainder of built uses in the Corridor is comprised of a small acreage of public facilities, office space, and hospitals.
TABLE 2.1: EXISTING LAND USE ACREAGE
LAND USE CATEGORY ACREAGE COMMERCIAL AND SERVICES 126
EDUCATION 82 FACILITIES 77
GENERAL OFFICE 8 MOBILE HOME 18
MULTI-FAMILY RESIDENTIAL 29 OPEN SPACE AND RECREATION 96
SINGLE FAMILY RESIDENTIAL 368 TRANSPORTATION, COMMUNICATION, AND
UTILITIES 14
UNDER CONSTRUCTION 0.2 VACANT 1,008 TOTAL 1,827
The Nason Street Corridor Plan Existing Conditions Report | 2-5
Existing Zoning Within the Corridor, the majority of the land is zoned for residential (single family, multi-family, and mobile home), totaling approximately 1,306 of the 1,827 acre planning area. General commercial is the second highest zone with 270 acres covering three separate areas of the Corridor. (Figure 2.2, Table 2.2) A majority of commercially zoned land is located in the northeast portion of the Corridor. The second area of commercial zone parcels surround Riverside County Regional Medical Center (RCRMC), although existing residential uses are close to the RCRMC and the remaining commercial zone lies vacant. Lastly, Kaiser Permanente Community Hospital is located in the third commercial zone in the southeast corner of The Corridor.
Additional zones in the Corridor are inconsistent with the built environment. The majority of the 1,827 acre planning area existing built uses are residential, including some residential developments located in areas zoned for commercial, and may be a result of various market pressures. Though there is a significant portion of vacant land, the Corridor Plan will provide strategic zoning for these un-developed parcels.

The Nason Street Corridor Plan Existing Conditions Report | 2-6
TABLE 2.2: ZONING ACREAGE OF NASON STREET CORRIDOR
ZONE ACREAGE BUSINESS PARK 0.5
GENERAL COMMERCIAL 266
HILLSIDE RESIDENTIAL 52
MEDIUM-HIGH RESIDENTIAL 49
MEDIUM DENSITY RESIDENTIAL 7
MEDIUM RESIDENTIAL 18
MIXED USE OVERLAY 35
MEDICAL OVERLAY 216
NEIGHBORHOOD COMMERCIAL 8
OFFICE 38
OFFICE COMMERCIAL 54
OPEN SPACE 97
PUBLIC FACILITIES 141
RESIDENTIAL 2 DU/ACRE 164
RESIDENTIAL 3 DU/ACRE 182
RESIDENTIAL AGRICULTURE 2 DU/ACRE 18
SINGLE FAMILY RESIDENTIAL 90
SMALL LOT RESIDENTIAL 408
SUBURBAN RESIDENTIAL 233
TOTAL (EXCLUDING OVERLAYS) 1,827

The Nason Street Corridor Plan Existing Conditions Report | 2-7
FIGURE 2.2: ZONING MAP OF THE NASON STREET CORRIDOR

The Nason Street Corridor Plan Existing Conditions Report | 2-8
Airport There are no airports located within the Corridor or within two miles of its boundary. The closest airport is the March Air Reserve base roughly two and a half miles west of the Corridor boundary. The Corridor is also located outside of the Airport Land Use Compatibility Area adopted in 2013, leaving any uses in the Corridor area free from potential conflicts with the March Air Reserve Base.
Parcel Size and Ownership Patterns Parcel sizes within the Corridor range from smaller than one-half acre to over 280 acres. However, 1,601 small parcels comprise a majority of the Corridor and are primarily single family residential, leaving the remaining 227 parcels between 1 and 286 acres. The two largest parcels are currently vacant and zoned for Residential Agriculture at two dwelling units per acres and are located in the southern half of The Corridor. The 225 parcels between 5 and 25 acres located within the Corridor are zoned for various uses including medical services, schools, open space, and shopping centers and may present an opportunity for greater density, neighborhood commercial, and mixed use (Figure 2.3).
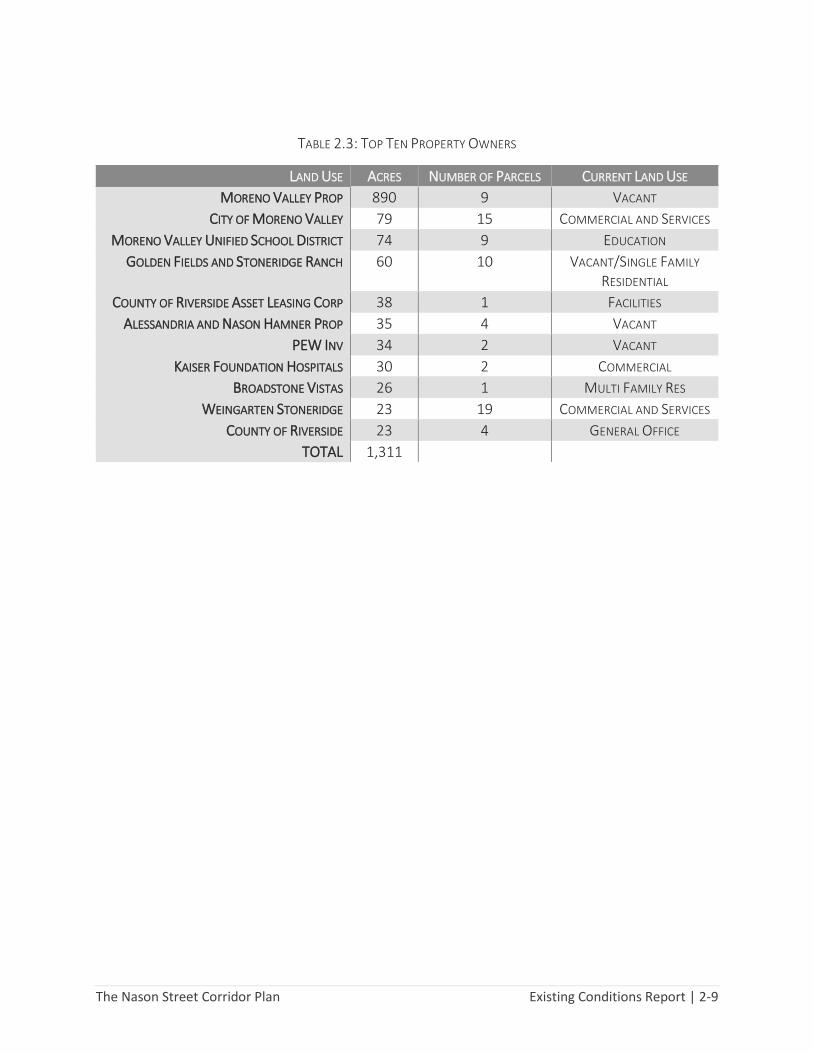
Parcel ownership in the Corridor reflect the high concentration of single family residential and City of Moreno Valley land in the plan area. The top ten land owners, by acreage, comprise residential development companies and publicly-owned land. Moreno Valley Prop is the largest land owner, possessing 890 acres (40%) of the 1,827 acres in the Planning Area. Moreno Valley Prop’s property includes the two largest parcels in the Corridor which are 280 acres each. The second and third holdings in the Corridor are owned by the City of Moreno Valley (78.5 acres) and Moreno Valley Unified School district (74 acres). The land holdings of the remaining 7 of the top 10 land owners range from 22 to 60 acres. Some parcels are currently vacant, while others are currently used for housing, commercial, and facilities. None of the top ten property owners are an individual. (Figure 2.4, Table 2.3)
The Nason Street Corridor Plan Existing Conditions Report | 2-9
TABLE 2.3: TOP TEN PROPERTY OWNERS
LAND USE ACRES NUMBER OF PARCELS CURRENT LAND USE
MORENO VALLEY PROP 890 9 VACANT
CITY OF MORENO VALLEY 79 15 COMMERCIAL AND SERVICES
MORENO VALLEY UNIFIED SCHOOL DISTRICT 74 9 EDUCATION
GOLDEN FIELDS AND STONERIDGE RANCH 60 10 VACANT/SINGLE FAMILY
RESIDENTIAL
COUNTY OF RIVERSIDE ASSET LEASING CORP 38 1 FACILITIES
ALESSANDRIA AND NASON HAMNER PROP 35 4 VACANT
PEW INV 34 2 VACANT
KAISER FOUNDATION HOSPITALS 30 2 COMMERCIAL
BROADSTONE VISTAS 26 1 MULTI FAMILY RES
WEINGARTEN STONERIDGE 23 19 COMMERCIAL AND SERVICES
COUNTY OF RIVERSIDE 23 4 GENERAL OFFICE
TOTAL 1,311

The Nason Street Corridor Plan Existing Conditions Report | 2-10
FIGURE 2.3: PARCEL SIZE

The Nason Street Corridor Plan Existing Conditions Report | 2-11
FIGURE 2.4: PARCEL OWNERSHIP

The Nason Street Corridor Plan Existing Conditions Report | 2-12
2.2 General Plan Land Use General Plan Designations General Plan Land Use Designations were adopted with the City’s General Plan in 2006. Land Use designations in the Corridor are largely for residential purposes with roughly 1,360 acres designated residential with varying densities. Commercial use is the second most designated use at 274 acres, followed by public facilities at 141 acres (Table 2.4). Residential designations are spread out throughout the Corridor from the northwest corner to the southeast corner and are adjacent to the schools and parks within the plan area (Figure 2.5). Commercial uses are reserved for medical facilities, the adjacent land and property near SR-60 in the northeast corner of the Corridor. Overall, the proportions of land use designations are consistent with the current build form along the Corridor.
Though residential is the most prevalent land use designation, the spatial layout of land use designations in the Corridor evenly distributes residential, education, and commercial. This designation pattern allows for residents localized and potentially walkable access to commercial uses and schools without having to use a vehicle to navigate the length of the Corridor. As the northern commercial uses serve visitors and locals, there may be an opportunity for the undeveloped commercial property to provide residents with local services to meet every day needs.

The Nason Street Corridor Plan Existing Conditions Report | 2-13
FIGURE 2.5: GENERAL PLAN LAND USES

The Nason Street Corridor Plan Existing Conditions Report | 2-14
TABLE 2.4: GENERAL PLAN LAND USE AND EXISTING LAND USES
GENERAL PLAN LAND USE GENERAL PLAN
ACRES EXISTING USES EXISTING USE
ACREAGE
BUSINESS PARK/LIGHT INDUSTRIAL 0.5 COMMERCIAL AND SERVICES 126
COMMERCIAL 274 EDUCATION 82
HILLSIDE RESIDENTIAL 51 FACILITIES 77
OFFICE 11 GENERAL OFFICE 8
OPEN SPACE 95 MOBILE HOME 18
PUBLIC FACILITIES 141 MULTI-FAMILY RESIDENTIAL 29
RESIDENTIAL OFFICE 82 OPEN SPACE AND RECREATION 96
RESIDENTIAL 10 DU/AC 45 SINGLE FAMILY RESIDENTIAL 368
RESIDENTIAL 15 DU/AC 31
TRANSPORTATION, COMMUNICATION, AND
UTILITIES 14
RESIDENTIAL 2 DU/AC 182 UNDER CONSTRUCTION 0.2
RESIDENTIAL 3 DU/AC 186 VACANT 1008
RESIDENTIAL 30 DU/AC 26
RESIDENTIAL 5 DU/AC 320
RESIDENTIAL 5 OR 15 DU/AC 383
TOTAL 1827 1827
General Plan Policies With the 2006 Moreno Valley General Plan, the City of Moreno Valley adopted a series of guiding policies for development within its boundaries. General Plan Policies address a range of topics and include relevant language that guides the Corridor Plan. Assessment of General Plan Policies, particularly the Community Development; Parks, Recreation, and Open Space; and Circulation Elements will provide a better understanding of specific policies that will support or prohibit the mobility improvement goals and objectives of the Corridor Plan.

The Nason Street Corridor Plan Existing Conditions Report | 2-15
GENERAL PLAN POLICIES THAT SUPPORT THE GOALS OF THE NASON STREET PLAN
Goal VI establishes support for a safe traffic environment for vehicle, bicycles and pedestrians. This overarching goal supports a multi-modal network for that is safe and accessible for all users.
5.8.3 Encourages public transportation opportunities that addresses the particular needs of transit dependent individuals in the City such as senior citizens, the disabled and low -income residents. It is important to provide equal accessibility for all who might live, work, or shop along the Corridor.
2.4 Encourages commercial development be are conveniently located, efficient, attractive, and have safe and easy pedestrian and vehicular circulation. This shows the prioritization of pedestrian accessible commercial shops, enhancing pedestrian connectivity.
5.9.1 Encourages walking as an alternative to single occupancy vehicle travel, and help ensure the safety of the pedestrian. Increased walking throughout the Corridor will support active lifestyles and reduce vehicle traffic.
2.4.8 Requires orientation of development to focus on the pedestrian, with a human-scale environment with pedestrian access, seating, courtyards, and sidewalk access. Pedestrian oriented development will support an active and multi-modal corridor.
6.6.2 Supports multi-family residential development in close proximity to commercial centers. Close proximity to everyday uses will help support pedestrian travel and increase overall accessibility in the Corridor.
4.3.1 Encourages multiuse trails, regional trails, and community trails to be integrated into urban populations, schools, and commercial areas. This policy not only supports recreational connectivity, but active and practical recreational planning that can be used in the Corridor planning effort.
7.5.2 Encourages energy efficient modes of transportation and fixed facilities, including transit, bicycle, and pedestrian transportation. Support for adequate infrastructure and efficient transportation modes will reduce single occupancy vehicle trips and support active transportation in the Corridor.
5.1.1 Encourages plans to have pedestrian and bicycle access, in addition to vehicular. This prioritization will increase potential for pedestrian and bicycle use and promote active transportation.
7.5.3 Supports planned commercial, industrial, and multi-family density residential development to be within areas of high transit potential. With the right infill development patterns and alternative transportation network, Nason Street will have high potential for supporting transit.
5.7.2 Encourage sidewalk connection to schools and bus stops. This is in line with safe pedestrian connections throughout the Corridor and supports the Safe Routes to School objective of the Corridor Plan.

The Nason Street Corridor Plan Existing Conditions Report | 2-16
GENERAL PLAN POLICIES THAT MAY CONFLICT WITH THE GOALS OF THE NASON STREET PLAN
2.4.4 Establishes an overlay district around Riverside County Regional Medical Center with supportive and compatible land uses. Consistency and cohesive connections with the overlay district will be necessary along the Corridor.
5.2.1 Minimizes direct residential access from collector streets. Restricting direct access to residential access may support the perception of a safe environment, but it will also decrease incentives and ease of access to collector streets for bicycles and pedestrians. To support an active corridor, direct access will be needed to support walking and biking along roads for short trips and linkages to regional transit services.
2.10.11 Encourages screening and buffering between non- residential and residential property to mitigate noise. Buffers could potentially break up transit connections, through sound walls and other physical barriers. Noise mitigation along the Corridor should consider pedestrian connections and activity when mitigating noise impacts.
5.2.4 Supports curvilinear streets and cul-de-sacs in residential sub-divisions. Disconnected street patterns are not easy to navigate through walking or biking and would discourage active transportation in the Corridor.
2.10.12 Encourages parking screens, such as low profile walls and grade separation. Dividing transportation elements could prevent connection of other modes of transportation such as pedestrian and bicycle. Screened parking areas should consider easy access points for walking and biking, to maintain adequate circulation.
5.5.3 Prohibits points of access from other existing or planned access points and requires points of access to roadways to be separated sufficiently to maintain capacity, efficiency, and safety of the traffic flow. Separating access points will also separate connection points for alternative modes of transportation. This requirement would not support easy connectivity in the Corridor.
5.1.3 Requires adequate off-street parking for all developments. Additional off-street parking requirements support vehicle dominated development, and reduces effectiveness and safety of bikeways and pathways. Balancing parking with bicycle and pedestrian safety and priority will need to be addressed.
The Nason Street Corridor Plan Existing Conditions Report | 2-17
2.3 Conclusions Land Use Compatibility The Corridor is largely comprised of vacant land, with single family residential making up the majority of existing built uses. For future development, several issues must be taken into consideration. Because much of the existing development consists of residential use, compatible uses adjacent to the areas should be considered, while uses in conflict with residential should be precluded. The presence of two key medical facilities creates an opportunity for compatible and supportive uses such as medical office, and mixed use for medical workers to live and shop. The large vacant lots consist of developable land with few environmental conflicts that require mitigation. These vacant areas in the Corridor present a tremendous opportunity for developing uses that support and complement the existing residential and medical uses.
One potential challenge is the consideration of the noise and traffic volumes associated with regional hospitals, the RCRMC may potentially face land use compatibility challenges. While current land use designations support commercial uses surrounding RCRMC, recent entitlement activity indicates a market demand for the development of residential uses in close proximity of the medical center. Future residential development should be designed with consideration of this potential conflict and utilize architectural and site design features to reduce compatibility issues.
Existing large scale lot design in the Target and Wal-Mart shopping centers poses an issue for pedestrian connection options and pedestrian safety. The existing built parcels with large setbacks from the curb present potential challenges to pedestrian and bicycle mobility. Under the Corridor Plan, it will be necessary to address this physical barrier, and strategize on future developments on how to better connect walkers and cyclists to store fronts.

The Nason Street Corridor Plan Existing Conditions Report | 2-18
Public Health and Safety The current residential neighborhood developments do not provide adequate pedestrian and bike connection routes to Nason Street. Because of this disconnected pattern, there are physical barriers that inhibit active transportation and subsequently contribute to health issues of local residents.
The Corridor serves as an important thoroughfare in Moreno Valley. A vehicle-dominated road may significantly reduce pedestrian and cyclist safety. This threat to pedestrian and cyclist safety may inhibit an active lifestyle objectives and future roadway design considerations should seek to balance all modes of transportation. Opportunities to address this issue are discussed in the Transportation section of this report.
Due to the Corridor’s close proximity to SR-60 areas of the Corridor closest to the freeway such as those north of Cactus Avenue are subjected to above average rates of air pollution.. Because there is potential for the Corridor Plan to increase the number of people who might be exposed to pollutants through increased physical activity associated with walking and bicycling. The Corridor’s close proximity to a major regional freeway is a health issue. Inhaling unhealthy particulates from freeway and roadway traffic may have severe and long term health impacts including cardiovascular disease, lung disease, and asthma. The Corridor Plan will consider neighborhood design and residential land use compatibility relative to the freeway.
Opportunities Establishing complete and multi-modal connections with the existing built environment, especially current traditional suburban neighborhoods and large commercial parking lots will be an important objective of the Corridor Plan if the City is to realize and active and transit supportive environment.
One of the biggest challenges to transforming built-out corridors to walkable, bike friendly, transit-supportive corridors is fixing disconnected development patterns. Because a large portion of the Corridor is undeveloped, there is an opportunity to
The Nason Street Corridor Plan Existing Conditions Report | 2-19
establish a connected and cohesive pedestrian, bicycle, and transit oriented development pattern correct from the start.
Similarly, the current land use designations and arrangements prevent large concentrations of single uses in the Corridor and place residents within a short distance of schools and commercial amenities. Due to the proximity of residential and commercial uses, there is an opportunity to encourage non-motorized transportation options and access points between residences, schools, and commercial properties. This non-motorized approach will help support plan objectives to create an active environment and promote health and sustainability within the Corridor. The Corridor’s location along a major retail core is also a significant economic opportunity that can help support the mobility objectives of the plan by providing an increased density of destinations.
Based on existing land use conditions, there is an opportunity to improve the mobility for residents and patrons navigating through the Corridor. Through additional land use specifications and potential changes, the Corridor Plan will provide a foundation for development that will promote wellness and improve quality of life for Moreno Valley residents. Initial land use opportunities are identified through the spatial distribution of residential, education, and commercial facilities. The primary land use strategies should focus on developing vacant land with development patterns that connect future development to existing development along and within the Corridor.

The Nason Street Corridor Plan Existing Conditions Report | 2-20
PAGE INTENTIONALLY LEFT BLANK.
The Nason Street Corridor Plan Existing Conditions Report | 3-1
3. Urban Design This assessment of the predominant urban patterns along the Corridor defines the context within which potential urban design and economic development opportunities will be studied and on which future planning and design recommendations will be based. This analysis covers the following topics:
Urban Context– Analyze existing urban patterns within the Planning Area with a short description of the opportunities that exist for future development and transformation.
Corridor Connectivity– Identify existing street connections to the Corridor from adjoining neighborhoods and properties, and the potential for future multi-modal network connectivity.
Corridor Bike/Walkability – Summarize existing public frontage conditions along the Corridor, their implications to the bike/walkability of the Corridor, and the overarching goal of transforming Nason Street into a multi-modal, multi-use corridor and into a catalyst for future economic development.
Urban Context Existing Development Patterns Figure 3.1 provides a high-level illustration of the predominant development patterns within the planning area, and begins to organize the planning area into areas and segments with definable levels of opportunity for improved multi-modal connectivity and walkable, mixed-density, mixed-use neighborhood development.
The Nason Street Corridor Plan Existing Conditions Report | 3-2
These areas, in-turn, will comprise the organizing framework for the Planning Area, within which a range of land use, urban design, and streetscape and landscape design strategies will be described. The current development pattern within that Plan Area is characterized by single-use development projects that are connected to one another primarily by wide, streets that are deficient in pedestrian- and bicycle-oriented facilities. Opportunities for walking or biking within or between these individual developments are as follows:
Vacant Land – There are some large vacant sites that offer significant opportunities for more connective infill development. Much of this vacant land is concentrated in the center of the Planning Area, at the intersection of Nason Street and Alessandro Boulevard, presenting the opportunity to create a well-connected “health care district” that provides new health-related businesses and a range of housing choices within walking distance of the Riverside County Regional Medical Facility.
Commercial Shopping Centers – The Northeast portion of the Planning Area – roughly between SR-60 and Fir Avenue – is primarily occupied by a regional commercial shopping center that, due to topography, is located at a higher elevation than the adjacent Corridor, fronting it with retaining walls. Strategies for improved multi-modal connectivity to this area will be studied.
Hospitals – Two hospitals – the Moreno Valley Community Hospital (Kaiser Permanente) and the Riverside County Regional Medical Center (RCRMC) occupy large parcels of land in the Planning Area. RCRMC is centrally located in the Planning Area, and could support a range of related future development opportunities on the vacant parcels surrounding it, especially – and consistent with the City’s Economic Development Action Plan – medical office uses and other healthcare related businesses. In addition, opportunities for a range of housing types within easy walking and biking distance of these important employment centers – along with citywide and regional transit access – will be studied.
Schools – Within and bordering the Planning Area are a number of schools supporting existing and future residential development along the Corridor.

The Nason Street Corridor Plan Existing Conditions Report | 3-3
Multi-modal access and safe routes to school will be a focus of the planning work ahead.
Parks & Open Space – A range of formal and informal open spaces are located within and surrounding the Planning Area, and due to the large amounts of vacant land, along the corridor, there are significant opportunities for additional open spaces in the future, including passive and active parks, trails, and plazas. The existing and potential future community open spaces – along with a more complete network of complete streets1 – will be studied as a unified public space network, as an armature for future development.
Large Lot Houses (Historic Pattern) – Within the Planning Area, and along the corridor, there remain segments of the original rural housing patterns – large rural ranch-style houses, on large open lots. In some cases, particularly along Nason Street, it may be economically advantageous for these houses to be replaced over time with more urban, multi-family and/or mixed-use development types. Strategies to accommodate this transition will be studied.
New, Recent, and Approved Production Tract House Developments – Particularly between SR-60 and Cottonwood Avenue, these new communities are adjacent to but not connected to Nason Street, typically fronting the corridor, with development perimeter walls that lack pedestrian passages or other opportunities for direct access between adjacent developments and Nason Street. Landscape and streetscape design strategies will be important design considerations to ensure that the Corridor-facing edges of these developments contribute as much as possible to a unified Nason Corridor design.
1 Complete Streets are streets designed and operated to enable safe access for all users, including pedestrians, bicyclists,
motorists and transit riders of all ages and abilities. Complete Streets make it easy to cross the street, walk to shops, and bicycle to work.

The Nason Street Corridor Plan Existing Conditions Report | 3-4
FIGURE 3.1: EXISTING DEVELOPMENT PATTERNS

The Nason Street Corridor Plan Existing Conditions Report | 3-5
Large vacant parcels at Nason St & Alessandro Blvd Commercial Center at Nason St and SR-60
The Riverside Country Regional Medical Center Valley View High School at Nason St and Eucalyptus Ave
One of a number of open spaces in the Planning Area
Original large rural residential lots along Nason St
Recent tract production housing development on Nason St
Recent tract production housing development on Nason St
The Nason Street Corridor Plan Existing Conditions Report | 3-6
Navigating the Corridor Existing Corridor Connectivity Opportunities Figure 3.2 illustrates the existing range of urban “frontage” conditions along the Nason Street Corridor. Inherent to each condition is a range of potential design strategies to better unify the Corridor and accommodate future development opportunities. These strategies generally range from streetscape and landscape only strategies, to more comprehensive designs of entire neighborhoods and districts. The prominent conditions that occur along the Corridor can be generally categorized into the following levels of connectivity—both existing and potential future—to the Corridor itself:
Very limited or no potential for future connectivity (existing developments) – This condition is typically characterized by sound walls and/or retaining walls, many buffered from the Corridor by some type of landscaping, but providing few or no opportunities for street or pedestrian connectivity other than approximately every quarter mile along east west arterial or collector streets. A development that does provide connections to Nason Street is the residential development located on the northwest corner of Cottonwood Avenue and Nason Street, which provides pedestrian paths between the cul-de-sacs and the Nason Street sidewalk Improvements along these segments of Nason Street will typically be limited to a more unified landscape and streetscape design, but there may also be some opportunity for new pedestrian and bicycle linkages..
Limited potential for future connectivity (planned developments) – The same pattern described above – development perimeter walls facing Nason Street – has been approved for a number of planned developments submitted to the city recently. For those planned communities that have not yet begun construction, there may be opportunities to work with builders/developers to refine the plan to accommodate improved levels of

The Nason Street Corridor Plan Existing Conditions Report | 3-7
connectivity, within and context of the unified vision for Nason Street that this planning effort intends to achieve.
Potential for future connectivity (existing developments) – This condition is characterized primarily by properties that were part of the original urban pattern of the Planning Area – the large-lot rural residential developments which still front onto Nason Street. Over time, some or most of these rural properties may be replaced with more-urban development types that, along with streetscape and landscape improvements, provide opportunities for higher levels of multi-modal connectivity to Nason Street.
High Potential for future connectivity (Vacant Land) – As discussed in Section 2.2, there are large parcels of vacant land distributed throughout the planning area that provide a wide range of opportunities for future development and economic improvement based on the unified vision of the Alessandro Boulevard Corridor Vision Plan, which provides recommendations for transforming and revitalizing Alessandro Boulevard into a transit corridor that links a planned Metrolink station with the community of Moreno Valley. Alternative development patterns and public realm design (streetscape, landscape, pedestrian and bike facilities) will be studied, with the objective of encouraging development types that are consistent with the overall goals of the Vision Plan.

The Nason Street Corridor Plan Existing Conditions Report | 3-8
FIGURE 3.2: CORRIDOR CONNECTIVITY OPPORTUNITIES
The Nason Street Corridor Plan Existing Conditions Report | 3-9
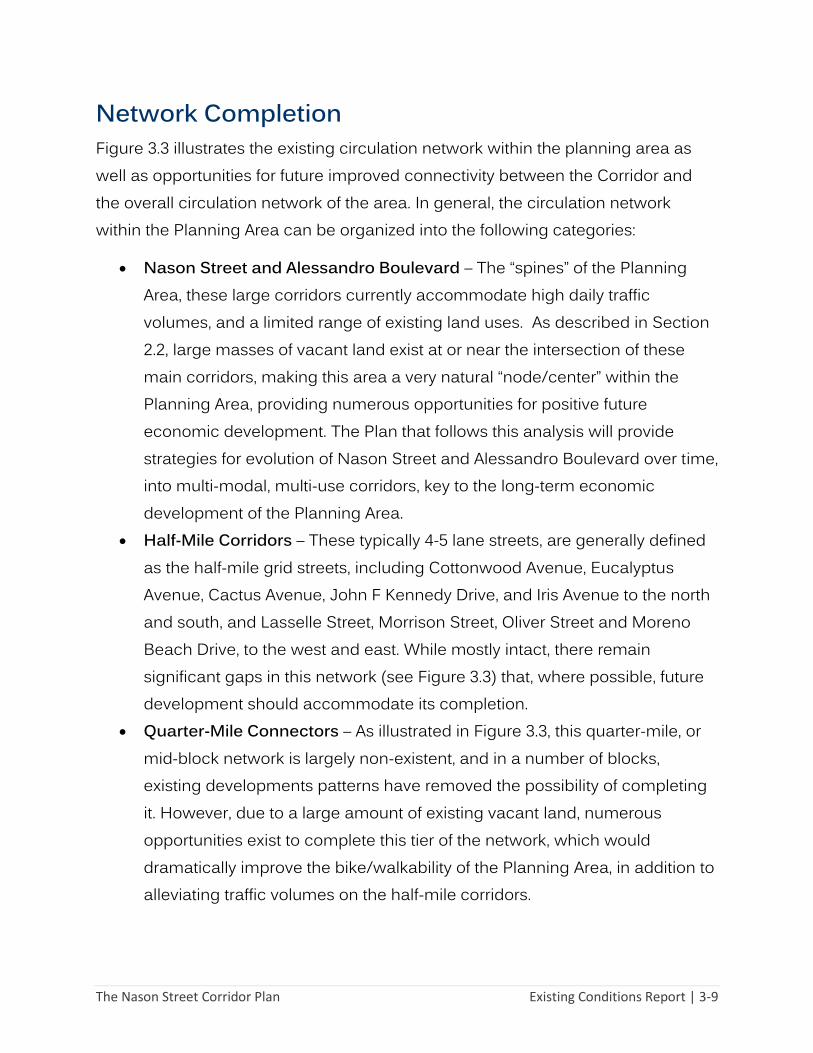
Network Completion Figure 3.3 illustrates the existing circulation network within the planning area as well as opportunities for future improved connectivity between the Corridor and the overall circulation network of the area. In general, the circulation network within the Planning Area can be organized into the following categories:
Nason Street and Alessandro Boulevard – The “spines” of the Planning Area, these large corridors currently accommodate high daily traffic volumes, and a limited range of existing land uses. As described in Section 2.2, large masses of vacant land exist at or near the intersection of these main corridors, making this area a very natural “node/center” within the Planning Area, providing numerous opportunities for positive future economic development. The Plan that follows this analysis will provide strategies for evolution of Nason Street and Alessandro Boulevard over time, into multi-modal, multi-use corridors, key to the long-term economic development of the Planning Area.
Half-Mile Corridors – These typically 4-5 lane streets, are generally defined as the half-mile grid streets, including Cottonwood Avenue, Eucalyptus Avenue, Cactus Avenue, John F Kennedy Drive, and Iris Avenue to the north and south, and Lasselle Street, Morrison Street, Oliver Street and Moreno Beach Drive, to the west and east. While mostly intact, there remain significant gaps in this network (see Figure 3.3) that, where possible, future development should accommodate its completion.
Quarter-Mile Connectors – As illustrated in Figure 3.3, this quarter-mile, or mid-block network is largely non-existent, and in a number of blocks, existing developments patterns have removed the possibility of completing it. However, due to a large amount of existing vacant land, numerous opportunities exist to complete this tier of the network, which would dramatically improve the bike/walkability of the Planning Area, in addition to alleviating traffic volumes on the half-mile corridors.

The Nason Street Corridor Plan Existing Conditions Report | 3-10
Sub-Quarter- Mile Connectors – Typically 2-3 lane streets, and almost entirely absent in the planning area. Wherever possible, at least one “through-block” connection should be provided per quarter-mile block. In some existing developments, namely tract residential developments with typically only one or two access points in and out, these connections are not possible. However, as new development proposals are received, this level of “through” network connectivity and completion is highly recommended.
Neighborhood Streets – Typically 2-lane streets which should be designed to be low-speed, and accommodate shared use between all modes of travel, including cars, bikes, and transit. Many existing new residential streets within the planning area have been designed quite wide (up to 40 ft curb-to-curb).
Figure 3.3 is intended to be illustrative, for the purposes of this discussion only, and further more careful study will be conducted to determine the potential feasibility of any network completions strategies.
It should be noted that the street network within the Planning Area is a grid system, providing good connectivity along the Corridor, although transit accessibility would be improved with shorter block lengths. Riverside Transit Agency (RTA) currently operates three local fixed routes and one CommuterLink express route in the Planning Area that provide service to surrounding cities and communities, as well as local civic, institutional, and shopping venues. RTA’s 10-Year Transit Network Plan will improve local bus service in the Corridor, potentially improving access to modes other than the automobile for residents and employees of the area. Additionally, WRCOG’s 2010 study of potential Bus Rapid Transit routes in Western Riverside County recommends BRT service to the Riverside County Medical Center. Finally, the Alessandro Boulevard Corridor Vision Plan provides recommendations for transforming and revitalizing Alessandro Boulevard into a transit corridor that links a planned Metrolink station to the Riverside County Regional Medical Center.

The Nason Street Corridor Plan Existing Conditions Report | 3-11
FIGURE 3.3: NETWORK COMPLETION OPPORTUNITIES

The Nason Street Corridor Plan Existing Conditions Report | 3-12
Pathway Design Existing Public Frontage Conditions The images on the following page illustrate a range of existing public “frontage” conditions along the Corridor. Inherent with each condition is a range of potential design strategies that are possible to unify the Corridor and accommodate future design and development opportunities.
Pedestrian Facilities – The quality of pedestrian facilities along the corridor vary widely from block to block, and result in a broken, discontinuous pedestrian circulation network. While new tract residential developments have provided relatively well-landscaped, and buffered sidewalks and/or multi-use trails along Nason Street, their common lack of mid-block connectivity with Nason Street creates very long, unbroken blocks, which discourage pedestrian traffic. Sidewalks are largely nonexistent (or occur as rural shoulders) along the rest of the Corridor, creating significant gaps in the overall network. Street trees are typically undersized or missing along the Corridor, failing to provide adequate shade and/or buffers along sidewalks between vehicular traffic and pedestrians that would encourage higher pedestrian use.
Bicycle Facilities – With the exception of the Class I multi-use trail for a single block of Nason Street, between Eucalyptus Avenue and Dracaea Avenue, and Class II bike lanes along the newly constructed south extension of Nason Street (south of Cactus Avenue), the corridor currently does not accommodate safe bicycle travel. The Moreno Valley Bikeway Master Plan proposes Class II bike lanes along the entirety of the corridor, which will be incorporated into all streetscape design recommendations proposed by this planning effort.
As described in previous sections, the overarching goal of the Plan that will follow this existing conditions analysis is to develop streetscape, landscape and urban design strategies that:

The Nason Street Corridor Plan Existing Conditions Report | 3-13
a. Better accommodate bicycles and pedestrian circulation along and across the Corridor;
b. Better unify disparate development types along and across the corridor; and c. Balance the needs of automobile, pedestrians, cyclists, and public transit
along the corridor.
A nicely landscaped and buffered sidewalk along Nason St between Eucalyptus Ave and Dracaea Ave
New sidewalk, parkway, and landscape buffer along the
east side of Nason St from Fir Ave to Dracaea Ave
One of a limited number of pedestrian connections
through sound walls lining a number of the north blocks
along the Nason St Corridor.
Incomplete sidewalks, often obstructed by street signage, are common along the Nason St Corridor.
Incomplete sidewalk network: common at transitions
between original rural development patterns and more
recent development projects.
Typical rural shoulder frontages commonly associated with the original rural developments along Nason St.
The Nason Street Corridor Plan Existing Conditions Report | 3-14
Conclusions The Corridor presents a unique opportunity to evolve this important part of Moreno Valley from its current “adolescent” pattern of auto-centric, relatively disconnected collection of individual development projects into a mature set of well-connected, walkable neighborhoods. This Corridor Plan will define patterns, strategies, conceptual designs, and recommendations that can inform updated development standards so as to coordinate further public and private improvements to deliver a more unified multimodal corridor, and more walkable, bikable, neighborhoods and centers well-connected to it. Key elements of the new vision for the Corridor are expected to include:
Complete Streets – An evolved design for Nason Street will be developed to complete its design and function to include better pedestrian, bicycle and transit facilities. Complete streets recommendations will also be provided for existing and future crossing and side streets within adjoining neighborhood.
Complete Network– Opportunities and alternatives for more and better pedestrian and bicycle routes between existing and future neighborhoods, and to Nason Street itself, will be identified and explored.
Complete Neighborhoods – Opportunities for infilling vacant properties with a range of housing types and neighborhood-serving commercial and civic amenities will be presented. Such infill neighborhoods offer both the opportunity to provide housing options not currently available in this area, as well as the possibility generating new centers of social, commercial and civic activity that are easily accessible by a range of travel modes to residents of the existing neighborhoods in the Plan Area.
Housing Near Jobs – Beyond the notion of a “jobs/housing balance” within the City of Moreno Valley as a whole, with the presence of two major health care employment centers, the Corridor Plan Area offers the prospect of introducing more housing near these important employment generators. A range of housing choices and healthcare-related businesses can be provided within a well-connected “health care district” setting, such that
The Nason Street Corridor Plan Existing Conditions Report | 3-15
workers have an array of options for living and working nearby, reducing commute-related stresses on the workers and the environment.
Health and Sustainability Outcomes – This effort also provides the opportunity to create a mature, complete set of walkable neighborhoods and centers that offer a variety of ways of getting around – walking, bicycling, transit, and driving – and that provide active, outdoor oriented lifestyles for children and families to live, work, shop and play.

The Nason Street Corridor Plan Existing Conditions Report | 3-16
Page is Intentionally Left Blank.

The Nason Street Corridor Plan Existing Conditions Report | 4-1
4. Transportation This section of the Existing Conditions Report discusses the current and proposed transportation network along with current regulatory policies pertaining to the Corridor.
4.1. Transportation Network The Corridor is approximately three miles long, running north-south between Iris Avenue in the south to State Route 60 (SR-60) to the north. Figure 4.1 shows the Corridor Study Area location. Land uses around the corridor include retail to the north near SR-60, Valley View High School at the corner of Eucalyptus Avenue, and Riverside County Regional Medical Center on the corner of Cactus Avenue. Significant portions of the Corridor are residential and several blocks are currently undeveloped.
The transportation system along the Corridor includes diverse elements including roadway systems, bicycle systems, pedestrian systems, and a public transit system. A field assessment was conducted in October 2014 to further assist in the exiting conditions evaluation. The transportation elements within the study area are discussed in greater detail below.

The Nason Street Corridor Plan Existing Conditions Report | 4-2
Figure 4.1 – Corridor and Study Area

The Nason Street Corridor Plan Existing Conditions Report | 4-3
Bicycle and Pedestrian Network Non-motorized modes of transportation are environmentally friendly alternatives to motor vehicles that enhance both personal and social well-being. These modes of travel are part of a seamless transportation system that includes connectivity and access to transit. In addition to transporting, these modes of travel provide many public access, health, and economic benefits. Safe, convenient, attractive, well-designed, and well maintained pedestrian, and bicycle facilities are essential if these modes are to be properly accommodated and encouraged. Inadequate facilities can degrade the user experience or discourage users altogether.
Pedestrian Facilities Six factors that might affect walkability and the pedestrian experience along Nason Street have been analyzed, including:
Sidewalk Continuity - Communities are more walkable if sidewalks do not end abruptly and are present throughout the entire segment on both sides of a roadway. This is especially important for the mobility-impaired or those pushing small children in strollers.
Sidewalk Conditions - This refers to the physical condition of sidewalk surfaces. Sidewalks that are broken or cracked can deter walkability and pose a safety hazard, particularly for the mobility impaired, such as those in wheel chairs and persons using walkers or strollers.
Corridor sidewalk with shade and buffering.

The Nason Street Corridor Plan Existing Conditions Report | 4-4
Shading - Persons are more inclined to walk in areas where there is shade present, particularly in Southern California and Riverside County. Additionally, shade trees create an aesthetic value that is pleasing to the pedestrian.
Grade - Persons are more inclined to walk in areas that are relatively flat or have limited grade changes.
Amenities - All items being equal, persons are more inclined to walk in areas that have interesting environments including shopping, retail, restaurants, public art, and other points of interest. Pedestrian-friendly amenities include street furniture, attractive paving, way-finding signage, enhanced landscaping, pet waste infrastructure, and improved lighting.
Buffers - A more pedestrian friendly environment is one in which there is some degree of separation between the pedestrian and the motorist. This typically includes wider sidewalks, street parking and sidewalk bulb-outs at intersections where feasible. Crosswalks with appropriate signage serve as an important buffer as well.
A general evaluation of the current pedestrian environment along Nason Street is provided in Table 4.1 below. A map of the Corridor’s existing sidewalk inventory is provided on Figure 4.2.
Missing sidewalk along Nason Street

The Nason Street Corridor Plan Existing Conditions Report | 4-5
Figure 4.2 – Existing Pedestrian Infrastructure

The Nason Street Corridor Plan Existing Conditions Report | 4-6
TABLE 4.1 EXISTING PEDESTRIAN FACILITIES
CRITERIA EVALUATION
SIDEWALK CONTINUITY PORTIONS OF NASON STREET PROVIDE DISCONTINUOUS SIDEWALKS, SIDEWALKS ON ONLY
ONE SIDE OF THE ROADWAY, OR NO SIDEWALKS AT ALL. NORTH OF COTTONWOOD
AVENUE, SOME GAPS EXIST BUT SIDEWALKS ARE PRESENT ON AT LEAST ONE SIDE OF THE
STREET. BETWEEN COTTONWOOD AVENUE AND CACTUS AVENUE, LITTLE TO NO SIDEWALK
CONNECTIVITY IS PROVIDED. SOUTH OF CACTUS AVENUE UNTIL IRIS AVENUE PROVIDES
SIDEWALKS ON ONE SIDE OF THE STREET.
SIDEWALK CONDITIONS WHERE SIDEWALKS DO EXIST ALONG THE CORRIDOR, THEY ARE GENERALLY IN GOOD
CONDITION, FREE OF CRACKS, FISSURES, OR UPLIFT.
SHADING SIDEWALKS ALONG NASON STREET GENERALLY PROVIDE ABUNDANT STREETS AND
LANDSCAPING. ADDITIONALLY, TREES ALONG PEDESTRIAN WALKWAYS PROVIDE
SUBSTANTIAL SHADE FOR PEDESTRIANS.
GRADE SIDEWALKS ALONG THE STUDY CORRIDOR ARE GENERALLY FLAT WITH LIMITED GRADE.
AMENITIES OFFERED PEDESTRIAN AMENITIES OFFERED ALONG THE CORRIDOR’S SIDEWALKS GENERALLY
CONSIST OF ATTRACTIVE LANDSCAPING AND BUFFERS. MEDIAN LANDSCAPING EXISTS
SOUTH OF CACTUS AVENUE
BUFFERS BUFFERED SPACE IS COMMON ALONG THE CORRIDOR’S SIDEWALKS IN THE FORM OF
LANDSCAPING AND BICYCLE LANES SOUTH OF CACTUS AVENUE. HOWEVER, SOME
SEGMENTS LACK BUFFERED SPACE AND COULD ALSO BENEFIT FROM WIDER SIDEWALKS.
Bicycle Facilities The City of Moreno Valley has made a concerted effort to expand the availability of bikeways for residents and visitors, recognizing benefits to public health, the environment, and the economy. The City’s Bicycle Master Plan Update provides for substantial increases in bicycle infrastructure coverage in the City and enhances the City’s ability to compete for state and federal grants. The plan includes expanding bicycle facilities along the City’s major roadways. The City is focused on becoming more bicycle-friendly and making bicycling a viable option that will attract more people to visit and live in Moreno
Class II Bicycle Lane south of Cactus Avenue.

The Nason Street Corridor Plan Existing Conditions Report | 4-7
Valley. The most recent update to the Bicycle Master Plan was unanimously approved by the City Council on January 6th, 2015.
Several bicycle facilities exist in the Corridor. These facilities consist of Class 1 separated paths, Class 2 striped lanes, and Class 3 shared roadways. Class 1 separated paths, which provide a dedicated bicycle right of way removed from the roadway, exist along Nason Street between Dracaea Avenue and Cottonwood Avenue and between Brodiaea Avenue and Cactus Avenue. These bicycle paths run parallel to Nason Street buffered by landscaping and sidewalks. Class 2 striped lanes, which provide a dedicated lane of one-way travel within the paved section of the street, exist on both sides of Nason Street between Cactus Avenue and Iris Avenue. Additionally, these lanes provide striped buffers from automobile traffic. Class 3 shared roadways providing a right-of-way with shared use with other motorists are provided north of Eucalyptus Avenue. Furthermore, a number of roadways bisecting Nason Street in the study area, such as Eucalyptus Avenue, Cottonwood Avenue, and Cactus Avenue, provide Class 2 and Class 3 facilities. Still, many of the roadways connecting to Nason Street lack bicycle infrastructure altogether. These include Fir Ave, Dracea Ave, Cottonwood Ave (east of Nason Street), Bay Ave, Alessandro Blvd, Brodiaea Ave, and Cactus Ave (east of Nason Street). Maps of the Corridor’s existing and proposed bicycle facilities are provided on Figures 4.3 and 4.4.
Class I Bicycle Path along Nason Street.

The Nason Street Corridor Plan Existing Conditions Report | 4-8
Figure 4.3 – Existing Bicycle Infrastructure

The Nason Street Corridor Plan Existing Conditions Report | 4-9
Figure 4.4 – Future Bicycle Infrastructure

The Nason Street Corridor Plan Existing Conditions Report | 4-10
Mode Split Mode choice refers to the mode of travel which is used for any particular trip. The US Census Department through the American Community Survey regularly reports mode split for travel to work. Figure 4.5 summarizes the Pedestrian mode split for travel to work and Figure 4.6 summarizes the Bicycle mode split.
FIGURE 4.5 PEDESTRIAN MODE SPLIT FOR TRAVEL TO WORK
As shown on Figure 4.5, the pedestrian mode split for work trips in the City of Moreno Valley (1.3%) is lower than both the national (2.8%) and county (1.6%) averages.
FIGURE 4.6 BICYCLE MODE SPLIT FOR TRAVEL TO WORK
As shown Figure 4.6, the bicycle mode split for work trips in the City of Moreno Valley (0.2%) is also lower than both the national (0.6%) and county (0.4%) averages.
2.8%
1.6%1.3%
Percentage of Work Trips Made by Walking
United States Riverside County Moreno Valley
0.6%
0.4%
0.2%
Percentage of Work Trips Made by Bicycle
United States Riverside County Moreno Valley

The Nason Street Corridor Plan Existing Conditions Report | 4-11
Mode split is heavily influenced by household vehicle ownership. Households with higher vehicle ownership are generally less likely to travel via transit, cycling, or walking
FIGURE 4.7 HOUSEHOLD VEHICLE OWNERSHIP
As shown on Figure 4.7, household vehicle ownership in Moreno Valley is generally greater than both the national and county averages.
9%
34%38%
14%
6%5%
30%
39%
17%
9%5%
26%
38%
20%
11%
No vehicleavailable
1 vehicleavailable
2 vehiclesavailable
3 vehiclesavailable
4 or morevehiclesavailable
United States Riverside County Moreno Valley

The Nason Street Corridor Plan Existing Conditions Report | 4-12
Existing Bus Routes and Ridership Bus Routes Bus service along the Nason Street Corridor Plan Study Area is operated and maintained by the Riverside Transit Agency (RTA). RTA is the Consolidated Transportation Service Agency for western Riverside County and provides both local and regional services throughout the approximate 2,500 square mile service area with 36 fixed-routes, 8 CommuterLink routes, and Dial-A-Ride services using 266 vehicles. RTA operates 3 local fixed routes and one CommuterLink express route in the Nason Street Corridor Plan Study Area and are described below and displayed on Figure 4.9. Figure 4.8 summarizes the travel to work bus mode split in the City of Moreno Valley.
RTA Route 20: RTA Route 20 is a local fixed route operating primarily in the east-west direction serving the Cities of Riverside and Moreno Valley via Alessandro Boulevard. This route includes stops at Magnolia Center, Riverside County Regional Medical Center, Kaiser Permanente, and Moreno Valley College. The route operates on weekdays and weekends, and on approximately 60 minute headways during the peak periods.
RTA Route 35: RTA Route 35 is a local fixed route operating primarily in the east-west direction serving the Cities of Moreno Valley, Beaumont, and Banning via SR-60, Eucalyptus Avenue, and Nason Street. This route includes stops at Moreno Valley Mall, Moreno Valley Senior Center, Riverside County Regional Medical Center, Super
The Nason Street Corridor Plan Existing Conditions Report | 4-13
Walmart at Moreno Beach, and Sun Lakes at Village. The route operates on weekdays only, and on approximately 60 minute headways during the peak periods.
RTA Route 41: RTA Route 41 is a local fixed route operating in the north-south and east-west direction serving the Cities of Mead Valley and Moreno Valley. Traveling between Mead Valley and Moreno Valley via Cajalco Road, Evans Road, Lasselle Road, Cactus Avenue and Nason Street, this route includes stops at Mead Valley Community Center, Moreno Valley College, and Riverside County Regional Medical Center. The route operates on weekdays and weekends, and on approximately 60 minute headways during the peak periods.
RTA Route 210/Sunline Route 220: RTA Route 210 is a CommuterLink Express route operating primarily in the east-west direction serving the Cities of Riverside, Moreno Valley, Beaumont, Cabazon, Rancho Mirage, and Palm Desert. Traveling between Riverside and Palm Desert primarily via SR-60, Eucalyptus Avenue, I-10, and Monterey Avenue, RTA Route 210 becomes SunLine Route 220 east of the City of Banning and includes stops at Downtown Riverside, Downtown Riverside Metrolink Station, UC Riverside, Moreno Valley Mall, Beaumont Super Walmart, Morongo Casino, and Westfield Palm Desert. This route operates on weekdays only, westbound during the AM peak period and eastbound during the PM peak period. SunLink Route 220 operates two buses during the AM and PM peak periods and RTA Route 210 operates four buses during the AM peak period and one bus during the PM peak period.

The Nason Street Corridor Plan Existing Conditions Report | 4-14
FIGURE 4.8 BUS MODE SPLIT FOR TRAVEL TO WORK
As shown on Figure 4.8, the bus mode split for work trips in the City of Moreno Valley (1.3%) is lower than the national average (2.6%) but higher than the Riverside County (1.0%) average.
2.6%
1.0%
1.3%
Percentage of Work Trips Made by Bus
United States Riverside County Moreno Valley

The Nason Street Corridor Plan Existing Conditions Report | 4-15
Figure 4.9a – Existing Transit Routes and Ridership
The Nason Street Corridor Plan Existing Conditions Report | 4-16
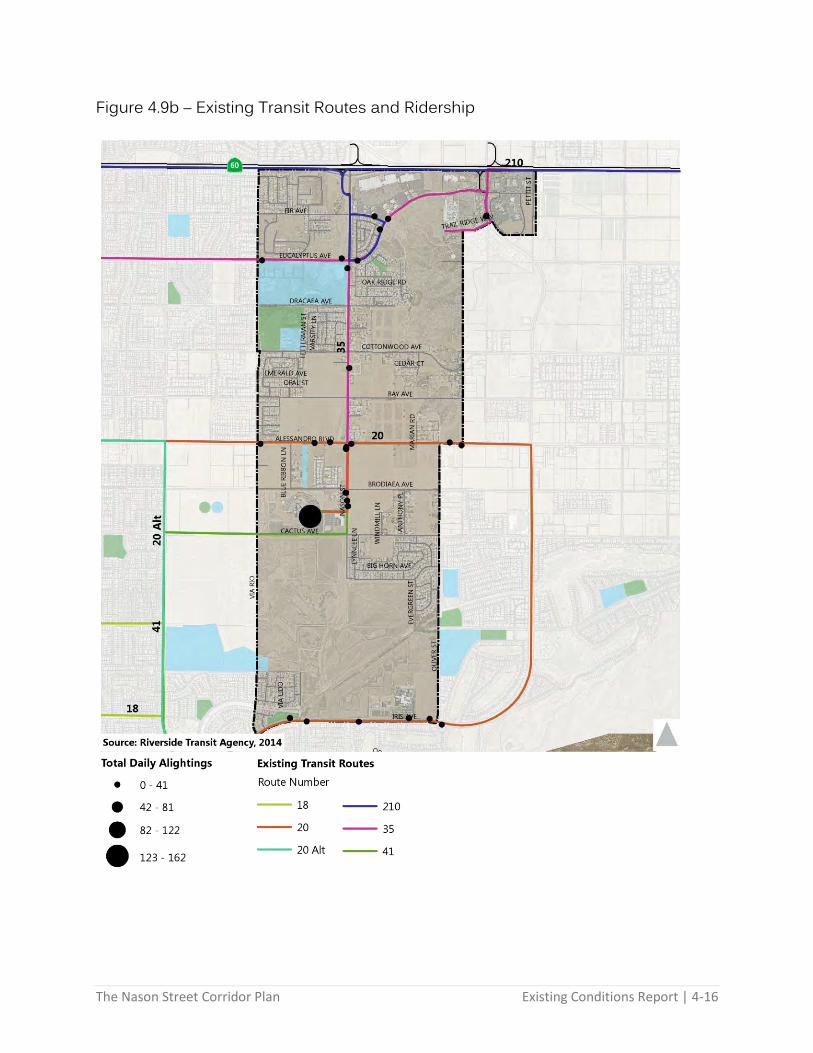
Figure 4.9b – Existing Transit Routes and Ridership

The Nason Street Corridor Plan Existing Conditions Report | 4-17
Transit Demand Potential The Riverside Transit Agency is in the final stages of completing a Comprehensive Operational Assessment (COA) of transit market demand and service operation performance in the RTA service area. The RTA COA provides a transit demand potential index that incorporates quantitative density and demographic data at the census tract level to identify transit supportive markets. Figure 4.10 provides the transit demand potential calculated in the RTA COA for the Moreno Valley area.
TABLE 4.2 CENSUS TRACT FACTORS FOR TRANSIT DEMAND POTENTIAL
MARKET FACTOR DESCRIPTION TOTAL POPULATION THE TOTAL POPULATION OF A CENSUS TRACT PROVIDES A CUSTOMER
BASE FOR POTENTIAL TRANSIT RIDERS. TOTAL
EMPLOYMENT THE TOTAL EMPLOYMENT OF A CENSUS TRACT PROVIDES A CUSTOMER
BASE FOR POTENTIAL TRANSIT RIDERS. MINORITY
POPULATION DEFINED AS NON-WHITE ETHNICITIES PLUS INDIVIDUALS WHO
RACIALLY IDENTIFY AS HISPANIC. THIS IS A KEY MOBILITY MARKET
TYPICALLY UNDERSERVED BY THE EXISTING TRANSPORTATION
SYSTEM. HOUSEHOLDS “IN
POVERTY” CENSUS DEFINITION OF INDIVIDUALS LIVING BELOW THE POVERTY
LINE. THIS IS A KEY MOBILITY MARKET TYPICALLY UNDERSERVED BY THE
EXISTING TRANSPORTATION SYSTEM. ZERO VEHICLE
HOUSEHOLDS ZERO HOUSEHOLD VEHICLES AVAILABLE. HOUSEHOLDS WITHOUT
VEHICLES AVAILABLE FOR USE ARE MORE LIKELY TO USE TRANSIT.

The Nason Street Corridor Plan Existing Conditions Report | 4-18
FIGURE 4.10 TRANSIT DEMAND POTENTIAL FOR CITY OF MORENO VALLEY AREA
Source: Riverside Transit Agency Comprehensive Operational Assessment – Market Assessment Final, April 2014
The Nason Street Corridor Plan Existing Conditions Report | 4-19
High population density increases the market for transit in Moreno Valley, however outside of the core areas of the City (including the Corridor (shown in green)), the existing transit potential is low.
It should be noted that the infrastructure along the corridor does provide opportunities for improved transit potential. The street network is a grid system, providing good connectivity along the corridor (although transit accessibility would be improved with shorter block lengths).
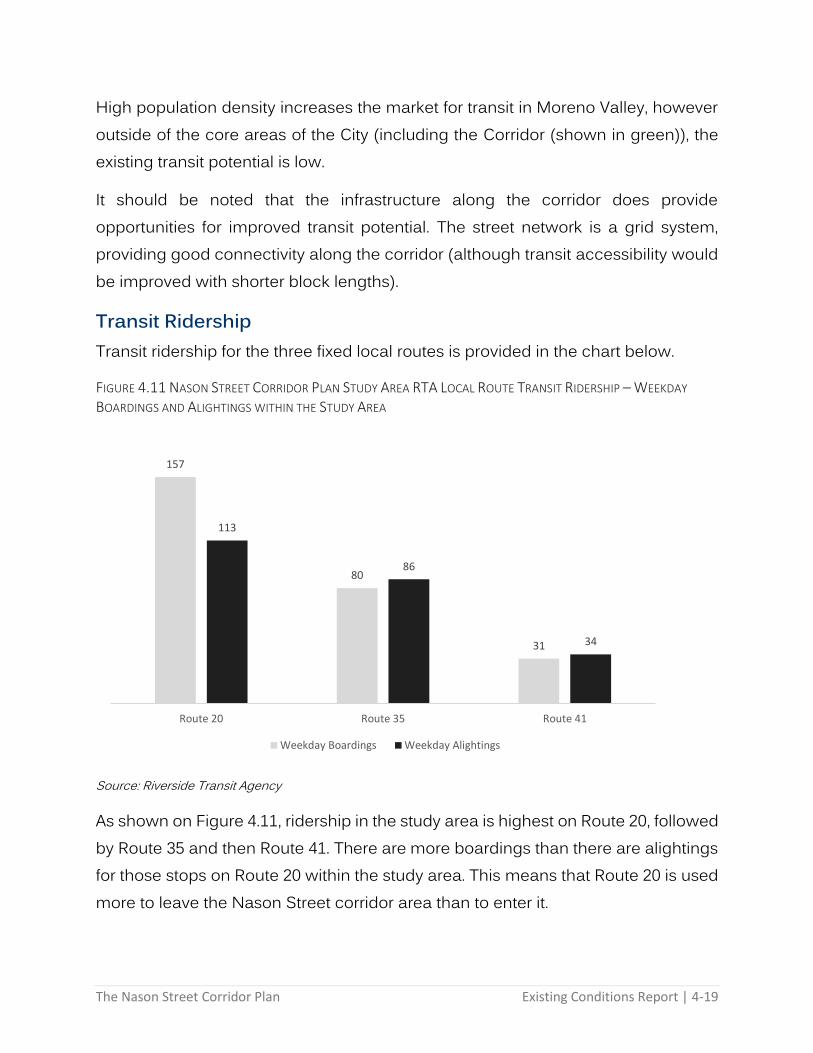
Transit Ridership Transit ridership for the three fixed local routes is provided in the chart below.
FIGURE 4.11 NASON STREET CORRIDOR PLAN STUDY AREA RTA LOCAL ROUTE TRANSIT RIDERSHIP – WEEKDAY
BOARDINGS AND ALIGHTINGS WITHIN THE STUDY AREA
Source: Riverside Transit Agency
As shown on Figure 4.11, ridership in the study area is highest on Route 20, followed by Route 35 and then Route 41. There are more boardings than there are alightings for those stops on Route 20 within the study area. This means that Route 20 is used more to leave the Nason Street corridor area than to enter it.
157
80
31
113
86
34
Route 20 Route 35 Route 41
Weekday Boardings Weekday Alightings
The Nason Street Corridor Plan Existing Conditions Report | 4-20
Figure 4.9 previously presented also provides a perspective on how transit boardings for all routes are distributed spatially. The figure shows a large number of boardings and alightings occur at the Riverside County Regional Medical Center.
Collisions A traffic collision is considered to be any event where a vehicle strikes any object while moving. That object could be another car, a pedestrian/bicyclist, or something fixed in place like a light post. When collisions cause damage or injury, the details are recorded by the local law enforcement agency and loaded into the California Highway Patrol (CHP) Statewide Integrated Traffic Records System (SWITRS). The latest data from the Moreno Valley Police Department was used to analyze collision data along Nason Street.
On Nason Street from 2009 to 2013, there were a total of 98 vehicle collisions, with no collisions resulting in a fatality and 43 collisions resulting in injuries. The top three cited factors contributing to collisions were: unsafe speed (23 percent), traffic signals and signs (15 percent), and improper turning (14 percent). Driving under the influence of alcohol or drug was a factor in 11 percent of the total collisions.
The number of vehicle collisions was generally declining between 2009 and 2012, but did increase in 2013. During the five year span, the number of collisions per year in the corridor ranged from 13 to 25.
During the same time period, there were no collisions involving a pedestrian and one collision involving a bicyclist in 2013. A spatial distribution of vehicular collisions on Nason Street is illustrated on Figure 4.12.

The Nason Street Corridor Plan Existing Conditions Report | 4-21
Figure 4.12 – Vehicular Collisions (2009 – 2013)

The Nason Street Corridor Plan Existing Conditions Report | 4-22
Existing Roadway Network Roadway System The roadway system in the Corridor is a developing grid-type network with major traveled ways arranged in square blocks that are spaced at approximately half a mile.
Functional Classifications The existing City of Moreno Valley General Plan Circulation Element designates five different roadway types in the City. Functional classification refers to how a road accommodates two characteristics: First, the extent to which the roadway prioritizes the through movement of traffic and second, the level of access provided to adjacent properties. Based on these generalized characteristics, roadways often vary in terms of right-of-way, roadway width, number of lanes, intersection and traffic signal spacing, speed, and other factors. Functional classification is generally determined in the Circulation Element of the City’s General Plan, in which the functional classification is assigned to a particular roadway based on the criteria above. The table below identifies these roadway types for the City of Moreno Valley and provides the general geometric cross sectional characteristics of each.
TABLE 4.3 CITY OF MORENO VALLEY GENERAL PLAN ROADWAY FUNCTIONAL CLASSIFICATIONS
ROADWAY TYPE DESCRIPTION OF TYPICAL STREET CROSS SECTION CHARACTERISTICS
DIVIDED MAJOR ARTERIAL A DIVIDED MAJOR ARTERIAL TYPICALLY FEATURES 120’ TO 134’ OF RIGHT-OF-WAY, SIX
LANES (THREE IN EACH DIRECTION), BICYCLE LANES, SIDEWALKS, AND A RAISED MEDIAN.
DIVIDED ARTERIAL A DIVIDED ARTERIAL TYPICALLY FEATURES 110’ OF RIGHT-OF-WAY, FOUR TO SIX LANES
(TWO TO THREE IN EACH DIRECTION), BICYCLE LANES, SIDEWALKS, AND A RAISED MEDIAN.
ARTERIAL AN ARTERIAL TYPICALLY FEATURES 100’ OF RIGHT-OF-WAY, FOUR LANES (TWO IN EACH
DIRECTION), BICYCLE LANES, SIDEWALKS, AND A STRIPED MEDIAN.
MINOR ARTERIAL A MINOR ARTERIAL TYPICALLY FEATURES 88’ OF RIGHT-OF-WAY, FOUR LANES (TWO IN
EACH DIRECTION), POSSIBLY A BICYCLE LANE, SIDEWALKS, AND A STRIPED MEDIAN.
COLLECTOR A COLLECTOR TYPICALLY FEATURES 78’ OF RIGHT-OF-WAY, TWO LANES (ONE IN EACH
DIRECTION), POSSIBLY A BICYCLE LANE, SIDEWALKS, AND A STRIPED MEDIAN.

The Nason Street Corridor Plan Existing Conditions Report | 4-23
Roadways in the Nason Street Corridor Plan Study Area consist of divided arterials, arterials, minor arterials, and unclassified local residential streets. Additionally, California State Route 60 to the north of the study area provides important regional access. Key roadways are described in detail below.
Nason Street – The City of Moreno Valley General Plan classifies Nason Street as a divided major arterial between Delphinium Avenue and Alessandro Boulevard, divided arterial between Dracaea Avenue and State Route 60, and arterial between Iris Avenue and Delphinium Avenue and between Alessandro Boulevard and Dracaea Avenue). Within the study area, Nason Street provides one to two travel lanes in each direction. The speed limit is 45 MPH.
State Route 60 – State Route 60 (SR-60) runs east-west to the north of the study area and provides two general travel lanes in each direction plus one high occupancy vehicle (HOV) lane in each direction. SR-60 ramps in the study area are provided on Nason Street and Moreno Beach Drive.
Morrison Street – Morrison Street runs north-south to the west of the study area and is classified as a minor arterial in the City of Moreno Valley General Plan. Within the study area, there are one to two travel lanes in each direction. The speed limit is 40 MPH.
Oliver Street – Oliver Street runs north-south to the east of the study area and is classified as a minor arterial in the General Plan. Within the study area, there are one to two travel lanes in each direction. The speed limit is 35 MPH.
Eucalyptus Avenue – Eucalyptus runs east-west through the study area and is designated as an arterial according to the General Plan. Within the study area, there are two travel lanes in each direction. The speed limit is 40 MPH.
Cottonwood Avenue – Cottonwood Avenue runs east-west through the study area and is designated as a minor arterial according to the General Plan. Within the study area, there are one to two travel lanes in each direction. The speed limit varies between 40 and 45 MPH.
The Nason Street Corridor Plan Existing Conditions Report | 4-24
Alessandro Boulevard – Alessandro Boulevard runs east-west through the study area. Within the study area, the General Plan classifies Alessandro Boulevard as a divided major arterial west of Nason Street and as a divided arterial east of Nason Street. Within the study area, there are one to two travel lanes in each direction. The speed limit varies between 25 MPH and 50 MPH.
Cactus Avenue – Cactus Avenue runs east-west through the study area. The General Plan classifies Cactus Avenue as a minor arterial within the study area, with 1 travel lane in each direction. The speed limit is 50 MPH.
John F. Kennedy Drive – John F. Kennedy Drive runs east-west to the east of the study area. The City of Moreno Valley General Plan classifies John F. Kennedy Street as an arterial within the study area. There are one to two travel lanes in each direction.
Iris Avenue – Iris Avenue runs east west to the south of the study area and is classified as a divided major arterial by the General Plan. Within the study area, there are three travel lanes in each direction. The speed limit is 50 MPH.
The Nason Street Corridor Plan Existing Conditions Report | 4-25
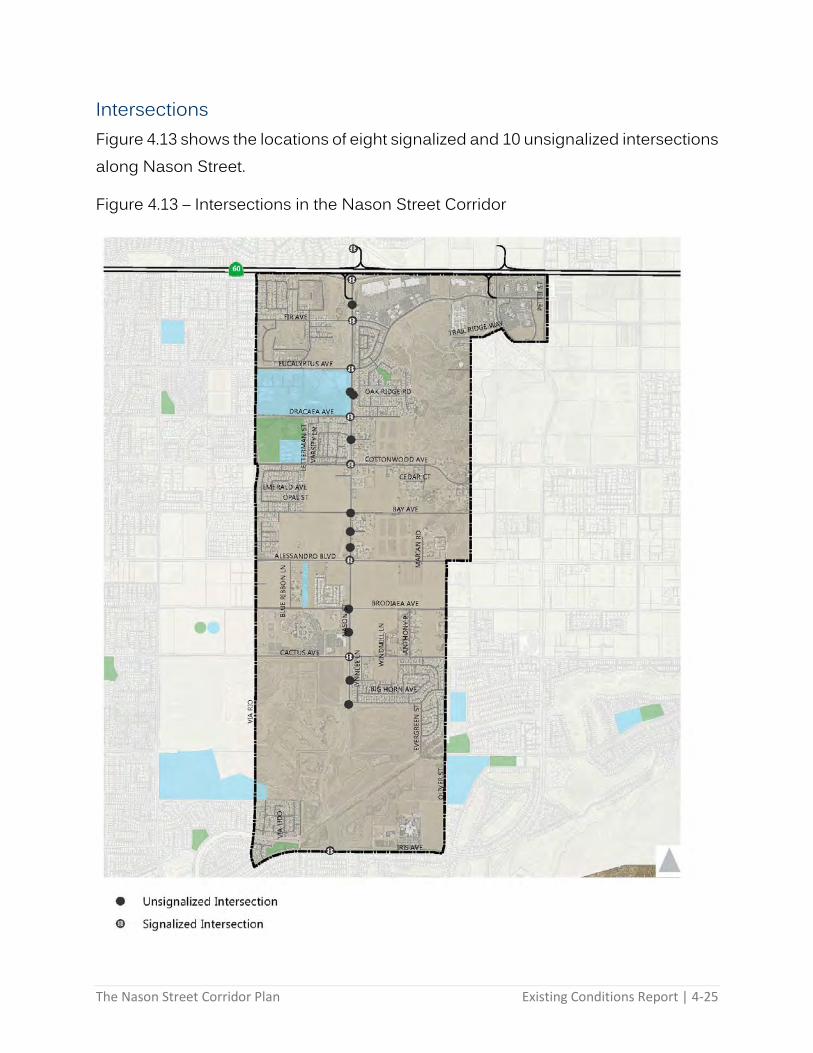
Intersections Figure 4.13 shows the locations of eight signalized and 10 unsignalized intersections along Nason Street.
Figure 4.13 – Intersections in the Nason Street Corridor

The Nason Street Corridor Plan Existing Conditions Report | 4-26
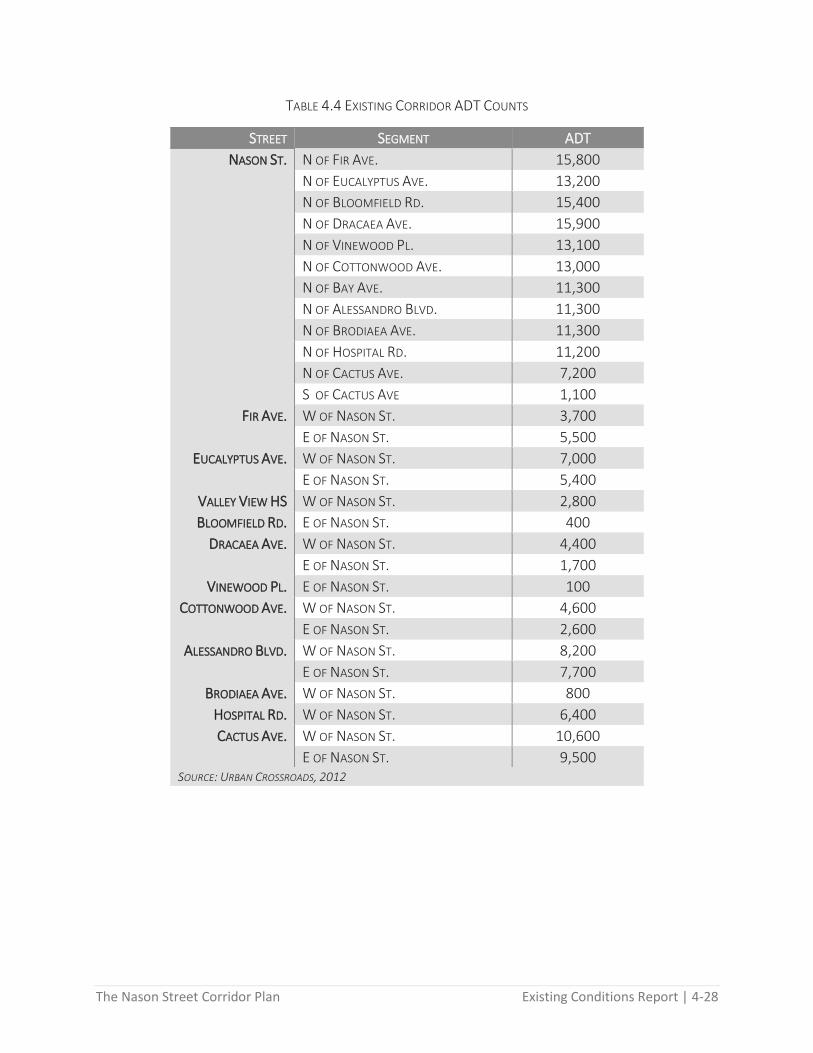
Existing Volumes Average Daily Traffic (ADT) volumes for roadway segments in the study area are summarized below. Additionally, AM and PM peak hour intersection turning movement counts are provided on Figures 4.14 and 4.15. It should be noted that these volumes were collected in 2012 for the Nason Street Improvement Project before the completion of Nason Street north of Iris Avenue.
FIGURE 4.14: EXISTING AM TRAFFIC VOLUMES

The Nason Street Corridor Plan Existing Conditions Report | 4-27
FIGURE 4.15: EXISTING PM TRAFFIC VOLUMES
The Nason Street Corridor Plan Existing Conditions Report | 4-28
TABLE 4.4 EXISTING CORRIDOR ADT COUNTS
STREET SEGMENT ADT
NASON ST. N OF FIR AVE. 15,800
N OF EUCALYPTUS AVE. 13,200
N OF BLOOMFIELD RD. 15,400
N OF DRACAEA AVE. 15,900
N OF VINEWOOD PL. 13,100
N OF COTTONWOOD AVE. 13,000
N OF BAY AVE. 11,300
N OF ALESSANDRO BLVD. 11,300
N OF BRODIAEA AVE. 11,300
N OF HOSPITAL RD. 11,200
N OF CACTUS AVE. 7,200
S OF CACTUS AVE 1,100
FIR AVE. W OF NASON ST. 3,700
E OF NASON ST. 5,500
EUCALYPTUS AVE. W OF NASON ST. 7,000
E OF NASON ST. 5,400
VALLEY VIEW HS W OF NASON ST. 2,800
BLOOMFIELD RD. E OF NASON ST. 400
DRACAEA AVE. W OF NASON ST. 4,400
E OF NASON ST. 1,700
VINEWOOD PL. E OF NASON ST. 100
COTTONWOOD AVE. W OF NASON ST. 4,600
E OF NASON ST. 2,600
ALESSANDRO BLVD. W OF NASON ST. 8,200
E OF NASON ST. 7,700
BRODIAEA AVE. W OF NASON ST. 800
HOSPITAL RD. W OF NASON ST. 6,400
CACTUS AVE. W OF NASON ST. 10,600
E OF NASON ST. 9,500 SOURCE: URBAN CROSSROADS, 2012

The Nason Street Corridor Plan Existing Conditions Report | 4-29
Existing Transportation System Performance Existing Intersection Level of Service Existing level of service (LOS) for intersections along Nason Street are provided in Table 4.6. As with roadway segment volumes, it should be noted that this analysis was conducted 2012 for the Nason Street Improvement Project before the completion of Nason Street north of Iris Avenue. Additionally, level of service at Fir Avenue was heavily affected by reduced intersection geometrics due to construction occurring to the north at the SR-60 ramps.
Intersections were analyzed using the Highway Capacity Manual (HCM 2000) methodology. The HCM 2000 methodology for signalized and all-way stop-controlled intersections estimates the average control delay for the vehicle at the intersection. For side-street stop-controlled intersections, the methodology estimates the highest delay for any approach. After the quantitative delay estimates are complete, the methodology assigns a qualitative letter grade that represents the operations of the intersection. These grades range from LOS A (minimal delay) to LOS F (excessive congestion). LOS E represents at-capacity operations. Descriptions of the LOS letter grades for signalized and unsignalized intersections are provided in Table 4.5.

The Nason Street Corridor Plan Existing Conditions Report | 4-30
TABLE 4.5 LEVEL OF SERVICE DEFINITIONS FOR INTERSECTIONS
(2000 HIGHWAY CAPACITY MANUAL METHODOLOGY)
LEVEL OF
SERVICE AVERAGE DELAY PER
VEHICLE1 (SIGNALIZED) AVERAGE DELAY PER
VEHICLE1 (UNSIGNALIZED) PM LOS
A <10.0 <10.0 NO VEHICLE WAITS LONGER THAN ONE RED
LIGHT AND NO APPROACH PHASE IS FULLY
USED.
B >10.0 AND <20.0 >10.0 AND <15.0 AN OCCASIONAL APPROACH PHASE IS FULLY
UTILIZED; MANY DRIVERS BEGIN TO FEEL
SOMEWHAT RESTRICTED WITHIN GROUPS OF
VEHICLES.
C >20.0 AND <35.0 >15.0 AND <25.0 OCCASIONALLY DRIVERS MAY HAVE TO WAIT
THROUGH MORE THAN ONE RED LIGHT; BACKUPS MAY DEVELOP BEHIND TURNING
VEHICLES.
D >35.0 AND <55.0 >25.0 AND <35.0 DELAYS MAY BE SUBSTANTIAL DURING
PORTIONS OF THE RUSH HOURS, BUT ENOUGH
LOWER VOLUME PERIODS OCCUR TO PERMIT
CLEARING OF DEVELOPING LINES, PREVENTING
EXCESSIVE BACKUPS.
E >55.0 AND <80.0 >35.0 AND <50.0 REPRESENTS THE MOST VEHICLES
INTERSECTION APPROACHES CAN
ACCOMMODATE; MAY BE LONG LINES OF
WAITING VEHICLES THROUGH SEVERAL SIGNAL
CYCLES.
F >80.0 >50.0 BACKUPS FROM NEARBY LOCATIONS OR ON
CROSS STREETS MAY RESTRICT OR PREVENT
MOVEMENT OF VEHICLES OUT OF THE
INTERSECTION APPROACHES. TREMENDOUS
DELAYS WITH CONTINUOUSLY INCREASING
QUEUE LENGTHS. 1. DELAY IS MEASURED IN SECONDS. SOURCE: HIGHWAY CAPACITY MANUAL, TRANSPORTATION RESEARCH BOARD, 2000
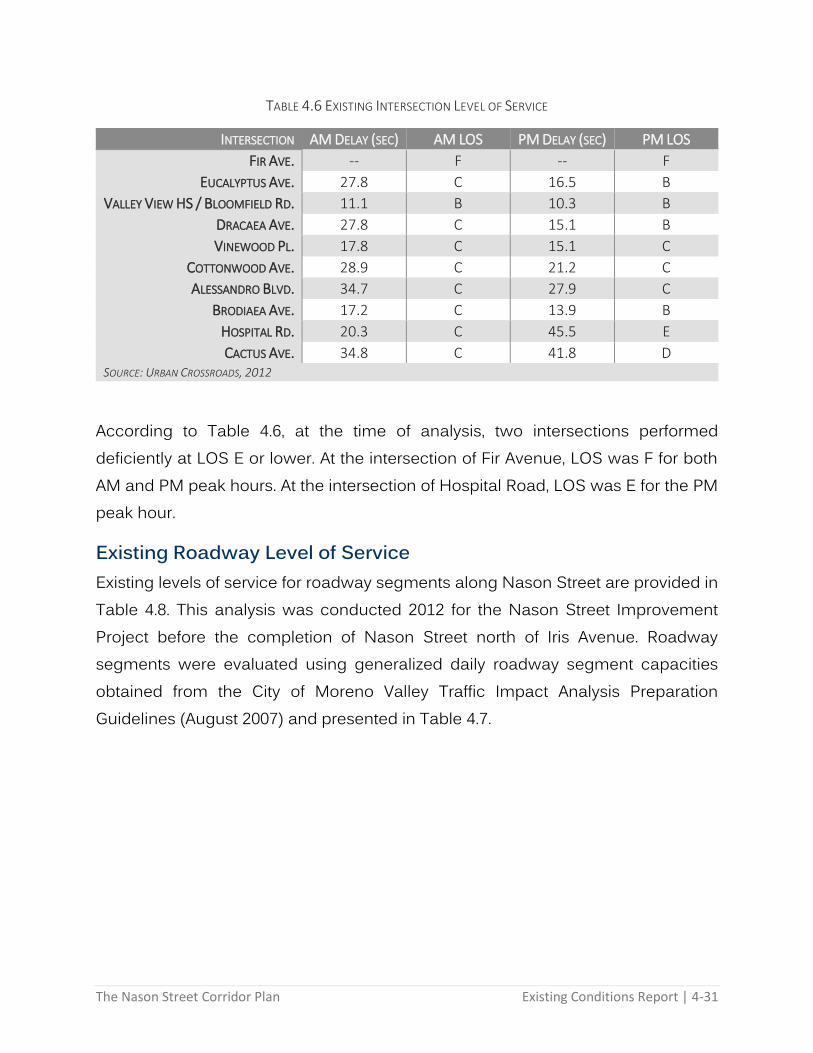
The Nason Street Corridor Plan Existing Conditions Report | 4-31
TABLE 4.6 EXISTING INTERSECTION LEVEL OF SERVICE
INTERSECTION AM DELAY (SEC) AM LOS PM DELAY (SEC) PM LOS
FIR AVE. -- F -- F
EUCALYPTUS AVE. 27.8 C 16.5 B
VALLEY VIEW HS / BLOOMFIELD RD. 11.1 B 10.3 B
DRACAEA AVE. 27.8 C 15.1 B
VINEWOOD PL. 17.8 C 15.1 C
COTTONWOOD AVE. 28.9 C 21.2 C
ALESSANDRO BLVD. 34.7 C 27.9 C
BRODIAEA AVE. 17.2 C 13.9 B
HOSPITAL RD. 20.3 C 45.5 E
CACTUS AVE. 34.8 C 41.8 D SOURCE: URBAN CROSSROADS, 2012
According to Table 4.6, at the time of analysis, two intersections performed deficiently at LOS E or lower. At the intersection of Fir Avenue, LOS was F for both AM and PM peak hours. At the intersection of Hospital Road, LOS was E for the PM peak hour.
Existing Roadway Level of Service Existing levels of service for roadway segments along Nason Street are provided in Table 4.8. This analysis was conducted 2012 for the Nason Street Improvement Project before the completion of Nason Street north of Iris Avenue. Roadway segments were evaluated using generalized daily roadway segment capacities obtained from the City of Moreno Valley Traffic Impact Analysis Preparation Guidelines (August 2007) and presented in Table 4.7.

The Nason Street Corridor Plan Existing Conditions Report | 4-32
TABLE 4.7 MORENO VALLEY DAILY ROADWAY CAPACITIES
TYPE OF ROADWAY
A
B
LOS C
D
E
SIX LANE DIVIDED ARTERIAL 33,900 39,400 45,000 50,600 56,300
FOUR LANE DIVIDED ARTERIAL 22,500 26,300 30,000 33,800 37,500
FOUR LANE UNDIVIDED ARTERIAL 15,000 17,500 20,000 22,500 25,000
TWO LANE INDUSTRIAL COLLECTOR 7,500 8,800 10,000 11,300 12,500
TWO LANE UNDIVIDED RESIDENTIAL NA NA NA NA 2,000 SOURCE: TRAFFIC IMPACT ANALYSIS PREPARATION GUIDELINES, CITY OF MORENO VALLEY, 2007
TABLE 4.8 EXISTING ROADWAY LEVEL OF SERVICE
SEGMENT V/C RATIO LOS
NORTH OF FIR AVE. 1.26 F
BETWEEN FIR AVE. AND EUCALYPTUS AVE. 0.53 A
BETWEEN EUCALYPTUS AVE. AND BLOOMFIELD RD. 0.41 A
BETWEEN BLOOMFIELD RD. AND DRACAEA AVE. 0.42 A
BETWEEN DRACAEA AVE. AND VINEWOOD PL. 0.52 A
BETWEEN VINEWOOD PL. AND COTTONWOOD AVE. 0.69 B
BETWEEN COTTONWOOD AVE. AND BAY AVE. 0.90 E
BETWEEN BAY AVE. AND ALESSANDRO BLVD. 0.90 E
BETWEEN ALESSANDRO BLVD. AND BRODIAEA AVE. 0.45 A
BETWEEN BRODIAEA AVE. AND HOSPITAL RD. 0.45 A
BETWEEN HOSPITAL RD. AND CACTUS AVENUE 0.29 A
SOUTH OF CACTUS AVENUE 0.04 A SOURCE: URBAN CROSSROADS, 2012
According to Table 4.8, at the time of analysis, two segments along Nason Street performed deficiently. Nason Street immediately north of Fir Avenue performed at LOS F. Nason Street between Cottonwood Avenue and Bay Avenue and between Bay Avenue and Alessandro Boulevard both performed at LOS E.
Roadway Congestion Another approach to analyzing roadway performance is to directly measure congestion as it occurs. One commonly used source is the INRIX database, which in turn uses crowd-sourced data from intersection detectors, GPS units in commercial vehicles, and other sensors to present real time and historical data.
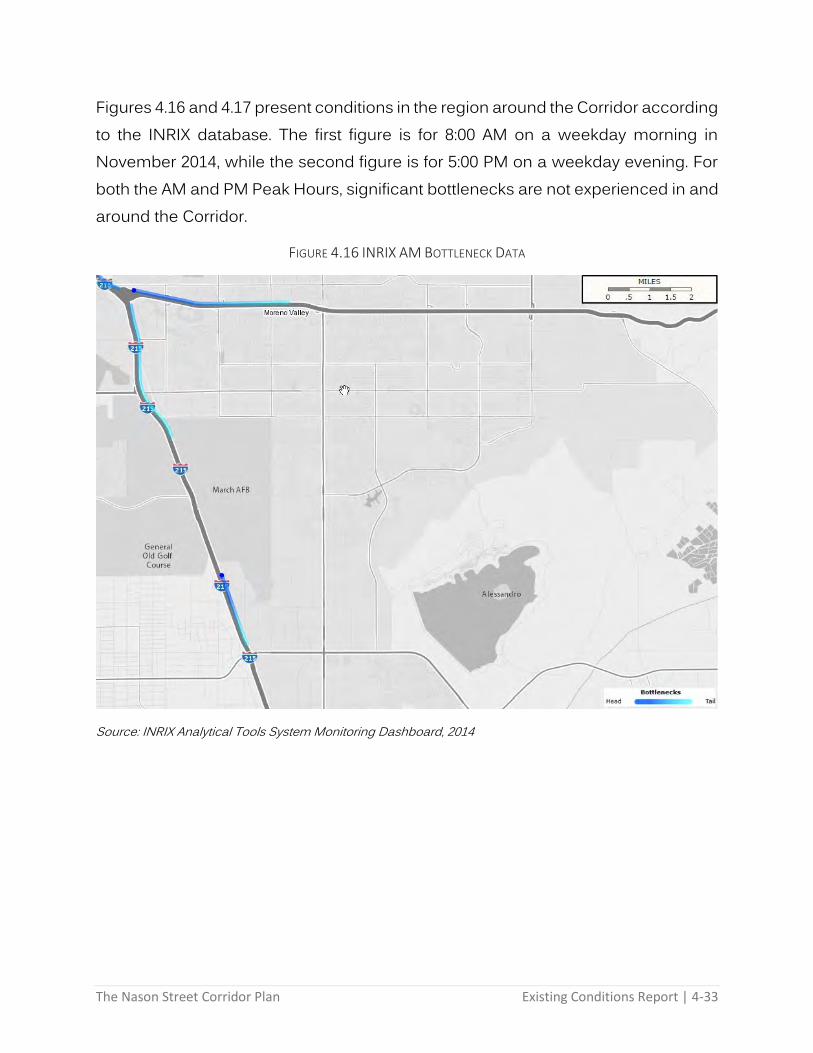
The Nason Street Corridor Plan Existing Conditions Report | 4-33
Figures 4.16 and 4.17 present conditions in the region around the Corridor according to the INRIX database. The first figure is for 8:00 AM on a weekday morning in November 2014, while the second figure is for 5:00 PM on a weekday evening. For both the AM and PM Peak Hours, significant bottlenecks are not experienced in and around the Corridor.
FIGURE 4.16 INRIX AM BOTTLENECK DATA
Source: INRIX Analytical Tools System Monitoring Dashboard, 2014

The Nason Street Corridor Plan Existing Conditions Report | 4-34
FIGURE 4.17 INRIX PM BOTTLENECK DATA
Source: INRIX Analytical Tools System Monitoring Dashboard, 2014
Future BRT Service In recent years an increasing number of Southern California transportation agencies have begun studying and developing Bus Rapid Transit (BRT) service. BRT provides high quality, high speed transit service in urban areas in a cost-effective manner. BRT features can include higher bus operating speeds than traditional bus service, high-quality stations with shelters and other amenities, transit priority measures along corridors to further increase speeds, and, in some cases, dedicated right-of-way for vehicle operations.
In 2010, on behalf of the Western Riverside Council of Governments (WRCOG), the Southern California Association of Governments (SCAG) completed a study analyzing long-term options for BRT service in Western Riverside County. The study

The Nason Street Corridor Plan Existing Conditions Report | 4-35
identified recommended corridors for future BRT service based on factors such as employment, density, and activity centers. Two of the potential routes examined in the study serve the boundaries of the Nason Street Corridor Study Area.
Alessandro Boulevard – Identified as the best option for BRT service in the study, this route would primarily run along Alessandro Boulevard between downtown Riverside and the Riverside County Medical Center for 13.5 miles. A key end-of-line BRT station would be provided at the medical center, located on Cactus Avenue adjacent to Nason Street. Recommended improvements for this corridor include gradual upgrades such as branded shelters, traffic signal priority, queue jumps, higher frequency, and BRT vehicles.
SR-60 West Segment – This route would primarily run along State Route 60 between downtown Riverside and Moreno Valley for 24.9 miles. Key stations near the Nason Street study area include Moreno Valley Mall, Perris Boulevard, and Redlands Boulevard. The study recommended express bus service along existing and future HOB lanes with a focus on commuter travel and lower frequency in the off peak periods.
Future Bus Route Expansions The Riverside Transit Agency is in the process of creating and approving its 10-Year Transit Network Plan. Based on research conducted for its Comprehensive Operational Analysis (COA), the plan will guide RTA service over the next ten years. Expected to be approved Fall 2014, changes will be implemented gradually over ten years with some changes taking effect as early as January 2015. The following changes are proposed for RTA routes in the Corridor Study Area. Figure 4.18 illustrates proposed route alignments in the study area.
RTA Route 20: Within the study area, routing changes will take place between Alessandro Boulevard and Cactus Avenue. RTA has also proposed changes in frequency.

The Nason Street Corridor Plan Existing Conditions Report | 4-36
RTA Route 35: The proposed changes include a shortened route that terminates at Riverside County Regional Medical Center instead of continuing west to Moreno Valley Mall. RTA has also proposed changes in frequency.
RTA Route 41: There are no proposed changes to routing. However, the Transit Network Plan proposes ceasing Route 41 service on weekends due to low ridership.
RTA Route 210: No changes have been proposed for this route.

The Nason Street Corridor Plan Existing Conditions Report | 4-37
Figure 4.18 – Proposed Bus Route Expansions

The Nason Street Corridor Plan Existing Conditions Report | 4-38
Future Traffic Conditions Roadway conditions along Nason Street will change significantly due to improvements implemented under the Nason Street Improvement Project. The Project will widen several segments of Nason Street as a four lane divided roadway to provide acceptable traffic operations under the City of Moreno Valley General Plan buildout conditions. Additionally, several improvements such as additional signalization and dedicated turn lanes will be made along Nason Street and its intersections.
Future (Post-2030) Volumes Future (Post-2030) Average Daily Traffic (ADT) volumes for roadway segments in the study area are given below. Volumes are based on data from the Moreno Valley Traffic Model (MVTM), derived for the Nason Street Improvement Project Traffic Analysis conducted by Urban Crossroads in 2012. Additionally, AM and PM peak hour intersection turning movement counts are provided on Figures 4.19 and 4.20.

The Nason Street Corridor Plan Existing Conditions Report | 4-39
Figure 4.19 – Future Intersection Volumes (AM Peak Hour)

The Nason Street Corridor Plan Existing Conditions Report | 4-40
Figure 4.20 – Future Intersection Volumes (PM Peak Hour)

The Nason Street Corridor Plan Existing Conditions Report | 4-41
TABLE 4.9: FUTURE (POST-2030) VOLUMES
STREET SEGMENT ADT
NASON ST. N OF FIR AVE. 30,300
N OF EUCALYPTUS AVE. 26,100
N OF BLOOMFIELD RD. 41,500
N OF DRACAEA AVE. 42,000
N OF VINEWOOD PL. 39,500
N OF COTTONWOOD AVE. 39,400
N OF BAY AVE. 35,300
N OF ALESSANDRO BLVD. 32,300
N OF BRODIAEA AVE. 28,300
N OF HOSPITAL RD. 27,600
N OF CACTUS AVE. 21,500
S OF CACTUS AVE 21,300
FIR AVE. W OF NASON ST. 8,400
E OF NASON ST. 6,100
EUCALYPTUS AVE. W OF NASON ST. 15,800
E OF NASON ST. 26,100
VALLEY VIEW HS W OF NASON ST. 2,800
BLOOMFIELD RD. E OF NASON ST. 900
DRACAEA AVE. W OF NASON ST. 4,800
E OF NASON ST. 2,100
VINEWOOD PL. E OF NASON ST. 300
COTTONWOOD AVE. W OF NASON ST. 13,300
E OF NASON ST. 12,300
BAY AVE. W OF NASON ST. 5,900
E OF NASON ST. 2,800
ALESSANDRO BLVD. W OF NASON ST. 27,200
E OF NASON ST. 23,100
BRODIAEA AVE. W OF NASON ST. 7,500
E OF NASON ST. 500
HOSPITAL RD. W OF NASON ST. 5,000
CACTUS AVE. W OF NASON ST. 30,000
E OF NASON ST. 31,100 SOURCE: URBAN CROSSROADS, 2012
As can be seen in Table 4.9, substantial volume increases are expected along Nason Street and intersecting roadways.

The Nason Street Corridor Plan Existing Conditions Report | 4-42
Future (Post-2030) Intersection Level of Service Future (Post-2030) levels of service for intersections along Nason Street are provided in Table 4.10. Intersections were analyzed using the HCM 2000 methodology and reflect level of service as a function of average delay. According to Table 4.10, intersections will perform at satisfactory levels of service.
TABLE 4.10: FUTURE (POST-2030) INTERSECTION LEVEL OF SERVICE
INTERSECTION AM DELAY (SEC) AM LOS PM DELAY (SEC) PM LOS
FIR AVE. 24.3 C 27.5 C
EUCALYPTUS AVE. 38.4 D 37.0 D
VALLEY VIEW HS / BLOOMFIELD RD. 20.0 C 14.2 B
DRACAEA AVE. 18.2 B 21.3 C
VINEWOOD PL. 10.0 B 11.2 B
COTTONWOOD AVE. 26.2 C 33.0 C
BAY AVE. 7.7 A 17.0 B
ALESSANDRO BLVD. 37.5 D 37.1 D
BRODIAEA AVE. 13.7 B 20.9 C
HOSPITAL RD. 8.5 A 12.8 B
CACTUS AVE. 46.8 D 53.0 D SOURCE: URBAN CROSSROADS, 2012
Future (Post-2030) Roadway Level of Service Future (Post-2030) levels of service for roadway segments along Nason Street are provided in Table 4.11. Several segments along Nason Street are projected to operate at unsatisfactory levels of service.

The Nason Street Corridor Plan Existing Conditions Report | 4-43
TABLE 4.11: FUTURE (POST-2030) ROADWAY LEVEL OF SERVICE
SEGMENT V/C RATIO LOS
NORTH OF FIR AVE. 0.81 D
BETWEEN FIR AVE. AND EUCALYPTUS AVE. 0.70 B
BETWEEN EUCALYPTUS AVE. AND BLOOMFIELD RD. 1.11 F
BETWEEN BLOOMFIELD RD. AND DRACAEA AVE. 1.12 F
BETWEEN DRACAEA AVE. AND VINEWOOD PL. 1.05 F
BETWEEN VINEWOOD PL. AND COTTONWOOD AVE. 1.05 F
BETWEEN COTTONWOOD AVE. AND BAY AVE. 0.94 E
BETWEEN BAY AVE. AND ALESSANDRO BLVD. 0.86 D
BETWEEN ALESSANDRO BLVD. AND BRODIAEA AVE. 0.60 B
BETWEEN BRODIAEA AVE. AND HOSPITAL RD. 0.59 A
BETWEEN HOSPITAL RD. AND CACTUS AVENUE 0.86 D
SOUTH OF CACTUS AVENUE 0.85 D SOURCE: URBAN CROSSROADS, 2012
4.2 Regulatory Considerations The regulatory framework is used to inform decision makers about the regulatory agencies/policies that affect transportation in the Corridor. This enables them to make informed decisions about planning improvements to transportation systems in the Corridor. This document includes a discussion of funding and regulation. Major policy documents impacting the transportation system in the Nason Street Corridor Study Area include laws at the state level and planning documents at a regional and local level.
The Nason Street Corridor Plan Existing Conditions Report | 4-44
State Regulations AB 32 – Global Warming Solutions Act With the passage of the Global Warming Solutions Act of 2006, the State of California committed itself to reducing greenhouse gas (GHG) emissions to 1990 levels by 2020. The California Air Resource Board (ARB), which is coordinating the response to comply with AB 32, is currently on schedule to meet this deadline.
In 2007, ARB adopted a list of early action programs that could be put in place by January 1, 2010. In 2008, ARB defined its 1990 baseline level of emissions, and by 2011 it completed its major rule making for reducing GHG emissions. Rules on emissions, as well as market-based mechanisms like the proposed cap and trade program, came into effect January 1, 2012. The cap and trade program controls pollution by a governing agency selling permits on the amount of pollutants a firm can emit. A firm’s pollutants cannot exceed the limit. Firms requiring the need to increase their emissions must purchase permits from other firms requiring fewer permits.
SB 375 – Sustainable Communities and Climate Protection Act On December 11, 2008, the ARB adopted its Proposed Scoping Plan for AB 32. This scoping plan included the approval of SB 375 as the means for achieving regional transportation-related GHG targets. SB 375 provides guidance on how curbing emissions from cars and light trucks can help the state comply with AB 32.
There are five major components to SB 375. First, SB 375 will address regional GHG emission targets. ARB’s Regional Targets Advisory Committee will guide the adoption of targets to be met by 2020 and 2035 for each Metropolitan Planning Organization (MPO) in the State. These targets, which MPOs may propose themselves, will be updated every eight years in conjunction with the revision schedule of housing and transportation elements.
Second, MPOs will be required to create a Sustainable Communities Strategy (SCS) that provides a plan for meeting regional targets. The SCS and the Regional Transportation Plan (RTP) must be consistent with each other, including action

The Nason Street Corridor Plan Existing Conditions Report | 4-45
items and financing decisions. If the SCS does not meet the regional target, the MPO must produce an Alternative Planning Strategy that details an alternative plan to meet the target.
Third, SB 375 requires that regional housing elements and transportation plans be synchronized on eight-year schedules. In addition, Regional Housing Needs Assessment (RHNA) allocation numbers must conform to the SCS. If local jurisdictions are required to rezone land as a result of changes in the housing element, rezoning must take place within three years.
Fourth, SB 375 provides CEQA streamlining incentives for preferred development types. Residential or mixed-use projects qualify if they conform to the SCS. Transit-oriented developments (TODs) also qualify if they 1) are at least 50% residential, 2) meet density requirements, and 3) are within one-half mile of a transit stop. The degree of CEQA streamlining is based on the degree of compliance with these development preferences.
Finally, MPOs must use transportation and air emission modeling techniques consistent with guidelines prepared by the California Transportation Commission (CTC). Regional Transportation Planning Agencies, cities, and counties are encouraged, but not required, to use travel demand models consistent with the CTC guidelines.
SB 743 – General CEQA Reform On September 27, 2013, Governor Jerry Brown signed SB 743 into law. A key element of this law is the potential elimination or deemphasizing of auto delay, level of service (LOS), and other similar measures of vehicular capacity or traffic congestion as a basis for determining significant impacts in many parts of the State. According to the legislative intent contained in SB 743, these changes to current practice were necessary to “More appropriately balance the needs of congestion management with statewide goals related to infill development, promotion of public health through active transportation, and reduction of greenhouse gas emissions.”

The Nason Street Corridor Plan Existing Conditions Report | 4-46
To implement this intent, SB 743 contains amendments to current congestion management law that allows cities and counties to effectively opt-out of the LOS standards that would otherwise apply in areas where Congestion Management Plans (CMPs) are still used. Further, SB 743 requires the Governor’s Office of Planning and Research (OPR) to update the CEQA Guidelines and establish, “... criteria for determining the significance of transportation impacts of projects within transit priority areas.” The new criteria, “… shall promote the reduction of greenhouse gas emissions, the development of multimodal transportation networks, and a diversity of land uses.” Once the Secretary of the Natural Resources Agency certifies the new guidelines, then “…automobile delay, as described solely by level of service or similar measures of vehicular capacity or traffic congestion shall not be considered a significant impact on the environment…, except in locations specifically identified in the guidelines, if any.” OPR is in the early stages of investigating alternative metrics, but a preliminary metrics evaluation suggests that auto delay and LOS may work against goals such as greenhouse gas reduction and accommodation of all modes. On August 6, 2014, OPR released a preliminary draft of changes to CEQA Guidelines to incorporate SB 743.
As noted, SB 743 requires impacts to transportation network performance to be viewed through a filter that promotes the reduction of greenhouse gas emissions, the development of multimodal transportation networks, and a diversity of land uses. Some alternative metrics were identified in the law including VMT or automobile trip generation rates. SB 743 does not prevent a city or county from continuing to analyze delay or LOS as part of other plans (i.e., the general plan), studies, or ongoing network monitoring, but these metrics may no longer constitute the sole basis for CEQA impacts.
Regional Regulations and Plans Riverside County Congestion Management Program The passage of Proposition 111 in June 1990 established a process for each metropolitan county in California, including Riverside, to prepare a Congestion Management Plan (CMP). The CMP, which was prepared by the RCTC in

The Nason Street Corridor Plan Existing Conditions Report | 4-47
consultation with the County and the cities in Riverside County, is an effort to align land use, transportation, and air quality management efforts, to promote reasonable growth management programs that effectively use statewide transportation funds, while ensuring that new development pays its fair share of needed transportation improvements.
The focus of the CMP is the development of an Enhanced Traffic Monitoring System in which real-time traffic count data can be accessed by RCTC to evaluate the condition of the Congestion Management System (CMS) and meet other monitoring requirements at the State and Federal levels. Per the adopted Level of Service target of “E,” when a CMS segment falls to “F,” a deficiency plan is required. Preparation of a deficiency plan will be the responsibility of the local agency where the deficiency is located. Other agencies identified as contributors to the deficiency will also be required to coordinate with the development of the plan. The plan must contain mitigation measures, including Transportation Demand Management (TDM) strategies and transit alternatives, and a schedule of mitigating the deficiency. To ensure that the CMS is appropriately monitored to reduce the occurrence of CMP deficiencies, it is the responsibility of local agencies, when reviewing and approving development proposals, to consider the traffic impacts on the CMS.
Western Riverside Council of Governments, Transportation Uniform Mitigation Fee (WRCOG TUMF) In November 1988, Riverside County voters approved Measure “A”; a one-half cent increase in sales tax over a twenty year period to be used for transportation purposes. A major factor contributing to the support of Measure “A” was the “return to source” concept which requires the additional sales tax revenue generated in a specific geographic area be used to finance projects within that same area, and that Transportation Uniform Mitigation Fees (TUMF) be adopted in Western Riverside County on all new development. The program has been so successful, in November 2002, Riverside County voters approved a 30-year extension of Measure “A” (2009 - 2039). Despite its success, Measure “A” funds will only contribute a portion of the

The Nason Street Corridor Plan Existing Conditions Report | 4-48
transportation improvements necessary to prevent a potential breakdown of the regional transportation system.
The TUMF program was developed to generate additional funds required for necessary improvements to the regional transportation system. TUMF is a development impact assessment which provides funding for transportation improvements required to support new development. The assessment is based on the number of vehicle trips new development or site improvement will generate. Local jurisdictions may choose not to collect TUMF, however, jurisdictions not collecting TUMF forfeit their share of Local Measure “A” funds to the regional arterial program.
WRCOG 4-City Neighborhood Electric Vehicle Transportation Plan Neighborhood Electric Vehicles (NEV’s) are low speed, all-electric powered vehicles that do not produce tailpipe emissions. They are typically capable of traveling 25-35 MPH with a range of 30 miles per charge. NEV batteries charge through a standard power outlet. NEV’s differ from traditional golf carts by being substantially heavier and being capable of a higher top speed, Additionally, NEV’s require a valid California driver’s license. Since NEV’s are considered low speed vehicles, they are legally limited to certain roads (usually those with posted speed limits of 35 MPH or less) and require legislative acts to allow use on facilities greater than 35 MPH. In areas that implement NEV master plans, NEVs can especially be effective for connecting residential land uses with nearby destinations.
Effective NEV implementation is needed to overcome obstacles such as connection issues and safety. Therefore, the Western Riverside Council of Governments (WRCOG) has developed the WRCOG 4-City Neighborhood Electric Vehicle Transportation Plan to leverage existing and future public street networks for maximum benefit in the Cities of Corona, Norco, Riverside, and Moreno Valley and surrounding unincorporated communities.
The Plan is the result of collaboration between WRCOG, local jurisdictions, Caltrans, Riverside County Transportation Commission (RCTC), Riverside Transit Agency
The Nason Street Corridor Plan Existing Conditions Report | 4-49
(RTA), and other county stakeholders. The Plan recommends several near-term and long-term NEV routes within each jurisdiction, including the City of Moreno Valley.
Western Riverside County Non-Motorized Transportation Plan The Western Riverside Council of Governments (WRCOG) recognizes the value of providing alternative modes of transportation in addressing congestion, emissions, improved mobility, and healthier and more livable communities. In 2010, WRCOG released its Non-Motorized Transportation Plan as an update to the plan developed in 1996. The Plan lays out a regional backbone of bicycle, pedestrian, neighborhood electric vehicle (NEV), and golf cart facilities to improve transportation mobility options. In addition to presenting various proposed routes, the Plan discusses goals and strategies, design guidelines, funding opportunities, benefits of implementation, and an implementation approach. Furthermore, local governments that apply for funds for projects in the Plan will receive some priority in funding decisions for non-motorized facilities.
Local Regulations and Plans City of Moreno Valley Development Impact Fees The City of Moreno Valley collects development impact fees from new private development to help fund future transportation system improvements. The exact fees collected are available on the City of Moreno Valley’s website.
City of Moreno Valley Circulation Element The City of Moreno Valley General Plan (2006) was developed to provide a comprehensive long-term strategy for how and where physical development would occur in the City. The Circulation Element specifically addresses Moreno Valley’s transportation goals including:
Maintain safe and adequate pedestrian, bicycle, and public transportation systems to provide alternatives to single occupant vehicular travel and to support planned land uses.
Support and encourage development of safe, efficient, and aesthetic pedestrian facilities.
The Nason Street Corridor Plan Existing Conditions Report | 4-50
Encourage bicycling as an alternative to single occupant vehicle travel for the purpose of reducing fuel consumption, traffic congestion, and air pollution.
4.3 Conclusions This section identifies issues and opportunities related to the various issues within the Corridor. These issues and constraints are generally related to conditions within the entire Corridor.
Issues Obstacles for Pedestrians – Sidewalks are nonexistent in several areas along the Corridor. Additionally, there is a lack of uniformity in width and design in locations that do provide paved sidewalks. Impediments to walking in the Corridor can explain the low levels of pedestrian mode choice in this and other areas of Moreno Valley. Additionally, land use development along the corridor is not at a pedestrian scale (e.g. it is set back from the roadway and, in many cases, has a large parking lot between the land use and the sidewalk).
Lack of Uniformity or Connectivity for Bicycle Facilities – Currently, bikeways in the Corridor vary between Class I, Class II, and Class III bikeways with little uniformity. Additionally, bikeways are not connected to one another and are somewhat disjointed. This can create a difficult network for bicyclists to navigate.
Significant Physical Obstacles for Transit Users – Many bus stops in the Corridor lack either a bench or a shelter, and instead merely provide signage and schedule information. In addition, many bus stops are on roadway segments with no sidewalk access, making transit use difficult.
Low Transit Demand Potential – According to the Riverside Transit Agency’s Comprehensive Operational Assessment (COA), the area surrounding the Corridor currently displays low transit demand potential. RTA’s assessment was based on factors such as employment and population density, development patterns, and street patterns, among others. This low demand can make it difficult to implement

The Nason Street Corridor Plan Existing Conditions Report | 4-51
new transit service in the Corridor in the near future since ridership may remain too low to be financially stable.
Opportunities Roadway Widening – Currently, several roadway segments in the Corridor are being widened for the Nason Street Improvement Project. As roadways are being widened, there exists the opportunity to include other improvements such as pedestrian, bicycle, and transit amenities.
Undeveloped/Unoccupied/Vacant Land – Many parcels along the corridor are currently vacant and undeveloped. These parcels present many development opportunities for the Corridor.
Future Transit Service Improvements – RTA’s 10-Year Transit Network Plan will improve local bus service in the Corridor, potentially improving access to modes other than the automobile for residents and employees of the area. Additionally, WRCOG’s 2010 study of potential Bus Rapid Transit routes in Western Riverside County recommended BRT service to the Riverside County Medical Center in the south of the study area.
Proposed Bikeway Improvements – The City of Moreno Valley’s Draft Bicycle Master Plan proposes substantial improvements to bicycle infrastructure in the corridor. This includes increased coverage on local roadways. The Plan’s proposed additions consist of more uniformity and consistency of bikeway types and design in the Corridor.

The Nason Street Corridor Plan Existing Conditions Report | 4-52
Page Intentionally Left Blank.
The Nason Street Corridor Plan Existing Conditions Report | 5-1
5. Market Conditions This section is focused on the economic conditions in Moreno Valley in general and the particular conditions in the Corridor.
Market Context The north end of the plan area is characterized by a mix of auto oriented retail and commercial uses with frontage along Nason Street at the intersection of SR-60. There are several large format retail stores such as Target, Kohl’s and Walmart in this area. The north end of the plan area also includes a cluster of auto dealerships. South of Fir Ave, the corridor becomes more residential in nature. There are two important institutional land uses along the corridor. These include Valley View High School at Nason and Eucalyptus and the Riverside County Regional Medical Center at Nason and Cactus. The corridor offers the opportunity to create denser nodes of transit serviced and walkable neighborhoods at key locations. In particular at major employment centers such as the Medical Center and High School or at the commercial cluster at the north end or the corridor. In addition there are large undeveloped parcels along the course of the corridor that may be induced to develop in a pattern that is supportive of transit use and or create moments of differentiation from the existing auto oriented development pattern that characterizes the area.
Information in this report is provided at varying levels of geography tied to the availability of data. Familiar political jurisdictions such as the City of Moreno Valley, Riverside County and the State of California are provided in order to give context for information provided on the plan area. The Planning Area for the economic analysis has been defined by four census tracts that are roughly coterminous with the boundaries of the Corridor Plan, however it includes residential sections and

The Nason Street Corridor Plan Existing Conditions Report | 5-2
neighborhoods that have been excluded from the defined boundaries of the project area itself. These tracts are:
426.21 426.22 487 511
Most of the information presented in this section will refer to the Corridor. The boundaries of these tracts are shown on Figure 4.1. The existing conditions analysis provides information on the following topic areas:
Population Households Housing and residential real estate Employment and incomes Real estate markets
o Multi-unit residential o Office o Industrial o Retail
Data for the Corridor will be presented in terms of a comparative index to Riverside County as a whole in order to identify the relative concentration of any particular variable and its attributes within the Corridor. This index value is presented in percentage terms. An index value of 100% shows that the attribute occurs within the Corridor at the same rate that occurs in the County as a whole. Index values under 100% indicate an underrepresentation of the attribute being examined; values over 100% indicate an overrepresentation of the attribute.

The Nason Street Corridor Plan Existing Conditions Report | 5-3
FIGURE 4.1. CENSUS TRACTS IN PLAN AREA
The Nason Street Corridor Plan Existing Conditions Report | 5-4
5.2 Population Table 5.1 lists the population rank of Riverside County cities. According to the California Department of Finance, Moreno Valley, with a population of 193,365, is the 2nd largest city in Riverside County and represents approximately 8.8% of the county’s total population of over 2.1 million in 2013. Moreno Valley has experienced significant rates of growth since 2000, considerably higher than the state wide growth rate but somewhat lower than Riverside County as a whole. Table 5.2 compares the rate of population growth for California, Riverside County and Moreno Valley indexed to 2000. California Department of Finance estimates indicate that Moreno Valley has experienced a population growth of just less than 40% over the last 13 years. This is in comparison to the growth rate of approximately 45% for Riverside County and 12% for California as a whole over the same time period. Figure 4.2 shows this growth in an index form.
Moreno Valley’s population is generally younger than Riverside County’s. As shown on Table 3.3, Moreno Valley has a median age of 28.6 years in comparison to the county at 33.7. Looking more specifically at the Corridor, it is home to a significant concentration of school aged children and people in their early 30s. The median age for the Corridor was reported at 28.5 years of age.
The 2010 census reported that just over 22,177 people lived within the Corridor. This compares to total population of Moreno Valley at just over 193,000. Again, that note that 2010 census data varies from California Department of Finance annual estimates.
Data for race and ethnicity from the 2010 census is shown on Table 5.4. A large proportion of the Corridor and the city’s population is comprised of individuals who identify themselves as being Hispanic of any race. This group represents 49% and

The Nason Street Corridor Plan Existing Conditions Report | 5-5
54% respectively compared to 45% for Riverside County. In terms of nationality, just over 25% of the Corridor population reports being foreign born.
This compares to a rate of 24% for Moreno Valley and 21% for Riverside County. Foreign-born individuals occur in the Corridor at 115% of the rate that they occur in the county. In terms of the place of birth for the foreign-born population, the largest group reports their origins as being from Latin America. However, the proportion of Latin American for individuals within the Corridor occurs at approximately the same rate as Moreno Valley. Information on linguistic isolation(speaking English less than very well) is also presented, with individuals who report speaking English less than very well accounting for approximately 14% of the total population aged five and over within the Corridor. The majority of these linguistically isolated individuals report Spanish as their primary language spoken at home. This data is summarized in Table 5.5. The population is on average less linguistically isolated that the population of the county as a whole.

The Nason Street Corridor Plan Existing Conditions Report | 5-6
TABLE 5.1: CITY POPULATIONS IN RIVERSIDE COUNTY, 2013
County Rank City Population Percent of County 1 Riverside 303,871 13.9% 2 Moreno Valley 193,365 8.8% 3 Corona 152,374 7.0% 4 Murrieta 103,466 4.7% 5 Temecula 100,097 4.6% 6 Hemet 78,657 3.6% 7 Menifee 77,519 3.5% 8 Indio 76,036 3.5% 9 Perris 68,386 3.1%
10 Lake Elsinore 51,821 2.4% 11 Cathedral City 51,200 2.3% 12 Palm Desert 48,445 2.2% 13 Palm Springs 44,552 2.0% 14 San Jacinto 44,199 2.0% 15 Coachella 40,704 1.9% 16 La Quinta 37,467 1.7% 17 Beaumont 36,877 1.7% 18 Wildomar 32,176 1.5% 19 Banning 29,603 1.4% 20 Norco 27,063 1.2% 21 Desert Hot Springs 25,938 1.2% 22 Blythe 20,817 1.0% 23 Rancho Mirage 17,218 0.8% 24 Canyon Lake 10,561 0.5% 25 Calimesa 7,879 0.4% 26 Indian Wells 4,958 0.2%
Balance Of County 504,392 23.0% Incorporated 1,685,249 77.0% County Total 2,189,641 100.0%
SOURCE: US CENSUS AND MR+E

The Nason Street Corridor Plan Existing Conditions Report | 5-7
TABLE 5.2 POPULATION GROWTH
Year California Riverside Co. Moreno Valley
2013 37,984,138 2,255,653 198,183
2012 37,668,804 2,234,209 197,088
2011 37,427,946 2,205,731 194,451
2010 37,223,900 2,179,692 193,365
2009 36,966,713 2,140,626 189,690
2008 36,704,375 2,102,741 185,513
2007 36,399,676 2,049,902 182,330
2006 36,116,202 1,975,913 176,830
2005 35,869,173 1,895,695 167,262
2004 35,570,847 1,814,485 158,634
2003 35,163,609 1,730,219 152,355
2002 34,725,516 1,655,291 147,533
2001 34,256,789 1,589,708 144,312
2000 33,873,086 1,545,387 142,379
FIGURE 4.2 POPULATION GROWTH INDEXED TO 2000
70%
80%
90%
100%
110%
120%
130%
140%
150%
20132012201120102009200820072006200520042003200220012000
California
Riverside Co.
Moreno Valley

The Nason Street Corridor Plan Existing Conditions Report | 5-8
TABLE 5.3 AGE DISTRIBUTION, 2010
Year Corridor City of Moreno Valley
Riverside County
Percentage
Under 5 years 1,842 16,175 162,438 8.63% 7.42%
5 to 9 years 1,846 16,354 167,065 8.65% 7.63%
10 to 14 years 1,955 18,068 177,644 9.16% 8.11%
15 to 19 years 2,161 19,289 187,125 10.13% 8.55%
20 to 24 years 1,702 16,173 154,572 7.98% 7.06%
25 to 29 years 1,801 14,595 143,992 8.44% 6.58%
30 to 34 years 1,677 13,372 138,437 7.86% 6.32%
35 to 39 years 1,588 12,993 143,926 7.44% 6.57%
40 to 44 years 1,509 12,766 149,379 7.07% 6.82%
45 to 49 years 1,371 12,731 152,722 6.42% 6.97%
50 to 54 years 1,188 12,313 140,016 5.57% 6.39%
55 to 59 years 936 9,505 114,765 4.39% 5.24%
60 to 64 years 652 6,897 98,974 3.06% 4.52%
65 to 69 years 391 4,382 78,495 1.83% 3.58%
70 to 74 years 291 3,083 62,103 1.36% 2.84%
75 to 79 years 188 2,240 49,003 0.88% 2.24%
80 to 84 years 118 1,346 36,793 0.55% 1.68%
85 years and over 124 1,083 32,192 0.58% 1.47%
Median age 28.5 28.6 33.7 84.57%
Total 21,340 193,365 2,189,641 0.97%
TABLE 5.4 RACE AND ETHNICITY, 2012
Race Corridor City of Moreno Valley
Riverside County
Corridor (%)
County (%)
Index (%)
White 3,419 36,573 869,068 15.42% 39.69% 38.84%
African American 4,793 33,195 130,823 21.61% 5.97% 361.74%
American Indian 87 573 10,931 0.39% 0.50% 78.58%
Asian 2,101 11,423 125,921 9.47% 5.75% 164.74%
Native Hawaiian / P.I.
94 990 5,849 0.42% 0.27% 158.68%
Some Other Race 80 388 3,682 0.36% 0.17% 214.52%
Two or More Races 654 5,054 48,110 2.95% 2.20% 134.22%
Hispanic (Any race) 10,949 105,169 995,257 49.37% 45.45% 108.62%
Median age 28.5 28.6 33.7 84.57%
Total 22,177 193,365 2,189,641 1.01%

The Nason Street Corridor Plan Existing Conditions Report | 5-9
TABLE 5.5 NATIONALITY AND LANGUAGE 2012
Number Nason Street Corridor
Moreno Valley
Riverside County
Nason Street Corridor Indexed to County
PLACE OF BIRTH
Total population 20,837 197,068 2,192,982
Native 15,559 148,141 1,711,123 95.70%
Born in United States 15,288 146,326 1,688,915 95.27%
State of residence (CA) 12,627 121,676 1,265,964 104.97%
Different state 2,661 24,650 422,951 66.21%
Puerto Rico or abroad to American parent(s)
271 1,815 22,208 128.43%
Foreign born 5,278 48,927 481,859 115.28%
U.S. CITIZENSHIP STATUS
Foreign-born population 5,278 48,927 481,859
Naturalized U.S. citizen 3,204 21,335 205,758 142.16%
Not a U.S. citizen 2,074 27,592 276,101 68.58%
WORLD REGION OF BIRTH OF FOREIGN BORN
Foreign-born population 5,278 48,927 481,859
Europe 65 787 25,610 23.2%
Asia 1,685 8,826 91,969 167.3%
Africa 108 1,253 6,466 152.5%
Oceania 65 221 2,322 255.6%
Latin America 3,341 37,743 344,634 88.5%
Canada / Other North America 14 97 10,858 11.8%
LANGUAGE SPOKEN AT HOME
Population 5 years and over 18,998 180,923 2,030,097
English only 10,109 87,751 1,221,523 88.43%
Language other than English 8,889 93,172 808,574 117.47%
Speak English less than "very well" 2,692 33,079 327,448 87.85%
Spanish 6,729 80,567 673,265 106.80%
Speak English less than "very well" 2,139 29,013 276,304 82.72%
Other Indo-European languages 331 2,440 42,022 84.17%
Speak English less than "very well" 71 672 11,156 68.01%
Asian and Pacific Islander languages 1,633 8,187 80,919 215.65%
Speak English less than "very well" 466 3,080 36,790 135.35%
Other languages 196 1,978 12,368 169.34%
Speak English less than "very well" 16 314 3,198 53.46% Source: US Census and MR+E, DP02

The Nason Street Corridor Plan Existing Conditions Report | 5-10
5.3 Households The Corridor contains 5,779 households of which approximately 82% are family households. The average household size is 3.7 which is the same as the city’s and somewhat larger than the county average with the city and county reporting averages of 3.74 and 3.14 respectively. 69% of family households in the Corridor live with related children under 18 years of age. Table 5.6 provides detailed information on the size of household and family structure for the Corridor, Moreno Valley, and Riverside County.

The Nason Street Corridor Plan Existing Conditions Report | 5-11
TABLE 5.6 HOUSEHOLD STRUCTURE 2010
Corridor Moreno Valley
Riverside County
Corridor (%)
Moreno Valley (%)
Riverside County (%)
Corridor (%)
HOUSEHOLD TYPE
Total households 5,779 51,592 686,260
Family households 4,738 43,181 510,241 81.99% 83.70% 74.35% 110%
Male householder 3,074 28,103 357,691 53.19% 54.47% 52.12% 102%
Female householder 1,664 15,078 152,550 28.79% 29.23% 22.23% 130%
Nonfamily households 1,041 8,411 176,019 18.01% 16.30% 25.65% 70%
Male householder 510 4,101 84,686 8.83% 7.95% 12.34% 72%
Living alone 351 2,754 58,397 6.07% 5.34% 8.51% 71%
Female householder 531 4,310 91,333 9.19% 8.35% 13.31% 69%
Living alone 401 3,340 74,097 6.94% 6.47% 10.80% 64%
HOUSEHOLD SIZE
Total households 5,779 51,592 686,260
1-person household 752 6,094 132,494 13.01% 11.81% 19.31% 67%
2-person household 1,125 10,627 194,449 19.47% 20.60% 28.33% 69%
3-person household 1,008 9,029 104,641 17.44% 17.50% 15.25% 114%
4-person household 1,139 9,579 108,831 19.71% 18.57% 15.86% 124%
5-person household 819 7379 71,703 14.17% 14.30% 10.45% 136%
6-person household 473 4340 37,337 8.18% 8.41% 5.44% 150%
7-or-more-person household
463 4544 36,805 8.01% 8.81% 5.36% 149%
Average household size 3.7 3.74 3.14 117%
Average family size 4.0 3.99 3.61 111%
FAMILY STRUCTURE
Families 4,738 43,181 510,241
With related children under 18 years
3,273 28,122 290,070 69.08% 65.13% 56.85% 122%
With own children under 18 years
2,858 24,115 257,077 60.32% 55.85% 50.38% 120%
Under 6 years only 552 3955 47,521 11.65% 9.16% 9.31% 125%
Under 6 and 6 to 17 years
693 6278 62,657 14.63% 14.54% 12.28% 119%
6 to 17 years only 1,613 13,882 146,899 34.04% 32.15% 28.79% 118%

The Nason Street Corridor Plan Existing Conditions Report | 5-12
TABLE 5.6 HOUSEHOLD STRUCTURE 2010 (CONTINUED)
Corridor Moreno Valley
Riverside County
Corridor (%)
Moreno Valley (%)
Riverside County (%)
Corridor (%)
Husband-wife families 3,231 29,000 376,381 68.19% 67.16% 73.77%
With related children under 18 years
2,163 18,213 202,045 45.65% 42.18% 39.60% 115%
With own children under 18 years
1,965 16,210 185,194 41.47% 37.54% 36.30% 114%
Under 6 years only 365 2,481 33,636 7.70% 5.75% 6.59% 117%
Under 6 and 6 to 17 years
515 4,544 48,031 10.87% 10.52% 9.41% 115%
6 to 17 years only 1,085 9,185 103,527 22.90% 21.27% 20.29% 113%
Female householder, no husband present
1,074 9,990 91,015 22.67% 23.14% 17.84%
With related children under 18 years
792 7,124 60,935 16.72% 16.50% 11.94% 140%
With own children under 18 years
641 5,687 49,824 13.53% 13.17% 9.76% 139%
Under 6 years only 116 952 8,393 2.45% 2.20% 1.64% 149%
Under 6 and 6 to 17 years
112 1,195 10,132 2.36% 2.77% 1.99% 119%
6 to 17 years only 413 3,540 31,299 8.72% 8.20% 6.13% 142%

The Nason Street Corridor Plan Existing Conditions Report | 5-13
5.4 Housing and Residential Real Estate There are 6,272 total housing units located within the Corridor. This represents approximately 11% of Moreno Valley's total housing stock. Table 5.7 provides detail on occupancy status and tenure. Sixty percent of the Corridor units are owner occupied, about the same rate as the city and county.
Table 5.8 provides additional information on the attributes of dwelling units and information on housing overcrowding.
Seventy percent of the dwelling units in the Corridor are single family detached units. This compares with approximately 79% for the city and 68% for the county. The largest class of multifamily units are in structures with between 10 and 19 units which accounts for 710 units. Additionally, 423 units are in structures with 20 or more units. A total of 402 units are reported as being overcrowded that is units with more than one occupant per room. This accounts for approximately 7% of the total Corridor housing stock which is lower than what was experienced throughout Moreno Valley. Housing overcrowding is often a symptom of high housing costs relative to the regional market.
Figure 5.3 provides data for the median sales price for single-family homes in California, Riverside County and zip code 92555 which covers portions Moreno Valley including the Corridor. As of June 2014, median sales price for single-family homes in zip code 92555, which covers most of the east side of Moreno Valley, was $250,000. This compares to countywide median price of $290,000 and the statewide median of $386,000. The Corridor, like the rest of California, experienced a peak in sales prices in late 2006, however with the onset of the recession in 2007 and financial crisis in 2008 housing prices underwent a relatively significant decline until the spring of 2010.

The Nason Street Corridor Plan Existing Conditions Report | 5-14
TABLE 5.7 HOUSING TENURE 2012
Number Corridor Moreno Valley
Riverside County
Corridor Indexed to County
POPULATION
Population 21,340 193,365 2,189,641 0.97%
Households 5,779 51,592 686,260 0.84%
Total housing units 6,272 55,559 800,707 0.78%
OCUPANCY STATUS
Total housing units 6,272 55,559 800,707 0.78%
Occupied housing units 5,779 51,592 686,260 0.84%
Vacant housing units 493 3,967 114,447 0.43%
TENURE
Occupied housing units 5,779 51,592 686,260 0.84%
Owner occupied 3,768 33,393 462,212 0.82%
Owned with a mortgage or loan
3,515 30,053 363,460 0.97%
Owned free and clear 253 3,340 98,752 0.26%
Renter occupied 2,011 18,199 224,048 0.90%
VACANCY STATUS
Vacant housing units 493 3,967 114,447 0.43%
For rent 156 1,486 23,547 0.66%
Rented, not occupied 8 66 1,107 0.72%
For sale only 183 1,196 18,417 0.99%
Sold, not occupied 24 177 3,255 0.74%
For seasonal, recreational, or occasional
use
9 130 50,538 0.02%
For migratory workers - 1 84 0.00%
Other vacant 113 911 17,499 0.65%

The Nason Street Corridor Plan Existing Conditions Report | 5-15
TABLE 5.7 HOUSING TENURE 2012 (CONTINUED)
Percentage Corridor (%)
Moreno Valley (%)
Riverside County (%)
Corridor Indexed to County
OCUPANCY STATUS
Total housing units
Occupied housing units 92.14% 92.86% 85.71% 107.51%
Vacant housing units 7.86% 7.14% 14.29% 54.99%
TENURE
Occupied housing units 92.14% 92.86% 85.71% 107.51%
Owner occupied 60.08% 60.10% 57.73% 104.07%
Owned with a mortgage or loan
56.04% 54.09% 45.39% 123.46%
Owned free and clear 4.03% 6.01% 12.33% 32.71%
Renter occupied 32.06% 32.76% 27.98% 114.59%
VACANCY STATUS
Vacant housing units 7.86% 7.14% 14.29% 54.99%
For rent 2.49% 2.67% 2.94% 84.58%
Rented, not occupied 0.13% 0.12% 0.14% 92.26%
For sale only 2.92% 2.15% 2.30% 126.85%
Sold, not occupied 0.38% 0.32% 0.41% 94.13%
For seasonal, recreational, or occasional use
0.14% 0.23% 6.31% 2.27%
For migratory workers 0.0% 0.00% 0.01% 0.00%
Other vacant 1.80% 1.64% 2.19% 82.44% Source: US Census and MR+E QT-H1

The Nason Street Corridor Plan Existing Conditions Report | 5-16
Table 5.8 Housing Attributes 2012
Corridor Moreno Valley
Riverside County
Corridor Indexed to County
UNITS
Total housing units 6,032 54,752 799,360 0.75%
Occupied housing units 5,692 50,393 676,618 0.84%
Vacant housing units 340 4,359 122,742 0.28%
UNITS IN STRUCTURE
1-unit, detached 4,239 43,284 543,732 0.78%
1-unit, attached 213 1,475 51,150 0.42%
2 units 30 263 10,984 0.27%
3 or 4 units 235 1,177 25,459 0.92%
5 to 9 units 85 1,446 31,967 0.27%
10 to 19 units 710 2,687 25,694 2.76%
20 or more units 423 3,192 35,738 1.18%
Mobile home 97 1,180 73,029 0.13%
Boat, RV, van, etc. - 48 1,607 0.00%
OCCUPANTS PER ROOM
1.00 or less 5,290 44,686 627,033 0.84%
1.01 to 1.50 249 4,091 36,321 0.69%
1.51 or more 153 1,616 13,264 1.15%

The Nason Street Corridor Plan Existing Conditions Report | 5-17
Table 5.8 Housing Attributes 2012 (CONTINUED)
Corridor (%)
Moreno Valley (%)
Riverside County (%)
Corridor Indexed to County
Units in structure
1-unit, detached 70.28% 79.05% 68.02% 103.31%
1-unit, attached 3.53% 2.69% 6.40% 55.18%
2 units 0.50% 0.48% 1.37% 36.19%
3 or 4 units 3.90% 2.15% 3.18% 122.32%
5 to 9 units 1.41% 2.64% 4.00% 35.24%
10 to 19 units 11.77% 4.91% 3.21% 366.19%
20 or more units 7.01% 5.83% 4.47% 156.85%
Mobile home 1.61% 2.16% 9.14% 17.60%
Boat, RV, van, etc. 0.00% 0.09% 0.20% 0.00%
Occupants per room
1.00 or less 92.94% 88.68% 92.67% 100.29%
1.01 to 1.50 4.37% 8.12% 5.37% 81.49%
1.51 or more 2.69% 3.21% 1.96% 137.12% Source: US Census ACS and MR+E, DP-04
FIGURE 5.3 MEDIAN SALES PRICE, SINGLE FAMILY HOMES
$386,000
$290,000
$250,000
$0
$100,000
$200,000
$300,000
$400,000
$500,000
$600,000
May
20
04
Oct
20
04
Mar
20
05
Au
g 2
00
5
Jan
20
06
Jun
20
06
No
v 2
00
6
Ap
r 2
00
7
Sep
20
07
Feb
20
08
Jul 2
00
8
De
c 2
00
8
May
20
09
Oct
20
09
Mar
20
10
Au
g 2
01
0
Jan
20
11
Jun
20
11
No
v 2
01
1
Ap
r 2
01
2
Sep
20
12
Feb
20
13
Jul 2
01
3
De
c 2
01
3
May
20
14
California
RiversideCounty92555
Source: Dataqucik and MR+E

The Nason Street Corridor Plan Existing Conditions Report | 5-18
Throughout the entire time period, housing prices in 92555 were lower than the county average and California as a whole. However that differential began to shrink with declines in the overall housing market. In general, prices in the Corridor have trended concurrently with state and county price levels with Moreno Valley area housing consistently priced below Riverside County averages the last decade. Table 5.9 provides the comparative data on an annual average basis.
Evidence of the recent volatility in the local housing market can be seen in the rates of new housing construction in Moreno Valley and Riverside County which peaked in 2006. Table 5.10 provides data on new residential construction. The effects of the financial crisis can also be seen in a rapid spike in residential housing foreclosures that occurred in the city and county from 2007 through 2011. Much of this excess inventory has been worked out through the market and this is reflected in declining median sales prices that were experienced during the same time period. Table 5.11 shows this information.
An analysis of apartment rents on a dollar per square basis shows that Moreno Valley zip code 92555 has had lower rental rates than any area of Moreno Valley based on zip code averages. Residential rental rates in 92555 as of July 2014 were reported at $0.76 this compares to a $0.99 for Riverside County and California average of $1.37. Figure 5.4 shows these relationships.

The Nason Street Corridor Plan Existing Conditions Report | 5-19
TABLE 5.9 ANNUAL AVERAGE HOUSING SALES VALUES
Year California Riverside 92555 2013 $340,021 $246,233 $210,496 2012 $282,544 $207,638 $171,464 2010 $293,375 $217,782 $175,628 2009 $295,759 $223,342 $189,965 2008 $356,036 $305,308 $260,733 2007 $445,845 $404,701 $370,652 2006 $476,665 $443,622 $411,712 2005 $453,406 $408,458 $348,066 2004 $380,566 $332,210 $277,339 2003 $301,247 $245,177 $197,856 2002 $253,292 $201,058 $166,897 2001 $221,345 $174,621 $156,339 2000 $192,864 $151,607 $141,108
TABLE 5.10: NEW RESIDENTIAL CONSTRUCTION IN DWELLING UNITS
Year Riverside Co. Moreno Valley
2012 6,507 82
2011 3,751 23
2010 4,436 161
2009 4,188 141
2008 5,921 200
2007 12,442 860
2006 25,570 2,111
2005 34,207 2,081
2004 34,232 3,614
2003 30,354 2,459
2002 22,651 1,222

The Nason Street Corridor Plan Existing Conditions Report | 5-20
TABLE 5.11 RESIDENTIAL FORECLOSURES
Year Riverside Co. Moreno Valley
2012 10,354 908
2011 17,466 1,571
2010 20,665 1,969
2009 25,377 2,704
2008 32,664 4,325
2007 12,535 1,557
2006 1,779 172
2005 317 34
2004 349 43
2003 849 145
2002 1,703 329
FIGURE 5.4 RESIDENTIAL RENTS IN DOLLARS PER SQ. FT
$1.37
$0.99
$0.76
$0.70
$0.80
$0.90
$1.00
$1.10
$1.20
$1.30
$1.40
$1.50. California
Riverside County
92555

The Nason Street Corridor Plan Existing Conditions Report | 5-21
5.5 Income and Employment Median household income in the Corridor was reported at $65,176 for 2012. This compared to $52,947 for the city and $74,069 for Riverside County. In terms of income distribution, the middle income brackets are well represented in the Corridor and there is relatively low representation of either extremely high or low income households. Table 5.12 provides the data on the comparative distribution between the Corridor, city and county.
Historically, Moreno Valley has had a higher unemployment rate than either California or Riverside County. This was particularly pronounced after the 2008 financial crisis. Unemployment peaked in the city at 16.7% in 2010, over 2% higher than the county and over 4% higher than the state. The employment situation has been improving along with the rest of the regional economy; however Moreno Valley continues to experience a higher unemployment rate than either the county or the state. Annual unemployment rates are shown on Table 3.13
Table 5.14 shows employment by major sector for Moreno Valley compared to the county. The largest industry classification group of employment for the Corridor population is health services which accounts for 28.45% of Corridor employment. This is a level of representation over twice the distribution for the county as a whole and is the largest index value for employment compared to the distribution for the county. This agglomeration can be seen as being associated with the Riverside County Regional Medical Center, which directly employs over 1,500 people. The Keiser Permanente Moreno Valley Community Hospital is located at Iris and Oliver also represents a major health care employer within the Corridor. The presence of these two medical centers can be seen as a comparative advantage for the Corridor.

The Nason Street Corridor Plan Existing Conditions Report | 5-22
With increasing demands and accessibility to health care, additional ancillary facilities are likely to be attracted to the plan area. The second largest employment classification is retail trade. In terms of concentration index relative to the county, transportation and warehousing is the second highest index value at over 225%. The sector employs over 2,000 people in the Corridor and is reflective of Moreno Valley’s growing role in the Inland Empire’s logistics and warehousing industry.
TABLE 5.12 INCOME DISTRIBUTION 2012
Corridor Moreno Valley
Riverside County
Corridor Moreno Valley
Riverside County
Index
Total households 5,692 50,180 676,618
Less than $10,000 177 2,893 34,121 3.1% 5.8% 5.0% 61.7%
$10,000 to $14,999 219 2,967 34,706 3.8% 5.9% 5.1% 75.0%
$15,000 to $24,999 280 4,776 70,036 4.9% 9.5% 10.4% 47.5%
$25,000 to $34,999 408 5,267 68,734 7.2% 10.5% 10.2% 70.6%
$35,000 to $49,999 1,049 7,795 91,939 18.4% 15.5% 13.6% 135.6%
$50,000 to $74,999 1,223 10,862 122,729 21.5% 21.6% 18.1% 118.5%
$75,000 to $99,999 842 6,338 90,192 14.8% 12.6% 13.3% 111.0%
$100,000 to $149,999
1,050 6,219 98,704 18.4% 12.4% 14.6% 126.5%
$150,000 to $199,999
314 2,186 37,923 5.5% 4.4% 5.6% 98.4%
$200,000 or more 130 877 27,534 2.3% 1.7% 4.1% 56.1%
Median household income
$ 65,176 $ 52,947 $ 57,096 114.2%
Mean household income
$ 75,501 $ 63,868 $74,332 101.6%
Households with earnings
5,247 43343 529,083 92% 122% 78% 117.9%
Mean earnings $ 72,109 61,386 $ 73,197 394%
With Social Security 914 $10,155 193,793 16% 30% 29% 56.1%
Mean Social Security income
$ 16,255 15,023 $17,040 382%
With retirement income
788 $ 6,545 122,769 14% 48% 18% 76.3%
Mean retirement income
$ 69,125 24,035 $26,020 266%

The Nason Street Corridor Plan Existing Conditions Report | 5-23
TABLE 5.13 ANNUAL UNEMPLOYMENT RATE
Year Moreno Valley Riverside County California
2013 11.9 10.3 8.9
2012 14.2 12.2 10.5
2011 15.9 13.7 11.8
2010 16.7 14.5 12.1
2009 15.5 13.4 12.0
2008 9.9 8.5 9.0
2007 7.1 6.0 5.4
2006 5.9 5.0 4.9
2005 6.3 5.4 5.4
2004 7.0 6.0 6.2
2003 7.6 6.5 6.8
2002 7.6 6.5 6.7
2001 6.4 5.5 5.4
2000 6.3 5.4 4.9

The Nason Street Corridor Plan Existing Conditions Report | 5-24
TABLE 5.14 EMPLOYMENT BY SECTOR, 2011
Moreno Valley Riverside County Sector Jobs Percent Jobs Percent Index Agriculture, Forestry, Fishing and
Hunting 35 0.14% 11,674 2.18% 6.52%
Mining, Quarrying, and Oil and Gas Extraction
- 0.00% 399 0.07% 0.00%
Utilities 29 0.12% ,425 0.83% 14.25% Construction 324 1.32% 30,706 5.74% 22.94% Manufacturing 627 2.55% 38,163 7.13% 35.72% Wholesale Trade 739 3.00% 21,802 4.07% 73.70% Retail Trade 4,846 19.69% 77,007 14.39% 136.83% Transportation and Warehousing 2,029 8.24% 19,546 3.65% 225.71% Information 81 0.33% 6,644 1.24% 26.51% Finance and Insurance 601 2.44% 10,522 1.97% 124.20% Real Estate and Rental and Leasing 223 0.91% 7,058 1.32% 68.70% Professional, Scientific, and Technical
Services 417 1.69% 17,500 3.27% 51.81%
Management of Companies and Enterprises
161 0.65% 2,799 0.52% 125.07%
Administration & Support, Waste Management
534 2.17% 31,353 5.86% 37.03%
Educational Services 1,734 7.05% 63,263 11.82% 59.60% Health Care and Social Assistance 7,002 28.45% 55,783 10.42% 272.93% Arts, Entertainment, and Recreation 141 0.57% 17,941 3.35% 17.09% Accommodation and Food Services 2,857 11.61% 59,970 11.21% 103.59% Other Services (excluding Public
Administration) 1,496 6.08% 24,341 4.55% 133.64%
Public Administration 737 2.99% 34,282 6.41% 46.74% Total 24,613 100% 535,178 100% 4.60%
Source: Census and MR+E

The Nason Street Corridor Plan Existing Conditions Report | 5-25
5.6 Real Estate Market Multi-Unit Residential The Corridor currently has a diverse mix of land uses. The central portion of the corridor from Fir Street to Eucalyptus St. is primarily residential in character. The North end of the Corridor close to SR-60 is generally commercial in nature and focused on community scale retail. The central portion of the corridor contains large tracts of undeveloped land, particularly on the east side of the Corridor, south of Valley View High School. At present this land is zoned for residential use. Undeveloped land in the Eastern third of Moreno Valley is currently selling at approximately $350,000 per acre, based on existing entitlements. As was illustrated in the discussion on the residential real estate market, housing demand is beginning to stabilize in Moreno Valley as the severe effects of the 2007 recession and 2008 financial crisis began to abate. Excess inventory of housing is being absorbed by the market, and prices have begun to stabilize and to see modest growth.
As the general economy improves and the local unemployment rate begins to decline, demand for new housing is likely to reemerge in the current low interest rate environment. Due to structural changes in the labor market that were caused by the recession and financial crisis, household income has been stagnant or declining both locally and for the bulk of the nation’s households. These conditions combined with more stringent lending requirements have moved a significant number of households from ownership to rental and have led to increasing market interest in multifamily products.
That being said, data on housing tenure shows that the majority of dwelling units built in the Corridor and in Moreno Valley as a whole, continue to be owner occupied. This is likely to continue to be the predominant form of tenure in the area and as the economy improves, demand for owner occupied single-family residential is likely to return. At the same time, this structural shift has made

The Nason Street Corridor Plan Existing Conditions Report | 5-26
multifamily rental projects feasible in markets where they had previously been difficult to develop. Sites that are located close to employment centers, or locations with particularly good accessibility and access to transit, have become increasingly attractive to multifamily housing developers in lower density communities where multifamily development has historically been difficult to achieve. At present, rental rates for multifamily housing in the Corridor are below replacement costs and as result there is unlikely to be demand for new units in the short run. As the existing housing stock is absorbed and prices began to increase, demand for these types of units can be anticipated to emerge. As rental rates begin to approach $1.05 to $1.08 per square foot, market rate multifamily residential reaches a threshold of feasibility given the existing land costs in the Corridor.
Office Demand for office space is tied to broader trends in employment in the regional market. As the unemployment rate decreases in Riverside County and as the economy begins to rebound, in general, office demand can be anticipated to increase. There have been several important changes to the office market since the onset of the 2007 recession, technology has facilitated a dispersal of office type employment and occupations. There has been a generally observed rise in home occupations live workspace and other nontraditional workspaces that had previously been the source of office space occupancy.
Office space that is being used is being deployed in a much more efficient floorplans than had been experienced in the past. Prior to the recession it was common to allocate 250 sq. ft. of gross building area per employee in an office setting. As office employment begins to rebound, users are occupying as little as 75 sq. ft. per permanent employee due to the adoption of new technology and strategies that allow for space sharing multiple users in one location and the widespread acceptance of creative office space layouts and floor plans. These

The Nason Street Corridor Plan Existing Conditions Report | 5-27
broad trends have resulted in significant surpluses in existing office space across major markets throughout the United States and in Southern California.
Table 3.15 provides data on office lease rates in the broader inland Empire market. The Riverside and Moreno Valley market currently report an average asking rents of $1.87 per square foot. This is above the regional average of $1.65. However, the market has significant vacancies at over 16%. Table 3.16 shows that office lease rates in Moreno Valley are consistently below the countywide average and have declined nearly 50% from a peak value 2007 of $22.59 to $12.20. This suggests that the Corridor is unlikely to be the site of any significant speculative office development. Most demand for office along the Corridor is likely to emerge as an ancillary use to either a hybrid live-work residential product or as a secondary use in a commercial or retail development. Large-scale office development is unlikely to occur outside of a build-to-suit product tied to a specific user.
The one important exception to this will be increasing demand for medical office space. The heavy concentration of patient care facilities within the Corridor between the regional hospital and the Kaiser Permanente facility, offers a comparative advantage to the corridor for the development of medical office. Specialized demand for new medical office space is anticipated to grow in the near-term as more households gain access to healthcare through the restructuring of the national health insurance market created by the Affordable Care Act. As more households gain access to medical services, demand for outpatient medical office facilities is anticipated to grow. Sites with close access to hospitals and medical centers are advantageous locations to site these uses.

The Nason Street Corridor Plan Existing Conditions Report | 5-28
TABLE 5.14 OFFICE LEASE RATES Q2 2014
Total inventory
Total Vacancy
Vacancy Prior Qtr.
Net Absorption
YTD
Ave. Asking Rents
Chino / Chino Hills 345,852 14.00% 14.70% 14,600 $2.29
Coachella Valley 1,003,715 12.60% 13.50% 23,500 $1.55
Corona 1,683,183 18.70% 18.40% -4,500 $1.76
Murrieta / Temecula 1,391,857 20.30% 20.80% 87,500 $1.41
Ontario 3,585,643 23.50% 23.60% 93,500 $1.69
Rancho Cucamonga 2,916,656 12.60% 13.20% 5,200 $1.61
Riverside / Moreno Valley 4,805,685 16.10% 16.70% -7,600 $1.87
San Bernardino 4,783,551 21.60% 22.40% 2,600 $1.47
TOTAL 20,516,142 18.50% 19.00% 214,800 $1.65
Source: Colliers and MR+E
TABLE 5.16 OFFICE LEASE RATES
Moreno Valley Riverside Co.
2014* $12.20 $16.64
2013 $11.25 $15.95
2012 $10.33 $15.94
2011 $19.36 $16.75
2010 $18.26 $17.55
2009 $18.21 $19.53
2008 $19.56 $22.32
2007 $22.59 $23.51
2006 $22.86 $23.70
.

The Nason Street Corridor Plan Existing Conditions Report | 5-29
Industrial Moreno Valley is playing an increasingly important role in the Inland Empire's transportation logistics industry. Recent major investments such as the new Amazon distribution hub, illustrate the strength of this sector locally. As locations with freeway access further to the west in the Inland Empire become developed, the two freeway corridors in Moreno Valley, SR-60 and I-215, will become increasingly desirable as for sites new warehouse and logistics development. Opportunities for industrial development with freeway access are available outside of the corridor study area North of SR-60. In addition other parts of the city including areas fronting I-215 and adjacent to March Air Reserve Base, are likely to be seen as more attractive for industrial development than the Corridor. The presence of large-scale industrial development may create land-use conflicts with the overall goals and objectives for establishing community character along the Corridor. However, industrial demand in the broader Moreno Valley market is likely to increase in strength as general economy continues to grow and national consumer demand stabilizes and increases. Data for industrial lease rates are presented on Table 5.17, and Table 5.18 which show industrial lease rates from 2006 to the first half of 2014. Current rates in Moreno Valley are significantly less expensive than the Riverside County average which is an important factor driving new industrial projects in the community.
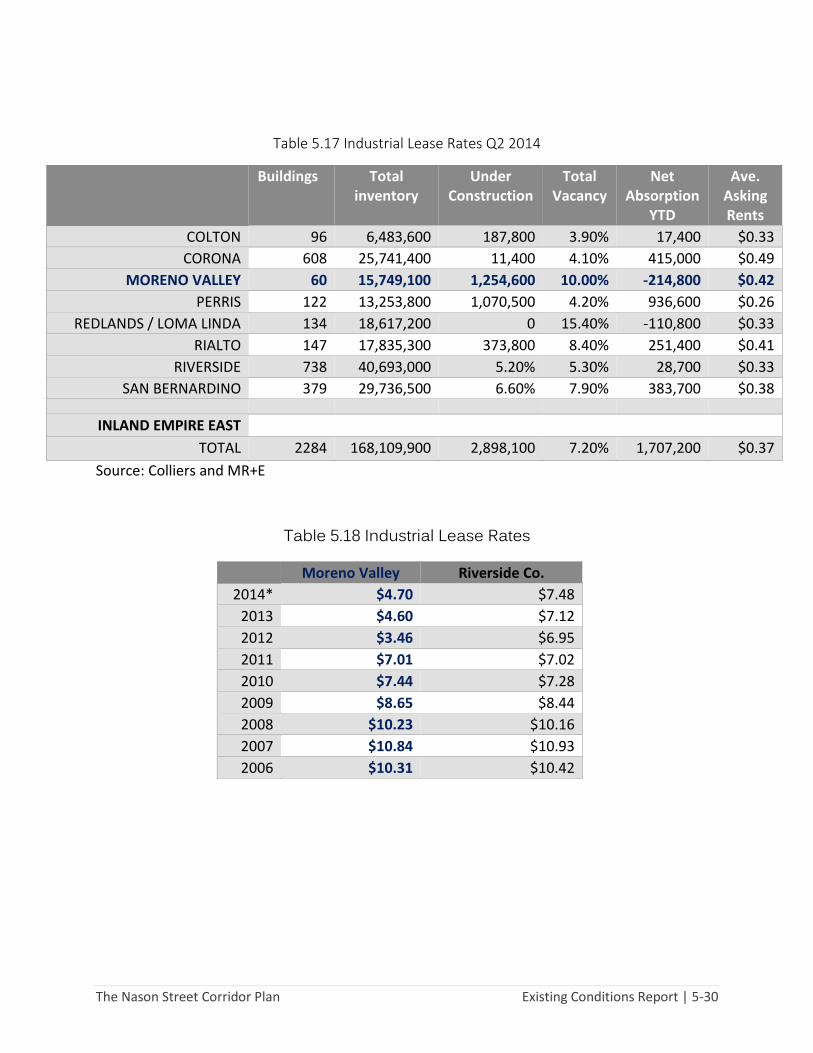
The Nason Street Corridor Plan Existing Conditions Report | 5-30
Table 5.17 Industrial Lease Rates Q2 2014
Buildings Total inventory
Under Construction
Total Vacancy
Net Absorption
YTD
Ave. Asking Rents
COLTON 96 6,483,600 187,800 3.90% 17,400 $0.33
CORONA 608 25,741,400 11,400 4.10% 415,000 $0.49
MORENO VALLEY 60 15,749,100 1,254,600 10.00% -214,800 $0.42
PERRIS 122 13,253,800 1,070,500 4.20% 936,600 $0.26
REDLANDS / LOMA LINDA 134 18,617,200 0 15.40% -110,800 $0.33
RIALTO 147 17,835,300 373,800 8.40% 251,400 $0.41
RIVERSIDE 738 40,693,000 5.20% 5.30% 28,700 $0.33
SAN BERNARDINO 379 29,736,500 6.60% 7.90% 383,700 $0.38
INLAND EMPIRE EAST
TOTAL 2284 168,109,900 2,898,100 7.20% 1,707,200 $0.37
Source: Colliers and MR+E
Table 5.18 Industrial Lease Rates
Moreno Valley Riverside Co.
2014* $4.70 $7.48
2013 $4.60 $7.12
2012 $3.46 $6.95
2011 $7.01 $7.02
2010 $7.44 $7.28
2009 $8.65 $8.44
2008 $10.23 $10.16
2007 $10.84 $10.93
2006 $10.31 $10.42

The Nason Street Corridor Plan Existing Conditions Report | 5-31
Retail Despite a significant inventory of retail space, Moreno Valley is a net sales tax exporter. This means that Moreno Valley residents, on a net basis, spend more money outside of the city than either the state or county average. Table 5.19 shows the sales tax per capita expenditures for the state and county compared to Moreno Valley. The one category where Moreno Valley approaches a fair share capture basis as general merchandise. This is a reflection of the presence of a large number of community oriented large-format retailers in the market. Examples include retailers such as Kohl’s, Target, and Walmart are present within the Corridor. Retail sales in the city peaked in 2006 and declined along with the state and the county after the beginning of the recession. However, retail sales rebounded quicker in Moreno Valley than the region and the state. Table 5.20 shows this data while Figure 5.5 shows the trend in retail sales Indexed 2002.
There are vacancies within the Corridor, generally speaking they are in smaller 2,000 to 10,000 sq. ft. spaces in community scale retail centers. At present one anchor space, a former Best Buy store is available for lease within the Corridor. Retail lease rates are shown on Table 3.21. Moreno Valley lease rates are roughly equivalent with the county average, which is reflective of the relative balance in the vacancy rates that are being experienced in the city and Corridor.

The Nason Street Corridor Plan Existing Conditions Report | 5-32
Table 5.19 Retail Sales, 2012
California Riverside Co Moreno Valley Variance
Sales Per Sales Per Sales Per Moreno Valley
(x$1,000) Capita (x$1,000) Capita (x$1,000) Capita to State to County
Motor Vehicle and Parts Dealers
61,547,848 1,625 3,493,098 1,563 205,299 1,062 -34.7% -32.1%
Furniture and Home Furnishings Stores
9,937,187 262 441,649 198 16,927 88 -66.6% -55.7%
Bldg. Matrl. and Garden Equip. and
Supplies
27,438,083 724 1,364,513 611 85,822 444 -38.7% -27.3%
Food and Beverage Stores
24,511,714 647 1,356,148 607 84,447 437 -32.5% -28.1%
Gasoline Stations 58,006,168 1,532 3,516,040 1,574 199,696 1,033 -32.6% -34.4%
Clothing and Clothing Accessories Stores
32,357,516 854 1,672,482 749 87,871 454 -46.8% -39.3%
General Merchandise Stores
49,996,451 1,320 3,174,022 1,421 255,502 1,321 0.1% -7.0%
Food Services and Drinking Places
59,037,320 1,559 2,668,324 1,194 174,706 904 -42.0% -24.3%
Other Groups 58,540,535 1,546 2,330,392 1,043 75,607 391 -74.7% -62.5%
Total: 381,372,823 10,070 20,016,668 8,959

The Nason Street Corridor Plan Existing Conditions Report | 5-33
TABLE 5.20 SALES TAX TREND (X$1000)
Year California Riverside County Moreno Valley Percent Share
2012 381,372,823 20,016,668 1,185,877 5.9%
2011 355,518,038 18,576,285 1,172,223 6.3%
2010 393,259,857 23,152,780 1,067,546 4.6%
2009 375,965,447 22,227,877 1,018,353 4.6%
2008 357,318,427 26,003,595 1,064,374 4.1%
2007 387,025,102 29,023,609 1,170,236 4.0%
2006 389,066,572 29,816,237 1,218,440 4.1%
2005 375,808,125 28,256,491 1,110,612 3.9%
2004 350,172,688 25,237,148 1,030,203 4.1%
2003 320,217,054 21,709,135 905,801 4.2%
2002 301,612,306 19,498,994 812,229 4.2%
FIGURE 5.5 SALES TAX INDEXED TO 2002
80%
90%
100%
110%
120%
130%
140%
150%
160%
20122011201020092008200720062005200420032002
California
Riverside County
Moreno Valley

The Nason Street Corridor Plan Existing Conditions Report | 5-34
Table 5.21 Retail Lease rates
Moreno Valley Riverside Co.
2014* $16.10 $17.27
2013 $15.25 $16.91
2012 $17.89 $17.28
2011 $18.76 $18.60
2010 $19.53 $20.07
2009 $21.29 $22.79
2008 $23.29 $25.61
2007 $23.25 $26.25
2006 $19.58 $23.70
5.7 Conclusions The demographics of the Corridor can best be described as being made up of younger families with midrange incomes living in single-family detached homes. The economy of the region has been significantly impacted by the twin economic shocks of the 2007 recession and 2008 financial crisis. Housing values are beginning to stabilize and excess inventory that was generated through foreclosure and decreased absorption has largely been worked through and the area should begin to experience modest increases in new residential development. The key factors driving this include low interest rates that help subsidize construction and borrowing along with an improving employment market. Neighborhood development can be anticipated to continue along the Nason Street corridor and as the housing market tightens, residential rental rates can also be anticipated to increase. In the intermediate future, as the residential market continues moving towards equilibrium, residential rental rates are likely to become high enough to induce multifamily residential development. Sites that are located near employment centers or have access to transit will be particularly desirable as locations for new multifamily development.

The Nason Street Corridor Plan Existing Conditions Report | 5-35
Opportunities for commercial development are likely to be driven by employment growth. In particular, the prominent role of medical facilities and health services should stimulate demand for associated uses including medical office. This demand is likely to be supported in the community as more people gain access to healthcare services. Current rental rates for general office, along with high regional vacancy rate, suggest that demand for spec office is unlikely to be significant in the Corridor in the intermediate future. Retail development, which is supported by households in the market area, has room for growth. The current mix of retail offerings, both along the Nason Street corridor and in Moreno Valley as a whole, are not sufficiently competitive to attract a fair share community spending. Retail opportunities, in categories other than general merchandise, could successfully be induced to locate in the Corridor provided adequate sites are identified and that household incomes in the market area are seen as a stabilizing with opportunities for growth in the future.
The Nason Street Corridor Plan Existing Conditions Report | 5-36
PAGE INTENTIONALLY LEFT BLANK

The Nason Street Corridor Plan Existing Conditions Report | 6-1
6. Summary This existing conditions analysis indicates that the Corridor presents a unique opportunity to develop this important part of Moreno Valley from its current “adolescent” pattern of auto-centric, relatively disconnected collection of individual development projects into a mature set of well-connected, sustainable neighborhoods.
Currently, less than half of the land in the Corridor has been developed. But existing land use designations support a diverse mix of residential, commercial, and public uses along the Corridor. One of the greatest opportunities is the significant portion of vacant land which creates the potential to make lasting change in mobility, health, and economic development.
The vacant property includes opportunities for infilling with a range of housing types and neighborhood-serving commercial and civic amenities will be presented. Such infill neighborhoods offer both the chance to provide housing and lifestyle options not currently available in this area, as well as the possibility generating new centers of social, commercial and civic activity that are easily accessible by a range of travel modes to residents of the existing neighborhoods in the Corridor.
There are several challenges to improving mobility in the Corridor. Establishing complete and multi-modal connections, particularly with the existing built environment, which is currently dominated by traditional suburban neighborhoods and large commercial parking lots will be a challenge for the Corridor Plan. Current bicycle and pedestrian infrastructure, including sidewalks and bicycle lanes, are inadequate. Sidewalks are nonexistent in several areas and lack uniformity in design, and bicycle lanes are insufficient and disconnected. However, the implementation of the City of Moreno Valley’s Draft Bicycle Master Plan proposes substantial improvements to bicycle infrastructure in the Corridor. Also,
The Nason Street Corridor Plan Existing Conditions Report | 6-2
proposed roadway widening in the Corridor, creates an opportunity to include other improvements such as pedestrian, bicycle, and transit amenities. Currently, the transit service for the Corridor is low, and existing bus stop facilities lack benches and shelters. The Riverside Transit Agency projects low transit demand in the Corridor, which poses a challenge to improving transit services and implementing new routes; however, future RTA plans include transit improvements along the corridor as well as potential BRT service. An evolved design for Nason Street will be developed with an aesthetic urban form the compliments existing use and design and that will accommodate connected pedestrian, bicycle and transit facilities. Complete streets recommendations will also be provided for existing and future crossing and side streets within adjoining neighborhood.
A recovering economy will impact development in the Corridor. Low interest rates and improved employment, as well as the Corridor’s proximity to employment centers, may encourage multifamily residential development. Current retail development, which is supported by households in the market area, may not fully capture the community’s fair share of spending; the Corridor is posted to attract and support additional retail establishments. Moreover, the prominent role of medical facilities and health services should stimulate demand for associated uses including medical office.
The Corridor Plan will define patterns, strategies, conceptual designs, and recommendations that can inform updated development standards so as to coordinate further public and private improvements to deliver a more unified multimodal corridor, and more walkable, bikable, sustainable neighborhoods and centers well-connected to it.
Most important of all is the opportunity to evolve the Corridor toward a mature, complete set of neighborhoods and centers, where driving becomes a freedom of choice rather than a necessity for survival, and where healthier, more active, outdoor oriented lifestyles for children and families are well-supported by the environment in which they live, work, shop and play.