Embed Size (px)
Citation preview

8/8/2019 NASA TN D-2402 Effects of High Altitude Explosions
http://slidepdf.com/reader/full/nasa-tn-d-2402-effects-of-high-altitude-explosions 1/38
N A S A T E C H N I C A L N O T E
cy0*c;r
nIzc
4w8
4z
N A S A
,-. , I 1 .
T N D-2402- --
-A
THE EFFECTS OF
HIGH ALTITUDE EXPLOSIONS
by Wilmot N. Hess
Goddard Space Flight Center
Greenbelt, Ma!
NATIONAL AERONAUTICS AND SPACE ADM INISTRA TION WASHINGTON, D. C . SEPTEMBER 1964
8/8/2019 NASA TN D-2402 Effects of High Altitude Explosions
http://slidepdf.com/reader/full/nasa-tn-d-2402-effects-of-high-altitude-explosions 2/38
THE EFFECTS OF HIGH ALTITUDE EXPLOSIONS
By Wilmot N. He ss
Goddard Space Flight Center
Greenbelt , Md.
N A T I O N A L A E R O N A U T IC S A N D S P A C E A D M I N IS T R A T I O N
For sale b y the Office of Technical Services, Department of Commerce,
Washington, D.C. 20230 - - Price $1.00

8/8/2019 NASA TN D-2402 Effects of High Altitude Explosions
http://slidepdf.com/reader/full/nasa-tn-d-2402-effects-of-high-altitude-explosions 3/38
THE EFFECTS OF HIGH ALTITUDE EXPLOSIONS
by
Wilmot N. H e s s
Goddard Space Flight Center
S U M M A R Y
High altitude nuclea r explosions have helped cons iderab ly in
our understanding of the natural radiation belts. The Argus arti-
ficial radiation belt made in 1958 gave information on the stability
of p arti cle o rbit s. The Starfis h artifi cial belt gave quantitative
information on electron lifetimes not available any other place.
Below L = 1.7 the electrons have a long life and apparently are
lost only by coulomb scattering on the atmosphere. Above L = 1.7
the lifetime shortens abruptly and some non-atmospheric p roce ss
dominates. Synchrotron radiation and au ro ra were al so observed
after Starfish. There are some interesting questions left about
how the Sta rfis h el ect ron s got whe re they did and why they have
the sp ectr a observed.
i

8/8/2019 NASA TN D-2402 Effects of High Altitude Explosions
http://slidepdf.com/reader/full/nasa-tn-d-2402-effects-of-high-altitude-explosions 4/38

8/8/2019 NASA TN D-2402 Effects of High Altitude Explosions
http://slidepdf.com/reader/full/nasa-tn-d-2402-effects-of-high-altitude-explosions 5/38
CONTENTS
Summary .................................. i
INTRODUCTION ............................. 1
A BOMB AS A SOURCE OF CHARGED PARTICLES 2
THE NEUTRON SOURCE ....................... 4
PARTICLE MOTION 6
EARLY HISTORY OF STARFISH. 9
SYNCHROTRON RADIATION ..................... 9
SATELLITE DATA ON STARFISH.. . . . . . . . . . . . . . . . 11
RADIATION DAMAGE ......................... 15
EF FE CT S ON THE NATURAL RADIATION BE L T . . . . . . 18THE SOVIET HIGH ALTITUDE EXPLOSIONS . . . . . . . . . 18
CHANGES OF THE ELECTRON ENERGY SPECTRUMWITH L ................................ 19
DECAY OF THE ELECTRONS .................... 24
....
........................... . . . . . . . . . . . . . . . .
L < 1.7 ............................... 25
L > 1.7 ............................... 28
References ................................. 29
iii

8/8/2019 NASA TN D-2402 Effects of High Altitude Explosions
http://slidepdf.com/reader/full/nasa-tn-d-2402-effects-of-high-altitude-explosions 6/38
THE EFFECTS OF HIGH ALTITUDE EXPLOSIONS*
Oct. 22, 1962
Oct. 28 , 1962
Nov. 1, 1962~
byWilmot N. Hess
Goddard Space Flight Center
Several hundred kt ?
? ?
? ?
Seven artifi cial radiation belts have been made by the explosion of high alti tude nuclear bombs
since 1958. These artificial belts re sult f rom the release of e nergeti c charged part icle s, mostly
electr ons, fro m the nuclear explosions. The se seven explosions are:t
Explosion
Argus I
Argus 11
Argus ID
Starfish
USSRS
USSR
USSR
__
Locale
South Atlanti c
South Atlantic
South Atlantic
Johnson Island,
Pacific Ocean
Siberia
Siberia
Siberia~ .-
Time
1958
1958
1958
July 9, 1962
Yield 1 Altitude
l k t
l k t
l k t
300 miles
300 miles
300 milesII 400
1 .4 Mt
The Argus explosions of 1958 wer e car rie d out to study the trapping of energetic particle s by
the earth's magnetic field. Nicholas Christofolis , a physicist at the Lawren ce Radiation Laboratory,
had for s ome time before Argus worked on Pr oje ct Sherwood-the attemp t to make controlled
thermon uclear reactio ns in laboratory containers. To contain the intensely hot ma ter ia l used in
the Sherwood expe riment s, no wal ls ca n be used; they would melt. Magnetic fields , shaped into
"magnetic bottles" to contain the particles, are used. Such a bottle as that used in Figure 1 has
been used suc cessfu lly to contain hot elec tron s and protons for sh ort times. The par tic les eventu-
ally leak out of the magnetic bottle, mostly through the ends, but they are contained for a time.
*To be publ i shed a s a cha pter in"Spa ce Ph y s ic s ," edi ted by Do nald P. LeGa l ley a nd Ala n Ro sen (publ i sher , J ohn Wiley & So ns , Inc . ) .t T h e U. S. ex plo s io ns Tea k a nd Ora ng e in the Pa c i f ic (be lo w 8 km) in 1758 ma y ha v e injec ted so me pa r t ic le s , but the e f fec t s here
were small and short-l ived. Another reported USSR high alt itude explosion of 1961 ma y ha v e pro duced so me e f fec t s , but th i s is
uncertain.$ Ato mic Energ y Co mmiss io n press re lea ses o f Oct . 2 2 a nd No v . 1 , 1 9 6 2 .

8/8/2019 NASA TN D-2402 Effects of High Altitude Explosions
http://slidepdf.com/reader/full/nasa-tn-d-2402-effects-of-high-altitude-explosions 7/38
MAGN ETIC FIELD LINE
P l A S M AI
FIELDC O I L
Figure 1-A magnetic bott le .
Christofilos took thi s idea for a laboratory-
si ze magnetic bottle and expanded it to earth
size. He suggested that the earth's magnetic
field should be abl e to contain and tra p en er-
getic particles, and showed that a nuclear
explosion would be a reasonable source of
particles to populate the terrestrial bottle
(Reference 1). This suggestion led to the
Argus experiments.
The planning for Argu s was well underway
before th e dis covery by Van Allen of the natu-
ral radiat ion belt. In the Argus planning sessions it had been suggested that a natura l belt might
exist around the earth , which w a s of cou rse borne out by the Ex plo rer I (1958 ( ~ 1 )nd Explorer 111
(1958 y l ) satellites. After each of the Argus explosions, tra pped part icl es wer e observe d by
Van Allen on the Expl orer IV (1958 €1) satellite (Reference 2).
Th e Starf ish explosion of July 9, 1962, was of h igher yield than Argus and made not only a
mor e intense art ificial belt but a considerably mo re extensive belt. Thi s belt is of longer life than
the Argus belts because it is at a lower latitude.
The t hre e Soviet explosions of 1962 made artificial belts somewhat less intens e than Starfish.
These also were at high enough latitude so that they decayed rat he r rapidly. The se thr ee belts had
different sp atial extents, maybe indicating differen t altitudes fo r the explosions.
A BOMB AS A SOURCE OF CHARGED PARTICLES
What is there about a nuclear explosion that makes an arti fici al radiation belt? The radiation
belts, both natural and artific ial, a r e simply larg e populations of charged part icl es trapped by th e
earth's magnetic field to s tay for long time s near the earth. The natural belts ar e made up mostly
of energe tic electrons and proto ns plus sm all number s of de uteron s and tritons , and possibly som e
alpha part icles and positrons as well. The artif icia l belt s ar e made up mostly of elect ron s with
som e protons, and maybe som e of the oth er par ticl es. oo.
There are two kinds of nuclear explosions: fis sion , and fusion. The-basic e lement of a-fis-sion
reaction is the cap ture of a neutron by a heavy element, frequently U235which then fissions, or
splits, into two lighter nuclei or fission fragments (Reference 3). In this proce ss two or three
neutrons are given off, of which about one pe r event may escap e fr om the fissioning system. Theneutron can produce trapped par tic les by decaying into a proton and an electron. At the tim e of
fission, s ev era l gamma ray s of roughly 1 Mev each are given off. Th ese might produce some
trapped electrons as the res ul t of Compton sca tte rin g on air atoms, but the trapped flux of electrons
produced by this p roce ss is probably sm al l enough to be neglected. Some alpha particles are also
given off by te rn ar y fissio n. About 1 in 300 fissio ns prod uces an alpha par ticl e of f ro m 5 to
2

8/8/2019 NASA TN D-2402 Effects of High Altitude Explosions
http://slidepdf.com/reader/full/nasa-tn-d-2402-effects-of-high-altitude-explosions 8/38
25 MeV.
system before they are slowed down to rest , but so me of them may wind up trapped.*
It is uncertain whether any of these alpha par tic le s will get out of t he fissioning
After the fission proc ess is over, more charged particles are given off. The fis sion fra g-
men ts produced are unstable (they a r e neutron rich ), and they decay by emitting electr ons to be-
come stable. One fission fragment emit s about six electro ns to become stable. These elec tronsare the most important sou rce of all the arti fic ial belt s produced. They have en ergi es up to about
8 Mev with an ave rage energy of about 1 MeV. They can be re le as ed a long distance fro m the
bomb because the fission fragment decay proc ess is rel atively slow. About one electron is given
off in the first second afte r fissi on, and the other five are given off with a decay law.
Ne = N,(O) t - ’ .2 ,
where t is in seconds. So ele ctro ns a r e still being given off minutes to hours after the explosion.
If the fis sion frag men ts expand with a velocity of about 500 km/sec, electr ons can be liberated up
to IO6 km a w a y from the explosion site. But probably the expanding fission fragments are mostly
ionized (Reference 4), and they will be trappe d by the earth ’s magnetic field and cannot get nea rly
this far away from the explosion.wr
Th ere a lso may be som e posit rons given off by radioact ive debri s after the explosion. One
pro ce ss that would cause this would be (n, 2 n ) reactions; for example,
The nucleus Ae 26 decays by posit ron emission. Thi s probably is not a very important partic le
source.
A fusion bomb works by burning hydrogen to make helium. The end products a r e not radio-
active, but some intermediate s teps in the reaction produce charged particl es that can be trapped.
Deuterium and tritium are involved in the fusion proc ess . Some triton s may be left after the re-
action, but they probably a r e of quite low energy and are not interesting as f a r as radiation belt s
a r e concerned. Neutrons a r e produced by both (d , d) and (d , t ) reactions. The neutrons fro m
(d , d) reacti ons a r e of about 3 MeV, and those f rom (d , t ) reactions are of 14 MeV. When these
neutron s decay, they make el ect ron s and al so protons of 3 o r 14 MeV, too; but, as we shall see, the
yield of this reaction is quite small.
A fusion or hydrogen bomb explosion will produce a quite insignificant arti fic ial radia tion belt
compared with fiss ion o r an atom bomb explosion of the s am e yield. The electro ns from fissi onfragment /3 -decay are the most important source of p arti cle s for artific ial radiation belts.
-* T i l I e s , D ., “O n the Po ss ibi l i ty o f Alpha Pa r t ic le s in the Art i f i c ia l Ra dia t io n Be l t , ” submit ted to J . C e o p h y s . Res.
3
8/8/2019 NASA TN D-2402 Effects of High Altitude Explosions
http://slidepdf.com/reader/full/nasa-tn-d-2402-effects-of-high-altitude-explosions 9/38
THE N E UTR O N S OURCE
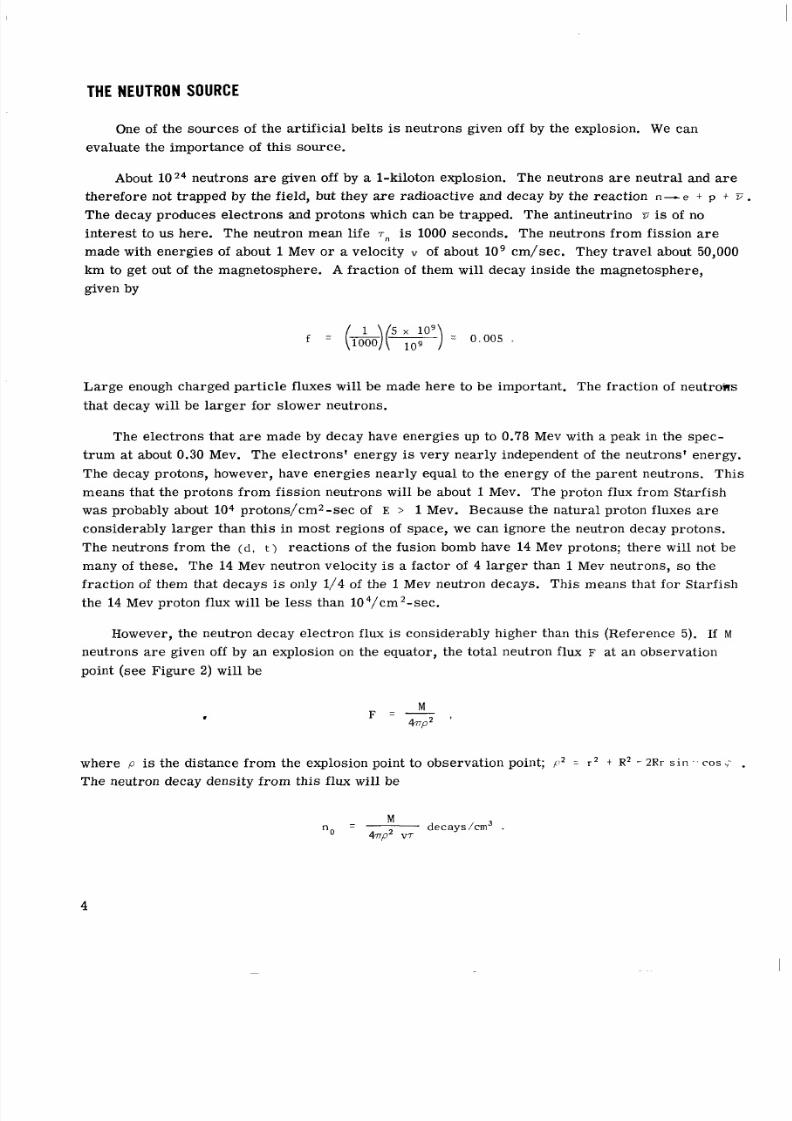
One of the s our ces of the a rtif icia l belts is neutrons given off by the explosion. W e can
evaluate the importa nce of this source.
About neutrons are given off by a 1-kiloton explosion. The neutrons are neutral and are
ther efor e not trapped by the field, but they a r e radioactive and decay by the reaction n--e + p + F .The decay produces el ectr ons and protons which can be trapped. The antineutrino v is of no
inte rest to us here. The neutron mean life r n is 1000 seconds. The neutrons from fissio n are
made with ene rgi es of about 1 Mev or a velocity v of about l o 9 cm/sec . They tr av el about 50,000
km to get out of the magnetosphere. A frac tion of them will decay inside the magnetosphe re,
given by
f = (&)(T) s109 = 0.005
Lar ge enough charged par tic le fluxes will be made her e to be important. The fraction of neutrofis
that decay will be larger for slower neutrons.
The electrons that are made by decay have energies up to 0.78 Mev with a peak in the spec-
tru m a t about 0.30 MeV. The electro ns’ energy is very nearly independent of the neutrons’ energy.
The decay protons, however, have en ergi es nearly equal to the energy of the parent neutrons. This
means that the protons fr om fissi on neutrons will be about 1 MeV. The proton flux from Star fi sh
was probably about 104 protons/cm2-sec of E > 1 MeV. Because the natural proton fluxes a r e
considerably large r than this in most regions of space, we can ignore the neutron decay protons.
The neutrons fro m the ( d , t ) react ions of the fusion bomb have 14 Mev protons; there w i l l not be
many of thes e. The 14 Mev neutron velocity is a fac tor of 4 larger than 1 Mev neutrons, so the
fraction of them that decays is only 1/4 of the 1 Mev neutron decays. Thi s means that for Starfish
the 1 4 Mev proton flux will be less than 104/cm2-sec.
However, t he neutron decay el ect ron flux is considerably higher than this (Reference 5). If M
neutrons are given off by an explosion on the equator, the tot al neut ron flux F at a n observation
point (see Figure 2) will be
*M
F = -
where p is the distance from the explosion point to observation point; p 2 = r z + R 2 - 2 R r s i n . . co s .; .The neutron decay density from this f l u x will be
Mdecays/cm3
“0 = 4rrp2 vr
4

8/8/2019 NASA TN D-2402 Effects of High Altitude Explosions
http://slidepdf.com/reader/full/nasa-tn-d-2402-effects-of-high-altitude-explosions 10/38
The explosion is a point source, but the part icl es will spr ead out in longitude by drift to form a
shell. We can average the decay density in longitude
Thi s space-averaged neutron decay density can be transformed directl y to be an electro n omni-
directi onal flux distribution in space.
If we have a neutron so urc e above the atmos phere, we must consid er not only neutrons
travel ing upwards away fro m the explosion but albedo neutrons fr om the top of the atmosphere.
About 80 pe rce nt of the downward trave ling neutrons will be refle cted fr om the atmosp here and then
tra vel upwards. In the reflection process the neutrons will be partly thermalized by collisions with
air nuclei. As a result of this, the rate of decay of these neutrons will be higher and actually more
total de cays will re su lt from the initially downward moving neutrons than fro m the upward moving
ones. By car ryin g out these c alculations and normalizing crudely to the Starfis h explosion (Refer-
ence 5), we get the s patial dist ributio ns of electr ons shown i n Figure 3. The calculations have been
made with and without albedo, and the impor-
tance of albedo in Figure 3 is obvious. Elec-
tron fluxes up to about l o 7 electrons/cm* -sec NO ALBEDO
~ WITH ALBEDO
Y
Figure 2-The geometry of th e po int source of neutrons
/ eo= 60'
/ ,/#:e---
/I
I eo = 40'
I I II I20 30 40 50 60 70 80 3
8 (degrees )
Figure 3-The calculate d in it i al electron f luxes from
neutron decay from Starfish, wi th and without albedo
from t he top o f the atmosphere (from Reference 5).
Dif ferent f ield l ines are ident i f ied by their earth sur-
face colatitudes 0,.
5

8/8/2019 NASA TN D-2402 Effects of High Altitude Explosions
http://slidepdf.com/reader/full/nasa-tn-d-2402-effects-of-high-altitude-explosions 11/38
are expected fr om neutron decay from Starfish. Thes e are initial fluxes and w i l l , of course,
decay with time. Thi s flux is not negligible, but it is concealed by the considerably larger flux of
fission electrons.
PARTICLE MOTION0
We need to understand th e motion of char ged pa rt ic le s in a magnetic field in order to under-
stand how an artificial belt of pa rti cle s surrounding the ear th is made from a point source explo-
sion. For the par tic les of in ter es t to us, we can break this motion down into three components
(see Figure 4):
(1 ) A rapid gyration of the part icl es around the field line,
(2 ) A bouncing back and for th along a field line fro m one hemisphere to the othe r, and
(3) A slow drift in longitude around the earth.
The gyration period or cyclotron period of an electron in the eart h's field is roughly a microsecond.
The bounce period is of the ord er of 1 second.
Fig ure 4 - h t i o n of charged particles in a dipole magnetic field.
6
8/8/2019 NASA TN D-2402 Effects of High Altitude Explosions
http://slidepdf.com/reader/full/nasa-tn-d-2402-effects-of-high-altitude-explosions 12/38
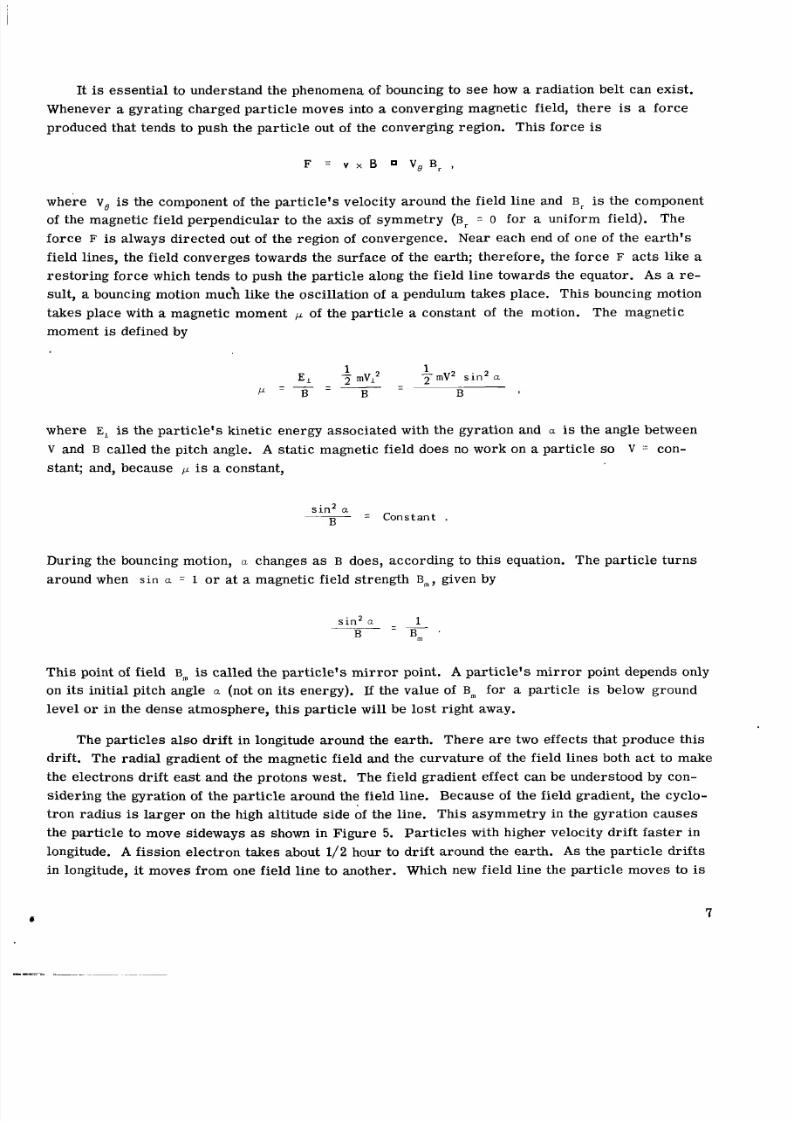
It is essenti al to understand the phenomena of bouncing to see how a radiation belt can exist.
Whenever a gyrating charged particle moves into a converging magnetic field, there is a force
produced that tends to push the particl e out of the converging region. Thi s forc e is
F = v x B V , B r ,
where V, is the component of the particle's velocity around the field line and Br is the component
of the magnetic field perp end icu lar to the axis of symmetry (B, = 0 for a uniform field).
force F is always directed out of the region of convergence. N e a r each end of one of the ea rth' s
field lines, the field converges towards the su rfac e of the earth; therefore, the force F acts like a
res tor ing forc e which tends to push the part icl e along the field line towar ds the equator. As a re-
sult, a bouncing motion mu6h like the o scill ation of a pendulum takes place. Th is bouncing motion
takes place with a magnetic moment l-L of the pa rti cle a consta nt of the motion. The magne tic
moment is defined by
The
where E, is the particl e's kinetic energy associate d with the gyration and a is the angle between
V and B called the pitch angle. A static magnetic field does no work on a particle S O
stant; and, because p is a constant,
V = con-
sin2 a~- - Constant .
B
During the bouncing motion, a changes as B does, according to this equation. The part icle tu rns
around when sin a = 1 o r at a magnetic field strength Bm, given by
sin2 a - 1
R Bm
Th is point of fie ld Bm is called the particle 's mi rr or point. A particle's mirror point depends only
on its initial pitch angle a (not on its energy). If the value of Bm for a particle is below ground
level or in the dense atmosphere, this particle will be l ost right away.
The part icle s also drift in longitude around the earth. The re are two eff ect s that produce this
drift. The radi al gradient of the magnetic field and the cu rvat ure of th e field line s both ac t to make
the electrons drift east and the protons west. The field gradient effect can be understood by con-
sider ing the gyra tion of t he pa rti cle around the field line. Because of the field gradient, the cyclo-
tron radius is lar ge r on the high altitude sid e of the line. This as ymm etry in the gyration cau se s
the particle to move sideways as shown in Figure 5. Pa rti cle s with higher velocity drift faster in
longitude. A fission electr on takes about 1 /2 hour to d rif t around the eart h. As the particle dri fts
in longitude, it moves from one field line to another. Which new field line the part icle moves to is
7

8/8/2019 NASA TN D-2402 Effects of High Altitude Explosions
http://slidepdf.com/reader/full/nasa-tn-d-2402-effects-of-high-altitude-explosions 13/38
MAG NETIC FIELD STRENGTH 82
/x x x x x x x x x x x x x x x x x x x x x x x x x x x
X
X
X
X
X X X X X X X X X X X X X X
\MA GN ETI C FIELD STRENGTH B1
( 82 > B1 ; therefore, R1 > R2.)
Figure 5-Drift of a charged particle in a magnetic field with a gradient.
determi ned by the fac t that
is a constant of the motion (where the integ ral is taken along a field line from one mir ro r point Bm
to the other Bm*). Actually, I is only an adiabat ic constan t of the motion. If B changes in a time
sho rt com pared with the bounce time, then I is not a constant. The magne tic moment is also
only an adiabatic constant of the motion.
The integral invariant I is a kind of weighted length of th e field l ine between B~ and B ~ * As
the particle d rift s from one field line to a new one, the va lue of Bm at the mirror point stays con-
stant because /L is a cons tant of the motion. Also, I rema ins constant during the drift, so th e
length of the field line from Bm to Bm* rema ins constant. As the par tic le drift s in longitude around
the earth, only one se t of field lines will satisfy these co nstraints and the particle will r etur n to the
line it st ar te d on, McIlwain ha s introduced a parameter L to label such a shell of fi eld lines. In a
dipole field, L would be the distance from the center of the ear th to the equatorial crossin g of th e
field line in units of ea rth radii. The shell L = 2 would go to 6370 km altitude at the equator. For
the re al field of th e earth, which va ri es considerably from a dipole, the definition of L is more
complicated. However, the L = 2 shell still has an aver age eq uato rial altitude of about 6370 km,although it var ies about *500 km from this.
W e now can understand what happens to par tic les emi tted at one point in space by a nuclear
explosion. In a f e w seconds they are spre ad out along a field line, and in a few hours they drift
around the ear th and s prea d out in longitude to form a blanket around the earth. The thickness of
the blanket depends on the initial dimensions of the parti cle source.
8

8/8/2019 NASA TN D-2402 Effects of High Altitude Explosions
http://slidepdf.com/reader/full/nasa-tn-d-2402-effects-of-high-altitude-explosions 14/38
EARLY HISTORY OF STARFISH
We now have an idea about what should happen to the par ti cle s fr om a n explosion. Le t us see
what the obs ervation s show after the Starfi sh explosion of Ju ly 9.
Magnetic and elec tromagne tic signa ls and a whistl er rad iated by the explosion wer e observ ed
at several places (References 6, 7, 8, and 9). These may play a pa rt in the arti fici al belt; they mayinte ract with part icl es in the natu ral belt, and either change their energy or sc att er them and change
thei r pitch angle. Thes e changes in the naturally trapped part icle s may produce some of the ob-
serv ed effects.
Just seconds after the explosion, a rtif icia l auro ras w ere obse rved in New Zealand (Reference
10). These are produced by the elec tron s and other part icle s from the explosion that a r e not
trapped. Becaus e lots of the se par tic les have mi rr or points below the atmosphere, they will enter
the atmo sphere and inte ract with oxygen and nitrogen atoms . The excited atoms will emi t light to
for m the auror a. Rockets have been flown into natural au ro ra and energeti c elec tron s found, so
this proces s of electrons making aur ora s is well established.
Ju st 2 seconds after the explosion, inc reas ed ionospheric absorption of cosmic radi o noise w a s
observed in Alaska (Reference 11) at L * 6 . This is probably due to debris from the explosion
traveling upwards to these field lines and relea sing electrons p -decay, some of which promptly a r e
los t into the atmosp here. The incr ease d ionospheric electro n densities produced th is way would
enhance the cosmic noise absorption. The peak absorption w a s detected within 1minute aft er the
explosion, followed by recovery to normal in a few hours. Attenuation like this was not obse rved
in the U. S. at the sam e distance as Alaska or in the a urora l region in Canada or Norway, so the
effect is clearly associated with ea rly time-effects of charged parti cle s from the explosion.
A few minutes af ter the explosion incr eased, f m i nw a s observed on an ionosonde in Jamaica
(Referenc e 12), indicating incr ease d absorption i n the lower regions of the ionosphere. Th is mus thave been due to trapped elec tron s drifting east and some of them getting lost as they went.
Topside soundings of the ionosphere on Arie l I, 1962 o 1 (Referen ce 13) also showed increa sed
electron densiti es in the ionosphere above the F, layer shortly afte r the explosion.
Th er e als o will be increas ed electron densities in the region nea r the explosion because of
absorp tion of sof t x r a y s fro m the explosion (as much as half the ene rgy of the explosion may be in
the f orm of these soft x rays ) (Reference 14). But thi s effect will only be line of sight f rom the
explosion and cannot explain the Alaska or Jam aica observations.
SYNCHROTRON RADIATION
A few minutes after Starfish, synchrotr on radiation fro m the trapped elect ron was observed in
P e r u (Reference 15). Th is is the only effect of th e art ific ial radiation bel ts that is observed on the
ground fo r long periods. Synchrotron radiation is the e lect roma gne tic radiation given off when an
9

8/8/2019 NASA TN D-2402 Effects of High Altitude Explosions
http://slidepdf.com/reader/full/nasa-tn-d-2402-effects-of-high-altitude-explosions 15/38
electric charge is accelerated in a circle (Reference 16). It was first observed as light emitted
from a synchrotron electron accelerato r. If the charged par ticle s have V << c , hen the radiation
is emitte d only at the cyclotron frequency and is called cyclotron radiation; but, when the particle
is relativistic, many higher harmonics of th e cyclotron frequency are emitted, too, and the radiation
is called synchrotron radiation. The radio emission of th e planet Jupiter in the 30 cm range is
tentati vely identified as being synchrotron radiation fro m trapped electrons with en ergies in theord er of 5 to 100 Mev (Reference 17).
-
The total power radiate d by a particle by synchrotron radiation is
p = - - e2 (%)I
3 c3
An expr ession that is more useful in comparison with experiments is the power spectru m radiated
in the electrons' orbited plane for a relativi stic electron (Reference 18):
P ( f ) = 4.1 ByF(f) watts/cps-ster ,
where B is the magnetic field strength in gra ms, y is the rela tivistic energy factor E/m,c2, and
F( f) is a function of th e frequency f . Evaluating P( ) at 50 Mc for B = 0.16 gauss and E = 2 Mev
gives P( ) = 4 x watts/cps-ster. Integrating P( f) over the electron spatial distribution and
fission energy sp ectrum fo r Starfish and integrating over antenna patterns gave calculated sky
brightnesses in ve ry good agreement with those measu red shortl y after Starf ish (Reference 19).
Attempts wer e made to observe synchrotron radiation f rom the natu ral Van Allen belt befo re
Starfish, but it could not be me asu red be cause of the background of other natural radio noises.
After the Star fish explosion, synch rotro n radiation w a s observed by seve ral stations. The Bureauof Standards has a radio obse rvato ry in Per u which co ntains about 20,000 dipoles (Reference 15);
this array can study the radio noise coming in a narrow angle from the zenith (which is very nearly
the magnetic equator). The newly trapped electrons f ro m Starfis h produced more synchrotron noise
than the natural belt electrons because ther e were m ore of them and they wer e of higher energy.
The maximum 50 Mc signal at Peru a r r ived at +6 minutes after the explosion. Th is delay time is
compatible with the time r equ ire d for a 2.7 Mev ele ctron to dri ft in longitude fro m the location of
the explosion to Peru. A second peak was seen about 3 5 minutes later because of the elec tro ns
drifting around the world a second time. After this, the noise was nearly constant because the
elec tron s had dispe rsed in longitude because of the ir different velocities. Polari zation meas ure -
ments made at Pe ru with the dipole ar ra y show the radio noise received was roughly east-west
linearly polarized, as is expected fo r synch rotro n radiation.
Several other antennas measured the synchrotron radiation after Starfish (Reference 20). At
Wake Island the maximum s ign al was obtained at +25 minutes. This later arri val than at Peru
shows that electrons d rift east as expected. Thi s delay tim e is right for about 2 Mev electron s.
10

8/8/2019 NASA TN D-2402 Effects of High Altitude Explosions
http://slidepdf.com/reader/full/nasa-tn-d-2402-effects-of-high-altitude-explosions 16/38
Comparing se ve ral rece iving st ati ons shows that only st ation s within 25 degre es of t he mag-
netic equator detected synchrotron radiation. This is reasonable because the radiation is given off
i n the inst antan eous dir ect ion of motion of the electron, and thi s means that larg e sign als should be
found at the equator and the signal should decrease rapidly going off the equator.
Ariel I
Injun
(1961 01)
Telstar I(1 962 A - E ~ )
Traac
(1961 A-772)
Observations at Pe ru showed that the synchrotron n oise deca yed with a time behavior given by
~
1209
1010
5630
1110
where t is the time in days after Starfish. This time decay is not representative of the decay of
the arti ficial radiation belt as a whole because a la rg e fracti on of th e synchrotron noise is given off
by low altitude electr ons where the magnetic field B is large. The se low altitude electrons will be
lo st quite rapidly.
SATELLITE DATA ON STARFISH
On July 10 the re were in orbit four sate llites that had electron de tecto rs on board and gave
use ful information on the newly tra pped partic les.
~~
Perigee (km)
39 3
890
955
951
Inclination (degrees)
54
67
44.7
3 2 . 4
Detectors
Shielded GM counter,
Ee > 4.7 Mev
Shielded GM counter, counting
seve ral Mev electron s bybremsstrahlung
4-channel solid state detector,
Ee > 0 . 2 Mev
Shiel ded GM counte r,
E, > 1 . 6 Mev
The Injun satellite had been in orb it a long time , and so it provided a ve ry good "before-after"
comp ariso n of th e radiation belt. The Tr aa c detector als o showed a good com paris on this way, as
did Ariel I. Unfortunately, Telstar I was launched the day after Starfish, so it could not give a
before-after comparison. Th is is quite unfortunate, because the Te ls ta r satellite goes to high alti-
tudes and maps out region s of spa ce that are unavailable to the othe r satellites.
The joint U. S.-U. K. satellite Ariel I showed that high energy electron s resulting from the
bomb appeared very shortl y after the explosion at high latitudes-up to L = 5 or more (Reference
21). Ariel I went out of operation a week aft er Starfish, but during this time the flux of energetic
ele ctr ons stayed high up to L = 5 .
11

8/8/2019 NASA TN D-2402 Effects of High Altitude Explosions
http://slidepdf.com/reader/full/nasa-tn-d-2402-effects-of-high-altitude-explosions 17/38
The T ra ac dete ctors followed the decay of low altitude Starfish e lectro ns until it also went out
of operation (Reference 22). Tr aa c located a puddle of fissio n deb ris sittin g on top of the atmo s-
ph er e in the Paci fic, continuously emitting elec tron s into the belt (Reference 23). Th es e new elec -
tron s from the debris puddle will have shor t lives, because they are emitted at low a ltitud es and
there fore have low mi rr or points and encounter a fairly dense atmosphere.
By comparin g the measuremen ts of the se ve ra l different det ec tors having different energy
res pon ses , the energy spect rum of the new pa rt ic les was determined. At about 1000 km the spec-
trum closely resem bled a fissi on energy spectru m, thus identifying the decay of fis sion frag ments
as the major particle source (Reference 24).
The Injun co unter s mapped out the new be lt at 1000 km altitude and produced the first flux con-
tour picture of the Starf ish elec trons (Reference 25). The Tel sta r satellite produced al l of the
information above 1000 km for the first thre e months after Star fish (Reference 26). The expe ri-
mental data from Injun and Telst ar fo r a short period after Starfish were organized and plotted. A
comparison of these data is shown in Fi gu re 6. The region of highest flux for t he Injun dat a is
Figure 6- A comparison of the elec tron flux distr ibutio n measured by Telstar I (on the left ) and lnjun (on
the right) shortly after Starfish. Both distributions are arb itra rily cut off at the outside at a flux o f 10’
eIectrons/cm*-sec.
1 2

8/8/2019 NASA TN D-2402 Effects of High Altitude Explosions
http://slidepdf.com/reader/full/nasa-tn-d-2402-effects-of-high-altitude-explosions 18/38
about l o 9 electrons/cm2-sec, and fo r th e Tels tar data the highest value is also about l o 9 electrons/
cm* -sec . The outer edge of both flux dis trib utio ns shown is at a flux of l o 7 electrons/cm2-sec.
These distributions in Fig ure 6 are only approximate and involve some extrapolations in both
cases.* Also they are not for the sa me ti me (Injun is +10 hours and Telst ar is + 5 days), but they
still are fairly ac curate and can be compared reasonably. It is obvious the Injun flux distr ibution
is much m ore compre ssed than is Tel sta r's . The total number of part icl es found by integrating
inside the Injun distribution is about 1 0 2 5 electrons (Reference 28) and inside the Telst ar picture is
about 10 2 6 electrons (Reference 26). This difference is reasonably well un derstood now. We will
return to this point later.
A ma p of the Starfish electron fluxes at 400 km altitude above the earth is shown in Figure 7.
These ar e the fluxes as of one week after Starfi sh. They have decayed probably about a fact or of
10 up to the present. The reason why larg e fluxes are seen in the South Atlantic and not else whe re
ha s to do with the ear th 's magnetic field. Since the field is weakest here, electrons-in ord er to
satisfy the condition of mi rro rin g at a cer tai n value of Bm-must com e clo ses t to the earth in this
region. Therefore th e larg est flux is seen in th is region.
.
I -
( At 400 km )
v
Figure 7-A mop of electron fluxes at 400 kilometers alti tud e shortly after Starfish.
'T he hes t T e l s tar contours are g iven in Reference 27 , and the best Injun data in References 25 and 28 .
13

8/8/2019 NASA TN D-2402 Effects of High Altitude Explosions
http://slidepdf.com/reader/full/nasa-tn-d-2402-effects-of-high-altitude-explosions 19/38
The spatial distribution of electron s fro m Starfish is not easy to understand. The ionized
deb ris fr om a n explosion will expand outwards and, becaus e the deb ris will be a good conductor, it
will push the magnetic field ahead of it. In thi s way a bubble will be blown in the magneti c field
(Refe rence 29). The bubble will stop expanding when the en ergy in the excluded field eq uals the
initial kinetic energy E of the debris:
The bubble will co llapse and l eave behind a region about the si ze of th e bubble filled with fissi on
fragm ents and electrons. For the Argu s explosion, E x 1 kt = 4 1 o 1 9 ergs. For B = 0 . 3 gauss
we get R x 100 km. Th is is the approximate mea sur ed thickn ess of the Argus electron shells
(Reference 2).
However, this simple model does not work for Starfish. The radi us her e would be R x 1000 km,
but actually the de br is mus t have gone considerably farther than this. To get to L = 5 , the bubble
would have to be about twice this diameter if it grows acro ss field lines or even larger if it grows
upwards. The bubble might bre ak up into sever al bubblets to allow the elect ron s to disp ers e more.
Several satellites launched after Star fish have m ade mea suremen ts on the artificial belts and
have confirmed the genera l picture of the electron flux distribu tion. A magnetic spectrometer
flown on the Air Fo rce satellite 1962 P K measur ed the electron energy sp ectra fr om Starfish at
different L values (Reference 30). Such spect ra for December 8, 1962, are shown in Figure 8. At
L = 1 .25 the energy spectrum looks like the fission spectr um (curve A, Figure 8) except that the re
a r e few er low energy electrons . The se low energy elec tro ns probably have been lost by coulomb
scat teri ng between Ju ly and December. The measured spectrum at L = 1 . 5 7 is softer. It ha s con-
siderably fewer high energy ele ctrons than a fissio n spectru m. Not much decay has taken place
here, so this spec trum should be quite like the initial spectrum on July 9 at L = 1 . 5 7 .
Thi s information on the energy sp ectr um helps in understanding the difference in th e Telstar I
and Injun flux distributions in Figure 6. In developing the se flux distr ibutions, it was assumed that
al l the e lect ron s involved had a fissio n energy spectrum. The Injun detector does not count elec-
tro ns of E < 2 Mev efficiently. The Telstar detector does count low energy electrons with E < 1
Mev well,, This means that Te lstar will count the soft electrons at L = 1 . 5 7 much mo re efficiently
than will Injun. Because of thi s, the Injun contours should close at lower altitude than the Telst ar
contours. The se two sets of contours are two different pict ures of th e s am e thing. The Injun
pict ure shows the spa tial distribution of elec tro ns of E % 3 MeV. The Te lst ar pict ure shows the
spatial distribution of E x 1 /2 Mev electro ns, and probably gives a better estimate of the total
arti fici al belt electro n population than the Injun estim ate because Injun does not include the l ar ge
number of low energy elect rons pre sen t.
Severa l sat ellit es have followed the decay of th e Starfis h electrons. This will be considered
in a later section.
14

8/8/2019 NASA TN D-2402 Effects of High Altitude Explosions
http://slidepdf.com/reader/full/nasa-tn-d-2402-effects-of-high-altitude-explosions 20/38
-
1000
8
6
4
2
100
8
c2z
L
4
m 6
c
4W
I-
W
2
10
8
6
4
2
1
__
\
6
\
%
1
\\
7
'\
'.\
\
-'\
\
\
2
\
\\\
'
\\
\
.=
\
',
<\\
- c
A
\'\
\'
Figure 8-Various electron energy spectra: (A ) the equilibrium fission energy spectrum; (B ) the spectrummeasured at L = 1.25 on Dec. 8, 1962; (C ) the spectrum measured a t L = 1.34 on Dec. 8, 1962; (D) the spectrummeasured a t L = 1.57 on Dec. 8, 196 2 (from Refe rence 31).
RADIATION D A M A G E
The art ificia l radiation belt can cause damage to radiation-sensitive components such as solar
cells-and man. The same , of cours e, is tr ue of the natural radiation belt. The power supplies of
thre e sate llites were damaged by the Starfish electrons. The Ariel I satel lite went into intermittent
operation after about 1week, and the Tr aa c and Tra nsi t 4B sat elli tes stopped in about 1 month. The
15

8/8/2019 NASA TN D-2402 Effects of High Altitude Explosions
http://slidepdf.com/reader/full/nasa-tn-d-2402-effects-of-high-altitude-explosions 21/38
SATELLITES
--C NORMAL "p on n "
-0- BLUE SENSITIVE "p on n"
201010 1011 1o12 1013 1014 1015 1016 1017
1 Mev ELECTRON FLUX ( cm-2 )
Figure 9-Solar ce ll degradation due to 1 Mev electron
bombardment (from Reference 33).
solar cells on these satellites were progres-
sively deteri ora ted because of the artifi cial
electro ns fro m Starfish. The output curren t
of a sola r cell goes down as the radiation ex-
posur e goes up (Reference 32), as shown in
Figure 9. A normally d esigned sate llit e power
supply will malfunction if the s olar cell output
drops to about 80 percen t of its designed value.
Figure 9 shows that this will take about 1OI3
electrons/cm 2 for the p-on-n type solar cells
used on Ariel. Ari el I sta ys in the high flux
region of l o 9 electrons/cm2-sec about 10 per-
cent of the time, so it encou nters roughly lo1*
electrons/cm 2-day; and a week is about the
right t ime for the power supply to last before
going into undervoltage. The output fr om the
solar cells on Traac and Transit 4B was
monitored (Reference 34), and the t ime history
is shown in Fig ure 10. The initial slow de-
c rease is due to the natu ral trapped particles,
and the sudden change on July 9 is clearly due
to the trapped electrons from Starfish. Tel-
star I, with a different and more radiation-
re sis tan t n-on-p type so lar cell, lived a long
time in the artificial radiation belt. Injun also
lasted a long time after Starf ish because i ts power supply was built to stand a larger percentage
degradation and the ref ore mo re radiation. Satelli tes clearly can be designed to have long lives in
the Starf ish belt, or even mo re inte nse belts; but Ari el I, Traac, and Transit 4B we re not expected
to encounter these radiation le vels, and so they were not designed for it.
A to tal flux of 3 x lo7 particles/cm2 is equivalent to 1 Rad (if the ch arged parti cles are
minimum ionizing). The flux of n atu ral high energy protons is about 2 X 10⁴/cm2-sec. This will
resu lt in about a 10 Rad/hour radiation dose to a lightly shielded person. The high electron flux
region from Starfish has about lo9 electron s/cm2 -sec. This would resu lt in about 30 Rad/sec.
Shielding can be used to reduce the radiation dosage. For a fission energy spectrum, 1 gm/cm2 of
shielding mat eria l will red uce the do se about a factor of 10, 2 gm/cm2 a fa ctor of 100, and 3 gm/cm2
a fa ctor of 1000. But it is quite difficult to red uce the radiation by m or e than a factor of 5000 be-cau se of th e x r ay s produced by the elect ron s hitting the shielding. The fraction f of the electrons '
energy that goes into brems strahl ung is about
z E 2f = -
1600
For fissio n electron s incident on an aluminum shield, f % 0.01. The absorption length of the
16

8/8/2019 NASA TN D-2402 Effects of High Altitude Explosions
http://slidepdf.com/reader/full/nasa-tn-d-2402-effects-of-high-altitude-explosions 22/38
70
60
50
-Evc
40e
5V
3
$ 30
c
5r,
20
10
TRANSIT 48CEASED
TRANSMITTING1 ( D A Y 2 1 4 )
LAUNCHDA Y
DAY 319 )
- - I2 1 ,
NI II
TRAAC SATELLITECEASED
TRANSMITTING( DAY 226 )
I
I
HIGH ALTITUDENUCLEAR TEST
( DAY 190 )
J I I I I I I I I I I I I I I I I20 40 60 80 100 120 140 160 180 200 220 240 260 280 3003r 1962 DAY NUMBER
305 325 345
1961
Figure 10-The time history o f the solar ce ll outp ut from Traac and Transit 4B (from Reference 35).
bremsstrahlung x r ay s is about 20 gm/cm2, so the rate of energy lo ss is about a factor of 50 less
than for minimum ionizing charged particles . Combining these factors gives a reduction of a
factor of 5000 i n th e rate of energ y deposition under the shiel d. But the x r a y s that a r e produced,
having an abso rption length of 20 gm/cm2, a r e very hard to absorb out; so additional shielding
after about 4 gm/c m2 does not help much.
With a facto r of 5000 reduction in radiation due to shielding, the radiation d ose from the S tar -
fi sh flux would still reach about 2 0 Rad/hr. Since about 500 Rad is lethal to most people, this
region of spa ce cannot be used for prolonged manned spa ce flight.
Attention w a s given to the proble m of manned flight sho rtl y after Starfish. The flux map for
By the time the MA-8 flight took
1 week aft er Starfish was used to calculate that about 1 Rad radiation dose would be received by an
astronaut on a six-orbit mission at that time (Reference 24).
place, decay of the trapp ed part ic le s had reduced the expected dose considerably, and the dos e re-
ceived wa s well under 1 Rad. This is less than is received in some chest x r ay s and is not a problem.
17

8/8/2019 NASA TN D-2402 Effects of High Altitude Explosions
http://slidepdf.com/reader/full/nasa-tn-d-2402-effects-of-high-altitude-explosions 23/38
EFFECTS ON THE NATURAL RADIATION BELT
The question had been rai se d before Star fish as to whether the explosion would seri ousl y alte r
the na tur al Van Allen belt. Most opinion was that it would not. Beca use of the l ar ge flux of arti-
ficial electrons injected by Starfish, it is not possib le to s a y anything about changes to the na tur al
belt electrons. However, there is some information about the high energy proton fluxes. Nuclear
emulsi ons flown on recove rabl e satellites measured the 55 Mev proton flux at various time s be-
fore and after Starfish.* About 3 weeks after Starfish the 55 Mev proton flux at 400 km was about
a factor of 5 larg er than before Starfish. It has decayed sin ce then. There is some uncertainty
about the rate of decay of the protons , but the decay constant is of the ord er of l o 7 seconds. There
is no so ur ce of 55 Mev protons f rom the explosion, so these part icle s must be natural belt protons.
Very likely the explosion displaced a sm all fraction of the high energy VanAllen beltprotons . The
hydromagnetic wave from the explosion might do it, but the de ta ils of such a process are not
understood quantitatively.
If only a few percen t of t he high energy protons at high altitudes were moved downwards, this
observation could be explained. The high energy proton flux at high altitudes ha s not been changed
measur ably by the Starfis h explosion. Measur ements on Explore r XV (1962 B-hl) and Telst ar I
before and aft er t he USSR exp losions on October 28 and November 1 show no measurable change
i n the energetic proton flux (References 27 and 36).
THE SOVIET H IGH ALTITUDE EXPLOSIONS
On October 27, 1962, NASA launched the Explor er XV satelli te to study the artifici al radiation
belt. But before it got in the air there were two arti fici al belts, and by the time it was up for a
day the re was a th ird belt. The Soviets conducted high altitude explosions on October 22 a nd 28
and then a thi rd one on November 1. Explorer XV had electron detectors on it to cover the range
of e nerg ies expected for fission el ectrons , det ectors with threshol ds from 1 /2 Mev to 5 MeV. Fig-
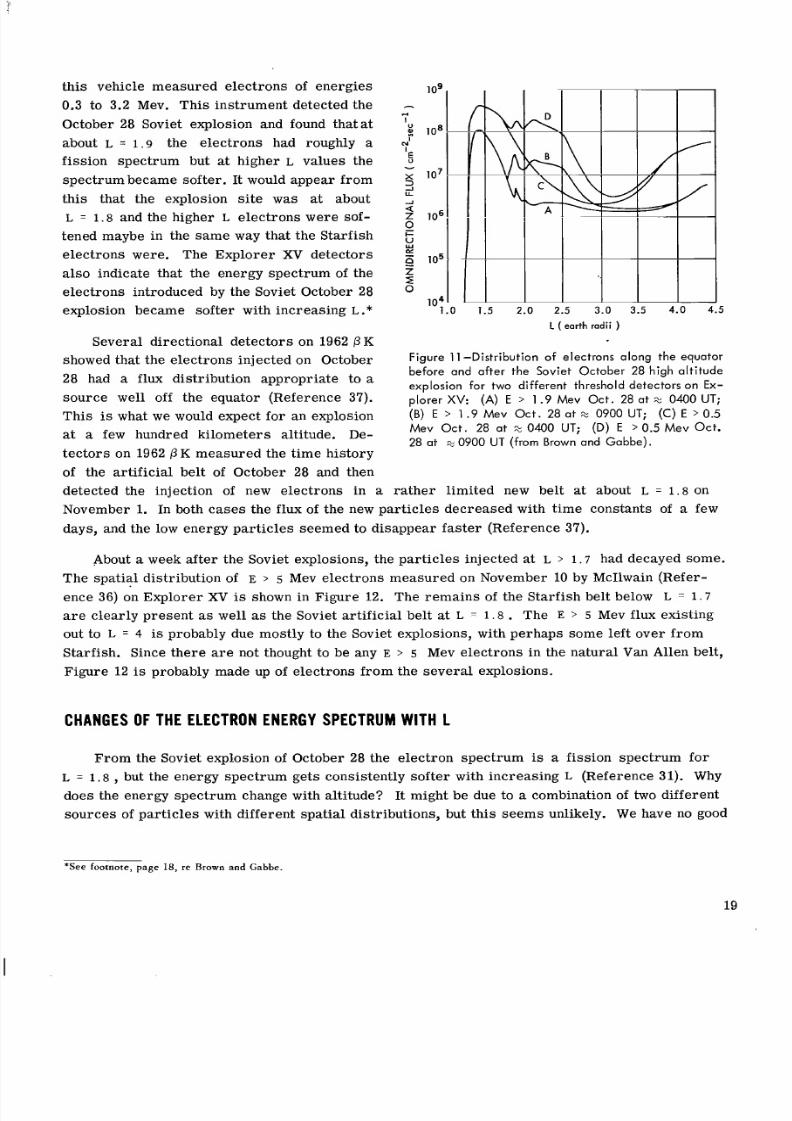
u re 11shows the distr ibution of el ect ron s for two of Brown’s thre sho ld detecto rs’ on Explo rer X V .
Curves A and C wer e taken just after Explorer X V was launched, and curves B and D wer e about
5 hours lat er a fte r the second Soviet explosion. The new belt of e lec tro ns from the explosion is
clea rly evident, st arti ng at L = 1 . 8 and extending out to about L = 3 . The inne r edge of the new
belt is quite sharp, perh aps indicating expansion of the de bri s from t he explosion prefer entiall y
upwards as in a field free bubble. Ins ide about L = 1 . 7 the electron fluxes were essentially un-
changed by the Soviet explosions. The little bump on curve A of Figure 11 at L : . 8 is probably
res idue from the Soviet explosion of October 22; thi s explosion was detected also by Tel st ar I
(Reference 27).
The polar-orbiting Air For ce satell ite 1962 p K car rie d sev eral radiation detection instruments
to study the artif icia l belts. The five-channel magnetic el ectron spe ctro met er (Reference 31) on
* Fi lz , R . , Ya g o da , H . , a nd Ho lema n, E . , “ Observ a t io ns on Trapped Protons in Emu lsions Recove red from Sat ell it e Orbits ,” paper de-l ivered at COSPAR meeting, Warsaw, June 1963. ( P r o c e e d i n g s to b e p u b l i s h e d . )
tPr ivat e communication from W. L . Brown and J . D. Gabbe.
18
8/8/2019 NASA TN D-2402 Effects of High Altitude Explosions
http://slidepdf.com/reader/full/nasa-tn-d-2402-effects-of-high-altitude-explosions 24/38
this vehicle meas ured electr ons of ene rgie s
0.3 to 3.2 MeV. This inst rument detected the
October 28 Soviet explosion and found that at
about L = 1 . 9 the elect ron s had roughly a
fission spectrum but at higher L values the
spectrum became softer. It would appear from
this that the explosion site w a s at about
L = 1 .8 and the higher L electrons were sof-
tened maybe in the s am e way that the Starfish
electrons were. The Explorer X V detectors
als o indicate that th e energy spect rum of the
electrons introduced by the Soviet October 28
explosion became soft er with incr easin g L *
Several directional detectors on 1962 PK
showed that the ele ctr ons injected on October
28 had a flux distribution appropriate to asource well off the equator (Reference 37).
This is what we would expect for an explosion
at a f e w hundred kil omete rs altitude. De-
tectors on 1962 P K measured the time history
of the art if ic ia l belt of October 28 and then
detected the injection of new el ect rons in a
2
L ( earth radii )
5 4.0 5
Figure 11 -Distr ibut ion of electrons along the equator
before and after th e Soviet October 28 h igh a l t i tude
explosion fo r tw o different threshold detectors on Ex-
plorer XV: (A ) E > 1.9 Mev Oct. 28 at 2 0400 UT;(B) E > 1 .9 Me v Oct. 28 a t % 0900 UT; (C ) E > 0.5
Mev Oct . 28 at 2 0400 UT; (D) E > 0.5 Mev Oct.
28 at a 0900 UT (from Brown and Gabbe).
rather limited new belt at about L = 1 . 8 on
November 1. In both ca se s the flux of the new pa rt ic le s decr eas ed with t ime constan ts of a few
days, and the low energy par tic les seem ed to disappear fa ste r (Reference 37).
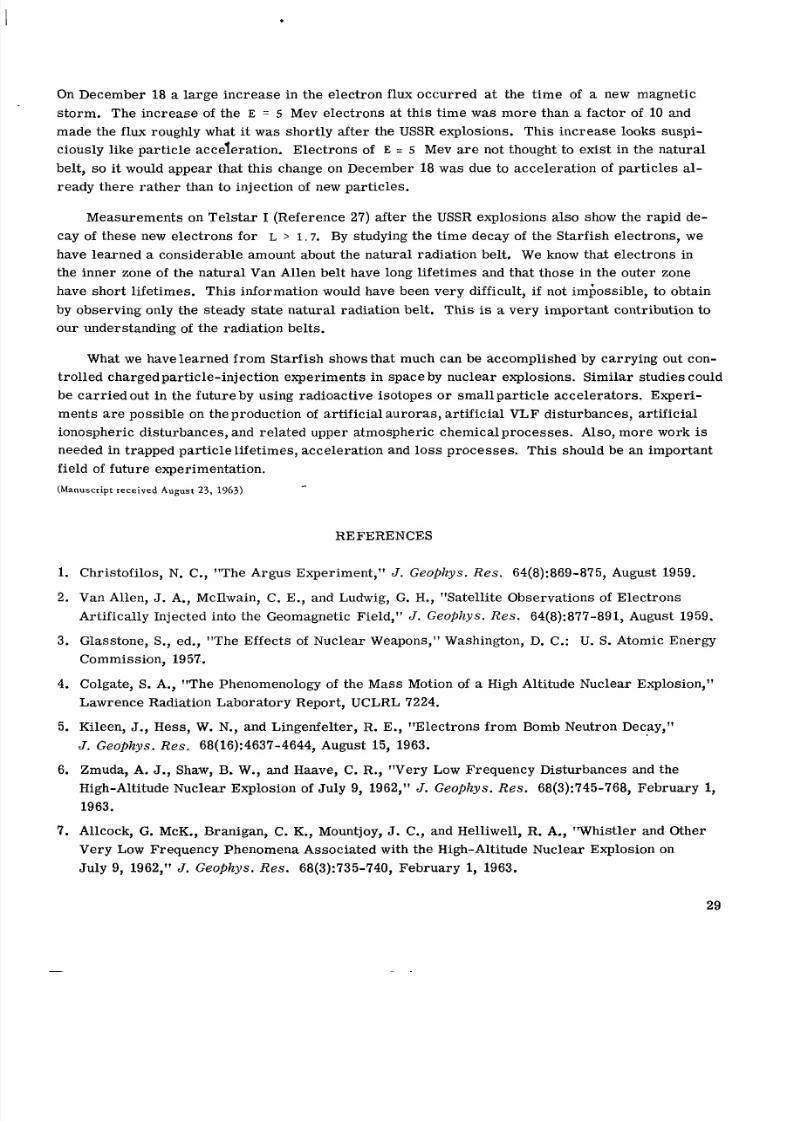
About a week after the Soviet explosions, the part icl es injected at L > 1 . 7 had decayed some.
The spatial distribution of E > 5 Mev elec trons m easu red on November 10 by McIlwain (R efer-
ence 36) on Explorer X V is shown in Figure 12. The re ma in s of the Starf ish belt below L = 1 . 7
a re clearly present as well as the Soviet artif icial belt at L = 1 . 8 . The E > 5 Mev flux existi ng
out to L = 4 is probably due mostly to the Soviet explosions, with perhaps some left over from
Starfish. Since ther e are not thought to be any E > 5 Mev elec tron s in the natural V a n Allen belt,
Figure 1 2 is probably made up of electrons fro m the sev era l explosions.
CHANGES OF THE ELECTRON ENERGY SPECTRUM WITH L
From the Soviet explosion of October 28 the elec tron spe ctr um is a fission spectrum forL = 1 . 8 , but the energy spectrum gets consistently softer with increasing L (Reference 31). Why
does the energy spec trum change with altitude? It might be due to a combination of two different
so urc es of p art icl es with different spat ial distributions, but this se em s unlikely. W e have no good
* S e e footnote, p a g e 18, re Brown and Gabbe.
19

8/8/2019 NASA TN D-2402 Effects of High Altitude Explosions
http://slidepdf.com/reader/full/nasa-tn-d-2402-effects-of-high-altitude-explosions 25/38
3.0+
Figure 12-Distribution of E > 5 Mev electrons i n R-h space on November 10 from
Explorer X V (from Reference 36).
idea what the second electron source would be. There are two other reasons why the elec-
trons from fission decay might have different energies at different locations.
1 . Tim e aftev Fission:
The equilibrium fissi on energy spe ctrum shown in Fig ure 8, curve A, is the electron spectrum
from a reacto r, but this is actually a composite of a var iet y of energy spe ct ra at different time s
aft er the fission event. High energy electr ons ar e given off ea rl ie r after fission. Figure 13 shows
how the energy spe ctrum changes with time aft er fiss ion (Reference 38). From the experimental
data on the Soviet October 28 explosion it would appear necessary to have fission fragments re-
main in space for se vera l hours in order to get the required spe ctra l softening at L = 1.57. This
see ms like a very long time, but it is not impos sible . Colgate (Refe rence 4) has suggested that
most of the fiss ion fra gmen ts fro m the explosion may be slowed down by the expanding debr is
picking up air. In this way the fission fragments may become slow enough so that the /3 -spectrum
will change some, but we consider it unlikely that they will stay aloft for a n hour.
20

8/8/2019 NASA TN D-2402 Effects of High Altitude Explosions
http://slidepdf.com/reader/full/nasa-tn-d-2402-effects-of-high-altitude-explosions 26/38
1OO(
I
f
4
1 ocE
E
4
vl
5z 1 c
c
Y
c
2r
Q
u 6
4
2
1
8
6
4
2
01
.\
$$, \
\\\\
2
\
\\+'\
\\\
\\
\
,
\-\
\
\
\
\\\\\
\,\
\
<\
\\\\
\
C
\
\\
'\
\\
\\
p
\
i'
\
\\\
\\
F
\
\\
\
\
'\
\\
A
\ "I1Figure 13-Various elect ron energy spectra:
spectrum softened by a bubble expansion o f
expansion of / / l o = 2;spectrum 5 minutes after fission;
(A ) the equilibrium fission energy spectrum; (B) he fission
(C ) the fission spectrum softened by a bubble
(E ) the fission energy
l / l 0 = 4/3;(D ) the fission energy spectrum 1 second aft er fission;
(F) the fission energy spectrum 2 . 4 hours after fission.
2 1

8/8/2019 NASA TN D-2402 Effects of High Altitude Explosions
http://slidepdf.com/reader/full/nasa-tn-d-2402-effects-of-high-altitude-explosions 27/38

8/8/2019 NASA TN D-2402 Effects of High Altitude Explosions
http://slidepdf.com/reader/full/nasa-tn-d-2402-effects-of-high-altitude-explosions 28/38
For fission electron,k~ ' 1 , so
f 2z -2p .
Th e number of col lis ions a particle has p er second with the wall is
Cn - -
- e '
where P is the bubble diamet er. The rate of energy loss of a particle is
which in tegrate s to
_ _ - - ' 0
E , - P
where E, and I, a r e the initial parti cle energy and bubble radius.
Now, considering a distri bution of energie s,
N(Eo) dE, = N(E) dE(2)
This expression, which shows how an in itial energy sp ect rum w i l l change as the bubble expands,
is plotted in Figure 13 for an initial fission energy spectrum. Fro m this we s ee that for a bubble
expansion ratio P/P, 5 2 , he spectrum will soften enough to match the observations at L = 1.57.
Fo r the Soviet explosion of October 28 conducted roughly at L = I.8, to produce electr ons on
the L = 3.0 line a bubble would have to expand at least 1600 km sideways or more in other di-
rections. During the bubble expansion of a factor of 2 starting from 8 , of se ve ra l hundred kilo-
met ers, the trapped pa rti cle s will hit the bubble w a l l s about lo3 times. What fractio n of the
electr ons will escape from the bubble during the expansions? If a particle sc atte rs into the loss
cone at the end of the bubble, it w i l l leak out. If the reflections at the wall are like diffuse sc att er-
ing, the bubble will probably be empty after 1000 collis ions with the wall. But for spe cular r e-
flecti ons some reasona ble fractio n of the pa rti cle s should st ay in the bubble.
One fea ture of the el ect ron dis tribution from the October 28 explosion is interesting. There
are clearly two peaks in the flux distribution ve rs us L (Refere nce 37).* It may be that the lower- -*See footnote, p . 18, r e Brown and Gabbe.
23

8/8/2019 NASA TN D-2402 Effects of High Altitude Explosions
http://slidepdf.com/reader/full/nasa-tn-d-2402-effects-of-high-altitude-explosions 29/38
...
flux peak at L = 1.8 is due to e lect rons from fi ssion frag ment s that have been trapped on the field
line s c lose to the explosion and that the other peak is due to electrons releas ed from a bubble that
has expanded upwards fro m the explosion site. If this is the case, it would appear that Fermi
deceler ation of p art icl es in the bubble is the process responsible for changing the electrons'
energies. It would not appea r that expansion of n eut ral fission fragments from the explosion s it e
and subsequent /3 -decay could explain the double-peaked flux distribution easily.
. The observations on the energy spectrum from the USSR October 2 8 explosion help in under-
standing the Starfis h electron f l ux . The energy spe ctrum softens with increasing L for the Soviet
explosion. Whatever the explanation of this effect is, it see ms reasonable to assume that the same
effect will be presen t fo r all la rg e high-altitude nuc lear explosions. There for e we expect to find
lower energy electrons at large L values in the radiation belt made by Starfish, as w e do
experimentally.
DECAY OF THE ELECTRONS
One of the most int eres ting feat ures of the Starfis h arti fici al radiation belt has been its decay.
Instrum ents on sev era l satel lite s have observed the par tic le population for se ver al months, and
cer tai n genera l featu res of the decay have been found. At low alt itud es the decay is rapid because
of interactions with th e atmosp here. At high altitud es the decay is quite fas t, too-but fo r a dif-
ferent reason. The atmosphere cle arly -is not responsible for this loss. In a region i n between
these two rapid decay zones, the decay is slow but se em s to be controlled by the thin atm osphere
at high altitudes.
Before th e advent of these explosions the only methods of estima ting electron lifet imes wer e
indirect. In dealing with a steady state situation where the par tic le population is moderately con-
sta nt with time, the only way to me asu re the lifetime T of a trapped particle is by measuring
either I, the inflow, or 0 , the outflow, of part ic les fr om the radiation belt and
"leaking bucket'' equation
using the
or some similar procedure, Here Q is the tota l number of pa rt ic le s trapped in the volume of the
belt a ssocia tion with the inflow I , or outflow 0 . In the past, the values obtained this way have
involved esti mat es of the outflow 0 down into the a tmosphe re and have produced widely different
values ofT
. We now have direct measurements ofT
fro m the decay of the art ific ial radiationbelt s which eliminate the necessity of using this indirect method, which is sus pect anyway.
In discuss ing the decay of the Starfish electrons, it is appropria te to sp lit the problem into
tw o part s: one for high altitude, and one fo r low altitude.
24

8/8/2019 NASA TN D-2402 Effects of High Altitude Explosions
http://slidepdf.com/reader/full/nasa-tn-d-2402-effects-of-high-altitude-explosions 30/38
1 < 1.7 1
In this region of s pace th er e is a rapid
initial decay at low altitudes, followed by a
slow decay afte rwa rds due to coulomb sc at ter -
ing with atmos pheric atoms. Van Allen, Frank,and O'Brien measured the decay of the arti-
ficial electrons at 1000 km with the Injun
satellites;* this is shown in Fi gure 14. After
the initial rapid decay, which is larger for
large B values (or low altitude), the decay
slows down and is nearly constant for all B
values. Meas ureme nts on Alouette (1962 B-a! 1)
from September 1962 to January 1963 of the
decay of the Starfis h electro ns (Reference 30)
gave ti me consta nts of s ev era l months for the
region 1 .3 < L < 1 . 6 . McIlwain studied the
INJUN IB = INJUNDI
0.220
t
\. 2 3 0 1
1°k 1 1 I I It 1 2 3 4 5 L!c A t ( months )
' 0 loo0 2 0 0 0 3 0 0 0 4000
A t ( hours )
Figure 14-Decay of the Starfish electro n flux for
low L values measured by the lnjun satellites (from
Van Allen, Frank, and O'Brie n).
trapped Starfish electrons on Explorer X V for about 3 months, sta rtin g in October 1962. He found
that, for 1.25 < L < 1 . 7 , the decay con stant s we re typically gre ate r than 1 year and in"some ca ses
ar e more than 3 y ea r s (Reference 36).
At lower altitudes the decay is faster. Glass1 ha s meas ured the electron decay at 400 km and
ha s found that the decay for se ver al months after S tarfish could be descr ibed by the law
where t is the time in days.
The decay of trappe d elect ron s controlled by the atmosp here can be calculated in a straight-
fo rward way. MacDonald and W a l t (Reference 40) have derived a Fokker-Planck equation that
des crib es how a distribution of ele ctr ons in s pac e and energy will change with time as the result
of coulomb scatt erin g. Th is ha s been used by Welch, Kaufmann, and H e s s (Reference 41) o study
electron time histories.
Neglecting c ro ss field diffusion and neglecting la rg e angle scatter ing, the ti me change of a
distri bution of el ect ron s u in space and energy is obtained by usi ng th e Fokker-Pla nck equation,
au
a t -_ _ -
'Van A l l e n , J. A , , Frank, L. A , , a nd O'Br ien, B . 'J . , 1 9 6 3 , to h e p u b l i s h e d .t G a i n e s , E . E . , a n d G l a s s , R . A , , 1 9 6 3, to b e p u b l i s h e d .
25
c

8/8/2019 NASA TN D-2402 Effects of High Altitude Explosions
http://slidepdf.com/reader/full/nasa-tn-d-2402-effects-of-high-altitude-explosions 31/38
The distribution function U is defined as the number of particles at time t in a magnetic flux
tube of flux d~ ,mirr oring in the magnetic field interval d~ at B , and having ene rgie s in dy at y ,
where y is th e relativis tic dimensionless energy
The ter ms in the < > above are the time rates of change of the quantit ies involved which res ul t
fro m atmospheric coulomb scatter ing. The atmospheric model used in the calculation is that of
Harr is and Pri est er (Reference 42) near sola r minimum. The atmosph ere is averaged over local
time and is als o averag ed over longitude, considering that a particle's mirror point changes alti-
tude as the particle drifts in longitude. The < > t e r m s are evaluated using s mal l angle coulomb
scattering. A tube of force is broken up into 100 space cel ls of equal AB , and th e fission energy
spectrum used w a s broken up iilto nine regions of Ay of about 0.75 Mev each. For a star ting con-
dition u was taken to be constant all along a
fiel d line. Then the problem was run on a
computer to watch the distribution change in
time.
L L
4YI
1 0 - ~-
0.17 0.18 0.19 0.20 0.21 0.22 0.23
B
Figure 15-Calculated time histories o f 3.75 Mev elec-
trons for L = 1.25 . Each curve i s labeled by the time
afte r inj ect ion in seconds. The data used for com-
parison show a smooth lin e drawn through the data i n
Reference 25 and are for about 1 week after Starfish
(from Reference 41 ) .
The resu lts of such a calculation are
shown in Figure 15. The ele ctro ns at large B
(or low altitude) a r e lost first and, as time
progresses, the particles n earer the equator
are lost. Eventually an equilib rium develops
where scat teri ng up the tube of f orc e is bal-
anced by sc att eri ng down the tube, so that th e
spatia1 distribution st ay s constant and tKewhole distribution then decay s in tim e main-
taining its shape. For this equilibrium the
decay rate is control led by the rate of scatter-
ing at the equator and is therefore slow com-
par ed with the initial decay at low altitudes.
The comparison with the experiment al data
fro m Injun in Fi gure 15 shows that the calcu-
lation removes particle s at large B faster than
it should. Recent changes in the Harr is and
Pr ie st er model atmosphere increasing the He
density should make the agreement better. The
decay rates given by the ca lculat ion ag re e
reasonably well with the experimental data.
The variation of decay constan ts with altitude
and al so the change of T with tim e (as indicated
2 6

8/8/2019 NASA TN D-2402 Effects of High Altitude Explosions
http://slidepdf.com/reader/full/nasa-tn-d-2402-effects-of-high-altitude-explosions 32/38
by the changes from Alouette 7?s to McIlwain’s 7?s in the same region but at different
times) is i n agreement with theoretical expectations.
The decay for e arly tim es can be ex presse d approximately as.
where 7 ( B ) is a charac teristi c decay time. This decay law gradually merges into an exponential
decay as scatt ering equilibrium is reached.
The decay represe nted in Figure 15 is what is expected for the atmosphere near sol ar mini-
mum and w i l l probably be reasonably good for the next year or so. But, as solar activity picks up
and we get close to sol ar maximum, the decay will incr ea se ve ry markedly. A lar ge fract ion of
the Starfish electro ns still trappe d now will be los t before so lar maximum.
During the pro ce ss of atmo spheri c scatterin g, the electr on energy spect rum changes. The
lower energy electro ns are more easily scattered and ar e therefore lost first. Because of this,
the fission energy spec trum hardens with tim e
until an equilibrium spectrum is developed
with a peak at about 2 MeV. The Fokker -Planck
calculations show this process developing as
in Figure 16.
The spe ctr ome ter (Refe rence 31) flown on
1962 P K measured an electron energy spec-
trum at L = 1.25 (see Figure 8, curve B) in
December 1962 which is quite similar to the
calculated hardened .fission spectrum in Fig-
ure 16, curve G. From a comparison of the
sev eral detectors aloft (Reference 24) at early
times after Starfish, the spectrum seemed
fission-l ike down to 1/2 Mev to L = 1.25.
The refo re th e lack of low energy pa rti cle s in
the L = 1.25 spectrum in December is not due
to an initial paucity but rather to a loss of
them after they were trapped. This is what is
expected from coulomb sc atteri ng.
An electron spectr ometer (Reference 34)
flown on another Air Force satellite in Sep-
tembe r 1962 measured an energy spectru m
quite similar to curve B in Figure 8 for
1 . 2 < L < 1 . 6 ; thi s confirme d the existen ce of
a hardened fission spectrum.
1
10-1
X
3
I
U
w
5w
o-’
lo-’
A
A = 1.3 x
B = 4 . 9 x i o 3 sec
c = 1 . 1 x 10⁵ sec
D = 2.7 x l o 5 sec
E = 7.6 x l o 5 sec
F = 1 . 7 ~o 6 sec
G = 3.0 x l o 6 sec
C
D
. E
I - I 10 1 2 3 4 5 6 7
Figure 16-Change in th e fission electron energyspectrum with t ime resulting from coulomb scattering
for L = 1.18 and B = 0.20 (from Reference 41).
27

8/8/2019 NASA TN D-2402 Effects of High Altitude Explosions
http://slidepdf.com/reader/full/nasa-tn-d-2402-effects-of-high-altitude-explosions 33/38
L > 1 .7
The situation is quite different for L > 1 . 7 . Brown and Gabbe measured on Te lst ar I (Refer-
ence 27) the decay of the tran sien t electron population introduced into space by the Starfi sh
explosion. They found th e decay curv es in Figure 17 for L > 1 . 7 . In th is region of space the
electro n population decays with sh or t tim e constants. At L = 1 . 7 the decay constant is many
months but, by L = 2 . 2 , r * 1 week. It see ms impossible for this ra pid decay to be due to the
atmosphere. It is ver y likely due to som e kind of magnetic dis turba nces which br eak s down one
of the adiabatic invariants. Although there are sev er al ideas about the types of d istur bances in-
volved (Referen ces 43, 44), the real nature of this process is not known.
Measurements made after the t hr ee USSR explo sions for L > 1 . 7 give decay constants quite
similar to the ear l ie r Te ls ta r data. McIlwain (Reference 36) on Explorer XV found the decay w as
quite steady and monotonic for L
ferent . There are several stepwise decrease s in the flux apparently relat ed to magnetic sto rms .
3 afte r November 1. But, for L 2 4 , the decay is quite dif-
2.5
I I0 210 230
DAY, 1962
..id
0
I
C
0
I80 270
Figure 17-Time decay of the Starfish elec tron flux for L > 1 .7 measured on Telstar I (from Reference 27).
28
8/8/2019 NASA TN D-2402 Effects of High Altitude Explosions
http://slidepdf.com/reader/full/nasa-tn-d-2402-effects-of-high-altitude-explosions 34/38
On December 18 a lar ge incr ease in the electron flux occurred at the time of a new magnetic
storm. The incr eas e of the E = 5 Mev electrons at this time was m ore than a factor of 10 and
made the flux roughly what it was shortly after the USSR explosions. Th is inc rea se looks suspi-
ciously like particle acceleration. Electro ns of E = 5 Mev are not thought to e xis t in the nat ural
belt, so it would appear that this change on December 18 was due to accelera tion of par tic les al-
ready th ere rat her than to injection of new particl es.
Measurements on Te lsta r I (Reference 27) af ter t he USSR explosions al so show the r apid de-
cay of the se new elect ron s for L z 1.7. By studying the tim e decay of the Star fish electrons , we
have learned a conside rable amount about the na tura l radiation belt. W e know that ele ctro ns in
the inn er zone of th e nat ural Van Allen belt have long life time s and that those in the outer zone
have sho rt lifetimes . Th is information would have been ve ry difficult, i f not im$ossible, to obtain
by observi ng only the steady state natural radiation belt. This is a very import ant contribution to
our understanding of the rad iation belts.
What we hav ele arne d from S tarf ish shows that much can be accomplished by carr ying out con-
trolled chargedparticle-injection xperim ents in spa ce by nu clear explosions. Sim ila r studi es couldbe ca rr ie d out in the fut ure by using radioactive isotopes o r small particle accelerators. Experi-
ments a re possible on the production of artifici al auro ras, artificial VLF disturbances, a rtificial
ionospheric disturbances, and related upper atmospheric chemical process es. Also, mor e work is
needed in trapped part icl e lifetim es, accele ration and los s proc ess es. This should be an important
field of future experimentation.
(Manuscript received August 23 , 1963)e
REFERENCES
1. Christofilos, N. C., "The Argus Experimen t," J . Geoplzys. Re s. 64(8):869-875, August 1959.
2. Van Allen, J. A., McIlwain, C. E., and Ludwig, G. H., "Satellite Observations of Elect rons
Artifically Injected into the Geomagnetic Field," J . Geophys. Res . 64(8):877-891, August 1959.
3. Glasstone, S., ed., "The Ef fect s of Nuclear Weapons," Washington, D. C.: U. S. Atomic Energy
Commission, 1957..
4. Colgate, S. A., "The Phenomenology of the Mas s Motion of a High Altitude Nuclear Explosion,''
Lawrence Radiation Lab oratory Report, UCLRL 7224.
5. Kileen, J., H e s s , W. N., and Lingenfelter, R. E., "Elect rons f ro m Bomb Neutron Decay,''
J. Geophys. Res . 68(16):4637-4644, August 15, 1963.
6. Zmuda, A. J., Shaw, B. W., and Haave, C . R., "Very Low Fre quen cy Dis turbanc es and the
High-Altitude Nuclear Explosion of July 9, 1962," J. Geophys. Res. 68(3):745-768, February 1,
1963.
7. Allcock, G. McK., Branigan, C. K., Mountjoy, J. C., and Helliwell, R. A., "Whistler and Other
Very Low Frequency Phenomena Associated with the High-Altitude Nuclear Explosion on
July 9, 1962," J . Geophys. Res . 68(3):735-740, February 1, 1963.
29

8/8/2019 NASA TN D-2402 Effects of High Altitude Explosions
http://slidepdf.com/reader/full/nasa-tn-d-2402-effects-of-high-altitude-explosions 35/38
8. Wilson, C. R., and Sugiura, M., "Hydromagnetic Waves Generated by the Ju ly 9, 1962, Nuclear
Weapons Test as Observed at College, Alaska," J. G e o p h ys . R e s . 68(10):3149-3154, May 15,
1963.
9. Crook, G. M., Greenstadt , E. W., and Inouye, G. T., "Distant Elec tromagne tic Observations of
the High-Altitude Nuclear Detonation of July 9, 1962," J. G e o p h y s. R e s . 68(6): 1781-1784,
March 15, 1963.
10. Gregory, J. B., "New Zealand Observations of th e High-Altitude Explosion of Ju ly 9 at Johnston
Island," N a t u r e , 196(4854):508-511, November 10, 1962.
11. Basler, R. P., Dyce, R. B., and Leinbach, H., "High-Latitude Ionization Associated with the
July 9 Explosion,"J. G e o p k y s . R e s . 68(3):741-744, February 1, 1963.
12. Armstrong, R. J., and Wharton, A. E. B., "Effec ts of the High-Altitude T hermonuclear Ex-
plosion of July 9, 1962, 0900 UT, Observed at Jamaica," J . G e o p h ys . R e s . 68(6):1779-1780,
March 15, 1963.
13. Rothwell, P., Wager, J. H., and Sayer s, J., "Effect of the Johnston Island High-Altitude Nuclear
Explosion on the Ionization Density in the Topside Ionosphere," J. G e o ph y s. R e s . 68(3):947-949,
February 1, 1963.
14. Latt er , R., and LeLevier, R. E., "Detection of Ionization Ef fect s fr om Nuclear Explosions i n
Space," J. G e o ph y s. R e s . 68(6):1643-1666, March 15, 1963.
15. Ochs, G. R., Farley, D. T., Jr., Bowles, K. L., and Bandyopadhay, P., "Observations of
Synchro tron Radio Noise at the Magnetic Equa tor Following the High-Altitude Nuclear Explosion
of July 9, 1962," J. G e o p h ys . R e s . 68(3):701-711, February 1, 1963.
16. Schwinger, J., ?'On the C las si cal Radiation of Accel erat ed Electrons," P h y s . R e v . 75 :1912-1925,
June 15, 1949.
17. Chang, D. B., and Davis, L., Jr., "Synchrotron Radiation as the Source of Jupiter's Polarized
Dec ime ter Radiation," A s t r o p h y s . J . 136(2):567-581, September 1962.
18. Pe te rs on , A. M., and Hower, G. L., "Synchrotron Radiation from High-Energy Electrons,?'
J . G e o ph y s. R e s . 68(3):723-734, February 1, 1963.
19. Nakada, M. P., "Synchrotron Radiation Calculations for the Ar tifi cial Radiation Belt," J .
G e o ph y s. R e s . 68(13):4079-4090, July 1, 1963.
20. Dyce, R. B., and Horowitz, S., "Measuremen ts of Synchro tron Radiation at Central Pacific
Sites," J. G e o ph y s. R e s . 68(3):713-721, February 1, 1963.
21. Durney, A. C., Elliot, H., Hynds, R. J., and Quenby, J. J., "Satellite Observations of the Ener -
geti c Pa rt ic le Flux Produc ed by the High-Altitude Nuclear Explosion of Ju ly 9, 1962," N a t u r e ,
195(4848): 1245- 1247, September 29, 1962.
22. Piep er, G. F., Williams, D. J., and Frank, L. A., "Traa c Observa tions of the Art ific ial Radi-
ation Belt from the July 9, 1962, Nuclear Detonation,'' J. G e o p h ys . R e s . 68(3):635-640,
February 1, 1963.
c
30

8/8/2019 NASA TN D-2402 Effects of High Altitude Explosions
http://slidepdf.com/reader/full/nasa-tn-d-2402-effects-of-high-altitude-explosions 36/38
23 . Pie per, G. F., "A Second Radiation Belt fr om the Ju ly 9, 1962, Nuclear Detonation," J .
Geophys. Res. 68(3):651-656, February 1, 1963.
24. H e s s , W. N., "The Art ific ial Radiation Belt Made on Ju ly 9, 1962," J. Geophys. Re s. 68(3):667-
683, February 1, 1963.
25. O'Brien, B. J., Laughlin, C. D., and Van Allen, J. A., "Geomagnetically T rappe d Radiation
Produced by a High-Altitude Nuclear Explosion on Ju ly 9, 1962," Nature 195(4845):939- 942,
September 8, 1962.
26. Brown, W. L., and Gabbe, J. D., "The E lectron Distribution in the Eart h's Radiation Bel ts
During July 1962 as Measur ed by Telstar," J. Geophys. Res. 68(3):607-618, February 1962.
27. Brown, W. Lo , Gabbe, J. D., and Rosenzweig, W., "Resu lts of the Telstar Radiation Experi-
ments," Bell System Tech. J . 42(4-3):1505-1560, July 1963.
28. Van Allen, J. A., Frank, L. A., and O'Brien, B. J., "Satellite Observat ions of the Art ific ial
Radiation Belt of July 1962," J . Geophys. Res. 68(3):619-627, February 1, 1963.
29. Kellogg, P. J., N e y , E., and Winckler, J., "Geophysical Eff ect s Associated with High Altitude
Explosions," Nature 183:358, 1958.
30 . McDiarmid, I. B., Burrows, J. R., Budzinski, E. E., and Rose, D. C., "Satellite Measurements
in the Starf ish Artif ici al Radiation Zone," Con. J . Phys. 41:1332, 1963.
31 . West, H. I., Mann, L. G., and Bloom, S. D., "Spectra and Fluxes of Ele ctrons Trapp ed in the
Earth's Magnetic Field Followed Recent High Altitude Nuclear Bursts," AFCRL Report,
Interim Results of Radiation Measurem ents from Air F orc e Satellite 1962 PK, June 17, 1963.
32 . Smith, R. V., and Imhof, W. L., 'Satellite Mea surements of the Ar tifi cia l Radiation Belt,"
J . Geophys. Res . 68(3):629-634, February 1, 1963.
33. Rosenzweig, W., Gummel, H. K., and Smits, F. M., "Solar Cell Degradation Under 1-Mev
Electron Bombardment," Bell System Tech. J. 42(2):399-414, March 1963.
34. Mozer, F. S., El liot t, D. D., Mihalov, J. D., Paulikas, G. A., Vampola, A. L., and Freden , S. C.,
"Prelim inary Analysis of the Fluxes and Spectr ums of Trapped Par ti cl es after the Nuclear
Test of July 9, 1962," J. Geophys. Res . 68(3):641-650, February 1, 1963.
35. Fischell, R. E., "Solar Cel l Pe rfor ma nc e in the Arti fi cia l Radiation Belt," AIM Jour.
1(1): 42-245, anuary 19 63.
36. McIlwain, C. E., "The Radiation Belts , Natural and Art ific ial ," Science 142:355, 1963.
37. Katz, L., Smar t, D., P aolini, F. R., Giacconi, R., and Talbot, R. J., "Measurements on Trapped
Pa rt ic le s Injected by Nuclea r Detonations," AFCRL R eport Int eri m Results of Radiation
Measurements from Air For ce Satellite 1962 P K , June 17, 1963.
38. W e s t , H. I., Lawre nce Radiation Labora tory Repor t UCRL 6123 T, 1960.
39. Fe rm i, E., '!On the Origin of Cosmic Radiation," Phys. Rev. 75(8):1169-1174, April 15, 1949.
40. MacDonald, W. M., and Walt, M., "Distribution Function of Magnetically Confined El ec trons in
a Scatt ering Atmosphere," Ann. Phys. 15(1):44-62, July 1961.
31

8/8/2019 NASA TN D-2402 Effects of High Altitude Explosions
http://slidepdf.com/reader/full/nasa-tn-d-2402-effects-of-high-altitude-explosions 37/38
I I1 I
41. Welch, J. A., Jr., Kaufmann, L., and Hess , W. N., "Trapped Elect ron Time Histories fo r
L = 1.18 to L = 1.30," J . G e o p h ys . R e s . 68(3):685-700, February 1, 1963.
42. Harris, I., and Priester, W., "Theo ret ica l Models for the Solar-Cycle Variation of the Upper
Atmosphere," NASA Tech nical Note D-1444, 1962.
43. Parker, E. N., "Effect of Hydromagnetic Waves in a Dipole Fie ld on the LongitudinalInvariant,"
J . G e o ph y s. R e s . 66(3):693-708, March 1961.
44. Dungey, J. W., "Resonant Effect of Pl as ma Waves on Charged Particles in a Magnetic Field,"
J . Fluid M e c h . 15:74-82, January 1963.
32 NASA-Langley, 1964

8/8/2019 NASA TN D-2402 Effects of High Altitude Explosions
http://slidepdf.com/reader/full/nasa-tn-d-2402-effects-of-high-altitude-explosions 38/38
/ 2.r-Q - j 7-. .
. . . ,1 .
, . . I , .
. ,, L .
"The aeronautical and space activities of the United States shall be
conducted so as to contribute . . . to the'expansion of human knowl- ,
edge of phenomena in the atmosphere and space. The Administration
of informhion.concerning its actiuities and. the results thereof .'I
'
''
. .hall provide .fat he widest practicable and appropriate dissem2nation. .
I .I .
-NATIONALAERONAUTICSND S P ~ ECT OF 1958 '
'
NASA SCIENTIFIC A N D TECHNICAL PUBLICATIONS
" ...
TECHNICAL REPORTS: Scientific and technical information considerkd . '. . ,
important, complete, and a lasting contribution to existing knowledge.
TECHNICAL NOTES:
of importance as a contribution to existing knowledge.
TECHNICAL MEMORANDUMS: Information receiving limited distri -
bution because of preliminary data, security classification, or other reasons.
CONTRACTOR REPORTS:
nection with a NASA contract or grant and released under NASA auspices.
Information less broad in scope but nevertheless
1 6
, .
-.-. ':,. 1 . .
, ' :
Technical information generated in icon- ,
,, .
TECHNICAL TRANSLATIONS:
language considered to merit NASA distribution in English.
TECHNICAL REPRINTS: Information derived from NASA activities
and initially published i n the form of journal articles.
SPECIAL PUBLICATIONS Information derived from or of value to
NASA activities but not necessarily reporting the results .of individual
NASA-programmed scientific efforts. Publications include conference
proceedings, monographs, data compilations, handbooks, sourcebooks,
and special bibliographies.
Information published in a foreign
Details on the ava i lab i l i t y of these publications may be obtained from:
SCIENTIFIC AND TECHNICAL INFORMATION DIVISION
N AT10 N A L AE R 0 NA UTIC S AN D SPACE A D M N IS T RAT I0 N
Washington, D.C. PO546