Embed Size (px)
Citation preview
NA
SA
April 19, 2023 UNAIDS
Spending assessment for Spending assessment for political decision making in political decision making in
HIV/AIDS: HIV/AIDS: Experience & OpportunitiesExperience & Opportunities
PresenterTeresa Guthrie
Centre for Economic Governance and AIDS in
Africa (CEGAA)
Septe
mber,
2
00
8
NA
SA
1. Introduction2. NASA global findings3. Opportunities for evidence-based
political decision making
Overview of Presentation
NA
SA
INTRODUCTION: Resource Tracking Using NASA
11.3
• As the international response to AIDS continues to scale-up, it is increasingly important to accurately track in detail:
• how funds are spent at the national level and
• where the funds originate.
• The data helps national-level decision-makers monitor the scope and effectiveness of their
programs
• When aggregated across multiple countries, the data helps the international community evaluate the status of the global response
NA
SA
KEY FINDINGS OF NASAsExamples from the regions
NA
SA
SOURCES OF FUNDS
NA
SA
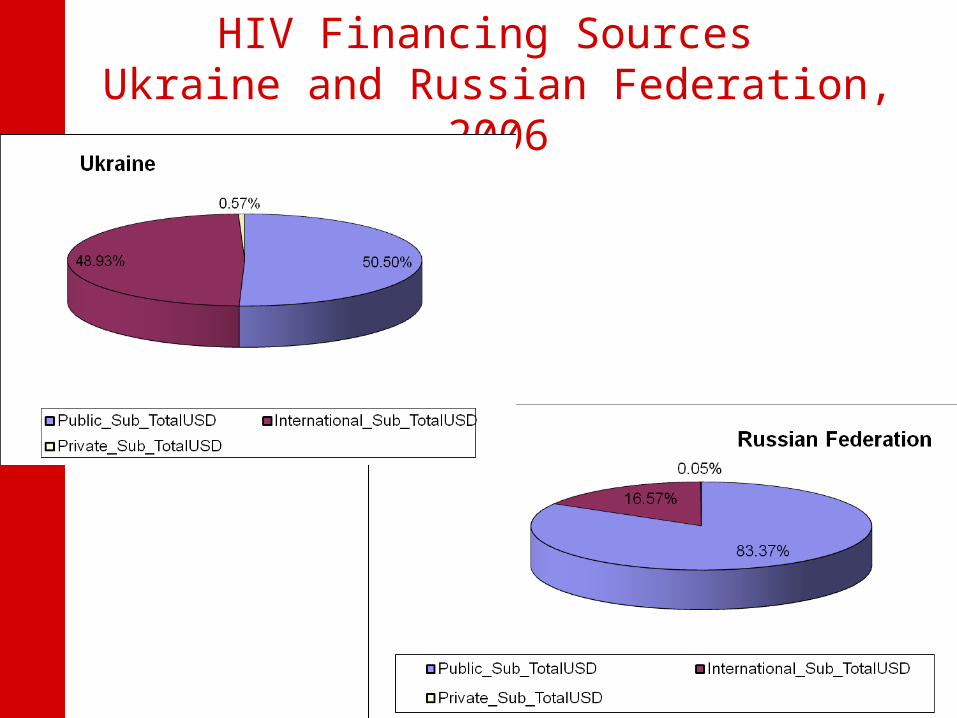
HIV Financing Sources Ukraine and Russian Federation, 2006
NA
SA
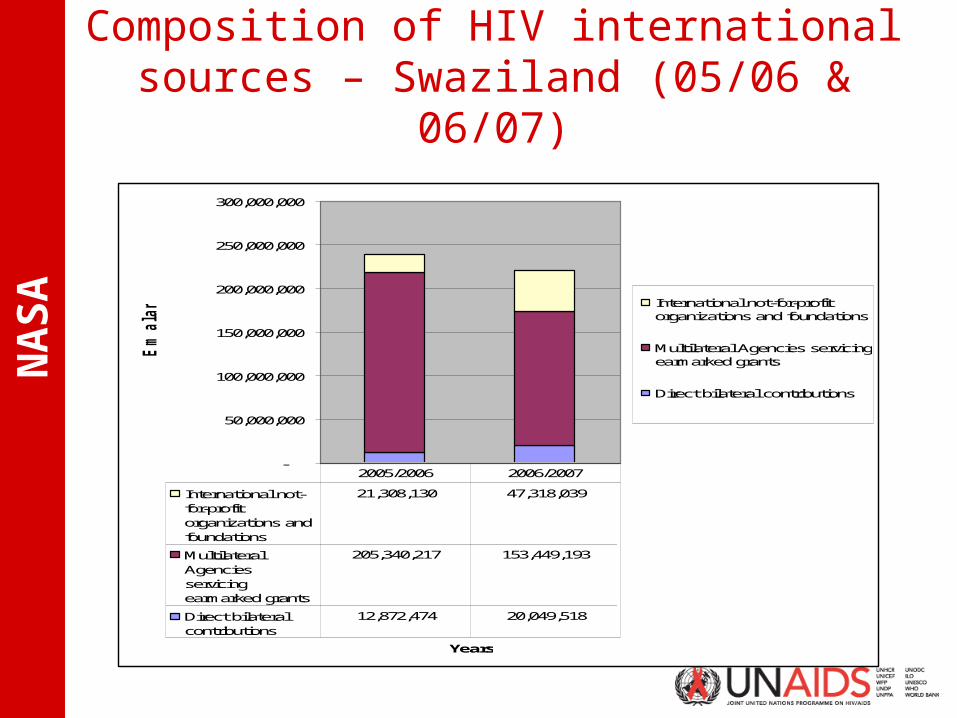
Composition of HIV international sources – Swaziland (05/06 & 06/07)
-
50,000,000
100,000,000
150,000,000
200,000,000
250,000,000
300,000,000
Years
Em
ala
ngen
International not-for-profitorganizations and foundations
Multilateral Agencies servicingearmarked grants
Direct bilateral contributions
International not-for-profitorganizations andfoundations
21,308,130 47,318,039
MultilateralAgenciesservicingearmarked grants
205,340,217 153,449,193
Direct bilateralcontributions
12,872,474 20,049,518
2005/2006 2006/2007
NA
SA
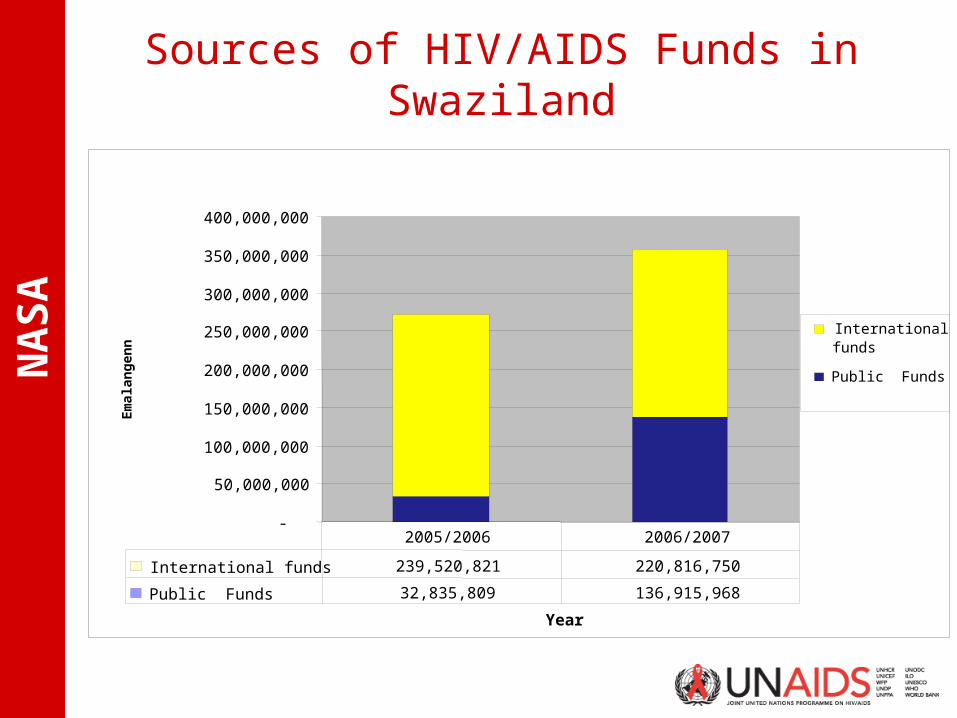
Sources of HIV/AIDS Funds in Swaziland
-
50,000,000
100,000,000
150,000,000
200,000,000
250,000,000
300,000,000
350,000,000
400,000,000
Year
Em
alan
gen
n
Internationalfunds
Public Funds
International funds 239,520,821 220,816,750
Public Funds 32,835,809 136,915,968
2005/2006 2006/2007
NA
SA
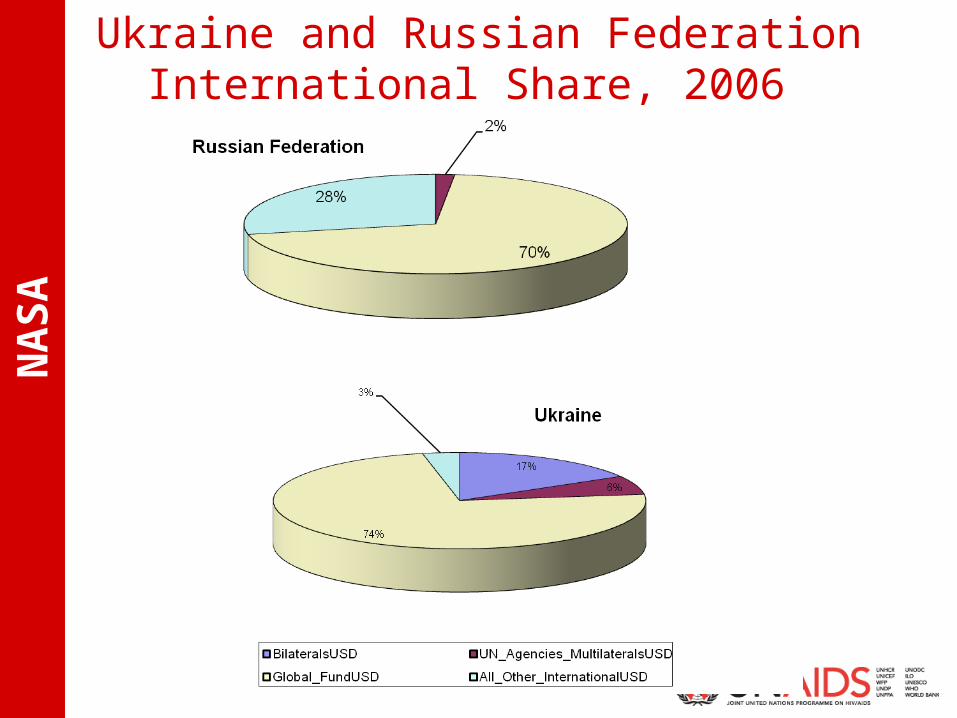
Ukraine and Russian FederationInternational Share, 2006
NA
SA
FINANCING AGENTS
NA
SA
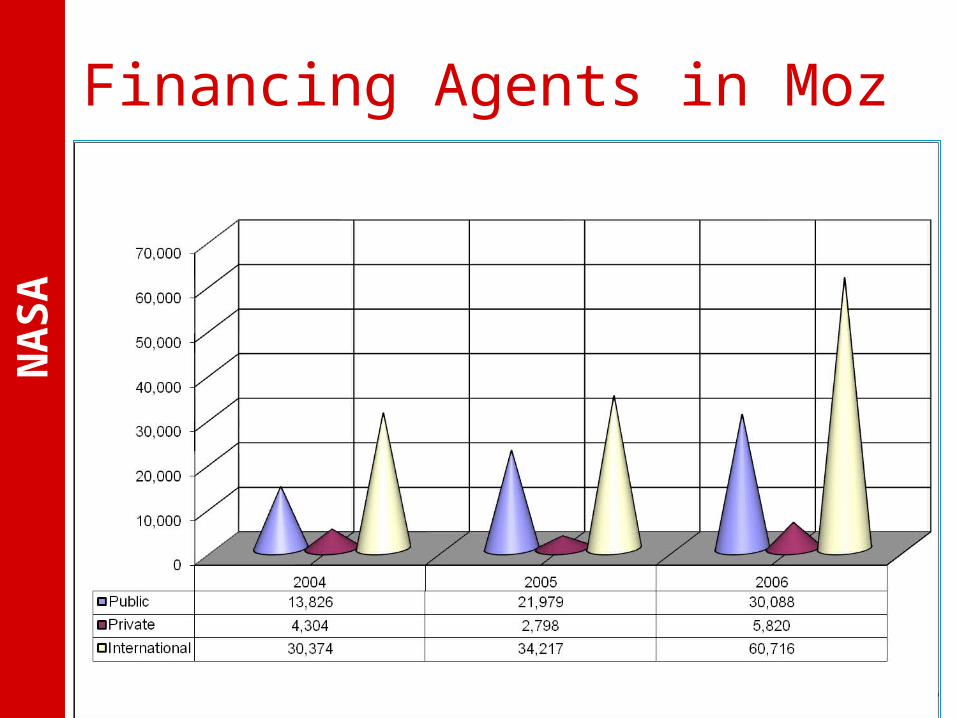
Financing Agents in Moz
NA
SA
AIDS SPENDING CATEGORIES
NA
SA
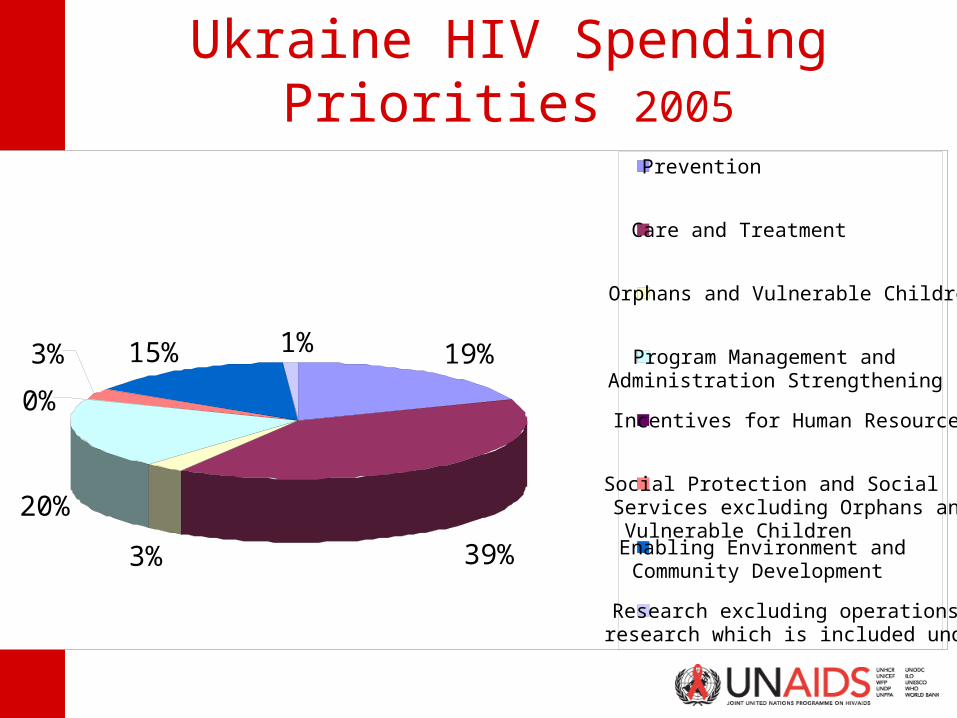
Ukraine HIV Spending Priorities 2005
19%
39%3%
20%
0%
3% 15% 1%
Prevention
Care and Treatment
Orphans and Vulnerable Children
Program Management andAdministration Strengthening
Incentives for Human Resources
Social Protection and SocialServices excluding Orphans andVulnerable ChildrenEnabling Environment andCommunity Development
Research excluding operationsresearch which is included under
NA
SA
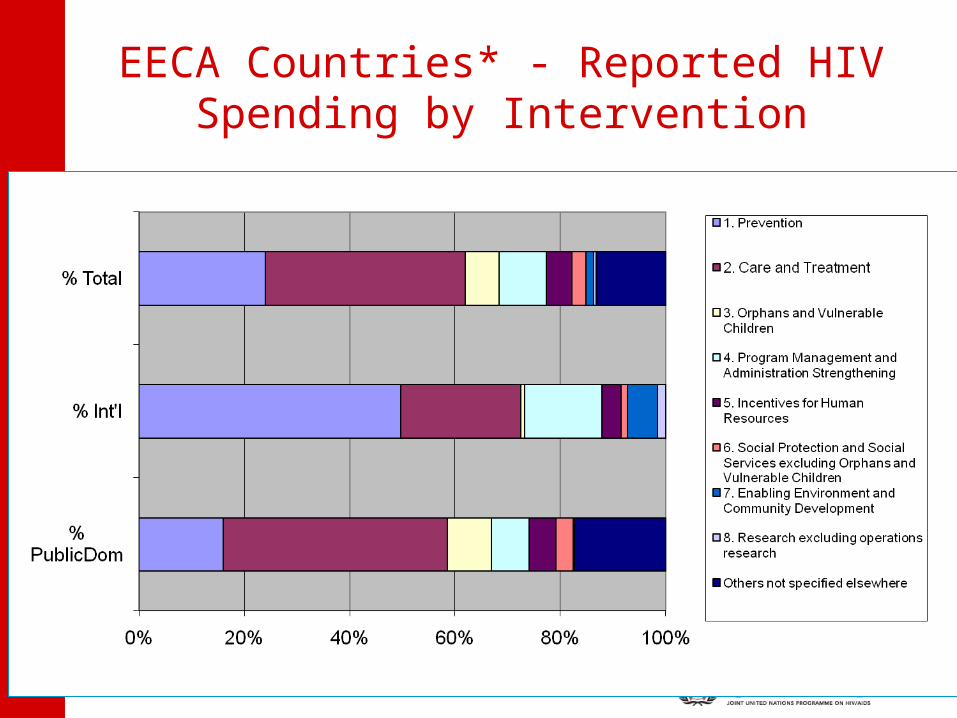
EECA Countries* - Reported HIV Spending by Intervention
NA
SA
Source: Resource Needs for an Expanded Response to AIDS in Low and Middle Income Countries. UNAIDS, 2005. Table 1.
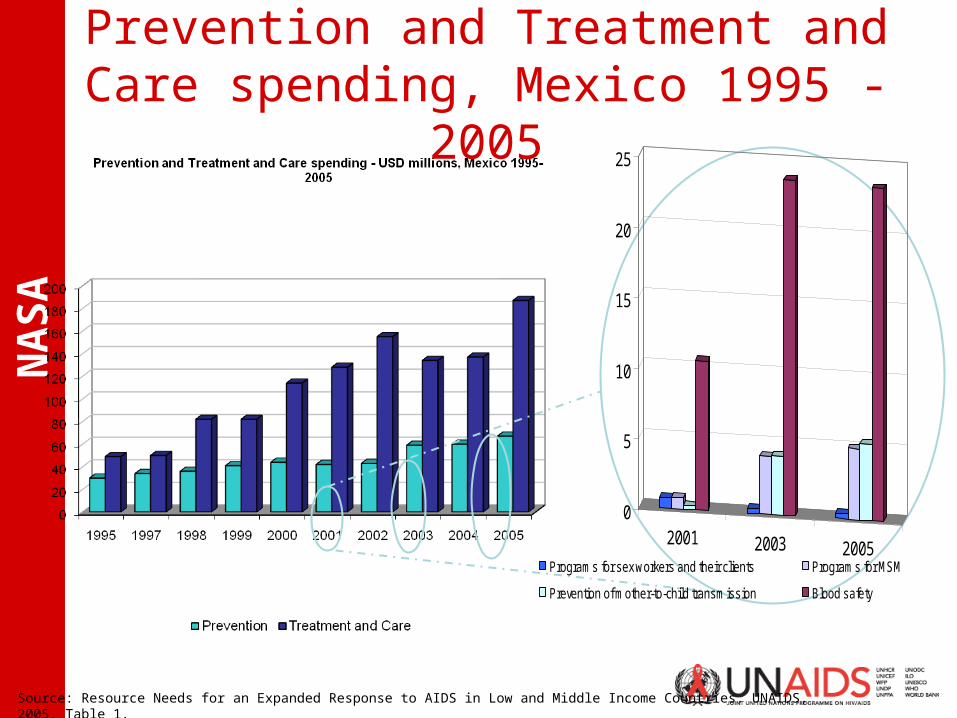
2001 2003 2005
0
5
10
15
20
25
Programs for sex workers and their clients Programs for MSM
Prevention of mother-to-child transmission Blood safety
Prevention and Treatment and Care spending, Mexico 1995 -
2005
NA
SA
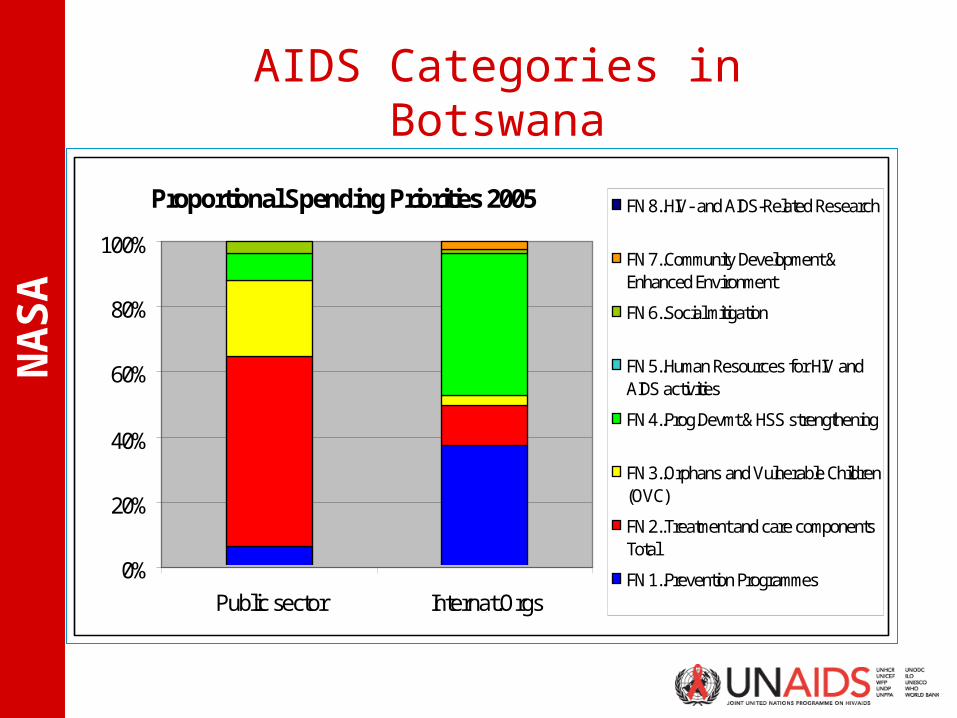
AIDS Categories in Botswana
Proportional Spending Priorities 2005
0%
20%
40%
60%
80%
100%
Public sector Internat.Orgs
FN 8..HIV- and AIDS-Related Research
FN 7..Community Development &Enhanced Environment
FN 6..Social mitigation
FN 5..Human Resources for HIV andAIDS activities
FN 4..Prog.Devmt & HSS strengthening
FN 3..Orphans and Vulnerable Children(OVC)
FN 2..Treatment and care components Total
FN 1..Prevention Programmes
NA
SA
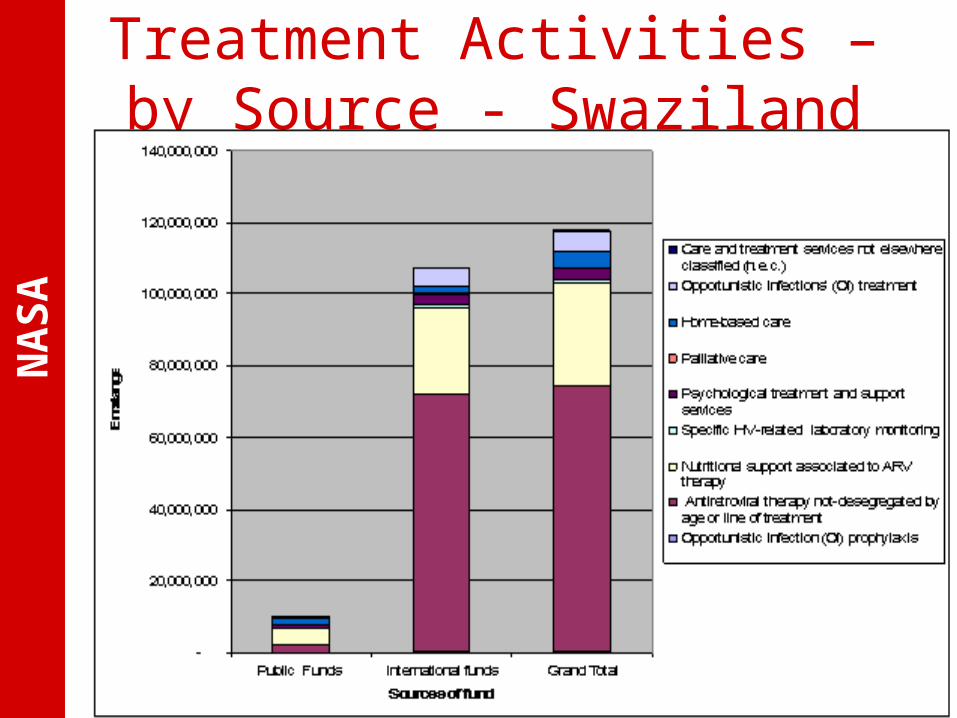
Treatment Activities – by Source - Swaziland
NA
SA
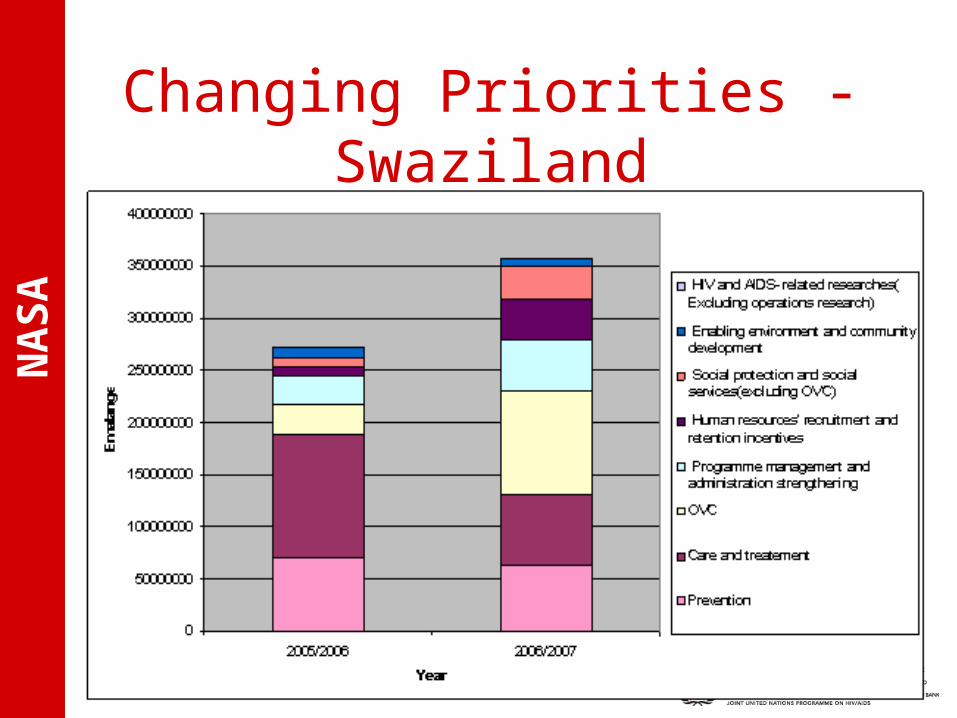
Changing Priorities - Swaziland
NA
SA
NA
SA
NA
SA
SERVICE PROVIDERS
NA
SA
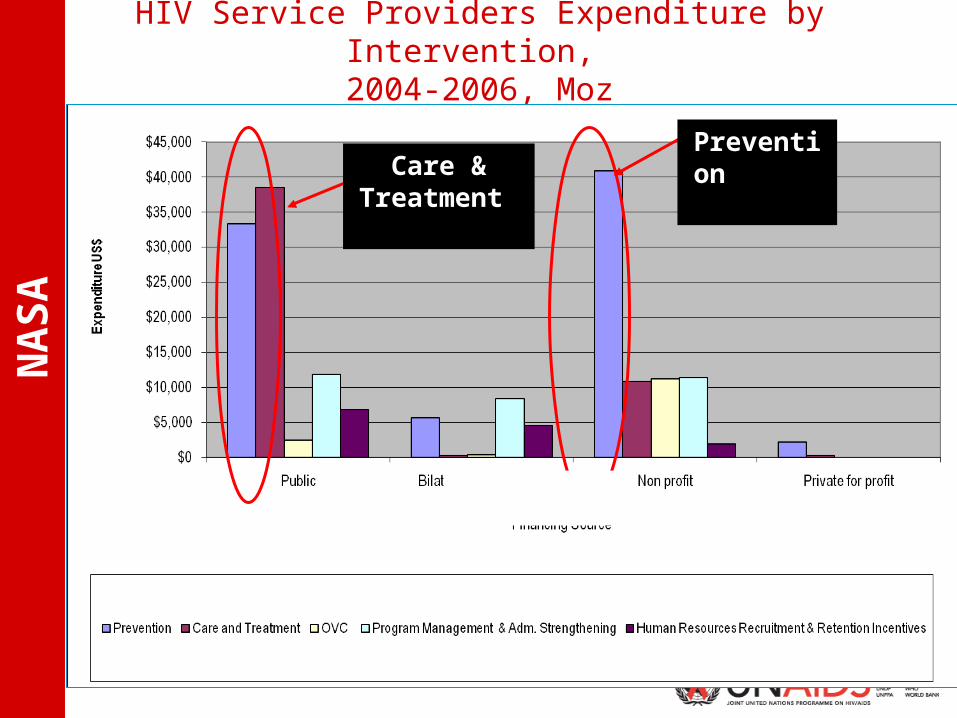
HIV Service Providers Expenditure by Intervention, 2004-2006, Moz
Care & Treatment
Prevention
NA
SA
BENEFICIARY ANALYSIS
NA
SA
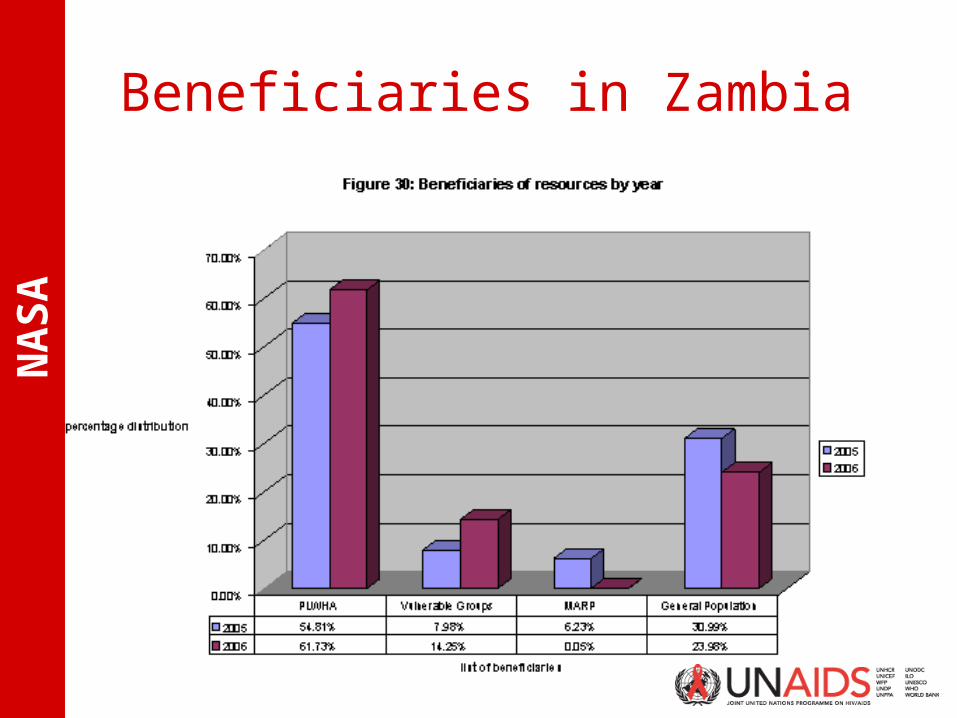
Beneficiaries in Zambia
NA
SA
MEASURING PROGRESS TOWARDS NATIONAL PRIORITIES
NA
SA
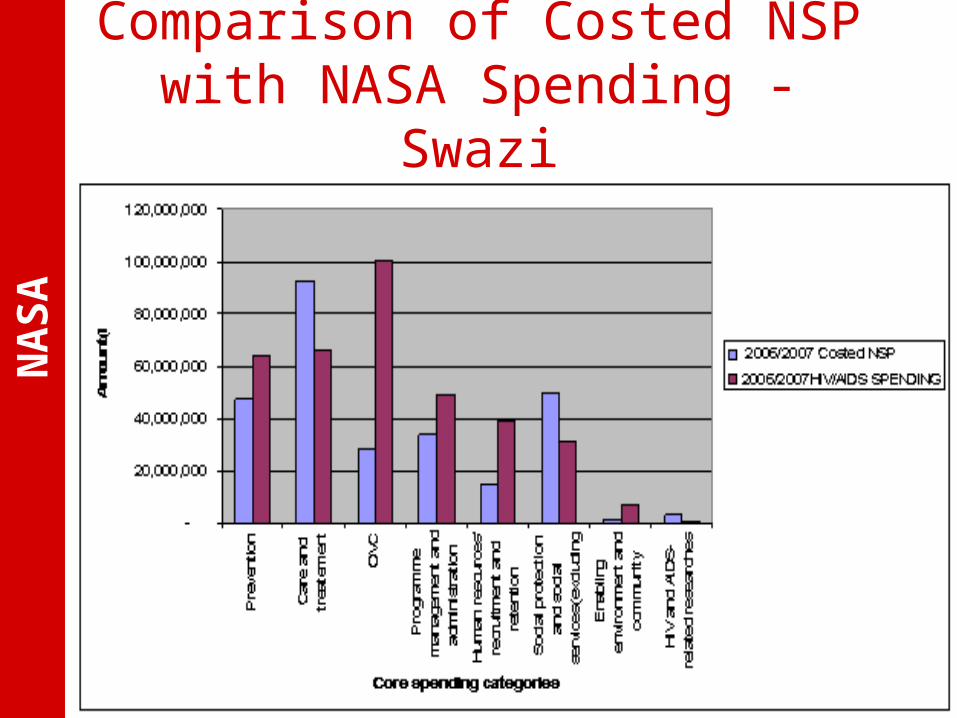
Comparison of Costed NSP with NASA Spending - Swazi
NA
SA
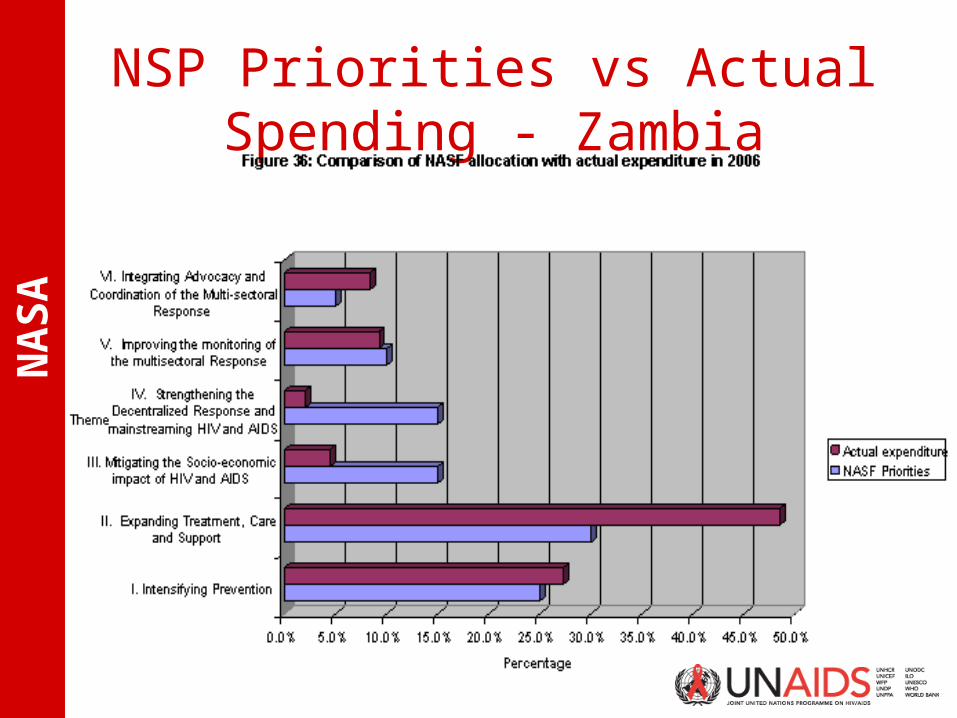
NSP Priorities vs Actual Spending - Zambia
NA
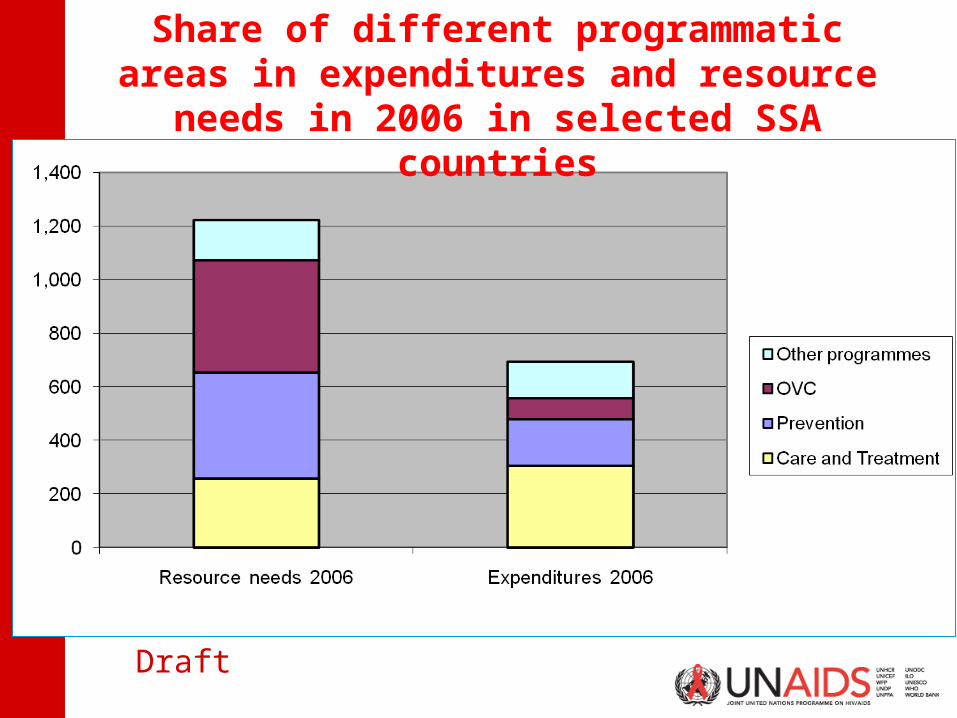
SA RESOURCE GAP ANALYSIS ~
Comparison of Estimated Resource Needs (RNE) with Actual
Expenditure (NASA)
NA
SA
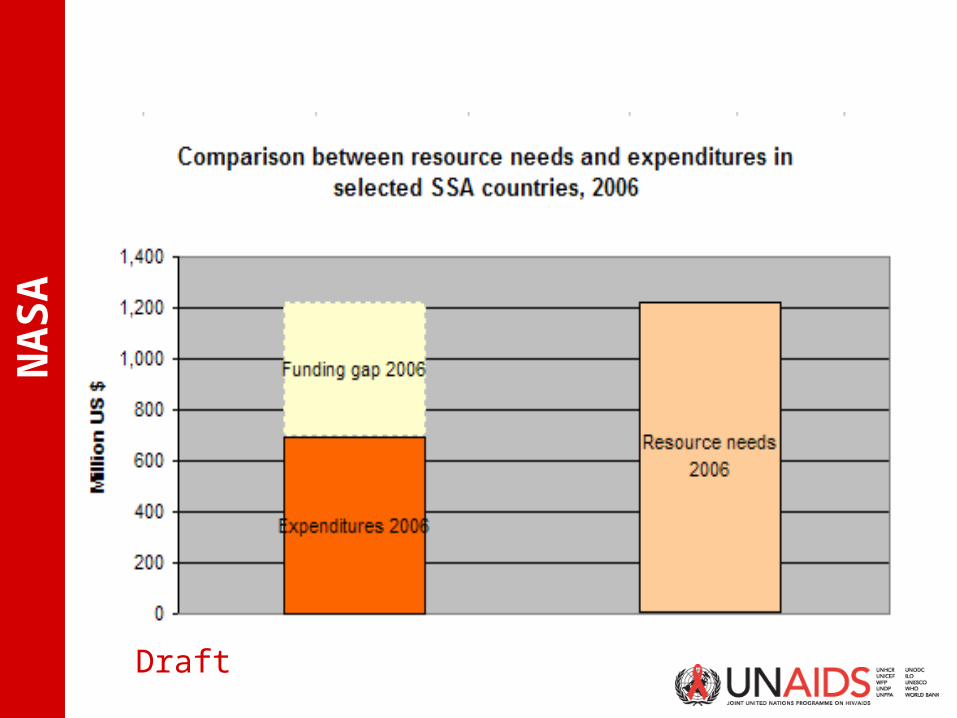
Draft
NA
SA
Draft
Share of different programmatic areas in expenditures and resource needs in
2006 in selected SSA countries
NA
SA
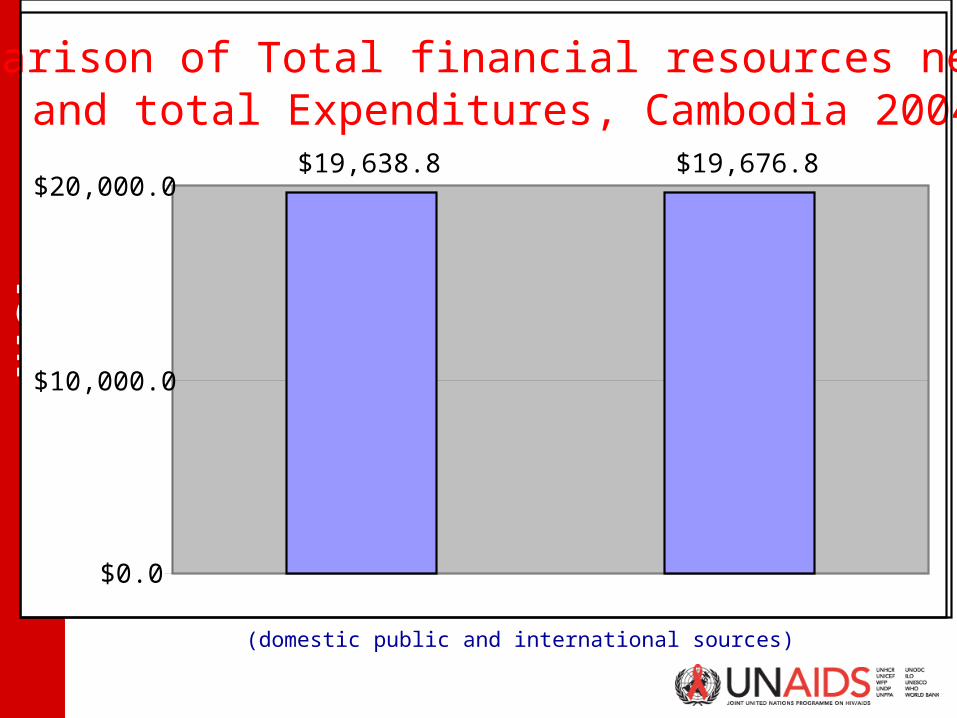
(domestic public and international sources)
Comparison of Total financial resources needed and total Expenditures, Cambodia 2004
$19,638.8 $19,676.8
$0.0
$10,000.0
$20,000.0
NA
SA
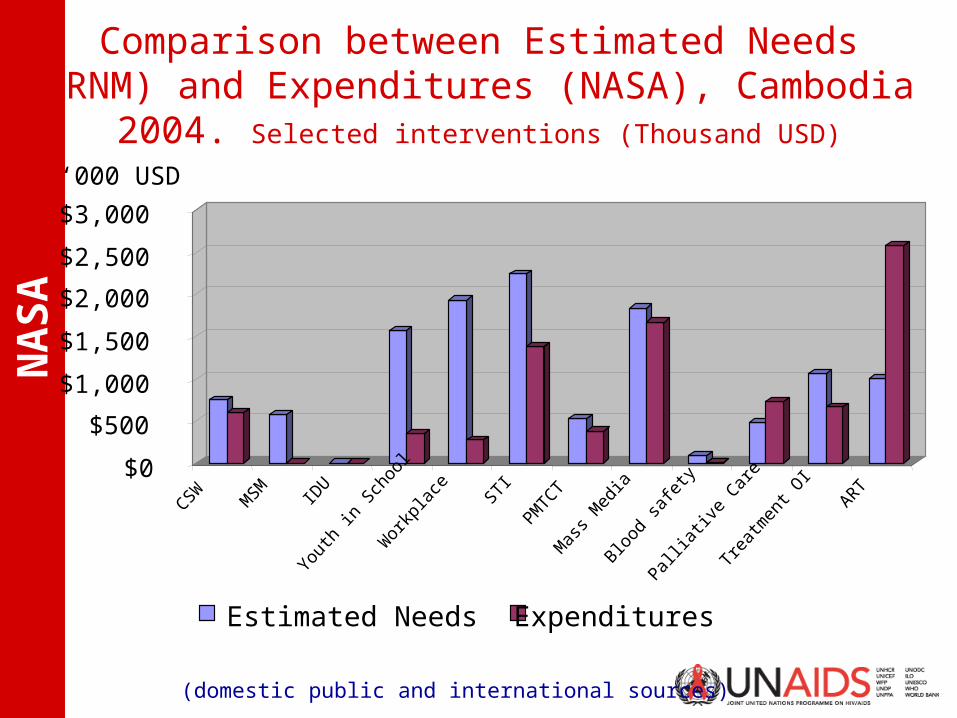
Comparison between Estimated Needs (RNM) and Expenditures (NASA), Cambodia 2004.
Selected interventions (Thousand USD)
Estimated Needs Expenditures
$0
$500
$1,000
$1,500
$2,000
$2,500
$3,000
CSW
MSM IDU
Yout
h in
Sch
ool
Wor
kpla
ce STI
PMTC
TMas
s Med
iaBl
ood
safe
tyPa
lliat
ive
Care
Trea
tmen
t OI
ART
‘000 USD
(domestic public and international sources)
NA
SA Opportunities for
Informing Evidence-Based Decision-Making
NA
SA
Opportunities for evidence-based political decisions
• ADEQUACY OF FUNDING – PUBLIC & EXTERNAL– Public commitments-meeting national/international
commitments ~ long-term sustainability– Comparison to costed NSP estimates of required
resources – funding gap analysis– Centralised funding and spending with low funds
for the sub-national level– Data not disaggregated according to national and
sub-national levels– Discrepancies between allocations and actual
expenditures ~ measurement of absorptive capacity, leakages, transaction costs
NA
SA
Opportunities for evidence-based political decisions (2)
• ALLOCATIVE DECISIONS – PRIORITIES– Meeting national priorities (aligned to NSP?)– Balance between programmes ~ unsustainability
of treatment costs without adequate prevention interventions ~ allocative efficiency
– Equity in allocations ~ between geographical areas, providers, beneficiaries & according to need
• EFFICIENCY OF SPENDING– Provides varying unit costs for interventions,
allows comparison of technical efficiency– Identifies poor absorption capacity ~ allows for
exploration of factors: bottlenecks, dumping etc.
NA
SA
Opportunities for evidence-based
political decisions (3)• COORDINATION, HARMONISATION AND ALIGNMENT
– Alignment of the actual HIV/AIDS spending to NSP – public and external
– Agent analysis shows who determines use of funds– Identifies poor harmonisation – duplicative financing &
reporting, high transaction costs• INSTITUTIONALIZATION OF NASA
– Within the Monitoring and Evaluation (M&E) framework– Using standardised financial information/ reporting
mechanisms
NA
SA
Opportunities for evidence-based
political decisions (4)• ENHANCED TRANSPARENCY, ACCOUNTABILITY
& ECONOMIC GOVERNANCE – Increased pressure (& desire) for mutual
accountability by all players– Promotes a (legal) framework to ensure all
partners report through a national resource tracking system
– Link framework to the National Resource Mobilisation and Management Strategy
– Using the framework to harmonise standards of costing among different partners
– Ensures transparent procurement systems & best pricing within and between countries & regions
NA
SA
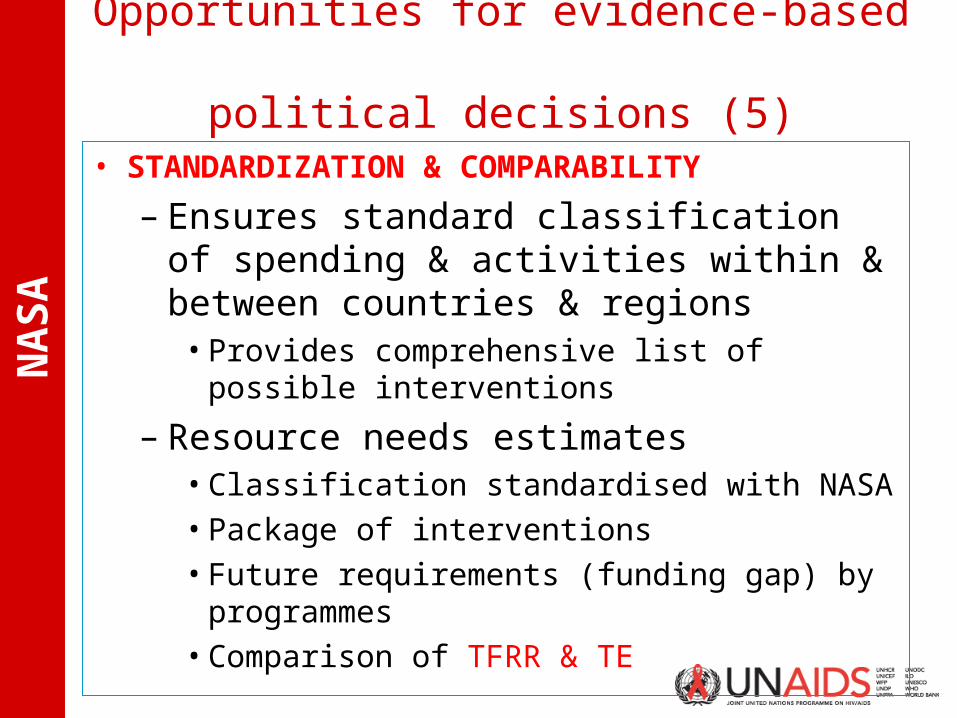
Opportunities for evidence-based political decisions (5)
• STANDARDIZATION & COMPARABILITY
– Ensures standard classification of spending & activities within & between countries & regions• Provides comprehensive list of possible
interventions
– Resource needs estimates• Classification standardised with NASA• Package of interventions• Future requirements (funding gap) by
programmes• Comparison of TFRR & TE
NA
SA Thank You
Teresa GuthrieCentre for Economic Governance and AIDS in
Africa Email: [email protected]